role of livestock on mixed smallholder farms in the
TRANSCRIPT

ROLE OF LIVESTOCK ON MIXED SMALLHOLDER FARMS
IN THE ETHIOPIAN HIGHLANDS
A Case Study from the Baso and Worena Wereda near Debre Berhan
Guido Gryseels
icó l) \-bob-bo

PROMOTORS :
Dr. D. Zwart, Hoogleraar in de Tropische Veehouderij
Dr. F.P. Jansen, Hoogleraar in de Agrarische Ontwikkelingseconomie, in het bijzonder de economische aspecten
BIBLIOTHEEK jiANDBOUWUNIVERSITEÎt
^AGENINGEN

Guido Gryseels
ROLE OF LIVESTOCK ON
MIXED SMALLHOLDER FARMS
IN THE ETHIOPIAN HIGHLANDS
A Case Study from the Baso and Worena Wereda near Debre Berhan
Proefschrift ter verkrijging van de graad van doctor in de landbouwwetenschappen, op gezag van de rector magnificus, dr. H.C. Van der Plas, in het openbaar te verdedigen op woensdag 28 september 1988 des namiddags te vier uur in de aula van de Landbouwuniversiteit te Wageningen
;sw.v2>o£>3o

Gryseels, Guido. 1988. Role of Livestock on Mixed Smallholder Farms in the Ethiopian Highlands. A Case Study from the Baso and Worena Wereda near Debre Berhan. Dissertation, Agricultural University, Wageningen, The Netherlands.

*JooJ^of/ '2^
STELLINGEN
1. In the mixed farming system of the Ethiopian highlands, farmers allocate their resources efficiently. Changes in the way these farmers manage their farms will therefore not raise farm productivity significantly. New technology, or external inputs are necessary for a substantial increase in smallholder agricultural production.
2. A strategy for livestock development on smallholder farms in the Ethiopian highlands should give first priority to the intermediate functions of livestock, such as draught power and manure, (eigen proefschrift)
3. Timely access to draught power is a strong determinant of farm grain production in the Ethiopian highlands, (eigen proefschrift)
4. The introduction of crossbred dairy cows is a valuable development option for a significant fraction of the farm population of the Ethiopian highlands, provided appropriate marketing arrangements and extension services are available, (eigen proefschrift)
5. In the Ethiopian highlands, one-ox ploughs can be useful for seed covering, but cannot replace the traditional ox-pair for primary cultivation, (eigen proefschrift)
6. On-farm livestock research should not be conducted solely by economists.
7. In areas of the Ethiopian highlands that are structurally famine-prone, non-emergency food aid discourages the migration of the local farm population to other areas of higher agricultural potential.
8. Livestock research in the African highlands has neglected small ruminants, and therefore, the poorer farmers.
9. Although only a small fraction of Ethiopia's grain is produced during the season of the 'small rains', these rains determine the timing of first cultivation and therefore the productivity of the main cropping season. This aspect is of crucial importance in the development of 'early warning' systems that have a predictive capacity for crop failure and food aid needs of a particular region.
10. Farmers participating in on-farm verification trials should normally not receive compensation for participating in such trials.
11. The succesful outcome of agricultural research is usually associated more with intuition of individual researchers and serendipidy, than with formal planning and the availability of a critical mass of staff.
12. Most experience results from bad decisions. An experienced person is thus not necessarily wise.
Proefschrift van Guido Gryseels
Role of Livestock on Mixed Smallholder Farms of the Ethiopian Highlands. A Case Study from the Baso and Worena Wereda near Debre Berhan.
Wageningen, 28 September 1988
W«

Aan mama, papa, filip, dirk, joris, hugo, machteld, bruno, jan, jos, lief en albert

ACKNOWLEDGEMENTS
This dissertation is based on research I undertook while I was working at the International Livestock Centre for Africa (ILCA) in Addis Abeba, Ethiopia from 1979 to 1987. I am deeply grateful to ILCA for the opportunity to undertake this research, and for the excellent research facilities it provided. Particular thanks are due to Dr. P.J. Brumby, ILCA Director General from 1982 to 1986, who took a keen interest in this work and was a continuous source of encouragement throughout the research process. I have greatly appreciated his generous support, and benefitted tremendously from his sharp intellect and in-depth knowledge of the problems and opportunities of livestock production.
I am also very grateful to my promotors, Prof. D. Zwart and Prof. F.P. Jansen for the confidence they gave me, the support in preparing this dissertation, and their critical reviews of successive drafts. Their positive attitude and constructive comments were very encouraging, and gave me the strength to complete the task.
Dr. H. Bakker, formerly Professor of Tropical Animal Husbandry, encouraged me to undertake this dissertation and was very helpful in the initial stages of its preparation. I gratefully acknowledge his contributions and have very much appreciated our many interesting discussions.
My research at ILCA was undertaken within the framework of the Highlands Programme. I owe a great deal to Dr. Frank Anderson, Team Leader of this programme, who was an endless source of support and scientific advice. Frank was always available as a sounding board, generously provided ideas, and efficiently organized the logistical and administrative support needed to undertake the field research. He also assisted in the data analysis, and provided critical comments on draft papers I prepared. Many thanks are also due to Getachew Assamenew, Senior Technical Assistant Socio-Economics, who provided much appreciated assistance in the supervision of data collection and of data tabulation. Getachew was also very helpful in the management of the data files, assisted in data analysis and made useful comments on some draft chapters.
In undertaking field data collection, I enjoyed the solid support of a number of enumerators. They were a fine team that included Tesfayesus Seiro, Seifu Kebede, Kebede Aydefer, Asfawosen Haile, Isayas Alemayehu, Alemu Gemeda, Samuel Mesakal, Kinde Engada, Daniel Habte Wolde, Shiferaw Hailu and Abayneh Haile. Day to day supervision of their work was provided by the Technical Assistant Socio-Economics of the ILCA Debre Berhan Station which from 1979 to 1982 was Berhanu Wolde Kidane, and from 1983 to 1986 was Abebe Misgina. To all I am very grateful. They worked hard and meticulously under often difficult field conditions, and ensured a smooth cooperation with the farmers, the representatives of Peasants Associations and officials of the Ministry of Agriculture. Thanks are also due to Woldeab Wolde Mariam, Officer in Charge of the Debre Berhan Research Station, for providing administrative and logistical support, and extension services. He also organised many of the farmer field days. Abiye Astatke, Senior Technical Assistant Animal Traction, played a crucial role in developing the single ox technology, and was always available whenever needed in the field.

I also gratefully acknowledge the inputs of other staff of the Highlands Programme, particularly of Dr. Samuel Jutzi, Abate Tedla, Martie Wagenaar-Brouwer, Taye Wolde Mariam, Dr. I. Haque, Ephraim Bekele, Tadesse Tessema, Wagnew Ayelneh, Kelemework Asrat, Asfaw Yimegnuhal, Ferdawork Debele, Negussie Akalework, Dr. Michael Goe, Azeb Sahlemariam, Dr. Irene Whalen and the late Frank O'Mahony. In undertaking field work, I benefitted from the occasional assistance of graduate students and ILCA trainees, particularly of Dorothée Dersch, Aart Voorthuizen, Rita Giglietti and Maria Rosa Stevan.
ILCA's computer unit provided substantial assistance in the statistical analysis of the data and I am particularly grateful to Robin Sayers, Jeff Durkin, Darell Light and Dr. Trey Richardson. Other ILCA units that were very helpful in the research process were Documentation, Animal Nutrition, Cartography, Publication and Liaison.
I have greatly benefitted from the support and advice of Dr. Kurt Peters, ILCA Director of Research. Other ILCA staff that provided helpful thoughts and were very supportive included Dr. John Me Intire, Stephen Sandford, Cees De Haan, Dr. M. Sail, Dr. Jim Lambourne, Dr. John Tothill, Koen Geerts, Dr. John Trail, Simon Chater, Amde Wondafrash, Dr. John Walsh, the late Dr. Martyn Butterworth, John Thersby, and Barry Henricksen.
Thanks are also due to the staff of the Department of Tropical Animal Husbandry at Wageningen University. They were always helpful, interested and supportive. During the final stages of the write up I enjoyed the support of Dr. John Monyo, Executive Secretary of TAC, which was much appreciated.
A significant contribution was made by Dr. Jozef Deckers and his wife Koeki Claessens. In addition to their warm and generous friendship, they carefully read through successive drafts of this dissertation and gave many useful suggestions. Other friends that were helpful in one way or another include Jacqueline Snijder, Louk Ochtman, Dorothé Appels, Michiel Cherlet, Mia Savenberg, Kees Tuinenburg, Susann Hofs, Karl Herz, Gary Smith and Ann Stroud. I am also grateful to my family and friends for their moral support and understanding.
The many drafts of this dissertation were patiently typed by Merron Seifu, Gunilla Arner-Tamantini and Joanne Morgante. They deserve great credit for their hard and excellent work.
A special note of thanks is due to Ann. Her enthousiastic support and love, particularly during difficult periods, were of critical importance in writing up this dissertation.
This study would not have been possible without the full cooperation of the farmers of the Faji-Bokafia, Karafino, Kormargfia and Milki Peasants Associations. They were interested partners in the research process, provided many ideas and thoughts, and I greatly enjoyed the many discussions I had with them. They were always cheerful and cooperative and patiently replied to hundreds of questions with admirable knowledge and honesty. They taught me a great deal about farming, and generously provided insights into their way of life. I will never forget their warm hospitality and their sense of humour.

Yet, despite their high level of traditional agricultural skills, their life remains one of daily struggle for survival. I sincerely hope that this study will provide the outside world with a better understanding of their farming environment, and will ultimately contribute to greater food security for the smallholder farmer in the Ethiopian Highlands.
ABSTRACT
The productivity of livestock in sub-Saharan Africa in terms of milk and meat is the lowest of any world region. The outcome of livestock development projects has been disappointing. Low returns to investment in such projects have often arisen from poor project design, in turn the result of inadequate understanding of the relevant livestock production systems. Livestock in sub-Saharan Africa is concentrated on smallholder farms, where crop and livestock husbandry are practiced in association. The role of livestock in such "mixed" farming systems and the interactions between the crop and livestock components have often been poorly understood.
The highlands have the highest density of both the human and livestock populations of any major ecological zone in sub-Saharan Africa. Almost all the livestock of this zone can be found on mixed smallholder farms. Ethiopia accounts for 50% of the African highland landmass, and has the largest livestock herd on the African continent. This study reviews the role of livestock on mixed smallholder farms in the Ethiopian highlands.
The study takes a farming systems approach to research. It was undertaken within the framework of the Highlands Programme of the International Livestock Centre for Africa (ILCA). Field data were collected from 1979 to 1985 through farm management and household economic surveys of a total of 170 traditional smallholder farms located in four different Peasants Associations of the Baso and Worena district. The area is representative of the higher altitude zone of the Ethiopian highlands, and is located in a cereal-livestock zone. The farming system is based on smallholder rainfed subsistence agriculture, annual crops planted by broadcasted seed, rudimentary implements and an ox-drawn wooden plough, the 'maresha'. The results of this study show that livestock are of crucial importance to this farming system, and that there is a high level of crop-livestock integration. Livestock provide a dominant part of the farm's cash income and gross margin. The main outputs of cattle were intermediate products used as inputs into the crop production enterprise, such as draught power for land cultivation and crop threshing, and manure for fertilizer. The availability of animal draught power was a significant factor in determining the level of farm grain production. Livestock generated a substantial amount of employment, and was of prime importance in providing security and a source of investment to the farm household. Animals, particularly small ruminants, were sold according to cash flow needs, and purchased as a store of wealth. Donkeys provide almost all the transport of inputs and outputs of agricultural products. The data show that livestock productivity is low for final products, but high in terms of intermediate products. The main production and institutional constraints to increased farm output are identified and discussed. The principal constraint to the development of livestock production for increased offtake of meat and milk is the importance given by farmers to the intermediate functions of livestock.

Research on relevant technology to increase the productivity of livestock in the Ethiopian highlands is reviewed. At ILCA's experiment station in Debre Berhan, research was undertaken on possible interventions for the farming system of the Baso and Worena district. Two technologies related to smallholder livestock production appeared particularly promising: the use of crossbred dairy cows (Boran x Friesian) for milk production, and the use of a newly developed single-ox plough. The encouraging results of on-station research and an ex-ante evaluation using a linear programming model led to the initiation of farmer-managed on-farm trials of both technologies in the same peasants associations in which the diagnostic studies had been undertaken previously. The productivity of test farms was compared with that of other farms that served as a control. Crossbred dairy cows had significantly higher milk yields than cows of local breeds, incomes of dairy test farmers were significantly higher than those of control farmers, and no major problems were encountered in technology adoption. The major constraints to dairy development in the area were found to be a shortage of feed during the dry season, lack of milk marketing facilities particularly during the main fasting period, occasional disease problems of crossbred cattle, and the lack of appropriate breeding services. If adequate extension services can be provided, smallholder dairy production on the basis of crossbred cows could be an efficient vehicle for agricultural development in the area. Verification trials were also conducted on the utilisation and rate of adoption of the single-ox plough for land cultivation. Both utilisation and adoption were low. An important weakness of the technology appeared to be the poor structural stability of the single-ox unit compared with the traditional 'maresha' plough drawn by a pair of oxen. The research findings suggest that single-ox ploughing may be useful for seed covering operations, but could not replace the use of paired oxen for land cultivation.
The study concludes with an appraisal of the methodological approach taken in the research process, and a discussion of the transferability of the research results that were obtained. The implications of the study for future research work on agriculture and livestock in the Ethiopian highlands are also discussed.

TABLE OF CONTENTS
ACKNOWLEDGEMENTS
ABSTRACT
TABLE OF CONTENTS
LIST OF TABLES AND ANNEXES
LIST OF FIGURES
1. BACKGROUND TO LIVESTOCK DEVELOPMENT IN SUB-SAHARAN AFRICA
1.1. Introduction 1.2. Contribution of Livestock to Agricultural Development 1.3. Livestock Production Systems 1.4. Crop-Livestock Production Systems in the Highlands 1.5. Objectives of the Study
Page
vi
ix
xiii
1
1
4 11 16 19
2. RESEARCH ON SMALLHOLDER MIXED CROP-LIVESTOCK FARMING SYSTEMS 21
2.1. The Need for Research 21 2.2. The Farming Systems Approach to Research 23 2.3. Farming Systems Research in Mixed Crop-Livestock
Agriculture 27 2.4. Need for Additional Studies 33
LIVESTOCK PRODUCTION IN THE ETHIOPIAN HIGHLANDS 35
3.1. Agriculture in Ethiopia 35 3.1.1. Introduction 35 3.1.2. The Economy 37 3.1.3. Topography and Climate 39 3.1.4. Framework for Rural Development 40 3.1.5. Agricultural Production 41 3.1.6. Importance of the Highlands 43
3.2. Research on Farming Systems in the Highlands 44 3.2.1. Zonation of the Ethiopian Highlands 44 3.2.2. Livestock Production Systems 45 3.2.3. Research and Development Efforts 48
3.3. A Case Study: Research on a Smallholder Mixed Farming System in the Baso and Worena Woredda of the Ethiopian Highlands 51 3.3.1. Background 51 3.3.2. Objectives of the Field Research 54 3.3.3. Research Design, Data Collection and Data Analysis 55

4. RESOURCE ALLOCATION BY SMALLHOLDER FARMERS IN THE BASO AND WORENA WOREDDA 62
4.1. Introduction 62 4.2. Production Environment and Ecology 63
4.2.1. Physiography and Soils 63 4.2.2. Agro-Ecological Characteristics 64
4.3. Family Size and Composition 67 4.3.1. Capital Assets 68
4.4. Farm Holding, Land Use and Land Productivity 70 4.4.1. Farm Holding 70 4.4.2. Land Productivity for Crop Production 72 4.4.3. Land Productivity for Fodder Production 80
4.5. Livestock Holdings, Management and Productivity 82 4.5.1. Background 82 4.5.2. Livestock Holdings 82 4.5.3. Livestock Husbandry 89 4.5.4. Livestock Productivity 90
4.5.4.1. Cattle 90 4.5.4.2. Small Ruminants 93
4.6. Labour Use and Time Allocation 96 4.6.1. Introduction 96 4.6.2. Labour Inputs in Crop Production 97 4.6.3. Labour Inputs in Livestock Production 104 4.6.4. Other Labour Inputs in Farm Production 109 4.6.5. Returns to Labour in Crop Production 110 4.6.6. Returns to Labour in Livestock Production 111
4.7. Use of Animal Draught Power 111 4.8. Subsistence Food Economy and Marketing 115
4.8.1. Nutrition and Health 115 4.8.2. Marketing 119
4.8.2.1. Introduction 119 4.8.2.2. Government Impact on Marketing 120 4.8.2.3. Marketing of Crops 121 4.8.2.4. Marketing of Livestock and Livestock
Products 124 4.9. Farm Incomes and Gross Margins 125
4.9.1. Cash Incomes 125 4.9.2. Gross Margins and Value of Production 128
4.10. Role of Livestock and Interactions with Crop Enterprise 133 4.10.1. Introduction 133 4.10.2. Draught Power and Grain Production 133 4.10.3. Livestock for Security and Investment 139 4.10.4. Crop-Livestock Interactions 141
4.11. Major Constraints to an Increase of Farm Output 145 4.11.1. Introduction 145 4.11.2. Factors Limiting the Productivity of Crop
Enterprises 146 4.11.3. Factors Limiting the Productivity of Livestock
Enterprises 147 4.11.4. Institutional Constraints 149
TECHNOLOGICAL OPTIONS FOR ON-FARM VERIFICATION 151
5.1. Introduction 151 5.2. An Overview of Possible Interventions 153
5.2.1. Draught Animal Usage 153

5.2.2. Improved Breeds 156 5.2.2.1. Cattle 156 5.2.2.2. Small Ruminants 159
5.2.3. Animal Feed and Nutrition 160 5.3. An Ex-ante Evaluation of Proposed Interventions 161
6. INTEGRATION OF CROSSBRED COWS AND FORAGES IN THE FARMING SYSTEM 171
6.1. Introduction 171 6.2. Materials and Methods 171 6.3. Results 173
6.3.1. Background Information on Dairy Test Farmers 173 6.3.2. Farm Holdings, Land Use and Productivity 173 6.3.3. Livestock Holdings and Productivity 176 6.3.4. Productivity of Crossbred Cows 179
6.3.4.1. Reproduction Characteristics 179 6.3.4.2. Production Characteristics 180
6.4 Farm Incomes and Gross Margins 182 6.4.1. Marketing 182 6.4.2. Gross Margins and Incomes 183 6.4.3. Cash Incomes 183 6.4.4. Effects on Gross Margins 184
6.4.4.1. Crop Gross Margin 184 6.4.4.2. Gross Margin from Traditional Livestock
Production 185 6.4.4.3. Gross Margin from Crossbred Cow
Enterprise 185 6.4.4.4. Overall Farm Gross Margin 188
6.4.5. Effect on Human Nutrition 189 6.5. Constraints to Dairy Development 189
6.5.1. Background 189 6.5.2. Feed 189 6.5.3. Marketing 190 6.5.4. Disease 191 6.5.5. Breeding 191
6.6. Discussion 192
7. USE OF SINGLE OXEN FOR CROP CULTIVATION 193
7.1. Introduction 193 7.2. Materials and Methods 193 7.3. Results 195 7.4. Discussion 197
8. SUMMARY AND DISCUSSION 200
8.1. Summary 200 8.2. Transferability of Results 205 8.3. Evaluation of Methodology 207 8.4. Implications for Future Research 211
LIST OF ABBREVIATIONS, ACRONYMS, SIGNS AND UNITS 214
REFERENCES 217
SAMENVATTING 247
CURRICULUM VITAE 249

LIST OF TABLES AND ANNEXES
CHAPTER ONE
Table 1.1.
Table 1.2.
Table 1.3.
Value of Total and Regional Livestock Production by Kind of Output in Sub-Saharan Africa (1975) Distribution of Area, Rural Population and Different Species of Ruminant Livestock by Ecological Zone of Sub-Saharan Africa (% of total in SSA) Size of Highland Areas in Sub-Saharan Africa by Region and Ecological Zone
Page
12
18
CHAPTER TWO
Table 2.1.
Table 2.2.
Annual Yield of Livestock and Major Crops in Ethiopia, Kenya and Tanzania 21 Comparison of Characteristics of Crops and Livestock and Implications for On-Farm Testing 28
CHAPTER THREE
Table 3.1. Characteristics of the Major Agro-Ecological Zones in the Ethiopian Highlands 44
Table 3.2. Characteristics of Baso and Worena Woredda 54 Table 3.3. Size of Human and Livestock Populations of the 4
Sample PAs 55 Annex 3.1. Specification of Data Collected in Farm Surveys at
Baso and Worena Woredda 60 Annex 3.2. Size of Data Sample (No. of Farmers/PA) 60 Annex 3.3. Area of Land Use of Sample PAs by Source of
Estimate (ha) 61 Annex 3.4. Land-Use Sample PAs (1984, % of Total Area) 61
CHAPTER FOUR
Table 4.1. Meteorological Records Debre Berhan (1979-1984) 66 Table 4.2. Farm Size and Land Use Patterns, 1979-1984 (ha) 70 Table 4.3. Proportion of Farmers Growing 'Belg' Crops and Size of
'Belg' Area Sown 72 Table 4.4. Annual Cropping Pattern of Control Farms (1979-1984) 73 Table 4.5. Average Gross Crop Yields During Belg and Meher
Seasons (1979-1984, Kg/Ha) 74 Table 4.6. Average Net Crop Yields (1979-1984, Kg/Ha) 75 Table 4.7. Proportion of Farmers Using Mineral Fertilizer and
Average Quantity Used Per Farmer (1979-1984) 77 Table 4.8. Fertilizer Response of Barley and VCRs (1979-1983) 78 Table 4.9. Cost of Mineral Fertilizer at Debre Berhan (1979-1984) 78 Table 4.10. Effect of Planting Date on Barley Yields 80 Table 4.11. Average Annual Straw Yields (1979-1984, Kg/Ha) 80

Table 4.12. Grain/Straw Ratio Estimates (1979-1984) Table 4.13. Feed Quality of Hay, Straw and Natural Grass in
Baso and Worena Woredda Table 4.14. Mean Livestock Holdings Control Farmers (No. of
Animals/Fa™, 1979-1984) Table 4.15. Distribution of Livestock Holdings (Mean 1979-1984) Table 4.16. Conversion Procedures for Metabolic Weight and TLU
Holding Table 4.17. Herd and Flock Structure Table 4.18. Feed Balance (% Feed Available/Feed Required) Table 4.19. Frequency of Watering by Class of Cattle and by
Season (% of Farmers) Table 4.20. Sheep Productivity Table 4.21. Seasonality of Mortality of Sheep and Lambs
(% of Flock, 1983/1984) Table 4.22. Labour Inputs in Crop Production (1979-1981) Table 4.23. Labour Input Per Crop Production Activity Table 4.24. Average Labour Input Per Crop (Hrs/Ha, Mean
1979-1981) Table 4.25. Labour Allocation by Activity and by Crop (Hrs/Ha,
Mean 1979-1981) Table 4.26. Modal Planting Weeks for Major Crops Table 4.27. Modal Harvesting Weeks for Major Crops Table 4.28. Monthly Distribution of Labour Inputs for Crop
Production by Activity (Hrs/Farm, Mean 1979-1981) Table 4.29. Use of Female, Child, Hired and Exchange Labour
(Hrs/Farm) Table 4.30. Saints' Days and Religious Holidays in the Baso and
Worena Woredda Table 4.31. Labour Inputs in Livestock Production (Hrs/Farm) Table 4.32. Time Allocation of Household Heads (1981) Table 4.33. Time Allocation to Field Work by Different Family
Members (1981) Table 4.34. Association Work of Control Farmers (1984) Table 4.35. Returns to Labour for Different Crops (1979-1981) Table 4.36. Animal Power Input for Crop Production by Activity
(Hours/Farm, 1979-1981) Table 4.37. Weight of Donkey Load by Commodity Table 4.38. Animal Power Inputs for Crop Production by PA
(1979-1981) Table 4.39. Animal Power inputs per Crop (Hours/Ha, Mean
1979-1981) Table 4.40. Fasting Periods Christian Orthodox Church Table 4.41. Grain Production and Use Per Farm (1981, Kg/Farm) Table 4.42. Proportion of Household Members in Various Categories
Height for Weight (December 1982) Table 4.43. Differential Prices Paid at Debre Berhan Market,
December 1985 (Birr/Qt) Table 4.44. Mean Consumer Prices for Major Crops at Debre
Berhan Market (1979-1984, Birr/Quintal) Table 4.45. Monthly Consumer Prices of Major Crops at Debre
Berhan Market (Mean 1979-1983, Birr/Quintal) Table 4.46. Prices of Straw and Hay at Debre Berhan Market
(1979-1984, Birr/Kg)
81
81
84 85
85 86 90
93 95
96 98 99
99
99 100 100
101
102
103 107 109
109 110 110
112 112
113
113 116 117
118
121
122
122
123

Table
Table
Table
Table
Table Table Table Table Table
Table Table Table Table
Table
Table Table
4
4
4
4
4 4 4 4 4
4 4 4 4
4
4 4
47
48
49
50
51 52 53 54 55
56 57 58 59
60
61 62
Table 4.63.
Table Table Table Table Table
4 4 4 4 4
64 65 66 67 68
Table 4.69.
Table 4.70. Table 4.71.
Monthly Prices of Straw and Hay at Debre Berhan Market (Mean 1979-1983, Birr/Kurbet) 123 Livestock Prices at Debre Berhan Market (1979-1983, Birr/Animal) 124 Monthly Livestock Prices at Debre Berhan Market (Mean 1979-1983, Birr/Animal) 124 Price of Livestock Products at Debre Berhan Market (1979-1983, Birr/Year) 125 Cash Income from Farm Sources (1979-1984, Birr/Farm) 126 Cash Income from Animal Trade (1980-1983, Birr/Farm) 127 Off-Farm Cash Income (1979-1981, Birr/Farm) 127 Household Expenses and Purchases (1980, Birr/Farm) 128 Gross Margins of Major Crops, Fallow and Pasture (1979-1983, Birr/Ha) 129 Gross Margins from Livestock (1979-1983, Birr/Farm) 129 Gross Margin Per Unit of Livestock (Birr/Animal) 130 Farm Gross Margin by Enterprise (Birr/Farm) 131 Annual Gross Margin Including Intermediate Products Per Unit Livestock Enterprise (Birr/Animal) 131 Farm Gross Margins Including Intermediate Products (Birr/Farm) 132 Gross Value of Production (Birr/Farm, 1979-1983) 133 Least Squares Estimate of Gross Cereal Yield (kg/ha) from the Interaction of Year and Level of Ox Ownership 137 Least Squares Estimate of Total Net Cereal Yield from the Interaction of Level of Oxen Ownership and Year (1979-1984, Kg/Farm) 137 Area of Belg Plantings by Ox Holding (m2/Farm) 138 Annual Rate of Return Sheep Enterprise 140 Annual Rate of Return Cattle Enterprise 140 Livestock Sales (1984) 141 Stocking Rates by Cultivated Area (No. of Livestock/ Farm/Ha) 142 Mean Cultivated Area, Fallow Area, Pasture Area, and Productivity of Cereal Straws by Different Farmer Groups 142 Grain Sales by Ox Holding (Birr/Farm) 143 Fertilizer Use by Livestock Holding 143
CHAPTER FIVE
Table 5.1 Draught Power Developed and Feed Consumed by a Pair of Local and a Pair of Crossbred Oxen 158
Table 5.2. Expected Costs and Returns of a Crossbred Cow Enterprise in the Baso and Worena Woredda (Birr/Cow) 169
Table 5.3. Mean and Standard Deviation (SD) of Net Farm Income Corresponding to Alternative Livestock Technologies (Birr/Farm) 170
CHAPTER SIX
Table 6.1. Farm Size and Land Use Pattern DTF (1983-1985) 174 Table 6.2. Cropping Pattern DTF (Meher Seasons 1983-1985, %
Cultivated Area) 174 Table 6.3. Gross and Net Crop Yields DTF (1983-1985, kg/ha) 175

- Xll -
Table 6.4. Net Yields Major Crops DTF and Control Farmers (1983-1985, kg/ha) 175
Table 6.5. Fertilizer Use by CF and DTF (% of Farmers Using) 176 Table 6.6. Feedstuffs of Different Types Offered to Crossbred
Cows (% of Farmers Giving) 176 Table 6.7. Livestock Holdings of CF and DTF (TLU Equivalent per
Farm, 1983-1985) 177 Table 6.8. Mean Livestock Holding DTF by Type (1983-1985) 178 Table 6.9. Fodder Amounts Fed to Crossbred Animals (Kg/Farm) 178 Table 6.10. Holdings of Crossbred Cattle (Mean per Farm,
1983-1985) 179 Table 6.11. Mean Production Results of Crossbred Cows by
Lactation Number 180 Table 6.12. Monthly Means of Milk Production Per Cow (1983-85,
Kg/Month) 181 Table 6.13. Disposal of Milk Production from Crossbred Cows
(Kg/Farm) 183 Table 6.14. Cash Incomes of DTF and Control Farmers by Source,
(1983-1985, Birr/Farm) 183 Table 6.15. Gross Margin Per Crop for DTF and CF (1983-1985,
Birr/Ha) 184 Table 6.16. Gross Margins from Crop Production for DTF and CF
(1983-1985, Birr/Farm) 184 Table 6.17. Gross Margin of CF and DTF from Traditional
Livestock Production (1983-1985, Birr/Farm) 185 Table 6.18. Average Cost of Feed per Farm Per Year by Feed Type,
for the Crossbred Cow Enterprise 186 Table 6.19. Costs and Returns of Crossbred Cow Enterprise
(1983-1985, Birr/Farm) 187 Table 6.20. Overall Farm Gross Margin DTF and CF (1983-1985,
Birr/Farm) 188
CHAPTER SEVEN
Table 7.1. Use of Single Ox Ploughing System (1983-1985, Area Per Farm) 195
Table 7.2. Mean Crop Yields on Plots Ploughed by Single and Paired Oxen (Kg/Ha) 196

- XT 1 1 -
LIST OF FIGURES
CHAPTER ONE Page
1.1. Importance of Draught Animals in Africa 8 1.2. Environmental Zones in Sub-Saharan Africa 13 1.3. The Highlands of Sub-Saharan Africa 17
CHAPTER TWO
2.1. Interactions Between Station-Based Technical Research and On-Farm Adaptive Research 26
2.2 Crop-Livestock Interactions in Mixed Farming Systems 31
CHAPTER THREE
3.1. Map of Ethiopia 36 3.2. Zonation of the Ethiopian Highlands (based on altitude and
agro-ecology) 46 3.3. Location of the Baso and Worena Woredda 52 3.4. Location of Control, Single Ox and Dairy Test Farmers in the
Baso and Worena Woredda 56
CHAPTER FOUR
4.1. Main Factors Influencing Enterprise Choice and Productivity of an Ethiopian Smallholder 62
4.2. Growing Period Characteristics at Debre Berhan 64 4.3. Distribution of Rainfall at ILCA Research Station at Debre
Berhan (1979-1984, mm per Month) 65 4.4. Frequency Distribution of Area Cultivated by Control Farmers 71 4.5. Effect of Length of Growing Period on Crop Yields in Baso and
Worena Woredda (1979-1984) 75 4.6. Crop Yield and Holding of Small Ruminants (1979-1985) 83 4.7. Liveweight of Livestock Holding by Farmer and Area Cultivated 87 4.8. Livestock Holding by Farmer and Area Cultivated 88 4.9 Production of Cereal Straw by Farmer and Area Cultivated 88 4.10. Seasonality of Calving (% of Calves Born/Month) 91 4.11. Seasonality of Lambing (Lambing %/Month) 95 4.12. Distribution of Labour Inputs for Crop Production (Hours of
Labour per Farm per Month) 97 4.13. Incidence of Religious Holidays per Month 104 4.14. Distribution of Labour Inputs for Crop and Livestock
Production 108 4.15. Distribution of Animal Power Inputs for Crop Production
(Hours per Farm, Mean 1979-81) 114 4.16. Area Cultivated with Cereals for Three Levels of Oxen
Ownership (Ha/Farm) 136 4.17. Total Net Farm Cereal Production for Three Levels of
Oxen Ownership (Kg/Farm) 138 4.18. Mean Crop Yields by Livestock Holding 144
CHAPTER FIVE
5.1. Linkages Among the Principal Components being Researched by ILCA's Highlands Programme 152
CHAPTER SIX
6.1. Monthly Milk Production of Crossbred Dairy Cows and Monthly Rainfall 182
CHAPTER SEVEN
7.1 Traditional and Modified Yoke and 'Maresha' Plough 193

BACKGROUND TO LIVESTOCK DEVELOPMENT IN SUB-SAHARAN AFRICA
1.1. Introduction.
Food production per caput in sub-Saharan Africa has declined sharply during the last two decades, and this has resulted in a widespread food crisis and an increasing dependence on food imports (Eicher, 1982; Congress of the United States, 1984; World Bank, 1981a and 1984a; FAO, 1986a; Mellor et al, 1987). There is an urgent need to increase the productivity of agriculture in sub-Saharan Africa to revert this trend and to ensure greater food security. Efforts to improve food security need to focus on agricultural production rather than food production only, because of the income and employment generating capacity of non-food crops and livestock (Eicher, 1982; Pinstrup-Andersen, 1983).
The importance of domesticated animals in agriculture and economic development has been well documented (Winrock, 1978; Crotty, 1980; FAO, 1983a; Nestel, 1984). They are a major source of high quality food, provide substantial inputs into crop production, and contribute a major part to cash income of smallholders, for whom they also serve as a form of security and investment.
Sub-Saharan Africa consists Of 46 countries (FAO, 1986b) and is a region of extreme diversity in terms of climate, ecology, environment, population, culture, political system and economic management. This diversity is also reflected in the region's agricultural systems. Livestock production varies from pastoral nomadism to integrated systems with crop agriculture. In many areas, the nature of livestock production systems corresponds to stages in the development of land use. Virgin land is usually exploited first by livestock and then used for crop production, with eventual integration of livestock and crop production (Hawksworth, 1984).
Livestock production systems in sub-Saharan Africa are predominantly subsistence oriented, and relatively concentrated geographically in areas which are tsetse free or only lightly infested (ILCA, 1980a). Traditional pastoralism is usually found in fragile environments under constant threat of drought, and characterized by overgrazing and resource degradation. Pastoralists are people who derive most of their income or subsistence from keeping domestic livestock that are fed on natural forage, rather than cultivated fodders and pastures (Sandford, 1983). Although recent evidence suggests that pastoralists manage their resources efficiently (Breman and de Wit, 1983; Cossins, 1985; Grandin, 1987), their production system is under increasing pressure as the availability of traditional rangelands is steadily reducing because population growth in Africa has led to an expansion of areas cropped. The declining amount of rangelands and inappropriate government and land tenure policies have resulted in overgrazing and land degradation (ILCA, 1980b). Overstocking is encouraged by the tenure status of these rangelands, because pastoralists lack incentives and alternative investment opportunities to adjust the size of their individual herd to the carrying capacity of the grazing lands that are communal (Lele, 1984). To date, research efforts have failed to identify

technical innovations that can substantially increase productivity of these pastoral systems, and in the short run only changes in government policies could bring welfare gains for the populations involved (ILCA, 1987a). As pastoralists introduce some cropping in their production system, they become agropastoralists, but still derive the major part of their income from livestock production. As the cropping intensity increases, livestock and crop production gradually become more integrated in a mixed farming system. Mixed farms are management units in which livestock husbandry is practised in association with crop production (Jahnke, 1982). During the last decade, increasing attention has been given to the problems and opportunities of livestock production in mixed farming systems.
The productivity of livestock in terms of milk and meat in sub-Saharan Africa has been the lowest of any world region. During the last two decades increases in livestock output have been largely due to a numeric expansion of herds and flocks, rather than an improvement of yield per animal (Anteneh, 1984). Substantial investments were made in livestock development projects throughout sub-Saharan Africa. From 1974 to 1983, annual external aid (not including FAO and UNDP projects) for livestock projects in Africa averaged US$ 78.9 million per year (FAO, 1986c). The economic and technical performance of these livestock projects have generally been disappointing. From 1960 to 1985, the World Bank invested approximately 1.34 billion US$ in livestock projects in sub-Saharan Africa. A World Bank audit of these projects found that only 38% of them had an Economic Rate of Return (ERR) of more than 10%, and that 36% of projects had a negative rate of return. The overall ERR averaged -.8% for livestock projects in Eastern and Southern Africa and -2.7% in Western Africa (World Bank, 1985a). Another major donor, USAID, had similarly low performance records of its livestock projects in the region (Hoben, 1979; Atherton, 1984).
A major cause of the low return to investment in livestock has been inappropriate project design which resulted from a lack of adequate understanding of livestock production systems, given the complex relationships between the biological, technical and social components of these systems (Brumby, 1982). In their survey of the literature on agricultural development in sub-Saharan Africa, Eicher and Baker (1982) noted that there had been little rigorous research by economists on the motives of keeping cattle and that "research on the behaviour of livestock herders in Africa is about at the same point where research was on the economics of crop production some 20 years ago - many assertions and a sparse supply of facts". The same authors highlighted the need to give high priority in livestock research to an improvement of the data base, to problem solving research under field conditions, and to acquiring basic knowledge of the interaction between the cropping and livestock subsectors in mixed farming systems.
The lack of basic knowledge of livestock production systems, despite their critical importance to subsistence for millions of smallholders and pastoralists in sub-Saharan Africa, led to the establishment of the International Livestock Centre for Africa (ILCA) in 1974 (Gryseels et al, 1986a). ILCA's foundation report stated that

"technical answers are available to many of the specific problems facing livestock development in Africa. The major constraint lies rather in the difficulty of introducing change into existing socio-economic systems, combined with inexperience in adapting technologies to suit local conditions" (Nesteletal, 1972).
The majority of livestock can be found on mixed farms, which account for 59% of ruminant animal units in Africa (Wheeler, 1982). These mixed farms are usually "small", although this categorization has been subject of much debate (Wharton, 1969; Valdes et al, 1979). According to Dillon and Hardaker (1980), a precise definition of "small farmers" is not required to recognize the reality of their plight, or their importance in world development. Two characteristics stand out: their small size in terms of resources, and their low income levels.
Although the importance of livestock in smallholder mixed farming systems of sub-Saharan Africa has been acknowledged (Musangi, 1971; Sprague, 1976; McDowell, 1978a and b and 1979; McDowell and Hildebrand, 1980; Ruthenberg, 1980), relatively little quantitative information is available on the role and contributions of livestock on these farms, and efforts to increase their productivity have been largely unsuccessful. While agronomists, economists and anthropologists tended to ignore the contribution of livestock on small farms, animal scientists had little concern for understanding the constraints to animal production on these farms, and have been reluctant to accept the concept that biological and economic efficiency do not always coincide (McDowell, 1978b).
Mixed farming systems can be found across all ecological zones, except the arid zone, of sub-Saharan Africa. In the highland and humid zones, almost all livestock are owned by mixed farmers. The highlands form the ecological zone with the highest density of both human and livestock populations. Although this zone accounts for only 5% of the total land mass of sub-Saharan Africa, the area contains almost 20% of the human and 17% of its ruminant livestock population (Jahnke, 1982). Ethiopia alone accounts for approximately 50% of the highland area, and the majority of highland livestock of sub-Saharan Africa (Getahun, 1978a).
The disappointing experiences of most livestock development projects, which showed that Western technology and the results of classical on-station research could not be transferred directly to African conditions, reinforced the view that attempts to increase the productivity of smallholder agriculture would need to be based on a sound knowledge of the existing farming systems. A better understanding of these systems and adaptive research would be necessary for the identification of relevant improvements (McDowell and Hildebrand, 1980; Gryseels et al, 1986a; ILCA, 1987a).
This study reviews the role of livestock on mixed smallholder farms of the Ethiopian highlands. Using a farming systems approach, it characterises in detail the allocation of resources on smallholder farms in a representative area of the Ethiopian highlands, and reports on research efforts to increase the productivity of the livestock component of this mixed crop-livestock agricultural system. The knowledge and

experiences gained have implications for the methodology of identification, appraisal and resolving problems of smallholder livestock production systems elsewhere in the highlands of sub-Saharan Africa.
1.2. Contribution of Livestock to Agricultural Development
Domesticated livestock in sub-Saharan Africa can be broadly categorized in large ruminants (cattle and camels), small ruminants (sheep and goats), equines (donkeys, mules and horses), pigs and chickens. Ruminant livestock and equines can be grouped as grazing animals, i.e. animals that depend largely on grazing for nutrition.
Having converted different species of livestock into a common reference unit of Tropical Livestock Unit (TLU, or an animal of 250 kg liveweight), Jahnke (1982) estimated that ruminants were of overwhelming importance, accounting for 91.4% of the livestock population of tropical Africa. Equines accounted for 4.8%, and pigs and chicken for 3.8% of the total TLU population.
The prime importance of ruminants to mankind lies in their ability to convert grass and other fibrous forage into food and other useful products, thereby utilizing plant materials for which there would otherwise be little alternative use.
The contribution of livestock to economic development of Africa and elsewhere has been well documented (Ward, 1974; Vandemaele, 1977; Winrock International, 1978; Wheeler, 1982; Jahnke, 1982; Prince Leopold Institute of Tropical Medicine, 1982; FAO, 1983a; Bernsten et al, 1984; Nestel, 1984; Lebbie, 1984). Livestock play a variety of economic and social roles in sub-Saharan Africa. They provide food outputs (milk, meat, and blood), inputs into crop production (manure, draught power), and other outputs (hides and skins, transport). Trade in livestock and livestock products provides cash farm income. Livestock are also a form of investment and security in which savings can be kept. In many societies, livestock ownership also provides prestige.
On the macro-economic level, the livestock sub-sector contributes approximately 17% of total agricultural Gross Domestic Product (GDP) of tropical Africa, or about 5% of total GDP. In absolute terms, the annual value of livestock production has been estimated at US$ 6 billion, using 1975 prices (Jahnke, 1982). This estimate includes only the value of commodity outputs, not the intermediate products such as draught power or manure. On the basis of data from 1975 also, ILCA (1987a) estimated the total gross value of food and non-food outputs of ruminant livestock in sub-Saharan Africa, not including hides and skins, at US$ 6,486 million (Table 1.1). According to ILCA's calculations, meat is the single most important form of livestock production, accounting for 47% of the value of total output. Beef alone accounts for 55% of meat output. The next most important livestock output is animal traction, accounting for 31%. The importance of this latter output is regionally orientated however, as it is produced for 75% in East Africa. The transport value of livestock was not included in the calculations however. Milk accounts for 15% of the total value of livestock output.

Table 1.1.: Value of Total and Regional Livestock Production by Kind of Output in Sub-Saharan Africa a/(1975)
Kind of Value in US$ millions (b) output WA CA EA SA SSA
Animal traction c/ 312 ( 21) d/ 11 ( 3) 1474 ( 39) 239 ( 26) 2036 ( 31) Manure e/ 62 ( 4) 5 ( 1) 111 (3) 16 ( 2) 194 ( 3) Meat f/ 811 ( 56) 277 ( 79) 1410 ( 38) 545 ( 58) 3043 ( 47) Milk 160 ( 11) 40 ( 12) 644 ( 17) 85 ( 9) 929 ( 15) Eggs 115 (8) 16 ( 5) 108 ( 3 ) 45 ( 5) 284 ( 4)
Total 1460 (100) 349 (100) 3747 (100) 930 (100) 6486 (100)
a/ Includes only food and food-related outputs, both marketed and non-marketed.
b/ Output was valued at uniform, continent-wide prices (1975). The prices used were: meat $ 1,000, milk $ 150 and eggs $ 750, all expressed in US$/tonne. Animal traction was valued at US$ 5.2/ox-day worked. WA = West Africa; CA = Central Africa; EA = Eastern Africa; SA = Southern Africa; SSA - Sub-Saharan Africa.
c/ Includes field operations by bovines only. 3/ Figures in parentheses indicate percentages of column totals. e/ Valued at the equivalent commercial fertilizer prices of the plant
nutrients contained. f/ Includes beef, goat, mutton, pork and poultry meat.
Source: ILCA (1987a).
These findings are in contrast with those of Jahnke (1982) who estimated that milk was the most important livestock output. His calculations included only meat, milk and eggs, and were on the basis of grain equivalents. The differences between both outcomes can further be attributed to the assumptions regarding the values of commodity outputs. Whereas ILCA has assumed in its calculations values per tonne of US$ 1,000 for meat and US$ 150 for milk, Jahnke applied import parity prices of US$ 640 for meat and US$ 272 for milk.
Over the last two decades, per caput meat and milk production in sub-Saharan Africa has remained static or declined. There was no clear pattern in the production trends between regions. Beef production grew at 2% p.a. in the first decade and 2.4% p.a. in the second. Cow milk output grew at 1.2% p.a. in the first decade, and 3.5% in the second (ILCA, 1987a). The growth in human population was approximately 3% p.a. (FAO, 1986b).
The demand for livestock products increased strongly, leading to a rapid increase of dairy imports (Brumby and Gryseels, 1985). Dairy imports increased 8% a year during 1961-70, and by 12% a year during 1970-80. By 1979-81, one third of all the dairy products consumed in Africa were imported. Sub-Saharan Africa also imported substantial quantities of meat, averaging 139,000 tonnes annually from 1983-85, for a value of US$ 184 million (FAO 1986a and b ) .

The rapid increase in the demand for livestock products has been linked to its high income elasticity and the economic growth that occurred in sub-Saharan Africa during the sixties and 1970s. De Montgolfier-Kouevi and Vlavonou (1983) estimated the average income elasticity of demand at 0.98 for meat, 0.82 for milk and 1.10 for eggs. These values were more than four times higher than similar estimates for staple foods. The demand for livestock products in sub-Saharan Africa was projected by the same authors to grow by 3.8% for milk and 4.2% for meat per annum until the year 2000.
Sarma and Yeung (1985) found somewhat lower estimates of income elasticities of demand for livestock products in sub-Saharan Africa. Their estimate of the income elasticity of demand for meat was 0.79, for milk 0.68 and for eggs 1.05. For cereals they found a corresponding value of 0.16.
While imports have been rising, exports of livestock products from Africa have been declining. The volume of meat exports decreased at an average annual rate of 4% over the last decade (ILCA, 1987a). This deteriorating trade position can be attributed to the decline in real international meat prices, overvalued exchange rates, dumping practices by developed countries, the effects of drought, and the growth in domestic demand (ILCA, Ibid). Beef exports in Western and Central Africa are mainly intraregional between the Sahel zone and the Atlantic coast area. Eastern and Southern Africa account for approximately two thirds of beef exports in Tropical Africa, and export mainly to countries of the EEC and the Middle East area (ILCA, 1979a).
On the basis of FAO (1986b), total annual export earnings from trade in meat can be estimated (using the mean of 1979-81 export quantities) at US$ 236 million per annum (assuming a value of US$ 1,000 per tonne) and at US$ 91 million from trade in hides and skins. Hides and skins are the most important non-food livestock commodity output of livestock. Total value of non-food products averages US$ 420 million per year or 7.5% of the value of food outputs (Jahnke, 1982).
The value of the commodity output of livestock at domestic price ratios has been estimated by Sandford (1986) to be the equivalent of 25% of staple food crops.
Animal products provide approximately 6.5% of dietary energy supply of sub-Saharan Africa (FAO, 1987a), ranging from 2.1% in Rwanda to 26.2% in Somalia (FAO, 1986b). The contribution to human nutrition of livestock products is particularly important through the supply of high quality protein. Bernsten et al (1984) estimated that meat and milk products accounted in Africa for 17% of digestible protein retained, and supply almost all the amino acids required by humans. Sandford (1986) found the contribution of animal products to protein supply to be 20%. Although the contribution of livestock to human diet may appear low compared to the world averages of 16% to energy supply and 34% to protein intake (FAO, 1987a), among particular groups of pastoralists the ratio is much higher and in many traditional societies livestock products play an important role as a food source seasonally (Gryseels and Whalen, 1984).
In addition to commodity or final outputs, livestock also supply intermediate products, which are used as inputs in the crop enterprise. The most important intermediate livestock product is draught power. Although it has been estimated that animal traction is the second-most valuable livestock output (Table 1.1), its importance is not spread equally across Africa. Estimates of the numbers of draught animals vary widely, but are estimated by Jahnke (1982) as 13 million cattle, 6 million equines, and 5 million camels. These provide draught power for land cultivation, threshing, and transport. Cattle are used usually for ploughing, soil preparation, seeding and threshing. Equines and camels are particularly important for transport of loads and people. Figure 1.1. shows the importance of animal traction in various countries of Africa. The use of animal traction for crop cultivation can be traditional or introduced, but is widespread in Ethiopia, Botswana, Madagascar, Niger, Burkina Faso, Mali and Senegal. The effects of animal traction have been subject of much debate (ILCA, 1981a; Sargent et al, 1981; FAO, 1984a; Eicher and Baker, 1982; Munzinger, 1982; Goe and Gryseels, 1983; Anderson, 1984; FAO, 1984a) but a comprehensive quantitative evaluation has been provided by Pingali, Bigot and Binswanger (1986). The technical aspects of draught animal usage, and the implications for future research have been reviewed by Goe and Mc Dowell (1980) and Goe (1983).
The potential contribution of animal draught power to crop production can be achieved through an increase in the cultivated area, a change in cropping pattern, higher yields or an improvement of labour productivity. The area effect has been the most important component in empirical studies, whereas cropping pattern and yield effects were usually small. Pingali et al (1986) found that the area cultivated per family was on average 25% greater where animal traction had been introduced. About two-thirds of the studies they reviewed reported that the introduction of animals had an effect on cropping pattern, but only 28% reported any effect on yield. Their study was almost exclusively based however on projects in West Africa, except for one in Kenya. In the areas under consideration, animal traction had been only recently introduced and was not a traditional practice.
The concentration of animal traction usage in highland and semi-arid ecological zones is determined by two major factors. In highland areas, many of the soils are of the heavy clay type and difficult to cultivate. The use of animals then reduces substantially human drudgery. In areas such as the semi-arid zone where the growing season is short, the use of draught animals allows for earlier planting and for cultivation of larger areas of land. Other factors that favour the introduction of animal traction are increases in population density, access to markets, and the availability of adequate extension services (Eicher and Baker, 1982; Pingali et al, 1986). The outcome of past investments in animal traction projects have often been disappointing (Sargent et al, 1981; Eicher and Baker, 1982; Goe and Gryseels, 1983). This has Been due mainly to high investment costs, inappropriate technology, and unattractive benefit cost ratios. Projects have been poorly designed, with little understanding of the farmers' resources in terms of feed availability, cash income, capacity for maintenance and access to veterinary drugs. Nevertheless, there is still substantial scope for an expanded and more effective use of animal traction, and this would lead to large increases in farm productivity (ILCA, 1987a). The valuation of benefits is often complicated however, and it may be misleading to evaluate projects on the basis of single production factors (Munzinger, 1982).

Figure 1-1- Importance of Draught Animals in Africa
IMPORTANCE OF DRAUGHT ANIMALS IN AFRICA
MOROCCO
1. Gambia 2. Guinea Bissau 3. Eq. Guinea 4 . Ruanda 5- Burundi 6 . felawi
DEGREE OF IMPORTANCE:
THA1MTI0NAU.Ï HIGH (DECKKA.SÜYG TKNPFNCY)
WIRING COLONIAL- DAYS (r*w RKUJCK.II)
INCREASING- IAJK 'l\J DFVF.I i )PMENT MKAUUKE3 (S - Kf t OK HOIJHNGS)
MAHGINAI,, WITH DEVELUl-MKNT POTENT!AI. ( 'JS6 OF IIOIDINGS)
NONK; SEVEKK LIMITING FACTORS
Source: Hunzinger (1982).

Very little research has been undertaken on the transport function of livestock. Usually equines are used for this purpose, i.e. donkeys, mules or horses. The donkey is the most numerous African equine, constituting more then 67% of the equine herd in Africa. Approximately one third of all African donkeys can be found in Ethiopia, while Mali, Nigeria and Sudan have substantial populations also (FAO, 1985). Although in Ethiopia donkeys are used almost exclusively as pack animals, in semi-arid Africa they are also used occasionally for cultivation of light and sandy soils. The use of donkeys in rural transport in Africa has been reviewed by Fielding (1987). ILCA (1980a) has estimated the value of the transport function of livestock at US$ 1,796 million, but did not indicate how this amount was calculated. This estimate almost equals a subsequent estimate (ILCA, 1987a) on the value of animal draught power in field operations.
Animal manure, or faeces produced by livestock, has multiple uses and is of significant importance in both farm and household systems throughout Africa. Most farmers recognize the value of manure to improve soil fertility, as it adds significant amount of nutrients such as nitrogen and phosphorus. The addition of manure also increases soil organic content, and raises the pH level in acid soils (Sandford, 1986). Although the positive effects of manure application on crop yields has been demonstrated on most agronomic research stations throughout Africa, only very few on-farm studies have been undertaken. Powell (1986) studied the effects of manuring in Nigeria and noticed some drawbacks of the practice: it may encourage weeds which in turn compete with crops for both nutrients and moisture. Eicher and Baker (1982) have reported on various studies that found positive relations between manure application and grain output. As only few farmers have sufficient manure to maintain soil fertility of all of their land, they often use available manure selectively on high-value crops, or near the household.
In many countries, dried manure is also important as a household fuel. This use is particularly important in subsistence oriented rural economies such as Ethiopia. Newcombe (1985) made a cost-benefit analysis of alternative uses of farm manure of the Ethiopian highlands, and assessed the returns on smallholder farms from using manure in comparison to other fuel sources. He found that the farmer strategy of using farm produced manure primarily for fuel purposes, with remaining leftovers being sold for cash, was a rational and profit maximizing strategy.
ILCA (1987a) estimated the value of the annual production of livestock manure in sub-Saharan Africa at US$ 196 million annually, equivalent to 3% of the total value of livestock output. This value contrasts with an earlier estimate of US$ 575 million (ILCA, 1980a).
Livestock production may well be the largest employer of labour in sub-Saharan Africa. Of the total rural population of 325 million, approximately 15-20 million people are pastoralists who can be considered full-time livestock producers, while approximately 190 million people are estimated to be living on mixed smallholder farms (Wheeler, 1984;FAO, 1986a). Available evidence indicates that on these mixed farms, approximately 30 to 40% of household labour is used for livestock production related activities (CBS, 1977; Vincent, 1977; Stotz, 1983; Vaidyanathan, 1983; Fafchamps, 1985). Little seasonal variation has been

10
recorded of labour inputs for livestock production, which are largely supplied by women and children. Livestock production appears to allow for an increase in labour productivity of family resources in mixed farming systems.
The available quantitative evidence on the use and productivity of household labour for livestock production in mixed farming systems is scarce. More attention should be given to this topic as it is now widely accepted that the low productivity of labour and inelastic labour supplies during critical periods, leading to seasonal labour bottlenecks, are the major constraints to the improvement of farm productivity in sub-Saharan Africa (Mellor et al, 1987; Delgado and Ranada, 1987). Collinson (1972) already stressed that "the pattern of labour availability and use over the season is the key to understanding traditional African agricultural systems", while Cleave (1974) further noted the "overwhelming importance of this factor of production". Various studies have been undertaken on labour use in pastoral systems, particularly of an anthropological nature, and Sandford (1983) noted that shortage of labour is a critical constraint for many pastoral activities. Eicher and Baker (1982) do not list a single study on labour productivity of livestock production in mixed farming systems in their comprehensive literature review of agricultural development in sub-Saharan Africa. In three recently published basic works on livestock development in sub-Saharan Africa, the topic of labour use is not discussed explicitly (Jahnke, 1982; Simpson and Evangelou, 1983; ILCA, 1987a). A large proportion of labour inputs into livestock production are supplied by women and children. The tasks are permanent rather than seasonal, creating a stable labour demand throughout the year. The labour employed may have few alternative uses and have a low opportunity cost. Yet, this hypothesis requires further investigation. Labour inputs and returns to labour are key elements in understanding decision making and resource allocation in a farm household (De Wilde, 1967; Collinson, 1972). Some estimates on labour inputs in grazing and watering have been made (Ruthenberg, 1980). It has been claimed that livestock labour usually has a low productivity (Fafchamps, 1985), or that returns to labour are lower in livestock production (Vaidyanathan, 1983). This outcome may largely result from the exclusion of intermediate products, such as the value of draught power and of manure, in the calculation of income derived from livestock production. Usually, only final products such as meat, milk or hides/skins have been incorporated, thereby underestimating livestock income levels and returns to labour.
The contribution of livestock to gross farm output, as reported by Ruthenberg (1980), ranges from 8% in a system of shifting cultivation in Central African Republic, to 60% on ley-maize farms in Kenya. Only milk output and meat offtake were taken into consideration in calculating gross returns.
Livestock often provide a substantial part of the farm cash income in mixed farming systems. Although data are scarce, available information (Collinson, 1972; CBS, 1977; Ruthenberg, 1980; Fafchamps, 1985) indicates that the average livestock contribution is generally between 5 and 40%. According to Brumby (1986), this factor is of crucial importance for the improvement of farming systems. If livestock productivity can be improved, cash incomes will change also, and the increased availability of funds will allow the farmer to improve crop

11
productivity through the purchase and application of additional inputs such as chemical fertilizer or improved seeds.
Livestock are also a "store of wealth" and an important capital asset in most farming systems (Doran et al, 1979). The animals are kept as a form of savings, which can easily be converted to cash in times of need. Only few studies have studied the profitability of investment in livestock, although Upton (1985) found that smallholders obtained rates of return of 24% to investment in small ruminants in Nigeria.
A livestock component in the farming system can diversify the agricultural outputs, and reduce production risks of smallholders (Rodriguez and Anderson, 1985; FAO, 1986a). Recently, the important role of animals in supporting the sustainability of agricultural systems has been recognized. Sustainability refers to the ability of an agricultural system to maintain food production levels so as to enable the satisfaction of changing needs of its population, while maintaining the normal resource base and avoiding environmental degradation (TAC/CGIAR, 1987). The most important endangered livestock production systems in sub-Saharan Africa are the mixed farming systems in the semi-arid and highland areas. Despite their sometimes favourable ecology, these areas have a declining resource base to satisfy the growing food needs of their populations and the major factors responsible are water and land erosion, and deterioration of soil structure (ILCA, 1986 and 1987a). Livestock provide opportunities to improve the sustainability of mixed farming systems, by providing manure to improve soil fertility, and draught power to improve soil and water conservation.
Finally, in many traditional societies livestock also have an important social and cultural function. They provide prestige and status, serve as a currency for brides, and have ritual functions (Schneider, 1984).
1.3. Livestock Production Systems
Sub-Saharan Africa is a region of great environmental diversity, and agro-ecological conditions vary widely. As livestock depend upon vegetation or crops as their feed base, land use characteristics have been a central consideration in the classification of livestock production systems. This classification has been approached in different ways (Chudleigh, 1976; De Boer, 1977; Ruthenberg, 1980; Humphrey, 1980), thereby identifying the major factors characterizing and influencing the utilization and production of livestock. The livestock production system may represent the total farm system, or represent a sub-set of farming systems. In sub-Saharan Africa, Jahnke (1982) has distinguished three major systems: range-livestock production systems, crop-livestock production systems, and landless production systems.
Jahnke (ibid) has pointed to the need to study livestock production systems within the framework of ecological zones, so as to enable an appraisal of the basic resource endowment. This endowment is largely determined by the climatic conditions, in particular by the growing period i.e. the period expressed in number of days when available water and temperature regime permits plant growth. The concept allows for a quantitative assessment of suitability of climate for rainfed

12
agriculture. The growing period has been defined as the continuous period during the year, from the time when rainfall exceeds half potential évapotranspiration until the moment when precipitation falls below full potential évapotranspiration, plus a number of days required to evaporate an assumed 100 mm of soil moisture reserve when available (FAO, 1978). Periods during which crop growth is not possible because of low temperatures are excluded. Although the concept of growing period has been developed primarily to assess its implications for crop production, it is also of direct significance to feed production.
On the basis of number of growing days (GD) and temperature, Jahnke (1982) has classified sub-Saharan Africa in five major ecological zones: arid (less than 90 GD), semi-arid (90-179 GD), sub-humid (180-269 GD), humid (over 279 GD) and highlands (Figure 1.2). The highlands are those areas in the semi-arid, sub-humid and humid zones where the mean daily temperature is less than 20 C during the growing period. The extent and relative importance of each of the ecological zones in terms of area covered, rural population, and livestock holding is given in Table 1.2. The dry areas (arid and semi-arid zones) account for 54% of sub-Saharan Africa's surface area, and for more than 50% of the ruminant livestock of each of the major species, but for only 38% of the human rural population. As humidity increases, livestock density decreases. The humid zone accounts for 19% of the land area, but for only 6% of TLU's. The highlands have the highest population density. With only 5% of the surface area, approximately 16% of the rural population and 18% of TLU's, can be found in the highlands.
The arid and semi-arid zones are important in every region of Africa except Central Africa, the sub-humid zone is spread throughout all regions, nearly 75% of the humid zone is in Central Africa, while East Africa alone accounts for 73% of the highland zone. The distribution of livestock in sub-Saharan Africa is uneven. Eastern Africa has more than half the ruminant livestock herd, while Central Africa accounts for only 3% (Jahnke, ibid).
Table 1.2. Distribution of Area, Rural Population and Different Species of Ruminant Livestock by Ecological Zone of Sub-Saharan Africa (% of Total in SSA)
Zone
Arid Semi-arid Sub-humid Humid Highlands
Total (%) Total n (in millions)
Area
36 18 22 19 5
100
22.4
Rur.Pop.
10 28 25 21 16
100
km2 279
Cattle
21 31 22 6
20
100
155
Sheep
35 22 14 8
21
100
117
Goats
39 26 16 9
10
100
136
TLU
30 27 19 6
18
100
137
a/ A Tropical Livestock Unit (TLU) is a composite factor to aggregate livestock species on the basis of their respective liveweights. One TLU is the equivalent of an animal of 250 kg liveweight. The calculation in the column includes cattle, sheep, goats, as well as camels.
Sources: Jahnke (1982), De Montgolfier-Kouevi and Vlavonou (1983) and FAO (1986b).

13
Figure 1.2. Environmental Zones of Sub-Saharan Africa
Highlands >1500m a.s.l.
Humid Zone >270 plant growing days/year
Subhumid Zone 180 to 270 plant growing days/yeai
Arid and semi-arid zones 0 to 180 plant growing days^year
S o u r c e : I LCA ( 1 9 8 4 )

14
These ecological and geographical factors are important for an appraisal of livestock production systems in sub-Saharan Africa. A major obstacle to livestock development on the continent is the problem of trypanosomiasis, a deadly animal disease transmitted by tsetse flies. This tsetse infestation virtually precludes livestock production on almost 50% or 10 million km2 of sub-Saharan Africa that includes some of the best watered and fertile land. Tsetse infestation is a major contraint in the humid, sub-humid and semi-arid zones. If trypanosomiasis could be controlled or circumvented, a large part of this area could be used for agricultural and livestock development. Encouraging results have been obtained with the use of chemoprophylactic drugs and the introduction of trypenotolerant breeds (Trail et al, 1984; Trail et al 1985; ILCA, 1987b).
The arid zones are too dry for crop production and their populations are largely dependent upon livestock for subsistence. In the highlands, the ecology is relatively favourable to crop and livestock production, leading to high densities of both human and livestock population. Livestock production systems are thus largely determined by their ecological environments.
Range-livestock production systems are based on the use of natural or semi-natural vegetation via domestic animals, particularly ruminants (Jahnke, 1982). These systems can be purely pastoral, agro-pastoral, or of the "ranching" type. In pastoral systems, rangelands are collectively owned and communally grazed. Cattle, sheep, goats and camels are the principal livestock species. The main product is milk, and the principal livestock function is subsistence, in addition to social and cultural functions. Additional household income is derived from occasional sales of live animals which are sold for cash to traders, or bartered for grain and other goods or services (Dahl and Hjort, 1976; Sandford, 1983).
Pastoral systems can be nomadic or transhumant in nature. Nomadic systems are characterized by the movement of whole families with their animals in search of water and grazing. These families have no fixed place of residence. In transhumant systems migration follows a similar seasonal pattern each year. The farmers or herdsmen have a permanent place of residence to which they return at some period of the year (Humphrey, 1980).
In semi-arid and sub-humid zones, there is an increasing trend towards sedentary farming, in an agropastoral system, particularly in the Sahel region. This trend is induced by population and cropping pressures, restrictions in movements across borders, the effects of prolonged drought, and government regulations (USAID, 1982). Absentee livestock ownership, whereby livestock owned by farmers or traders are herded and managed by pastoralists or agropastoralists, is also widespread.
Ranching is a range-livestock production system but in a different management setting. Livestock management on ranches is characterized by grazing on often improved and developed rangelands within fixed boundaries of individual tenure. Owners or managers live in one place, and livestock production is for cash income. Ranches usually produce one or two marketable commodities such as beef, mutton, milk or wool. They can be privately owned or leased, or be of a parastatal or cooperative

15
nature. Ranching can be found throughout Africa, and has usually been introduced by Western colonists. Ranches account for only 5% of TLU's in sub-Saharan Africa (Jahnke, 1982).
Landless livestock production systems refer to a situation in which livestock does not derive feed from grazing or fodder production, but from household refuse and/or purchased concentrates or feedstuffs. In traditional farming, these systems are usually based on pig or poultry production. In commercial systems they may also have cattle or sheep, usually in feedlots for fattening purposes. In the latter case, animals will be housed and fed with the intention of maximizing output in the shortest possible time (Humphrey, 1980).
Crop-livestock production systems refer to land use systems in which crops and livestock husbandry are practised in association (Jahnke, 1982). They can be of two basic types; segregated or integrated systems (Mclntire and Gryseels, 1987). In segregated systems, crop and livestock husbandry are undertaken as parallel activities without interactions. This may refer to a situation of either simple geographical proximity of both activities, or where crops and livestock production is undertaken within the same management unit but without interchange of input and output between both sub-systems.
In integrated systems, crop and livestock production are undertaken within the same management unit, and interact through an interchange of inputs and outputs. For example, animals contribute to crop production by producing draught power for land cultivation and manure to improve soil fertility, while in turn crop by-products are used to feed livestock.
Segregated crop-livestock systems are dominant in the West African Sahel and savannah. Integrated systems are dominant in the highlands and parts of Zimbabwe, Malawi, Mali and Senegal.
Jahnke (1982) distinguishes crop-livestock systems in the lowlands from those in the highlands, because of the special features of the latter. In the lowlands, crop-livestock production systems can be found in the semi-arid, sub-humid and humid zones. Often they have developed in areas that were traditionally dominated by pastoral systems. In semi-arid and sub-humid zones, agricultural systems have become more sedentary and only partly pastoral. Pastoral people have settled and started growing crops. In semi-arid zones, crops are grown through either small-scale irrigation, or by using drought resistant varieties such as millet and sorghum (ILCA, 1981b). Sub-humid zones have longer growing periods and more diversified cropping patterns. The principal field crops are sorghum, maize, rice and groundnuts. Roots and tubers, such as yams and cassava, and garden crops also become important (Mclntire and Gryseels, 1987). In humid zones, livestock production is severly constrained by the tsetse challenge. Small populations of cattle, sheep and goats are possessing some degree of resistance to trypanosomiasis. These trypanotolerant breeds are characterized by their small size. The major cattle breeds are the N'Dama, the West African shorthorn, and crosses with Bos indicus or Zebu breeds.

16
Trypanotolerant small ruminants are of the dwarf types, such as the Djallonké. A systematic review of trypanotolerant livestock breeds in sub-Saharan Africa has been made by ILCA (1979b). The productivity of trypanotolerant livestock diminishes as tsetse challenge increases. In order to obtain more knowledge on trypanotolerant breeds, including detailed information on genetic and acquired resistance, environmental factors affecting susceptibility, and the efficiency of control measures, ILCA and the International Laboratory for Research on Animal Diseases (ILRAD) have created the African Trypanotoleranee Network, which is operating at various sites in 10 African countries (Trail et al, 1984).
Crop-livestock production systems in the lowlands are outside the scope of this study. They are well described in detail in Delgado (1979), McCown et al (1979), Ruthenberg (1980), Jahnke (1982), Powell and Taylor-Powell (Ï987T, Wilson (1986) and von Kaufman et al (1986).
1.4. Crop-Livestock Production Systems in the Highlands
The highlands of sub-Saharan Africa have been defined as areas above 1,500 m elevation above sea level, or with mean daily temperatures of less than 20 C during the growing period (Jahnke, 1982; Getahun, 1978a; FAO, 1978).
The highlands cover approximately one million square km, or some 5% of the land area of sub-Saharan Africa. About 76% of the highlands and located in Eastern Africa (Table 1.3.). In Ethiopia, Kenya, Rwanda and Burundi they account for the great majority of the human and livestock populations. Tanzania, Zaire, Chad, Somalia, Cameroon, Angola, Réunion, Malawi, Uganda, Zambia and Madagascar have large highland areas also. The distribution of highland areas in Africa is illustrated in Figure 1.3. Recently highland zones have also been referred to as mountain environments (Getahun, 1984; Getahun and Kirkby, 1987). In its study "African Agriculture: The Next 25 Years" FAO (1986a) has classified most of the highlands as "Sub-humid and Mountain East Africa". The differences between the FAO and earlier classifications originate from the fact that FAO has subdivided Africa in regions which have to accord with national boundaries, in order to enable the use of statistical information which is available at the country level, for its assessment of the resource base. Broadly, FAO's classification corresponds with that of Getahun (1978a) and Jahnke (1982).
The highlands encompass a wide variety of environmental conditions covering every ecological zone. Almost half of the highlands can be classified as sub-humid (Table 1.3.).
Although the highland zone is only a fraction of the land area of sub-Saharan Africa, it accounts for 16 and 18% respectively of the human and livestock populations (Table 1.2.). The human population density (44 personsAni2) is more than double, while the stocking density almost (26 TLU/km2) four times the average for sub-Saharan Africa as a whole (Jahnke, 1982). Several factors contribute to the concentration of people and their livestock in the highlands, including favourable climates and ecological conditions, the absence of tsetse flies, comparatively high feed availability, and greater military security. Yet, the concentration of people and livestock over many centuries has resulted in substantial erosion problems and declining soil fertility.
17
Figure 1.3.: The Highlands of Sub-Saharan Africa
Source : Adapted from Amare Getahun (1978a); Gryseels and Anderson (1983a).
The human population of the area is expected to grow by 3.35% per annum between 1980-2010, while per caput food production has declined by 1.5% per annum from 1970-84 (FAO, 1986a). This leads to increased pressure on land for growing food crops, and increasing dependence of livestock on crop residues as pasture availability declines.
Subsistence smallholder mixed farming systems prevail generally throughout the highlands, with crops and livestock husbandry typically produced within the same management unit. There is a high degree of integration between the crop and livestock sub-systems, although there is substantial scope for further intensification.

18
Table 1.3. Size of Highland Areas in Sub-Saharan Africa by Region and Ecological Zone
A. By region. Highlands defined as 1,500 m a.s.l. (Getahun, 1978a)
Area ('000 km2) Proportion (!)
76 6 4
11 3
Total 1,049 100
B. By ecological zone (FAO, 1978)
Eastern Africa Central Africa Western Africa Southern Africa Islands of Indian Ocean
790 63 45
118 33
Climate type
Arid Semi-arid Sub-humid Humid Cold
Source :
Growing period
Jahnke
0- 90 90-180
180-270 >270 0
(1982)
(days) Area ('000 km2)
140 195 441 189
29
994
Proportion (%)
14 20 44 19
3
100
Crop-livestock systems in the highlands are distinct to those in the lowlands. There is a much higher degree of crop-livestock integration, livestock production is not affected by trypanosomiasis, a large proportion of land is only suitable for grazing, because of waterlogging or frost exposure, cropping intensity is high and a large amount of crop by-products is available as livestock feed. The highlands provide also better opportunities for an intensification of both crop and livestock production, through the introduction of new varieties and breeds from temperate zones elsewhere (ILCA, 1978; Ruthenberg, 1980; Jahnke, 1982).
Yet, the highlands are a complex zone with a wide diversity in agroclimatology (Brown and Cochemé, 1973). As a result, considerable differences in settlement and land use occur. For example, Rwanda and Burundi have population densities of 200 and 154 people/km2 respectively, which compares with an average of 44 peopleAm2 for the highlands region as a whole. Some differences in land use also reflect the impact of a differential historical and cultural background (Jahnke, 1982). Ethiopia, which alone accounts for 50% of the total highlands area as well as of its human and livestock population, has ancient indigenous farming systems, largely dependent on ox traction for crop cultivation and widespread use of equines for traction. Kenya, where nearly 80% of the population live in the highlands, has a significant amount of dairy farming, through the influence of colonization and European settlement. In Rwanda and Burundi agricultural development is marked by the existence

19
of tribal structures, whereby the Tutsi had the traditional right to own cattle, while the Hutu were largely confined to crop production and small ruminant holdings.
In the highlands, two broad environments with corresponding farming systems have been distinguished (Getahun and Kirkby, 1987). First, the equatorial highlands largely lying near the equator which are characterized by hoe cultivation and production of roots and tubers, and cash crops such as coffee and tea (Jones and Egli, 1984). Second, the sub-tropical highlands dominated by cereal-ox plough agriculture. Each of the areas is equal in size, covering approximately half of the highland land mass.
The cereal-ox plough farming system corresponds largely to the central and northern Ethiopian highlands, central Madagascar and the communal areas of Zimbabwe. The hoe cultivation/perennial farming system is widespread in the central highlands of Kenya, Rwanda, Burundi, southern Ethiopia and northern Tanzania.
To both these farming systems correspond different levels of crop-livestock integration. In the cereal-ox plough system there is widespread use of animal traction for seedbed preparation and transport among smallholders. There is also recovery of livestock manure for crop fertilization or for household fuel. Livestock are fed on crop by-products, fodder crops and pastures.
In the hoe cultivation/perennial farming system, animal traction is largely absent partly due to the small size of holdings, uneven topography, and intercropping practises. There is intensive use of manure for crop fertilization and of by-products for animal feed. Because of the rapid decline in grazing areas, fallows, and average farm sizes, there is a gradual shift from cattle to small ruminant holdings. In Rwanda, between 1970 and 1980, the average holding size declined by 17%, the average area under pasture by 56%, the number of cattle by 16%, while the number of goats increased by 84% and sheep by 59% (Gryseels, 1983b).
In both dominant farming systems of the highlands, livestock play an important role and provide a significant part of farm income (Ruthenberg, 1980). However, population pressures lead to rapid degradation of natural resources, reflected in an expansion of areas cropped and the resulting removal of natural vegetation, grazing lands, and tree cover. There is a need for a development of more sustainable agricultural systems. The improvement of livestock productivity will thereby play a key role.
1.5 Objectives of the Study
The interest for this study arose from the growing perception that inadequate attention had been given to the role of livestock on mixed smallholder farms, and that there appeared to be a substantial potential for an increase in the productivity of livestock on these farms in the highland areas of sub-Saharan Africa. The study focused on the Ethiopian highlands because of their predominant importance in terms of size of human and livestock populations. Agriculture in the Ethiopian highlands

20
also provides a good example of a farming system with a high level of integration of crop and livestock production.
The study was undertaken from 1979 to 1985 while the author was working as an agricultural economist at the International Livestock Centre for Africa (ILCA). iLCA's field research programme during that period was organized on the basis of the major agro-ecological zones of sub-Saharan Africa (Brumby et al, 1985). The research reported upon in this study was undertaken within the framework of ILCA's Highlands Programme which was based in Ethiopia. The basic objective of the Highlands Programme was to study ways of improving the overall productivity of mixed smallholder farms in the highlands by increasing the technical and economic efficiency of livestock enterprises (Gryseels and Anderson, 1983a and b ) . The author had principal responsibility for on-farm research of the Highlands Programme during this period.
The specific objectives of the research reported in this study were to:
(i) obtain basic field data on an existing mixed agricultural system in a region representative of broad areas of the Ethiopian and other African highlands;
(ii) to identify production constraints in that farming system, and possible research and development opportunities of its livestock component;
(iii) to identify component research relevant to the priority problems of smallholder livestock production systems in the Ethiopian highlands;
(iv) to test technologies innovative to the livestock component of the farming system under farmer conditions, and to study the socio-economic impact of the adoption of these innovations on farmers' income and welfare;
(v) to study and assess the problems and processes associated with the adoption of innovations in this farming system;
(vi) to evaluate a methodology for problem identification, and appraisal and testing of innovations relevant to smallholder crop-livestock production systems in the highlands of Sub-Saharan Africa.

21
2. RESEARCH ON SMALLHOLDER MIXED CROP-LIVESTOCK FARMING SYSTEMS
2.1. The Need for Research
The need for research on smallholder mixed crop-livestock farming systems arises from the desperate food situation of sub-Saharan Africa. Crop and livestock yields have remained stagnant during the last two decades, while the human population continues to expand rapidly. The majority of Africans derive their food supply from mixed farming systems, which have increasingly come under pressure, while the resource base is eroding. Research is needed to produce new technologies which can sustainably increase the food output of these farming systems. The lack of progress in improving the productivity of livestock in pastoral systems has given increased attention to the problems and opportunities of livestock production in mixed crop-livestock agriculture. Particular emphasis is thereby given to the possibilities of a greater integration between crop and livestock production, as it is thought that both components of mixed farming systems have unused inputs to contribute to the other.
The productivity of livestock on these smallholder mixed farming systems is persistently low, even in the highlands despite the favourable ecology in which these are situated. There are major gaps between present yield levels and potentials of both food crops and livestock production (Table 2.1.). Some care is to be taken in the interpretation of Table 2.1 and the comparison that is made between the productivity of smallholder subsistence agriculture in Ethiopia, Kenya and Tanzania and the productivity that is commonly achieved in commercial farming. Commercial farms are usually located on good soils that are well drained and not exposed to frost. They also have good access to a marketing system for inputs and outputs, and can more easily obtain mineral fertilizers, pesticides, veterinary care and drugs, etc.
Table 2.1. Annual Yield of Livestock and Major Crops in Ethiopia, Kenya and
Product
Crops (kg/ha)
Sorghum Maize Wheat Irish potato Pulses
Livestock
Milk (kg/head) Beef (kg/carcass
Tanzania
Ethiopia
900 1,000
940 6,000
735
230 ) 109
Kenya
1.050 1,850 1,770 7,600
435
447 130
Tanzania
630 575
1,400 5,600
435
325 101
Commercial farms in highlands
3, 5,000
500-8,500 6,000
40,000 2,000
2,000 500
Source: Collinson (1987)

22
Efforts to improve the productivity of livestock in these smallholder farming systems have largely failed. Livestock projects financed by the World Bank and USAID have had very low or negative returns (Sandford, 1981; USAID, 1982; World Bank, 1985a).
A major cause of the failure of these projects has been poor project design, and lack of appropriate production technology, leading to poor adoption rates by the farmers. According to Sandford (1981) donors have underinvested in adaptive research and assumed that technology from temperate zones in Western countries could automatically be introduced in African farming systems.
The reasons behind the lack of adoption of improved technologies in smallholder farming systems generally have been extensively reviewed by Hardaker et al (1984) and Merrill-Sands (1986). Reviews of research on livestock production in sub-Saharan Africa have reached similar conclusions (McDowell, 1978; McDowell and Hildebrand, 1980; Eicher and Baker, 1982; Jahnke et al (1987). Many technologies that were introduced were simply inappropriate to the conditions of smallholder farming systems, and to the goals of the target farmers. There is a basic lack of knowledge on technical, economic and social issues involved in smallholder mixed farming, and on the interactions between the livestock and crop sub-sectors. There is a need to obtain farm level data of smallholder production systems, particularly of the livestock sub-sector. The decision making process of smallholder farmers is complex and insufficiently understood. Farmers have multiple objectives with their livestock enterprise, and try to satisfy these simultaneously. These different objectives include the supply of meat and milk, draught power, manure, capital savings and risk minimization. Livestock projects have tempted to stress single objectives, such as for example the maximization of meat or milk output, which resulted in a lack of cooperation by the farmer.
In the past, research on livestock production in sub-Saharan Africa has been dominated by veterinary research. This has been well documented by Toulmin (1984) who undertook a historical survey of resource allocation to livestock research. The emphasis on veterinary research, oriented towards the understanding and control of the major epizootic livestock diseases, was a consequence of the devastating effects of the rinderpest epidemic at the end of the last century. After the second world war, there was a gradual shift of emphasis towards efforts to transfer technology from the Western world. These studies were undertaken almost exclusively on experiment stations, focussing on cross-breeding and nutrition trials. According to Toulmin (Ibid), in countries with powerful producer lobbies, research was oriented towards the generation of technologies to improve commercial beef and dairy farming enterprises. Since the seventies, more emphasis has been given to activities related to animal husbandry and socio-economics, following the growing dissatisfaction with the failure of research to increase the productivity of traditional smallholder livestock systems.
Similar conclusions have been reached by the World Bank in their Review of Agricultural Research in Eastern, Southern and Western Africa (World Bank, 1986a and b). The dominance of veterinary science and animal health in research on livestock production continues however.

23
Mclntire (1985) has found that 53% of livestock research publications in sub-Saharan Africa during the period 1975-1983 were on issues related to animal health and trypanosomiasis, while ecology, pastures and forages, and general management accounted for 25%. The emphasis on trypanosomiasis is related to the argument that this disease must first be brought under control, before livestock can be usefully introduced in tse tse infested areas. This argument is only partly valid however. The successful introduction of control methods will be largely determined by its implications for the sustainability of the target crop/livestock system. This requires in turn a prior and solid understanding of this farming system.
In addition to the dominance of veterinary science, research to develop livestock production systems until the early 1980s has largely focused on pastoral systems (ILCA, 1981b).
It is now widely acknowledged that research on livestock production in sub-Saharan Africa should give high priority to the problems of mixed farming systems, and that the approach should be adaptive and farming systems oriented (Wheeler, 1982; FAD, 1983a; USDA, 1982; Eicher and Baker, 1982; World Bank, 1984a; US Congress, 1985; SPAAR, 1986). This high priority has been given on the basis of the importance of livestock in these systems, numerically, as well as in terms of contribution to meat, milk, power, and nutrient supplies. Is also acknowledged that mixed farming systems have a major potential for productivity increases, and that an improvement in livestock productivity may lead to positive spillovers to the crop enterprise. The experiences gained in Asia provide good examples of the opportunities for greater crop-livestock integration on smallholder farms (FAD, 1976; Fine and Lattimore, 1982; Groenewold, 1983; FAO, 1984b; Amir and Knipscheer, 1987).
Agricultural research can be divided into four main categories (CGIAR, 1981):
Basic or strategic research: generates new knowledge and new methodologies for the solution of specific research problems;
- applied research: creates new technology from the knowledge and methodologies generated by basic research;
adaptive research: adapts technology generated by applied research to the specific needs and agro-ecological conditions prevailing in a given locality; and
maintenance research: is the research continuously necessary to prevent productivity decline.
The nature of research on farming systems is applied and adaptive.
2.2. The Farming Systems Approach to Research
Stagnant productivity of crops and livestock in sub-Saharan Africa led in the early seventies to the conclusion that technological innovations proposed by agricultural research institutions were not

24
being adopted by farmers. The reasons for the non-adoption of these innovations were that they were inappropriate to the needs, and unsuitable for the socio-economic environment, of the farmers. This gave growing rise to the perception that agricultural research had to be reoriented, and be tailored to the needs, resources, and goals of the target smallholder farmer. A new approach emerged, which was commonly called "Farming Systems Research" (FSR).
In the past decade, there has been an increasing commitment to FSR as a new tool of agricultural research. The topic has become such a popular theme that its meaning, approaches, activities and methods have recently been subject of much debate (Simmonds, 1985; Merrill Sands, 1986b; IARCs, 1987).
FSR is an approach to agricultural research which views the farm in a holistic manner, i.e. it attempts to understand how the different components of the farming system relate and interact with the members of the farm household, and with the outside physical, biological and socio-economic environment (TAC/CGIAR 1978; Shaner et al, 1982).
FSR is different from traditional farm management research in that it is oriented towards the needs of small farmers, sets priorities for research reflecting its holistic perspective, and is aimed at defining general farming systems in a region under study as a means to identify and describe a population's activities (Simpson, 1985).
The basic concepts and approaches to FSR have been described by Norman (1978 and 1980), TAC/CGIAR (1978), Byerlee and Collinson (1980), Gilbert et al (1980), Zandstra et al (1981), Collinson (1982), Byerlee et al (19B2T7 Shaner et al (19827, Dillon and Anderson (1984), Fresco TÏ9ÏR), Remeneyi (19857, Simmonds (1985) and IARCs (1987).
Simmonds (1985) has identified three main types of FSR: farming systems research in the narrow sense, on-farm research with a farming systems perspective (OFR/FSP), and new farming systems development (NFSD).
FSR in the narrow sense is the study of farming systems as they exist. It involves an in-depth description and analysis of these systems, but the object has been scholarly rather than practical.
OFR/FSP is problem-oriented research founded on the assumption that changes need to be adapted to the circumstances of their users, and that on-station research does not predict farm experience. The approach stresses incremental improvements to farming systems, rather than revolutionary changes.
NFSD takes as its starting point the view that many tropical farming systems are under such heavy stress that their radical restructuring is necessary. NFSD involves the conception, testing and implementation of new systems. The approach usually has a longer term perspective. Development of new farming systems may be appropriate however where there is a drastic change in the farmers' external environment, such as the introduction of irrigation or a settlement program (CIMMYT Economics Staff, 1984).

25
Successful research to improve the productivity of mixed farming systems will usually have to be OFR/FSP, as it is problem and impact oriented, and since incremental rather than radical change is the objective of this type of research. The approach is gradual and stepwise, and tailored towards the small needs of farmers which have been characterized as resource-poor, short of cash, risk averse, and experiencing both under-employment as well as seasonal labour shortages (Collinson, 1984). OFR/FSP has the following characteristics: it aims to generate technology to increase productivity of a target group of farmers, it is conceptually based on a farming systems perspective, and it uses on-farm research methods (CIMMYT Economics Staff, 1984).
There is general agreement on the steps to be followed in FSR. The starting point is the choice of a "target" farming system or recommendation domain. Generally, a recommendation domain will consist of farmers with common production patterns and similar practices within an agroclimatic zone (Harrington and Tripp, 1984). The area where the actual field research takes place will have to be representative of the zone. Research is then generally going through three major stages: diagnosis, design and testing, and evaluation and extension.
In the diagnostic stage, the environmental, technical, economic and sociological contexts within which the farming system operates are determined and assessed. The literature review and systematic collection of secondary data are supplemented with a separate, problem-oriented baseline survey of the target areas. The latter provides a basic understanding of the functioning of a farming system and an appraisal of the availability, use and productivity of the farm resources. It also illustrates the boundaries in which a farmer operates within a system, and the exogeneous factors that influence his decision making. The results of the diagnostic stage permit an assessment of the major constraints, and of the agricultural development potential of the area. Priorities for component research can be defined at this stage.
The design and testing stage is not necessarily sequential to the diagnostic phase, but can be interactive and overlapping. During this stage, the information generated in the diagnostic phase will suggest possible technological interventions for an increase in farm productivity and income. New technologies are tested, usually first on-station, and at a later stage on-farm. On-farm research is research conducted in farmers' fields with the participation of farmers. This ensures that technologies are tested under their conditions and enables a verification of results obtained on-station. This process is necessary because researchers that work on-station may have different production objectives to the farmer. A two-way flow of information should exist between on-farm research and experiment-station research (CIMMYT Economics Staff, 1984). Information obtained from on-farm research will allow a specification of desired technology characteristics for the farmer, and provide guidelines for prioritisation of experiment-station work. Research on experiment stations aims at the development of new technology, and screen existing technological components for their suitability of introduction on-farms. The interactions between experiment station based research and on-farm research are well illustrated in Figure 2.1. Farmers participate in the testing by managing the new technology according to the designed

26 Figure 2 . 1 . Interactions Between Station-Based Technical Research and On-Farm Adaptive Research
Target Group Farmers of a Recommendation
Domain in a Region'
Survey diagnosis of farmer priorities,
(1) resource and environment problems and development opportunities.
Experiments on apparently relevant materials ,^ and techniques under ^ ' farmers' conditions
(2)
Identification & Evaluation of materials and techniques offering potential for problem solution and the exploitation of opportunities.
(4)
Unsolved technical problems and possible /STATION-new practices and I BASED materials relevant I TECHNICAL to farmers' development \RESEARCH opportunities.
Body of Knowledge of materials and techniques suitable for the climate and soils of the Region
(5)
»Commodity and Disciplinary research, solving priority technical problems and investigating possible new materials and practices
Source: Collinson (1982)

27
methods, with frequent advice from and monitoring by research staff. Information on the performance and adoption rate of the technology will be used for further adjustments or redesign of the research. Menz and Knipscheer (1981) have pointed to the problem of location specificity in farming systems research. Technologies therefore have to be designed in such a way that they can easily be adapted to local conditions.
In the evaluation and extension stage, an in-depth appraisal of the technology, and its economic impact on farm productivity will be undertaken. The suitability of the new methods to larger ecological and production zones is assessed, as a prior step to extension activities by development agencies.
2.3. Farming Systems Research in Mixed Crop-Livestock Agriculture
Farming systems research has been conducted mainly by crop research institutes, and methodologically has been more advanced for cropping systems than for mixed systems. Gilbert et al (1980) noted specifically that the livestock sub-system had reciîviH little attention in the context of FSR. Shaner et al (1982) observed that "a subject with considerable and yet untapped potential is research on mixed farming systems in which researchers consider the influence of crops and livestock on each other". As a result, various authors have attempted to suggest how the methodology of FSR/FSP could be extended to livestock and mixed crop-animal farming systems (Bernsten, 1982; Gryseels, 1983a; ILCA, 1983a; Zandstra, 1982; Bernsten et al, 1984; and Zandstra, 1985). In recent years, several conferences an3 workshops have also tried to bring together researchers to exchange experiences and refine the conceptual and methodological approaches (Fitzhugh et al, 1982; Butler Flora, 1984; Nordblom et al, 1985; Kearl, 1986; Amir anH Knipscheer, 1987).
Although the general cropping systems model provides a basic framework to integrate livestock research, a number of attributes make on-farm studies with animals different and more complicated than with crops. These different characteristics are summarized in Table 2.2.
The problems relate to the following (Gryseels, 1986):
Mobility of livestock
Mobility makes it difficult to describe environment-livestock interactions, to measure and control factors not included as treatments, and to organize data collections.
Life cycle duration
While grain crops typically mature in a few months, the reproductive cycle of ruminant livestock extends over at least a year. This increases the timeframe and cost of experimentation, as well as the risk that experimental animals may die or be sold before the trial is completed.

28
Table 2.2. Comparison of Characteristics of Crops and Livestock and Implications for On-Farm Testing
Factor
Situation with respect to
Crops Livestock Implications for on farm livestock research
Mobility Stationary Mobile Difficult to measure and control non-expe r imental factors
Life cycle duration
Generally 4 months
< Generally > 1 year
Increases costs, and likelihood of losing experimental unit
Life cycle synchronization
Multiple outputs
All units synchronized
Only grain/tuber and residues
Units seldom synchronized
Meat, hides, milk, manure, power
Difficult to find comparable units
Difficult to measure/value treatment effect
Non-market inputs Few and outputs
Experimental unit size
Producer attitudes
Management variability
Small, divisible
Impersonal
Low
Many
Large, indivisible
Personal taboos
High
Difficult to value
Increases cost, risk to cooperator
Difficult to cull, castrate, earmark
Difficult to isolate treatment effect
Observation units
Ownership
Many
Individual
Few
Often shared or inherited
Large statistical variability
Joint management
Resource attribute
Land tenure individual
Often communal land
Target audience Individual farmer Farm family
Reduces motivation
Increases management variability
Source: Adapted from Bernsten et al (1984) and Gryseels (1986).

29
Life cycle synchronization
Crops of similar varieties are planted and harvested more or less at the same time. Animal production, however, is not synchronized and occurs at different times and intervals. This makes it difficult to find animals of the same production categories and in the same production phase.
Multiple outputs
Animals produce several outputs of economic value. These outputs include milk, meat, manure, draught power and hides. Some of these animal outputs are intermediate products and are used as inputs in the crop enterprise. This makes it difficult to measure the impact of treatments, to evaluate the economic impact of an intervention and to assess the constraints in the farming system.
Non-market inputs and outputs
Smallholder livestock production systems depend on inputs such as child labour, crop residues and water which are difficult to value, and produce outputs such as draught power and manure for which there is no ready market. The value of other functions of animals such as capital accumulation, risk management and ceremonial functions are difficult to measure.
Size of experimental unit
Smallholder farmers have only a few large ruminants. Exposing these to trials and treatments in the research exposes the producer to substantial risks. Moreover, a large number of farmers will have to participate in trials in order to achieve statistical significance. This increases the cost of on-farm experimentation substantially. Also, farm comparisons with a control group are rarely possible and the researcher needs to resort to cross-farm comparisons.
Producer attitudes
Livestock are subject to various religious and cultural taboos which makes it difficult to cull, castrate and earmark them.
Management variability
The management of livestock includes a large number of critical decisions (feeding, watering, milking, breeding, animal health control, etc.) which need to be made regularly, often daily, over a long production cycle. The variability of this management makes it difficult to attribute the effects of certain treatments given the number of experimental units.
Number of observation units
Livestock performance is measured as production per animal, and as small farms tend to have only few animals, the statistical variability of performance within treatment groups tends to be large.
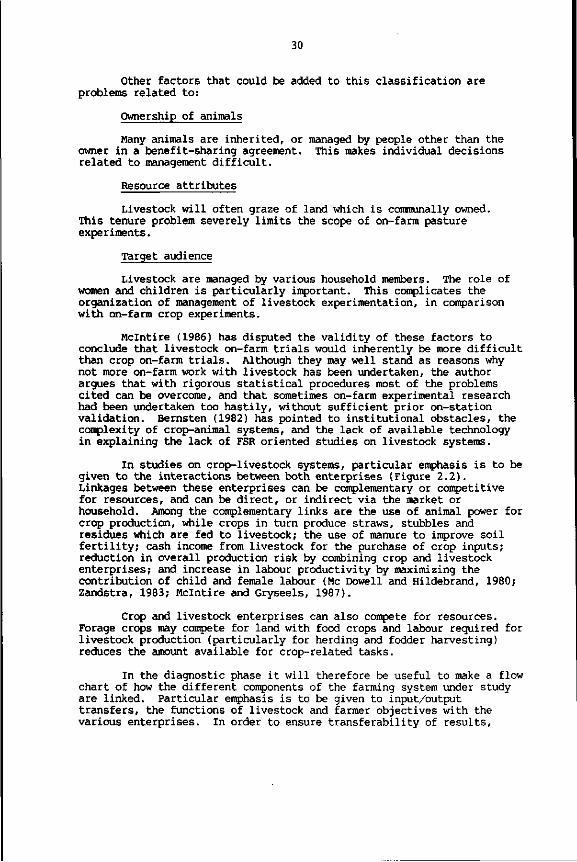
30
Other factors that could be added to this classification are problems related to:
Ownership of animals
Many animals are inherited, or managed by people other than the owner in a benefit-sharing agreement. This makes individual decisions related to management difficult.
Resource attributes
Livestock will often graze of land which is communally owned. This tenure problem severely limits the scope of on-farm pasture experiments.
Target audience
Livestock are managed by various household members. The role of women and children is particularly important. This complicates the organization of management of livestock experimentation, in comparison with on-farm crop experiments.
Mclntire (1986) has disputed the validity of these factors to conclude that livestock on-farm trials would inherently be more difficult than crop on-farm trials. Although they may well stand as reasons why not more on-farm work with livestock has been undertaken, the author argues that with rigorous statistical procedures most of the problems cited can be overcome, and that sometimes on-farm experimental research had been undertaken too hastily, without sufficient prior on-station validation. Bernsten (1982) has pointed to institutional obstacles, the complexity of crop-animal systems, and the lack of available technology in explaining the lack of FSR oriented studies on livestock systems.
In studies on crop-livestock systems, particular emphasis is to be given to the interactions between both enterprises (Figure 2.2). Linkages between these enterprises can be complementary or competitive for resources, and can be direct, or indirect via the market or household. Among the complementary links are the use of animal power for crop production, while crops in turn produce straws, stubbles and residues which are fed to livestock; the use of manure to improve soil fertility; cash income from livestock for the purchase of crop inputs; reduction in overall production risk by combining crop and livestock enterprises; and increase in labour productivity by maximizing the contribution of child and female labour (Mc Dowell and Hildebrand, 1980; Zandstra, 1983; Mclntire and Gryseels, 1987).
Crop and livestock enterprises can also compete for resources. Forage crops may compete for land with food crops and labour required for livestock production (particularly for herding and fodder harvesting) reduces the amount available for crop-related tasks.
In the diagnostic phase it will therefore be useful to make a flow chart of how the different components of the farming system under study are linked. Particular emphasis is to be given to input/output transfers, the functions of livestock and farmer objectives with the various enterprises. In order to ensure transferability of results,

31
delineation of recommendation domains needs to include a stratification of crop-animal production systems in the larger agroclimatic zone under study. This can be done by various criteria, using the predominant crop and animal enterprise, such as for example maize/beans and pasture/dairy cows, or coffee/bananas and small ruminants; livestock functions such as animal traction or dairy production: resource endowments; or more general characteristics of the farming system structure such as the degree of subsistence and market access or soil types (Zandstra, 1985).
Figure 2.2.: Crop-Livestock Interactions in Mixed Farming Systems
Cash CTd Fam Inputs
Grain and Straw Live animals and Livestock Froducts
Draught power - reruns - Transport
- ^ LIVESTOCK
'T
Land - Labour - Capital •
} HOUSEHOLD £
T. Milk - Meat - Hides - Security - Ti
Source: Adapted from Mc Dowell and Hildebrand (1980),
Bernsten (1982) stresses the importance of a clear identification of hypotheses at the outset of the research programme, to formulate the criteria for evaluating these hypotheses, and to specify data needs to

32
test them. Collinson (1981) has provided a checklist on information needs in the diagnostic phase of research on mixed farming systems. Gryseels (1985) has listed the specific data requirements of the research on livestock sub-systems. In the analysis of the production system, Zandstra (1985) has identified three levels. First the exogenous factors which have conditioned the system are considered, at the second level analysis is structured and refers to an inventory of land use, livestock herds and capital assets. At the third level, the analysis will focus on the way the system functions. The author notes the importance for the researcher to understand the reasons behind the particular form the production system has taken, e.g. why are farmers not using a particular input even though they are aware of it?
In the diagnostic stage, emphasis is to be given to the seasonality aspects of the inputs and outputs of the production system. This could be in the form of agroeconomic profiles (De Boer, 1983). This stage should also include an appraisal of future prospects for the area if there are no development interventions, the so called "zero option" (Gryseels and Anderson, 1983a).
Information generated by the diagnostic phase should lead to the formulation of possible interventions with likely potential to increase farm productivity. Particular emphasis will be given to ways and means to enhance the interactions between crops and livestock production. Interventions will need to try to overcome the major constraints to the farming system, which can be biological, ecological or socio-economic in nature. Nutritional factors are generally considered the primary limiting factors in crop-livestock research (Bernsten et al, 1983; Zandstra, 1985). New technologies should be low cost, ancTmeet major concerns of the farmer.
These technologies will need to be pre-screened before being tested on-farm, in order to minimize the risk of the farmer involved. This pre-screening can be done through the use of unit, research, or experimental farms (Jolly, 1952; Gryseels and Anderson, 1983a). These are farms usually located on a research station which are managed under the supervision of research staff. Budgeting, programming and simulation modelling procedures also have an important role to play in pre-screening technologies (De Boer, 1983). These technologies will usually relate to forage production, animal nutrition, animal health, integration of higher yielding breeds, or animal traction.
When sufficient confidence is developed in the appropriateness of a particular technology, on-farm testing can be initiated . The objective of this stage is to evaluate the improved practices flowing from the design stage, to the farm. On-farm trials are the intermediate step between controlled laboratory work or on-station research, and extension/ development. They can be of three types: researcher-managed, farmer-managed, or promotional trials (Knipscheer, 1985). Researcher-managed trials may use the farmer's land and his labour, but the managerial input is provided by the research workers. Farmer-managed trials involve the supply of all major resources (land, labour, capital and management) by the farmer who is also the risk taker. Promotional trials consist of demonstrations to illustrate the superiority of a technology.

33
The interventions are then evaluated, both technically and economically, and the impact of their adoption on farm productivity appraised. In the evaluation, three main areas are to be addressed: technical effectiveness, economic benefits and sociocultural compatability (Cook, 1985). Factors affecting adoption of the technology by the target farmers have to be carefully studied. In the research process, close contact will be kept with government extension agents, officials of the Ministry of Agriculture, and research workers of other institutes. Issues related to extension and development of new technology for mixed farming systems are further discussed in Bernsten (1982).
2.4. Need for Additional Studies
Despite the growing acceptance of FSR in sub-Saharan Africa, only few on-farm studies have been undertaken on livestock production in mixed farming systems in the African highlands. Almost all studies on smallholder farming have focused on the crop components. Most of the literature reporting on results of on-farm animal research relate to Asia and Latin America. In sub-Saharan Africa, farming systems research programmes with an emphasis on livestock have focused on pastoral or sedentary farming systems. They have been dominated by international centres or institutes, and USAlD-sponsored projects. ILCA has projects in Mali, Kenya, Niger and Ethiopia, Winrock International in Kenya, and WSARP/USAID in Sudan (Bernsten et al, 1984). ILCA's projects in Mali, Nigeria and Kenya, as well as the WSARP/USAID projects focus on transhumant pastoral and sedentary farming.
The Small Ruminant-Collaborative Research Support Programme in Kenya has been set up with support from Winrock International and USAID. Its objective is to develop and evaluate dual purpose goat production systems for limited resource farmers (Sidahmed et al, 1985). It is undertaken by a multidisciplinary team of scientists, and has involved diagnostic studies, on-station and on-farm trials, and large scale monitoring on the effects of package technologies adopted by farmers.
ILCA's initial results of studies with smallholders in the highlands have been summarized by Gryseels and Anderson (1983a). These studies were undertaken in Ethiopia, which accounts for 50% of the African highlands. The country contains the largest livestock population of sub-Saharan Africa, and its farming system is one of smallholder mixed farming, with a close integration of the crop and animal components. The following chapter will deal with agriculture in Ethiopia in greater detail.
A major study on the economics of smallholder livestock production systems in the highlands was undertaken in Kenya (Stotz, 1983). The systems discussed were commercial in nature, and highly market dependent. The study reviewed the possibilities of intensification of livestock production in Kenya. Livestock production systems were studied in isolation of the cropping system associated with them, and crop-livestock interactions between both systems were outside the scope of this study.
An overview of research on mixed smallholder farming systems in sub-Saharan Africa generally can be found in ILCA (1983a), Nordblom et al

34
(1985), Von Kaufman et al (1986) and Kearl (1986). Many of the research projects are in the form of case studies. The usefulness of this approach has been discussed by Casley and Lury (1982) and Maxwell (1986a). Tuiza and Amir (1986) prepared a useful glossary of on-farm livestock research terms, while Revilla and Amir (1986) have made a bibliographic study of ongoing on-farm livestock research throughout the developing world.

35
3. LIVESTOCK PRODUCTION IN THE ETHIOPIAN HIGHLANDS
3.1. Agriculture in Ethiopia
3.1.1. Introduction
Ethiopia is located in the northeastern corner ("the Horn") of Africa between 3 and 18 latitude north and from 33 to 48 longitude east, and is surrounded by Sudan, Somalia, Kenya, Djibouti and the Red Sea. The country covers a land area of 1.2 million km2, and has a population of 42 million people, the third largest in Africa after Nigeria and Egypt. The population growth has been estimated at 2.7% p.a. from 1965 to 1980, and 2.5% p.a. from 1980 to 1985 (World Bank, 1987). Ethiopia's population is characterized by a wide variety of ethnic groups, languages, cultures and religions. The Amhara form the culturally most dominant group although they account for only 30% of the population, while the Oromos are with 40% of the population numerically the largest tribe. The third largest group is the Tigray with 15%, while other tribes form an additional 15% of the population. The official language of Ethiopia is Amharic, while Orominya and Tigriniya are major regional languages. Approximately 40% of the population is Coptic Christian while 45% is Moslim (Slikkerveer, 1986). Ethiopia still retains the Julian calendar, rather than the Gregorian Calendar which is common throughout the Western world and elsewhere in sub-Saharan Africa. The year is divided into 12 months of 30 days each and a 13th month of five days (or six in a leap year). The Ethiopian Calendar is seven years and eight months behind the Gregorian Calendar. Unless specified, the dates referred to in this study refer to the Gregorian Calendar.
Administratively, Ethiopia is divided in 14 provinces (Figure 3.1). Each province is divided into Awradjas, of which there are 102. Each Awradja is sub-divided into Weredas, which total 586. Ethiopia's capital city Addis Abeba is located in Shoa, the most densily populated province and in 1987 had a population of just under 2 million people. The economies of the northern provinces of Eritrea and Tigray are severely disrupted by warfare and civil unrest. Approximately 15% of Ethiopia's population live in urban areas, and 85% in rural areas (World Bank, 1984a and b ) .
With a per capita income of US$ 110 in 1985 (World Bank, 1987), Ethiopia is one of the least developed countries of the world, and the poorest of Africa, among the countries for which information is available. Life expectancy at birth is 45 years, infant mortality (aged under one) is 168, only 6% of the population has access to safe water and the average calorie supply is only 75% of requirements (World Bank 1981a and 1987). Despite its poverty, Ethiopia has received until recently relatively little development aid. In 1982 for example, the net official development assistance to Ethiopia was US$ 6.1 per caput, compared with an average of US$ 19 for sub-Saharan Africa (World Bank, 1984a and b ) .
In recent years, Ethiopia has received worldwide attention because of widespread famine and starvation. During 1984 and 1985, the country had to provide emergency relief for 9 million people, and import

Figure 3 . 1 . Map of E t h i o p i a 36
( E R I T R E A \ ^ Annan -
^J A-x
T I G R A Y "
• ttetota N.
G 0 N D E R f N \
• Gonder ( * "*"'**.̂
W E L O
G 0 J A M V 0««*
. Gond«. \
W E L E G A *&4 Bate aWoroxa Nakwnt«,
_-» Addit Alubo • D * * » 1 - , r * \
. / .Metu
I L U B A B O R/'Jmmo ƒ SHEWA ^ « * M l o u
«e A R S I / \ H A R E R,G E
K E F A
f G A M O ! G O F A
Arte f)
• * * 0
B A L E
S' \
S I O A M O \

37
approximately 1 million tonnes of grain annually. The need for massive imports of cereals as "food aid" is continuing to date (Maxwell, 1986b) '. The rugged and mountainous terrain of the Ethiopian highlands is a major constraint for an effective distribution of food aid, and for economic development in general. The majority of rural people live at more than a day return walk from an all-weather road (Stommes and Sisay, 1979).
Efforts to halt the trend of declining food production per caput are urgently needed, and the size of the food crisis alone provides sufficient justification to focus agricultural research efforts on Ethiopia, in order to find ways and means to rapidly increase the productivity of agriculture in the country.
3.1.2. The Economy
Ethiopia's economy is dominated by the agricultural sector which in 1985 contributed approximately 44% of the total Gross Domestic Product (GDP) of US$ 4,230 million and 80% of its labour force. Agricultural production has been growing with 2% p.a. between 1971 and 1980, and declined by -0.34% p.a. between 1980 and 1984. Food production grew by an approximately equal amount until 1980, and then declined by -1.4% p.a. until 1985. GDP declined by -0.7% p.a. between 1980 and 1983 (World Bank, 1984b, 1985b and 1987; FAO, 1986). The minimum wage rate fixed by the government is 1.92 Birr per day, reflecting the low income levels of the country 1/. This minimum rate is the actual wage throughout most of the rural areas except during peak seasonal periods. In urban areas, the minimum wage rate is 50 Birr/month, and the majority of unskilled labourers earn less than 100 Birr/month (World Bank, 1984b).
Agricultural exports account for close to 90% of total export earnings. The balance of trade has been negative for the last decade, and despite severe restrictions on imports, these exceed exports by almost one third. Coffee alone provides more than 65% of export earnings, and other agricultural exports include oilseeds, pulses, cotton, sugarcane, fruits, flowers, hides and skins, and livestock (sheep and cattle). Ethiopia has the largest livestock herd of Africa. Other known natural resources include gold, platinium, copper, potash and petroleum. None of these minerals has been exploited on a large scale, and the potential for commercial development remains to be proven. There are some prospects for the exploitation of geothermal energy.
In 1974, the country underwent a profound political change with the overthrow of its emperor, Haile Selassie, and his replacement by a marxist government which has been led since 1977 by Lt. Col. Mengistu Haile Mariam. The banks and major industry and service corporations were nationalized, and private land ownership abolished. The Ethiopian economy experienced severe disruptions in the post-revolutionary period, resulting in stagnation and decline of industrial and agricultural production, until the end of the 70s.
1/ The value of the Ethiopian Birr is linked to the US$ in a fixed exchange rate of 1 US$ = 2.07 Birr. One Birr is thus officially worth approximately US$ 0.50.

38
Since the 1974 political revolution, Ethiopia has made considerable social progress, as reflected by significant increases in literacy rate and school enrollment. The literacy rate rose from 7% in 1973 to 40% in 1981, and the primary school enrollment rate increased from 19% to 47% over the same period (World Bank, 1984b). The marxist government has transformed the institutional and social basis for agriculture. The Land Proclamation Act of 1975 dissolved all existing tenancy relationships and abolished private land ownership. All rural land became the collective property of the Ethiopian people. The policy of the Ethiopian Government is to promote, on a voluntary basis, cooperative modes of production.
Although it is too early to assess the outcome of the agrarian reform, it has been widely acknowledged that the process has led the basis for a more egalitarian income distribution (World Bank, 1981c; Rahmato, 1984; Tegegne, 1984; Ghose, 1985; Dejene, 1987). The performance of the agricultural sector is disappointing however, food production is stagnating and increasingly lagging behind population growth.
Some of the policies of the Ethiopian Government have stirred strong controversy, particularly in the Western world. Although individual smallholder peasants cultivate 95% of arable land, government investments in the agricultural sector are allocated primarily to the state farm sector which covers less than 4% of arable land, and which incurs heavy recurrent losses.
Shortly after the revolution, the Ethiopian Government introduced controls on grain prices by announcing maximum price limits at which grain could be sold by producers and retailers. As the effects of this policy was negligible, the government strategy moved towards controllng supply through the Agricultural Marketing Corporation (AMC). Farmers and merchants are since obliged to sell to AMC particular grain quotas, which are set for each region, at official wholesale prices which are well below free market prices. According to Ghose (1985) the official prices imply a general underevaluation of peasant labour and the price control measures operate as mechanisms of surplus extraction. The government has also instituted legal controls on the domestic grain trade in the major surplus producing provinces such as Gondar, Bale and Arssi (Griffin and Hay, 1985). This prevents traders in moving grain from surplus to deficit areas. The policies to control grain prices and domestic grain trade are thought to result in a discouragement of farmers to produce above their subsistence needs (World Bank, 1983).
In view of the continuing problems of drought and famine, and the need to accelerate agricultural and economic development, the Ethiopian Government in 1984 initiated two major programmes: resettlement and villagization. The resettlement programme aims to transfer people from the ecologically fragile and famine stricken areas in the north, to more fertile areas in the south and south west of the country. In many areas of Tigray, Eritrea, Wollo and Norther Shoa soils are so eroded that even in years of normal rainfall not sufficient food can be produced to support the ever expanding population. At the same time many areas of Kaffa, Wollega, and Illubabor have a low population density, fertile soils and high agricultural potential. The resettlement programme was an

39
expansion of activities that had been started by the Relief and Rehabilitation Commission during the early seventies (RRC, 1985). The new programme is however undertaken on a much larger scale and by the end of 1985 a total of 600,000 people had been transferred. Although the need for and principle of resettlement and migration out of the famine prone areas of the north was generally agreed upon, it was felt that the programme was not well planned and too hastily executed. Some of the new settlement sites were unsuitable for agriculture, and prone to diseases, particularly malaria. In addition, the migration had occasionally been imposed compulsory, and many families were split in the process. These problems caused an international outcry and the government in 1986 temporarily suspended for one year the implementation of the resettlement programme.
In 1984, the Ethiopian Government also started a 'Villagization' programme, through which farmers were encouraged to leave their individual homestead, often located on top of scathered, isolated hills, and build a new one in a centrally located site of each village. The objective of the villagization programme was to faciliatate the provision of social services such as drinking water, education and schools, better housing, clinics and agricultural extension. Critics of the programme pointed to the negative experiences of a similar programme carried out in Tanzania, the resulting difficulties of crop protection due to the larger distance from the village to the fields, the dangers of overgrazing and infectuous diseases around the village, the disturbances in agricultural production as farmers had to build new housing during the ploughing and harvesting seasons, and the large financial expenses, both for the government and the farmers, associated with the implementation of the programme. The rapid speed in the implementation of the programme may have caused a reduction of national agricultural production during 1985 and 1986.
3.1.3 Topography and Climate
Ethiopia has a complex and rugged topography, dominated by a high central plateau ranging in altitude between 1,800 and 3,000 m a.s.l., but on average 2,200 m, with some mountain peaks rising to more than 4,000 m. This plateau descends in the east in a coastal plain spreading to the Red Sea, and in the west in the White Nile Valley plain on the Sudanese border. The Rift Valley divides the country from northeast to southwest, which is further dissected by gorges and broad valleys. The central plateau is bound by extensive lowland areas, most of which are extensive rangelands.
The country can broadly be divided into highlands and lowlands. The highlands, defined as areas above 1,500 m a.s.l., represent 490,000 km2 or approximately 40% of the country's landmass. The lowlands represent 740,000 km2 or 60% of the country. The choice of 1,500 m as the dividing line between highlands and lowlands is justified because in Ethiopia it also corresponds to the altitude at which the mean daily temperature during the growing period is less than 20°C, and to the boundary between the mixed crop-animal farming system of the highlands, and the nomadic pastoralist production system of the lowlands (Constable, 1984).
Ethiopian culture distinguishes three principal altitude-physiographic zones: the "kolla" (tropical) below 1,500 m, the

40
"waina-dega" (subtropical highlands) between 1,500 and 2,500 m and the "dega" (highlands) above 2,500 m. At the lower and upper limits, the "behera" (desert) zone at less than 800 m a.s.l., and the "woorah" (alpine) zone above 3,500 m are also distinguished. This traditional classification on the basis of altitude is largely determined by the temperature regime. The mean annual temperature in the "behera" is between 30 and 40 C, in the "kolla" between 20 and 30 C, in the "waina-dega" between 15 and 20 C, in the "dega" between 10 and 15°C, and in the "woorah" less than 10 C (Getahun, 1978a; AACM, 1984; FAO, 1986d).
Climatologically, Ethiopia can be divided into six moisture regions: perhumid, humid, moist subhumid, dry subhumid, semiarid and arid (De Montgolfier-Kouevi, 1976).
The combination of altitude, temperature and rainfall determines the range limits of vegetation. Actual land use patterns are determined by the length of the growing period and socio-economic factors. The agroclimatic conditions and the growing period classes and types for different areas in Ethiopia have been estimated by Goebel and Odenyo (1984).
3.1.4. Framework for Rural Development
Agriculture in Ethiopia is dominated by the peasant sector, which accounts for 91% of rural households, 95% of the area cultivated and 95% of production (Ghose, 1985). Since the Land Reform Proclamation of 1975, all tenancy relationships have been abolished, and most commercial farms have been nationalized. Prior to the revolution, an estimated 55% of farmers were tenants and they accounted for 61% of cultivated land (Abate and Teklu, 1979). The pre-revolution land tenure system was complex, differed regionally and was closely linked to the social class organization and political power structures existing at that time (Goericke, 1979; Rahmato, 1984; Dejene, 1987). The Land Reform Proclamation declared "all rural land to be the collective property of the Ethiopian people", and that "no person or any other organization shall hold land in private ownership" (Government of Ethiopia, 1975). It also specified that the right to use land was to be distributed as equally as possible, and that the practice of hiring labour was prohibited. The institutional vehicle to implement these reforms were the Peasants' Associations (PAs) that were established by the same proclamation. A PA usually has between 200 and 500 families, and a mean total land area of around 800 ha. PAs have been given wide administrative and judicial powers to redistribute the land, organize cooperations and build social services. By 1984, some 20,000 PAs were in existence, with a total membership of 6.5 million farm families (Constable, 1984).
The policy of the Ethiopian Government is to provide cooperative modes of production. It argues that the formation of Producer Cooperatives (PCs) will allow for economies of scale in the utilization of land and labour, and facilitate the provision of extension, input and market facilities. The process of transformation from individual to collective farming is voluntary and gradual. Although the formation of PCs is encouraged by incentives such as cheaper inputs, lower taxes, higher output prices and access to extension services, by 1984 PCs accounted for only 2% of crop land.

41
The Proclamation of 1975 also allowed for the creation of Service Cooperatives (SCs). These are formed by a minimum of three and a maximum of ten PAs, and are encouraged to procure, store and distribute crop inputs and consumer goods, provide credit, market crops, and promote rural industry and political education. By 1984, 3,815 SCs had already been established with a membership of four million households (Constable, Ibid). Most SCs have concentrated on the distribution of consumer goods, and the collection of grain for the Agricultural Marketing Corporation.
State farms were created on the basis of commercial farms that were nationalized in 1975. They account for only 4% of the area cultivated and for 6% of agricultural production. State farms operate with heavy losses, and production costs far exceed revenues. The Government has not expanded the state farm sector since 1984, and is undertaking efforts to increase their productivity. The peasant sector is of overwhelming importance, and uses its resources far more efficiently than producer cooperatives or state farms (Griffin and Hay, 1985).
3.1.5. Agricultural Production
Agriculture in Ethiopia has been described by various authors including Huffnagel (1961), Westphal (1975), Getahun (1978b and 1980b) and FAO (1986d). These descriptions have been mainly made in qualitative terms. The lack of a quantitative data base has been a severe constraint in the planning of development activities.
In addition to its slow rate of growth, agriculture in Ethiopia is characterized by three conditions: geographical concentration of output in about a third of the land area; the limited amount of intra-regional trade; and instability due to climatic variability (Griffin and Hay, 1985).
Approximately 55% of cereal output and 72% of output of pulses in Ethiopia is produced in the provinces of Shoa, Gondar and Arssi (Ministry of Agriculture, 1979). Although this is largely due to the better quality of land in these regions, Griffin and Hay (1985) noted that the farmers in these regions also enjoy better access to land and had larger holdings. The size of cropland available per peasant family in Ethiopia ranges from an average of 2 ha in Gondar to only .7 ha in Gamo Gofa. Average crop yields range from 1280 kg/ha of cereals in Bale to 490 kg/ha in Gamo Gofa, and for pulses from 450 kg/ha in Wollo to 250 kg/ha in Gamo Gofa. The main regional food surplus areas are Arssi, Bale and Gondar, and the main deficit areas Gamo Gofa, Hararghe, Sidamo, Wollo, Tigray and Eritrea.
Because of the price and distribution controls of trade in grains through AMC the intra-regional trade flows are severely restricted. As a result, inter-regional price differences are substantial and the coefficient of variation of prices of cereals for example are 34% for teff, 25% for wheat, 37% for maize, 21% for barley, 49% for sorghum and 72% for millet (Griffin and Hay, 1985). In addition to the legal controls, transport difficulties and the lack of infrastructure also explain the limited amount of inter-regional grain trade.

42
The most important attribute of the Ethiopian climate is the variability in the intensity and onset of rainy periods. Crop yields vary around a trend line by 10-15% and the coefficient of variation of cereal production in Ethiopia between 1970 and 1985 has been estimated at 13.9% (Griffin and Hay, Ibid; FAO, 1986b). This variability puts additional burdens on the distribution system as reliable crop forecast data are not available.
An increase in grain production could be achieved by either an expansion of area cultivated or by increasing the productivity of cropland.
Of Ethiopia's total land area of 110 million ha, approximately 13.9 million ha (12.6%) is regularly cultivated rainfed cropland, 94,000 ha (.8%) is irrigated land, 9 million ha (8%) is covered with forests, 62 million ha (56%) with pastures and the remaining 25 million ha (23%) is waste or woodland (World Bank, 1984b; FAO, 1987b). The official statistics provided by the Central Statistical Office (Ministry of Agriculture, 1977) indicate that private holdings cultivate approximately 5.9 million ha annually, while PCs and state farms cultivate an additional 300,000 ha. The difference between both estimates can be attributed to areas cropped with perennial crops such as enset (false banana), coffee, chat and tuber crops for which data are generally lacking, and the incidence of fallow land which covers approximately 3 million ha per year.
Crop production by smallholders is dominated by cereals which account for 81% of cultivated land. The principal cereals and the proportion of total area cultivated are teff (24%), barley (13%), maize (11%), wheat (12%), sorghum (13%) and millet (4%). Pulses account for a total of 14% of the total area cultivated, particularly horse beans (6%), chick peas (2%), field peas (3%) and lentils (1%). Other crops account for 5% of area cultivated, and include noug, flax, and sesame. These data are for the 1981/82 crop year. During that year total food production was 5.7 million tonnes of cereals, 0.9 million tonnes of pulses, and 0.3 million tonnes of oilseeds (World Bank, 1984b). In 1986, food production amounted to 5.7 million tonnes of cereals, 1.3 million tonnes of root crops, .9 million tonnes of pulses, and .12 million tonnes of oilseeds (FAO, 1987b).
There are opportunities for an expansion of up to 20% of cultivated land. In the west, south west and southern parts of the central highlands, the land is relatively under-utilized and has a high fraction of fallow. In these areas, the constraints to expanding production are first labour and then capital. In the northern highlands land is scarce, and the remaining land usually eroded, waterlogged or exhausted. The constraint to land expansion in these areas is primarily capital, for example for land conservation, irrigation, or drainage works (Griffin and Hay, 1985; RRC, 1985).
Crop yields in Ethiopia are generally low and for most years average nationally just below 1000 kg/ha for both cereals and pulses. In the period 1974-1978, the national average was 740 kg/ha for teff, 950 kg/ha for wheat, 950 kg/ha for barley, 630 kg/ha for chick peas, 605 kg/ha for field peas and 985 kg/ha for horse beans (Ministry of Agriculture, 1979).

43
Increases in crop yields could be achieved from a higher use of inputs, particularly mineral fertilizers, improved seed varieties and irrigation. Mineral fertilizer consumption is low and averages nationally only 35 grams of plant nutrient per hectare of arable land (World Bank, 1987). In 1981/82 approximately 76% of available fertilizers were allocated to the state farm sector and only 24% to the peasant sector. On peasant holdings, fertilizer use is confined to 2.5% of land cultivated. The principal reasons for this low use of fertilizer are its limited availability and unfavourable benefit/cost ratios. Only 5000 tonnes of improved seeds are used annually by the peasant sector, mostly in producer cooperatives. Approximately 88% of improved seeds go to the state farm sector and resettlements (Ghose, 1985; FAO 1986d).
Irrigation is limited to less than 1% of cultivated land but the high capital cost of irrigation works constrains a further expansion.
Nationally, crops account for 80% of the gross value of production of agriculture and livestock for the remainder. Ethiopia has the largest livestock herd on the continent and accounts for 17% of cattle, 20% of sheep, 13% of goats and 55% of equines of sub-Saharan Africa. Its livestock population was estimated in 1983 at 26.3 million cattle, 23.4 million sheep, 17.2 million goats, and 1 million camels. A description of the indigenous cattle breeds can be found in Alberro and Haile Mariam (1982a and b) and of the indigenous sheep breeds in Ministry of Agriculture (1975). Annual production of milk during 1979-81 was estimated at 808 million tonnes, and of meat 415 million tonnes (FAO, 1986b). The country recovers annually about 1.9 million hides and 15 million skins from the slaughter of animals. In addition animals provide nearly all the draught power for the cultivation of cropland, and produce 24 million tonnes of dryweight manure (AACM, 1984). Donkeys provide most of the rural transport needs.
Marketing systems for livestock are not well developed. Smallholder farmers do not keep livestock for the purpose of selling market products. Most animals are purchased and sold on small local markets, and eventually trekked to major consumption areas, causing substantial weight losses (AACM, 1984). The organisation of the meat market in Addis Abeba has been described by Assamenew (1977).
In the peasant farming sector of Ethiopia, broadly two main agricultural systems can be distinguished: smallholder mixed farming in the highlands, and pastoralism in the lowlands.
3.1.6. Importance of the Highlands
Although the highlands cover only 40% of Ethiopia's land mass, they contain 88% of its human population, account for 95% of regularly cultivated cropland, 70% of livestock and 90% of the country's economic activity (Constable, 1984). Within the livestock population, 70% of cattle, 75% of sheep, 27% of goats and 80% of equines can be found in the highlands (Jahnke and Asamenew, 1983).
Agricultural production in the highlands is of overwhelming importance to Ethiopia. Yet, the physical resources of the highlands are at risk. Degradation is increasing rapidly, and over 200 million tonnes of soil are lost from the highlands annually (FAO, 1986d). The

44
sustainability of the farming systems is threatened, mainly through the reduction in soil depth and the loss in vegetation cover.
For that reason, the Ethiopian Government initiated in 1983 a Highlands Reclamation Study (FAO, Ibid). This study was intended to assess the extent and causes of degradation and formulate development options. By 1987, a stream of working documents had been prepared, and an integrated study was being finalized. Almost all working documents that were produced pointed to the lack of farm level data, and the difficulties of planning and appraisal of development activities in the absence of quantitative data base.
3.2. Research on Farming Systems in the Highlands
3.2.1. Zonation of the Ethiopian Highlands
Various authors (Getahun, 1978a and b, and 1980; AACM, 1984; FAO, 1986d) have attempted to classify the Ethiopian highlands in terms of agro-ecological zones. Broadly, a distinction can be made between a high potential cereal-livestock zone, a low potential cereal-livestock zone, and a high potential perennial-livestock zone. The principal characteristics of these major zones are summarized in Table 3.1.
Table 3.1. Characteristics of the Major Agro-Ecological Zones in the Ethiopian Highlands
High potential cereal-livestock
Area 149,900 Population density
(persons/km2) 73 Proportion of total
human higland population (%) 32
Livestock density (TLU/km2) 55
Proportion of total highlands livestock population (%) 41
Ratio livestock/ human population 0.75
Soils volcanic parent materials
Climate sub-humid/humid
Topography rolling plateaux
Growing period (days) 150 to 240
Agricultural output cereals, pulses,
livestock
Low potential cereal-livestock
134,000
72
35
30
26
0.42 sedimentary or metamorphic parent materials sub-humid/semi-arid
mountainous/ escarpments
90 to 150
cereals, pulses, livestock
High potential perennial-livestock
139,500
74
33
27
33
0.36 volcanic parent materials
humid
dissected plateaux
>240
coffee, tubers, enset, livestock
Source: Adapted from Getahun (1978a), Jahnke and Asamenew (1983) and Constable (1984).

45
The three zones are approximately equal in size and in human population density, but the high potential cereal/livestock zone has a much higher livestock density than the other zones. For every human being in the high potential ceral/livestock zone (HPCL), there are 0.75 TLU, against only 0.42 TLU in the low potential cereal/livestock zone (LPCL), and 0.36 in the high potential perennial/livestock (HPPL) zone. The climate ranges from sub-humid/humid in the HPCL to sub-humid/arid in the LPCL and humid in the HPPL, and the growing period ranges accordingly.
Soil degradation is widespread and severe in the LPCL, moderate to severe in the HPCL, and limited in the HPPL. Smallholder mixed farming is dominant in all three zones, and ox-ploughing is the usual tillage system in both the cereal/livestock zones. Although in the HPPL ox-ploughing may occur occasionally, the common tillage system consists of the use of hand hoes.
The HPCL comprises the central highlands of Shoa, Gojam, South Gondar, East Welega, Arsi and Bale massifs, Wole excarpment and the Central Hararghe highlands. The LPCL consists of the northern provinces of Eritrea and Tigray, North Gondar, Wollo except escarpment, northeast Shoa and its Rift Valley, and the lower highlands of Hararghe, Arssi and Bale. The HPPL is located in the southern and western parts of Ethiopia, particularly in the provinces of Sidamo, Gamo Gofa, Kefa and Illubabor, east Welega, and southwest Shoa (Figure 3.2.).
It is mainly in the LPCL that famines have occurred in recent years, while the HPPL has attracted attention because of government resettlement programmes.
3.2.2. Livestock Production Systems
The livestock population of the Ethiopian highlands has been estimated by various authors (De Montgolfier-Kouevi, 1976; Ministry of Agriculture, 1977; AACM, 1984) and summarized by Jahnke and Asamenew (1983) as consisting of 18.9 million cattle, 18 million sheep, 4.8 million goats and 5.6 million equines. The cattle herd includes four to six million draught oxen. FAO (1987b) has estimated the livestock population of Ethiopia at 26.3 million cattle, 23.5 million sheep, 17.2 million goats and 5.6 million equines. The estimate of the number of goats is particularly wideranging, and reflects the poor state of the existing data base on the size of Ethiopia's livestock population.
Livestock husbandry systems are similar throughout the highlands but differences in population density, cropping systems and resource availability cause regional characteristics. Principally, cattle are kept for draught power and manure, sheep for meat and as an investment. Equines are used as pack animals. All livestock graze on unimproved pastures, and are occasionally fed crops by-products. Mating is natural. Productivity is low for all species in terms of conventional outputs such as milk and meat.
AACM (1984) has distinguished three zones in the highlands that have distinct livestock production systems: the barley and sheep farming zone above 3,000 m a.s.l., intensive field crop farming between 1,500 and

46
Figure 3.2. Zonation of the Highlands
(based on altitude and agro-ecology)
A L T I T U D E
2 500 - 3000
2 000— 2 500
I 500 — 2 000
H P P HIGH POTENTIAL PERENNIAL CROP Z O N E |
HPC HIGH POTENTIAL CEREAL ZONE
L P C LOW POTENTIAL CEREAL ZONE
-^r Source: FAO (1986d).

47
3,000 m a.s.l., and moderate cultivation or perennial crop farming also at altitudes of between 1,500 and 3,000 m.
The barley and sheep farming zone above 3,000 m has a short growing season because of frost, and livestock are fed on natural grazing and barley stubbles. The dominant livestock are sheep which are herded in large flocks and owned by several farmers and herded by children. Cattle are only kept for crop cultivation.
The most important livestock production and farming system can be found in the area between 1,500 and 3,000 m. The proportion of land planted with crops can vary from 70% in the intensively cultivated areas to 50% in areas with moderate cultivation. Usually the area between 2,000 and 3,000 m is moderately cultivated because of frost problems and lower human population densities. The main crops in this area are wheat and barley, in addition to pulses such as horse beans and field peas. A large proportion of this zone is kept as fallow or pasture, and livestock density is higher than elsewhere. The intensively cultivated areas can be found at altitudes between 1,500 and 2,000 m. The main crops are teff, wheat, maize, chick peas and horse beans, and almost all land on the slopes is being cultivated. Livestock graze in the bottomlands, which are unsuitable for cultivation because of waterlogging during the rainy season, and on rough or waste land. Fallow land is rapidly disappearing in this area. Feed intake of animals is increasingly dependent on crop by-products. Cattle are kept mainly for land cultivation, and milk and manure production. Small ruminants are kept as a secondary investment.
Livestock production in field crop farming systems has been described by Gryseels and Anderson (1983a). Livestock productivity is low by Western standards. Milk offtake of Zebu cows rarely exceeds 300 kg for lactation periods of less than 7 months. The annual calving rate for indigenous cattle is just over 50% and cattle take from four to five years to reach maturity. Lambing percentages are no more than 110%, and morbidity and mortality are high, up to 30%. Livestock graze in mixed sex groups, giving little opportunity for controlled mating or seasonal calving.
In the highland-perennial zone, animals are of less importance in the farming system. The staple food is ensete (false bananas) and maize, while coffee serves as a cash crop. Land cultivation is by hand hoe, because of the fragmentation of the holding into small parcels and intensive intercropping, and there are higher numbers of small ruminants. Manure is important for crop fertilization. Little grazing land is available and livestock are mainly fed on by-products and roadside verges.
In the literature on agricultural production in Ethiopia very little attention has been given to the problems and opportunities of livestock production, except in pastoral systems. Westphal (1975) limits his consideration of livestock in the highlands to a description of ox-ploughing and some very brief references, while Huffnagel (1961) and Getahun (1978b) only give a qualitative overview of the livestock sector. Only few farm management data are available on smallholder livestock production systems in the highlands, and these relate mainly to the size of livestock holdings on individual farms.

48
3.2.3. Research and Development Efforts
The Institute of Agricultural Research (IAR) was established in 1966 to undertake and coordinate agricultural research in Ethiopia. Its research is organized on a commodity and disciplinary basis, and livestock research is coordinated within the Department of Animal Science. The Department consists of three divisions: Animal Production, concerned with cattle, sheep and goats; Animal Feeds and Nutrition, that includes forage and pasture research and Animal Health, which has an advisory and service function. Recently, IAR has organised a major workshop in which the state of its livestock research has been critically reviewed (Kebede and Lambourne, 1987).
The major research emphasis has been on crossbreeding trials. Managerial and fattening trials have also been conducted, mainly in association with the breeding programme. A number of promising grass and legume species for different agro-ecological zones have been identified, and the composition of various feeds determined. There has not yet been an attempt to test any results under farm conditions, and the impact of the research programme on farm production has been virtually nil (Abebe et al, 1983; ISNAR, 1987).
The Department of Socio-Economic Studies has undertaken farm management surveys (Friedrich et al, 1973), and starting in 1977, some initial FSR studies. These were rapid, single interview surveys aiming at identification of problems, and to indicate priority areas for research (Zegeye et al, 1979 a, b and c ) . These surveys focused on the cropping system but gave initial indications on the constraints to livestock production in the areas surveyed. An attempt was made to develop 'packages' of innovations which would include improved crop varieties and recommended cultural practises, but few positive results were achieved. There was no follow-up on the results of surveys in the livestock component research programme. Since 1985, IAR has strengthened its capacity for FSR through an in-depth training programme for its staff, organized by CIMMYT with support from ILCA. A review of FSR at IAR has been made by Mekuria and Franzel (1987). A major problem in achieving impact is the weak link between IAR and the extension services of the Ministry of Agriculture.
Most of the studies on the traditional farming system in the Ethiopian highlands were undertaken in the period before the land reform. Cossins (1973) for example undertook a survey of the farming system of 4 areas in the Ethiopian highlands. Although his report is mainly descriptive, it contains much valuable information about the farming systems during the period before the land reform. Leander (1969) studied the traditional farming system in Chilalo province. Recently, the Ministry of Agriculture has also started to undertake farming systems surveys throughout the country (Ministry of Agriculture, 1986a and b; Mitchelhill, 1986).
Livestock development efforts in Ethiopia are coordinated by the Ministry of Agriculture, through its Animal Resources Development

49
Department (ARDD), which is divided in eight teams: veterinary services, animal breeding, nutrition and range improvement, marketing services, tsetse and trypanosomiasis, articifial insemination laboratory services and rangelands projects. The livestock state farms are under the authority of the Ministry of State Farms Development.
The Ministry of Agriculture recognized the importance and potential of the livestock sector in Ethiopia and therefore commissioned in 1983 a "Livestock Sector Review" study to an Australian consultancy company. This study defined the nature and size of the country's livestock resources, determined the potential for development, and identified a series of development projects. The results are available in the form of a main report and 14 annexes on particular aspects of the livestock industry (AACM, 1984). The study identified major gaps in knowledge, and urged to give a major priority in the future to farm and Peasants Association level studies to develop an adequate data base. On the basis of available information, it identified nutrition and health as the major constraints of Ethiopia's livestock industry.
Earlier efforts to review the livestock industry of Ethiopia were made by Marousek et al (1969) and the Ethiopian Science and Technology Commission (1978). Livestock projects in Ethiopia financed by the World Bank before 1980 were largely failures due to the civil unrest during the 1970s and poor project design (World Bank, 1985a). The First Livestock Development Project supported commercial dairy development around Addis Abeba. The Second Livestock Development Project involved the establishment of slaughter facilities, and stock routes for livestock, but was only partly completed. The Third Livestock Development Project focused on the improvement of rangeland management and of veterinary services in pastoral areas. The Fourth Livestock Development Project has started in 1987 and is more oriented towards the needs of small farmers and consists of sub-projects to improve veterinary services, marketing, fodder production and information on farming systems (AACM, 1984; World Bank, 1985a).
Although the Ethiopian Ministry of Agriculture was established at the beginning of this century, it was not until the early 1950s that attempts were made to transform traditional peasant agriculture. Most of these attempts have focused on the cropping system and used the "package" approach. The major components of the package programmes have included fertilizers, improved seeds, farm credits, marketing facilities, better tools and implements, and improved storage facilities.
The basic aim of the package approach was to accelerate agricultural development by concentrating inputs and activities in geographically delimited regions (Stahl, 1973). A partial inventory of these regional development projects was compiled by Getahun (1977).
The first comprehensive package project established in Ethiopia was the Chilalo Agricultural Development Unit (CADU). This project began in 1967 and was financed jointly by the Ethiopian and Swedish Governments and continued until 1974. It included research, extension and marketing activities as well as credit and input supply schemes for smallholders (Nekby, 1971; Bengtsson, 1983). Its main impact was to show that

50
significant increases in cereal yields were feasible through the use of fertilizer. Farmer extension services were an integral part of CADU's activities. Other similar projects were started in later years, but it was realized that implementing them throughout the whole country would not be feasible because of the high manpower needs and costs involved. Then, as now, Ethiopia had insufficient highly qualified staff to service adequately the needs of millions of farmers. These package programmes also fostered regional economic inequalities and large landowners benefited disproportionally (Stahl, 1973; Tecle, 1975; Lele, 1980; Whyte and Boynton, 1983; Dejene, 1987).
As a result of these disadvantages, the minimum package programmes (MPPs) were initiated. In 1971 the Extension and Project Implementation Department (EPID) was established in the Ministry of Agriculture, with the general aim of increasing the production of peasant farmers by the distribution of fertilizer and improved seeds and credit. The programmes were funded by the World Bank through a credit from the IDA (International Development Association). Most of the target farmers for these programmes were, however, located close to all-weather roads and therefore only a minor fraction of the population was reached. Furthermore, the MPPs have concentrated on crop improvement. There was also little attempt to adopt the package to the varying ecological and social conditions of the country. During the 70s, the activities of MPP were severely constrained by the disruptions and security problems associated with the post-revolution period (World Bank, 1981b). The MPP programmes were revived during the early '80s but an assessment of their impact has as yet not been made. To date, little attention has been given to improving the whole farming system by developing the livestock component as an integral part of the farm. The MPP programme emphasises the production of basic food-stuffs, and livestock development is given low priority.
CADU was renamed the Arsi Rural Development Unit (ARDU) following the 1975 Agrarian reform. Although ARDU is still the only integrated rural development programme in Ethiopia with the objective of increasing the productivity of peasant farmers, since the early 80s its programmes have concentrated on the promotion of cooperatives and on the gradual transformation of individual small farms into cooperatives (Dejene, 1987).
To date the most significant contribution of CADU/ARDU to agricultural production is the package programme, which includes the dissemination of higher yield varieties of wheat and barley, and mineral fertilizers, on credit. Yields of the farmers involved have increased from 600 kg/ha in 1966 to 2000 kg/ha for barley (Dejene, ibid). Dejene (1985) found however only 11% of sampled households in the area to be using fertilizer together with improved seeds. The impact of ARDU's livestock projects was found to be limited to vaccination programmes, and the improvement of dairy cattle on cooperatives. Only few positive results have been obtained in the areas of plant protection, water development, and the improvement of farm implements. Such programmes are perhaps too resource and manpower demanding for sustained impact.

51
3.3. A Case Study: Research on a Smallholder Mixed Farming System in the Baso ana Worena Wereda of the Ethiopian Highlands
3.3.1. Background
Field research on a smallholder mixed farming system in the Ethiopian highlands, reported in this study, arose from the need for farm management data that would quantify the contributions of the livestock enterprise to the overall farming system. The research was undertaken within the framework of the highlands programme of the International Livestock Centre for Africa (ILCA). ILCA has followed a systems approach to research since its inception, and has undertaken field studies in each of the major ecological zones of sub-Saharan Africa, i.e., arid, semi-arid, sub-humid, humid and highland zones. An overview of FSR at ILCA and of the results achieved is provided by Gryseels et al (1986a). The objectives of ILCA's Systems Research were to diagnose constraints to increased animal production, develop prototype technologies under farm conditions, develop research methodologies, monitor technology adoption, and to help the systems research capacities of national institutions.
ILCA's highlands programme started in 1977 with the general objective to undertake research that would provide the development basis for increased agricultural production in the African highlands. The initial focus of the research was in the central Ethiopian highlands, particularly in the high potential zone (ILCA, 1978; Getahun, 1978a). As indicated in previous sections, Ethiopia alone accounts for 50% of Africa's highland area. The country also has the largest livestock herd of Sub-Saharan Africa.
The choice of the high potential cereal/livestock zone was justified because of the high human and livestock densities, and because its ratio human/livestock population was much higher than elsewhere. In-depth information on such a farming system would provide adequate quantitative evidence on the processes of both crop-livestock interactions and competition between these enterprises. Results obtained here would have broad relevance to other highland areas.
Within the high potential cereal/livestock zone, Getahun (1978a) identified four distinct regions: Central highlands, Arsi-Bale highlands and massif, Harar highlands and northeastern highland valleys. ILCA decided to focus its initial efforts on the central highlands because it was the largest of the four regions, and it contained almost 5 million cattle, or 25% of the highlands' total. In addition, its geographic proximity to Addis Abeba, where ILCA's headquarters is located, was a particular advantage in minimizing the logistical and security problems for the staff involved.
Within the central highlands ILCA selected two study areas for its field research, each at a different altitude: the first area lay around Debre Zeit, 50 km south of Addis Ababa at an altitude of 1800 m, while the second lay around Debre Berhan, 120 km northeast of Addis Ababa in an altitude of 2800 m (Figure 3.3.). Research stations were established in both areas (Gryseels and Anderson, 1983a). In each of these areas a rapid baseline survey was undertaken to provide an initial understanding of the farming system. The results of these surveys are reported in Telahun Mekonnen and Getachew Assamenew (1978) and Telahun Mekonnen (1978).

52
Figure 3.3.: Location of the Baso and Worena Wereda
ETHIOPIA
The specific objective of the highlands research program, as stated in a document of the Board of Trustees of ILCA (ILCA, 1978) was:
"To bring together available technologies in a range of farming systems that will increase animal productivity and profitability in the Highlands." However, it was felt that dependence on available technology should not be seen in absolute terms, but technology should be used as a first step to the identification of constraints. As experience of the effects of available technologies would come in, new constraints would be identified, and be the subject of further research. A number of assumptions were made that provided the form and operating conditions for the Highlands Program. They were summarized as follows (ILCA, ibid):
" (i) Smallholder farming for the production of subsistence crops will be the prevailing system for the foreseeable future in the East African Highlands.

53
(ii) There is an urgent need to maintain and build up soil fertility.
(iii) Animal draught will remain an integral part of Ethiopian Highland farm system.
(iv) Improved forage production and better genetic capabilities are the basis for the improvement of livestock output.
(v) Improved forage production on arable land is possible only when basic subsistence requirements are fulfilled.
(vi) There is a growing demand for dairy products and an increasing interest among smallholders in starting dairy farming.
(vii) Sheep are an important feature in the Highlands of Ethiopia and there is considerable scope for increased output, again if fodder production and genetic potential can be improved.
(viii) At present there is a certain amount of under-utilisation of labour in most peasant communities, at certain times of the year."
The programme consisted of a combination of farming system studies, including on-farm technology testing and appraisal, and station-based research which focused on key elements of the traditional farming system. The Highlands Programme staff consisted of a team leader (initially an animal scientist, at a later stage an agricultural economist), an animal scientist, a forage agronomist and an agricultural economist. The author of this study was the agricultural economist of the team, and had overall responsibility for survey work and on-farm research activities.
The initial baseline survey results only gave a very general, mainly qualitative description of the local farming systems of Debre Zeit and Debre Berhan. It was felt that more in-depth studies were necessary to more adequately identify the constraints to these farming systems. This would help to identify new opportunities for development as well as any special problems and processes likely to occur with the adoption of innovations in a peasant economy. Routine data collections with a group of control farmers were set up in each study area. These farmers would serve as a control group against which innovation introduced at a later stage could be evaluated, and at the same time provide detailed information on the productivity and the workings of a subsistence farming system.
In late 1978, three Peasants Associations of the Tegulet and Bulga Awraja provided ILCA's Highland Programme with 280 ha of land for a research site near Debre Berhan. This Awraja covers 7844 km , and has a rural population of around 530,000 people, organized in 761 Peasants Associations (PA's) having a total farmer membership of 126,000 farm families. Its principal urban centre is Debre Berhan, which has a population of approximatively 22,000 inhabitants.

54
The Awraja is divided into 12 Weredas. The ILCA station is located in the Baso and Worena Wereda. The rural population of this Wereda is organized in 100 PA'S with a registered membership of just under 20,000 farm families. Details on the Wereda are given in Table 3.2.
Table 3.2. Characteristics of Baso and Worena Wereda
Number of peasant associations: 100 Size (excl. Debre Berhan town): 105,040 ha Number of households: 21,604 Total population (excl. Debre Berhan): 105,124 people -Population density: 100 people per km
Age and sex distribution of members of peasants associations (1980) 1/
Age:
Male Female
All % total
18-28 29-39 40-48 49-59 60-69 70-79 Total
3418 240
3658 18
4267 241
4508 23
3444 374
3818 19
3104 370
3474 18
2265 407
2672 13
1438 260
1698 9
17936 (90%) 1892 (10%)
19828 (100%)
1/ Household heads only. Data were collected from records from the local Ministry of Agriculture office.
This study reports on the outcome of the research findings in the Baso and Worena Wereda. The author joined ILCA in February 1979, at which time research in the Debre Zeit area had already been initiated. The organization of field research in the Baso and Wereda was under the principal responsibility of the author.
3.3.2. Objectives of the Field Research
The objectives of the field research were as follows:
(i) To provide a quantitative and qualitative description of the production system around the ILCA Debre Berhan station in order to clarify causal relations between its components so as to yield information to enable:
- identification and analysis of factors limiting the productivity of the farming system; and
- evaluation of the likely impact of alternative technological interventions.
(ii) To quantify the role and contribution of livestock in that production system.

55
(iii) To provide baseline information against which the results of on-station and on-farm experimentation could be evaluated.
(iv) To appraise the feasibility of introducing improved technology related to the livestock sub-system and to assess its impact on farm income and on the productivity of the whole farm.
3.3.3. Research Design, Data Collection, and Data Analysis
ILCA's station at Debre Berhan is surrounded by land belonging to four different PAs: Milki, Karafino, Korgmargfia, Faji and Bokafia (Figure 3.4). These four associations were choosen as the basis for the sample selection of the farmers involved in the study on the traditional farming system. During the first year, 60 farmers (15 from each association) were randomly selected from the population lists of these associations, as they were kept at the district office of the local Ministry of Agriculture. After one year of data collection, the sample size was reduced to 42 farmers because of operational difficulties. The sample farms were located within an eight km radius around the ILCA station, or up to two hours of walk. The four PA's are somewhat different in terms of ecology and population density. Size and populations of each of these PAs are given in Table 3.3. To ensure full cooperation of the sample farmers in the data collection, meetings were organized regularly with the farmers themselves, the chairmen and secretaries of the PAs concerned, extension workers and government officials. Farmers were invited at least once a year to a field day organized at the Debre Berhan Station, at which they were briefed on ILCA's research activities, and were given lunch, a 'certificate for cooperation in agricultural research' and a present that would not affect their agricultural productivity, such as an umbrella, a rope or a bucket. In addition to farming systems research activities, the Highland Programme had on-station research activities on important components such as forage and pasture agronomy, bottom land utilization and draught power usage (ILCA, 1981b).
Table 3.3.: Size of Human and Livestock Populations of the 4 Sample
Name of PA
Milki Karafino Faji-Bokafia Korgmargfia
PAs 1/ Size (ha)
720 640 800 680
N° Total Families Pop.
210 1005 132 603 273 965 250 834
N° N°other N° N° N° N° Oxen Cattle Sheep Goats Equines Poult
364 793 1567 92 502 501 140 340 721 - 195 n.a. 137 350 1383 38 532 n.a. 406 831 1333 47 593 479
1/ Size as estimated in 1979 by chairmen of the PAs. Livestock populations were estimated in 1982 on the basis of PA records.
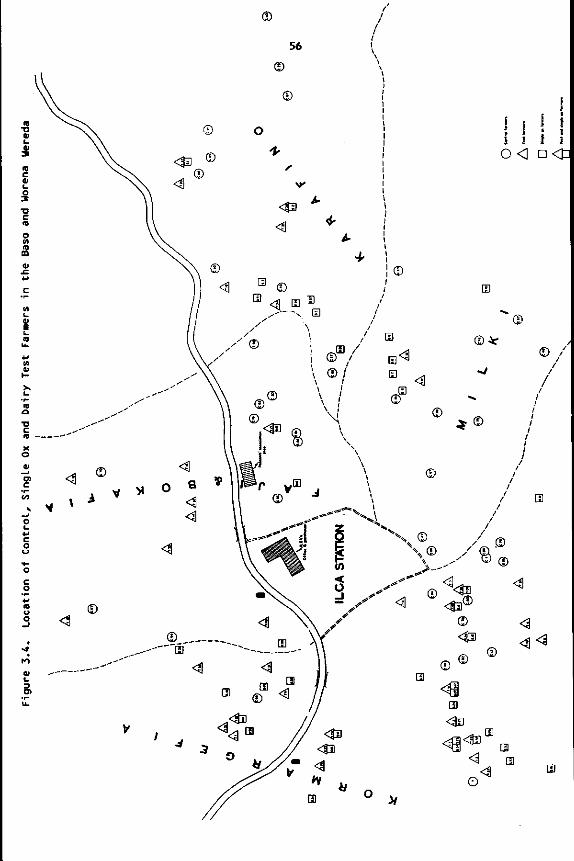
! i o <
I ! î 1 D <£
<D /

57
The information on size of PAs as reported in Table 3.3 was obtained from the chairmen of the respective PAs. Subsequent measurements using land use maps and aerial photographs showed the real size of three out of the four PAs to be almost twice this estimate (see Annex 3.3). According to the land reform proclamation no PA is entitled to control more than 800 ha of land. The underestimation by the chairman was probably due to a fear of government imposed redistribution. It would also explain why the estimate by the Chairman of the Karafino Association, which has real size of only 676 ha, was correct.
Approximately 51% of the area of the four PAs can be classified as arable cropland, 29% as pasture land and 20% as rocky upland. Pasture land is located mostly (75%) on the moderate slopes, while approximately 25% is located in the wet bottomlands. The distribution of land use according to PA is given in Annex 3.4. All PAs have a relatively equal proportion of wet pasture. Faji-Bokafia has a substantially higher fraction of dry pasture, but less arable land. Both Faji-Bokafia and Milki have a much greater proportion of upland (26% and 28% respectively) than Karafino (19%) and Kormargfia (18%).
Routine data collections were set up from 10 farmers in each of the Milki, Korgmargfia, Faji and Bokafia, and Karafino PAs, while 12 farmers were from Korgmargfia. The surveys covered thus approximately 5% of the farmer population of each PA sampled. In this study, farmers in the sample are referred to as 'control farmers'. The size of the data sample per year per PA is given in Annex 3.2. Data were collected from a total of 91 different smallholders and the data set available for in depth analysis consisted of 237 farmer/years. Four data collectors, all high school graduates, were recruited for the actual data collection. They were given an in-depth training on the objectives of the survey, the use of the questionnaires and basic techniques for measuring and observation. Supervision was given by the author and one Ethiopian field agricultural economist. The data were collected through weekly visits (on horseback or by walking) to the farmers and through direct observation. Outputs and inputs were measured by weighing, using portable scales. For each farmer, local weight units and containers such as 'Kuna' (for grain), 'Kurbet' (for hay or straw), 'Tassa' (for butter), were measured in kg/equivalent for each crop or livestock product. This allowed for a precise estimate of quantities of inputs and outputs if on-farm direct measurement was not possible. Inventories were taken in April, at the start of the main cultivation season. Routine data collection was undertaken from 1979 until 1984. Certain data were only collected for part of this period.
The following data were collected:
(a) Inventories of land holdings (including area cultivated, fallow land and pasture land), plot sizes, stock holdings, tools and equipment, and demographic data.
(b) Detailed input-output data on both crop and livestock production by labour category and farm operation. In particular: - labour by activity, by type, age and sex of workers;
- animal draught power usage and cultivation details;

58
- material inputs to the cropping enterprise such as seeds and fertilizer, by crop and plot;
- material inputs to the livestock enterprises such as feed concentrates, veterinary supplies and grazing time per animal type;
- breeding and animal health records;
- outputs of grain, straw and residues from the cropping enterprise, and productivity (milk, meat and other livestock products) of the livestock enterise;
- weights of draught oxen and milking cows;
- disposal of crops and livestock, such as consumption, sales and gifts;
- basic agronomic information on seeding, weeding and harvesting dates, crop diseases, fertilizer response, etc;
- household economy information, consumption and expenditure patterns, use of cash income and energy use;
- sociological/demographic information on family sizes, task responsibilities, observance of religious holidays and fasting periods; and
- market information on crops and livestock.
Every year around 20% of the farmers were replaced in the sample. This was due to factors such as migration, data collection fatigue, the joining of a cooperative or death. A detailed list of farmers in the sample, as well as the data collected annually is given in Appendix 3.1. The data were tabulated on computer entry formats and directly entered on a Hewlett-Packard-3000 computer.
The initial data evaluation and analysis was done using Statistical Package for Social Sciences (SPSS) as developed by Nie et al (1975). This programme calculated means, frequency distributions, and standard deviations for the main parameters. The Statistical Analysis System (SAS, 1985) package was used to verify the statistical significance of results of comparative studies. The data were also analyzed by least square procedures (Harvey, 1977). Such procedures adjust for unbalanced sample design and allow valid comparisons of unequal population sizes. The choice of data analysis tools was taken after close consultation with ILCA's biometricians and computer programmers.
The study of the traditional farming system and the identification of constraints took place from 1979 to 1984. It had been intended to phase out routine data collection at the end of 1983. However, this latter year was a poor crop year, and drought and frost caused low grain yields. The incidence of crop failure was widespread throughout the country, causing famine and hardship for many millions of rural people.

59
Although most of the data analysis had been completed, it was decided to continue data collection in the traditional system for one more year until 1984.
The process of farm surveys led to the identification of a number of promising new technologies, that were subsequently tested with farmers belonging to the same Peasant Associations where the previous farm studies had been undertaken. In order to provide a control group against which the effects of these innovations could be evaluated, some data such as information on livestock holdings, land use and productivity, and market prices were also collected until 1985. The objective of these on-farm verification trials was to evaluate the suitability of new technologies in a farm environment, to study the effect of this technology on farm income and productivity, to appraise adoption problems and to give guidelines to component research.

60
Annex 3.1 Specification of Data Collected in Farm Surveys at Baso and Worena Wereda
Type of Data
1. Family size and composition 2. Inventory of landholdings, plot sizes
and farm assets 3. Livestock holding and composition 4. Consumption, sales and purchase of grains
and livestock products 5. Market survey of crops, livestock and
livestock products 6. Material inputs and outputs crop and
livestock production 7. Cropping pattern 8. Labour inputs and draught animal usage 9. Milk production from cows 10. Livestock feed record 11. Weights of cows and oxen 12. Breeding and health records 13. Farm income and expenses 14. Weights and heights of family members 15. Time allocation of household members
Frequency of data collection 1/
A
A TM
Year of collection
1979-85
79-85 79-85
1/ A = once a year; months
TM twice a month; W
TM
TM
80-84
79-85
TY TY W W TM TM TM W 2M W
79-85 79-85 79-81 82-84 82-84 83-84 82-84 79-84 82-84 81
weekly; 2M = every 2
Annex 3.2 Size of Data Sample (No. of Farmers/PA) 1/
Year Peasants Association
Faji/Bokafia Karafino Korgmargfia Milki
Total
79
10 12 10 9
80
10 12 11 9
81
9 11 11 9
82
8 8
11 9
83
9 11 11 10
84
8 10 9
10
Total
54 64 63 56
41 42 40 36 41 37 237
1/ Number of farmers per Peasants Association for which records of sufficient quality for analysis were available.

Pasture Arable Upland
Total
61
Annex 3.3 Area of Land Use of Sample PAs by Source of Estimate (ha)
Milki Fajl/Bokafla Map Chairman
Peasants Association Karafino ^_^ Korgmargfia Map Chairman Map Chairman
676 788 371
1835
320 352 120
792
194 382 100
240 360 40
676 640
Source: Giglietti and Stevan (1986).
406 777 235
453 227
1418 680
Map Chairman
300 200 806 580 329 100
1435 880
Annex 3.4 Land-Use of Sample PAs (1984, % of Total Area)
Land Use Class
Faji/Bokafia
Wet pasture Dry pasture Arable land Cropped upland Upland wasteland
Total
Source: Giglie >tti
7 30 37 6
20
100
and Stevan
Karafino
8 21 52
4 15
100
(1986).
Kormargfia
7 22 53
1 17
100
Milki
8 13 51
5 23
100
Total(Ha)
394 1182 2523
229 1036
5364

62
4. RESOURCE ALLOCATION BY SMALLHOLDER FARMERS IN THE BftSO AND WORENA WEREDA ~~ _
4.1. Introduction
The Baso and Worena Wereda is located in the high potential cereal/livestock belt of the Ethiopian highlands (Amare Getahun, 1978a). Throughout this belt, the farming system is based on smallholder rainfed agriculture, annual crops planted by broadcasted seed, rudimentary implements (sickles and hoes) and ox drawn wooden ploughs. Land use is dominated by the production of cereals, pulses and livestock. Most of this production is for subsistence consumption by the farm household. A general description of this traditional agricultural system is given in Huffnagel (1961), Cossins (1973), Westphal (1975), Getahun (1978b), Makonnen (1978) and Gryseels and Anderson (1983a).
The factors affecting enterprise choice and farmer decision making of an Ethiopian highland smallholder are illustrated in Figure 4.1. The purpose of this schematic model is to illustrate the complexity of the agricultural system from the point of view of the smallholder. The model distinguishes between those factors which can be considered as essentially under the control of the smallholder, and those under which
Figure 4.1.: Main Factors Influencing Enterprise Choice and Productivity of an Ethiopian Smallholder
/'C'JLTURA ' SOCIOLOGICAL ^CONSTRAINTS.
A V A I L A B I L I T Y ^ l O F INPUTS J
TOTAL 6 SEASONAL FARM LABOUR
FOR SMALLHOLDER
FF-FARM " \ WORK ]
C R * U N I T l E 5 y
/ ^ COMMUNALE- ( L—( LABOUR r*~ ' ' ' \ *
^OBLIGATIONS/ N -
(cu>
k>^^>-^ SUBSISTENCE
NEEDS
X / I R E W O O p y
\POP\ 'ULATION J
FUEL f*— JEEDS_J#-
PRODUCTION FROM FARM
/ ^ A O Ë S S T O N _ f c / AND USE OF V — -
* \ COMMUNAL } V GRAZING y
('POST HARVEST} y ^ PRICES J
SUBSISTENCE
~tz
EXPANSION OF LIVESTOCK
MOLDINGS
| DISEASE '
ally beyond control of smolll
l ion of linkog« or influença
Source: Adapted from Gryseels and Anderson (1983a).

63
he has little or no control. It focuses primarily on the factors affecting enterprise choice within a mixed smallholder farm setting and the relationships between the smallholder and the Peasants Association (PA) of which he is a member. The links described in this model are applicable to the farming situation in the Baso and Worena Wereda.
As elsewhere in the Ethiopian highlands, land in this Wereda is allocated by the Executive Committee of the Peasants Association of which the farmer is a member. The size of the individual holding is determined primarily by the size of the smallholders' family, and the total land area and mix of land qualities available to the PA. Plots allocated to a smallholder in one year are not necessarily allocated to him again in subsequent years. Usually the cropland allocated is the same every year, but changes occur frequently in fallow or pasture land which is used for grazing and haymaking. Occasionally some cropland is re-allocated to allow for new PA members or the establishment of a producer cooperative. Most of the pasture land within an association is communal with no restrictions to access for livestock owned by members of the particular PA. The carrying capacity of the communal pastures is continuously exceeded, causing overgrazing and strongly reduced pasture productivity (Jutzi et al, 1987c). In addition, human population pressures are
. gradually .expanding—the~area undar cultivation, thereby shortening the fallow cycle and reducing the„available pasture area. This leads to declining soil fertility and land productivity. The ability of the local farming system to sustain food production for the expanding population will progressively diminish (Gryseels and Anderson, 1983b).
The choice of enterprise combinations by an Ethiopian smallholder is largely determined by the land, labour, capital and management resources he has available, his own individual and household needs and preferences, and a number of exogeneous factors over which he has no direct control such as government policies or market prices.
The allocation of resources by smallholder farmers in the Baso and Worena Wereda is described in the following sections.
4.2. Production Environment and Ecology
4.2.1. Physiography and Soils
The predominant topographical feature of the Baso and Worena Wereda is a dissected stony highland plateau (2,500-3,000 m in altitude) including some depressions with seasonal drainage deficiencies. Some vents and cone remmants occur, developed in pyroclastics (De Pauw, 1987). The soils of the area are developed in alkaline and olivine basaltic parent material which explains the vertic properties as a common feature. According to the most recent soils association map of Ethiopia (De Pauw, 1987; Bruggeman, 1987) the predominant soil units covering 90% of the area are:
Stony dark cracking clays: Vertic Cambisols, Vertic Luvisols and Vertisols, stony phase
Dark cracking clays: Chromic Vertisols, Pellic Vertisols, Vertic Luvisols and Vertic Cambisols
Deep dark cracking clays: Pellic Vertisols and Chromic Vertisols (ponded drainage)

64
In approximately 10% of the area other soils units are found such as:
Undifferentiated very shallow soils with rock out crops: Lithosols, Eutric Regosols (stony phase)
Stony brownish friable clay loams and sandy clay loams developed on volcanic rock: Eutric Nitosols, Chromic Luvisols, Orthic Luvisols (stony phase)
- Dark brown friable clay loams and sandy clay loams developed on pyroclastic deposits: Calcic Chernosems, Luvic Chernosem, Haplic Phaeosems and Luvic Phaeozems
An analysis of the most important physical and chemical properties of these soils indicates that the agronomic potential of the area is relatively high (Jozef Deckers, personal communication). The soils moisture storage capacity is high in the deep soils. Organic matter content in the predominant soil units ranges from 1 to 3%. The soils are slightly acid with Ph ranging from 4.8 to 6.34. Soils on the slopes have a marked deficiency of phosphorus, while in the bottomlands the main constraint to crop cultivation is waterlogging and poor internal drainage of the profilet This necessitates delayed planting and suboptimal use of the climatic growing period. A review of the soil and agronomic factors influencing fodder production in the Ethiopian highlands has been made by Ahmad (1984).
4.2.2. Agro-Ecological Characteristics
Rainfall in the area is bimodal, with short rains (belg) occuring from February to May, and the long rains (meher) from June to September. According to probability calculations of the growing periods (De Pauw, 1987) the first growing period allows for a short maturing crop of 3 months cycle, planted in February/March at the earliest. A second crop can be planted in July, with a 3.5 to 5.5 months growing cycle, depending on the soil moisture storage capacity (texture, profile depth). The growing period characteristics in the Baso and Worena Wereda, estimated on the basis of 17 years of precipitation records collected by the metereological station of the Ministry of Agriculture at Debre Berhan, are presented in Figure 4.2.
Figure 4.2.: Growing Period Characteristics at Debre Berhan
y 'S.
400
300
200
100
Precipitation
Potential Evapotranspiration (PET)
1/2 PET
J M M J S N
Source: Goebel and 0denyo(1984)

65
Data recorded at the ILCfi Debre Berhan station (altitude 2780 m a.s.l.) indicate an average annual rainfall of 963 mm from 1979 to 1984. Almost 72% of this amount fell between July and September (Figure 4.3). During the same period there was an annual average of 97 raindays. Of the six year survey period, only four had sufficient rainfall during February and March to allow farmers to grow a crop during the early "belg" season. During the main rainy season rainfall was very reliable. The coefficient of variation (CV) of total annual rainfall during the study period was only 10%.
Figure 4.3.: Distribution of Rainfall at ILCA Research Station at Debre Berhan (mm per month, 1979-19547
320
280
240
E200-
E 160-
120
so ̂
40 25
55
1 54
1 1 1 \\
month
The Debre Berhan area can be included in the sub-alpine climatic region which is generally cool. Mean daily temperature during the period of 1979 to 1984,was 12.8 C. Temperatures at 0.5 m ranged from an average minimum of 6 C to an average maximum of 20.4 C. The average annual solar radiation was 3,198 hours, with the maximum values registered between November and January. Night frosts occurred frequently from October to January, and there were on average 21 frost nights each year. Temperatures at 0.5 m dropped as low as -8 C. Of particular importance for crop yields was the timing of first frost.

66
Harvesting of crops grown during the main rainy season starts mid-October. This is also the period during which the first light frosts occur. If there is heavy frost, it coincides with the stage during which grain crops mature, thereby damaging the seed and severely reducing yields.
Meteorological records from 1979 to 1984 are summarized in Table 4.1. The table also includes for each year an estimate of the length of both the short and main crop growing period. These estimates were derived from the application of a water balance model which assumed maximum water storage of 50 mm in the topsoil (Henricksen and Durkin, 1985). Although the analysis suggests that the Wereda experiences a mean growing period during the main cropping season of 144 days, in practice the length of this period was truncated by frosts in October, resulting in a crop growth period which could be as short as 90 days.
Table 4.1.: Meteorological Records Debre Berhan (1979-1984)
1979 1980 1981 1982 1983 1984 Mean
Total rainfall (mm) 961 1068 981 1009 897 861 963 N° rain days 72 96 109 106 101 96 97 Mean max t (at .5m) 18.9 19.9 20.0 19.8 20.4 18.8 18.1 Absolute min t (at .5m) -7.0 -7.0 -8.0 -6.0 -5.0 -7.0 N.A. 1/ N° frost nights 16 16 38 13 23 22 21 Date of first frost 13.10 24.10 7.11 19.10 24.10 7.10 N.A. 1/ Estimated length short growing period (days) 51 15 66 48 93 0 45 Estimated length main growing period (days) 168 150 129 135 114 168 144
1/ N.A. = not applicable
Source: Compiled from unpublished data of the ILCA Debre Berhan Station, Showamare (1983, 1984 and 1985), and Anderson et al (1986).
Crop cultivation was also seriously constrained by hailstorms that usually occurred during the month of July, when most crops are planted. This affected germination rates negatively.
Of the study area 29.4% can be considered as pasture land, 51.3% as arable land and 19.3% as not arable upland (Stevan and Giglietti, 1986). Otherwise classified, in general, 29% of the study area is located on seasonally wet bottomland, 47% on slopes and 24% on the upland plateau. About three quarter of the pasture area is located on slopes, and the dominant plant species is Andropon abyssinica. One quarter of the total pasture area is in the seasonally wet bottomlands. The dominant plant species here are todropon distachys and Trifolium spp.
On the arable land of the slopes, cereal and pulse crops are grown (see section 4.4.). Other vegetation is mainly erbaceous and a few bushes such as Rosa abyssinica and Permisetum sphocelatum.

67
On the uplands the vegetation ranges from erbaceous to woody. The most common erbaceous plants are Permi setum sphocelatum, Andropon abyssinica, Medicago polymorpha, Aloe berfiina, Salvia spp., Trifolium pichisemolli and Guizotia scabra.
Some of the common shrubby and bushy species are Hypericum revolutum, Thymus shimperi, Clematis spp., and Lasiocorys stochydiformis. Some scattered trees such as Hagenia abyssinica, Acacia negrii and Cupressus spp. testify that some of the original vegetation was highland forest. Most trees are newly planted of the Eucalyptus spp.
Farmers themselves distinguish among three basic land classes for crop production: productive aredda ("Lern"), less productive aredda ("Lem Ketaf") and unproductive yemeda ("Taff") (Gryseels and Anderson, 1983). Land is included in a particular class according to the natural environment, exposure to frost, soil fertility, and the type of crop grown.
Productive aredda land (around 30% of area cultivated) usually lies close to the homestead on the hillside. It is well drained, comparatively fertile, less exposed to frost and is usually cropped once a year during either the belg or meher seasons. Ash and manure are applied to this land class, and the fallow fraction is minimal. Horse beans, wheat and sometimes barley are grown, and the grain is used as seed for crops on all land classes. Average crop yields are highest on this land class, reflecting the factors mentioned above plus generally more intensive crop management. Grazing is actively restricted on productive aredda plots.
Land in the less productive aredda class (13% of area cultivated) is more exposed to frost and less well drained, with occasional waterlogging problems in the lower parts. Barley, horse beans, field peas, lentils and linseed are grown, again during either the belg or meher seasons.
The yemeda land class (57% of area cultivated) consists of the seasonally flooded bottomland, and is most exposed to frost. It is usually used for cropping only during the belg, when flooding is not a severe problem and frost incidence is lowest. Barley, which is early maturing and relatively water tolerant, is almost the only crop grown on this land class.
4.3. Family Size and Composition
Almost all farmers in the survey sample belonged to the Amhara tribe. Only 12% were Oromo's of origin. All were members of the Christian Orthodox church which has Coptic origins. Of those sample farmers who were already working in the period before the land reform 60% had been tenants, 18% landowners, 17% landowner as well as tenant, and 5% had been landless labourers.
The average age of sample farmer was 47 years, the youngest being 17 and the oldest 90. It is liksly however that these data are inaccurate, in view of the absence of birth records and the dependence on recall. Probably, the average age of sample farmers is somewhat lower

68
than indicated. Around 10% of household heads were female, and 12% of the sample farmers were single.
The average family size of control farmers was 4.6 people per household, consisting of 2 adults and 2.6 children. In terms of Adult Equivalent (AE), the mean household size was 2.97 AE/Farm with a standard deviation of .8. An AE was defined as 1 for each adult over 15 years of age, .5 for each child between 10 and 15 years old and .25 for each child between 6 and 9 years old. In about 40% of the sample households, there was also an additional member of the family (grandchild, grandparents, or other relative) living in. There were slightly more females (52%) than males (48%) in the overall household sample. Overall, there was only very little inter-year variation in average family size or male/female ratio.
Whereas in 1979 only 12% of the sample farmers reported to have some degree of literacy, this percentage increased to 30% in 1984. For most of these farmers, literacy was limited however to the ability to distinguish a few characters of the alphabet, or the reading of a few words. The increase in literacy rates is associated with a national government campaign promoting literacy. Nevertheless, in 1983 only 18% of control farmers sent their children to school, 12% let them participate in elementary literacy classes, while in 70% of families children did not receive a formal type of education. Informal surveys indicated a high degree of child mortality among sample farm families with roughly 20% of children dying before they attained the age of four.
4.3.1. Capital Assets
Farmers have capital assets for use directly or indirectly in agricultural production. These can be categorized as houses and barns, ploughing tools, equipment for harvesting and threshing, grain containers and trees. The mean value of these capital assets was 698 Birr per household.
Like elsewhere in the Ethiopian highlands, settlements in the Debre Berhan area are clustered on hill tops. Usually around 3 to 4 family related households have their living houses adjacent to each other, surrounded by a stone wall. This is due to social and security reasons. Many of the farm plots are located around the home compound. Usually a farmer will have on his compound a dwelling house, a crop granary and a livestock shade. Dwelling houses are built of stones which are in ample supply and collected from the vicinity. The fences around the homestead are also of stone and around 40 to 50 meters long in perimeter.
Grain stores are usually built of wooden walls plastered with mud and grass roofs. Fumegation of stored grain is not practised. Storage wastes due to pests and holes in granaries are reported by farmers to be high but remain as yet unquantified.
Within a fenced homestead livestock shades are common. They are intended to protect animals at night from predators such as hyenas. Animals are not segregated by sex when kept in livestock shades. Unweaned calves are separated from their dams and milking of cows is usually done here.

69
Control farmers had one or two dwelling houses each with an average value of 270 Birr. Just over 51% had one dwelling house, 33% had two and 16% three or more. They usually also had a store, valued at 18 Birr. About 63% of farmers had one, 13% had two or more, but 22% did not have any. Most farmers had a livestock shade (mean value 90 Birr), but 22% did not have one, 67% had one and 11% had two. All farmers had a fence around the homestead, valued on average at 76 Birr. Total capital value of these fixed assets averaged 623 Birr/farm, and farmers reported a mean maintenance cost of 14 Birr per year.
Only 43% of houses were less than 10 years old, and 20% was even more than 20 years old. Only 6% of them had a corrugated metal sheet as a roof, instead of the traditional grass roof.
An ox drawn plough ('maresha'), an ancient ard, is generally used for seedbed preparation. It breaks the soil clod but does not invert the soil. The system of ploughing has been described elsewhere (Gryseels et al, 1984; Goe, 1987). A complete set of maresha consists of a metal plough tip, a yoke, a wooden beam and leather straps. Except for the metal tip which is produced by the blacksmith, the rest of a maresha's parts are mainly home made. A leather whip is used to lead the oxen. Other implements owned by farmers for use in land preparation were shovel, doma, hoe and guie mekeskesha. The latter is used to break soil clods after soil burning (see section 4.4.2). The average value of ploughing tools owned was 25 Birr per farm. Most of the equipment was very old (67% more than 5 years old) and inherited from the parents.
Harvesting is done using a sickle to cut the crop stalks. After the cutting, the produce is transported to the homestead for threshing. The crop stalks are then heaped on a threshing floor, which is usually prepared with stamped earth or cow dung. Animal will be driven around on the crop stalks to separate the grain from the straw.
Farmers will then start winnowing, by tossing the grain into the air to allow the wind to separate the grain from the chaff. During winnowing, a liada (wooden shovel) or mensh (wooden pitchfork) will be used. The average value of harvesting and threshing equipment was 10 Birr per farm.
Once the crop is threshed and winnowed, the grain will be stored in containers made of dried mud mixed with straw and manure. Some of these containers will also be used as a measure to weigh grains. The local names of the containers are debignet, kuna, enkib, gurzigne, enik and included also sacks and metal barrels. The average value of these containers was 40 Birr/farm.
Although historically Debre Berhan was forested, it is now denuded due to long periods of settlement and use of firewood for energy purposes. Trees are owned collectively by the PA. Trees are cut for fuel and building purposes. The Ethiopian Government has an active reforestation programme, encouraging PA's and farmers to reforest. Germination is difficult due to frost and the long dry season. At the ILCA station, only 10% of the seedlings planted grew to maturity (Woldeab Woldemariam, Personal Communication). The main trees found in the area were Eucalyptus spp.
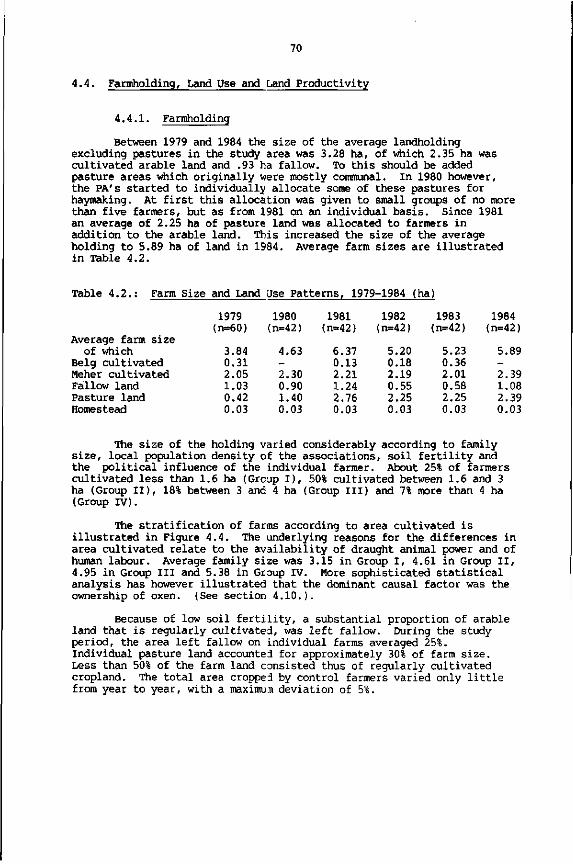
70
4.4. Farmholding, Land Use and Land Productivity
4.4.1. Farmholding
Between 1979 and 1984 the size of the average landholding excluding pastures in the study area was 3.28 ha, of which 2.35 ha was cultivated arable land and .93 ha fallow. To this should be added pasture areas which originally were mostly communal. In 1980 however, the PA's started to individually allocate some of these pastures for haymaking. At first this allocation was given to small groups of no more than five farmers, but as from 1981 on an individual basis. Since 1981 an average of 2.25 ha of pasture land was allocated to farmers in addition to the arable land. This increased the size of the average holding to 5.89 ha of land in 1984. Average farm sizes are illustrated in Table 4.2.
Table 4.2.: Farm Size and Land Use Patterns, 1979-1984 (ha)
Average farm size of which
Belg cultivated Meher cultivated Fallow land Pasture land Homestead
1979 (n=60)
3.84 0.31 2.05 1.03 0.42 0.03
1980 (n=42)
4.63 -2.30 0.90 1.40 0.03
1981 (n-42)
6.37 0.13 2.21 1.24 2.76 0.03
1982 (n-42)
5.20 0.18 2.19 0.55 2.25 0.03
1983 (n-42)
5.23 0.36 2.01 0.58 2.25 0.03
1984 (n-42)
5.89 -2.39 1.08 2.39 0.03
The size of the holding varied considerably according to family size, local population density of the associations, soil fertility and the political influence of the individual farmer. About 25% of farmers cultivated less than 1.6 ha (Group I ) , 50% cultivated between 1.6 and 3 ha (Group II), 18% between 3 and 4 ha (Group III) and 7% more than 4 ha (Group IV).
The stratification of farms according to area cultivated is illustrated in Figure 4.4. The underlying reasons for the differences in area cultivated relate to the availability of draught animal power and of human labour. Average family size was 3.15 in Group I, 4.61 in Group II, 4.95 in Group III and 5.38 in Group IV. More sophisticated statistical analysis has however illustrated that the dominant causal factor was the ownership of oxen. (See section 4.10.).
Because of low soil fertility, a substantial proportion of arable land that is regularly cultivated, was left fallow. During the study period, the area left fallow on individual farms averaged 25%. Individual pasture land accounted for approximately 30% of farm size. Less than 50% of the farm land consisted thus of regularly cultivated cropland. The total area cropped by control farmers varied only little from year to year, with a maximu.Ti deviation of 5%.

71
Figure 4.4.: Frequency Distribution of Area Cultivated by Control Farmers
60
50
if)
§ 40 o
<o 30 en a c V o
20
10-
<1.6 ha 1.6<3 ha 3<4 ha
a rea cu l t i va ted
= >4 ha
In 1980, when pastures were allocated individually for the first time, the smallest holding, including pasture and fallow land, was 0.7 ha while the largest holding was 9.5 ha. Between these extremes, holdings were statistically normally distributed, with the modal size category being 3.5 to 4 ha. In the following year, a similar picture emerged, although the maximum size of holding fell from 9.7 to 7.7 ha. The coefficient of variation (CV) of the size of individual holdings during the study period ranged per each year between 33 and 41%. Holdings at Karafino were somewhat smaller than in the other 3 associations. Farmers from Kormargfia had the largest average farm size, because this association had much more pasture land. The mean area cultivated annually was 2.2 ha in Kormargfia, 2.3 ha in Karafino, 2.4 ha in Faji/Bokafia and 2.8 ha in Milki.
Farm holdings were fragmented in three or four parcels, subdivided in on average 11 plots (ranging up to 20). Fragmentation arises from the PA strategy of allocating different land classes among its member farmers. The average plot size was 2,100 m . Plots were on average 525 meters from the homestead with single plots up to 3,500 m distant.

72
4.4.2. Land Productivity for Crop Production
Farmers grow crops during both the 'belg' and 'meher' seasons. The major crops that are grown barley (Hordeum vulgare), wheat (Triticum spp.), horse beans (Vicia faba), field peas (Pisum sativum), lentils (Lens esculenta) and linseed (Linum usitatissimum). These are all crops suitable for this high altitude environment. Different species of barley (white, black and mixed), and wheat (emer, white and black) are grown, and farmers kept several landraces of each of the major cereals which they used under specific production conditions. For barley for example some of the local landraces were Senefe Gebes, Houge, Kesali, Ferese Goma, Galla Gebes, Workeye and Ferke Gebes.
When the 'belg' rainfall was considered reliable and sufficient, most farmers planted a crop during this period of early rains between February and May. During the study period, a belg crop occurred four years out of six. On average, only about 2,700 m2 of land per farmer was sown. Because of the irregularity of rainfall, farmers will not risk to loose seed, and many farmers also lack timely access to sufficient draught power. There was indeed a significant impact of ownership of oxen on the size of 'belg' area cultivated by control farmers (P<.05). It appears also that farmers set themselves a "target area" of land that will be cultivated annually, and that the greater the 'belg' area, the less is planted during the meher season. This may be associated with a lack of market incentives for the farmer to produce more than the subsistence needs of his family.
Almost all land (between 84 and 92%) of 'belg' plots was planted with barley. Some farmers also grew some wheat or horse beans. The proportion of farmers growing a belg crop, the area sown and the dominant crop planted are presented in Table 4.3.
Table 4.3. Proportion of Farmers Growing 'Belg' Crops and Size of'Belg' Areas Sown
Mean belg % of farmers area (m2)l/ growing
Mean area Max area sown (m2)2/ sown (m2)
barley
1979 1980 1981 1982 1983 1984
3183 n.a.3/ 1382 2249 3994 n.a.3/
73 n.a.
52 76 90
n.a.
4341 n.a. 2638 2952 4414 n.a.
8139 n.a. 5066 5143
10772 n.a.
90 n.a.
84 85 92
n.a.
1/ mean area of all farmers 1/ mean area of farmers growing belg crop 1/ N.A. = not applicable as no 'belg' crop was grown during that year.
The highest proportion of farmers growing a belg crop and the largest mean area sown was found in 1983. During that year there was an unusually long 'Belg' growing period of 93 days.

73
All farmers grow crops during the mener season. The dominant crop is again barley, but wheat and horse beans are important also. Mainly bread wheat is grown and occasionally durum wheat. Other crops grown are field peas, lentils, linseed, temenze (a type of mixed barley) and oats. The share of barley in the cropping pattern declined rapidly from 73% in 1979 to 46% in 1984. This corresponded with the rapid increase in the area planted with wheat (because of high gross margins), the emergence of oats (Avena sativa) as a crop, and the growing importance of linseed. The cropping pattern of control farmers from 1979 to 1984 is presented in Table 4.4.
Table 4.4.: Annual Cropping Pattern of Control Farms (1979-1984) 1/
Barley Wheat Horse beans Field peas Linseed Lentils Temenze Oats
1979
72.9 5.1
12.2 3.8 4.1 1.9 --
1980
70.6 8.5
12.4 5.6 1.3 1.2
.4 -
1981
62.9 9.7
14.8 5.9 3.2 1.6 0.8 1.1
1982
57.7 10.0 14.8 5.6 7.3 1.4 0.9 2.3
1983
55.9 10.4 12.0 3.8 7.8 1.3 1.8 7.0
1984
45.7 12.1 11.0 2.6
11.0 1.0 1.2
15.4
100.0 100.0 100.0 100.0 100.0 100.0
1/ In % of cultivated land, combining both belg and meher seasons.
Oats (Avena sativa) were first grown at ILCA's research station at Debre Berhan for experimental purposes, and were also introduced into the cropping pattern of on-station ILCA research farmers. These research farmers grew these oats mainly to be used as green feed or hay for ILCA's dairy cows. Gradually, farmers outside the station started adoption. Two control farmers (5%) were growing oats in 1981, 7 (17%) in 1982, 17 (40%) in 1983 and 33 (79%) in 1984. The average area sown per farmer was 4,620 m2 in 1984.
The reasons for this rapid spread of oats were discussed in Jutzi and Gryseels (1984a and b ) , but can be summarized as better resistance to aphids, better tolerance to frost and waterlogging, and less labour intensive land preparation when compared to barley. The oat grains are used for human consumption.
Linseed has also rapidly gained importance, due to its drought tolerance characteristics, and its high gross margin.
Average annual crop yields are presented in Table 4.5. There was no significant difference between yields obtained during the belg and meher seasons. In normal years all crops except lentils and linseed yielded between 600 and 800 kg/ha. Lentils and linseed are low yielding crops that produced on average 200 kg/ha. There was a high variation in crop yields between farmers both for cereals (CV = 46%) and pulses (CV = 70%), and there were significant differences in crop yields between Peasants Associations. The differences in productivity between

1979
720 400 335 350 70
840 850
1270 1000 360 -
200
1980
_ ---
870 960
1000 640 240 -
175
1981
500 ---
560
'Meher'
575 550 640 520 80
500 100
1982
710 580 --
560
775 670 520 530 160 900 300
1983
705 500 -
445 470
330 590 530 210 240 500 200
1984
_ ---
1000 610 770 800 170 805 355
Mean
660 495
n.a. n.a.
415
732 705 788 617 208 676 222
74
individual farmers within a PA could be attributed to differences in resources available, ecological environment, management skills and labour inputs (Gryseels and Durkin, 1985). Between associations, crop yields varied mainly because of their different ecological endowments and characteristics.
Table 4.5.: Average Gross Crop Yields during Belg and Meher Seasons (1979-1954 kg7H¥)
'Belg'
Barley Wheat Horse beans Field peas Lentils
Barley Wheat Horse beans Field peas Lentils Oats Linseed
Using the same data, Henricksen and Durkin (1985) showed that there was a direct correlation between crop yields and length of growing period. This is illustrated in Figure 4.5. The importance of this finding is that crop yields could increase considerably if ways and means can be found to extend the growing season (for example through strategic irrigation inputs), or by using crop varieties that have a shorter maturity period.
The seed rates averaged 155 kg/ha for barley, 153 kg/ha for wheat, 240 kg/ha for horse beans, 181 kg/ha for field peas, 40 kg/ha for linseed and 73 kg/ha for lentils. These seed rates are very high compared to recommended rates by the Institute of Agricultural Research (IAR, 1979). As a result, net crop yields (after deducting the seed input) were substantially lower than gross yields (Table 4.6.). Horse beans were the highest yielder, and there was no significant difference between average yields of barley, oats and wheat.
Seed rates did not differ significantly across PAs, but differed among individual farmers within a PA and were strongly influenced by the year of cultivation. The coefficient of variation of seed use on a per ha basis was 34% for cereal seed and 62% for pulse seed. These high seed rates can be explained by the nesd to compensate for losses caused by birds and rats, the stony nature of the fields, poor viability of seed, hailstorms at time of germination and the inefficiency of broadcasting seeds. Stone cover of many plots exceeds 60% (Goe, 1987) while substantial savings of seed could probably be made by row planting rather than broadcasting (Schep and Jutzi, 1985). High seed rates are also associated with a farmer strategy to reduce weed infestation (Ann Stroud, personal communication).

75
Figure 4.5.: Effect of Length of Growing Period on Crop Yields in Baso and Worena Wereda
Vicio faba Barley
* O
Crop yield (kg/ha)
Field peas Lenti Is * A
1250
1000
750
500
250
-(1983)
*
O 1 *
(1931)
*
O *
, A.
(1S82)
* O
*
A
1
(1980)
*
O
*
A
(1984)
O
*
A
*
(1979)
*
O
A
i
130 140 150 160 170 180 190
Length of growing period (days)
200
Source: Adapted from Henricksen and Durkin (1985)
Table 4.6.: Average Net Crop Yields (1979-1984, kg/ha) 1/
1979 1980 1981 1982 1983 1984
Barley Wheat Horse beans Field peas Lentils Linseed Oats
Mean
675 670 975 780 240 155 -
720 800 755 460 175 135 -
425 400 730 350 40 60
420
620 530 630 355 90
265 780
175 455 465 50
165 160 420
855 480 540 555 95
310 725
578 556 682 425 134 181 586
1/ Meher season only

76
Although crop yields variad between PA's, there was no uniform pattern in differential productivities. Farmers from Milki had the highest yields of cereals and pulses four years out of six, but the lowest during the other two years. Karafino had the opposite result, with the best yields during two out of six years, but the lowest during the other four years. The yields of Karafino may indicate comparably good soil fertility levels but high exposure to frost. Giglietti and Stevan (1986) have reported on the agro-ecological conditions of the four PA's and listed the most important ecological parameters affecting crop productivity. The parameters with positive effect on crop production were western exposure, moderate gradient, drainage, soil structure and depth of soil profile. Those parameters with negative effect on crop production were erosion, south eastern exposure, steep gradient, waterlogging, stoniness, structureless soil and frost liability.
Weed infestation was a serious problem, particularly by Cyperus and Songana grass.
Many farmers also reported crop damage or complete loss due to insect attacks and natural hazards such as frost and hail. On average 30% of the farmers reported insect attacks on their crops each year. Aphids have been identified as a major cause of damage to barley and wheat.
Crop pests and diseases occur regularly, especially on horse beans, barley and wheat. The main pests affecting horse beans are chocolate spot (Botrytis spp.), rust (Puccinia spp.) and worms. Wheat is mainly affected by rusts (Puccina spp.), loose smut (Ustilago tritici), and leaf blatch (Septoria tritici).
Soil fertility of cropland is maintained through the rotation of cereal crops with pulses, the incorporation of fallow periods in the rotational cycle, the occasional use of chemical or natural fertilizers, and soil burning or guie. On the slopes the usual crop rotation is:
Year 1 Barley Year 2 Barley, wheat or oats Year 3 Pulse (horse beans or field peas) Year 4-12 Fallow
The introduction of a fallow period in the cropping cycle allows the soil to recover its fertility by natural means. Most of the longer term fallows were located on the communal land and used for grazing.
Depending on the type of cropland, fallow may last up to 8 years on Aredda non-productive land. On the Yemeda land, the fallow period may last up to 20 years, and crop rotation is somewhat different. It often takes the following form:
Year 1 Barley Year 2 Barley Year 3-20 Fallow
Yemeda land is highly exposed to frost and flooding and therefore considered less suitable for pulse crops. Soil burning or guie (see following sections) is practised particularly on this yemeda land.

77
Fanners occasionally use surplus manure and ashes on the Aredda productive land near the homestead. Grains produced from this land will usually be used as seed for the following crop. Only a small fraction of the manure produced is used as a fertilizer on the land. Host is used as fuel in the household.
The use of mineral fertilizers in Ethiopia was first evaluated through nationwide trials conducted in 1966 by the Freedom from Hunger Campaign Fertilizer Programme (Ministry of Agriculture, 1968). The trials revealed that the major grain crops responded well to the application of nitrogen and phosphorus in most of the highland areas. Urea and diammonium phosphate (DAP 18-46-00) were recommended at a rate of 50 kg/ha and 100 kg/ha for wheat and barley respectively.
Mineral fertilizer is distributed in Ethiopia through the Peasants Associations. Short term credit of maximum one cropping season for the purchase of fertilizers is available. If a farmer does not repay the loan, the PA as a whole will be denied fertilizer during the following year until the loan is settled. This situation can continue for many years.
Around Debre Berhan, only DAP has been available. Farmers in the Wereda have become familiar with the use of mineral fertilizer through the efforts of the extension agency of the local branch of the Ministry of Agriculture. Although only 2% of the farmers interviewed for the Tegulat and Bulga baseline survey (Telahun Makonnen, 1978) reported to have used mineral fertilizers during the 5 years preceding the survey, the results of subsequent field research indicated a much higher frequency of mineral fertilizer use among farmers. The proportion of farmers using mineral fertilizers and the average quantities used per farmer are given in Table 4.7. The table also includes an estimate of the proportion of control farmers using 'guie' (See next page).
Table 4.7.: Proportion of Farmers Using Mineral Fertilizer and Average Quantity Used Per Firmer (1979-1984)
% of farmers using mineral fertilizer
1979 68 1980 76 1981 69 1982 40 1983 76 1984 14
The proportion of farmers using mineral fertilizers declined annually. Various factors have contributed to this decline such as the high nominal cost of fertilizer, low fertilizer responses, low cost/benefit ratios, the risk avsrsion strategy of farmers, and low output prices. Fertilizer response of barley and benefit cost ratios are reported in Table 4.8. In view of the low amount of fertilizer used during that year, 1984 was excluded from the table. A value/cost ratio
av. qt. (kg/farm;
71 70 52 47 45 43
used % of farmers using 'guie'
n.a. 54 64 59 10 52

127 742
52
1058 897
18
767 584
31
884 734
20
435 259
68
78
(VCR) of greater than 100 indicates that the return from the application of fertilizer was greater than its cost. A VCR of less than 200 is generally considered as being too low for farmer conditions, and will discourage fertilizer use. Only during 1979 was the benefit of fertilizer use substantially higher than the cost of its application. During three out of five years the additional return was far below fertilizer cost.
Table 4.8.: Fertilizer Response of Barley and VCRs (1979-1983)
1979 1980 1981 1982 1983
Barley yield with DAP Barley yield no fertilizer % increase
Value/cost ratio 1/ 241 26 43 102 55
1/ Calculated as ratio of extra return due to fertilizer use to the cost of fertilizer application. Output prices used were free market prices at Debre Berhan market.
Almost all fertilizer was used on land sown to barley and wheat. The rates of application varied between 50 and 75 kg/ha. The total use of fertilizer by control farmers declined from 2,800 kg in 1979 to 1,400 kg in 1983, and to only 250 kg in 1984.
The cost of fertilizer during the study period was as in Table 4.9. The price is determined annually by the Ethiopian Government, through the Ministry of Agriculture. The price increased sharply from .65 Birr to 1.16 Birr per Kg during 1981, and was gradually reduced to .84 Birr/Kg in 1984.
Table 4.9.: Cost of Mineral Fertilizer at Debre Berhan (1979-1984) 1/
Price (BirrAg)
1979 0.55 1980 0.85 1981 1.16 1982 0.89 1983 0.81 1984 0.84
1/ The only fertilizer available was DAP.
Most farmers apply on one or two parcels of land a traditional soil management practice known as soil burning or "guie". Except during 1983, more than 50% of farmers applied 'guie' on at least one plot (Table 4.7). During 1983, the number of farmers using guie dropped substantially because of unusually good 'belg' growing conditions. This practice is a traditional form of fertilization to improve soil

79
properties and nutrient availability. Various authors (Tesfaye Tessema and Dagnatchew Yirgou, 1973; Mesfin Abebe, 1981; and Roorda, 1984) have studied guie practices and their effects on land productivity. The practice is as follows:
After a plot has been fallow for some years (up to 15 years after a previous guie) the fields are ploughed at the beginning of the dry season, during October-November. The topsoil is then left to dry until January. Just before the start of the belg short rainy season, i.e. January/February, the fields are ploughed again up to 10 times in cris-cross directions to dislodge the sod. The remaining aggregates are crushed and the loose topsoil and surface vegetation mounded in heaps with a wooden spade. The number of heaps ranges from 850 to 1,639, with a mean of 1,230 heaps per ha (Mesfin Abebe, 1981). The mounds are spaced at 2 to 3 m intervals over the plots. Then cow dung is inserted into one side of the mound towards the centre, ignited and left burning for 3 to 8 days. In June, before the onset of the main rains, the burnt soil is spread over the field and ploughed again. Although few authors have studied the particular effects on crop yields, it is generally believed that soilburning results in high yields of barley (up to 30 quintals per ha) in the first year of cultivation, but they are drastically reduced in the second year, while in the third year the land is often no longer cropped and left fallow for up to 15 years (Roorda, 1984; Tessema and Yirgou, 1973).
The positive effect on crop yields of guie appears to be the instant release of nutrients such as phosphorus, nitrogen, potassium, calcium and magnesium. The physical properties in the soil are also improved through changes in soil structure which in turn improves drainage aeration and water percolation (Roorda, 1984). Soil burning also sterilizes the microbial population in the topsoil and destroys weed seeds, thereby helping weed control.
Its disadvantages are the loss of organic matter and dehydration of lattic clays, which leads to changes in clay minerology. Guie is also very labour intensive. Surveys results indicate an average labour input of almost three times that of non-guie plots. Farmers therefore applied guie on only a few plots.
Although soil burning causes high crop yields in the short term, long fallows are necessary afterwards (on average 13 years in the survey) to allow the soil to restore the organic matter lost in the process. The Ethiopian Government is actively discouraging the practises and the user can be fined 30 Birr. In practice very few fines have actually been levied.
Available data also indicate a substantial impact of planting dates on crop yields. The highest yields have been observed when crops were planted during week 25 and 26 for barley and field peas and week 27 for wheat. This is because the earlier planting can take place, the longer the growing period. The affect of planting date on the yield of barley is presented in Table 4.10. The optimal date ranges from week 24 to week 26, afterwards yield levels drop substantially.

80
Table 4.10.: Effect of Planting Date on Barley Yields
Planting week
19 20 21 22 23 24 25 26 27 28
1979
695 925 941
1033 914
1121 1224 704 781 792
Barley yield (Kg/ha) 19ÔÔ
_ -
473 609 671
1038 1042 1036 816 701
1981
_ -
219 363 484 532 853
1120 928 431
With respect to the harvesting date, the general indication is that the earlier the harvest can take place, the higher the grain yield. The risk of frost incidence and resulting risk of crop failure increases as from mid October.
4.4.3. Land Productivity for Fodder Production
The major source of animal feed in the Ethiopian highlands is from crop by-products (Jutzi et al, 1987c). At Debre Berhan, there is proportionally much more pasture land than elsewhere, and a greater percentage of feed intake is from grazing.
The most important crop by-product is the straw separated from the grain after threshing. The straw is used as a supplementary feed for livestock, mainly for oxen befors and after they have worked, and cows in milk. Not all straw is equally valuable: cereal straw has a much higher protein and energy content than pulse straw. Only cereal straws have a commercial value. Yield levels of grain and straw can be relatively independent. This degree of indapendence is presumably determined by the stage of plant development at which poor growing conditions strike. If frost or an insect attack occurs, or if there is an early end of rainfall then both grain yield and straw yields are reduced. If these events happen at flowering or setting stage then only grain yield will be affected. Average straw yields are given in Table 4.11.
Table 4.11.: Average Annual Straw Yields (1979-1984 kg/ha)
Barley Wheat Oats Horse beans Field peas Lentils Linseed
1979
1000 1150
-1500 1225 450 460
1980
1125 1315
-1370 900 400 240
1981
860 870 800
1450 100 150 190
1982
1150 925
1250 775 150 290 510
1983
580 910 900 565 340 285 370
1984
1285 920
1160 815
1505 325 590

81
The grain/straw ratio is on average between 0.65 and 0.72. This is illustrated in Table 4.12. Straw yields are almost always higher than grain yields. Lentils and linseed produce proportionally the highest amount of straw, while straw and grain yields of horse beans are almost equal. The grain/straw ratio was lowest in 1983, and highest in 1984.
Table 4.12.: Grain/Straw Ratio Estimates (1979-1984)
Barley Wheat Oats Horse beans Field peas Lentils Linseed
1979
0.84 0.74 -0.85 0.82 0.80 0.43
1980
0.78 0.73 -0.73 0.60 0.60 0.73
1981
0.57 0.63 0.53 0.66 0.53 0.53 0.53
1982
0.67 0.72 0.72 1.10 0.55 0.55 0.59
1983
0.57 0.65 0.55 0.94 0.62 0.84 0.54
1984
0.78 0.65 0.69 0.94 0.53 0.52 0.60
Mean
0.72 0.69 0.65 0.87 0.69 0.64 0.57
Straw output per year averaged between 1,200 kg (in 1983 which was a very poor agricultural year) to 2,350 kg in 1984. Between 70 and 85% of straw produced is from cereal crops. Working oxen and cows in milk are given daily rations of straw, which is usually a mixture of different kinds. Some pulse straw (horse beans, lentils, field peas) will be mixed within the cereal straw. Generally, pulse straw alone is not fed to livestock.
Straw is fed in addition to hay, produced from the individual and communal pastures. Surveys by ILCA (Jutzi et al, 1987c) have indicated that the average hay production from pasture areas was 600 kg dry matter/ha, while the DM equivalent of pasture production grazed fresh by animals was 2,500 kg/ha. Hay pastures are heavily overgrazed which has a substantial effect on yield. Jutzi et al (Ibid) have shown that too frequent grass offtake leads to a reduction in DM yield of 50%. Yields of heavily grazed grasslands therefore do probably not exceed 1,500 DM/ha. The quality of hay, straw and intake from natural grazing that was fed to livestock on smallholder farms in the Baso and Worena Wereda is not significantly different as indicated in Table 4.13.
Table 4.13.: Worena Wereda
Dry matter (DM) Digestible dry matter (DDM) Crude protein (CP) Gross energy (MJAg DM)
Hay
34 57
6.6 18.09
Straw
84 54
5.11 17.8
Grass
90 56
6.25 19.18
Source: Goe (1987)
Approximately 40% of feed intake of livestock was from cereal straw, while 60% was supplied by roughage from native pasture and browse grazing. Control farmers harvested hay from their individually allocated pasture areas. Each farmer harvested approximately 4050 m of hay, which

82
yielded on average 1135 kg DM of hay per farm. This corresponded to a mean yield of 2.8 Tonnes/DM/ha.
As human population pressures in the Wereda gradually expand the area cultivated with crops, fallow cycles are shortened and the available pasture areas reduced. In the longer term, such pressures lead to declining soil fertility and land productivity, and an increasing dependence of livestock upon cereal crop residues for feed supply. A declining soil fertility will also cause a reduction of the production of crop residues however, and increasing the demands on available feed supplies. This would negatively affect animal nutrition.
4.5. Livestock Holdings, Management and Productivity
4.5.1. Background
Almost all farmers, except divorced or widowed women, or young men, own livestock and a typical herd contains cattle, sheep, equines and poultry. Livestock are privately owned and there are mechanisms to transfer the ownership of animals from parents to children even before the death of the parents. Boys are given sheep while they are still young herders, so that they will ultimately have a herd of their own at the time of marriage. The families of both the bride and groom may give animals as a wedding present to the new household.
In terms of monetary value or contribution to agricultural production, cattle are the most important species. Their prime role is to supply draught power for crop cultivation, and manure which is mostly dried and used as household fuel. Debre Berhan cattle are of the highland/shorthorn zebu type (Alberro and Hailemariam, 1982a and b ) . There is substantial intercrossing. This is probably due to the fact that Baso and Worena Wereda is a zone through which many animals from the Debre Sina area pass on their way to the market of Addis Ababa.
Sheep are of the "Menz" type, which is an indigenous breed. They are numerically the most important species in the farm herd. Sheep, and occasionally goats, are kept mainly as a secondary investment and a source of cash in times of need. They are also the dominant source of meat, and supply manure for fuel.
Donkeys are of local breeds and widely used as pack animals. Horses are used for human transport. Poultry are scavengers, and kept for egg production, home consumption and as a source of cash. Beekeeping is not practised in the area, because of high altitude and low temperatures.
4.5.2. Livestock Holdings
Average livestock holdings between 1979-1984 and the equivalent animal units are given in Table 4.14. The overall average holding consisted of 1.23 oxen, 1.50 cows, 1.74 young heifers or young bulls, 0.6 mature bulls, 1.11 calves, 4.6 young sheep, 6.39 adult sheep, 0.14 goats, 0.45 young donkeys, 1.16 adult donkeys, 1.46 horses or mules, and 2.72 poultry. Statistically, the distribution of livestock holdings across holdings was normal.

83
Grouped by species the mean farm holding consisted of 6.18 cattle, 11.16 small ruminants, 2.83 equines and 2.72 poultry. Livestock holdings in the Debre Berhan area are larger than reported elsewhere (Ministry of Agriculture, 1977, Ardu, 1978, Mukassa-Mugerwa, 1981). This can be explained by the much larger feed resources that are available from pastures and fallow land, as crop production is problematic because of the incidence of frost and other ecological factors. Because of the high altitude location of the Debre Berhan area, animal diseases except liverfluke are not a major problem.
The productivity of grain crops has a substantial effect on the size of livestock holdings. After a poor agricultural year (such as for example 1983), farmers will sell their livestock to generate cash for the purchase of foodgrains. Small ruminants sold were generally young. This confirms the findings of Galal et al (1979) who, on the basis of a survey that covered 13 markets in the Ethiopian highlands, estimated that 82% of sheep marketed were milk tooth lambs. After a good harvest, farmers will purchase additional animals. The dynamics of the close interaction between the productivity of crops and the size of livestock enterprises is well illustrated in Figure 4.6.
Figure 4.6.: Crop Yield and Holding of Small Ruminants (1979-1985)
120Û1
1000
O -C \ O'
J *
T>
u a n
+>> a> c
800
600
400
200
barley yield
number of small ruminants

84
Crops are harvested at the end of the year, and as data are compiled on a per annum basis, there is a lag effect of one year in reflecting changes in the size of the small ruminant holding. Data collection started in 1978 and followed a year during which there was a general crop failure in the region due to drought. Farmers sold a substantial part of their stock, which were therefore at a low level when this study started. Livestock holdings gradually increased from 1979 to 1981, then remained relatively stable and declined sharply after 1983. Poorer farmers, which have a relatively larger share of small ruminants, will be first to sell stock, particularly young sheep. During this initial crisis period, more wealthy farmers may still buy stock to take advantage of declining prices, provided they have sufficient feed available.
Table 4.14.: Mean Livestock Holdings of Control Farmers (No. of Animals/Farm, 1979-1984)
1979 1980 1981 1982 1983 1984 (n=60) (n=42) (n=42) (n=43) (n-42) (n=42) Mean
Oxen Cows Heifers/young bulls Bulls Calves
Total cattle:
Young sheep Adult sheep Goats
Total small ruminants:
Young donkeys Adult donkeys Horses/mules
Total equines:
Poultry
For the farmer, the main objective of the cattle enterprise is to rear draught oxen. Almost all oxen are reared on the farm. Support stock is kept to timely generate replacements. Oxen constitute only 20% of the cattle herd, and for each ox there are four to five support cattle.
It is to be noted that there were more heifers than young bulls (ratio 1-1.2), more ewes than rams (ratio 1-7.8), and more female than male donkeys (ratio 1-1.7). Horses were mostly mares (50%), colts (31%) or stallions (19%). Mules were rare. Goats also were of minor importance.
1.18 1.33 1.30 0.56 0.88
5.25
2.55 4.80 0.12
7.47
0.35 1.07 1.04
2.46
2.38
1.02 1.43 1.62 0.74 0.98
5.79
4.57 5.21 0.12
9.90
0.50 1.09 1.21
2.80
1.90
0.83 1.52 1.83 0.64 0.83
5.65
5.05 8.73 0.21
13.99
0.50 1.02 1.19
2.71
2.26
1.19 1.70 2.05 0.49 1.16
6.59
5.16 6.81 0.12
12.09
0.56 1.21 1.19
2.96
3.00
1.71 1.67 1.45 0.67 1.71
7.21
5.40 7.38 0.26
13.04
0.69 1.31 1.17
3.17
3.50
1.40 1.48 2.16 0.52 1.09
6.65
4.86 5.38 -
10.24
0.66 1.26 1.00
2.92
3.29
1.23 1.50 1.74 0.60 1.11
6.18
4.60 6.39 0.17
11.16
0.54 1.16 1.13
2.83
2.72

85
Most farmers had at least one ox, one cow, a heifer or young bull, a few sheep, a donkey and some poultry. About 20% of farmers did not have oxen, 28% had one, and only 52% had two or more. About 80% of farmers had at least one cow, and almost all farmers had sheep and poultry. Roughly 66% of farmers had more than five sheep and three quarters of farmers had a donkey. Only 2% of sample farms had no animals. These were very poor farmers, usually divorced or widowed women. The distribution of livestock holdings is illustrated in Table 4.15. There was only little change in the distribution of livestock holdings in between years.
Table 4.15.: Distribution of Livestock Holdings (Mean 1979-1984)
% of Farmers
No ox 20 One ox 28 Two or more oxen 52 One or more cows 80 One or more bulls 48 One or more sheep 89 Five to twenty sheep 66 More than twenty sheep 14 One or more donkeys 77 One or more horses 54 One or more poultry 98 No animals 2
In order to allow for comparisons, and given the similarity of the feed base, it is useful to convert animals of different sizes and species into common reference units. For tropical animal production, the Tropical Livestock Unit (TLU), or "Unité de bétail tropical" is commonly taken to be an animal of 250 kg liveweight (Jahnke, 1982). However, such a conversion factor does not take into account that feed requirements are more directly determined by the metabolic weight rather than the liveweight.
The metabolic weight of an animal can be calculated as MW = LW ' whereby MW = metabolic weight and LW = Liveweight (Maynard et al, 1979).
The conversion procedures used for Debre Berhan livestock holdings are given in Table 4.16.
Table 4.16.: Conversion Procedures for Metabolic Weight and TLU Holding
Livestock type
Oxen/bulls Cows Heifers Immature males Calves Sheep Goats Horses/mules Donkeys
LW (kg)
275 200 125 150 50 22 22
200 90
TT7 0-75 LW
67.53 53.18 37.38 42.86 18.80 10.16 10.16 53.18 29.22
TLU
1.1 0.80 0.50 0.60 0.20 0.09 0.09 0.80 0.36

86
Using the procedures of Table 4.16., the average livestock holding per farm during the study period was estimated at 6.92 TLU. This figure ranged from 5.90 in 1979 to 7.92 in 1983. Both 1977 and 1978 were extremely bad crop years forcing many farmers to sell livestock. The figure of 5.90 of 1979 was thus a below average inventory value. Since 1979, the size of the herd has been gradually building up, reaching the peak of 7.92 TLU/farm early 1983. The growth rate of the herd averaged 8% per year during this period. During 1983, crop yields failed due to drought and frost. Many farmers sold livestock, especially sheep, and the average holding declined to 7.11 TLU in 1984.
Total metabolic weight ranged from 429.63 kg per farm in 1979 to 592.97 kg in 1983, declining to 528.85 in 1984. The mean metabolic weight during the study period was 518 kg/farm.
The average herd and flock structure was as in Table 4.17. Oxen constituted 20% of the herd, cows 24%, and bulls 10%. Flocks consisted of 44% ewes, 36% lambs and only 5% rams.
Table 4.17.: Herd and Flock Structure
Herd Composition (%)
Oxen Bulls Cows Immatures Calves
20 10 24 28 18
Flock Composition (%)
Ewes Rams Lambs Young stock Castrated male
44 5 36 12 3
Immature animals made up 46% of the cattle herd and 48% of the flock. The low fraction of oxen in the cattle herd indicates that the area is likely to be self sufficient in oxen. For each ox, there are four backup stock. As a rule of thumb, a region where the proportion of oxen in the cattle herd is higher than 30%, can be considered a deficit area (Sandford, personal communication). Such an area needs to import oxen to satisfy its needs for animal power.
The average value of the livestock herd was 1,614 Birr per farm. While 2% of the farmers did not own any livestock, the maximum value owned by any farmer was 4,170 Birr.
There was a strong positive correlation between cultivated area and livestock holding. This was already reported by Gryseels and Assamenew (1985). When livestock holdings were converted into livestock weights for each group of farms, average liveweight per farm was 855 kg in Group I, 1,677 kg in Group II, 1,900 kg in Group III and 2,645 kg in Group IV (Figure 4.7.).

87
Figure 4.7.: Liyeweight of Livestock Holding by Farmer and Area Cultivated
Ó2ÜÜ-
2800-
2400-
E o 2000 -
. y ' i 6 o o -
— 1200-
800-
400-
o-
855
\ \ V ^
$ ^
1677
^ ^ \ v \ V \ \ s
N N ^ X N
SS^
1900
V S V
^
1
2645
K\\W
\\^NX
^ \$S^
S> ^
<1.6 ha 1.6<3 ha 3<4 ha area cultivated
= >4 ha
This stratification was uniform across the different livestock holdings. The number of cattle ranged from 4.3 in Group I to 10.7 in Group IV, small ruminants from 6.1 to 18.3, and equines from 1.8 to 4.7 per farm (Figure 4.8.).
In other words, the higher the number of animals owned, the larger the area cultivated, and vice versa.
The reason for these correlations are twofold. The more cattle a farmer owns, the more draught power he has at his disposal, enabling him to cultivate more land. The extra land cultivated in turn produces more crop by-products such as straws, which are the major source of animal feed. This extra feed allows more animals to be kept. The impact of area cultivated on the production of cereal straws is illustrated in Figure 4.9. Farmers of Group I produce per year on average 768 kg dry matter of cereal straw, Group II 1,385 kg, 2,075 kg in Group III and 2,090 kg in Group IV.

88
Figure 4.8.: Livestock Holding by Farmer and Area Cultivated
k \ | <1.6 no
£x3 1.6<3 ho
Y/\ 3<4 ho
NSSy =>4 ho
smoll ruminants
Source: Gryseels and Assamenew (1985)
Figure 4.9.: Production of Cereal Straw by Farmer and Area Cultivated
2100
.6<3 he 3<4 he
area cultivated

89
4.5.3. Livestock Husbandry
Livestock of mixed species are herded and grazed during most of the day. An analysis of grazing records indicates no significant difference between grazing time of different livestock species, except oxen during work. In general, livestock are kept in a "kraal" next ot the homestead at night, and driven out to the pastures and stubble at between 8 and 9 a.m. They are herded by young boys and girls of age between 5 and 12. Animals are kept grazing until just before sunset, or about 8 to 10 hours per day.
After the crop harvest, cattle and equines are needed for threshing and grazing time for these species reduces accordingly. During this periods, these animals will graze only 4 to 6 hours per day.
There is no significant difference in the time the animals graze on individually allocated grazing land, and on the communal grazing land. On average animals graze 49% of the time on the private grazing land, 49% on the communal land, and 2% of stubble grazing of individual cropland.
There are strong seasonal patterns in the use of grazing land. From mid-February till early June most of the grazing is on communal land, while from mid-July till early December the grazing is on the individually allocated land. This can be attributed to the type of land. Communal grazing land is usually located in the bottomland which is seasonally flooded during the main rainy season. The animals even move to the hillsides, which are mostly individually allocated.
Hay is made from late September to November from the individual pasture land. Because of labour shortages, hay cutting is frequently done late, resulting in rapidly declining hay quality.
Stubble grazing occurs after the harvest from the end of October till January, and some after the belg harvest in June.
Working oxen and cows in milk get supplementary feeding at night. The main feed types are barley and wheat straw, grass hay, green grass fodder, salt licks (Amole salt), and "atela" (residue from beer brewing). They are also fed grass from weedings during September, and if there is a belg crop, in May. Salt is given during the rainy season in July and August.
Working oxen get the highest amount of hay and straw. The difference with the amount given to lactating cows is statistically significant (P<0.01). Hay is mainly given during the dry season. Straw is fed mostly during the rainy season of belg and meher. Very little straw is given during the dry season because farmers think animals will require too much water then. Livestock are however allowed to eat straw from the threshing area during the threshing period.
Salt licks or "amole" salt is only given occasionally. Whenever a local beer brew ("Telia") is made, the residue known as "atella" is given to working oxen, cows in milk and calves.
Farmers are critically short of feed at the end of the dry season and the beginning of the rainy season. Hay supplies will be depleted, the pastures have not yet picked up the effects of the rains, and the demand for feed particularly for oxen is high because of the start of the working season. As a result, animals rapidly lost weight during the dry season. Whereas the mean oxen weight was 275 kg, this declined to 240 kg

90
in July, but increased to 294 kg during December when crop by-products and hay were plentiful available.
Given an average holding of 7.66 TLU or an average liveweight of 1,915 kg, the mean feed requirement is 48 kg of DM feed a day, or a total of 17,478 kg of feed a year. Total production in a normal year will be approximately 1,700 kg of cereal straw, 1,200 kg of hay, and 2,500 kg from natural pastures, or a total of 5,400 kg of feed. Only 31% of the theoretical requirements are thus met, assuming feed requirements to be 2.5% of bodyweight. Farmers with small holdings have surplus feed however. This is illustrated in Table 4.18. Farmers with 1-4 livestock have substantially more feed than required, while farmers having more than 11 livestock face a major shortage which gives a feed balance according to the size of the livestock holdings. Farmers who do not have sufficient feed will purchase straw and hay on the market, or will give out animals in "Ribi" arrangements.
Table 4.18.: Feed Balance (% Feed Available/Feed Required) 1/
1980 1981 1982 1983
Farmers with 1-4 livestock Farmers with 5-10 livestock Farmers with 11-20 livestock Farmers with more than 20 livestock
1/ Feed requirement estimated as 2.5% of bodyweight in DM equivalent. Feed available was estimated as aggregate in DM equivalent of cereal straw and hay produced, and estimated feed availability from grazing.
4.5.4. Livestock Productivity
4.5.4.1. Cattle
The mean weight of adult female cattle was 200 + 34 kg 1/, and the mean bodyweight of working oxen 275 + 43 kg. This is Tess than reported by Alberro and Haile Mariam (1982a and b) and Mukassa (1982). The average age of cows on control farms was 9.5 years. Of these, 67% were reared on the farm, 29% were purchased and 4% gifts. Cows are kept to produce replacement oxen and milk. Average milk offtake has been estimated at 292 + 27 kg for a lactation length of 6.5 months.
Age at first calving was 61 months or five years and one month. Calf mortality rate was 21.7%. The survey also indicated that of the calves that died, 10% did so at the age of less than 1 month, 16% between 1 to 2 months, 48% at the age of 3 to 6 months and 26% between 6 months and 1 year. The farmers stated the causes to be 13% due to bloat, 16%
179 112
55 42
259 155 104
58
326 87 55 38
319 257
76 39
1/ Figures presented are mean and standard deviation.
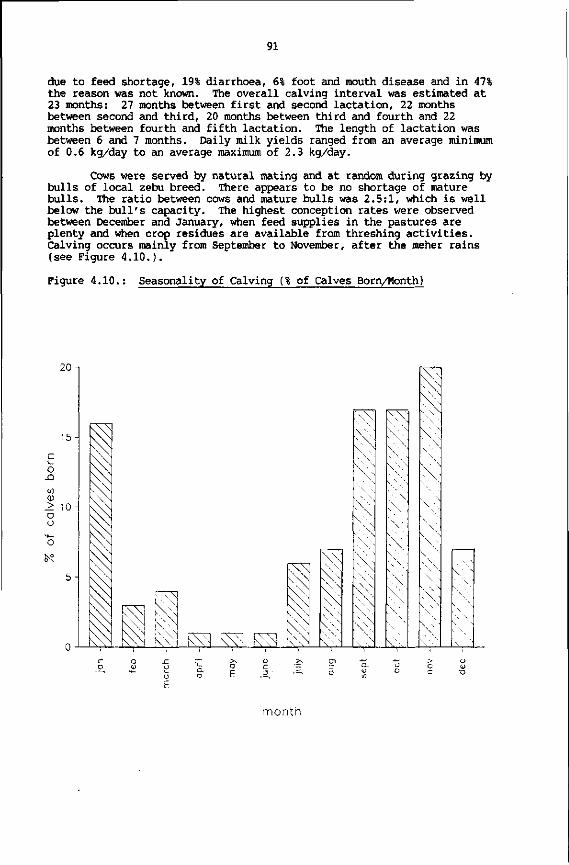
91
due to feed shortage, 19% diarrhoea, 6% foot and mouth disease and in 47% the reason was not known. The overall calving interval was estimated at 23 months: 27 months between first and second lactation, 22 months between second and third, 20 months between third and fourth and 22 months between fourth and fifth lactation. The length of lactation was between 6 and 7 months. Daily milk yields ranged from an average minimum of 0.6 kg/day to an average maximum of 2.3 kg/day.
Cows were served by natural mating and at random during grazing by bulls of local zebu breed. There appears to be no shortage of mature bulls. The ratio between cows and mature bulls was 2.5:1, which is well below the bull's capacity. The highest conception rates were observed between December and January, when feed supplies in the pastures are plenty and when crop residues are available from threshing activities. Calving occurs mainly from September to November, after the mener rains (see Figure 4.10.).
Figure 4.10.: Seasonality of Calving (% of Calves Born/Month)
20
15
O -Q
l/) 0)
> 10 o o
o
5- w wN
N \ \ N
N^
„ s '
\ \ NN x \ \
^ N
\ V
NN
month

92
Calf birth and weaning weights were not measured in the survey, but have been estimated by Mukassa (1981) under similar conditions to be 21 and 46 kg respectively. Preweaning average daily gain (ADG) was estimated at 92 g per kg. Yearling weight was 59 kg, giving a post weaning ADG of 146 gAg- Weaning is done usually at 3 to 6 months of age.
Calves are fed by suckling the mother. The amount of milk consumed by the calf was not measured. No reliable estimates are available in the literature although Mukassa (ibid) on the basis of personal communications estimates it at an extra 1.21 of milk for every one recovered for human consumption. This would bring total lactation yield to 642 kg. In view of the competition between the calf and the farmer's family for the dam's milk, the calf is often sent to graze in the pastures earlier than desirable, increasing the risk for exposure to disease and parasites. Using the conversion rates developed by Montsma (1962), who estimated milk consumption by calves on the basis of calf growth, calf intake could be estimated at 196 kg of milk. Mean milk production of local Zebu cows can then be estimated at 488 kg per lactation.
Entire males to be used as draught oxen are castrated at 4 to 5 years of age when they are physically mature. Then they have a working life of 5 to 6 years, and they are replaced at the age of 10 or 11.
In view of the high altitude location of the Baso and Worena Wereda, infectious diseases are not a major constraint to livestock production in the area. Since 1982, animals are vaccinated against rinderpest by extension agents of the Ministry of Agriculture.
The major animal health problems are infestation of endo-parasites such as liverfluke, lungworm and intestinal worm, caused by watering the animals at water spots in seasonally flooded or waterlogged bottomlands. Liverfluke ( Fasciola hepaticia) is an important factor causing mortality of sheep and young cattle. Infection is acquired by grazing on swampy areas and borders of temporary ponds and streams (Gemechu and Mamo, 1979; Erich, 1983), which represent the habitat of the intermediate snail host. The intensity of liverfluke infestation in grazing animals is most acute during October and November. Erich (Ibid) observed that liverfluke was acquired from the first day of grazing on bottomland areas with favourable snail habitats. Occasional outbreaks occur of infectious diseases such as black leg, anthrax, pasteurolosis, and foot and mouth disease.
The water requirements of animals may vary considerably according to the climate and ecology, livestock species and age, the type of feed rations available and the productivity of animals for the various purposes they are used (Williamson and Payne, 1978; Maynard et al, 1978). Assuming a minimal requirement of 30 litres of water per TLU, and given the average holding of 6.92 TLU, the average herd will require 208 litres every day.
The herdsboy will let the animals water once or twice a day depending on the distance to be covered. According to Steinfeld (1984) the correlation between distance and frequency of watering is significant. For the Debre Berhan area, he found that as from a distance

93
of 1,600 m, farmers change from a watering twice per day-pattern to once a day. The frequency of watering by class of cattle and by season is indicated in Table 4.19.
Table 4.19.: Frequency of Watering by Class of Cattle and by Season (% of Farmers)
Type of cattle
Cow
Working oxen
Source :
Watering frequency
Once/day Twice/day Not restricted
Once/day Twice/day Not restricted
Steinfeld (1984)
Dry season
49 47
4
49 47
Season Belg
47 49
4
29 67
Meher
12 16 72
12 16
The information presented in Table 4.19. suggests that there is no significant difference in the watering of cows and oxen during the dry or meher seasons. However, more attention is given to working oxen during the belg season. This may be due to better care because of the importance of land preparation which requires the oxen in good working condition. Springs and rivers are the main water sources during the day and belg season. During the meher most herds obtain drinking water from natural depressions around the homesteads.
4.5.4.2. Small Ruminants
Sheep are numerically the most important species, Per farm there are on average 11 sheep, against only 6.2 cattle, 2.8 equines and 2.7 poultry. Sheep are almost exclusively from the "Menz" bread. Smallholder farmers have various objectives with the sheep enterprise. First they are the most important source of investment, security and cash income. Some farmers have large flocks and have up to 45 sheep. Sheep are purchased and sold according to the cash flow situation and needs of the farmer. Around 40% of the farmers cash income from trade in animals can be attributed to the sale of sheep. Second, sheep provide the farmer families with meat. On average each farmer family slaughters a sheep three times a year. Third, sheep are important for the supply of manure. During the dry season it is collected from the night shelter of the flock, mixed with cattle manure and prepared into dung cakes that are used as fuel in the household. During the rainy season the manure collected is often wet and mixed with mud which makes it difficult to use as fuel. It is then used to fertilize cropland.
During the day sheep are grazed and herded with the other livestock species. At night they are brought back to the homestead for protection against predators. Farmers with small flocks keep their sheep with other livestock but farmers with larger flocks (more than 10 sheep) mostly keep their flocks separately from other species. Pregnant ewes are housed separately during the last few weeks of pregnancy.

94
The main feed source for sheep is native pasture grazing, and like the other livestock species this can be both on individual and communal pasture land, on fallow land and on stubble fields. Grazing is done for 8-9 hours per day, with per 75% of flocks once per day watering at mid-day (Steinfeld, 1984).
Only in periods of severe feed stress will sheep be given some hay or straw supplement. Heavily pregnant ewes may occasionally get a supplement in the form of "atela" waste, hay or straw, or small amounts of grain.
The main diseases are liverfluke, coenurus, diarrhae and anthrax. Most farmers will occasionally treat sheep against liverfluke and lungworm. However, often the drugs are not available, or the farmers lack cash for the purchase. Liverfluke is the dominant cause of sheep mortality.
Most farmers have at least one ram running with the flock throughout the year. Mating is by natural service. Rams are usually used for service for the first time at about 12 months of age, and taken out of service for castration or for sale at the eruption of the second pair of permanent incessors, usually at about 2 year (Agyemang et al, 1985). Exceptionally good rams are not taken out of service until about four year of age.
Most farmers castrate the rams at an age that varies from the appearance of the second pair of permanent incessors to the appearance of the fourth pair of incessors, or between 2 and 4 years of age (Ibid). Castration is done for the purpose of fattening animals, in order to fetch a higher price when sold. Supplementary feed is provided in the last few weeks before sale.
An important aspect of sheep management in the Baso and Worena Wereda is the existence of "Ribi" arrangements, i.e. multiple ownership, or a separation of management and ownership of animals. Farmers who do not have sufficient feed will lend female animals to farmers with surplus feed. The recipient farmer will manage the animal, and will receive half the offspring return. Usually sheep only are exchanged in Ribi systems, although occasionally cattle are exchanged also. Approximately 47% of farms had at least one Ribi animal. Farmers with smaller flocks have proportionally more Ribi animals.
As the sheep breed is of the Menz type, it does not produce wool but hair. Only few farmers have the skill to shear sheep, and this task is therefore mostly performed by craftsmen from the Menz area, who pay farmers Birr 0.15 for each sheep sheared and who use the hair for crafting purposes. The main reason for a farmer to have his sheep sheared is to have it cleaned from external parasites such as ticks, and mud.
The productivity of sheep on the 42 control farms during 1983 and 1984 was as in Table 4.20.

95
Table 4.20.: Sheep Productivity
1983 1984
N N
Lambing % Ewe mortality Lamb mortality Sheep mortality
259 119 31 14.1 71 27.5 89 18.0
198 123 14 9.0 42 21.0 55 15.1
Lambing percentage of the sheep flock owned by control farmers was 119% (i.e. 1.19 lambs born per ewe per year). This figure increased to 123% in 1984. This slight increase may have been due to better feed availability resulting from higher rainfall during 1984.
The peak lambing season was from September to November and relatively equally distributed during the rest of the year (Figure 4.11). Conception rates increased between April and June.
Figure 4.11.: Seasonality of Lambing (Lambing %/Month)
20
en
• J " t a
w " T
I k\N
-£
kv^ k' v!
N k, R,> .k^i X-N
' \ \ ^ K N
ikyi R>N K\N
9.5
k ^
15
k ^ \ \ x \ \
^
^ ^
\ \ \ - \ \ \ x X
t ^ \ \ " i \ \ \
kxN
fl ! \ k
iN'-C1 \ v
K \ \
i \ >
month
96
Controlled breeding was not practised. Mortality is highest during the dry season because of cold temperatures and feed stress. During October to January night temperatures may drop to as low as -7 C, causing substantial lamb mortality due to pneumonia. This seasonality of mortality is indicated in Table 4.21. In 1984 there were no short rains and the period February to May was exceptionally dry, causing severe feed shortages and high mortality during that period.
Table 4.21.: Seasonality of Mortality of Sheep and Lambs (% of Flock,
Period
Feb. - May June - Sept. Oct. - Jan.
1983-1984)
1983 Lambs
7.0 6.0
14.5
Sheep
6.3 3.5 8.2
1984 Lambs Sheep
11.6 6.8 4.4 3.1 5.0 5.2
Total 27.5 18.0 21.0 15.1
Sheep mortality was lowest from June to September due to the availability of feed and the warmer weather during this period. The main cause of mortality of sheep is liverfluke. On the basis of discussions with farmers, and veterinary staff of the Ministry of Agriculture, it is estimated that 70% of sheep mortality is due to liverfluke. On the basis of tracer lamb experiments, Erich (1983) observed that all sheep infected with liverfluke died within 16-25 weeks after the beginning of the experiment.
4.6. Labour Use and Time Allocation
4.6.1. Introduction
The human labour required to operate farm holdings around Debre Berhan is characterized by strong seasonality for crop production, while remaining relatively constant for livestock production. Almost all labour is supplied by the family household, except during peak periods of field activities, mainly during harvesting, when extra labour may be hired. Farmers also often exchange labour, by assisting each other on alternate, days. All physically able members of the household participate in farm work. Tasks can be grouped as labour for crop production (seedbed preparation, planting, weeding, harvesting and transport of the produce to the homestead, threshing, winnowing and storing), livestock production (milking, feeding, herding, shearing, manure collection, barn clearing, hay making and forage production, etc.), marketing, domestic chores, farm maintenance and communal farm work. As indicated in Section 4.1., the average family size is 4.6 people, consisting of 2 adults and 2.6 children, or 2.9 Adult Equivalents (AE). There is some specialization by age and sex. Field work for crops is mostly done by adult males. Women and children assist in the weeding and harvesting of crops, as well as in the transport of the produce. Livestock labour is supplied mostly by women and children, who also perform most of the household tasks.

97
4.6.2. Labour Inputs in Crop Production
The farm work schedule for field crops is dictated by the agricultural calendar which is strongly influenced by the distribution of precipitation. Seedbed preparation starts with the onset of the small rains and continues till end of June when most crops are planted. The peak labour months are during the harvest period from November to January. During the three years of field collection of labour data, there was little variation in the average amount of labour supplied to crop production during the meher season: 873 hours/farm during 1979, 909 hours/farm during 1980 and 891 hours/farm during 1981. This is illustrated in Figure 4.12.
Figure 4.12.: Distribution of Labour Inputs for Crop Production (Hours of Labour per Farm per Month)
Labour inputs for crop production (Debre Berhan, 1979-81) 1979
(Meher)
2 0 0 Hours/farm
180
160
140
120 --
100--
8 0 -
60
40
20
0
«s
±fc l
1980 (Meher)
l v
1981 (Belg)
ÜA
1981 (Meher)
«V «V
«\ <v «v «v
«\ «V
«V >\ »\ *•. *•, «V «s <N XV « V « V K \ * V
Jan Feb Mar Apr May Jun Ju l Aug Sep Oct Month/yeap
Nov Dec Jan Feb Mar
During the period of data co l lec t ion there was only one belg season, in 1981, and on average of 72 hours of labour per farm was used during t h i s ea r ly season of crop production. However, there were va r i a t ions between farms and between PAs as indicated in Table 4.22.

98
Table 4.22.: Labour Inputs in Crop Production (1979-1981)
100
Crops for the mener season are planted from the end of May till early July. Usually barley is sown early June, horse beans and field peas mid-June, lentils end of June to early July, wheat early July, while for linseed there is a spread in modal planting dates from the end of May to the end of June (Table 4.26.).
Table 4.26.: Modal Planting Weeks for Major Crops 1/
Barley Wheat Horse beans F.peas Lentils Linseed range mode range mode range mode range mode range mode range mode
1979(M) 19-32 21 21-31 27 19-30 25 21-28 25 24-31 27 19-28 19 1980(M) 19-28 24 23-29 27 21-28 25 21-28 24 23-28 26 21-26 26 1981(B) 10-15 1 2 - - - - _ _ _ _ _ _ 1981(B) 20-30 24 21-30 28 21-29 26 22-29 24 24-30 27 20-26 21
1/ Values are week numbers of time of planting for the meher (M) and belg (B) seasons.
Except for linseed, there is little interannual variation on the modal value of the planting week. This confirms observations that the timing of the onset of main rains has been similar throughout 1979-81.
The labour requirements for the belg cropping season are small, as only a limited area of land is being cultivated (on average 2500 m2/ farm). Land preparation of belg crop, almost exclusively barley, is planted mid-March and harvested around July. Unless the farmer is short of grain, he may not thresh the crop until December-January, together with the meher crops.
Harvesting of the crops is done with sickles to cut the crop stalks. The cutting is usually done by adult men, while adult females and children haul the unthreshed crop with donkeys to a stalking ground near the homestead.
Table 4.27.: Modal Harvesting Weeks for Major Crops 1/
Barley Wheat Horse beans Field peas Lentils Linseed range mode range mode range mode range mode range mode range mode
1979(M) 38-52 42 41-54 49 40-51 46 43-50 44 41-50 43 40-50 47 1980(M) 42-59 45 46-57 50 44-51 47 40-50 43 43-51 46 48-59 52 1981(B) 25-29 2 7 - - - - _ _ _ _ _ _ 1981(M) 45-53 46 47-56 50 45-55 47 45-53 46 45-48 46 50-56 52
1/ Values are week numbers of the time of harvesting for the meher (M) and belg (B) seasons.
The harvesting of barley is usually from mid-October to early November, field peas at the end of October, lentils and horse beans early to mid-November, wheat at the beginning of December and linseed towards the end of the same month (Table 4.27.). Threshing of crops is done
101
after harvesting, and continues throughout January and February. However, farmers who are not in immediate need of grain, may delay the threshing to avoid the social obligation of lending grain to poor neighbours or relatives, or from fear of exhibiting wealth and therefore having to pay higher taxes.
Table
Month
1 2 3 4 5 6 7 8 9
10 11 12
4.28.:
S.B.P.
17 29 44 40 24 9 1
-4
28 18 4
Monthly Distribution of Labour Inputs for by Activity (Hrs/Farm, Mean
2/ Guie
1 8 5 4
10 14 3
-----
Seeding and fertilizing
_ -3 1 -
43 51 12 ----
Weeding
_ -----1 7
26 13 --
1979-1981) 1/
Harvesting and transport
71 16 4
---10 4
-5
66 145
Crop
Thr and
Production
eshing storing Total
59 148 58 111 11 67
1 46 34 66 66 23 30 46
2 86 26 175
Total 218 45 110 47 321 157 898
1/ During the period of data collection, there was only one belg season. the figures are therefore to underestimate labour inputs for years with a belg season.
2/ S.B.P. = seedbed preparation.
The monthly distribution of labour inputs per activity is presented in Table 4.28. Some of the seedbed preparation and ploughing starts immediately after the harvest, when the soil still contains some moisture and can easily be ploughed. Most of the ploughing is done at the onset of the early rains in March. Guie preparations are in May/ June. The planting of mener crops is predominately done during June and July, while belg crops are planted in March. Only little weeding is carried out, mainly during September. The bulk of labour inputs are for harvesting and transport which takes place from November to January. Children and adult men will then be quite busy threshing, winnowing and storing. The busiest months are December and January, while August is the month with the lowest activity.
Although adult males provide most of the labour in crop production, females assist mainly with the harvesting, and children with the harvesting and threshing. During harvestings when available family labour supplies will not be sufficient for the needs, additional labour is hired, or assistance sought through exchange systems. Each year, around 50% of the farmers hired some labour for crop production. The cost of hiring labour is around Birr 2/day in addition to providing lunch. Labour was hired for an average total of 7 days per year, costing Birr 14 per farm per year. Around two thirds of the hired labour will be for harvesting and threshing activities, and predominantly for plots planted with barley (73%), horse beans (13%) and wheat (8%).

-1
14 49 8
13 8
10 7
49 30
5 3 5 6
31 8
17 5 9 3
44 14
102
Table 4.29.: Use of Female, Child, Hired and Exchange Labour (Hrs/Farm)
Female Child Hired Exchange
Seedbed preparation Guie Seeding and fertilizing Weeding Harvesting and transport Threshing and storing
Total 72 108 58 92
Farmers will assist each other with exchange labour during the busy periods of seedbed preparation and planting as well as during harvesting and threshing. The use of female, child, hired and exchange labour is presented in Table 4.29.
Correlation analysis has indicated that there is some effect of family size on the area cultivated, but not a strong one. There is a significant effect however of labour inputs per ha on the productivity of wheat and barley (P<0.05). The non-significance of labour inputs as a causal variable of the productivity of pulses, is probably linked to the strong impact frost has on the yield of pulses. Pulse yields are very variable as a result of frost incidence, thereby distorting the positive effects of labour inputs.
Correlation analysis has also shown that those farms with the highest labour inputs also have the highest amount of grain production. Labour inputs do not differ significantly by the size of farms. Smaller farms do not use more labour on a per hectare basis than larger farms.
Cultural and religious factors limit the field work of this Coptic Christian farmers, who observe between 150 and 200 religious holidays each year. These restrictions mostly relate to any activity that involves the breaking of the soil. Around Debre Berhan, 157 Saints' Days are being observed annually not including Sundays, on which field work may also not be performed. The incidence of church holidays is presented in Table 4.30. and Figure 4.13. The number of non-working days due to religious factors including Sundays averages approximately 180 days each year.
The months with the largest number of Saints' Days are July, August and September (Hamle, Nehase and Meskerem). This may explain why so little effort went into weeding of field crops. Farmers believe that if they work on a religious holiday God will punish them with hail, drought or other hazards. The restrictions that apply during these religious days are not uniform and very much depend on the views of the local priest. During certain days only those activities are prohibited which involve breaking the soil, while for example hay cutting and livestock production are not affected. On other days, all agricultural labour activities will be prohibited. In general, livestock production is much less affected by religious restrictions than crop activities.

103
Table 4.30.: Saints' Days and Religious Holidays in the Baso and Worena
Saint name
Lede ta Perrekelitos Bahta Hawaria. Abo* v
Eyesus Sellassie* Abakiros Ababorsema Meskelyesus Kidistahanna Michael* Egziarab* Aregaye Cherkos Kidenemeheret Estifanos Hawaria Gebriel*
-Mariam*
-Giorgis* Abatekle Markoriyos
-Medhanealem* Amanuel Balewold* Yohanis
Wereda 2/
M
h h
h/w 4/ w h w h h/w w h h h h h/w w w h w h w h w h w w w h h h w
T
w h w w h w h w w w w h h w w w w w h w h h h w w w h w h w
H
w w w w h h h w w w w h h w w w w h h w h w h w w w h w h w
T
w w w h h w h w w w w h h w w w w w h w h h h h w w h h h w
T
w w w h h h h w w w h h h w w w w h h w h w h w w w h w h w
Months 1/ Y
w w w w h w w w w w w h h w w w w w h w h w h w w w h w h w
M
w w w w h w w w w w w h h w w w w w h w h w h w w w h w h w
M
w w w w h w w w w w w h h w w w w w h w h w h w w w h w h h
G
h w w w/h h w w w w w w h h w w w w w h w h h h h h h h h h w
S
w w w h h w h w w w w h h w w w w h h w h w h w w w h w h w
H
w/h w/h h h h w h w/h w h h h h w/h w h w h h w h w h h w/h w h w/h h w
N P
w w w w h h w w h w w h h w w h h h h w h h h h h h w h h w w h w h w
N of holidays 15 11 11 14 13 9 8 15 11 22 18 1
1/ M - Meskerem (September), T » Tikemt (October), H = Hedar (November), T = Tahesas (December), T = Tir (January), Y = Yekatit (February), M = Magabit (March), M = Miyazia (April), G - Ginbot (May), S - Sene (June), H = Hamle (July), N = Nehase (August), P = Pagume. Ethiopia follows the Julian Calendar which consists of 12 months of 30 days and one month 'pagume' of 5 days, or 6 days in a leap year. Ethiopian New Years Day is on the equivalent of 12 September of the Gregorian calendar.
2/ w = working day, h = holiday, Sundays are not included.
3/ * obligatory holidays for all farmers.
4/ h/w holiday or work depending on the views of the local priest.

104
The mean number of days in a year that control farmers did not perform any agricultural activity was 7 0 + 4 . The low value of the standard deviation indicates that almost all farmers followed the restrictions in a similar magnitude. The incidence and impact of religious holidays on agricultural production is also discussed by Kiros (1976).
Figure 4.13.: Incidence of Religious Holidays Per Month
25-
20-
15-
10-
X religious holidays
other days (including Sundays)
o -o v a> -c JZ
o •" 'S
I 1 c
Ä
4.6.3. Labour Inputs in Livestock Production
Labour inputs to livestock production consists of efforts related to milking cows, barn clearing, manure collection, sheep shearing, livestock butchering, and herding, feeding and watering of the animals.
The main labour inputs in livestock production in smallholder farming in the Debre Berhan area are summarized in Table 4.31. The mean monthly labour input is 449 hrs/farm, ranging from 402 hours in February

105
to 521 hours in December. The peak labour months related to livestock production are from October to December when hay is harvested. During the rest of the year, the labour flow is relatively even. Overall, livestock labour inputs average 15 man hours per day, assuming no quality difference between child and adult labour input. Labour inputs are somewhat lower during the rainy season (14 hrs/day) because of reduced herding and increased stall feeding.
Herding
The dominant labour input to livestock production is the herding of animals. From November to May, they graze in the bottomlands which are flooded during the rainy season, and on the stubble fields after harvesting has taken place. From June to October, animals graze on the upland pastures and the waste land. Herding is done by young children, as from the age of 6. Usually this will be the responsibility of the sons, although daughters may assist. In every household, at least one person will be assigned the specific duty of herding. Many families have a hired boy or girl especially when they do not have children of their own, or if they are considered wealthy. Often these herd boys or girls (more boys than girls) have a family relation to the household, although occasionally they may also be refugee children from drought stricken areas or originating from very poor families. Herd boys and girls are aged between 6 and 17, and earn between 20 and 70 Birr per year in addition to food and some grain if they are not related to the family household. When they are relatives of the household, they will usually only receive food, lodging and clothes, and occasionally a sheep. Herding takes about 9 hours a day. It starts at 8 a.m. and continues till 5 p.m. During the dry season herding will be somewhat longer than in the wet season.
Manure Collection and Dung Preparation
During the herding, manure droppings will be collected and heaped, while the animals are watched. These animal wastes are then transported to the homestead. Control farmers undertook this activity on average 4 times a week and the process of collecting manure takes 1 1/2 hours a day.
Once the manure is transported to the homestead, it will be processed into dung cakes. This is done by mixing the animal wastes with water, straw and grass, shape it into cake form (of between 400 and 500 grams each) and let it dry in the sun. The preparation of dung cake is an exclusively female activity, of wifes and daughters, but usually not by mothers. Sometimes dung cake making is done collectively. The making of dung cakes takes about one hour a day, and around 20 pieces are made per hour.
An important aspect of dung cake preparation is the mixing of the dung with water. Steinfeld (1984) has estimated that on average 28 litres of water per day are used for this activity, or a consumption of 4.4 litres of water per person per day.
Control farmers collect water on average four times a day. Females carry 95% of the water used. The water is transported in a locally made jar ("ensira") made of clay, and which is carried on the

106
back of the women with the support of a rope (Steinfeld, ibid). The only cases where males were involved in water collection was when the wife was disabled, or when they were divorced or widowed. The average daily total amount of water carried for household purposes from the source (mainly springs, rivers or natural ponds or water holes during the meher) to the homestead is 80 litres. The mean distance walked was 575 m one way, and the activity took an average of 128 minutes a day. According to Steinfeld, there is no correlation between the distance from the homestead to the water source and the amount of water used for the various purposes, except in the case of dung cakes. Water consumption for the preparation of dung cakes increases with decreasing distance to water source.
Cleaning, Feeding and Milking
Another predominantly female task is the cleaning of the barn. This is done by wifes and daughters, and takes one hour per day during the dry season, and 1.30 hours during the wet season. The task takes longer during the rainy season because more manure is being produced and because the barn will be dirtier.
The hand feeding of animals is done by the household head, assisted by his wife and children. It is done twice a day and it takes on 3-4 minutes each time to provide the feed. Cows in milk and working oxen are provided additional feed, in the field, and this then takes an average of 1 hour a day. Equines are handfed only once in the evening, taking also 3-4 minutes only. Sheep are not handfed, except occasionally when they are being fattened for sale.
The milking of cows is done primarily by women, although on one farm in four the household head also undertakes this activity. It takes between 5-10 minutes each time and is done twice a day. Only very few control farmers sell milk in fluid form. The milk of local cows is partly directly consumed, and partly processed into butter and cheese. The processing of milk is done once or twice a week by the women (wives and daughters). It takes between 1.30 hours and 2.30 hours for butter making and an additional 30 minutes to make cheese. There is a direct correlation between the size of the cattle holding and the time spent on milk processing. The processing of fluid milk into butter and cheese in the Ethiopian highlands is described in O'Mahoney and Ephraim Bekele (1985).
Feed Harvesting
One of the most labour intensive activities associated with livestock production is the harvesting of hay. This activity takes place from late September to end December, which is the most labour intensive period at the farm as it coincides with the harvesting of the meher grain crops. After the hay is cut, by means of a sickle, it is left to dry in the field for about a week. The dried hay will then be bundled and transported by donkey to the dwelling house for storage. Farmers who are short of labour, either hire extra labour during this period, or delay the cutting or the transport of hay till they finish the harvest of grain crops. Surveys have indicated that the cutting, stacking and transport of hay takes about 160 hrs/ha, or between 200 and 300 hours per farm.
Farmers who delay the harvesting and cutting of hay, suffer a penalty in the reduced quality of the hay. Protein content declines rapidly, when cut after early October, although the energy content may

107
initially increase. During October there is a trade-off therefore between protein and energy, but as from November the quality of both declines (Goe, 1987). Farmers who are short of labour are thus penalized in the quality of hay.
Only few control farmers grew special purpose fodder crops, other than hay. Oats, which are usually regarded as a fodder crop, are grown predominantly for human consumption.
Butchering
Butchering of animals is a male task, and associated with major festivals during which meat is consumed. Animals are usually sold alive, and are not normally slaughtered for sale of the meat. Efforts associated with butchering should therefore not be counted for a labour inputs related to livestock production, rather as household activities. Control farmers slaughter between 2 and 9 sheep a year, and many have once a year a "kircha" or communal slaughter of bovine. In such a system, a group of 8 to 10 farmers purchase an ox or other bovine, slaughter the animal and divide the meat.
Table 4.31.: Labour Inputs in Livestock Production (Hrs/Farm)
Months Activity Jan Feb Mar Apr May June July Aug Sept Oct Nov Dec
Herding 1/ 295 266 295 285 295 255 263 263 255 263 285 295 Manure collection/ 24 24 24 24 24 24 24 24 24 24 24 24 Dung preparation 3/ 31 28 31 30 31 30 31 31 30 31 30 31 Water collection J/ 22 20 22 21 22 21 22 22 21 22 21 22 Barn cleaning 5/ 31 28 31 30 31 45 47 47 45 47 30 31 Hand feeding 6/ 19 18 19 19 19 19 19 19 19 19 19 19 Milking 4 3 4 4 4 4 4 4 4 4 4 4 Milk processing 7/ 15 15 15 15 15 19 19 19 19 19 15 15 Hay cutting - - - - - - - - - 80 80 80
Total 441 402 441 428 441 417 429 429 417 509 508 521
Assumptions:
1/ Assuming 8.5 hrs/day during the wet season and 9.5 hrs/day during the dry season, and only one herder.
2/ Assuming manure collection is done 4 times a week and takes 1.5 hours each time.
3/ Dung preparation takes about one hour per day. ~A/ Only water collection for dung preparation is taken into account. Animals
are being watered during herding. Other water collection is mainly for household purposes and not included in tabulation.
5/ Barn cleaning takes one hour per day during the dry season, and 1.30 hour during the wet season.
6/ Assuming 8 minutes per day in the barn, and one hour a day for 6 months a year of additional handfeeding of working oxen and cows in milk.
7/ Milk processing is done on average 1.5 times a week taking each time 2.5 hours. In view of higher quantities of milk that are being produced during the wet season, labout inputs will be higher during this period.

108
The other tasks involved in livestock production require relatively minor labour inputs. They can be classified as efforts related to breeding, sheep shearing, animal health, and calf care.
Most of the mating of animals will be at random in the field. Occasionally, a farmer may take a stallion to a stud farm to produce a mule offspring, or bring a cow to a PA bull station.
Sheep shearing is usually done by specialist shearers who come down from the Menz area and who will pay the farmer between 10-20 cents per sheep for its hair.
Only few farmers give drugs to their animals, except for the occasional vaccination or treatment against worm infestation.
Calves are usually thethered and looked after by the wives and daughters while they are cleaning the barn or undertaking household activities.
The distribution of labour inputs for crop and livestock production is presented in Figure 4.14. Whereas labour inputs for crop production are highly seasonal, those for livestock are relatively even throughout the year.
Figure 4.14.: Distribution of Labour Inputs for Crop and Livestock Production
Labour inputs crop and livestock production
Crops Livestock Total
7Qn Hours/Farm
600-•
500-•
400
300
200-•
100-•
II U 1
II A
II
A As A J a
s
n A 'A
i A Jan Feb March April May June July
Month Aug Sept Oct Nov Dec

109
4.6.4. Other Labour Inputs in Farm Production
Labour inputs into farm work, other than those related directly to crop and livestock production, relate to the marketing of crop and livestock products, as well as live animals, maintenance activities on the farm and peasant association work.
A special survey carried out during 1981 on the time allocation of control farmers, has highlighted the labour inputs associated with these enterprises. Household heads visited the market during 48 days of that year, worked 33 days for the association and had 71 days during which predominantly work at the farm was carried out. This is illustrated in Table 4.32.
Household heads went on average on 48 different days to the market, for a total of 308 hours, or 6.4 hours each time. Their wives visited the market 25 days, taking an average of 5.6 hours each time.
Adult men spent substantially more time on field work than children and adult females (Table 4.33.).
Table 4.32.: Time Allocation of Household Heads (1981)
Activity Days
Field work own land Exchange labour Marketing Association work Holidays 1/ Other activities 2/
Total 365 100.0
1/ Holidays are defined here as days during which no agricultural activity was carried out.
2/ These include making fences, construction of barns, handicraft, etc.
Table 4.33.: Time Allocation to Field Work by Different Family Members TT98TT
Family member Total days Total hours Hours/day
Adult male 116 754 6.5 Adult female 19 102 5.4 Child 50 180 3.6
Each farmer is also required to supply labour to the Peasant Association with which he is affiliated. The survey indicated that on average 33 days have been used for this activity. The labour is used for planting trees, making contour bunds, assist aged or disabled or enlisted farmers. This amount has increased sharply since 1981. During 1984, farmers worked on average more than two days each week for the association, or a total of 132 days (Table 4.34.).
116 27 48 33 70 71
31.8 7.4
13.2 9.0
19.2 19.4

110
Table 4.34.: Association Work of Control Farmers (1984)
Type of work Frequency Total/year
Terracing 2 days a week 80 Tree planting 7 days a year 7 Irrigation work 22 days a year 22 Communal farm work 6 days a year 6 PA barn construction 9 days a year 9 PA hay making 1 day a week (Oct.-Dec.) 8
4.6.5. Returns to Labour in Crop Production
In order to better understand the rationale of farmers in choosing certain crops in the cropping pattern, it is interesting to look at the returns to labour in terms of grain production. During 1979-1981, the average amount of grain produced per unit of labour input was 2.03 kg/hour. The highest return farmers obtained was 2.28 kg/hour in 1979, compared to 2.24 kg/hour in 1980 and 1.56 kg/hour in 1981. All labour (family, hired and exchange) and types of grain (gross output) were aggregated in the calculation.
The crops giving the highest return were horse beans and field peas (2.76 and 2.71 kg/hour respectively), while barley and wheat gave a return of only 1.9 kg per hour of labour input. Oats yielded 2.55 kg/hour but conclusions are difficult given the fact that only one year of data were available. The return to labour of different crops for the period 1979-1981 is presented in Table 4.35. Only results from the meher season are included.
Overall the return to labour to crop production in monetary terms was 0.89 Birr/hour in 1979, 1.09 Birr/hour in 1980 and 0.86 Birr/hour in 1981. This was calculated by dividing the gross output of each crop by the aggregated input of family and exchange labour.
Table 4.35.: Returns to Labour for Different Crops (1979-1981)
Crop Grain production per hour of labour input (kg/hr) 1979" 1385 1981 Mian
Field peas Wheat Horse beans Lentils Barley Linseed Temenze Oats
3.81 1.99 3.29 0.93 2.13 0.87 n . a . n . a .
2.69 2.19 2.58 0.88 2.20 1.12 1.55 n . a .
1.64 1.53 2.41 0.42 1.39 0.51 1.17 2.55
2.71 1.90 2.76 0.74 1.91 0.83 1.36 2.55

Ill
4.6.6. Returns to Labour in Livestock Production
Total labour inputs in livestock production were estimated at an average of 5,383 hours per farm per year. As argued before, we have assumed no quality differences between labour inputs. There is for example no evidence to state that male adult labour would do herding, manure collection or barn cleaning more efficiently than children. Labour inputs in livestock production are mainly supplied by female and child labour, with low opportunity costs. In the calculations it was assumed that there would be little inter-annual variation in labour inputs for livestock production. Given a mean livestock holding of 6.92 TLU, the mean labour input is 778 hours/TLU.
The gross margin resulting from livestock production (excluding intermediate products) averages 744 Birr/farm/year. This would indicate that the return to labour averages around 0.14 Birr/hour. When the value of draught power and manure are included, return to labour increases to 0.18 Birr per hour. Although this is less than the returns to crop labour, livestock labour inputs are mainly supplied by woman and children and have low opportunity costs. Livestock production would be difficult for farmers to undertake in the absence of woman and children. The labour required for livestock production would then compete with labour required for crop production. Livestock production provides substantial opportunities for employment of surplus family labour resources.
4.7. Use of Animal Draught Power
The most important contribution cattle make to agricultural production is in the form of draught power. Oxen are used for seedbed preparation, planting and crop threshing. Sometimes they are also used for the transport of the produce from the field to the homestead. If a farmer has insufficient oxen to his disposition for seedbed preparation, he will sometimes use a young bull as a substitute. All cattle except calves, and adult equines assist in the threshing. Donkeys are used as pack animals to transport agricultural produce from the field to the homestead and to the market.
During the period of data collection, the mean animal power input for crop production was approximately 1,044 hours per farm: 959 hours from cattle and 85 from equines.
Of the 959 hours from cattle, 900 were from oxen (450 ox-pair hours), and 59 from other cattle (bulls, heifers and cows). Almost all of the 85 hours provided by equines were from donkeys, other equines accounted for less than 10% of this input.
The use of animals for crop production according to activity is presented in Table 4.36. There was little inter-year variation, although between farms there are variations according to labour input and crop productivity. The CV of animal power inputs between farms ranges as from human labour inputs, between 25 and 30%. The distribution of animal power inputs during the year is presented in Figure 4.15.
As there was only one belg season during the period of data collection, the animal power inputs during this time may be somewhat underestimated.
423 235
2 42
333 48
388 200
2 38
294 43
26 21
1 5
29 1
467 211
4 33
249 46
435 222
3 39
299 46
112
Table 4.36.: Animal Power Input for Crop Production by Activity (Hours/Farm, 1979-19BTT
1979 1980 1981(B) 1981(M) Mean/year
Seedbed preparation Seeding and fertilizing Harvesting and transport
oxen donkeys
Threshing oxen/other cattle donkeys/other equines
Total 1083 965 83 1001 1044
Almost two thirds of the animal power input is for ploughing (seedbed preparation and seeding). Weeding is done by hand without assistance from animals and therefore not included in Table 4.36.
The inputs from donkeys as presented in Table 4.36. are only for the transport of produce from the field to the homestead. To this should be added the time donkeys walk from the homestead to the market to transport dung cakes, grain and straw offered by the farmer for sale. Almost all farmers go to the local market at Debre Berhan once a week. On average this is a 2.30 hours trip, or 5 hours round trip. Once a month they also go to Chacha, a nearby village at two hours walk or a 4 hours round trip.
The total animal time input for marketing can be estimated at 308 hours per donkey. Given an average holding of 1.2 mature donkeys per farm, the mean donkey input for marketing will average 380 hours per farm per year. Donkeys are also used to transport hay from the pasture to the homestead, which will take on average 40 donkey hours per farm.
The total input from donkeys therefore averages approximately 500 hours per farm per year.
Donkeys carry loads of between 15 and 50 kg each time, depending on the type of produce. Typical donkey loads as measured during the survey period were as in Table 4.37.
Table 4.37.: Weight of Donkey Load by Commodity
Size of load Straw 1/ Hay Manure 1/ Grain
Small Medium Large
30 35 40
15 20 25
35 40 47
20 35 50
1/ Farmers express loads of straw and manure in "Kurbet" but these were reconverted in kg equivalents for the purpose of this table.

113
A hay load will normally not be more than 25 kg because it is more voluminous than other crops. Male donkeys carry heavier loads than female donkeys. Farmers believe that a strong male donkey can carry up to 100 kg over a short distance. However, as indicated previously farmers have more female than male donkeys.
The average animal power input for crop production is around 457 hours per ha. (Table 4.38.). PA 5 (Karafino) has substantially lower animal power inputs per farm, because of the smaller size of the area cultivated. There is no significant difference of animal power inputs per ha between the different associations.
Table
PA
4 5 6 7
4.38.: Ai
Yea 1979 (n=60)
978 850
1359 1114
limal Power Inputs for
r (hours/farm) 1980 (n-42)
1185 732 954
1031
1981 (n-42)
1182 908
1118 1178
Mean
1115 830
1144 1108
Crop Production by PA
Year (hours/ha)
1979
453 500 576 530
1980
456 407 430 357
1981 1/
462 513 383 413
(1979-
Mean
457 473 463 433
1981)
Mean 1075 975 1096 1049 515 412 443 457
1/ The figure for 1981 is a weighed aggregate of belg and meher.
Table 4.39.: Animal Power Inputs per Crop (Hours/Ha, Mean 1979-1981)
Activity
Seedbed preparation (oxen)
Seeding and fertilizing (oxen)
Harvesting and transport
oxen donkeys
Threshing oxen and other
cattle donkeys and other
equines
Total
Barley
222
92
1 16
132
17
480
Wheat
162
103
1 12
143
20
441
Horse beans
108
102
2 20
132
26
390
Field peas
92
96
2 18
83
42
333
Lentils Linseed
158
97
8
52
8
323
53
80
9
59
4
205
Temenze
190
98
8
177
18
491
Barley and temenze (which is a type of barley) are the crops requiring most animal power. Almost two thirds of the animal input is allocated to seedbed preparation and seeding. Pulses require less power for seedbed preparation. Lentils and linseed are low yielding crops, and

114
therefore require significantly less animal power for threshing and transport of the produce.
The peak working months for animals are from December to March, when threshing coincides with seedbed preparation. This is illustrated in Figure 4.15., which illustrates the seasonal distribution of animal power inputs. During the study period from 1979 to 1981, animal power inputs averaged 87 hours/month, ranging from 167 hours in December to only 4 hours in August, which is the slack period. As there was only one belg season during the study period, the animal power inputs may be somewhat underestimated. The major use of animal power for the belg crop is during the month of March, for ploughing purposes. Farmers delay most of the threshing of belg crops till the harvesting of meher crops, and then bulk both harvests. Few farmers rent oxen. If they are short of power they usually use labour and draught oxen exchange systems. Only during 1984, which followed an extremely bad drought year, some farmers rented oxen, at a cost of 5 Birr per ox per day, including the ox handler.
Figure 4.15.: Distribution of Animal Power Inputs for Crop Production (Hours per Farm, Mean 1979-81)
Belg Meher
Hours/farm Belg (1981): 81 hours
Meher (mean 1979 - 1981) • 1010 hours
Jan Feb March April May June July Aug Sept Oct Month
115
Overall, draught animals have spare capacities to perform additional work. They are only used 50-70 days per year. The gross energetic efficiency of oxen, defined as energy in the form of work accomplished as a percentage of energy consumed for maintenance and work on working days, ranges between 11 and 151 (Gryseels and Anderson, 1983a).
4.8. Subsistence Food Economy and Marketing
4.8.1. Nutrition and Health
Farmers in the Baso and Worena Wereda are subsistence oriented and their agricultural output is largely consumed by the farm family, with some additional production for cash to supplement the family with consumer items. This is the second stage in the transition process from a non-monetary production unit to commercial farming as described by Fisk (1975). Barley, wheat, horse beans, lentils and field peas are the major food grains consumed. Home consumption of livestock products is limited, but they are with live animal sales the major source of cash.
The staple food of the study population is "injera" and "wot". This is the dominant food type of the members of the Amhara and Oromo tribes. Their food habits have been extensively described elsewhere (ENI, 1980; Westphal, 1978). "Injera" is a porous, sour pancake, a few millimetres thick and 40 to 45 cm in diameter. At Debre Berhan "injera" is made of barley, or in a mixture with wheat or oats. The ingredients of "wot", the highly spiced sauce which accompanies the "injera", depends on what is available, fasting requirements and local tastes. Meat "wot" is preferred, but most farmers can afford it only on feast days.
The consumption habits of the farmers in the Wereda, as in other Amhara communities, are strongly determined by the fasting rules of the Coptic Christian Orthodox church, to which all farmers belong. These fasting rules prohibit the consumption of food containing animal protein (except fish) on Wednesdays and Fridays, and during long fasting periods, such as the eight weeks before Easter and the second and third week of August.
The fasten periods of the 1981 calender year are tabulated in Table 4.40. This year is representative of other years. As indicated in this table, some fasting periods are obligatory, others are optional.
Farm families around Debre Berhan are confined to a vegetarian diet for at least 139 days each year, and for the dogmatic believers this total can be as high as 221 days per year. Children below the age of 10 are excluded from this rule. During fasting periods, farmers also do not take breakfast. This often weakens their physical condition during critical periods of the agricultural season, particularly during the period of ploughing. Previous research on the nutritional effects of fasting in Ethiopia (Knutsson and Selinus, 1970) has observed reduced energy intakes during fasting periods.

116
Table 4.40.: Fasting Periods of Christian Orthodox Church (1981)
A. Obligatory fasting days
Name of fast Starting date Ending date N of fasting days
Wednesdays 52 Fridays 52 Nenewe 16 February 18 February 3 Hudade (Abye) 2 March 26 April 55 Feleseta 7 August 22 August 15
Total T T T
Double counting Wednesdays-Fridays -22
Non-fasting Wednesdays and Fridays after Easter -16
Total obligatory fasting days 139
B. Optional fasts
Tsege 5 October 14 November 40 Gena 24 November 7 December 44 Hawariat 8 June 12 July 35
Double counting of Wednesdays and Fridays -37
Optional fasting days 82
On fasting days, the "wot" is made of pulses (peas, beans, lentils) and spices. Home consumption of animal products is limited by the low productivity of livestock and the need to use them as a principal source of cash. Approximately 55% of the value of livestock production (including sales of live animals) is marketed. Sheep account for most household meat consumption. Mutton and beef is almost exclusively from homeproduced sheep, while the beef is sometimes purchased. Veal and pork are not consumed by Amhara.
Control farmers slaughtered an average of 4.4 sheep a year for meat consumption, with a range of 2 to 9 per family. Only few (12%) of the animals slaughtered were mature, the majority were lambs (34%) or other young stock (54%). Almost all meat consumption was related to major religious festivals such as Easter, Christmas, Epiphany, Meskel and the end of the short fast in August, or to other celebrations such as the New Year and weddings. About 75% of the slaughters take place during the months of April (for Easter), September (for New Year and Meskel) and January (for Christmas and Ephiphany). The amount of purchased meat consumed is negligible. Assuming an average weight of 15 kg per slaughtered animal, and a dressing percentage of 40%, the average consumption of sheep meat averaged 26 kg or around 9 kg per adult equivalent per year.
Milk is usually prepared into butter, and control farmers consume on average 0.5 litre of buttermilk per month. The consumption of eggs is limited to religious festivals and averages 18 eggs per household per

117
year (Wagenaar-Brouwer, 1986). Almost all consumption of livestock products is from home production. Beef is consumed rarely. Once a year, farmers participate in a "Kircha," but for the group of control farmers the aggregate number of bovines slaughtered for meat consumption was only 4 or 5 animals per year. The consumption of poultry is linked to religious festivals, but averages only one or two chicken a year.
The dominant sources of food in the Debre Berhan area are cereals and pulses. Barley and horse beans are the most important food items consumed. Other grain consumed are wheat (for bread), oats, lentils, field peas and sorghum. All these grains except sorghum are home produced. Consumption of grains includes use for beer making. On average 102 kg of grains per farm are used every year for this purpose. During 1981, the average grain consumption per person per day was 622 grams, consisting of 401 grams of cereals and 21 grams of pulses. Monthly grain consumption varied seasonally, with the highest intakes recorded during April, and the lowest during August and September.
It is difficult to present an annual profile of food consumption and production flows of Debre Berhan farm families. There are substantial inter-annual flows, and consumption behaviour is strongly affected by farmer expectations about the coming harvest, cropping pattern, market prices, political developments and the grain supply of the previous crop year, in addition to the yield of the early season belg crop. Table 4.41. is based on actual figures for the average farm during 1981. The table illustrates that 21% of grain production is used for seed, 66% for home consumption, 4% for sales and 9% balance that is being used as a food reserve. It is to be noted that 1981 followed a very good crop year, and also had a belg season. Table 4.41. is therefore to be considered as representative of a "good" year.
Table 4.41.: Grain Production and Use Per Farm (1981 Kg/Farm)
Grain type
Barley Wheat Horse beans Field peas Lentils Linseed Tamenze
Total %
Production
987 182 445 82 4 7
24
1731 100
Seed
204 39 77 35 3 2 3
363 21
Home
628 148 343 24 1 1 2
1147 66
Net sales 1/
47 4
11 1 ---
63 4
Balance
+108 - 9 + 14 + 22
-+ 4 + 19
+158 9
1/ Net sales equal total sales minus purchases of the grain during the year.
After good harvests, farmers replenish their food stocks to make up for shortfalls in bad years. During the study period farmers produced in all years except one (1983) sufficient cereals and pulses from their own cropped land to have a modest surplus over and above minimum family food needs.

118
Farmers also report the regular purchase of extra grains to make up for shortfalls during the year for home consumption, beer making or seed use. On average just over 100 Birr per year were used for this purpose.
The nutritional status of the rural population in Ethiopia has been described as "characterized by low levels of energy intake" (Miller et al, 1976). Most nutritional studies in Ethiopia have been undertaken Before the 1975 land reform, which substantially altered farming conditions throughout the country. A more recent study (ENI, 1980) indicated the national average daily energy intake to be only 67% of the requirement, while the overall protein intake was 156% of the requirement. The findings of the study suggest that people use their excess protein for energy purposes. FAO (1987b) has estimated that nationally in Ethiopia the average calorie intake amounts to 73% of requirements.
From the household data collected from the Debre Berhan farm families, average daily energy intake per capita from grains was estimated at 2,450 kilo calories. This was supplemented by energy from fats, and from occasional small quantities of milk and meat. The average daily protein intake was around 90 grams per head (Gryseels et al, 1984b). These calculations were based on coefficients estimated-by Agren and Gibson (1968) and Agren et al (1975). The energy intake corresponds more or less to the requirement of 2,400 K cal as set by WHO (1973), while the protein intake is well above the requirements. Intakes appeared high compared with national estimates of 1704 kilo calories, and 57 grams of protein per head as estimated by FAO (1987b).
The nutritional status of control farmers as measured by height for weight standards is illustrated in Table 4.42.
Table 4.42.: Proportion of Household Members in Various Categories Height for Weight (December 1982)
>100% 90-99% 80-89% 70-79% <70% (N)
Adult male 7 Adult female 26 Boys 5-18 yrs. 36 Girls 5-18 yrs. 22 Children 5 yrs. 49
Average (%) 26 36 31 6 1
Source: Gryseels, Wagenaar and Anderson (1984b).
Weights and heights of all members of 40 households were taken in December 1982. Weights were compared to reference weights at given lengths. For children up to 5 years of age the standard of the National Centre for Health Statistics (WHO, 1979) was used and for older children and adults the Harvard standard (Stuart and Stevenson, 1959).
41 35 36 46 23
46 33 25 18 21
4 4 3
13 6
1 1 ---
68 57 36 46 47

119
According the the reference standards, about 7% of the total sample population are moderately to severely malnourished. Malnutrition (weight below 80% of reference weight 5-18 years at given weight) occurs most frequently for girls ages 5-18 years. The highest proportion of the population (68%) was found in the category between 80 and 99% of the established standard. The mean weight of adult men was 58.5+5.8 kg.
Although these data do not suggest serious nutritional deficiencies in the study area, caution is required in the interpretation of this information. There are substantial seasonal variations. The survey reported upon in Table 4.43. was undertaken in December when most crops had just been harvested. It can be expected that the prevalence of malnutrition will be higher in the preharvest period (July-October).
Wagenaar-Brouwer (1986) found up to 40% stunting in children of control farmers. Control farmers and their families were found deficient also in nutrients such as riboflavin (vit. B2), ascorbic acid (vit. C) and ritivoc (vit. A ) .
Little information is available on the human health situation in the study area. Records on the number of people treated for certain diseases from the Debre Berhan hospital indicate that gastritis is the most prevalent disease followed by upper respiratory infections, pneumonia, gastro-entitis and rheumatism (Gryseels et al, 1984). Dysentries, colitis and venerial diseases are also major health problems.
4.8.2. Marketing
4.8.2.1. Introduction
Although farmers are subsistence oriented, they regulary visit markets to sell or puchase grains, livestock, livestock products, clothes, implements, energy sources (dung cakes, parafine oil, etc.), crop by-products and consumer items. The market also performs an important social function where people meet and discuss.
The principal market is at Debre Berhan town where there are two market days each week, the major one on Saturdays and a minor one on Wednesdays. Separate sites are provided for livestock and crop products. Most farmers also go to Chacha market every Tuesday.
The markets are a meeting place between farmers, townfolk, wholesalers and retailers. Farmers can sell grains either directly to consumers at the market, to retailers or to middlemen who in turn transport the products to other urban centers, mainly Addis Ababa. An important role is also played by government purchasing agents who buy the produce at official rates and transfer it to the Agricultural Market Cooperation (AMC), which sells in turn to the kebele shops in urban centers. Livestock are sold as live animals which are offered for sale within a close yard specifically allocated for that purpose by the municipality. Prices of livestock and livestock products are not subject to government control.

120
4.8.2.2. Government Impact on Marketing
The Ethiopian Government has a regulating function in the marketing of crops, with the objective of stabilizing prices, and to organize a fair distribution of food grains among consumers. The system operates primarily through the AMC which at the regional level coordinates closely with the Wereda Ministry of Agriculture, Wereda Administration, Wereda Oil and Pulse Export Corporation, Transport Corporation and the Wereda Peasant Associations. These organizations form a regional committee which organizes the supply of grains to AMC.
The AMC sets a grain quota for the country as a whole, while the different committees decide on the quota that is to be supplied regionally, by each awraja and each wereda. At the wereda level, a quota is allocated to each service cooperative, which in turn distributes this quota among the member Peasants Associations. In addition to a quota for service cooperatives, a quota is also given to each officially registered wholesale dealer of the area.
The Executive Committee of each peasants association in turn determines on the basis of its quota how much grain is to be supplied by each farmer individually. Although in principle each farmer within an association will be asked to supply a similar amount of grain, in practice the executive committee will also take into account factors such as family size and crop stand in deciding on individual allocations. The PA has the right to enforce or impose a fine on each individual farmer not fulfilling his quota or refusing to sell this cropshare to the PA at AMC's prices. Fines can amount to up to 50 Birr per farmer. The grain collected by each PA is transported to the service cooperative or wholesaler, where it is being picked up by AMC, who pays the SC's and merchants 5 Birr/quintal more than the official purchase price from farmers. The practice has in general discouraged farmers to produce mush grain beyond their subsistence family needs.
During the 1984 crop year, the quota set for the Baso and Worena Woreda was set at 16,275 quintals. This quota was distributed between 10 wholesalers and 17 SCs, comprising a total of 77 PAs. Although there are 103 PAs organized in 22 SCs in the Woreda, 5 SCs and 26 PAs were labelled as drought affected and deficit areas which would not produce sufficient grain for sale. These PAs were excluded from supplying quotas.
ILCA's control farmers are organized under the Faji and Bokafia S.C., which comprises the PA's of Kormargfia, Milki, Faji and Bokafia, Karafino, Tebasse and Atoberet. During 1984, they were to supply a total of 400 quintals of barley to AMC, at the official farm gate price. Each farmer was to supply 38 kg of grain to his respective PA who forwards them to the S.C. In addition, wholesalers were to buy 474 quintals of grains from farmers and sell it to AMC at the official prices. Farmers can negotiate prices however, and merchants will often pay purchase prices which are substantially higher than the AMC price they receive. The loss is seen as a hidden tax to keep their operating licence. Official and free market prices differ strongly, as illustrated in Table 4.43., which reports on prices paid during December 1985, during the harvest, when grain prices are usually low. Farm gate prices paid by AMC were nevertheless only between 25% and 50% of consumer prices.

121
1.
2.
3.
4.
5.
December 1985
Price paid to farmers by AMC
AMC purchasing price froir wholesalers and SC's
Price paid to farmers by wholesalers
Wholesalers price to retailers
Retailers price to consumers
(Birr/qt)
Barley
28
32
65
95
98
Wheat
34
39
95
125
142
Horse beans
25
30
75
100
n.a.
Field peas
36
40
70
75
80
The Baso and Worena Wereda is not considered a productive area for grain crops. The incidence of hail and frost, low soil fertility, and recurrent drought in the lower altitude areas severely affects crop yields and the region regularly has a grain deficit. The quota system which came into effect during 1982, works both ways. During years that the region is considered to have a deficit, AMC will sell crops at the official prices to the S.C's, which will in turn supply grain to farmers in need. During 1983, AMC supplied to total of 41,000 quintals of grain to the region.
The impact of the quota system on income of control farmers is negligible, as only a minor (less than 5%) proportion of their grain production is affected. In our calculations we have therefore worked with free market prices as they occur at the Debre Berhan market.
There is no regulating function from the Government on the prices of livestock and livestock products. Farmers can freely offer their animals for sale at the market, provided that an entrance tax of 1 Birr per bovine, and 0.25 Birr per small ruminant is being paid at the market yard.
4.8.2.3. Marketing of Crops
Immediately after the threshing of the grain crops, a farmer will sell surplus grain at the market. Usually this will be between 50 and 100 kg. As the year progresses, and depending on his cash needs, he or his wife will sell small quantities of grain to enable the purchase of consumer items.
Crop prices fluctuate seasonally, with a peak in the rainy season around July when crops are being planted. The lowest prices occur at harvesting and threshing time from November to January when market supplies are most abundant.
Prices did not fluctuate much annually between 1979 and 1983. As from 1984 the country was nationally hit by drought and widespread food shortages, and as from mid-1984 this reflected in a sharp increase in food prices at the Debre Berhan market. Average annual consumer prices for the major crops from 1979 to 1984 are presented in Table 4.44.

122
Table 4.44.: Mean Consumer Prices for Major Crops at Debre Berhan Market 1979-1984 (Birr/quintal)
Barley Wheat Horse beans Field peas Lentils Linseed
1979 1/ 1980
46 52 75 89 36 41 43 49 68 95
105 90
1981
52 80 38 47 78
101
1982
54 83 41 47 68
114
1983
52 79 39 47 76 94
1984
75 97 62 71
127 103
1/ Market survey started in May 1979.
Seasonal price variations for different crops are illustrated in Table 4.45. The data are based on mean prices at the Debre Berhan market as recorded between 1979 and 1983 for the major crops. Because Ethiopia's food shortages led to very sharp increases of crop prices during 1984, this year was excluded from the calculations.
Table 4.45.:
January February March April May June July August September October November December
Monthly Consumer Prices Market (Mean 1979-1983,
Barley
45 45 46 47 52 57 56 53 55 54 55 49
Wheat
79 76 74 74 79 83 84 86 85 83 88 85
of Major Crops Birr/quintal)
Horse beans
36 35 36 36 38 39 41 45 43 42 40 38
Field peas
42 43 46 46 52 48 48 50 49 47 47 45
at Debre
Lentils
68 73 73 74 77 77 80 87 84 81 79 75
Berhan
Linseed
96 95 88 88 96 93 97
105 111 101 112 105
Prices generally peak during the months of June, July and August when crops have to be planted and the result is high demand for seed, and are lowest in December when harvests lead to a sharp increase of market supplies. The only exception is linseed where prices remained very high even during harvest periods, due to consecutive failures of the crop in 1981 and 1982.
Straw and hay are also important commodities traded at the Debre Berhan market. Only cereal straws (barley, wheat, and oats) are of commercial value. The price of straw and hay is related to feed availability in the region. The average annual price from 1979-1984 of straw and hay is illustrated in Table 4.46. There is no price difference between barley, wheat or oats straw. Often they are sold as a mixture.

123
Table 4.46.: Prices of Straw and Hay at Debre Berhan Market (1979-1984, BirrAg)
1979 1/ 1980
Straw 0.06 0.08 Hay 0.11 0.12
1981 1982 1983 1984
0.07 0.13 0.12 0.22 0.10 0.14 0.15 0.24
1/ Market survey started in July 1979.
Prices of straw and hay increased rapidly during 1982, and even more in 1984 as a result of drought. The market price of hay and straw is usually expressed in "kurbet" equivalent but have been converted to "kg" units. There is also substantial seasonal variations in the price of straw and hay, as illustrated in Table 4.47. which reports on average monthly prices for the period 1979-1983. 1984 was excluded because of the unusual price rises related to the effects of widespread drought.
Table 4.47.: Monthly Prices of Straw and Hay at Debre Berhan Market (Mean 1979-1983, Birr/Kurbet)
Straw Hay
January 2.27 2.19 February 2.35 2.27 March 2.16 2.15 April 2.07 2.41 May 2.83 3.15 June 3.16 3.36 July 3.19 3.10 August 3.32 3.25 September 3.14 2.67 October 3.14 1.83 November 3.19 2.04 December 2.72 2.03
1/ One Kurbet of straw averages 30 kg and of hay 23 kg.
The price of hay is lowest from October to December when hay is being made on the pastures, and is highest from May to August which coincides with the rainy season. This is somewhat contradictory to earlier arguments that nutritional constraints are most severe during the dry season from January to May. However, hay and straw are predominantly fed to working oxen and cows in milk. Farmers run out of stocks of straw and hay in April at the end of the dry season, but when the feed requirements of oxen increase because of the start of the working season the demand for feed for the work oxen cannot be met by available stocks and farmers have to purchase hay and straw at the market. In addition, the rains do not have an immediate effect on pasture productivity. Pasture production and quality does not peak until August. The price of straw remains high until early November, when the first crops are harvested and threshed, leading to increased supplies of straw to the market.

124
4.8.2.4. Marketing of Livestock and Livestock Products
The trade in live animals is often closely linked to events in crop production. When crop harvests fail, farmers will make up for the shortfall in food stocks by selling animals and purchase foodgrain in return. The process of selling livestock is a selective one. As food and seed grain stocks are depleted, small ruminants are sold first, then young cattle and equines, then cows, and finally draft oxen. The complete cycle will only occur however in situations of general crop failure and food shortages.
Usually, a farmer will sell young small ruminants to generate cash to buy seed grain, or consumer items. Oxen are usually reared on the farm, and purchased at the market only in times of acute need. During the study period, there was little variation from year to year in the price of animals, as illustrated in Table 4.48. The mean annual price of a working ox ranged from 289 Birr in 1980 to 338 Birr in 1983 but remained relatively stable for other types of livestock.
Table 4.48.: Livestock Prices Debre Berhan Market (1979-1983, Birr/Animal)
1979
Ox Cow Ewe Ram Donkey (mature) Mare
323 186 20 56 45
108
1980 1981 1982 1983
289 156 22 64 44 84
323 165 27 64 52 81
322 167 24 62 54 89
338 177 25 70 54 78
Prices of livestock fluctuate seasonally. The price of oxen rises sharply at the start of the working season in April and remains high throughout this period, as demand is high and supply limited (Table 4.49.).
Table 4.49.
January February March April May June July August September October November December
Monthly Livestock 1979-1983,
Ox
299 289 298 326 325 329 346 343 330 310 314 303
Prices at Birr/Animal)
Cow
165 156 154 163 166 168 171 179 195 176 161 164
Ewe
23 23 22 29 24 25 24 23 26 26 23 23
Debre
Ram
63 63 68 74 69 69 60 62 62 62 61 62
Berhan Market
Donkey
45 49 52 53 56 55 57 51 58 50 56 53
(Mean
Mare
82 75 90 73 93 90 99
105 92
n.a. 80 76

125
The prices of cows will increase during the rainy season also, because of good pasture growth and positive effects on milk production. The price of sheep (ewes and rams) is closely linked to the incidence of religious festivals. During the week before Easter (April), New Year and Meskel (September) celebrations, prices will rise dramatically for a few days, because of the high demand particularly for urban consumption. The number of animals offered at the market will be more than double during such periods. Prices of equines are uniform throughout the year, and trade in those animals is limited. Fluctuations of equine prices are related more to differences in quality than to external events.
Animals are normally sold alive to other farmers or to traders or butchers. Meat as a commodity is not sold at the livestock market. About 65% of the milk produced at the farm is processed into butter and partly sold, partly home consumed. Butter prices peak during April-May, at the end of the dry season when milk production is lowest. The period also coincides with the end of the fasting period and the Easter celebrations. An important livestock commodity for trade is manure. It is sold in the form of dung cakes, and accounts for a substantial proportion of cash income. The price of dung cakes, expressed in Kurbet, has remained relatively stable during the study period, ranging from an average of 1.50 Birr during 1980 to 1.68 Birr during 1983. There were some seasonal fluctuations and the price of dung cakes increased by 15-20% during the rainy season when the demand for household fuel is high.
Hides and skins were also traded on the market. Their prices fluctuated little. Egg prices increase sharply with the incidence of festivities. Average yearly prices of livestock products are given in Table 4.50.
Table 4.50.: Price of Livestock Products at Debre Berhan Market (1979-1983, Birr/YeàTT
1979 1980 1981 1982 1983
Butter (kg) Eggs (n for 1 Birr) Hides (cattle) Skin (sheep)
4.9. Farm incomes and Gross Margins
4.9.1. Cash Incomes
Section 4.8. illustrated that farm families in the Debre Berhan area are subsistence oriented and that only a small proportion of farm production is sold. Comparatively, a higher proportion of livestock production than from grain production was sold.
8.6 11.2 17.2
6.2
8.0 9.9
16.1 5.9
9.2 10.7 19.2
6.0
8.2 10.1 17.3
6.2
9.4 9.1
18.6 5.1
126
Table 4.51.: Cash Income from Farm Sources (1979-1984, Birr/farm)
Source
Crop and crop by-products
Livestock production Milk Butter Eggs Manure Sheep skin Net sale of
live animals 2/
Total
% of income from livestock
1979
27
99
132
257
90%
1980
77+15
155+24 56+24 47+15 5+1
32+6 15+3
257+65
489+80
84%
1981
97+18
162+40 n 60+4 25+5 10+3 49+9 18+3
270+57
529+75
82%
1982
50
.a. 1/
274
324
85%
1983
14
112
222
348
96%
1984
28
29 -
15 2
10 2
488
545
95%
1/ During 1982 and 1983 the sale of livestock products were not recorded.
2/ Net sale of live animals calculated as difference in value of animals sold and purchased.
Note: Only during 1980 and 1981 were the data of sufficient quality to enable the estimation of standard deviations.
The overwhelming proportion of cash income of control farmers originated from the sale of livestock and livestock products. During the study period 1979-1984, the proportion of cash incomes originating from livestock averaged 89%. This is illustrated in Table 4.51.
Only during 1980 and 1981 were data collected in sufficient detail to enable the quantification of contribution of each of livestock products to cash income. Cash income averaged 509 Birr per farm per year, of which 83% originated from the sale of livestock and livestock products. About 52% of cash income was from the trade of animals, 31% from the sale of livestock products. Manure alone accounted for around 25% of the sale of livestock products, and dairy products for just over 50%. Farmers with small livestock holdings derived a proportionally higher fraction of their cash income from livestock, than farmers with large livestock holdings.
The trade in animals is the dominant source of cash income. Sheep account for about 40% of this trade value. The distribution of cash income resulting from trade in animals according to different animal species is presented in Table 4.52.

127
Table 4.
Cattle Sheep Equines Poultry
52.: Cash
1980
144 74 38 1
Income from Animal Trade
1981
97 139
30 4
1982
143 81 48 2
(1980-1983, Birr/farm)
1983
93 110
16 3
Mean %
119 46 101 40
33 13 3 1
Total 257 270 274 222 256 100
Cash incomes are however not necessarily a proxy for wealth. As crop yields fail, farmers are forced to sell animals to purchase food grain. The cash income of an individual farmer may therefore increase, while there is a decline in his wealth.
Most farm families also obtain income from non-agricultural sources: from off-farm work, the sale of drinks (tej or tella), sale of handicrafts, herding by children, the sale of sand or grin or from gifts. The monetary amounts involved in these incomes were generally small although large variations were encountered between farmers. Some farmers rent their services as craftsmen or others may sell wood. For the years 1980 and 1981 non-agricultural income averaged 103 Birr per farm per year (Table 4.53).
Table 4.53.: Off-Farm Cash Income (1979-1981, Birr/farm)
1979 1980 1981
Off-farm work Gifts Other
Total 118 102 90
Average cash incomes from both agricultural and non-agricultural sources for control farmers can therefore be estimated at 590 Birr during 1980 and 618 Birr during 1981.
Farmers also obtain additional cash sources from loans and "ekub". "Ekub" is a type of "forced" saving, whereby a group of people contribute a given sum of money at given intervals (weekly, fortnightly or monthly) to a coordinator of the group. The money collected is won in a draw by one of the members who is then locked out from subsequent draws until everyone in the group wins a draw. The process then starts again. Almost all farmers around Debre Berhan contribute to at least one "ekub" scheme. During 1979 they contributed 68 Birr a year to ekub schemes. This is in fact a saving from their own resources and does not constitue an additional income. Farmers also borrow regularly to pay for seed, major purchases, or social occasions such as weddings, funerals or baptisms.
53 17 48
31 37 34
22 5
63

128
Most of the available cash income will be used for the purchase of animals and grains. Only in 1980 were data sufficiently reliable and detailed to enable the breakdown of household expenses as in Table 4.54. Expenditures per household averaged 444 Birr during that year.
Table 4.54.: Household Expenses and Purchases (1980, Birr/farm)
Birr/farm
Grain purchase Livestock products Stimulants (coffee, tea) Vegetables Incense Ingredients brewing Clothes Association fees Church fees Gifts Entertainment Fertilizer Others
108 20 28 18 19
5 125 18 7
17 18 54 7
Total 444
Almost 30% of household expenses was for the purchase of clothes, while 25% was for the purchase of grain. During 1984, a year which followed a situation of widespread crop failure and grain shortages, the average proportion of cash expenditure spent on food grains was 58%. Farmers which owned two TLU or less, spent 94% of their cash expenditures on food grains. Poorer farmers (i.e. with small livestock holdings) spent thus a proportionally higher fraction of household income on the purchase of foodgrain. The purchase cost of agricultural tools and other equipment was not included in table 4.54. Farmers have to also pay a land tax of 20 Birr per year, and an income tax of 10 Birr/year. In addition they pay a monthly contribution to the Peasant Association of .50 Birr per adult and .25 Birr per child.
4.9.2. Gross Margins and Value of Production
As only a small proportion of farm production is being marketed, it is important to look at gross margins in evaluating the profitability of the farm. The gross margin of crops was 278 Birr/ha and ranged from 224 Birr/ha in 1979 to 359 Birr/ha in 1982, and 214 Birr/ha in 1983. Wheat, temenze and oats were the most profitable crops. In view of the unusual price increases of 1984, and the resulting strong effects of farm gross margins, the latter year was excluded from the tabulation. The average farm gross margin was 307 Birr/ha, taking into account the gross margins of fallow and pasture land (Table 4.55.).

129
Table 4.55.:
All crops Barley Wheat Horse beans Field peas Linseed Lentils Temenze Oats Teff
Fallow 2/ Pasture 3/
All farm
Gross Margins of Maj (1979-1983,
1979
224 202 537 176 202 95
158 ---
110 385
211
Birr/Ha)
1980
356 356 633 283 165 173 131 543 --
120 420
329
ar Crops, 1/
1981
237 232 385 246 135 57 25
489 43 43
100 350
259
Fallow and Pasture
1982
359 377 530 274 145 317 78
667 118 118
140 490
392
1983
214 200 462 146 14
149 119 125 136 136
150 525
342
Mean
278 273 509 225 132 158 102 456 99 99
124 434
307
Assumptions for the calculations:
1/ Gross margin calculated as ((crop yield x output price) - (seed use x seed price) - (fertilizer use x fertilizer price) - (cost hired labour + hired traction) + (yield of cereal straw x price).
For meher crops, output price used was the average farm gate price between week 46-58 which is the harvest period. Seed price was average farm gate price between week 20-28 when crops are being planted. For belg crops, seed price was the average from week 8-13, and for output value the average price from week 25-31.
For the valuation of straw and hay, the mean annual market price was used. Only straw of barley, wheat, teff and oats was assumed to have commercial value.
2/ Average hay yield from fallow land assumed 600 kg/ha.
3/ Average pasture yield assumed 2,500 kg/ha and valued at price of hay.
The average gross margin for livestock was 744 Birr/farm, gross margins from livestock are given in Table 4.57.
Annual
Table 4.56.: Gross Margins from Livestock (1979-1983, Birr/farm) 1/
Oxen Cows Heifers/y. bulls Bulls Calves Young sheep Adult sheep Goats Donkeys Poultry
1979
80 190 48 28 11 13
171 4
39 17
1980
68 223
58 37 13 23
188 4
43 11
1981
56 237 66 32 11 25
314 8
41 14
1982
80 265 74 24 15 26
245 4
48 18
1983
115 261
52 23 22 27
266 8
54 21
Total 601 668 804 799 849
1/ Excluding the value of intermediate products such as draught power and manure.

130
The assumptions and methodology for the calculations in Table 4.56. are presented in Table 4.57.
Table 4.57.: Gross Margin
Return
Progeny 2/ Milk 3/ Meat V Manure 5/ Hide/skîn Wool
Total return
Cost
Vet. expenses Hired labour Purchased feed
Total cost
Net value
Ox
40 35 1
76
2 2 5
9
67
Cow
37 68 30 30 1
166
2 2 6
10
156
Per Unit of
Heifer
19 16
1
36
1 1
2
34
Livestock
Y. bulls
22 19
1
42
1 1
2
40
(Bi
Calves
7 6 1
14
1
1
13
rr/Animal) 1/
Lambs
3 2
5
—
-
5
Ewes
18
15 4 2 1
39
1 .50
1.50
3
36
Donkey
15
12
27
-
-
27
1/ Excluding intermediate products.
2/ Assuming calving rate of 50%, lambing rate 120% and fowling rate 50%.
3/ Assuming milk offtake of 300 kg/lactation, calving interval 2 years, milk price 0.45 BirrAg-
4/ Offtake rate of cattle 10%, and of sheep 34%. Meat valued at 1.5 Birr/kg. Average liveweight ox = 275 kg, cows = 200 kg, heifer = 125 kg, young bull - 150 kg, calves » 50 kg, lamb - 10 kg, ewes = 30 kg. Mortality of sheep assumed 17%.
5/ Manure production 1% of body weight in DM equivalent, assuming 30% losses and price of 0.05 BirrAg-
Correlation analysis has shown that there is no significant difference between the gross margin/ha of crops according to area cultivated per farm, farm size, or size of livestock holding. Although there are clearly wide differences in crop productivity between farms, the causal factor appears to be management rather than resource availability.
Overall farm gross margin was estimated by combining crop and livestock enterprises. Livestock provides most of the gross margin of the farm. The overall gross margin per year averaged 1,403 Birr, of which 659 Birr (47%) was contributed by crop production and 744 Birr (53%) by livestock production. During 1983, a poor crop year, the contribution from livestock was as high as 62%. Annual and mean gross margins are illustrated in Table 4.58.

131
Table 4.58.: Farm Gross
Origin
Crops Livestock
Total farm GM
Crops (%)
Livestock (%)
1979
529 601
1130
47
53
Margin
1980
823 668
1491
55
45
by Enterprise (Bi
1981
569 804
1373
41
59
1982
858 799
1657
52
48
rr/Farm)
1983
514 849
1363
40
62
Annual average
659 744
1403
47
53
The annual return to labour in crop production was 0.89 Birr/hour during 1980 and 0.86 Birr/hour during 1981. The return to labour in livestock production, assuming no annual variation in labour inputs was 0.11 Birr/hour in 1979, 0.12 Birr in 1980, 0.15 Birr in 1981, 0.15 Birr in 1982 and 0.16 Birr in 1983.
The contribution of livestock to farm income rises further if the value of draught power is taken into account. This is illustrated in Table 4.59. The cost of hay and straw, which are produced by the crop enterprise are taken into account in the calculations.
Table 4.59. :
Returns
Progeny 1/ Milk 2/ Meat 3/ Manure 4/ Hide/skin Draught 5/ Wool
Total value
Costs
Vet. expenses Hired labour Hay Straw
Total cost
Net benefit
Assumptions :
Annual Gross Margin Including Unit Livestock Enterpr]
Ox
40 35 1
180
256
2 2
18 23
45
211
Cow
37 68 30 30 1
166
2 2
19 24
47
119
Heifer Y
19 16
1
36
1 1 9
11
22
14
Intermediate Products Per Lse (Birr/Animal)
bull
22 19
1 90
132
1 1
12 15
29
103
Calf
7 6 1
14
1
5 3
9
5
Lamb
3 2
5
-
-
5
Ewe
18
15 4 2
1
40
1
l'
3
37
Donkey
15
12
30
57
50 -50 -
5
5
52
1/ Calving rate of 50% and calf value of 74 Birr, rate of 120% and lamb value 15 Birr.
Also assuming lambing

132
2/ Milk offtake 300 kg/lactation, calving interval 2 years and milk price 0.45 Birr/kg-
3/ Offtake cattle 10%. Meat price 1.5 Birr/kg L.W. Weight of ox = 275 kg, cow - 200 kg, heifer » 125 kg, young bull = 150 kg, calf = 50 kg. Offtake sheep 34%, meat price 1.5 Birr/kg. Weight of lamb » 10 kg, ewe = 30 kg.
4/ Manure output 1% of body weight DM equivalent, 30% losses and price of 0.05 BirrAg.
5/ Draught power value per ox estimated at equivalent of 0.6 ha of crops, or 180 Birr per annum. Young bull valued at 50% of this value. Annual donkey transport valued at 60 tonsAm at 0.50 Birr each.
Horses were not taken into account in the calculations because they do not directly contribute to agricultural production. They are mainly used for transport of people.
The incorporation of intermediate products increased the value of the gross margin of the livestock enterprise by approximately 32%, and raised its contribution to the overall farm gross margin to about 60%. This is illustrated in Table 4.60.
Table 4.60.: Farm Gross Margins Including Intermediate Products
Origin
Crops Livestock
(Birr/Farm)
Total farm GM
Crops (%)
Livestock (%)
1979
529 831
1360
39
61
1980
823 858
1681
49
k
1981
569 1079
1648
34
66
1982
858 1046
1904
45
55
1983
514 1103
1617
32
68
Average
659 983
1642
40
60
The total gross value of farm production averaged Birr 2,570 per farm per year between 1979 and 1983. The gross value of production (GVP) was calculated as the total value of crop and livestock products produced on the farm, not taking into account production costs. GVP was estimated as output multiplied by the mean weekly price during the year. Intermediate products were not taken into account.
About 54% of GVP originated from crop and crop by-products and 46% from livestock products (Table 4.61.).
The subsistence nature of the traditional farming system at Debre Berhan is highlighted by relating the annual cash income to gross value of production. The ratio of cash income to GVP was 14% in 1979, 18% in 1980, 18% in 1981, 13% in 1982 and 12% 1983. On average only 15% of production was thus marketed.

133
Table 4.61.:
Origin
Crops Livestock
Total GVP
Crops (%) Livestock (%)
Gross Value
1979
828 1004
1832
45 55
of Production
1980
1644 1042
2686
61 49
1981
1585 1288
2873
55 45
(Birr/Farm
1982
1257 1265
2533
50 50
, 1979-
1983
1610 1326
2936
55 45
-1983)
Mean
1385 1185
2570
54 46
4.10. Role of Livestock and Interactions with Crop Enterprise
4.10.1. Introduction
As indicated previously, the major functions of cattle are to provide draught power for crop production, manure for fuel and milk and meat for direct home consumption. Small ruminants, almost only sheep, are kept for investment and security. Cattle and sheep also generate the major part of cash income, are an important source of protein and calories, and supply hides and skins.
Donkeys provide for almost all transport of agricultural inputs and outputs. Horses have only a limited function in the agricultural system but the transport of people. Poultry produce eggs and meat for cash and home consumptions. Previous sections have already quantified the individual contributions of each of the livestock species to agricultural production. This section will highlight how each of these functions interacts with the crop enterprise and illustrate the efficiency of using livestock as a store of wealth.
4.10.2. Draught Power and Grain Production
Throughout most of the Ethiopian highlands land is tilled using a pair of indigenous zebu oxen which pull the locally made traditional plough, the "maresha." The majority of smallholder farmers own either one or no oxen and use rental, exchange or loan arrangements necessary for timely cultivation. Details of these arrangements are given in Gryseels et al (1984b) and Gryseels and Jutzi (1986a and b ) . Nationally, around 29% oF~Ethiopian farmers have no oxen, 34% have one, 29% two, and only 8% have three or more oxen (Ministry of Agriculture, 1980).
Those farmers with one ox normally enter a "mekanajo" agreement whereby two farmers with one animal each agree to pair their animals for work on alternate days. The drawback of this strategy is that the time available for planting is so short, that the draught capacity is insufficient to allow both farmers to sow at the optimal time. A two week difference in planting time may make a difference of up to 50% in the yield obtained (Table 4.10.).

134
Those farmers who do not have even one ox enter a "kollo" agreement first, whereby they rent one ox for one year in return for between 200 and 300 kg of grain, to be paid after the next harvest. These "kollo" oxen are mostly owned by traders who invested in oxen during a drought period. Poorer farmers enter a "domegna", "yemoyaltegna" or "balegn" agreement whereby labour is given to another farmer in return for the use of his oxen. The usual arrangement is to work two days for every day of oxen use.
Farmers who are not only too poor, but also too weak to work have no alternative but to use a "megazo" agreement. The farmer with no oxen thereby asks another farmer to plough his land and offers a certain part (30 to 70%) of the yield in return.
A few farmers borrow a young bull and train it to work. At the end of the cropping season the animal is returned to the owner. This is called a "yegeraffi" agreement. Some farmers also have "wonfel" agreements whereby oxenless farmers offer grazing land in return for the use of oxen.
In the Baso and Worena Wereda, 20% of control farmers did not have oxen, while 28% only had one. About 52% of farmers were thus dependent upon rental, exchange or loan arrangements to obtain sufficient oxen for land cultivation. Farmers with one ox used "mekanajo" arrangements. Those farmers who did not own oxen used labour exchange systems to obtain the use of an ox, and then paired it with a "mekanajo" ox.
Those with no oxen ordinarily gained access to pairs of oxen for cultivation from nearby relatives, whereas farmers with one ox tended to secure a second ox to form a pair from neighbours and not necessarily relatives.
Farmers in the Wereda not owning oxen are usually young and newly established, or widowed or divorced women. Within the four Peasants Associations under study, there are a total of 29 farmers (4% of population), who do not have any ruminant livestock. About 45% of these livestock-less farmers are women, although only 10% of the household heads in the four PAs are female.
Most of these oxenless female farmers will use "megazo" arrangements to overcome the shortage of draught power and labour availability. The land is leased to a farmer with sufficient oxen and who will cultivate (ploughing, seeding and harvesting) crops on that land. Crop yields will be shared between both farmers and various agreements are in operation: "Yekul," "Sisso" or "Erbo."
"Yekul": This lease agreement is mostly in use for the fertile aredda productive land. It specifies that half of the produce will be given to the land owner and half to the oxen owner.
"Sisso": On aredda non productive land the agreement will be "sisso" which specifies that two thirds of the produce will be given to the oxen owner and one third to the land owner.
135
"Erbo": On yemeda land the agreement will be "erbo" which specifies that three quarters of the produce will be given to the ox owner and one quarter to the land owner.
The impact of draught power availability on crop production in the Baso and Worena Wereda has been reported by Gryseels et al (1986b), Gryseels and Durkin (1986), and Anderson, Gryseels ancTDurkin (1986). For this purpose, the survey data reported in this study were analyzed by least square procedures (Harvey, 1977). Combined analyses were made with the following parameters as dependent variables: area cultivated, seed use, and yields per ha and per farm. The analysis was done separately for cereal and pulse production because they have different labour requirements and gross margins, as well as different feed values.
The statistical model included the random effect of farmer within PA and the fixed effects of PA, year of planting, number of oxen owned at time of planting, fertilizer used, and interaction terms for year by ox ownership and PA by year of planting. Household size (expressed as adult equivalents) and livestock holding excluding oxen (expressed as tropical livestock units) were used as covariates.
The level of oxen ownership had a significant effect (P<0.01) on both the yield per ha and total area cultivated of cereal production. The mean area cultivated with cereals was 1.76 ha but farmers owning two or more oxen cultivated on average 32% more land to cereals than farmers owning no oxen. Farmers owning one ox cultivated an intermediate area.
The overall least squares estimate of mean net cereal yield (after deducting the seed input) was 516 kg/ha. Cereal yields per ha of farmers with two or more oxen were on average 35% greater than those of farmers owning no oxen and 14% higher than those of farmers with one ox (Table 4.62).
The increment in total cereal production per farm (after deducting the seed input) due to owning one ox rather than no ox was estimated at 266 kg per farm; the increment due to owning the second ox was estimated at 186 kg per farm.
Figure 4.14. graphs the least squares estimates of total cereal area per farm by year for the^three levels of oxen ownership specified in the model. The graph shows the positive impact of greater oxen ownership on total farm cereal area. The effect on cereal area cropped of owning a pair as opposed to no oxen was greatest in 1979 when farmers with a pair sowed 77% more land than those without oxen. The differences were also substantial in 1980 (+26%), 1982 (+26%) and 1984 (+65%).
The years with the largest differences, 1979 and 1984, both followed a year when there was a short main growing season. In 1978, the area recorded the lowest rainfall for 20 years, and although there were good rains in January and February of the following year (1979) farmers with two oxen used their oxen to maximize the area they put under crop to make up for the shortfall of 1978. The farmers owning no oxen were severely constrained in the area they cultivated as they had to wait until the farmers with an oxen pair satisfied their own needs for power. In 1984, farmers suffered from failure of the 1983 season and there were no short rains. Thus in 1979 and 1984 farmers with two oxen ploughed extra land to make up for the previous bad year, and so oxenless farmers were again penalized.

136
Figure 4.16.: Area Cultivated with Cereals for Three Levels of Oxen Ownership (Ha/Farm)
1979 1980 1981 1982 year
1983 1984
Source: Gryseels et al (1986b)
Two main factors affected the availability of draught power for oxenless farmers in anyone year. These were the outcome of the previous cropping year and the duration of the short rains. If either of these factors applied, the oxenless farmer will cultivate less area as a consequence of deferred access to draught power. In years with effective rains from February to May the soil is more easily ploughed, the most demanding cultivations can be done before June and individual power shortages can be overcome in a more timely way. Also, early rains produce better pasture growth so oxen are fitter for work in these years. If both these factors apply the negative production effect of limited oxen ownership is compounded.
The successful crop years of 1980 and 1982 together with good short rains in 1981 and 1983 enabled all farmers to cultivate approximately equal areas to cereals irrespective of oxen ownership. However, 1981 and 1983 proved to have poor long rains, and grain yields per ha were substantially reduced (Table 4.62).

137
Table 4.62: Least Squares Estimate of Gross Cereal Yield (kg/ha) from the Interaction of Year and Level of Ox Ownership
Zero
538 664 411 389 409 965
563
—
582 916 600 804 317 792
668 (+19%)
—
796 873 623 740 558 968
760 (+14%
79 80 81 82 83 84
Mean
Farmers with no oxen had substantially lower yields per ha than farmers with two or more oxen, except in 1984. During that year, there was no 'belg' season, and oxenless farmers were not able to cultivate sufficient land during the 'meher' season. They were desperate for grain after three consecutive years of low crop yields, and therefore extensively used 'guie' or soil burning on their land. This practice dramatically increased average yields per ha. As 'guie' is much more labour intensive than the usual method of land preparation, oxenless farmers reduced their area under cultivation with cereals, used only the most productive land, and left plots of lower soil fertility fallow.
Table 4.63.: Least Squares Estimates of Total Net Cereal Production from the Interaction of Level of Oxen Ownership and Year (Kg/Farm, 1979-1984) 17
Level of oxen ownership
Year Zero 1 2
1979 550 830 1313 1980 774 1396 1408 1981 466 889 786 1982 670 1169 1121 1983 692 463 741 1984 1179 1184 1675
Overall 722 988 (+37%) 1174 (+19%)
1/ Net yields, i.e. after deduction of seed inputs.
Table 4.63. and figure 4.17 are illustrative of the impact on whole net farm cereal production of increased oxen ownership. For the study period, farmers owning one ox produced on average an estimated 37% (266 kg) more cereals than farmers with no oxen. Farmers with two oxen had a further 19% (186 kg) advantage over farmers with no oxen. Overall, farmers with two oxen are shown to produce 63% more grain than farmers with no oxen.

138
Figure 4.17.: Total Net Farm Cereal Production for Three Levels of Oxen Ownership (Kg/Farm)
1750
1500-
1250
£ u O
J*
000
750
500
250 1979 1980 1981 1982 1983 1984
year
There was no significant impact of ox ownership on the production of pulses. The main influences on pulse productivity arose from the differences in cropping environment as regards frost risk and differences between farmers within a PA.
Farmers with more oxen can also cultivate belg crops more easily. Farmers with two or more oxen could plough between two and three times more land during the belg season than farmers without oxen. This is illustrated in Table 4.64.
Table 4.64.
Year
Belg Plantings and Ox Holding (m2/Farm)
Number of Oxen Owned 0 I 2 3+
1981 1982 1983
741 839
1803
1771 1908 3145
1957 1912 2586 2520 4934 4607
Mean 1128 2275 3159 3013

139
There was no statistical evidence that farmers with no oxen planted crops later than farmers with one or more oxen. There were no significant differences in planting week of barley between farmers owning zero, one, two, or more than three oxen. This may indicate that impact of planting week on crop yield is so high that farmers prefer to optimally cultivate a smaller area rather than try a larger area but with severe penalties on crop yields.
The relevance of the importance of the availability of timely access to draught power on area cultivated and total farm grain production has been confirmed for other areas in the Ethiopian highlands in studies by ITAD/AID Bank (1986), Gryseels et al (1986b) and Dejene (1985 and 1987).
4.10.3. Livestock for Security and Investment
The second most important function of cattle, but the major objective farmers have with the sheep enterprise, is its use for security and investment. Animals are purchased and sold according to the cash flow needs, and as a store of wealth. Farmers consider livestock to be a more reliable store of wealth than other alternatives such as bank deposits. It is also an investment which is easy to convert into cash. Despite the low productivity of livestock in this traditional system, this investment is a sound one. The annual rate of return to investment in livestock of local breeds can be estimated at 25% for sheep and 31% for cattle. This figure was calculated using a methodology first developed by Upton (1985).
The method is simplified as it takes only the major livestock products into account, i.e. meat for sheep, and milk and meat for cattle. The model could however easily be expanded to take into account other livestock commodities. The sheep model (Table 4.65.) follows the Upton method. The cattle model (Table 4.66.) was modified to enable the incorporation of milk into the model. The assumptions made for the calculation of the annual rate of return are based on the technical parameters as collected in the survey.
The rate of return to investment in livestock can be considered as being attractive, and farmers will invest their surplus cash in the purchase of animals. This occurs particularly after good harvests when a substantial part of the crop can be marketed. Oxen are purchased when they are required for farm production, just before and during the ploughing season.
After the very bad harvests of the 1983 crop season, almost all farmers sold animals during 1984. A total of 264 ruminant livestock and 39 chicken were sold by the 42 control farmers during this period. The timing of the sale and the number and type of livestock involved is illustrated in Table 4.67.
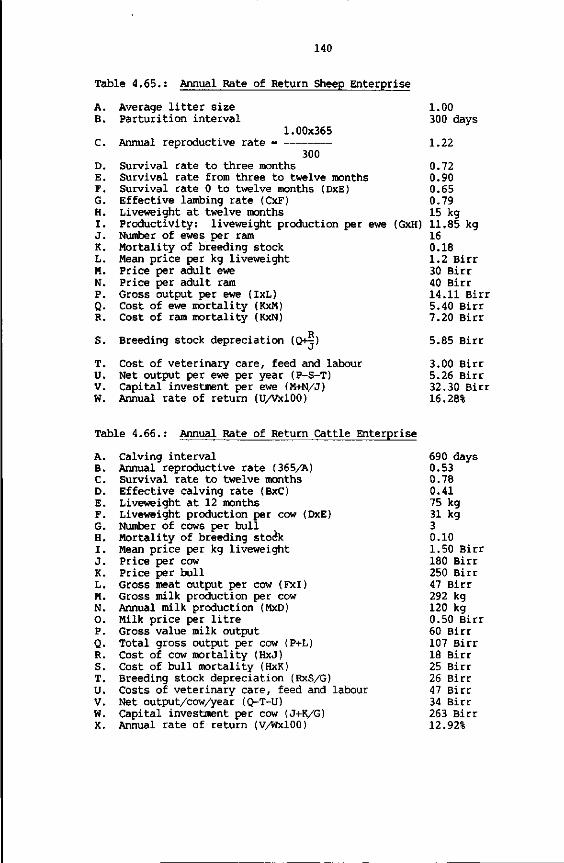
140
Table 4.65.: Annual Rate of Return Sheep Enterprise
A. B.
Average litter size Parturition interval
C. Annual reproductive rate 1.00x365
300 D. Survival rate to three months E. Survival rate from three to twelve months F. Survival rate 0 to twelve months (DxE) G. Effective lambing rate (CxF) H. Liveweight at twelve months I. Productivity: liveweight production per ewe J. Number of ewes per ram K. Mortality of breeding stock L. Mean price per kg liveweight M. Price per adult ewe N. Price per adult ram P. Gross output per ewe (IxL) Q. Cost of ewe mortality (KxM) R. Cost of ram mortality (KxN)
S. Breeding stock depreciation (0+-=)
T. Cost of veterinary care, feed and labour U. Net output per ewe per year (P-S-T) V. Capital investment per ewe (M+N/J) W. Annual rate of return (U/Vxl00)
(GxH)
1.00 300 days
1.22
0.72 0.90 0.65 0.79 15 kg 11.85 kg 16 0.18 1.2 Birr 30 Birr 40 Birr 14.11 Birr 5.40 Birr 7.20 Birr
5.85 Birr
3.00 Birr 5.26 Birr 32.30 Birr 16.28%
Table 4.66.: Annual Rate of Return Cattle Enterprise
A. Calving interval 690 days B. Annual reproductive rate (365/A) 0.53 C. Survival rate to twelve months 0.78 D. Effective calving rate (BxC) 0.41 E. Liveweight at 12 months 75 kg F. Liveweight production per cow (DxE) 31 kg G. Number of cows per bull , 3 H. Mortality of breeding sto<*k 0.10 I. Mean price per kg liveweight 1.50 Birr J. Price per cow 180 Birr K. Price per bull 250 Birr L. Gross meat output per cow (Fxl) 47 Birr M. Gross milk production per cow 292 kg N. Annual milk production (MxD) 120 kg O. Milk price per litre 0.50 Birr P. Gross value milk output 60 Birr Q. Total gross output per cow (P+L) 107 Birr R. Cost of cow mortality (HxJ) 18 Birr S. Cost of bull mortality (HxK) 25 Birr T. Breeding stock depreciation (RxS/G) 26 Birr U. Costs of veterinary care, feed and labour 47 Birr V. Net output/cow/year (Q-T-U) 34 Birr W. Capital investment per cow (J+K/G) 263 Birr X. Annual rate of return (V/Wxl00) 12.92%

141
Table 4.67.: Livestock Sales (1984)
Cattle Sheep Goats Equines Chicken
Jan-March
Total ruminants
Mean per holding
29 39
3 15
71
1.7
April
2
-June
22 63
3 2
10
90
.14
July-Sept
17 44 2 1 5
64
1.52
Oct-Dec
0
7 31
1
39
.92
Total sold
75 177
5 7
30
264
6.28
% of holding
27 41 90
6 22
Total purch.
18 29
3 41
Animals are sold according to the cash flow needs, and the opportunity of making profits. When farmers have to make major expenditures for either household of farm purposes, sheep or young cattle will be sold according to need. The sale of livestock is a selective process. Smallstock (lambs, sheep and goats) are sold first, then young cattle and equines, then cows, and in a final and desperate stage, oxen. This need for cash is usually to purchase foodgrain after poor harvests, for household expenditures, to buy farm inputs such as seeds, or to pay for social obligations such as wedding parties. Most sales take place from April to June.
Livestock is a risky form of capital, as it can be lost through the death of animals. The "edir" institution is an insurance system and serves to reduce the risk of loss for the individual farmers. "Edir" is a group of farmers who have committed themselves to mutual support for specific expenses. This may consist of the collection of a certain amount of money from the members in case one of them loses any cattle, or when one has expenses in connection with a funeral. The "edir" has a formal organizational structure, and has between 30 and 50 members. Most farmers also participate in "awchachin" agreements. This is an ox insurance system whereby the member-farmers contribute a certain amount of money when one of them looses an ox for accidental reasons.
4.10.4. Crop-livestock Interactions
In mixed agricultural systems, close interactions occur between the crop and livestock enterprises. The general nature of these interactions and the implications for farming systems research have been reviewed by Mclntire and Gryseels (1987). Linkages between both enterprises can be competitive for resources (e.g. land, labour and capital), or complementary (manure for fertilizer, draught power for crop production).
The strong positive correlation between cultivated area and livestock holding was already highlighted in section 4.5.2. This correlation was caused by the cumulative effects of draught power and feed availability. Although it was shown that the number of animals of

142
different species increase as the area cultivated increase, on a per hectare basis, the correlation is inverse. Small farms carried proportionally more livestock. Farms of less than 1.6 ha of cultivated land carried on average 743 kg/ha, those between 1.6 and 3 ha carried 593 kg/ha, between 3 and 4 ha 571 kg/ha, while larger farms carried 558 kg/ha. This higher stocking rate was reflected in all species (Table 4.68.).
Table 4.68.: Stocking Rates According to Cultivated Area (No. of Livestock/ Farm/Ha)
Groups of farmers Small cultivating Cattle ruminants Equines
Less than 1.6 ha (I) 3.74 5.30 1.57 Between 1.6 and 3 ha (II) 2.23 3.71 1.02 Between 3 and 4 ha (III) 2.01 3.64 1.02 More than 4 ha (IV) 2.26 3.86 0.99
Although the difference in stocking rate was highly significant (P<0.01) between Group I and the other groups, there was no statistically significant difference between Groups II, III and IV. This may indicate that farmers limit their livestock holding to feed availability and maximum stocking rate.
Table 4.69.: Mean Cultivated Area, Fallow Area, Pasture Area, and Productivity of Cereal Straws of Different Farmer Groups 1/
I II III IV (n=52) (n=109) (n=41) (n=16)
Mean area cultivated (ha/farm) 1.15 2.83 3.33 4.74 Mean fallow area (ha/farm) 0.56 0.88 0.95 0.91 Mean pasture area (ha/farm) 1.23 ' 1.76 1.23 1.94 Mean productivity cereal straw (kg/ha) 668 489 623 441
1/ Group I refers to farmers cultivating less than 1.6 ha, Group II cultivate between 1.6 and 3 ha, Group III between 3 and 4 ha, and Group IV more than 4 ha. The data are mean results for the period 1979-1983.
The higher stocking rate of Group I is caused by the greater feed availability (Table 4.69.). Farmers of Group I have proportionally much more land fallow than other farmer Groups. The ratio fallow area/area cultivated is 49% in Group I, 31% in Group II, 29% in Group III and 19% in Group IV. This is due to a lack of draught power and of labour availability. The ratio arable land (area cultivated + fallow land) to pasture area was 72% in Group I, 47% in Group II, 29% in Group III and 34% in Group IV. The shortage of draught power is illustrated by the mean ox holding of each Group: 0.39 in Group I, 1.38 in Group II, 1.60 in Group III and 2.56 in Group IV.

143
The average family size was 3.15 in Group I, 4.61 in Group II, 4.95 in Group III and 5.38 in Group IV. The availability of family labour increases thus with higher farm sizes.
In section 4.8., it was already illustrated that the dominant part of cash income originated from trade in animals and the sale of livestock products. The more animals farmers own, the higher their cash income and the higher the proportion that is derived from livestock production. Although grain sales increased with greater ox holdings, the overall contribution of crop products to cash income remained limited to less than 15% of farm production. The relation ox holding and grain sales is illustrated in Table 4.70.
Table 4.70.: Grain Sales by Ox Holding (Birr/Farm)
N of oxen owned
0 1 2 3+
1980
50 54 76
n.a.
1981
44 66 81
140
1982
0 52 57
114
1983
0 12 22 32
Table 4.70 clearly illustrates the strong correlation between ox holding and grain sales. In drought years such as 1983, almost no grain was sold.
Cash income is primarily used for the purchase of household items and clothes, but also to buy crop inputs. The only marketable crop inputs are seed, labour and mineral fertilizer. Seedgrain and labour are predominantly supplied by the farm and only a minor preparation is purchased. Farmers with more animals are more likely to use mineral fertilizer, because of their higher cash availability. Only 3% of farmers owning 0-4 livestock (Group I) use mineral fertilizer, but this increases to 61% in Group II (5-10 livestock), 61% in Group III (11-20 livestock) and 81% in Group IV (more than 20 livestock). As almost no fertilizer was used during 1984, this year was excluded from the tabulations (Table 4.71.).
Table 4.71.: Fertilizer Use by Livestock Holding
Quantity of fertilizer used % of farmers using (kg/farm)
Mean 1979 1980 1981 J982 1983 Mean 1979 1980 1981 1982 1983
I 3 12 25 0 0 0 47 50 45 - - -II 61 54 90 50 33 80 47 73 53 77 4 27 III 66 84 78 67 36 67 54 54 75 56 53 31 IV 81 89 78 90 67 81 61 83 79 47 42 54
The quantities of mineral fertilizer applied by those farmers using it, were not significantly different between farmer groups.

144
Farmers with larger livestock holdings also hired significantly more labour for crop production. Farmers of Group I hired on average only 2 Birr/year of labour for crop production, farmers of Group II and Group III for 7 Birr/year, while farmers of Group IV annually hired for more than 15 Birr of labour.
As a result of the greater fertilizer use, farmers owning more animals generally had higher crop yields, although the effect was not significant for all years. Figure 4.18. illustrates the indirect effects of livestock holdings on the productivity of barley, which is the major crop. The effect was significant in 1979, 1980 and 1982 (P<0.5). During 1981 and 1983 frost reduced crop yields considerably and the positive effects of fertilizer use were greatly diminished.
Figure 4.18.: Mean Crop Yields by Livestock Holding
1200
1979 1983
0 to 4 livestock
5 to 10 livestock
11 to 20 livestock
>20 livestock
As livestock holdings increase, manure production increases also. A substantial portion is dried and used as fuel, while most of the remainder is sold. Although quantitative evidence is not available, discussions with farmers indicated that surplus manure would be used as fertilizer on the aredda productive land. In fertilizer trials

145
throughout the Ethiopian highlands, NFIU (1987) found strong grain yield responses to relatively low (10 tonnes/ha) manure applications.
4.11. Major Constraints to an Increase of Farm Output
4.11.1. Introduction
Farmers in the Baso and Worena Wereda are subsistence oriented and their overall objective is to produce sufficient food to daily feed their family. They generally possess a high level of traditional agricultural skills, and use their resources effectively. Farm productivity is very low, when compared with that obtained in similar ecological zones elsewhere in the world primarily because of the lack of technical progress. Farmer practices have remained basically unchanged for centuries.
In previous sections it was shown that during normal years just sufficient food is produced to fulfill the subsistence requirement. When crops production fails, farmers become highly dependent upon the sale of livestock to generate sufficient cash to purchase foodgrain for the family. Livestock are sold selectively, according to the role they play in farm production. If crop failure occurs on a regional scale, the farmers' terms of trade will rapidly worsen, as the prices on the livestock market collapse due to oversupply, while grain prices increase sharply because of the accelerated demand and the limited amount of grains on offer. If such a situation is prolonged, this process ends in destitution when the farmer and his family are forced to leave their homesteads in search of assistance elsewhere.
During the widespread drought and famine of 1984-85 this process was common throughout the northern Ethiopian highlands (Gryseels and Jutzi, 1986a). Although Debre Berhan was also affected by drought, it did not have the famine consequences faced by other areas of the country. Although grain prices increased sharply livestock prices kept relatively stable due to the vicinity of Addis Ababa where incomes had not been affected by drought, and the activities of traders who purchased oxen, speculating on substantial profits once the drought would be finished.
The production system in the Wereda is fragile, and the ability of farmers to produce sufficient food for their family will come under increasing pressure. The rapid population growth of 2.8% p.a. (FAO, 1986d) that occurs in the Ethiopian highlands, leads to diminishing farm sizes, encroachment of cropping land into grazing areas and other less fertile areas, and a lessening of the ability the sustain food production. Given their low cash incomes, farmers lack investment capital for major improvements in the productivity of their crop land as for example through irrigation.
Low cost ways and means need to be found to increase to productivity of this smallholder farming system to enable food production to keep pace with population growth. Such an improvement in the system is at present constrained by a number a factors that limit the productivity of both the crop and livestock enterprise. These factors are listed in the following sections. They were identified through our own analysis of the farming system, and individual discussions with farmers and officials of PAs.

146
4.11.2. Factors Limiting the Productivity of Crop Enterprises
Low Soil Fertility and High Rates of Erosion of Slopy Lan3
On the slopes, soils are strongly deficient in nitrogen and phosphorus. Of the arable land, around 30% is continuously kept as fallow while an additional 20% is kept under pasture. Long fallow periods, often between 3 and 15 years, are common. The length of these fallows is gradually reducing, reflecting population growth. In the absence of frost or hailstorms, crop responses to phosphorus fertilization can be substantial.
The rates of erosion are high, and caused by the rapid rate of deforestation. The effects of wind and water erosion are particularly devastating.
Poor Drainage of Vertisols
About 70% of the cropland in the Wereda is on soils with vertic properties. These soils have a high clay content and are fertile, but they are prone to waterlogging and difficult to plough. Because of the waterlogging problems the choice of crops is restricted to relatively low yielding species and land races tolerant of surplus moisture. The problem of waterlogging also causes the farmer to keep a substantial part of his land as pasture because of the difficulties in growing food crops.
Hail and Frost, and Short Growing Season
Hailstorms occur frequently during June and July, at which time most crops are planted. This often affects germination rates and the early growth of the plant. Farmers then either have to plant again, or they will suffer greatly reduced yields.
Night frosts occur frequently from October to January, the harvest period, severely affecting yields. The low yields of 1983 (net grain yields less than 300 kg/ha) were almost entirely due to frost.
The incidence of frost and the long dry season restrict the plant growing period to a maximum of 120 days.
High Seed Rates
Seed rates vary between 150 and 260 kg/ha for the major crops. This is substantially higher than the recommended rates (IAR, 1979). The high seed rates are due to the stony nature of the land, the incidence of birds and rats, as well as hail storms, and the practice of seed broadcasting rather than row planting. As a result, a farmer uses on average 350 kg or 20% of his total production for seed purposes.
Crop Pests and Insect Attacks
Insects such as aphids cause considerable damage to wheat and barley. The main crop pests are chocolate spot, rust and smut.

147
4.11.3. Factors Limiting the Productivity of Livestock Enterprises
Livestock Functions and Farmer Objectives
Livestock productivity in the smallholder farming system of the Debre Berhan area is low for final outputs such as milk and meat, but high in terms of intermediate products such as draught power, investment and security, transport and fuel. The principal constraint to the development of livestock production with the aim of increasing offtake of meat and milk, is the importance given by the farmers to these intermediate products.
Cattle are the dominant species of the herd (57% of the mean TLU holding) and the farmers breeding objective for cattle is to produce oxen for crop cultivation. Oxen constitute 20% of the cattle herd, the rest are back up stock that form the reproductive apparatus. Immatures make up to 46% of the cattle herd. Only 24% of the cattle herd are milking cows and offtake for meat was only 9% per annum.
Small ruminants have a higher offtake rate because of their role as cash generators and their higher rate of reproduction. They are however only 22% of the TLU holding. Equines provide transport only, while they are 21% of the TLU holding.
Consequently, the mean annual output per farm is 240 kg of meat and 123 kg of milk. For this calculation an offtake rate of 9% for cattle and 34% for sheep, a milk production of 292 kg per lactation and an effective calving rate of 42% was assumed.
Per TLU of 250 kg, the mean annual output of final products is therefore only 31 kg of meat and 16 kg of milk. The corresponding figures for Tropical Africa as a whole are 18.5 kg of meat and 56 kg of milk. Meat production for unit TLU is considerably higher, and milk production substantially lower in the Wereda compared to elsewhere in Africa.
The dominant farmer objective is to fulfill the subsistence food requirement of his family. The staple food consists of cereals and pulses and the intermediate functions of livestock, i.e. to serve as an input in the crop enterprise, are therefore of overwhelming importance to the farmer. The productivity of livestock in these intermediate functions is more related to numbers than to output per unit animal. Jahnke (1984) illustrated this well by stating:
"Two lean oxen can be used for ploughing by the traditional method, one fat one is useless. The farmer who owns two small sheep can sell one in times of strife and is still left with one unlike the farmer who only owns one big sheep. Two small donkeys transport almost twice as much as one big one. The more animals are kept on the grazing during the day the more manure can be collected in the evening."
As a result farmers will build up their herd and flock size to maximize the fulfillment of these intermediate functions. Most grazing is communal and there is no limit to the number of animals a farmer can bring to the pasture. As Jahnke (1984) points out "the larger an

148
individual's herd the larger the benefits to himself, while the decrease in productivity due to overgrazing is shared by all." The optimum carrying capacity of pastures is almost continously exceeded, and improvement of pastures or of animal productivity is very difficult, if not impossible, under this land tenure system.
The inherent tendency for overgrazing increases the relative dependence of farmers livestock upon cereal crop residues and stubble, as individual livestock holdings increase.
The dominant importance of the intermediate functions of livestock, and the inherent tendency of farmers to increase their livestock holdings beyond what available feed resources allow for other than maintenance requirements, is the major constraint to the improvement of the productivity of milk and meat per animal.
Inadequate Availability of Draught Power
The number of oxen owned is a strong determinant in smallholder grain production, through the effects on area cultivated and grain yields per hectare. About 52% of the farmers do not own the two oxen presently required for cultivation and are dependent on renting or exchange arrangements to obtain additional oxen for cultivation. Minimum power cultivation systems are therefore to be developed, that reduce the dependence upon draught animals available.
Animal Nutrition
There are severe shortages of animal feed at the end of the dry season and the beginning of the main rains. The most critical months are from April to June, when virtually no grass is left on the pastures, and when the rains have not yet stimulated plant growth. The farmer's stocks of hay and straw are almost depleted, while feed demands peak during this period of ploughing and seedbed preparation. The lack of feed combined with high energy demands results in rapid weight loss of draught animals during this period. There is no conclusive evidence however that this weight loss results in reduced power output (Astatke et al, 1986b).
Feedstuffs at Debre Berhan (pasture, hay and straws) have a low digestibility of between 40 and 50%. The conversion efficiency of feed into liveweight gain is low. Protein levels are well below the requirements. Almost all feed is used for maintenance requirements and very little is available for production. This nutritional stress causes low growth rates, poor fertility and high calf mortality. It is necessary to develop technologies that increase feed and protein availability during the dry season, and improve the digestibility of local feedstuffs. An improvement in the quality of crop residues would increase crop-livestock interactions.
Low Genetic Potential of Zebu Breed
Average milk offtake of Zebu cows at Debre Berhan is only 292 kg for a lactation of 6 to 7 months, and with a calving interval of 22 months. Studies at the Institute of Agricultural Research (IAR, 1976) have indicated however that even with improved feeding practices, productivity will increase only marginally. The introduction of higher yielding breeds has to be considered.

149
Animal Health
The major animal health problems constraining animal production are parasitic diseases, causing substantial production losses, particularly in young stock. Liverfluke particularly is thought to be responsible for about 50% of mortality of sheep. It also affects milk production, draught power output, fertility and growth. Cheap health packages and appropriate management strategies are necessary to alleviate this important constraint.
Marketing
All control farmers are members of the Christian Orthodox church, which observes at least 140 fasting days each year, during which consumption of animal protein except fish is prohibited. As meat, and milk offtake are presently low, there is no serious marketing constraint at present. However, if output of milk and meat were to increase considerably, marketing problems would occur. The development of small scale and low cost processing technologies would then become a necessity.
Low Reproductive Performance
Calving intervals of local cows average 22 months, while lambing percentages average 119%. These are low compared to results obtained on-station (IAR, 1976). Through improved feeding and health practices, reproductive performance could increase considerably.
4.11.4 Institutional Constraints
Land Tenure
Ethiopian smallholder farmers have users' rights, not owners' rights over the land they till. They do not have security of ownership, and have no guarantee that they will next year have access to the same land they till this year. As a result, farmers are discouraged to invest in land improvements. A greater security in land tenure is necessary. Pastures are mostly communal and access for grazing is restricted to animals of farmers belonging to that particular association. This creates an inherent tendency for overgrazing, as farmers cannot "herd around" and try to find higher productivity pastures in other PA's.
Price Policies
Government market intervention reduces the amount of grain farmers can sell at free market prices. At present, less than 5% of farm production of the Baso and Worena Wereda is sold to AMC at official government prices. If the government were to increase this share however, farmers may be discouraged to produce above subsistence needs.
Socio-cultural Constraints
Farmers in the Wereda are members of the Christian Orthodox church which observes around 180 religious holidays during which it is not allowed to work on the land, in addition to the 140 fasting days during

150
which reduced energy intake occurs. In crop production, the effects of this labour constraint are particularly strong during August and September, resulting in almost total neglection of weeding.
Since the socialist resolution of 1974, farmers also have to fulfill communal obligations for at least 2 days each week, which reduces the amount of time they have available for farm work. During 1984 and 1985, the government launched a villagization program which further reduced the amount of time farmers had available for agricultural labour.
When evaluating new technologies, their labour requirements therefore need careful consideration.

151
TECHNOLOGICAL OPTIONS FOR ON-FARM VERIFICATION
5.1. Introduction
Technological change is the basis for agricultural development. To overcome the major constraints to increasing the productivity of a smallholder farming system, new technology, which reduces the cost of output per unit of input, is to be introduced. Production technology can be defined as "all methods which farmers, market agents and consumers use to cultivate, harvest, store, process, handle, transport, and prepare food crops and livestock for consumption" (Horton, 1986). New farm technology either has to be developed, or already exists elsewhere and can be transferred, eventually after modification to suit local conditions. In order to ensure the generation of appropriate technology for a particular subsistence farming system in a target area, several major general concerns have to be met. The new technology must address a priority problem as perceived by the target farmer, it must be low-cost and simple to use, it is to help overcome a major constraint to increasing farm output and it has to be compatible with overall government objectives for the particular area and farm population. The suitability of a particular technology for large-scale dissemination can be determined through an ex ante appraisal, followed by on-farm verification. Both these steps are necessary in order to minimize the risk of failure and wasted efforts associated with attempts to introduce inappropriate technology. As FSR studies have a high degree of location specificity, efforts must be made to ensure that technology tested has a wide applicability throughout the target zone or can be easily adapted to local conditions (Menz and Knipscheer, 1981).
In the choice of improved technology for the Baso and Worena Wereda, adequate attention was also given to a number of other important concerns. As farmers were subsistence oriented, innovations had to improve the efficiency of resource use without jeopardizing the reliability of food supply. Land was scarce and its distribution was under the control of the PA, so individual farmers did not have the capacity to increase the size of their land holdings. The incidence of frost during the period that crops are maturing severely limited the technological options to improve crop production in the area. As ILCA's mandate was to improve livestock production, the choice of improved technology had to be oriented to that particular sub-system. In addition, given the international nature of ILCA's work, any technology choosen would also have to be of relevance beyond the study area to other areas of the highlands. The linkages between the various components being researched by ILCA are illustrated in Figure 5.1.
The low cash incomes of the farmers necessitated innovations with limited cash requirements. Similarly, cultural restrictions on labour utilization highlighted the need for innovations which did not create additional demand for labour, particularly of adult males, during the peak periods of June-July, and October-December. In order to be relevant, innovations would have to help to overcome one or more of the constraints discussed in Section 4.11. The choice was limited to those innovations which did not require a radical change of existing management practices, and were profitable given existing market prices. As

152
discussed in Section 2.2, it was felt that innovations could only be introduced successfully if they involved only a gradual change from existing farming practices.
Figure 5.1. Linkages Among the Principal Components Being Researched by nong ighlj the ILCA Highlands Programme
Increased or more timely
traction power
Use of better
implements
Improved and more timely cultivation
Lower labour requirement for weeding
Larger or fewer oxen
Expansion of crop cultivation
into wet bottomlands
Increased manure
production
Higher yielding and
larger cows
Improved animal feed
supplies
T~T
Improved farm productivity
Higher cash
income
Improved soil
fertility
Increased human food
supply
Widened rotation, production of forage crops
Source: Adapted from Gryseels and Anderson (1983a)
Technologies relevant to the livestock component of the farming system would for these reasons have to relate to an increase in genetic potential of local breeds, an improvement in the efficiency of draught power usage, improvements in feed availability and/or animal nutrition, ways to overcome marketing problems, or strategies to reduce liverfluke infestation. The main target species had to be cattle and small ruminants because of their importance to the farming system and their relevance to ILCA's work. In the choice of a technology, particular emphasis had to be given to the opportunities to enhance crop-livestock interactions in the farming system.
153
5.2. An Overview of Possible Interventions
5.2.1. Draught Animal Usage
The use of draught animals is common throughout the Ethiopian highlands, where it has been a traditional practice for many centuries. As indicated in earlier sections, between four and six million draught oxen, and about four million donkeys can be found in the country. The use of animal power is limited however to land cultivation, threshing and for transport of goods. Animals are rarely used for alternative functions.
Efforts to improve draught animal usage in the Ethiopian highlands focused initially on the development of implements to replace the "maresha" by more efficient primary cultivation tools. These attempts were undertaken by FAO during the '50s, by the Chilalo Agricultural Development Unit (CADU) during the late sixties and early seventies, and by ILCA in the early eighties (CADU, 1970a and 1971; ILCA, 1982b; Astatke and Matthews, 1981, 1982, 1983 and 1984). Most of the efforts related to the design and testing of mouldboard ploughs. In contrast to the "maresha" which only breaks the soil, mouldboard ploughs invert the soil, and cultivate at a much greater depth. ILCA trials showed that cultivation time could be reduced by up to 50% when the "maresha" was replaced by a mouldboard plough (Astatke and Matthews, 1983 and 1984). Crop yields were not significantly different as a result of better cultivation. Unfortunately, the experimental design of these trials did not allow for an assessment of yield effects of early planting dates, as these were similar for all trials. The impact of faster cultivation was therefore not adequately assessed. Other tillage implements tested were harrows and spring-tine cultivators. None of these implements were adopted by farmers at any scale (Dejene, 1985 and 1987). They were too expensive and not within the means of cash poor farmers. In addition, they were too heavy to be pulled by oxen of local breeds, which under farm conditions have average liveweights of between 230 and 300 kg. Such oxen develop insufficient draught power to operate heavy metal implements efficiently. The implements were also difficult to maintain and the advantages of faster and more efficient cultivation did not outweigh the costs involved.
ILCA experimented also with the use of animal drawn metal mouldboard ploughs for improving drainage on waterlogged soils. Various drainage treatments were tested, including the use of ridge and furrow, ditch and dyke, and a combination of both (Gryseels and Anderson, 1983a). Crop yields increased considerably as a result of surface drainage, but the cost of the implements used far exceeded the additional return generated by the higher yield. In addition, for these experiments ILCA used crossbred oxen which are larger and more powerful than oxen of local breeds, as the latter had insufficient draught power capacity. The effects of improved surface drainage on crop yields was also demonstrated by Abebe (1982).
Jutzi et al (1987a) have recently developed modifications of the traditional Ethiopian plough for making raised broadbeds and furrows to facilitate surface drainage on heavy clay soils (vertlsols), and for use in the construction of terraces for soil conservation. Both implements

154
can be drawn by a pair of local Zebu oxen. For the Debre Berhan area the broadbed and furrow technology is of particular importance as it facilitates weed control and enhances surface drainage, resulting in better crop growth. Raised broadbeds (20 cm higher and 120 cm apart) and furrows can be made at a rate of 0.4 to 1.2 ha/ox-pair working 7 hours a day. The yields of wheat and teff grown on drained farmers' fields in the Debre Zeit area were about 80% and 25% higher respectively than those on traditionally cultivated, flat land (Jutzi et al, 1987b). At Debre Berhan, the drainage effect of the broadbed and-furrow system allowed to more than double the dry matter production of Italian ryegrass and oats (Jutzi and Haque, 1984). The broadbed and furrow technology is presently being tested in a national-wide verification programme undertaken by ILCA in cooperation with IAR, the Ministry of Agriculture, Alemayah University and ICRISAT (Jutzi et al, 1987 b). A large scale extension programme is in preparation. The project is a model of interinstitutional cooperation between national agricultural research and development institutes and international centres (Jutzi and Abebe, 1987). If successful, the project may have a dramatic effect on food production in Ethiopia. Vertisols cover about 8 million ha in the Ethiopian highlands and comprise 18% of all arable soils. Although they are potentially very productive soils, they are prone to waterlogging and difficult to plough (Debele, 1983). Of the 8 million ha of highland vertisols, only 1.9 million ha are currently cropped. The remainder are mainly under native pasture. Because of waterlogging, crops on vertisols are usually planted towards the end of the rains and the major part of the crop growth then occurs on the residual moisture stored in the soil. The keys to increased food and feed production from vertisols are effective surface drainage and early crop planting in the rainy season so that the full length of the growing period can be exploited (Jutzi and Goe, 1987).
Constraint analysis of the farming system in the Baso and worena Wereda reported upon in this study showed the strong impact of the availability of draught power on smallholder grain production. A shortage of draught oxen is a critical constraint throughout the Ethiopian highlands (Ministry of Agriculture, 1980; Dejene, 1985). As a result efforts were made by ILCA's highlands programme to develop minimum power systems for crop cultivation. Particular consideration was given to the design of a single-ox plough. Such a plough would enable farmers which owned only one ox to cultivate land with their own resources, and to reduce their dependency upon borrowing or renting agreements to obtain the two oxen hitherto needed for cultivation. In due course, such a single ox plough was developed by ILCA's highland programme and the results obtained on-station warranted the initiation of on-farm verification trials (Gryseels and Astatke, 1982).
In addition to the development of low power input cultivation systems, the ILCA highland programme also tried to find alternative uses of draught animals. It had been shown that oxen were only used 50 to 70 days a year for draught power purposes, primarily ploughing and threshing. If alternative uses could be found for these animals, it would raise their productivity, resulting in improved farm profitability and a higher intrinsic capital value of the animals (Anderson, 1983).
ILCA focused its efforts on the use of draught oxen for pond excavating. Although water shortage was not a critical constraint as such to farm production in the Debre Berhan area (Steinfeld, 1984), ILCA

155
felt that the availability of water supplies for both livestock and the farm household was a major problem in many other areas of the highlands (Bishaw and Gebre Medhin, 1983). An improvement of water supplies would also be necessary to enable the introduction of higher yielding and exotic livestock breeds. The soils and topography of the highlands were well suited to smallscale dam and pond construction (ILCA, 1983b). The Debre Berhan area was chosen as a pilot area for the development and testing of improved technology for this activity. Prior attempts to construct ponds in the Ethiopian highlands by the Ministry of Agriculture had made use of engine driven machinery, or of hand labour only. Given the heavy nature of most Ethiopian soils, the latter method involved excessive human drudgery. The use of tractors and other engine driven machinery was costly, and the equipment difficult to find and to maintain.
ILCA therefore introduced animal drawn metal scoops with a nominal capacity of 0.15 m3, a size matched to the draught power available from paired working oxen of indigenous breeds. The cost of a scoop ranged from 200 to 300 Birr. During 1983, a 7,000 m3 pond was excavated at the Debre Berhan research station to determine the technical parameters of the scoops drawn by oxen. A pair of oxen could excavate an average of 10 m3 of earth during a six and a half hour working day (Abiye Astatke, 1984). The power requirements of these scoops were similar to those of a "maresha" plough. The cost of pond excavation using draught oxen averaged 1 Birr/m3, which compared favourably with a cost of 5 Birr/ m3 for fuel engine equipment (Anderson, 1983).
Farmers of the Baso and Worena Wereda showed enthousiastic interest in the pond technology during field days organized by ILCA at the Debre Berhan station. Members of the Kormargfia and Faji and Bokafia PA's agreed to cooperate with ILCA and extension agents of the local Ministry of Agriculture in a pilot programme of pond construction. Work on one pond in each of these PAs begun in the 1984 dry season, a year during which severe drought substantially reduced animal feed supplies available. The work was therefore halted because farmers were concerned that by working their oxen on the pond they would subsequently be less fit to undertake the primary task of land cultivation at the end of the dry season. Work restarted however after the harvest in December 1984 and both ponds were completed by March 1985. One pond was completed in 79 and the other in 76 working days. Both have a capacity of approximately 7,000 m3 each (ILCA, 1984). Individual farmers of the PAs concerned worked on the ponds with their oxen for an average total of 17 days, and, on average, each farmer only once every seven days. There was no conflict with the labour requirements of other farm activities (Whalen and Anderson, 1985). During the subsequent rainy season, the ponds rapidly filled with water mainly through runoff.
The ponds were intended to serve various purposes: to provide drinking water for both the household and livestock, to stock with fish in order to provide an additional protein source, and to irrigate small areas of high return crops.
To date farmers have used the ponds only for household and livestock water needs. So as to preserve the water quality, the water is hand-pumped into a water-through from which the animals can drink. Animals are not allowed to drink directly from the ponds, in order to

156
avoid them polluting the water. The ponds are protected by fences, and trees have been planted around the ponds. Household water is collected using jars and transported to the homestead by children carrying these jars on their backs or using donkeys.
Fish consumption is at present too new a cultural practice for the rural population at Debre Berhan, and the stocking of ponds will therefore be undertaken at a later stage. The irrigation of crops using pond water is not yet a feasible option. The size of the ponds is insufficient for the water needs of land irrigation. In addition, irrigation requires a low cost system to transfer the water to the fields. Further investigations are necessary. These need to center on ways of releasing water from the pond to the field by gravity, and on the water needs of strategic, rather than year-round irrigation inputs. Possible options for the latter would be to extend the growing period of grain crops by bridging the gap in growing conditions between the "belg" rains and the "meher" rains, or alternatively, by extending the growing season at the end of the main rainy period to ensure adequate grain development, or by ensuring adequate water supplies for a short season crop in the dry season.
The Ethiopian Ministry of Agriculture has given strong support to a dissemination of the scoops technology, and by the middle of 1987 approximately 3,000 scoops had been disseminated throughout the country to interested PAs (ILCA, 1987b). ILCA has produced a technical manual for building ponds with animal power (Astatke et al, 1986a).
As pond construction is only feasible at the PA or communal, rather than the smallholder level, if falls somewhat outside the scope of this study.
Very little research has been carried out in Ethiopia on the development of the transport function of livestock. Some efforts were undertaken by CADU on the development of ox and donkey carts (CADU, 1970a) but they were too expensive and not adopted by farmers (Dejene, 1985 and 1987). One possible intervention would be the use of sledges which may be more appropriate for the rugged terrain of the Ethiopian highlands but to date no effort has been reported in this field.
5.2.2. Improved Breeds
5.2.2.1. Cattle
Cattle of indigenous Zebu breeds are considered to have a low genetic potential for milk and meat production (Glenn et al, 1963; IAR, 1972 and 1976; ILCA, 1981c; Schaar et al, 1981; AACH, T58T; Ministry of Agriculture, 1986c). IAR particulaFIy~nas undertaken several studies to assess the characteristics and potential of four types of Zebu cattle, i.e. Borana, Horro, Barka and Fogera. The assessments were made on growth rate, reproductive performance and production potential for meat and milk. Even with improved management, the average milk yield of each of these breeds did not exceed 700 kg per lactation (Kebede, 1987).
As it was considered that improvement through selection would be too costly and too lengthy a process in Ethiopia, research and development efforts focused on the introduction of higher yielding breeds and crossbreeds. The first exotic breeds were imported into the country

157
in the 50s by mainly commercial dairy farms located around Asmara and Addis Ababa. Pure exotic animals required too high a management level for smallholders, and experimentation soon started with the use of crossbred cattle. The first efforts to introduce crossbred dairy cattle (using mainly Friesian but also Jersey sires and Arssi Zebu breeds) were undertaken by CADU (CADU, 1970b; Branning et al, 1980; Schaar et al, 1981; Swensson et al, 1981). Results of tHi Breeding work indicated mean milk yields of HÜ9~kg for a lactation length of 272 days for the Arssi Zebu breed, while the crossbred cow yielded 2,374 kg in a lactation period in 411 days (Kiwuwa et al, 1983). The project was a combination of both scientific experimentation and on-farm development work. The programme made a substantial impact in Arssi province, and today over 5,000 crossbred dairy cows can be found in the area. Unfortunately only very few farm management and economic data are available to appraise the impact of these dairy cows on farm productivity. Since the phasing out of CADU, the Ethiopian Government has focused its efforts on the development of dairy production in the area on cooperative farms. Almost all crossbred dairy heifers from government ranches are supplied to cooperatives.
IAR started a long-term breeding programme in 1972, comparing the productivity of different exotic breeds for different levels of crossing under different environmental conditions (IAR, 1972 and 1976; Kebede, 1982).
Other institutions involved with crossbreeding activities were the College of Agriculture at Alemayah, and the agricultural schools and colleges at Jimma, Ambo and Debre Zeit (Wagner et al, 1969b; Debre Zeit Agricultural Research Station, 1982).
The Ministry of Agriculture through its Animal Resources Department has also promoted dairy production through crossbreeds. The Addis Ababa Dairy Development Project, was financed by the World Bank and implemented between 1972 and 1978. Most of the farms involved were commercial in nature, and were later nationalized. The activities were disrupted through uncertainties associated with the post-revolutionary period (World Bank, 1985a). A financial analysis of some of these project farms (Gryseels, 1979) indicated that small farms had lower production costs than the larger commercial farms. Although several efforts were thus undertaken to introduce crossbred dairy cows on smallholder farms, farm management data to assess their productivity and impact on farm income are scarce.
Efforts to introduce improved breeds on smallholder farms in the Ethiopian highlands have focused on dairy production. There are as yet only few activities to improve beef production. IAR does not have a clearly defined beef cattle research programme, although some beef production studies have been undertaken. Borana cattle have been identified as being the local breed with most potential, but the development of a national research programme has been impeded by the lack of national policy guidelines and coordination (Gebrewold, 1987; Jepsen and Creek, 1971; Obradovic and Haile, 1971). IAR has undertaken some studies to evaluate weight gains of local breeds under different feeding conditions, in which gains of up to 0.9 kg per day were recorded. Feed conversion efficiency calculated as kg of feed consumed per kg of liveweight gain was 11.9 kg for Borana and 12.7 kg for Arssi (IAR, 1976). Some research was also undertaken on the productivity of crossbreds for beef production (Wagner et al, 1969a; IAR, 1976).

158
Although results indicate that substantial productivity gains can be made, no efforts were made to introduce beef production at the smallholder farm level. This is because in the Ethiopian highlands no breed is kept exclusively for beef production, which is for smallholders only a secondary activitiy. In addition, available prices and price ratios have not been conducive for the introduction of improved beef production. Beef prices in Ethiopia range uniformly around 1.5 Birr per kg liveweight, with no premium for quality.
Farmers will occasionally fatten an old cow or ox for sale around particular festivities, but no systematic effort has yet been undertaken to assess the profitability of such fattening activities. Smallholder beef production exists to some extent in Hararghe province, but this situation is very location specific because of the particular ecology, breed and marketing situation of the area.
ILCA has evaluated the use of crossbred oxen for draught purposes. The use of crossbred oxen would be linked to the prospect of widespread introduction of dairy enterprises using crossbred cows (Gryseels and Anderson, 1983a). Male offspring would be reared as draught animals. Crossbred oxen can develop substantially more draught power, but also have higher feed requirements. This is illustrated in Table 5.1.
Table 5.1. Draught Power Developed and Feed Consumed by a Pair of Local and a Pair of Crossbred Oxen 1/
Average Draught Ox Mean Weight Speed Force Draught Power- Hay Concentrates
Breed (kg/ox) (m/sec) (kg) Developed (kW) (kg/ox) (kg/ox)
Local 337 .75 84 .63 7.4 2.8
Cross 523 .92 110 1.02 11.1 4.9
1/ Measurements were made during ploughing for pond construction with a 'maresha'. The animals were ILCA oxen from the Debre Berhan Station. Speed and draught power developed were estimated on a per pair basis, while weights and feed intakes were estimated on a per head basis. The hay had 6.8 megajoules (MJ) of metabolisable energy (ME) per kg of dry matter (DM), and the concentrates had 10.1 MJ of MEAg DM. The DM fractions were .90 for hay and .85 for concentrates. Animals were fed ad libitum.
Source: Adapted from Astatke (1984).
Draught power output of crossbred oxen has been reported by Astatke (1984). At the ILCA research station in Debre Berhan, weights of crossbred oxen were on average 55% higher than those of oxen of local breeds. When pulling the local 'maresha' plough, crossbred oxen developed 23% higher speed, 31% higher draught force and 62% more draught power. They also consumed 50% more hay and 75% more feed concentrates however (Table 5.1.). Recent evidence has indicated that local oxen

159
appear to have lower energy needs than crossbreds (Soller et al, 1986) and that breed has a significant affect on force but not on power (Astatke et al, 1986). To date an economically viable system of using crossbred oxen for draught at the smallholder level has not yet been developed.
5.2.2.2. Small Ruminants
Although Ethiopia has one of the largest herds of small ruminants in Africa, relatively little research has been undertaken to improve the productivity of its breeds. As goats can be found mainly in the lowlands, they fall outside the scope of this study.
Sheep are mostly concentrated in the highlands, and Shoa province alone accounts for 29% of Ethiopia's sheep population (AACM, 1984). Many breeds have been identified although highland sheep are typically fat tailed. Most of these are of the Menz breed, but other breed types are the Abele Guzai, the Rashaidi, the Tueur and the Arssi-Bale. Only at very high altitudes is a wooly undercoat developed beneath the outer hairy covering (Ministry of Agriculture, 1975).
Little is known regarding the productivity of local sheep breeds. In 1975, IAR initiated a research programme to study the performance characteristics of some of the domestic breeds in the country. Flocks were established on experiment stations and the major productivity parameters measured (Wiener, 1975).
The Ministry of Agriculture in 1971 established a sheep breeding station at Debre Berhan, at which Menz and Awassi breeds are being crossed with exotic animals of Merino, Hampshire, Cowedale and Romney breeds. Crossbred rams are being produced and distributed to producer cooperatives throughout the country. By 1982, approximately 800 crossbred rams had been distributed, but most farmers reject crossbred sheep. They do not like the flavour of its meat, its colour and its conformation (AACM, 1984). ARDU has also undertaken experimentations on crossbreeding of sheep and studies on the performance of local breeds, particularly Arssi.
The impact of sheep crossbreeding programmes has been almost nil, and it is now acknowledged priority should be given to selection programmes among indigenous breeds, and strategies to improve the nutrition of small ruminants (Awgichew, 1987). Sheep research efforts in Ethiopia have been little, uncoordinated and not sustained over long periods of time (Agyemang, 1985). As almost no research had been undertaken on the productivity of the dominant sheep breed in the highlands, i.e. the Menz, ILCA initiated in 1979 studies to fill this gap. Information was collected on their reproductive and productive performance, and simple management innovations such as improved housing, strategic drenching against liverfluke infestation, and supplementary feeding in dry periods were introduced (Agyemang et al, 1984). The analysis of the data showed that, with the exception of the twinning rate, productivity parameters of Menz sheep were similar to those of other sheep breeds in the country (Agyemang, 1985).
Although the initial results obtained at the Debre Berhan experiment station with improved housing and drenching were encouraging, it was felt by ILCA that it was too early for on-farm follow up

160
verification trials. The improved housing was too expensive for resource poor farmers, and the drugs needed for drenching were not regularly available in the country. ILCA is continuing its research on sheep productivity in cooperation with the Ethiopian Ministry of Agriculture. The research programme focuses on the incidence of multiple births, a selection programme for rams and strategies to improve nutrition (ILCA 1986, 1987b).
5.2.3. Animal Feed and Nutrition
The main animal feed resources in the highland farming system are roughage from natural pasture and browse, and crop residues. Their relative importance in overall feed intake is largely a function of human population pressures on available land (Jutzi et al, 1987c).
Pasture research was initiated in Ethiopia in the mid 60s (Gebrehiwet, 1987). Many agronomic and management trials have since been conducted, but results are inconclusive and to date no technology suitable for smallholder conditions has been developed. In the Baso and Worena Wereda, as in many other highland pastures, the slow growth is due to waterlogging and low temperatures. Many studies have focused on response of pasture growth to fertilizer application. The application of nitrogen significantly increased dry matter yield, while the application of phosphorus improved protein content (IAR, 1982a and b; IAR, 1983; Haile, 1983). The cost of fertilizer application and unfavourable benefit-cost ratios, causes this technology to be beyond the means of the smallholder however.
ILCA has investigated the effects of forage legume oversowing and soil ripping to improve aeration and accelerate nutrient mineralization on an Andropogon longipes pasture at Debre Berhan (ILCA, 1982a). No effects on yields or quality have been recorded. According to Jutzi et al (1987c), this can be seen as evidence of the ecological stability öï these natural pasture environments. The same authors also investigated the effects of overgrazing on pasture yield, using pot experiments. It was shown that overgrazing, simulated through frequent offtakes, drastically reduced dry matter production. Inputs of nitrogen fertilizer could not be transformed into higher biomass production by the grasses if they were exploited too heavily.
Jutzi et al (1987c) concluded that:
"Native pasture is generally confined to soils with rather severe contraints for plant growth. The grassland vegetation has adapted itself to these specific conditions. No evidence has yet been produced that exotic germplasm performs better than these highly specialized pasture communities unless major changes in the physical or chemical conditions of these soils are undertaken (such as drainage or heavy fertilizer inputs) and unless grassland management practices are changed".
Major productivity gains may be obtained from improved management of native Ethiopian clovers. Dramatic responses of dry matter production to phosphorus application have been reported (Akundabweni, 1984a and b; Jutzi and Haque, 1984). Given the communal nature of pastures, introduction of improved pasture management techniques will be a difficult process, which will have to be undertaken at the PA level.

161
Many efforts have also been undertaken to produce fodder on arable land. As land is scarce, these forage crops must be sufficiently high yielding to provide returns per ha comparable with forage crops (Gryseels and Anderson, 1983a). For the higher altitude areas such as Debre Berhan only fodder oats (Avena sativa) and vetches (Vicia dasycarpa) have proven suitable and acceptable to smallholder farmers (Gryseels and Anderson, 1983a; Gebrehiwet, 1987; Jutzi et al, 1987c). Oats and vetch are usually grown in a mixture. The benefit oï~vetch as a legume in the mixture is twofold: it improves the quality of the feed by increasing protein content, and fixes atmospheric nitrogen in the soil. This organic nitrogen will be mineralized and transferred at least partly to the subsequent nitrophilous crop. Experimental results at Debre Berhan showed dry matter yields of oats and vetch mixtures to be 1.17 tonne/ha under zero fertilizer inputs, and 2.25 tonne/ha if 46 kg/ha of phosphorus was applied (Jutzi et al, ibid). The use of oats/vetch mixtures appeared promising, and warrantiB the initiation of on-farm trials in the Baso and Worena Wereda.
A substantial proportion of feed intake in the Ethiopian highlands is from the use of crop by-products. Various efforts have been undertaken to improve the quality of these residues by supplementation with feed concentrates, molasse/urea mixtures, or clovers (IAR, 1976; ILCA, 1982b and 1983b; Preston and Lewis, 1984; Preston, 1985). No economically profitable technology has yet emerged that has prospect of widespread adoption at the smallholder level.
Encouraging results have been obtained with the use of forage legumes in rotation with food crops. Nitrogen fixation of forage legumes in sub-Saharan Africa has been recorded at between 62 and 290 kg nitrogen/ha/year (Haque and Jutzi, 1984b). Forage legumes offer thus low cost opportunities for improving soil fertility and sustaining food crop yields (Haque et al, 1986).
The most important plant nutrient limiting legume growth in the Ethiopian highlands is phosphorus (Jutzi and Haque, 1984). ILCA has initiated a two-stage research programme on legume germplasm. During the first phase environmental, nutritional and biological factors limiting legume growth and nitrogen fixation are investigated, and the best performing legumes selected. In a second phase, "best bet" legumes will be integrated in cropping systems (Jutzi et al, 1987c). If ways can be found to introduce forage legumes in the cropping cycle, it may lead to a substantial increase in crop yields while simultaneously expanding fodder supply. Such technologies would be of particular importance in areas such as the Baso and Worena Wereda, where extended fallows are now necessary to regenerate soil fertility levels to support subsistence cropping. To date however, there is a serious lack of information regarding the economics of improved forage production (Gebrehiwot, 1987).
5.3. An ex-ante Evaluation of Proposed Interventions
Of the technological options available for a likely improvement of the farming system around Debre Berhan, in line with the specifications discussed in Section 5.1., two were selected for on-farm verification: single ox ploughing and the introduction of crossbred dairy cows. It was felt by ILCA that both these technologies had major potential for
162
increasing the productivity of resource poor smallholders, and that on-farm experiences gained at in the Baso and Worena Wereda would be of substantial relevance elsewhere in the highlands.
Both single ox ploughing and improved dairy production addressed a major constraint to farm producivity in the Ethiopian highlands. The shortage of timely draught power is a major problem faced by a majority of smallholder farmers. Nationally, around 29% of Ethiopian farmers have no oxen, 34% have one, 29% two and only 8% have three or more oxen (Ministry of Agriculture, 1980). In the Arsi region, a shortage of oxen was the most serious problem faced by the majority of farmers (Dejene, 1985).
Available evidence indicated that smallholder dairy production was also an attractive development option. The introduction of crossbred cows was likely to lead to a rapid increase in milk production and farm cash income.
Both technologies provided substantial opportunities for an enhancement of crop-livestock interactions. Progressively less land will be available in the future to farmers to keep oxen and their attendant stock. Because of population pressures on land resources, a conflict between crop and livestock production is energing. Widespread use of a single ox could dramatically reduce the number of oxen and their attendant breeding and replacement stock needed to support food crop production, thereby increasing the resources available for each working animal. This would allow for a reduction in grazing pressures, lowering the risk of environmental degradation, and an improvement in the nutritional status of remaining oxen. More timely cultivation of larger areas of land would also lead to increased food crop production and allow more balanced cereal/pulse rotations to be practised (Gryseels et al, 1984b). Improved dairy production would improve farm income and-allow the farmer to purchase additional inputs for crop production. As such, there would be a positive spillover from an improvement of livestock production to the productivity of the crop enterprises (Gryseels and Anderson, 1983b).
Few other technologies were available that warranted on-farm testing in the study area. At the ILCA research station, positive results had been obtained with the evaluation of improved potato varieties. Average yields of between 30 and 40 tonnes per ha were recorded. The experiments faced severe problems of potato blight however, as well as with potato storage (Woldeab Wolde Mariam, personal communication). There was also only a limited marketing demand for potatoes in the area and labour demands for potato harvesting appeared competitive with those of crops. Although the agronomic potential for potato production in the area is undoubtedly high, it was too early to involve farmers in the research process.
Efforts were undertaken to find short maturing crop varieties to overcome the frost problem. Experimental results with the improved barley varieties obtained were unsuccessful, and there was no apparent superiority over local varieties.
No alternative livestock technologies were available that would have a reasonable chance of being adopted by farmers. Given the lack of veterinary drugs and the high cost of better housing, the initiation of

163
on-farm research to improve sheep production was not a feasible option. Sheep fattening trials were still under experimentation at the Debre Berhan station, and problems were encountered in the development of an appropriate feeding system that was sustainable at the farmer level. The introduction of beef production through cattle fattening was also not feasible because the lack of an appropriate feeding system and of favourable market prices.
Despite many years of experimentation, the only forage species that were suitable for on-farm introduction were oats and vetch. Although experiments had shown that native clovers from the Ethiopian highlands had potential for hay production on bottomland sites subject to waterlogging, moderate inputs of P fertilizer were necessary for good production. The use of clovers outside their normal habitats would also require inoculation with appropriate rhizobia (Kahurananga and Tsehay, 1984). As these bottomland pastures are usually communal, the introduction of clover species would have to be initiated at the Peasants Association level.
With respect to initiating improvements in animal traction techniques other than single ox ploughing, available options by 1983 were few. The cost of improved implements was high and the impact on crop yields insignificant. Experiences in the Arssi region also indicated that the adoption rate of improved implements developed by CADU was negligible. The introduction of crossbred oxen was not feasible as their high demands for feed would not be adequately offset by the advantages of faster cultivation.
In view of the lack of appropriate alternatives, single ox ploughing and crossbred dairy cows were the technologies selected for on-farm testing. They were the best solutions of those technologies readily available in 1983 when the diagnostic phase was moving towards a "design and testing" phase of the research process.
Both technologies had first been tested at ILCA's research station at Debre Berhan. This was a risk neutral environment however, as ILCA could easily absorb the cost of the inputs involved and carry the risk of eventual failure. On-station research was conducted using resources which were far beyond those available to the smallholder such as high quality feed, veterinary inputs, and good management. Before dissemination of these technologies to the community at large through the Ministry's extension services, an intermediate phase of on-farm verification was therefore necessary.
As a preliminary phase to this, an ex ante evaluation of the proposed interventions was undertaken. An ex ante analysis seeks to evaluate the anticipated or expected impact of these interventions (Zandstra, 1985). The impact can be specified both in biological and economic terms. In view of the difficulties and risks associated with testing improved livestock production systems (De Boer, 1983; Fitzhugh et al, 1982), ex ante analysis is of particular importance in estimating tne potential benefits of new technology, to minimize the risk of failure for farmers involved in the verification trials. Various techniques have been used for ex ante analysis, and the approaches can be grouped as partial or whoTi farm budgeting, linear programming and system simulation (Hardaker, 1979; Eicher and Baker, 1982; De Boer, 1983; Simpson, 1985).

164
Simulation models usually assess animal performance under different feeding levels, and give prime emphasis to biological relationships. In view of the nature of the technologies under consideration, it was felt that a budgeting and linear programming approach would be particularly useful.
Farm budgeting is a technique to show the anticipated consequences, in terms of selected measures of performance, of changes in farm methods or organization (Dillon and Hardaker, 1980). Budgets can be constructed on a whole-farm basis, or for particular sectors of the farming system.
Linear programming (LP) is a computer-based procedure to determine the optimal value of a linear function subject to a set of constraints. The approach has frequently been used for farm planning. The application of LP to African smallholder agriculture has been reviewed by Eicher and Baker (1982). The first application was by Clayton (1961) in a study on the effect of resource constraints on the profitability of typical farms in the central province of Kenya. Heyer (1971) later refined the approach and undertook an ex ante analysis of the introduction of cash crops in the traditional farming system. The most frequent use of LP has been for the identification of constraints on smallholder farming, the derivation of normative supply and input demand functions, estimates of frontier production functions, evaluation of the profitability of new technologies, and identification and evaluation of management strategies (Eicher and Baker, 1982).
Although linear programming is a useful tool, it also has limitations. Dillon and Hardaker (1980) have pointed to the assumption of linearity, of the implication that all activities and resources are infinitely divisible, and the assumption of risk neutrality. However, recent developments in programming techniques (Hazell and Norton, 1986) have provided ways and means to overcome these limitations.
An LP model is useful in illustrating the interactions in a farming system, specifying data needs and to give indications on the sensitivity of the effects of particular interventions to a change in value of a range of factors, such as a change in market prices.
As LP models are necessarily based on historical data, their predictive capacity is somewhat limited. The future allocation of resources by farmers is not necessarily determined by historical patterns.
LP models of smallholder agriculture in the Ethiopian highlands have been constructed by Sisay (1983) and Mela (1985). Both authors however excluded livestock production from their model.
Using data collected by ILCA, Leithman-Fruh (1983) used an LP approach to model the traditional farming system in the Debre Zeit area, and to simulate the effects of possible interventions. The model's results showed that the introduction of a crossbred cow combined with an improvement package for crop production that consisted of fertilizer application and improved management, allowed for an increase in cash income of 531 compared to traditional farms. She also illustrated that, in the Debre Zeit situation, the introduction of a one-ox ploughing

165
system would not be profitable, because the available land resources could not be cultivated on time and would therefore not be fully utilized.
The time available to farmers for land cultivation is much shorter at Debre Zeit than in the Baso and Worena Wereda however, and these results could therefore not be extrapolated. Around Debre Zeit, because soils are heavy and rainfall is essentially unimodal, cultivation for the main crops has to be done within a very limited period of often less than three months. In the Baso and Worena Wereda, rainfall is more uniformly distributed over the year and soils are lighter than at Debre Zeit, so that ploughing can be done almost year round. The benefits of single ox ploughing can be estimated on the basis of section 4.10. The increment in total cereal production due to owning one ox rather than no ox was estimated at 266 kg or approximately 186 Birr per annum. The increment due to owning the second ox was estimated at 186 kg, or 130 Birr per annum.
For the purpose of this study, a simple LP model was constructed to simulate the traditional farming system in the Baso and Worena Wereda (Gryseels and Anderson, unpublished). In subsequent runs, changes to the existing livestock enterprise were simulated.
The matrix was a single period deterministic model of a representative farm in the area. It comprised a set of production activities during the "belg" and "meher" seasons, of both the crops and livestock sectors of the farming system. The matrix was composed of 39 activities subject to 35 constraints. The activities included the production of barley, wheat, horse beans, field peas, oats, hay and straw. They also included livestock production, particularly the husbandry of oxen, cows, donkeys and sheep, while manure was used both as household fuel and to sell for cash. Oxen and donkeys were used for draught purposes, while cows produced milk and replacement oxen. Only cattle produced manure for fuel and sale. The animals were fed on pastures, crop by-products and hay. Working oxen and cows received approximately 45% of their feed from cereal straw and hay.
Three land classes were specified: arable, pasture and fallow land. Feed supply was determined by three seasons of the year, i.e. dry season (October to January), early "belg" rainy season (February to May) and the wet "meher" season (June to September). Straw and hay could be purchased in each season if required, and supplies could be transferred from one season to another. This allowed feed surpluses and deficits to be balanced across the three feed seasons. The labour supply constraints were specified corresponding to the same time periods as the periods used to specify the feed supply periods. For each season 700 hours of human labour and 720 hours of ox-time were available. Donkeys could be used for 2000 hours per year. Arable land availability was restricted to maximum 4 ha during the "meher" season and 0.5 ha during the "belg" season. A non-arable permanent pasture supply was specified at maximum 1 ha. A crop rotation scheme was introduced and in the "meher" season farmers could plant a maximum of two years of cereals for each year of pulses. In the "belg" season, a ratio of four years of cereals to one year of pulses was assumed. For each three years of cereals, one year of fallowing was necessary. A family subsistence constraint of 800 kg of cereals and 200 kg of pulses, the average annual consumption, was specified.

166
Many of the activities in the matrix have a zero gross margin coefficient. In the case of the main season barley crop for example, the enterprise uses land, produces grain and straw, and utilizes labour in two seasons, and oxen time as well as donkey time for both grain and straw production. Oxen as well as cows are fed on pasture, straw and hay. Sheep and donkeys derive their intake mainly from pastures, but receive occasionally some hay or straw. The vector reflects the reality that the traditional enterprise uses no purchased inputs. By disaggregating each enterprise, the impact on optimal organisation could be easily examined by manipulating constraints or market prices.
The specification of the livestock activity was such that the keeping oxen activity was only feasible if a local cow enterprise was also included. The model allowed for oxen to be rented on a daily basis. The production parameters used in the model were specified as observed in the surveys.
The matrix was composed of 39 activities, subject to 35 constraints. The objective function was specified as:
MAX J = 0.0 BARLEY + 0.0 WHEAT + 0.0 HORSEBEANS + 0.0 FIELDPEAS + 0.0 OATS +0.0 FALLOW +0.0 PERM PASTURE +0.0 STRTF 12 + 0.0 STRTF 13 + 0.0 HAYTF 31 + 0.0 HAYTF 32 + 0.0 BARLEYTF + 0.0 WHEATTF + 0.0 HORSEBEANTF + 0.0 FIELD PEATF + 0.0 BARBELG +0.0 HORBEAN BELG +0.79 SELL WHEAT +0.52 SELL BARLEY +0.47 SELL FIELDPEA +0.39 SELL HORSEBEANS 5 -0.10 BUYHAY 1 - 0.10 BUYHAY 2 + 80.0 KEEP OXEN + 0.0. OXBELG + 0.0 OX MEHER + 0.05 SELLMANURE - 0.63 ROBEL -0.63 ROMEH - 10.0 DONKEY - 0.0 MARKET + 42.0 SHEEP + 103.0 LOCCOW - 0.50 SELLMILK - 0.12 BUYSTR 1 - 0.12 BUYSTR 2 -0.12 BUYSTR 3 + 0.0 MANFUEL.
Following definitions were used:
MAX J = Maximize Gross Margin
BARLEY, WHEAT, HORSEBEANS, FIELD PEAS, OATS = Production of these respective crops in the main 'Mener' season, on arable land in a crop rotation system. Expressed in ha.
FALLOW = Compulsory fallowing of arable land to reflect current low soil fertility (ha)
PERM PASTURE = Permanent pasture on currently non-arable land (ha)
STRTF 12, STRTF 13 = Transfer of straw from one feed season to the other season (kg)
HAYTF 31, HAYTF 32 = Transfer of hay from one feed season to the other season (kg)
BARLEYTF, WHEATTF, HORSEBEANTF and FIELDPEATF: Transfer activity of grain of respective crop to the subsistence requirement row (kg)
167
BARBELG, HORBEANBELG = Barley and horsebean production in the short rain 'belg' season (kg)
SELL WHEAT, SELL BARLEY, SELL FIELD PEAS, SELL HORSE BEANS = Sale of grain of respective crops from their supply pools (kg)
BUYHAY 1, BUYHAY 2, BUYHAY 3 = Hay purchase in the respective periods (kg)
KEEP OXEN = Enterprise fixing costs and benefits of keeping a pair of oxen (pair)
OXBELG = Working a pair of oxen during the 'belg' season (pair hour)
OXMEHER = Working a pair of oxen during the 'meher' season (pair hour)
SELLMANURE = Sale of manure cakes (kg)
ROBEL = Rental of ox-pairs for use in 'belg' season (pair hour)
ROMEH - Rental of ox-pair for use in 'meher' season (pair hour)
DONKEY = Enterprise of keeping donkey (head)
MARKET = Marketing enterprise which uses donkey time (hrs)
SHEEP = Sheep keeping enterprise defined on a ewe plus follower basis (head)
LOCCOW » Keeping of a local cow plus followers in order to provide replacement oxen for KEEPOXEN activity (head)
SELLMILK » Sale of farm produced milk (kg)
BUYSTR 1, BUYSTR 2, BUYSTR 3 = purchase of straw for use in the respective feed period (kg)
MANFUEL = Burning of home produced manure cakes as a source of household fuel (kg)
The basic solution of the matrix gave the optimal mix of enterprises for a representative farm in the Baso and Worena Wereda. The enterprise mix which maximised total gross margin from the resources available to the average farmer, gave a total annual gross margin of 946 Birr. The optimal enterprise included 1.97 local cows, 40 sheep, and one ox. Donkeys should be rented, and barley should not be grown unless its gross margin increases by approximately 50%. There was surplus straw from June to September. Both meher and belg crops were grown on all available arable land.
The model results illustrated critical feed constraints, particularly during the dry season from February to May. The results also showed the need for rental oxen during the meher season, and
168
indicated that there was room for an expansion of sheep holdings. Labour availibility was not a major constraint, and outside the main cultivation season, there was surplus oxen time. Manure was used as necessary for household fuel, and surplus manure was sold for cash.
The model was then expanded to simulate the likely impact of the introduction of a crossbred cow on farm productivity. The production parameters involved were estimated on the basis of results obtained at the Debre Berhan station, and previous experiences of the programme at Debre Zeit (Gryseels and Anderson, 1983a). The anticipated costs and benefits of a crossbred cow enterprise were first estimated in a budget presented in Table 5.2. Total returns of the enterprise were estimated at 1,195 Birr/annum, and the costs at 325 Birr/annum. The net benefit of the introduction of a crossbred cow could therefore be estimated at 870 Birr per annum per cow. This amount would be additional to the returns from the traditional farm enterprise.
Using the methodology described in section 4.10., the annual rate of return of a crossbred cow could further be estimated at 110% per annum.
The basic LP model was then adapted to allow for the incorporation of a crossbred cow in farm operations. The farmer grew a mixture of oats and vetch, which was fed both as green feed and as hay. Grass hay and straw of other cereals were also fed to the cow and followers. Total gross margin (TGM) increased from 946 to 2073 Birr, or an increase of 82% to the TGM obtained with the traditonal enterprise mix.
Rodriguez and Anderson (1985) modified and expanded this basic model to allow for the incorporation of risk, to test a modification of a traditional ox-pair cultivation system to a single ox ploughing system, and to evaluate the income variation impacts of changes in livestock technologies. The objectives of the study were to analyze the role of livestock enterprises as a risk reducing option, and to evaluate the impact of crossbred cows and single ox ploughing on farm activities within a stochastic environment.
The single ox technology was specified as requiring 50% less feed but providing only 50% of the animal draught power usually provided by the ox-pair. The model made use of a 'risk-aversion scalar' in the objective function and produced a set of solutions for different levels of risk ranging from 0 to 3, with 0.5 as intervals. Results are summarized in Table 5.3.
It was shown that a single ox ploughing strategy yielded a higher mean farm income, but a larger standard deviation of net farm income relative to the ox-pair. For example, at a risk aversion level of 0.5 the lowest net farm income under the ox pairs was 86 Birr (252 minus SD of 166) while it was 459 Birr (647 minus 188) under the single ox technology. The high mean net farm income of the single ox system would be a sufficient advantage to offset the increased variations of net farm income. The differences in the standard deviation of net farm income were caused by shifts in the cropping pattern, which reflected different attitudes in risk aversion. Differentials in mean net farm income could partly be attributed to livestock sales. The loss of manure due to the adaption of the single ox technology was more than offset by the improvement of animal power efficiency.

169
Table 5.2. Expected Costs and Returns of a Crossbred Cow Enterprise in the Baso and Worena Wereda
costs
Item
1. Forage
2. Feed concentrates 3. Veterinary care 4. Housing and tools 5. Breeding 6. Labour
Total costs
a/ Assumptions as fol]
a/
Lows:
Amount
115 100
20 30 10 50
325
(Birr/Cow)
returns b/
Item
1. Milk production
2. Dung 3. Surplus males 4. Surplus females 5. Residual value
Total returns
Amount
850 73 22
170 80
1,195
1. Cash costs for forage production are oats and vetch seed and fertilizer; 100 kg oats at 30 Birr, 20 kg vetch at 5 Birr, and 100 kg DAP at 80 Birr.
2. 1,000 kg of available feed concentrates at 0.10 Birr/kg.
3. Veterinary care at 20 Birr/annum.
4. Improved housing and tools such as milk cans and buckets depreciated over 5 years.
5. Breeding services supplied at 10 Birr/year.
6. Additional labour needed estimated at 25 mandays at 2 Birr/day.
b/ Assumptions as follows:
1. Milk production is 1,700 kg/year and valued at 0.50 BirrAg-
2. Dung production of cow and followers estimated at 2 kg dry matter equivalent per day, after allowing for losses, and valued at 0.10 Birr/ day.
3 and 4. Assuming calving interval of 14 months and 50% males/females ratio. Male calves sold at 1 year of age at 120 Birr, and rearing costs assumed at 30 Birr. Cows rear their own replacements. Each cow produces an average of 5 calves over a 6 year productive cycle. One of the female calves is kept as a replacement, and mortality is assumed at 20%. This allows for 1.5 male calves and 1.5 female calves to be sold during the 6 year period. Surplus heifers are sold at 18 months of age at 800 Birr/head. Rearing cost is assumed at 120 Birr.
5. Residual value estimated at meat value of 400 kg at 1.2 Birr/kg.
Source: Adapted from Gryseels and Anderson (1983a).
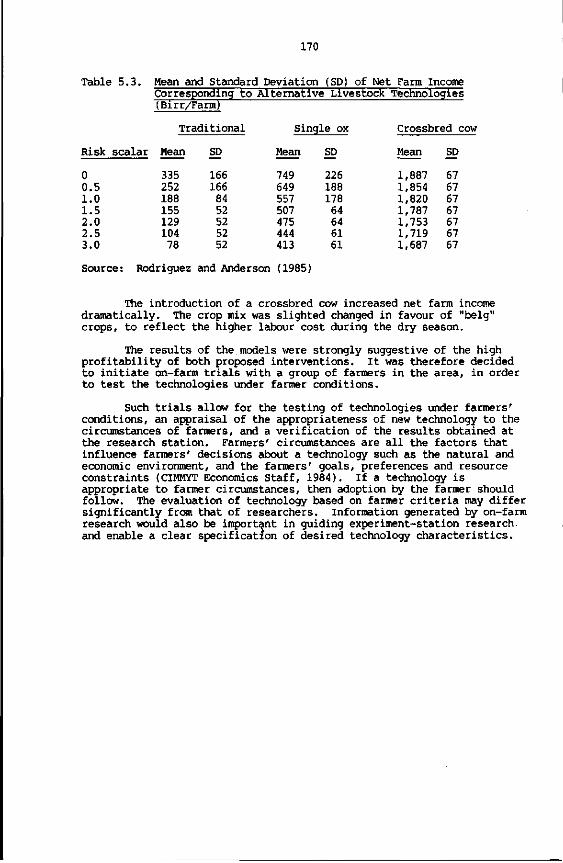
170
Table 5.3. Mean and Standard Deviation (SD) of Net Farm Income Corresponding to Alternative Livestock Technologies (Birr/Farm)
Risk scalar
0 0.5 1.0 1.5 2.0 2.5 3.0
Traditional
Mean SD
335 166 252 166 188 84 155 52 129 52 104 52 78 52
Single ox
Mean SD
749 226 649 188 557 178 507 64 475 64 444 61 413 61
Crossbred cow
Mean
1,887 1,854 1,820 1,787 1,753 1,719 1,687
SD
67 67 67 67 67 67 67
Source: Rodriguez and Anderson (1985)
The introduction of a crossbred cow increased net farm income dramatically. The crop mix was slighted changed in favour of "belg" crops, to reflect the higher labour cost during the dry season.
The results of the models were strongly suggestive of the high profitability of both proposed interventions. It was therefore decided to initiate on-farm trials with a group of farmers in the area, in order to test the technologies under fanner conditions.
Such trials allow for the testing of technologies under farmers' conditions, an appraisal of the appropriateness of new technology to the circumstances of farmers, and a verification of the results obtained at the research station. Farmers' circumstances are all the factors that influence farmers' decisions about a technology such as the natural and economic environment, and the farmers' goals, preferences and resource constraints (CIMMYT Economics Staff, 1984). If a technology is appropriate to farmer circumstances, then adoption by the farmer should follow. The evaluation of technology based on farmer criteria may differ significantly from that of researchers. Information generated by on-farm research would also be important in guiding experiment-station research, and enable a clear specification of desired technology characteristics.
171
INTEGRATION OF CROSSBRED COWS AND FORAGES IN THE FARMING SYSTEM
6.1. Introduction
The productivity of local Zebu cattle for meat and milk production is low. Their genetic capacity for increased milk production is limited, even with improved feeding and management. A major increase of milk productivity in the short term can only be achieved by the introduction of higher yielding breeds or cross breeds of cattle. In the absence of suitable local stock, these will have to be exotic breeds of origin. In the long term, there may be scope for the development through a selection process of the genetic potential of local Zebu breeds, but this will require a substantial and long term research effort (AACM, 1985; Kebede, 1987). The Ethiopian Government has a programme for crossbreeding of Friesian sires and Boran cows. This results in crossbred progeny that are substantially larger than the local cows, with a higher milk and meat productivity while maintaining a relative tolerance to conditions of sub-tropical climates.
The favourable climatic and environmental conditions, the orientation towards mixed agriculture, the existence of traditional dairy production, the accessibility to urban markets, and the likely profitability suggested a substantial potential for the development of smallholder dairy production in the Baso and Worena Wereda. Experiences elsewhere in the Ethiopian highlands (Branning et al, 1980; Gryseels and Anderson, 1983a) had shown that introducing crossbred cattle for smallholder dairy production was feasible, and would be a potent means of raising net farm income and family welfare. It was therefore decided to initiate adaptive research on the integration of crossbred dairy cows in the traditional farming system of the Wereda. The objectives of the research were to monitor the performance of crossbred cows under smallholder conditions, to study adoption problems, to appraise the impact of increased milk production on farm productivity and income, and to use the results to guide component research.
6.2. Materials and Methods
Since 1979, ILCA operated a number of research farms at its experiment station at Debre Berhan. These farms were managed and operated by ILCA employees on a fixed salary plus an annual bonus as part of an incentive scheme. In addition to providing a direct means of assessing the technical and biological feasibility of a range of alternative enterprise combinations, the research farms served as a clearing house for more innovative enterprises which might later be introduced to the farming community (Gryseels and Anderson, 1983a). Studies on the productivity of crossbred cows were the initial focus of the station research. It was felt however that the station ecology was not fully representative of the area under study. The research station is located in a 'yemeda' land class area, and was highly frost-prone. Crops were extensively damaged by frost, and forage production, with fertilizer application, averaged only 2 t/ha. Average annual milk yield of the cross bred cows, adjusted for calving interval, was 1700 kg + 510 in the first lactation, with a range of 900 to 3,000 kg (Gryseels and Anderson, Ibid).
172
research farms were very dependent upon inputs which were not farm produced, such as feed concentrates. Also it was felt that given the "risk neutral" status of the farmers involved, the technology was not put under adequate test. A decision was therefore taken to test the technology with traditional farmers of the surrounding area. A field day was organized at the station to discuss the crossbred cow and forage technology with control farmers, local government officials and extension agents. ILCA staff presented preliminary findings of the technology, the likely effects on farm productivity, and the adoption problems that may occur. In July 1982 twenty farmers, all residents of one of the four surrounding PAs decided to purchase one crossbred cow from ILCA. In mid-1983, an additional 17 farmers purchased a cow, and another three farmers joined the research in early 1984. The cows were sold at 1.5 Birr/kg liveweight, 50% on cash down payment, and 50% on credit. They were Friesian-Boran crosses that were produced at ILCA research stations of both Debre Zeit and Debre Berhan. They had 75% exotic blood, as the sire was a purebred Friesian bull and the dam a 50% Friesian-Boran cross. Their mean weight was 385 kg, and they were sold at an average of 578 Birr each. Previous experiences in the Arssi region (Kiwuwa et al, 1983) had shown that the performance of 75% was slightly superior to tEit of 50% crosses.
Farmers participated in a group training course before the animals were delivered. The training consisted of lectures on forage production, dairy husbandry, animal health, and economics/marketing, and were given by ILCA staff. Each farmer signed a letter of understanding which included a replacement guarantee if the cow would produce less than 700 kg of milk during the first lactation, provided that the low yield would not be due to obvious mismanagement by the farmer. The letter of understanding also included a promise that farmers would participate in the data collection procedures set up by ILCA, and that they would not sell or dispose of the cow without a written agreement from ILCA. Disputes would be referred to the Executive Committee of the PA.
The 40 dairy test farmers (DTF) were members of the four PA's of the prior study. Eight (20%) were from Faji-Bokafino, 6 (15%) from Karafino, 24 (60%) from Kormargfia and 2 (5%) from Milki. The location of the DTF is illustrated in Figure 3.4. Eight DTF were previous control farmers. The relatively high proportion from Kormargfia can be explained by the higher availability of animal feed (pasture and fallow) and the easier access to water sources that exists in that PA. In addition, during 1983 Korgmargfia was the only PA with a milk collection centre of the Dairy Development Enterprise (DDE). The crossbred cow enterprise was wholly farmer managed. ILCA's input was limited to the provision of technical advice and veterinary inputs, the supply of forage seeds and of occasional supplementary wheat bran ("frushka"). Farmers were advised to produce special forage crops, grown as a mixture between oats (Avena sativa) and vetch (Vicia dasycarpa), on 0.5 ha of land. All farmers adopted this dairy husbandry package at their own risk and expense. They themselves decided whether or not to accept ILCA's recommendations and paid cash or through short term credits for material inputs received from ILCA.
Breeding services were provided by ILCA's purebred Friesian bull that resided on station. Although it was realized that half bred bulls

173
would have been preferable so as to stabilize the level of exotic blood in the progeny, the available half breds lacked libido and proved unsuitable for breeding purposes.
In order to monitor the performance of these crossbred cows and to study the impact on farm productivity and income, data collection started immediately after the distribution of the animals. Structured questionnaires were used for this purpose and the information collected was similar to the type of data that were gathered from control farmers. Data analysis was undertaken using similar procedures as for control farm data and included routines of the Statistical Programme for Social Sciences (Nie et al, 1975), Harveys Least Squares (Harvey, 1977) and Statistical Analysis System (SAS, 1985).
The performance of the DTF was compared with the productivity of control farmers. For that purpose, data collection on control farms continued during 1985.
The following section presents results obtained from 1983 to 1985.
6.3. Results
6.3.1. Background Information on Dairy Test Farmers
The mean age of DTF was 42 years, slightly less than control farmers. About 44% had a basic degree of literacy. The average household size was 5 persons (CV 39%) of which 52% were male and 48% female. There was no significant difference between test and control farmers in terms of family size and composition.
The mean value of farm assets owned by DTF was estimated at 1019 Birr. This was significantly (P<0.01) higher than of control farmers where this value averaged only 698 Birr. DTF had more dwelling houses and stores. The higher asset position allowed DTF to be less risk averse, and facilitated an early adoption of technology.
6.3.2. Farm Holdings, Land Use and Productivity
The size of farm holding and pattern of land use of DTF was similar and not significantly different from that of control farmers. The average farm size was 5.2 ha, of which 2 ha (38%) was cultivated and 3.2 ha (62%) pasture or fallow land. The statistical distribution of holding sizes was skewed slightly to the right as about 51% of DTF owned more than 5 ha of land. This was mainly due however to large pasture holdings, as the distribution of area cultivated was similar to that of control farmers.
About 21% of DTF cultivated less than 1.6 ha, 69% cultivated between 1.6 and 3 ha of land and only 10% cultivated more than 4 ha. Of the cultivated area 35% was on aredda productive land, 2% on aredda less productive land, and 63% on yemeda.
The average farm size and patterns of land use during the years of the study are presented in Table 6.1.

174
Table 6.1.: Farm Size and Land Use Pattern DTF (1983-1985)
1983 1984 1984 (n-37) (n=40) (n-40)
Mean farm size 5.1 5.3 5.2 Land cultivated 1.9 2.1 2.0 Fallow land 2.5 2.5 2.5 Pasture land 0.7 0.7 0.7
The cropping pattern of DTF was also similar to that of control farmers. A slightly higher proportion of land was sown to oats and vetch, so as to produce sufficient fodder for the crossbred cows. The amount of forage crops sown was however well below ILCA's recommendations of 0.5 ha per farm. Oats, vetch or a mixture of oats and vetch were grown on an average that ranged from 2470 m in 1983 to 5040 m during 1985. A substantial fraction of the oats were harvested as grain and used for human consumption however. The cropping pattern of DTF is illustrated in Table 6.2.
Table 6.2.: Cropping Pattern DTF (Meher Seasons 1983-1985, % Cultivated " a) Area)
1983 1984 1985
Barley 54 50 60 Wheat 7 6 7 Horse beans 12 2 10 Field peas 3 1 -Linseed 8 5 6 Lentils 1 1 1 Oats 10 16 16 Vetch - 2 -Oats and vetch 3 6 -Fenugreek 2 11 -
Total 100 100 100
Well over 50% of all cultivated land was sown with barley, and between 13 and 24% to oats, vetch or a mixture of both. The proportion of land sown to cereals averaged around 70%, while 30% was sown to pulses.
The use of mineral fertilizer by DTF was similar to that of control farmers. During 1983, 78% of DTF applied mineral fertilizer or 29 out of 37 farmers. Almost all farmers (97%) used fertilizer on barley plots with a mean application rate of 86 kg/ha. Some (23%) also applied fertilizer to their wheat plots, with an application rate of 68 kg/ha. Only DAP fertilizer was applied.
The incidence of drought and frost caused 1983 to be a very poor crop year. Yields were very low and grain responses to fertilizer
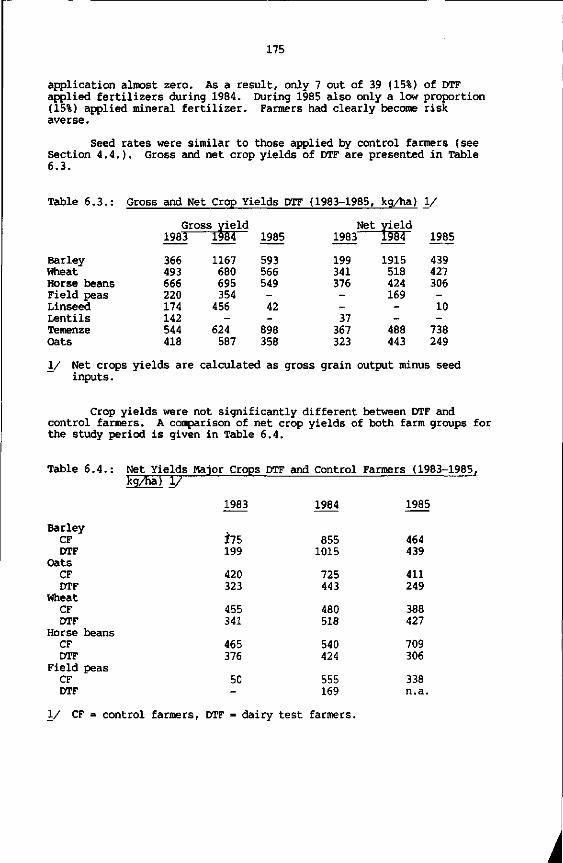
175
application almost zero. As a result, only 7 out of 39 (15%) of DTF applied fertilizers during 1984. During 1985 also only a low proportion (15%) applied mineral fertilizer. Farmers had clearly become risk averse.
Seed rates were similar to those applied by control farmers (see Section 4.4.). Gross and net crop yields of DTF are presented in Table 6.3.
Table 6.3.: Gross and Net Crop Yields DTF (1983-1985, kg/ha) 1/
Gross yield Net yield 1981 1§84 1985 1983 19~8T~ 1985
Barley Wheat Horse beans Field peas Linseed Lentils Temenze Oats
1/ Net crops yields are calculated as gross grain output minus seed inputs.
Crop yields were not significantly different between DTF and control farmers. A comparison of net crop yields of both farm groups for the study period is given in Table 6.4.
366 493 666 220 174 142 544 418
1167 680 695 354
456 -
624 587
593 566 549 -42 -
898 358
199 341 376 --37
367 323
1915 518 424 169 --
488 443
439 427 306 -10 -
738 249
Table 6.4.:
Barley CF DTF
Oats CF DTF
Wheat CF DTF
Horse beans CF DTF
Field peas CF DTF
Net Yields kg/ha) 1/
Maj< or Crops
1983
Ï75 199
420 323
455 341
465 376
50 -
DTF and Control
1984
855 1015
725 443
480 518
540 424
555 169
Farmers (1983-1985,
1985
464 439
411 249
388 427
709 306
338 n.a.
1/ CF = control farmers, DTF = dairy test farmers.

176
There was no significant difference between CF and DTF in proportions of farmers using mineral fertilizer (Table 6.5.). The low profitability of fertilizer discouraged its use.
Table 6.5.
CF DTF
Fertilizer Use by CF and DTF (% of Farmers Using)
1983 1984 1985
76 78
14 18
19 15
The production of cultivated fodder was low. ILCA recommended that farmers should grow oats and vetch in a mixture, but farmers felt that management of this mixture was very difficult. Vetch matured well before the oats while harvesting was not yet possible. Undersowing practises also failed. Average production was between 1 and 3 t/DM/ha during 1983 and 1984 but farmers then stopped growing vetch. Although oats grew well in this environment, most farmers harvested it as a cereal and used it as a grain for human consumption. After the crop failures of 1983, and the national grain shortage of 1984, this was a rational strategy.
The forage crops were mainly used as hay, although just under 50% of farmers also served it as green feed. All farmers fed concentrates and grass hay to the crossbred cows. The proportion of farmers offering feedstuffs of different types is given in Table 6.6.
Table 6.6.:
Green grass Concentrates Vetch hay Vetch green Green oats Oats hay Straw Grass hay Worts
Feedstuffs of Different of Farmers Giving)
1983 (n=l7)
83 (wheat bran) 100
11 >_ 47 77 94
100 65
Barley (residues) 77
6.3.3 . Livestock Holdings anc
Types Offered
1984 (n-30)
100 100 --57 63 93
100 77 70
1 Productivity
to Crossbred Cows (%
1985 (n=35)
100 86 --43 52
100 100 67 69
In addition to the crossbred cow enterprise, DTF had livestock holdings of similar breeds and species of control farmers. These consisted of local Zebu cattle, sheep of menz breed, donkeys and horses. Holdings of DTF were somewhat larger than those of control farmers, reflecting their higher wealth status.
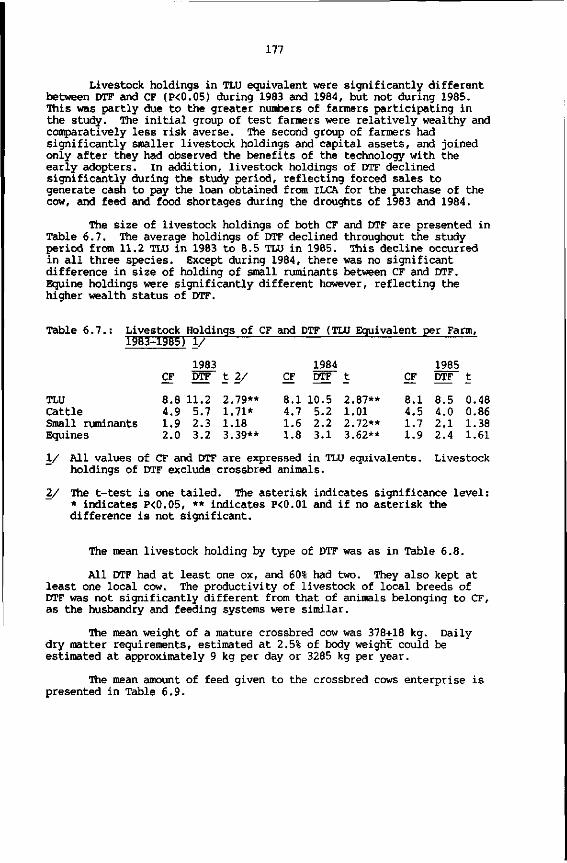
177
Livestock holdings in TLU equivalent were significantly different between DTF and CF (P<0.05) during 1983 and 1984, but not during 1985. This was partly due to the greater numbers of farmers participating in the study. The initial group of test farmers were relatively wealthy and comparatively less risk averse. The second group of farmers had significantly smaller livestock holdings and capital assets, and joined only after they had observed the benefits of the technology with the early adopters. In addition, livestock holdings of DTF declined significantly during the study period, reflecting forced sales to generate cash to pay the loan obtained from ILCA for the purchase of the cow, and feed and food shortages during the droughts of 1983 and 1984.
The size of livestock holdings of both CF and DTF are presented in Table 6.7. The average holdings of DTF declined throughout the study period from 11.2 TLU in 1983 to 8.5 TLU in 1985. This decline occurred in all three species. Except during 1984, there was no significant difference in size of holding of small ruminants between CF and DTF. Equine holdings were significantly different however, reflecting the higher wealth status of DTF.
Table 6.7.: Livestock Holdings of CF and DTF (TLU Equivalent per Farm, 1963-1985) 1/
1983 1984 1985 CF DTF t 2/ CF DTF t CF DTF t
TLU 8.8 11.2 2.79** 8.1 10.5 2.87** 8.1 8.5 0.48 Cattle 4.9 5.7 1.71* 4.7 5.2 1.01 4.5 4.0 0.86 Small ruminants 1.9 2.3 1.18 1.6 2.2 2.72** 1.7 2.1 1.38 Equines 2.0 3.2 3.39** 1.8 3.1 3.62** 1.9 2.4 1.61
1/ All values of CF and DTF are expressed in TLU equivalents. Livestock holdings of DTF exclude crossbred animals.
2/ The t-test is one tailed. The asterisk indicates significance level: * indicates P<0.05, ** indicates P<0.01 and if no asterisk the difference is not significant.
The mean livestock holding by type of DTF was as in Table 6.8.
All DTF had at least one ox, and 60% had two. They also kept at least one local cow. The productivity of livestock of local breeds of DTF was not significantly different from that of animals belonging to CF, as the husbandry and feeding systems were similar.
The mean weight of a mature crossbred cow was 378+18 kg. Daily dry matter requirements, estimated at 2.5% of body weight could be estimated at approximately 9 kg per day or 3285 kg per year.
The mean amount of feed given to the crossbred cows enterprise is presented in Table 6.9.

178
Table 6.8.: Mean Livestock Holding of DTF by Type (1983-1985) 1/
1983 1984 1985
Ox 1.5 Cow 1.9 Heifer 0.9 Bulls/immature males 1.7 Calves 1.7
Total cattle 7.7
Lamb 4.6 Ram 0.8 Ewe 6.6 Castrated sheep 0.4 Young stock 1.6 Goats 0.4
Total small ruminants 14.4
Donkeys 2.1
Horses/mules 2.3
Total equines 4.4
Poultry 4.0
1.4 1.6 1.0 1.2 1.4
6.6
5.5 0.7 5.7 0.5 0.6 0.6
13.6
1.8 2.2
4.0
3.5
1.3 1.4 0.5 0.9 1.2
5.3
5.6 0.6 5.9 0.1 1.5 0.4
14.8
1.8 2.1
3.9
3.0
1/ Not including crossbred livestock
Table 6.9.: Fodder Amounts Fed to Crossbred Animals (Kg/Farm)
1983 1984 1985
Green fodder grass oats
Dry fodder grass hay oats hay vetch hay cereal straw
Feed concentrates
Residues attella barley others
665 471
'194
2124 1650 227
34 213
284
59 29 30 -
1477 1223 254
3468 2747 194 -
527
565
169 119 43 7
959 864 95
4411 3698 202 -
511
217
119 57 55 7

179
Assuming green fodder to have a dry matter equivalent of 25%, dry fodder of 80%, feed concentrates 95% and residues 70%, then total DM feed offered was 2176 kg in 1983, 4871 kg in 1984 and 4058 kg in 1985. Feed requirements in DM equivalent during this period (calculated at 2.5% of body weight of the average annual inventory) amounted to 3759 kg in 1983, 4517 kg in 1984 and 4991 kg in 1985. Maintenance needs of crossbred livestock were met in 1984, but in 1983 only 58% and in 1985 and 81% of feed required was available. The deficit was met by pasture grazing. Cows were also given small amounts of salt for mineral supplementation.
DTF gave special care to the crossbred cows. They were kept separate from the animals of local breed. Crossbred cows were grazed outdoors for an average of 5 hours/day, tethered by the wife and the children. About 90% of grazing was done on the individual grazing land, 8% on communal land and 2% on crop stubbles. The crossbreds were not mixed with other animals of the herd. The crossbred animals were also kept separately during hand feeding.
All crossbred animals were vaccinated by ILCA against rinderpest, contagious bovine pleuro-pneumonia (CBPP) and black leg. Vaccines against foot and mouth disease were not available. Every month the cows were drenched for protection against liverfluke and worms. Farmers complained about the susceptibility of crossbred animals to liverfluke. Bloat was also a major problem, as well as mastitis.
The mean holding of crossbred animals of DTF was as in Table 6.10.
Table 6.10.: Holdings of Crossbred Cattle (mean per Farm, 1983-1985)
1983 1984 1985
Cow 1.0 1.0 1.0 Heifer 0.0 0.1 0.4 Calf 0.7 0.8 0.8 Young bull 0.0 0.2 0.4 Bull 0.0 0.0 0.02
Total crossbred cattle 1.7 2.1 2.62 f
TLU equivalent 1.65 1.98 2.19
All DTF had one crossbred cow, and usually at least one follower. Herd growth rate in terms of TLU equivalent was 20% in the first year, and 11% in the second year.
6.3.4. Productivity of Crossbred Cows
6.3.4.1. Reproduction Characteristics
Mean age at first calving was 986+22 days with a CV of 11%. The mean age of heifers at first service was 719+23 days (CV=17%).
The overall calving interval (CI) was 424+15 days. Between the first and second lactation CI was 377+35 days, and 470+33 days between second and third lactation.

180
6.3.4.2. Production Characteristics
The mean lactation yield was 1843+112 kg and increased from 1715+255 kg in first lactation (n=23) to 1970+243 kg in second lactation (n=32), Lactation yield of cows calving in tHe dry season (n=27) was 1553+249 kg, and 2132+244 kg for those calving in the wet season (n=28). Yet, because of the hïgh standard errors, these differences were not statistically significant.
Mean AAMY 1/ was 1660+126 kg, and was 1708+315 kg for the first lactation and 1611+299 kg in the second lactation.
Although the means of milk yields appeared to be strongly influenced by year of calving, season of calving, and calf sex, these differences were not found to be statistically significant using HLSQ procedures.
The average lactation length was 332+20 days, and increased from 280+48 days in first lactation to 385+45 days in second lactation. The lactation length was strongly correlated with lactation number (P<0.05).
During the first lactation, 58% of calves born alive were female, and 42% were males. During the second lactation 40% were females and 60% males. The mean birth weight of calves was 28+0.74 kg (n-41), ranging from 27.8+0.99 kg for female calves to 29+1.07 kg for male calves. There was a significant effect of age of dam on birth weights. Mean birth weights of dams less than four years old was 31 kg, while only 26 kg when the dam was more than four years old.
Overall calf mortality was estimated at 16% (n=118), and was distributed as 58% male calves and 42% female calves. Abortion occurred in 4% of pregnancies. There was no significant difference in calf mortality according to lactation number. Of the calf deaths 20% occurred within one month after birth, 40% between the second and third month, 10% between the fourth and sixth month and 25% between the seventh month and one year.
The production results per lactation are summarized in Table 6.11.
Table 6.11.: Mean Production Results of Crossbred Cows by Lactation Number
Lactation Number 1 2
(N=39) (N=32)
Age at first calving (days) Lactation yield (kg) AAMY (kg) Lactation length (days) Lactation yield/day (kg) Calving interval (days)
986+22 1715+255 1708+315
280+48 5.49+0.49
377+35
n.a. 1970+243 1611+299
385+45 5.34+0.37
470+33
1/ Adjusted Annual Milk Yield (AAMY) Lactation yield
Calving interval x 365

181
Milk production per cow peaked just after the main rains (August-September) when grass growth on the pastures was lush. It also peaked during the Belg rains of April and May. During 1984 there were no Belg rains. The fluctuations in monthly milk production are illustrated in Table 6.12.
Table 6.12.: Monthly Means of Milk Production per Cow (Kg/Month, 1983-1985)
1983 1984 1985
January February March April May June July August September October November December
Mean 180 183 140
Milk production was correlated with rainfall, as shown in Figure 6.1. Milk yields strongly decreased towards the end of the dry season, reflecting feed shortages.
Cows were milked twice a day, once in the morning and once in the evening. Let down was stimulated by the calf, which was then taken away and fed from a bucket. Calves were fed a mean of 336+16 kg of milk until weaning at between three and six months. ILCA's advice was to rear calves with four litres of milk per day during the first month, three litres/day during the second month, and two litres/day during the third month, of which half was to be offered in the morning and half in the evening. After weaning, calves started grazing with the crossbred cow. It appeared that male calves received slightly more milk than female calves.
The milk from crossbred Friesian-Boran cows had a lower butterfat content than that of local Zebu cows. Butterfat content of milk produced by crossbred cows of DTF averaged around 4%, with a range from 3.2 to 4.8% depending on the type of feed intake, and water availability (Ephraim Bekele, personal communication). This compared with an average fat content of 5.3% of milk of local cows (O'Mahoney and Peters, 1987).
137 155 175 187 188 179 146 185 196 208 182 188
191 180 187 150 139 162 194 200 211 215 182 172
154 113 131 128 128 109 129 171 170 177 140 130

182
Figure 6.1.: Monthly Milk Production of Crossbred Cows and Monthly Rainfall
Rainfall (mm) Milk (kg)
Rainfall (mm/month) 500T
400
300--
200-•
100--
Jan'83
Milk (kg/cow) 250
••200
150
Jan'84 Jan'85
••100
Dec.1985
6.4. Farm Incomes and Gross Margins
6.4.1. Marketing
DTF are subsistence farmers and almost all grains produced were consumed on the farm. Only a minor fraction of farm grain production was marketed. Each farmer had to supply annually approximately 50 kg to the AMC at official government prices via the Service Cooperative of which he was a member.
DTF sold most of the milk produced by the crossbred cows to the Dairy Development Enterprise, through its collection centres on the Debre Berhan-Addis Abeba road. Milk was delivered once in the morning to these collection centres. It was immediately checked for quality by the DDE staff, and if milk was not conform to standard it was rejected. Farmers were paid 0.45 Birr/litre during 1983 and 1984, and 0.50 Birr/litre during 1985. Payments were made twice a month in cash at the collection centres. About one third of DTF sold also privately, mostly on contract basis to urban consumers in Debre Berhan town.

183
Approximately 77% of the milk of crossbred cows was sold, while 13% was home consumed (in either liquid form or processed into butter), and 10% of production was for calf consumption through bucket feeding. (Table 6.13.). Farmers frequently sold the milk of crossbred cows, while keeping the milk of the local cows for processing into butter. This was done because of the higher butterfat content of milk of Zebu cows.
Table 6.13.: Disposal of Milk Production from Crossbred Cows (Kg/Farm)
1983 1984 1985 Mean %
Production Sales Home consumption Calf consumption
1518 1147 252 119
1764 1285 252 227
1499 1240 119 140
1594 1224 208 162
100 77 13 10
6.4.2. Gross Margins and Incomes
6.4.3. Cash Incomes
Total cash incomes of DTF were on average 120% higher than those of control farmers. This was predominately due to higher milk sales. During 1983 the increase in cash income was 148%, during 1984 it amounted to 82%, and to 149% during 1985 (Table 6.14).
There was no significant difference between DTF and CF in cash income from sources other than milk sales.
1984 followed an extremely poor agricultural year, during which crop yields failed. Control farmers had to sell a substantial proportion of their stock to generate cash to enable the purchase of food grain. DTF had a relatively higher income stability through milk sales, and were not forced to sell as many animals.
Table 6.14.: Cash Incomes of DTF and Control Farmers by Source, (1983-1985, Birr/Farm)
Source of sales
Grain Crop by-products Milk Manure Other livestock
products Trade in livestock
1983 Control
14 0
57 -
55 221
DTF
10 0
516 -
70 268
1984 Control
17 12 0
10
19 488
DTF
6 3
578 12
20 373
1985 Control
25 17 29 29
53 259
DTF
82 62
620 3
51 211
Totals 347 864 546 992 412 1029

184
6.4.4. Effects on Gross Margins
6.4.4.1. Crop Gross Margin
DTF and control farmers had similar cropping patterns and crop yields. They also similar amounts of crop inputs. Gross margins obtained in crop production were therefore similar and did not differ significantly between DTF and CF. (Table 6.15.). Estimates of gross margins and value of production were made on the basis of the methodology and assumptions reported upon in Section 4.9.2.
Table 6.15.: Gross Margin per Crop of DTF and CF (1983-1985, Birr/Ha)
1983 1984 1985
Barley Wheat Oats Temenze Horse beans Field peas Lentils Linseed
CF
200 462 136 125 146 14
119 149
DTF
212 430 125 130 164 15 95
136
CF
1243 882
1080 763 584 503 128 330
DTF
1160 877 923 865 482 129
-419
CF
385 364 341 363 239 262 31 85
DTF
385 358 201 482 42 ---
Gross margins per ha in 1983 averaged 214 Birr for control farms and 193 Birr for test farms, while during 1984 they were estimated at 569 Birr for control farms and 568 Birr for DTF. During 1985, gross margins decreased to 185 Birr/ha for CF and 184 Birr/ha for DTF. As DTF cultivated a somewhat smaller area than CF, overall gross margins per farm of DTF from crop production were somewhat lower (Table 6.16.). Gross margins varied widely between 1983 and 1985 because of the combined effects of crop failure, national food shortages and rapid market price increases. Gross margin per unit area was estimated on the basis of cultivated and fallow land.
Table 6.16.: Gross Margins from Crop Production for DTF and CF (1983-198.
Gross margin (Birr/farm)
Gross margin per unit area (Birr/ha)
Gross value of production (Birr/farm)
CF
631
214
1610
3, Birr/Farm)
1983 DTF
849
193
2140
CF
2519
569
2578
1984 DTF
2207
568
2368
CF
898
185
2118
1985 DTF
817
184
1878

1983 CF DTF
778 916 1103 1235 1326 1499
t 2/
1.54 1.19 1.31
1984 CF DTF
675 818 974 1126
1188 1364
t 2/
1.86* 1.56 1.49
185
6.4.4.2. Gross Margin from Traditional Livestock Production
DTF had somewhat larger livestock holdings than CF and as no significant different differences were observed in the productivity of livestock of local breeds, this translated into higher gross margins on a per farm basis (Table 6.17.). The methodology applied for the calculation of gross margins was as in section 4.9.2. The differences were statistically not significant except during 1984.
Table 6.17.: Gross Margin of CF and DTF from Traditional Livestock Production (1983-1985, Birr/Farm) 1/
1985 CF DTF t 2/
GM 778 916 1.54 675 818 1.86* 680 668 -0.13 GM I 1103 1235 1.19 974 1126 1.56 997 911 -0.69 GVP 1326 1499 1.31 1188 1364 1.49 1201 1092 -0.72
1/ GM = Gross Margin; GM I » Gross Margin including the value of intermediate products; GVP = Gross Value of Production.
2/ T-test is one tailed. Asterisk reflects degree of significance. If * then P<0.05. If no asterisk then the correlation is not significant.
6.4.4.3. Gross Margin from Crossbred Cow Enterprise
Economic analysis of a smallholder dairy enterprise within a subsistence setting requires making a number of assumptions. Some inputs are home produced and outputs are often consumed at home in different forms. There is no readily available market for some of the inputs or outputs. It is difficult to assign an appropriate value to a female heifer which is not yet pregnant and which has not yet started to produce milk.
To evaluate the economics of the crossbred cow enterprise gross margin analysis was used. The returns of the enterprise included milk output, manure production, sales of calves, weight gains of followers, a projected value for future milk production of heifers and the residual value of the cow. The costs included both fresh and conserved fodder, feed concentrates, residues, health care and veterinary services, depreciation of special housing and tools, breeding services, the use of hired labour and the cost of marketing. For the analysis, only farms with complete data records were taken into account. Over the three year period, 16% of farms could not be included in the analysis, because of incomplete data records.

186
Table 6.18.: Average Cost of Feed per Farm per Year by Feed Type, for the Crossbred Cow Enterprise
1983 1984 1985 Kg Birr Kg Birr Kg Birr
Green fodder 1/ 665 27 1477 66 959 24 - grass 471 1223 864 - oats 194 254 95
Dry fodder 2/ 2124 159 3468 347 4411 419 - grass hay 1650 2747 3698 - oats hay 227 194 202 - vetch hay 34 - cereal straw 213 527 511
Concentrates 3/ 284 74 565 147 217 56
Residues 4/ 59 4 169 17 119 14 - attelTa 29 119 57 - barley 30 43 55 - others 7 7
Average total feed cost 264 577 513
1/ Assuming fresh cut grass had 25% DM content and valued at 1/3 of hay cost. Green fodder at market value "as is" in the field before cutting and marketing and calculated at 4.4 centsAg during 1983, 4.5 centsAg during 1984 and 2.5 centsAg during 1985.
2/ Dry fodder as market value "as is" before cutting and excluding marketing cost, i.e. 50% of average hay cost on market. Cost per kg calculated as 7.5 cents during 1983, 11.5 cents during 1984 and 9.5 cents during 1985.
3/ Feed concentrate at 26 centsAg.
4/ Residue cost 7 centsAg in 1983, 10 centsAg in 1984 and 12 centsAg in 1985. Cost was assumed at 70% of market value because of transport expenses.
The incomplete records were due to the replacement of the cow or heifer in case of insufficient milk production or infertility, or if the farmer joined the research only in the middle of the year in which case only 6 months' records were available.
During 1983, 17 out of 20 (85%) of farms had complete records, 30 out of 37 (81%) in 1984 and 35 out of 40 (87%) during 1985.
The major cost of the crossbred cow enterprise was feed. Table 6.18. presents the average cost of feed per farm per feed type.
The cost of feed was 264 Birr/farm during 1983, 577 Birr/farm during 1984, and 513 Birr/farm during 1985. The sharp increase in prices of straw and hay during 1984 was the major causal factor for the substantial increase in feed cost, in addition to the expansion of the size of the crossbred holding through natural growth.

187
Table 6.19.: Costs and Returns of Crossbred Cow Enterprise, 1983-1985 (Birr/Farm)
Returns 1983 1984 1985
Milk sales 1/ Milk consumption 1/ Calf sales Weight gains of followers 2/ Manure 3/ Residual value of cow 4/
516 113 -
236 37
100
578 113
7 216 42
100
620 60 19
277 53
100
Subtotal
Costs
Feed cost 5/ Veterinary care 6/ Calf milk 7/ Marketing expenses 8/ Breeding 9/ Housing and tools 10/
Subtotal Gross margin
1002
264 20 68 20 10 15
397 605
1056
577 20 98 20 10 15
740 316
1129
513 20 87 20 10 15
635 494
1/ Milk sales and consumption valued at DDE price of 0.45 Birr in 1983 and 1984, and 0.50 Birr in 1985.
2/ Weight gains of followers estimated as change in liveweight of crossbred cattle from the beginning of the year, and valued at 1.5 Birr/kÇ-
3/ Manure amount calculated as 1.5% of mean annual liveweight. A DM content of 40% was assumed, and only 85% of manure was collected. Manure was valued at 0.05 Birr/kg DM.
4/ Cows rear their own replacements and can be sold after a 6 year productive life at 600 Birr.
5/ Feed costs as in Table 6.17.
6/ Veterinary care expenses include the imputed value for services given by ILCA.
7/ Milk given to calves valued as in 1/.
8/ Marketing expenses imputed at 10 cents/day for 200 days a year.
9/ Breeding cost imputed on the basis of AI cost in Addis Ababa.
10/ Housing and tools valued at 150 Birr and fully depreciated over 10 years with no residual value.

188
Gross margins of the crossbred cow enterprise are tabuled in Table 6.19. The gross margin amounted to 605 Birr in 1984, 316 Birr in 1985 and 494 Birr in 1986. The additional labour requirements of the enterprise could usually be provided by the wife and children. The enterprise added about 1 hour daily to labour requirements, for milking, calf care, barn cleaning, marketing of milk and extra hand feeding of the cow and her followers. The animals were usually tethered around the homestead or grazed by one of the children. This labour had a low opportunity cost. About 31% of farmers rented additional labour for the crossbred cow enterprise, mainly for feed collection (14%), hay cutting (11%) or herding (6%).
The major labour input to the crossbred cow enterprise was for grass cutting and hay preparation. About 64% of farmers reported that children were more involved in farm tasks as a result of the introduction of crossbred cows. More than 50% of farmers' wifes reported a significant increase in the amount of time needed for dung preparation.
On the basis of Table 6.19., production costs of milk of DTF could be estimated as 26 cents/litre in 1982, and 42 cents/litre in 1984 and 1985. The rapid increase in production costs was due to escalating feed prices. The milk price by DDE was .50 Birr/litre.
6.4.4.4. Overall Farm Gross Margin
Overall gross margins, combining the crop, and livestock enterprises were significantly higher for DTF than for control farmers (P<0.05). The crossbred cow enterprise added substantially to farm income. This is illustrated in Table 6.20.
Table 6.20.: Overall Farm Gross Margin DTF and Control Farmers (1983
Crops Livestock
traditional crossbred
1985, Birr/Farm)
1983 Control Test
631 849
778 1093 605
1984 Control Test
2519
657
2207
996 316
1985 Control
898
680
Test
817
960 494
Total 1409 2547 3176 3519 1578 2271
The overall gross margin of DTF was 81% higher than that of control farmers in 1983, 11% in 1984 and 44% higher in 1985. The crossbred cow enterprise provided 32% of the DTF gross margin in 1983, 9% in 1984 and 22% in 1985. The 1984 results are distorted because of the unusual price rises of grains during that year as a result of widespread drought. The profitability of the crop enterprise can therefore not be assessed on the basis of the unusual price ratios during that year.

189
6.4.5. Effect on Hunan Nutrition
Wagenaar-Brouwer (1985) did not find significant differences in nutritional status between DTF and control farmers. The increased milk offtake did not lead to a substantially higher family milk consumption as most of the milk was sold. During the main rainy season milk consumption of DTF increased slightly to overcome seasonal food shortages. Although on-farm consumption of cereals and pulses appeared higher on test farms, this was largely due to the greater family size. The higher cash income was used for the purchase of clothes, household items, and food. Greater amounts of dairy products, coffee/sugar and alcohol were also being consumed.
6.5. Constraints to Dairy Development
6.5.1. Background
The perception by DTF of the crossbred cows and their likely impact on family welfare was studied in two special surveys. One was undertaken in 1984 at the start of the trials, and one in 1987 more than 12 months after the end of routine data recording. During 1984, all farmers indicated satisfaction with the crossbred cow (listing as main advantages the higher income and the regular cash flow, the increase in social status and the availability of milk for children), but also pointed to problems faced in managing this dairy enterprise. The main constraint related to the shortage of feed during the dry season and the lack of feed concentrates, the difficulty of obtaining veterinary care in the absence of ILCA and the lack of sufficient water.
The survey of April 1987 was undertaken about 15 months after the formal end of routine data collection. Of the 40 DTF, three had left their respective PA's and had migrated while two farmers had sold their cows. A total of 35 DTF were interviewed. All expressed their great appreciation for the crossbred cow enterprise as it had significantly increased their income. Almost 29% had already sold crossbred offspring at substantial prices e.g., six farmers sold an 18 month old heifer at an average 300 price of Birr, or almost 50% of the original purchase price of the cow.
The major problems farmers faced with crossbred animals related to availability of feed, milk conservation and marketing, and lack of disease resistance.
6.5.2. Feed
Almost all farmers cited the shortage of feed as their major problem in managing the cow enterprise. The problem is confounded because most farmers are overstocked with animals of local breeds, despite the fact that 89% of DTF sold at least one local bovine to reduce feed demands.
Farmers had been advised to grow forage crops to produce sufficient high quality feed for the dairy cows. The widespread drought

190
in 1983 and 1984 led to sharp increase in food prices throughout the Ethiopian highlands. DTF preferred to use their arable land to grow food crops. In addition, growing oats and vetch in a mixture proved difficult.
The proportion of oats and vetch in feed intake declined from 29% in 1983 to 17% in 1984 to only 10% in 1985. The proportion of oats and vetch in dry fodder decreased from 12% in 1983 to 7% in 1984 and 4% in 1985.
Cows were fed mainly on grass and hay from pastures, and feed concentrates. The concentrates were initially provided by ILCA and farmers became very dependent on them. The main feed constraint occurred from February to July particularly when there were no or only scarce early rains, such as in 1984. The peak shortages occurred in May, June and early July. Milk yields declined dramatically during this period. During the 1987 survey, only 11% of farmers still used concentrates as a feed for their animals, as the supply was difficult. About 88% were growing oats for fodder again however.
In view of the farmers' reluctance to grow forage crops on arable land, research will have to consider an increase in the productivity of pastures, or ways to improve the feeding value of crop by-products and hay. ILCA should continue its research on the productivity of 'trifolium' species in the Wereda. If a successful technology could be developed and introduced on farms this would allow for a shortening of the fallow cycle and increase fodder productivity. ILCA is also undertaking experimental reserch at the Debre Berhan station to assess the effects of molasse/urea blocks as an animal feed supplement on milk production. Initial results obtained show highly significant effects of adding urea to feed intake on milk yields.
Milk yields decreased dramatically during the dry season. Crossbred cows have higher water requirements which were often difficult to fulfill and water stress appeared to be a major problem. The construction of ponds by the local PA's may alleviate this problem.
6.5.3. Marketing
Farmers in the Baso and Worena Wereda are located near milk collection centres of the Dairy Development Enterprise. The system of milk collection does not always operate efficiently and frequent breakdowns occur. In the absence of a collection system, farmers face severe problems in the marketing of milk, particularly during fasting periods. Although there are alternative outlets in Debre Berhan town, the absorption capacity is limited and the marketing costs are high. About 77% of DTF reported the marketing of milk to be a major constraint. They also complained of the distance of DDE collecting centres to their farms. More than 50% of farmers reported problems with the coagulation of milk.
If the crossbred cow technology is to be extended to a wider population, the marketing problem will have to be addressed. The milk collection points are not available beyond Debre Berhan town, and are accessible only to farmers living near Addis-Debre Berhan road. The

191
majority of Ethiopian highland farmers live more than one day round trip walk from all-weather-roads. For these farmers, ways and means will have to be found to process liquid milk into products such as butter and cheese, to extend the storage capacity. ILCA has initiated research in this area (O'Mahoney and Bekele, 1984; O'Mahoney and Peters, 1987). This research should focus on the female members of the household, since they are primarily responsible for milk processing.
The major economic problem is the low price of milk. The cost of production was 42 cents during 1984, compared to the price of 45 cents/ litre although the price was increased to 50 cents in 1985. The profitability of the enterprise is relatively low, particularly because of feed costs. About 30% of the farms had negative gross margins when milk production only was considered. The government should consider either an increase in the milk price or a subsidy on inputs. It should also consider linking the output price to the butterfat content of the milk, and a premium to be paid for milk supplied during the dry season.
6.5.4. Disease
Almost all farmers encountered disease problems with their crossbred cattle. The major problems were liverfluke (listed by 97% of DTF as the major health constraint), bloating (due to a too high fraction of green grass in the diet), worm infestation and foot and mouth disease. As ILCA provided veterinary services, until 1985 health problems were never a major contraint to the farmers. Veterinary drugs were difficult to obtain for farmers. The Ministry of Agriculture is using its veterinary resources to support dairy production in Service Cooperatives. Experiences at Debre Zeit (Gryseels and De Boodt, 1986) have shown the negative consequences of a lack of extension services on crossbred cow productivity. The susceptibility to disease is particularly detrimental to calves. Ways and means have to be found to reduce the high level of calf mortality.
6.5.5. Breeding
The cows provided by ILCA to DTF had a 75% fraction of exotic blood. As the ILCA bull was à purebred Friesian, the progeny was 87.5% exotic. Although Kiwuwa et al (1983) had reported superior performance of three quarter breds, this finding was not confirmed by this study. It was felt that the cows of DTF had excessive feed demands, and that milk yields were below the potential of crossbred animals. The high level of exotic blood was notably responsible for the susceptibility to disease and high calf mortality. Similar problems were experienced in the Debre Zeit area (Gryseels and De Boodt, 1986). Artificial insemination (AI) services were not available, and the halfbred bulls tested by ILCA lacked libido. Farmers were advised to use local bulls but almost all of the DTF refused to follow this practice. About 77% of farmers are now using a purebred Friesian bull from the PA. They do not want their beautiful white "ferenzi" cow to be served by an animal of local breed. As a result all farmers have offspring with an exotic blood level far above what is advisable. Efforts should be made by the Ministry of Agriculture to provide alternative breeding services, either through the provision at the PA level of suitable halfbred bulls, or through AI services.

192
6.6. Discussion
The crossbred cow technology is viable and profitable, and all DTF expressed their satisfaction with the enterprise. They cited the high income, the regular cash flow, and the greater amounts of milk and manure as its main advantages. A crossbred cow yields about 6 times as much milk as a cow of local breed.
The crossbred cow enterprise added on average almost 50% to the farm gross margin and provided income stability during poor crop years. Yet, high feed costs, exacerbated by the rapid price rises of hay and stray due to the drought, have had strong negative influences on profitability during 1984. As a result, approximately 30% of farmers had negative gross margins. To ensure widespread adoption of this technology, the economic return needs to further increase. This could be done by on-farm milk processing into more profitable products such as butter and cheese, and by using the cows as draught animals. An ex-ante evaluation of keeping the crossbred cows for work as well as for milk production, using the linear programming model discussed in section 5.3, indicated that farm gross margin would increase with a further 27%. In the adaption of the model, the assumption was made that feed requirements of cows would increase with 10%, while their milk yields would decline by 20% during working periods. Promising results with the use of crossbred cows as draught animals have been obtained in the Debre Zeit Area (Gryseels and Anderson, 1985).
In addition, during these early years, ILCA had provided farmers with substantial assistance in the form of extension advice, veterinary care and forage seeds. It is yet to be seen how well farmers will perform in the absence of ILCA and having to rely on government extension services. The results of the survey undertaken in 1987 were encouraging, and farmers clearly coped well with the gradual withdrawal of ILCA. Only a minor fraction of farmers used feed concentrates, and most DTF relied on farm grown fodder to feed the crossbred animals. If this situation can be sustained, then it is likely that dairy production will prove to be an efficient vehicle for agricultural development of the Debre Berhan area.

193
7. THE USE OF SINGLE OXEN FOR CROP CULTIVATION
7.1. Introduction
The impact of the availability of draught power on farm grain production has been highlighted in Section 4.10.2. It was shown that farmers with two or more oxen produced on average 63% more grain than farmers with no oxen, and 19% more than farmers with one ox. This was linked to the traditional practice to cultivate with paired oxen. Those farmers that do not own two oxen are dependent upon renting or borrowing arrangements to obtain the necessary animals. All farmers with less than two oxen use "mekanajo" arrangements to obtain the second animal. Those farmers with no oxen first rent one ox in exchange for labour, at a rate of two days' work for every day of oxen used. The shortage of draught power during the ploughing season is one of the major problems confronting a majority of small-holder farmers throughout the Ethiopian highlands. This situation highlighted the need to develop cultivation systems requiring less power per unit area cultivated. The need for two animals to pull the plough was challenged and it was decided to experiment with the use of local Zebu oxen as single draught animals.
7.2. Materials and Methods
During 1982, ILCA's Highlands Programme developed a yoke and harness and a modified version of the local wooden "maresha" plough suitable for use by a single ox of local breed. The traditional neck yoke designed for a pair (Figure 7.1.) was replaced by a simple, "inverted V"-type yoke and a swingletree joined by two traces made of nylon rope. A single metal skid was attached under the shortened beam to overcome the tendency of the modified "maresha" to penetrate to ground at an oblique rather than an acute angle (Gryseels et al, 1984b).
Figure 7.1.: Traditional and Modified Yoke and 'Maresha' Plough
Figure 1. Tradilionsl maresha and neck yokt
Figure 2. Wooden yoke designed (or single
Source: Gryseels et al (1984b)

194
No particular technical difficulties were encountered during the on-station trials at Debre Berhan. These trials were done with well fed oxen and organized informally. A single ox could cultivate some 60-70% of the area ploughed by a pair in a day if a rest was given regularly. Depth of cultivation was slighly shallower than with a pair of oxen and the traditional "maresha", but the desired depth could be achieved by making extra passes. The work output of the singles was considered to be adequate to warrant on-farm verification of the on-station tests.
A field day was organized during February 1983 at the Debre Berhan station to demonstrate the new cultivation technique. Farmers of the four surrounding PAs, as well as local government officials and extension workers, a total of about 85 people, attended. After the demonstration by ILCA staff, farmers were invited to try ploughing with the single ox. Many did so, and although the general consensus was that this modification of the traditional system could have its benefits, farmers were doubtful about the ability of local oxen to work singly for extended periods.
After a lengthy discussion on the advantages and possible drawbacks of single ox ploughing, farmers were invited to try this adaptation of the traditional method on their own farms. They were to do this at their own risk and expense but ILCA was to give technical advice and assist in the training of the animals to work singly. For those who did not want to modify the implement themselves, ILCA offered to sell the single ox plough and yoke at cost, or Birr 10, to be paid immediately after the next harvest. At the end of the field day, 19 farmers had volunteered to test the modified "maresha" on their own farms.
ILCA held training sessions, in which the volunteer test farmers were assisted in retraining their ox previously used as one of a pair. Most oxen adapted without difficulty, while others needed up to 2 days' retraining to work as a single animal.
In April 1983, these farmers started their land cultivation. To monitor the performance, impact and adoption problems of the new technology, a data recording system was initiated. The farmers testing the single ox system were visited twice weekly and data were collected on land holdings, cropping patterns, inputs and outputs by plot, cultivation details, draught animal usage, adoption problems related to the single ox technology, livestock inventories, and family size and composition. The data were collected by 12th grade enumerators that had previous experience in field data collection.
The objectives of the on-farm verification trial were:
- to monitor the adoption and associated problems of the single ox technology;
- to study the effect of this technology on farm productivity;
- to use the results to formulate guidelines for further component research.
The data recording continued for three cultivation seasons: 1983, 1984 and 1985. Whereas 19 farmers were monitored during 1983, this number increased to 35 in 1984 and 40 in 1985. During 1985, data

195
collection was limited to measurement of the area cultivated with single oxen. It was feared that farmers felt "obliged" to participate in the trial because of the frequent visits by enumerators. It was also felt that given the slow progress of adoption too many data were being collected, that were not strictly necessary for technology evalution. Data recording was stopped completely at the end of the 1985 cropping season. No monitoring was undertaken during 1986 but early 1987 each single ox farmer was visited once again to verify the use of the technology.
The available data were evaluated and analyzed with an Hewlett-Packard 67 hand calculator that was loaded with statistical programmes for analysis of variance. Farm sizes and their distribution were calculated using SPSS programmes on iLCA's HP 3000 mainframe. In view of the results obtained, more in-depth statistical analysis was not considered necessary.
7.3. Results
The single ox farmers (SOF) at Debre Berhan were generally young and innovative. Their mean age ranged from 32 years in 1983 to 34 years in 1985. About 55% was elementary literate, a somewhat higher fraction than control farmers. Their average family size was 4 people per household, significantly (P<0.05) smaller than the household size of control farmers (CF).
The farm size of SOF was significantly smaller than of CF, and averaged 4 ha including pasture and fallow land. The area cultivated annually per farm was significantly (P<0.01) smaller than CF and averaged 1.4 ha during 1983, 1.5 ha during 1984 and 1.6 ha during 1985. Control farmers cultivated on average almost 1 ha more during the corresponding periods.
Of the SOF, 57% cultivated less than 1.6 ha, compared to only 25% of CF. Almost 39% of SOF cultivated between 1.6 and 3 ha, compared to 50% of CF. The underlying causal factor for the difference in area cultivated between SOF and CF was the availability of draught power. Only 26% of SOF had two or more oxen, while 68% had one and 6% did not have oxen.
Adoption of the single ox ploughing system was extremely slow and its use limited to a minor faction of the arable land. ,The mean area per farm ploughed by single oxen was 910 m in 1983, 1170 m in 1984 and 1655 m in 1985. This corresponded to 7% of the area cultivated in 1983, 8% in 1984 and 10% in 1985 (Table 7.1.).
Table 7.1.: Use of Single Ox Ploughing System (1983-1985, Area Per Farm)
1983 1984 1985 Tr?l9) (n=35) TrS30)
mean area (m ) 910 1170 1655 % of all cultivated land 7 8 10 maximum use (m ) 2800 3000 5100 CV (%) 43 48 43

196
Farmers used the single ox system as from the second ploughing, and mainly on lighter soils near the homestead. Cereals only were grown on plots ploughed with single oxen, particularly barley, wheat and oats. Barley was the dominant crop, and accounted for two thirds of these plots. Overall cropping patterns of SOF were similar to those of CF.
The average cultivation depth obtained with a single ox was 14 cm during the second ploughing and 15.8 cm during the third ploughing. During seeding the mean depth obtained was 14.7 cm during the second pass, 14.7 cm during the third pass and 15.3 cm during the fourth pass. These cultivation depths were not significantly different to those obtained with paired oxen.
With a single ox it took on average 135 hours to complete all the cultivations on one ha of land, or 35% more time than the 100 hours required by a pair of oxen. It is to be noted however that the first cultivation on most of the "single ox plots" was done with paired oxen, so the cultivation time is somewhat underestimated. The differences in cultivation time between plots ploughed with single oxen and plots ploughed with paired oxen were significant (P<.01). They were due to the slower speed and power output of single animals.
Crop yields were slightly higher on plots cultivated with single oxen compared to the plots on the same farm ploughed with paired oxen (Table 7.2.).
Table 7.2.: Crop Yields on Plots Ploughed by Single and Paired Oxen (Kg/Ha) 1/
1983 1984 Single Pair Single Pair
Barley 445 350 1180 1040 Oats n.a. n.a. 775 625
1/ Yields reported are gross and include seed use. During 1985 crop yields were not measured.
The differences in crop yields between plots ploughed by single and paired oxen were not significant. Farmers used single oxen on well drained land near the homestead with soils of higher fertility, hence the higher average yields. There was no evidence to conclude that the higher yields were due to earlier planting dates or to reduced ox trampling. Seed use was also not significantly different between plots ploughed by single or paired oxen.
The mean weight of oxen used as singles was 281+18 kg. This weight was not significantly different from oxen owned by control farmers that had a mean weight of 275 kg. It was significantly (P<0.01) different from oxen at ILCA'S research station at Debre Berhan. The mean weight of station oxen was 343+23 kg or approximately 25% more than the weight of farmers' oxen. The Higher weight of station oxen is due to the better feeding regime, management and health care.

197
The weight of oxen used as singles varied dramatically throughout the year and ranged from 242 kg during July, when work output peaked and animal feed supplies were short, to 315 kg in November when the animals were not worked and feed supplies plentiful.
7.4. Discussion
The utilization and adoption of the single ox plough has been much below expectations. Although constraint analysis had strongly indicated that reducing the number of animals required for land cultivation would have a major impact on the availability of grain at the smallholder level, the technology never really "catched on". Farmers were interested, praised the benefits of the new technology during individual discussions and field days, indicated they would use the single ox ploughing system in the future, yet never really did so, except for trials on a modest scale. The number of farmers using the system remained a minor fraction of the farm population, and even these test farmers limited its application to one or two plots. Some of the inital reasons of the non-adoption were:
- Cultural barriers preventing farmers from adopting this radical change in tillage method.
- Risk aversion by the farmers who feared long term detrimental impact on the health of the ox.
- The weakness of many of the oxen. About 60% of farmers' oxen weighed less than 290 kg, and could not develop sufficient power and speed to pull the plough to farmers' satisfaction. However, there was no evidence that farmers with heavier oxen ploughed greater areas of land.
- Farmers complained about labour bottlenecks because of the government villagization programme and PA communal activities. As a result they faced labour bottlenecks in view of the limited time available for ploughing and the slowness of the single ox system. The speed of a single ox during ploughing was approximately 20-30% slower, and the animal needed frequent rest periods. An ox working singly needed to be rested for 15 to 20 minutes after every 1.30 hour of work, and could work a maximum of 4.30 hours a day, compared to 7-8 hours worked by a pair.
- Many plots in the Baso and Worena Wereda have a high stone cover which negatively affected work output of single oxen.
During March 1987, and more than one year after routine data recording had been phased out, a follow-up survey was undertaken to study the use of single oxen at Debre Berhan during 1986. It had been felt that farmers had participated in the verification trial to "please" ILCA, and in the hope ILCA would assist them with other matters (such as the supply of concentrate feeds, veterinary drugs or political security) in return.
198
A total of 32 farmers, all of whom were previous SOF, were interviewed. The remaining 8 farmers had either migrated, joined military service, or could not be reached. Only 31% of them (n=10) had used single oxen during the previous 1986 cropping season, on an average of 1550 m of land, ranging from 500 m to 4000 m . All used it for the planting of crops and on the lighter soils near the homestead. The single ox system was found beneficial for the planting phase, as farmers did not have to wait for a "mekanajo" arrangement and farmers recognized the importance of early planting.
About 69% of SOF did no longer use the single ox system. Almost two thirds of them found their land to be too stony or slopy, while 77% found the ploughing to be too difficult for one ox. Other major problems that were causing the non-adoption of the new technology were the lack of feed (27% of respondents), the yoke caused wounds (27% of respondents), and 23% of respondents said that they had stopped their trials because they thought ILCA had stopped its research.
About 36% of farmers encountered difficulties with the metal skid attached to the plough. This skid is required for depth control but it tends to become loosened from the beam after some use, particularly on stony land. Most farmers do not have the means to retighten the connection, and therefore once the skid becomes too loose the single ox plough is no longer operative.
A large scale on-farm verification of the single ox technology was introduced in 1984 through ILCA's ox-seed project which attempted to provide appropriate inputs in order to help farmers in drought and famine stricken areas of the Ethiopian highlands to produce their own food. The project involved the provision of food aid and, on a credit basis, seed, one ox and a single ox plough to a total of 1800 farmers who had either lost or had had to sell their oxen during the drought. The main development objective was to assist drought effected families in the target areas to re-establish agricultural production (Gryseels and Jutzi, 1986a and b ) . Draught animals are a major factor in bringing about post drought recovery in animal power based farming systems. The project also aimed at introducing single ox ploughing in such areas where severe shortages of animal power existed.
The results of the project (Gryseels and Jutzi, 1986b) indicated that the provision of an ox to these farm families was of crucial importance in helping them to regenerate their farming system, by enabling timely land cultivation. The utilization rate of the single ox plough was much below expectations. The implement was not used for inital tillage because it was considered too power demanding, particularly on the hard and dry soils, for one animal. Farmers instead resorted to 'mekanajo' agreements with neighbouring farmers. The single ox plough was used by some~farmers (although only on one or two test plots of on average 1000 m ) for second and third ploughings and for seed covering. Only farmers where routine data recording was undertaken used the new technology, thereby suggesting that these felt "obliged" to ILCA to show their interest in the technology, as a sign of gratitude for the assistance in supplying food aid and farm inputs. Farmers reported that their soils were too heavy, the oxen too weak, and the land too slopy for the use of a single ox for cultivation.

199
One important structural weakness of the single ox system appeared to be the poor stability of the single ox unit as compared with the traditional "maresha" which has a solid beam firmly attached to a rigid double neck yoke. The rigid yoke allows a team of paired oxen to stabilize each other, particularly on stony land and steep slopes. In addition, the solid beam provides the farmer with good handling ability when guiding the plough through the soil. The beam also gives the farmer firm control over the oxen, particularly when turning around after a pass, and makes it easier to lift the plough when encountering large stones or after a pass. In contrast, the loose connection of the single ox plough over the swingletree and the rope to the yoke does not provide much stability, either in controlling the oxen, or in guiding the plough. Moreover, when turning around after a pass, a farmers must lift the full weight of the plough himself, while at the same time ensure not to entangle the rear legs of the ox with the ropes (Samuel Jutzi, personal communication).
Farmers clearly prefer the inconvenience of "mekanajo" and labour exchange agreements to obtain additional oxen, rather than the single ox technology. Similar findings were experienced in the Debre Zeit area. The advantages of this technology do not sufficiently outweigh its structural deficiencies. The research findings indicate that the single ox ploughing may be of use for seed covering operations, but is unlikely to replace the use of paired oxen for land cultivation. The results of ILCA's station research before the on-farm verification stages are to be considered biased, because they were undertaken with oxen that were substantially heavier, on land that was easy to plough with no stone cover, and for trials of a limited demonstration duration. The hypothesis put forward at the start of the research, that single ox ploughing would be a attractive alternative to the traditional system of paired oxen, could not be validated for the Baso and Worena Wereda. The research merits to be continued however, but particular emphasis should be given to a clear identification of the conditions under which the technology may work effectively. As 31% of farmers were still using the technology to some extent, rejection is only partial. One hypothesis is that the technology can be applied on light soils, with limited stone cover, and on moderate slopes. It is recommended that this basic information would be generated through on-station experimental work. Renewed emphasis should also be given to research on work output of single crossbred oxen in comparison with paired local oxen. As a spillover from dairy development in the area, large numbers of crossbred males will become available in the Baso and Worena Wereda. These could be reared as draught animals. The feed demands of a pair of crossbred oxen are no doubt excessive for the resources available to a smallholder farm, but the possibilities of introducing single crossbred oxen merit further investigation.

200
SUMMARY AND DISCUSSION
8.1. Summary
Food production per caput in sub-Saharan Africa has steadily declined during the last two decades, leading to increasing poverty and widespread food shortages for many millions of people. The bulk of agricultural output in sub-Saharan Africa is produced on smallholder subsistence farms, many of which both grow crops and keep livestock. Productivity increases are urgently needed, but agricultural research efforts to date have focused mainly on cropping systems, because of their importance for food supply.
Yet, livestock are of crucial importance to agricultural and economic development. They are a major source of high quality food, provide substantial inputs into crop production, generate income and employment, and provide a form of security and investment.
The productivity of livestock in sub-Saharan Africa in terms of milk and meat has been the lowest of any world region. Increases in livestock output have been largely due to a numeric expansion of numbers, rather than yield per animal. The outcome of livestock development projects in sub-Saharan Africa has been disappointing. A major cause of the low return to investment in livestock development has been inappropriate project design, which has resulted from a lack of adequate understanding of livestock production systems. There is increasing evidence that traditional pastoralists manage their resources efficiently. To date research efforts have failed to identify technical innovations that could substantially increase the productivity of pastoral systems. The growing realization that in the short run only changes in government policies can lead to a substantial improvement of the welfare of pastoralists, has drawn greater attention to the problems and opportunities of livestock in mixed farming systems.
The majority of livestock in Africa can be found on mixed smallholder farms, which practice crop and animal husbandry in association. The role of livestock, and the interactions between the crop and livestock components of these farming systems have been poorly understood. During the late 70s, it became increasingly clear that in agricultural research high priority was to be given to acquiring basic knowledge on the contribution of livestock to the productivity of mixed smallholder farming systems.
The highlands have the highest density of both the human and livestock populations of any ecological zone in sub-Saharan Africa. Although this zone accounts for less than 5% of the total land mass of the continent, it contains almost 20% of the human and 17% of the ruminant livestock population. Almost all livestock in the highlands can be found on mixed smallholder farms. Because of the favourable climatic conditions, the highland zone is seen as having the highest potential for livestock development of all ecological zones on the continent.
This study has reviewed the role of livestock on mixed smallholder farms in the Ethiopian highlands. Ethiopia accounts for 50% of the African highland landmass and has the largest livestock herd of any

201
country on the continent. Mixed farming systems with a high level of crop-livestock integration are predominant. Research experiences gained in this country would be of relevance elsewhere in smallholder systems of the highlands of sub-Saharan Africa.
The field research for this study was undertaken in the Baso and Worena Wereda, an area near Debre Berhan, 120 km north-east of Ethiopia's capital city Addis Ababa, at an altitude of approximately 2,800 m above sea level. Data were collected through farm management and household economic surveys from a total of 170 traditional smallholder farms, located in four different peasants associations of the Baso and Worena Wereda. The information was obtained through direct measurement, observation and weekly formal interviews.
The study took a farming systems approach to the research. This approach views the farm in a holistic manner and is focused on the needs of small farmers. The research had two phases: a diagnostic phase during which the traditional farming system was studied and its constraints identified, and a design and testing phase during which two promising technologies were tested in farmer managed on-farm trials.
Only few farming systems research studies that focus on the livestock component of smallholder mixed farming systems had previously been undertaken in the African highlands. Little was thus known on how to best approach on-farm research on livestock production, and this study therefore provided a particular methodological challenge.
The diagnostic phase was undertaken from 1979 to 1984. During this phase detailed information was obtained through routine data collection and special purpose surveys on family size and composition; size of farm holdings, land use and land productivity; size and composition of livestock holdings, their management and productivity; labour use and time allocation; use of animal draught power; marketing and farm income. Household information on consumption, nutrition and time allocation was also collected and reported upon.
The Baso and Worena Wereda is representative of the higher altitude areas of the Ethiopian highlands, and located in the high potential cereal-livestock zone. The farming system is based on smallholder rainfed agriculture, annual crops planted by broadcasted seed, rudimentary implements and an ox drawn wooden plough, the 'maresha'. Land use is dominated by the production of cereals, pulses and livestock. Frost, hail and a short growing season severely limit agricultural productivity. The main crop is barley, but wheat, oats, horse beans, field peas, lentils and linseed are also grown. The average farm size is 3.28 ha of which 2.35 ha is cultivated arable land and .93 ha fallow. Approximately 30% of the area covered by the four Peasants Assocations was pasture land, which was predominantly communal. The mean livestock holding per farm consisted of 1.23 oxen, 1.5 cows, 3.45 other cattle, 11.16 sheep, 1.70 donkeys, 1.13 horses or mules, and 2.72 poulty. Almost all livestock were of local breeds. Wide variations in livestock ownership were observed. Farmers produced predominantly for subsistence consumption and only 15% of farm output was marketed.
It was shown that livestock are of crucial importance in the farming system of the Baso and Worena Wereda and that there was a high level of crop-livestock integration. During the years of the survey

202
livestock provided on average 89% of farm cash income, 53% of farm gross margin and 46% of gross value of production. Trade of animals, particularly cattle and sheep, was the main source of cash income. The main outputs of cattle were intermediate products, used as inputs into the crop enterprise, such as draught power for land cultivation and crop threshing, and manure for fertilizer and household fuel. When these intermediate functions were valued, livestock contributed on average 60% of the farm gross margin. Livestock generated a substantial amount of employment, particularly for women and children. Labour inputs for livestock production had little seasonal variation.
The availability of animal draught power was a strong factor in determining farm grain production. The level of ox ownership had a significant effect on both the yield per ha and total area cultivated of cereal production. The mean area cultivated with cereals was 1.76 ha, but farmers owning two or more oxen cultivated on average 32% more land to cereals than farmers owning no oxen. Farmers owning one ox cultivated an intermediate area. Mean cereal yield was 516 kg/ha but the yield per ha of farmers with two or more oxen was on average 35% higher than those of farmers owing no oxen.
Overall, during the study period farmers with two oxen produced on average 63% more cereal grains than farmers with no oxen. The increment due to owning one ox was estimated at 266 kg; the increment due to owning the second ox was estimated at 186 kg. It was also shown that in any one year the availability of draught power for oxenless farmers was affected by two main factors: the outcome of the previous cropping year and the duration of the short rains.
Livestock were also of prime importance in providing security and investment. Animals were purchased and sold according to the farmers' cash flow needs, and as a store of wealth. Despite the low productivity of livestock, the investment was shown to be sound. The annual rate of return to investment was estimated at 16% for sheep and 13% for cattle. Cattle and sheep provided manure which was mostly dried and used for fuel, or sold for cash on the market. Donkeys provided almost all transport of agricultural inputs and outputs.
The linkages between the crop and livestock enterprises were clearly illustrated and quantified. A strong positive correlation was found between cultivated area and livestock holding, caused by the cumulative effects of draught power and feed availability. Farmers with more animals were also more likely to use mineral fertilizer, and to hire additional labour. Approximately 40% of livestock feed intake was supplied by crop by-products, particularly cereal straws.
The main constraints to crop productivity were low soil fertility and high rates of erosion on arable land on slopes, seasonal waterlogging and insufficient surface drainage on most of the cultivated land, particularly on soils with vertic properties, and hail and frost incidence which caused a short growing season.
Livestock productivity in the smallholder farming system of the Baso and Worena Wereda was shown to be low for final outputs such as milk and meat, but high in terms of intermediate products such as draught power, investment and security, transport and fuel. The principal

203
constraint to the development of livestock production with the aim of increasing offtake of meat and milk was the importance given by farmers to these intermediate functions, as herd and flock sizes were built up accordingly. In addition, pastures are communal and as a result the optimum carrying capacity of these pastures was almost continuously exceeded. This inherent tendency for overgrazing increased the relative dependence of livestock upon cereal crop residues and stubble for feed intake.
For approximately 50% of farmers in the area, a principal constraint to increasing farm output was inadequate availability of draught power. Poor animal nutrition during the dry season, a low genetic potential of local breeds for milk and meat production, and animal health problems, particularly the high incidence of liverfluke, were identified as major constraints to an increase in livestock productivity.
On the institutional side, major constraints were found to be the system of land tenure in which farmers have users' rights rather than owners' rights over the land they till, government price policies, and the high incidence of religious church holidays.
During and after this diagnostic phase, efforts were made to specify the desirable characteristics of improved technology for the farming system. A review was made of relevant research results obtained elsewhere in the Ethiopian highlands, and on-station research was initiated on a number of possible interventions. Two technologies related to livestock production were particularly promising: the use of crossbred dairy cows for milk production, and the use of single oxen instead of the traditional pair for land cultivation. Both technologies had been tested on-station, and their likely impact on the productivity of the farming system in the Baso and Worena Wereda was evaluated ex ante through a linear programming model. The encouraging and positive results obtained led to the initiation in 1983 of farmer managed on-farm trials in the same peasants associations where the diagnostic studies had been undertaken. Each technology was tested by about 40 farmers, and its adoption and impact monitored over a three year period from 1983 to 1985. Farmers who purchased a crossbred cow were encouraged to grow a mixture of oats and vetch, so as to produce sufficient fodder. The cows were crosses between Friesian and Boran breed types and had been produced at the ILCA Debre Berhan station. Farmers participated in a group training course before the animals were delivered. All farmers participated in the trial at their own risk and expense. ILCA's inputs consisted of the provision of technical advice and some veterinary inputs, the supply of forage seeds and of occasional supplementary wheat bran. Farmers paid cash or through short term credits for material inputs received by ILCA.
The productivity of dairy test farms was compared with that of control farmers in the same area. Although family size, farm holdings and land use patterns of dairy test farmers were similar to those of control farmers, they had significantly higher farm assets, allowing them to be less risk averse. Mean milk yields of crossbred cows were 1,843 kg in the first lactation and 1,970 kg in the second lactation, or approximately six times those of cows of local breeds. The average lactation length was 332 days and milk production per cow peaked just after the main rains when grass growth on the pastures was lush. Milk

204
production was strongly correlated with rainfall. Mean birth weights of calves were 28 kg and calf mortality was estimated at 16%.
There was no difference in crop yields between both farmers groups, nor in the productivity of livestock of local breeds.
Approximately 77% of the milk of crossbred cows was sold, mainly to the milk collection centres of the Dairy Development Enterprise, while 13% of the milk was home consumed, and 10% fed to calves. Cash incomes of dairy test farmers were on average 120% higher than those of control farmers. The overall farm gross margin of dairy farmers was on average 50% higher than that of control farmers. The regularity of milk sales allowed for a stable farm income during poor crop years. The profitability of the dairy enterprise was negatively influenced during 1984 as a result of unusually strong grain price rises during that year, caused by the drought and famine situation that existed in the country. As a result, feed prices, as well as grain prices, rose dramatically. The economic return of the dairy enterprise during the period of the on-farm trial was thus less than what could be expected during normal years. Nevertheless, a follow up survey undertaken in 1987 indicated that 87% of dairy test farmers still had their crossbred cows, and all expressed their satisfaction with the enterprise which had significantly increased their income. They cited the high income, the regular cash flow, and the higher yields of milk and manure as the main benefits of the crossbred cow enterprise. Major constraints also existed with the availability of feed during the dry season, marketing of milk during the main fasting period, occasional disease problems, and the lack of appropriate breeding services. If the Ethiopian Government can supply sufficient extension services, then smallholder dairy production on the basis of crossbred cows will be an efficient vehicle for agricultural development in the Baso and Worena Wereda.
The second technology that was tested through on-farm verification trials was the use of single oxen, rather than the conventional pair, for land cultivation. Almost 50% of the farmers in the Baso and Worena Wereda do not own two oxen and are dependent upon renting or borrowing arrangements to obtain the necessary animals to form a pair.
During 1982, ILCA's highlands programme developed a yoke and harness and a modified version of the local 'maresha' plough suitable for use by a single ox of local breed. On-station trials showed that wellfed oxen could cultivate some 60-70% of the area ploughed by a pair in a day if a rest was given regularly. The work output of the single oxen was considered adequate to warrant on-farm verification of the station experiments.
Farmers were introduced to the new technology through a series of field days. During the first year of the on-farm trial, 19 farmers participated and this increased to 35 in the second, and 40 farmers in the third year. The performance of single ox farmers was monitored through farm management surveys, and the results compared with those of control farmers in the area. Single ox farmers were generally young and had smaller holdings than control farmers. Adoption of the single ox technology was slow, and the mean area cultivated by single oxen was 910 m2 in 1983, 1,170 m2 in 1984 and 1,655 m2 in 1985. This corresponded to respectively 7%, 8% and 10% of total area cultivated by the farmers

205
involved during those years. The maximum area ploughed by a single ox on an individual farm was 5,100 m2. Farmers generally used the system as from the second or third ploughing, and mainly on the lighter soils near the homestead. The cultivation depths obtained were not significantly different from those obtained with paired oxen. Cropping patterns of single ox farmers were similar to those of control farmers. Crop yields were somewhat higher on plots ploughed with single oxen, but the difference was not significant statistically. Weights of the farmer-owned oxen were significantly below those of research station oxen. Weights of oxen used as singles varied substantially throughout the year and were lowest during the month of July when work output peaked and animal feed was in short supply.
The utilization and rate of adoption of the single ox plough has been below expectations. Initially, it was felt that the slow progress was due to cultural barriers, the weakness of many oxen, labour bottlenecks, and the high stone cover of many plots.
More than a year after the formal end of the monitoring of the single ox farmers, a follow-up survey on the adoption of the technology was undertaken. Approximately 31% of single ox farmers were still using the technology, on an average of 1,550 m2 of land. All used it for seed covering only, and on the lighter soils near the homestead. Farmers felt that the single ox system was particularly beneficial for the planting activities, in view of the crucial importance of timely planting. Those farmers no longer using single oxen said they found their land to be too stony or slopy (66%), and the ploughing to be too difficult for one ox (77%). Other major problems cited were the lack of feed (27%), the yoke causing wounds (27%), and difficulties with the metal skid attached to the plough (36%).
The single ox technology was also tested in large scale verification trials in drought and famine stricken areas of the Ethiopian highlands. Adoption of the technology was equally slow and below expectations. An important structural weakness of the single ox system appeared to be the poor stability of the single ox unit as compared to the traditional "maresha". The research findings indicated that single ox ploughing may be of use for seed covering operations, but it was unlikely to replace the use of paired oxen for land cultivation. For both the crossbred dairy cow and single ox technologies guidelines for further experimental work were outlined.
8.2. Transferability of Results
The most important output of this study has been the wealth of information generated on the allocation of resources by smallholder farmers in the Ethiopian highlands. The multi-year farm level data base that was generated is unique, and can provide a solid support for the planning of agricultural development activities throughout the cereal-livestock zone. The time series data can be further explored for an analysis of particular factors where inter-year effects are likely to be important, such as for example farmers' strategies to ensure food security for the household, or the impact on crop-livestock interactions of the variability in crop yields.

206
The results and information obtained in the study are of relevance elsewhere in smallholder farming systems in the African highlands. As McDowell and Hildebrand (1980) observed for a particular system in the Philippines " ...to know and understand the interaction of the system....is to feel familiar with it wherever it is found".
The farming system studied in the Baso and Worena Wereda is similar to that of other areas in the Ethiopian highlands where ox ploughing is being used, i.e. the high and low potential cereal/livestock areas which cover 67% of the Ethiopian highland area, and which contain two thirds of its human and livestock populations. It is also representative of the farming system in large parts of Madagascar, Kenya and Zimbabwe. The experiences gained in the study are of broad relevance to other areas of the African highlands with perhaps different environments, but where the same problem classes are prevalent, such as the lack of draught power, shortage of animal feed, low cash income and lack of food security. The findings of Shumba (1983) for example indicate that in the communal areas of Zimbabwe livestock play an equally important role in smallholder farming systems with respect to draught power and cash income as in the Ethiopian highlands.
The Baso and Worena Wereda was unique in its high altitude environment, and the problem of frost relatively location specific. However, as the Quinquennial External Review of ILCA (TAC/CGIAR, 1982) observed in a review of the programme " ...although the farming systems approach involves location specificity, the demonstration of the approach is valuable to encourage national programmes to follow suit, while research on adopted technologies can have a zonal importance and transferability".
Recently, the number of FSR studies in Ethiopia has grown rapidly. Staff of the Institute of Agricultural Research have benefitted from a series of IAR-CIMMYT in-country training workshops held from 1985 to 1987. Farming systems research has now become institutionalized in IAR and there has been a rapid expansion in the number of studies undertaken (Mekuria and Franzel, 1987).
The Ministry of Agriculture in 1987 undertook a series of farming systems surveys throughout the Ethiopian highlands, with particular emphasis on the livestock component of the mixed farming system, under the Fourth Livestock Development Project funded by the World Bank.
The widespread adoption of the FSR approach in Ethiopia is encouraging. It will substantially improve the data base needed for agricultural development planning. It will also allow for an identification of different farming systems within similar agro-ecological zones and a clear specification of recommendation domains within each of those agro-ecological zones. The development of technologies can then be more easily focused towards the needs of particular target groups of farmers within a given recommendation domain. It is to be noted that agro-ecological zones in Ethiopia are very heterogeneous, and that farmer resource endowments may differ signifcantly within similar agrc-ecological zones.

207
The farming systems approach to research is rapidly adopted in the national agricultural research programmes of highland countries of sub-Saharan Africa. Countries that have recently institutionalized a systems approach in their programmes include, in addition to Ethiopia, Zimbabwe, Rwanda, Madagascar and Kenya.
The relevance of the approach was confirmed by the recent Africa Study of FAO (FAO, 1986a) which strongly recommended the use of resource and socio-economic surveys for the identification of pilot livestock development areas and programmes, and through their implementation, of replicable examples. For the mountain regions of East Africa, the FAO study recommended to give high priority to animal traction and smallholder dairy development as areas for action.
The data base gathered and experiences gained in this study has been of valuable assistance to other organizations and to Ethiopian authorities in its design of agricultural development programmes during the periods of drought and famine (TAC/CGIAR, 1986). The data and information gathered were also basic reference material for use by the various groups that have recently assessed the situation of agriculture and livestock production in the Ethiopian highlands (AACM, 1984; FAO, 1986d).
8.3. Evaluation of Methodology
As only few on-farm studies of the livestock component of smallholder mixed farming systems have been undertaken elsewhere in the African highlands, it is important that the experiences gained in this research project be documented so as to assist ILCA, national research institutes and other agencies in the planning and appraisal of future research and development activities.
At the time of the beginning of this study, only little experience was available in sub-Saharan Africa with farming systems-oriented research on the livestock component of mixed crop-livestock agriculture. The topic has since received far more attention, and has been the subject of several workshops and conferences (Butler Flora, 1984; Nordblom et al, 1985; Kearl, 1986).
The farming systems approach has been useful in identifying the major constraints to increasing farm output, and in providing a solid understanding of farmers' circumstances and decision making processes. This knowledge is essential for the development of relevant technology for the improvement of smallholder subsistence farming systems throughout sub-Saharan Africa. The failure of the majority of livestock projects in this region has shown that little "modern" technology is available that has substantial advantages over traditional methods, and that there is little scope for the transfer of western technology to subsistence farming systems, given the economic and ecological conditions facing producers (Gryseels et al, 1986a). Technology development for subsistence farming systems will have to be based on a solid understanding of the functioning of traditional agriculture and the processes of farmers' decision making. This understanding can only be provided through a farming systems approach, which can then guide research on particular components of the farming system, to be undertaken on-station under experimental conditions, for the development of relevant

208
technologies. Such an approach allows for a clear specification of desired technology characteristics, the development of impact-oriented technologies and the evaluation of technology on the basis of farmers' criteria. An inherent advantage of the farming systems approach is also that it allows non-quantitative variables, such as information on inter-household processes and farmer decision making to be taken into account in the design of new technology. This points at the same time to a possible danger of the approach, i.e. an over-reliance on enumerators for data collection. These tend to focus on the "quantitative" rather than the "qualitative" aspects of farmers' decision making.
The research reported in this study has contributed to the identification of farmers' constraints and specific areas for experimental research. iLCA's highlands programme in 1985 was restructured subsequently and implemented by four major problem driven and impact oriented sub-programmes (ILCA, 1986):
- soil/plant nutrition and agronomy
- animal power for improved management of deep black clay soils
- sheep production using indigenous breeds
- smallholder dairy production.
The accumulation of baseline data has been a long-term process, i.e. from 1979 to 1984. This is an approach that resource poor national institutes would find difficult to replicate. Rapid rural appraisal strategies (Carruthers and Chambers, 1981; Collinson, 1981; Beebe, 1985) are an attractive alternative in order to be as cost effective as possible, particularly for agencies that are short of money and staff.
Rapid rural appraisal techniques are useful for an initial analysis of the constraints to a farming system. The next step, the identification of desired technolody characteristics, is one that requires however, experienced and technically skilled staff. There is no short-cut to experience, although training courses and workshops can substantially shorten the length of time normally needed for "learning by doing". One inherent danger of rapid appraisal techniques is that inexperienced staff may opt for inappropriate technologies which may give short term productivity gains at the farm level, but which can be detrimental to long term agro-ecological stability of the region as a whole and to the sustainability of the farming system. But, as Norman and Collinson (1985) have observed, three principles must be emphasised in designing cost and time effective methods: minimize the time required to move through the different research stages (diagnostic, design and testing), maximize the returns by making results more widely applicable by defining target groups of farmers in broad terms, and be open to taking second best solutions or the best of those readily available. A good analysis of the economics of farming systems research and of the costs associated with intensive as well as extensive methods of data collection has been provided by Mclntire (1984). Stroud (1985 a and b) has developed useful guidelines for the methodology of on-farm experimentation.
Long-term data collection is valuable, however, in areas for which an adequate data base is not yet available, to enable analysis of factors

209
where inter-year effects are likely to prove important. The impact of the short rains, and of draught power availability on smallholder grain production in the Baso and Worena Wereda, would have been difficult to quantify adequately in the absence of multi-year data. Time series data are necessary to enable the establishment of a firm planning basis for development activities.
In the specification of the data needs for this study, more attention should have been given to the need for an adequate measurement of both the quantity and quality of feed intake of livestock, so as to enable the establishment of seasonal feed profiles for particular livestock species. Insufficient attention was also given to issues related to animal health. As a result the incidence and impact of liverfluke on the productivity of sheep could not adequately be documented, although it is likely to be the single most important factor limiting output from sheep production. This type of data may have to be collected however by more classical disciplinary approaches.
The harsh high altitude environment of the Baso and Worena Wereda negatively influenced the productivity of crops. The hypothesis that increases in livestock productivity would lead to higher cash incomes, which in turn would allow farmers to buy additional crop inputs and enable higher crop yields could not entirely be validated. Because of frost incidence, the use of mineral fertilizer was a risky venture given the cash outlays involved. The impact of frost on crop growth and yields also negatively affected straw production, and hence, feed availability. A major study on the nature of crop-livestock interactions in smallholder farming systems in different ecological zones of sub-Saharan Africa is currently being undertaken by ILCA in cooperation with the World Bank.
The choice of the Baso and Worena Wereda as a research site which would be representative of broad areas of the highlands was not optimal. Only in very few areas of Africa is crop growth so curtailed by low temperatures as in the study zone. The area provided a good example of an integrated crop/livestock farming system, but the opportunities for increased interaction between both system components would have been substantially higher in the absence of frost. It is also recognized that because of the difficulties in crop production, livestock holdings in the Baso and Worena Wereda are larger, and the contribution of livestock to farm cash income higher than elsewhere in the Ethiopian highlands. This does not alter the conclusions and observations made in the study. Gryseels et al (1986b) and Gryseels (1987) have made a comparative study on the impact of ox holdings on farm grain production, and the contribution of livestock to farm income, between the Debre Berhan and Debre Zeit areas of the Ethiopian highlands. The Debre Zeit area is intensively cultivated with almost no land left fallow and representative of Ethiopia's large medium altitude zone. The supplies of oxen differ markedly between the two areas, but the impact of ox ownership on farm grain production was similar, although at Debre Zeit there was no significant difference in yields per ha on the basis of ox ownership. The contribution of livestock to farm cash income was 34% and to farm gross margin (not including intermediate products) 45% at Debre Zeit.
Cooperation from farmers, peasants associations and government officials was excellent throughout the research. This was no doubt largely due to the care that was taken by ILCA staff in keeping these

210
groups fully informed of the research process and progress, and by regularly organizing field days at which ongoing research activities were discussed.
On-farm trials were initiated after a relatively brief period (less than six months in the case of the single ox technology) of on-station testing. It was felt that this was justified in order to economize on scarce resources and because there was sufficient confidence among researchers that the technology would be robust. With the benefit of hindsight, the single ox technology should have been tested under more rigorous conditions on-station, so as to enable a much clearer specification of the conditions under which the technology could be used by the target farmers.
It was unfortunate that only cows with 75% exotic blood were available for the on-farm trials. These cows have higher feed requirements and less resistance to disease than 50% crosses. But there is a limited supply of crossbred cows in Ethiopia, and those produced on government breeding ranches are allocated first to producer cooperatives. In addition, only cows of Friesian breeds were available. It is likely that crosses with the Jersey breed would be more adapted to the Baso and Worena Wereda conditions. Jersey crossbreeds have higher butterfat yields per unit of metabolic body weight than Friesians and are well adapted to temperate and tropical conditions (IAR, 1976; Kiwuwa et al, 1983; Ministry of Agriculture, 1986). This breed would therefore be of higher relevance in areas such as the Baso and Worena Wereda, where milk marketing is a constraint, and where buttermaking is a traditional practice.
The Ethiopian Government (Ministry of Agriculture, 1986) has recently published a policy for cattle breeding which encourages the introduction of crossbred dairy stock on peasant farms. The exotic blood level of such stock should however not exceed 62.5% and the use of Friesian as well as Jersey breeds is recommended.
In the mixed farming system of the highlands, Government efforts in the area of cattle breeding will focus on dairy production, while the development of beef production will be primarily concentrated on the pastoral systems in the lowlands.
In the research phase, relatively little emphasis was given to the ex ante evaluation of the proposed on-farm interventions. Only very few suitable technologies were available for the area, and there was no need for a "ranking" or "priorization" of various alternatives. A rigorous model allows for an assessment of the expected benefits (for example through an estimate of the expected net present value) of a new technology, and indicates the mechanisms how farm productivity will be affected. Alternative technologies can then be ranked accordingly to the size of the benefit stream they are expected to generate. Models can also illustrate the anticipated bottlenecks in the farming system in regard to input and output flows. Mclntire and Seyoum (1986) have developed a herd model for economic analysis of cattle production which allows for simulation of interventions such as animal supplementation.
During the on-farm trials, not enough effort was put in encouraging the farmers in producing home grown fodder. ILCA initially assisted the farmers in overcoming feed shortages by supplying feed

211
concentrates and this created a dependency. AS feed concentrates were cheap, farmers neglected their forage crops and when ILCA interrupted the supply of concentrates, a fodder "crisis" emerged. Milk yields dropped sharply, while farmers tried to organize their own cooperative supply of feed concentrates from the Debre Zeit feed mill. This proved difficult because of the government policy to give priority to the supply of cooperatives. Farmers subsequently gave more attention to the production of forage crops.
Throughout the research process, there was a close cooperation between ILCA and officials of the Ministry of Agriculture and extension agents. This was useful and essential to enable continuous interaction and feedback on the research experiences gained. As the ILCA field research activities phased out, the Ministry of Agriculture officials were fully informed of the results obtained, and took responsibility for the follow-up of the technology adoption process. This ensured a relatively smooth transition from the research to the extension phase, as the research results obtained in this study provided a basis for a major smallholder dairy development project for the area. The single ox technology is being tested further by the Ministry of Agriculture and cooperating NGO's in different areas of the Ethiopian highlands, particularly within the framework of post-drought recovery projects.
8.4. Implications for Future Research
Smallholder dairy development is becoming a major theme in government extension programmes throughout the Ethiopian highlands. Various projects have been prepared for implementation by the Ministry of Agriculture (AACM, 1985). The research results obtained in this study has provided useful background information for the project design. Back up research activities are needed to develop low cost technologies for milk processing to overcome the marketing constraints particularly during the fasting season. Encouraging results have been obtained by ILCA (O'Mahoney and Peters, 1987) but the research is ongoing. Research is also needed to improve the feed resources available. Although oats and vetch are a promising feed resource, farmers seem reluctant to grow forage crops on arable land. Ways and means have to be found to improve the nutritive value of crop residues. Although the use of molasse urea blocks as feed supplementation appears promising (Preston, 1985; ILCA, 1987), the practical difficulties of organizing their distribution to farmers have not yet been overcome.
The profitability of the dairy enterprise would increase drastically if the crossbred cows could be used simulataneously for work and milk production. Initial results of on-farm trials at Debre Zeit and of ex-ante modelling (Gryseels and Anderson, 1985) were very encouraging and has been complemented by on-station experimental work (ILCA, 1987b).
On-station work should also be undertaken to assess the productivity of 25% crosses. Although milk production of such breeds will undoubtedly be well below that of 50% crosses, they are likely to have a much higher disease resistance. In areas where extension support is not readily available, such breeds could make a very valuable contribution to milk production. Research is also needed as to the labour demands associated with improved milk processing, particularly with respect to the female members of the households.

212
The majority of Ethiopian smallholders live far away from all-weather roads, with no ready access to markets and extension service. For these farmers, research efforts should focus on further exploiting the potential of local Zebu breeds, particularly through improved nutrition.
One of the major constraints to an increase in livestock output on smallholder farms is the shortage of animal feed. Despite many years of research on pasture and forage production, only little progress has been made in developing appropriate technologies that are adopted by smallholders. In the Ethiopian highlands, forage production competes with food crops for arable land. In situations where land is scarce, forage researchers should have an awareness of the particular needs and preferences of subsistence farmers, and focus their research activities accordingly. For each target farming system and ecological zone feed profiles should be established for different livestock species, that clearly illustrate seasonal feed demands, and seasonal feed supply. This would then illustrate the gaps and help forage researchers to specify the desired forage characteristics. A selection strategy for forages would then give adequate attention to conservation quality of particular forages, select for growth on residual moisture with deep rooting species so as to make forages available into the dry season without need for supplementary irrigation, a balance between forages which can be grazed also, as opposed to only cut and carry, and to labour demands of forages to ensure that land preparation would not interfere with those of food crops (Mclntire and Debrah, 1986). Alley cropping techniques have a particularly high potential in this regard. The ILCA/IAR/ICRISAT project on vertisol development also offers substantial scope for an increase in the production of feed biomass throughout the Ethiopian highlands.
More investigations are required to determine the precise conditions under which single oxen can be used for cultivation purposes. A possible future role is on light soils, with a limited stone cover and with a slope of less than 10%. The prime use of single oxen would be for seed covering purposes, which would allow earlier planting dates. The experiences gained in development projects since 1986 should be systematically analyzed to enable definite conclusions to be drawn as to the likely future of the technology. The Highlands Reclamation Study (FAO, 1986d) calculated that, if single oxen were to replace the traditional pair for tillage, and if feed resources so released were to be used for small ruminant production, that for the high potential cereal/livestock zone the annual internal rate of return of such a project could be estimated at 12%. Given the impact of draught power availability on grain production, cultivation systems requiring less draught power have to be developed. The analysis of the effects of draught power availability on grain production as reported in this study, focused on the within-year effects of ox ownership, not on the processes by which livestock wealth is accumulated. In a dynamic perspective, draught power may also be an effect, rather than a cause of low farm incomes. This aspect merits further investigation. Another issue worthy of additional research efforts relates to the net benefits associated with an expanded use of oxen in Ethiopia.
High priority should be given to research on sheep production using local breeds. Studies should focus on selection, nutritional

213
improvement, and the development of low cost health packages. The Ethiopian highlands have a substantial potential for the development of sheep production, and the lucrative markets in the Middle East are near. ILCA has recorded very dramatic increases in sheep productivity by introducing legumes into sheep based diets (ILCA, 1986 ).
ILCA has obtained encouraging results with indigenous species of clovers, e.g. Trifolium ruepellianum, Trifolium burchellianum and Trifolium tembenze, and ways and means should be found to introduce these on communal pastures, through a cooperative programme with the PA's involved. Root crops such as fodder beet and turnip may have some potential also in these high altitude zones, but initial results at ILCA's research station were not too promising.
Attention is also to be given to crop response studies of manure, and early planting trials. Only few studies are currently available that provide this important information.
A strategy for livestock development in the highlands needs to focus first on the intermediate functions of livestock, i.e. by improving the efficiency of animal draught power utilisation, and encouraging the use of manure for fertilizer instead of fuel. Such a strategy should also focus on the development of milk production through the introduction of crossbred cows. The improvement of sheep should receive high priority if low cost technological improvements are available, but in the short term the emphasis should be on the research needed to develop these technologies. The policy implications of the findings of this study on the effects of ox-ownership are important. Major cropping areas of Ethiopia do not have sufficient ox-rearing capacity and are reliant on inflows of oxen from areas of relative surplus. As a result, herd structures differ markedly between regions. Policy makers will have to appraise the possibility of introducing rural credit schemes to allow resource-poor farmers to purchase oxen. Proper targeting of the recipients of such credits will be vital.
If the Ethiopian Government wants to increase the offtake of meat, efforts will have to be undertaken to reduce herd size and improve the nutritional status of the remaining animals. In view of the high return that the farmer obtains even under traditional management from investing in additional animals, this proposition is unlikely to receive the necessary cooperation of the target farmers.

214 -
LIST OF ABBREVIATIONS, ACRONYMS, SIGNS AND UNITS
AACM = Australian Agricultural Consulting and Management Company Pty, Ltd. (Australia)
AAMY « Adjusted Annual Milk Yield ACIAR - Australian Council for International Agricultural Research
(Australia) ADG - Average daily gain AE = Adult equivalent AMC = Agricultural Marketing Corporation ARDD = Animal Resources Development Department (Ethiopia) ARDU = Arsi Rural Development Unit (Ethiopia) ARNAB = African Research Network for Agricultural By-Products a.s.l. = above sea level
BBF = Broadbed and Furrow Birr = Ethiopian Currency, one US$ 2.07 Birr
C » Degrees Centigrade CA - Central Africa CAB = Commonwealth Agricultural Bureaux (London) CADU - Chilalo Agricultural Development Unit (Ethiopia) CF = Control Farmer CGIAR = Consultative Group on International Agricultural Research
(Washington, D.C.) CI = Calving Interval CIMMYT =•= International Maize and Wheat Improvement Centre (Mexico) CP = Crude Protein cv = Cultivar CV - Coefficient of Variation
DAP - Di-ammonium phosphate DDA » Dairy Development Agency (Ethiopia) DDE = Dairy Development Enterprise (Ethiopia) DDM = Digestible Dry Matter DM = Dry Matter DTF = Dairy Test Farmer
EA = Eastern Africa EB = Ethiopian Birr EHRS = Ethiopian Highlands Reclamation Study ENI = Ethiopian Nutrition Institute EPID = Extension and Project Implementation Department (Ethiopia) ERR = Economic Rate of Return
FAO = Food and Agriculture Organisation of the United Nations (Rome)
FSP = Farming Systems Perspective FSR = Farming Systems Research FSSP = Farming Systems Support Project (U.S.A.)

215
g = Grams GD = Growing days GDP = Gross Domestic Product GM = Gross Margin GMI = Gross Margin Including Intermediate Products GNP = Gross National Product GTZ = Gesellschaft für Technische Zusammenarbeit (FR Germany) GVP » Gross Value of Production
ha HLSQ HP HPCL HPPL
IAR IBRD
ICARDA
ICRISAT
IDA IDR IDRC IFPRI ILCA ILRAD
ISAR ISNAR
kg km-knT kw
Hectare Harveys Least Squares Hewlett-Packard High Potential Cereal-Livestock Zone High Potential Perennial-Livestock Zone
Institute of Agricultural Research (Ethiopia) International Bank for Reconstruction and Development (World Bank, Washington, D.C.) International Centre for Agricultural Research in the Dry Areas (Syria) International Crops Research Institute for the Semi-Arid Tropics (India) International Development Association (World Bank) Institute of Development Research (Ethiopia) International Development Research Centre (Canada) International Food Policy Research Institute (U.S.A.) International Livestock Centre for Africa (Ethiopia) International Laboratory for Research on Animal Diseases (Kenya) Institut des Sciences Agronomiques du Rwanda (Rwanda) International Service for National Agricultural Research (Netherlands)
Kilograms Kilometers Square kilometers kilowatt
LP = Linear Programming LPCL = Low Potential Cereal-Livestock Zone LU = Livestock Unit LW = Liveweight
Z2
! 3
m M.J. mm MOA MPP MSU
metres square metres cubic metres Megajoules millimetres Ministry of Agriculture Minimum Package Programme (Ethiopia) Michigan State University (U.S.A.)

216
N = Nitrogen N.A. = Not applicable/Not Available M.W. - Metabolic Weight NFIU - National Fertilizer and Inputs Unit (Ethiopia) NFSD » New Farming Systems Development
OFR = On-Farm Research
P = Phosphorus p.a. = Per annum PA = Peasant Association PC « Producer Cooperative PET » Potential Evapotranspiration pH = Measure of acidity (<7(/Alkalinity (>7)
Qt - Quintal (100 kg)
RRC = Relief and Rehabilitation Commission (Ethiopia)
SA = Southern Africa SAS = Statistical Analysis System SC = Service Cooperative SD » Standard Deviation SOF - Single Ox Farmer SPAAR - Special Programme for African Agricultural Research spp - Species SPSS - Statistical Package for the Social Sciences SSA « Sub-Saharan Africa
TAC « Technical Advisory Committee of the CGIAR TGM = Total Gross Margin TLU - Tropical Livestock Unit
USAID » United States Agency for International Development (U.S.A.)
US$ - United States Dollar
VCR - Value/Cost Ratio
WA - Western Africa WHO » World Health Organisation WSARP - Western Sudan Agricultural Research Project

217
REFERENCES
AACM (Australian Agricultural Consulting and Management Company Pty. Ltd.). 1984. Livestock Sub Sector Review. Four volumes. Ministry of Agriculture, Ethiopia.
AACM (Australian Agricultural Consulting and Management Company Pty. Ltd.). 1985. Dairy Rehabilitation and Development Project. Project Preparation Report. Ministry of Agriculture, Ethiopia.
Abate, Alula and Tesfaye Teklu. 1979. Land Reform and Peasant Associations in Ethiopia. A case study of two widely differing regions. Working Paper, World Employment Programme Research, International Labour Office, Geneva.
Abate, Alula and Fassil Kiros. 1980. Agrarian Reform, Structural Changes and Rural Development in Ethiopia. Working Paper, World Employment Programme Research, International Labour Office, Geneva.
Abebe, Mesfin. 1981. Soil Burning in Ethiopia. Ethiopian Journal of Agricultural Sciences 3(1): pp. 57-73.
Abebe, Mesfin. 1982. Uses of Improved Seed-bed and Fertilizers as an Alternative to Soil Burning or "Guie". Ethiopian journal of Agricultural Sciences 4(1): pp. 1-9.
Abebe, M., Mekuria M. and Gebremeskel, T. 1984. Status of Agricultural Research in Ethiopia. In: ACIAR (Australian Centre for International Agricultural Research). Proceedings of the Eastern Africa-ACIAR Consultation on Agricultural Research, 18-22 July 1983, Nairobi, Kenya.
Aggrey-Mensah, W. 1985. Cost-Benefit Analysis of Alternative Strategy Proposals for Reclaiming and Developing the Highlands. Ethiopian Highlands Reclamation Study, Working Paper 18. FAO/Ministry of Agriculture, Addis Abeba.
Agren, G. and Gibson, R. 1968. Food Composition Table for Use in Ethiopia. CNU Report No. 16. SIDA, Stockholm.
Agren, G., Eklund, A. and Lieden, S.A. 1975. Food Composition Table for Use in Ethiopia II. Ethiopian Nutrition Institute/SIDA, Addis Abeba.
Agyemang, K. 1985. An overview of sheep research in the highlands programme. Mimeograph Highlands Programme, ILCA, Addis Abeba.
Agyemang, K., Anderson, F.M. and Woldeab Woldemariam. 1984. Preliminary Evaluation of Reproductive and Productive Performance of Indigenous Sheep at Debre Berban Research Station. Mimeograph Highlands Programme, ILCA, Addis Abeba.

218
Agyemang, K., Negussie Akalework, Voorthuizen, A. and Anderson, F.H. 1985. A rapid survey of sheep production in the traditional sector of Debre Berhan, Ethiopian Highlands. In: Wilson, R.T. and Bourzat, D. (eds). Small Ruminants in African Agriculture. Proceedings of a conference held at ILCA, 30 Sept. - 4 Oct. ILCA, Addis Abeba.
Ahmad, N. 1986. Soil and Agronomic Factors Influencing Fodder Production in the Ethiopian Highlands of East Africa. PSD Working Paper No. B4. ILCA, Addis Abeba.
Akundabweni, L. 1984a. Native Clovers of the Ethiopian Highlands: the backwood champions. ILCA Newsletter 3(1): pp. 5-6. ILCA, Addis Abeba.
Akundabweni, L.M.S. 1984b. Forage Potential of Some Annual Native Trifolium Species in the Ethiopian Highlands. Ph.D. Thesis, South Dakota State University, Brookings.
Alberro, M. and Haile Mariant, S. 1982a. The Indigenous Cattle of Ethiopia, part 1. World Animal Review 41: pp. 2-10.
Alberro, M. and Haile Mariam, S. 1982b. The Indigenous Cattle of Ethiopia, part 2. World Animal Review 42: pp. 27-39
Amir, P. and Knipscheer, H.C. (eds). 1987. On-Farm Animal Research/Extension and its Economic Analysis. Proceedings of a Workshop January 19-23. Winrock International, Arkansas.
Anderson, F.M. 1983. A Strategy for Smallholder Water Development in the Ethiopian Highlands. Mimeograph Highlands Programme. ILCA, Addis Abeba.
Anderson, F.M. 1984. Draught Animal Power in Africa: An Overview. In: FAO. Animal Energy in Agriculture in Africa and Asia. FAO Animal Production and Health Paper No. 42. FAO, Rome.
Anderson, F.M. and Dillon, J.L. 1985. Farming Systems Research at the International Agricultual Research Centers and other International Groups. In: Remenyi, J.V. (ed). Agricultural systems research for developing countries: proceedings of an international workshop held at Hawkesbury Agricultural College, Richmond, N.S.W., Australia, 12-15 May 1985. ACIAR Proceedings No. 11. ACIAR, Canberra.
Anderson, F.M., Gryseels, G. and Durkin, J.W. 1986. Factors affecting smallholder grain production in the Ethiopian highlands. Paper presented at the OAU/SAFGRAD international drought symposium on food grain production in the semi-arid regions of Africa, Nairobi, 19-23 May. ILCA, Addis Abeba.
Anteneh, A. 1984. Trends in Sub-Saharan Africa's Livestock Industries. ILCA Bulletin 18: pp. 7-15. ILCA, Addis Abeba.
Arsi Rural Development Unit (ARDU). 1978. Rural Population, Land Utilisation Practices and Livestock Survey. Ardu Publication No. 13, Assella.

219
Assamenew, Getachew. 1977. The Organisation of the Meat Market in Addis Abeba. Special Study Economics Programme. ILCA, Addis Abeba.
Astatke, Abiye and Matthews, M.D.P. 1981. Progress Report of Cultivation Trials at Debre Zeit and Debre Berhan. Mimeograph Highlands Programme. ILCA, Addis Abeba.
Astatke, Abiye and Matthews, M.D.P. 1982. Progress Report of Cultivation Trials at Debre Zeit and Debre Berhan. Mimeograph Highlands Programme. ILCA, Addis Abeba.
Astatke, Abiye and Matthews, M.D.P. 1983. 1982 Progress Report of the Cultivation Trials and Related Cultivation Work at Debre Zeit and Debre Berhan. Mimeograph Highlands Programme. ILCA, Addis Abeba.
Astatke, Abiye. 1984. The use of animal power in water conservation works. M.Sc. Dissertation. Cransfield Institute of Technology, Silsoe College, Bedford, U.K.
Astatke, Abiye and Matthews, M.D.P. 1984. 1983 Progress Report of the Cultivation Trials and Related Cultivation Work at Debre Zeit and Debre Berhan. Mimeograph Highlands Programme. ILCA, Addis Abeba.
Astatke, Abiye, Bunning, S. and Anderson, F.M. 1986a. Building Ponds with Animal Power in the Ethiopian Highlands. Manual. International Livestock Centre for Africa, Addis Abeba.
Astatke, Abiye, Reed, J.D. and Butterworth, M.H. 1986b. Effect of diet restriction on work performance and weight loss of local Zebu and Boran x Friesian Crossbred Oxen. ILCA Bulletin No. 23: pp. 11-14. ILCA, Addis Abeba.
Atherton, J.S. 1984. The Evolution of a Donor Assistance Strategy for Livestock Programs in Sub-Saharan Africa. In: Simpson, J.R. and Evangelou, P. (ed). Livestock Development in Sub-Saharan Africa: Constraints, Prospects, Policy. Westview, Boulder, Colorado.
Awgichew, Kassahun. 1987. The Status of Sheep and Goat Research and Development in Ethiopia. In: Kebede, B. and L.J. Lambourne (ed). The Status of Livestock, Pasture and Forage Research and Development in Ethiopia. Proceedings of the Workshop held in Addis Abeba, 8-10 January 1985. Institute of Agricultural Research, Addis Abeba.
Beebe, J. 1985. Rapid Rural Appraisal: The Critical First Step in a Farming Systems Approach to Research. FSSP Networking Paper No. 5. FSSP, University of Florida, Gainesville.
Bellete, Solomon. 1979. An Economic Analysis of Small-Holders Agriculture in the Central Highlands of Ethiopia: A System Simulation Approach. Ph.D. Thesis, Oregon State University.
Bengtsson, B.M.I. 1983. Rural Development Research and Agricultural Innovations. Department of Plant Husbandry Report 115, Swedish University of Agricultural Sciences, Uppsala.
220
Bernsten, R.H. 1982. Analytical approaches to farming systems research with an emphasis on animal production. In: J.C. Fine and R.G. Lattimore. Livestock in Asia: Issues and Policies. IDRC, Ottawa.
Bernsten, R.H., Fitzhugh, H.A. and Knipscheer, H.C. 1984. Livestock in Farming Systems Research. In: Cornelia Butler Flora (ed). Proceedings of Kanas State University's 1983 Farming Systems Research Symposium. Animals in the Farming System. Paper No. 6. Kansas State University, Manhattan.
Bishaw, Makonnen and Gebre Medhin, Zenebech. 1983. Some socio-economic factors related to rural water use. Institute of Development Research, Research Report No. 18, Addis Abeba University, Addis Abeba.
Branning, E., Meskel, L.B., Schaar, J. and Swensson, C. 1980. Breeding activities of the Ethio-Swedish integrated and development project. World Animal Review No. 36: pp. 26-34.
Breman, H. and de Wit, C.T. 1983. Rangeland productivity and exploitation in the Sahel. Science 221: p. 134-137.
Brown, L.H. and Cochemé, J. 1973. A study of the Agroclimatology of the Highlands of Eastern Africa. Technical Note No. 125. World Meteorological Organization, Geneva.
Bruggeman, H.Y. 1987. Physiography and Soils Map of Ethiopia. Land Use Planning and Regulatory Department, Ministry of Agriculture, Addis Abeba, (in press)
Brumby, P.J. 1982. Foreword. In: H.E. Jahnke. Livestock Production Systems and Livestock Development in Tropical Africa. Kieler Wissenschaftsverlag Vauk, Kiel, West Germany.
Brumby, P.J. 1986. ILCA and Food Production in Africa. World Animal Review No. 60: pp. 33-37.
Brumby, P.J. and Gryseels, G. 1985. Stimulating Milk Production in Milk-Deficit Countries Of Africa and Asia. In: A.J. Smith (ed). Milk Production in Developing Countries. Proceedings of the conference held in Edinburgh from 2-6 April 1984, organized by the Centre for Tropical Veterinary Medicine, University of Edinburgh.
Brumby, P.J., Gryseels, G. and Stewart, R.A. 1985. The International Livestock Centre for Africa (ILCA): Objectives, Structure, Achievements and Prospects. Quarterly Journal of International Agriculture 24(1): pp. 48-62.
Butler Flora, C. (ed). 1984. Proceedings of Kansas State University's 1983 Farming Systems Research Symposium. Animals in the Farming System. Paper No.6. Kansas State University, Manhattan.
Byerlee, D. and Collinson, M. 1980. Planning Technologies Appropriate to Farmers. Concept and Procedures. Economics Program, CIMMYT, El Batan, Mexico.

221
Carruthers, I. and Chambers, R. 1981. Rapid Appraisal for Rural Development. Agricultural Administration 8(6): pp. 407-422.
Casley, D.J. and Lury, D.A. 1982. Monitoring and Evaluation of Agriculture and Rural Development Projects. Published for the World Bank by the John Hopkins University Press, Baltimore.
Central Bureau of Statistics (CBS). 1977. Integrated Rural Survey. Ministry of Finance and Planning, Nairobi, Kenya.
Chilalo Agricultural Development Unit (CADU). 1970a. Implement Research Section. Progress Report No. 2. CADU Publication No. 53, Asella.
Chilalo Agricultural Development Unit (CADU). 1970b. Animal husbandry activities 1966-1970. CADU Publication No. 56, CADU, Asella.
Chilalo Agricultural Development Unit (CADU). 1971. Implement Research Section. Progress Report No. 2. CADU Publication No. 79, Asella.
Chudleigh, P. 1976. The use of classification and description of animal production systems in the formation of priorities for agricultural research in Kenya. Agricultural Systems 1(4): pp. 281-299.
CIMMYT Economics Staff. 1984. The Farming Systems Perspective and Farmer Participation in the Development of Appropriate Technology. In: C K . Eicher and J.M. Staatz (eds). Agricultural Development in the Third World. John Hopkins University Press, Baltimore and London.
Clayton, E.S. 1961. Technical and Economic Optima in Peasant Agriculture. Journal of Agricultural Economics No. 14: pp.337-377.
Cleave, J.H. 1974. African Farmers: Labour Use in the Development of Smallholder Agriculture"? Praeger Publishers, New York.
Collinson, M.P. 1972. Farm Management in Peasant Agriculture. A Handbook for Rural Development Planning in Africa. Praeger Publishers, New York.
Collinson, M.P. 1981. A Low Cost Approach to Understanding Small Farmers. Agricultural Administration 8(6): pp. 433-450.
Collinson, M.P. 1982. Farming Systems Research in Eastern Africa: The Experience of CIMMYT and Some National Agricultural Research Services, 1976-81. MSU International Development Paper No.3, Michigan State University, East Lansing.
Collinson, M.P. 1984. Eastern African Farming Systems and Some Indications of Research Priorities. In: ACIAR (Australian Centre for International Agricultural Research). Proceedings of the Eastern Africa-ACIAR Consultation on Agricultural Research, 18-22 July 1983, Nairobi, Kenya.
Collinson, M.P. 1987. Potential and Practice in Food Production Technology Development: Eastern and Southern Africa. In: J.W.

222
Mellor, C L . Delgado and M.J. Blackie (eds). Accelerating Food Production in Sub-Saharan Africa. John Hopkins University Press, Baltimore.
Congress of the United States. 1984. Africa Tomorrow: Issues in Technology, Agriculture and US Foreign Aid - A Technical Memorandum. Office of Technology Assessment, OTA-TM-F-31, Washington, D.C.
Constable, M. 1984. Resources for Rural Development in Ethiopia. Ethiopian Highlands Reclamation Study. Working Paper 17. FAQ/Ministry of Agriculture, Addis Abeba.
Consultative Group on International Agricultural Research (CGIAR). 1981. Second Review of the CGIAR. Washington, D.C.
Cook, R.H. 1985. Methodological Summaries: Criteria for Evaluation. In: Nordblom, T.L., Awad El Karim Hamid Ahmed and Potts, G.R. (eds). 1985. Research Methodology for Livestock On-Farm Trials: proceedings of a workshop held at Aleppo, Syria, 25-28 March 1985. ICARDA/IDRC, Ottawa.
Copland, J.W. (ed). 1985. Draught Animal Power for Production. Proceedings of an international workshop held at James Cook University, Australia, 10-16 July. ACIAR Proceedings Series No. 10, Canberra.
Cossins, N. 1973. Still Sleep the Highlands: A Study of Farm and Livestock Systems in the Central Highlands of Ethiopia. Livestock and Meat Board, Addis Abeba.
Cossins, F. 1985. Wool Processing in Ethiopia. Mimeograph Highlands Programme, ILCA, Addis Abeba.
Cossins, N.J. 1985. The Productivity and Potential of Pastoral Systems. ILCA Bulletin No. 21: pp. 10-15. ILCA, Addis Abeba.
Crotty, R. 1980. Cattle, Economics and Development. Commonwealth Agricultural Bureaux, London.
Dahl, G. and Hjort, A. 1975. Having Herds: Pastoral Herd Growth and Household Economy. Department of Social Anthropology, Stockholm.
Debele, Berhanu. 1983. The Vertisols of Ethiopia: their properties, classification and management. In: Fifth Meeting of the Eastern Africa Sub-Committee for Soil Correlation and Land Evaluation. December 1983, Wad Medani, Sudan. World Soils Resources Reports No. 56. FAO, Rome.
De Boer, A.J. 1977. A Classification Scheme for African Livestock Production Systems and Its Use for Research Resource Allocation, Program Design and Project Monitoring. Occasional Economics Paper No. 7. ILCA, Addis Abeba.
De Boer, J. 1982. Livestock Development: The Asian Experience. In: J.C. Fine and R.G. Lattimore (eds). Livestock in Asia: Issues and Policies. IDRC, Ottawa.

223
De Boer, J. 1983. Design of Alternative Crops - Livestock Systems for Asian Farmers. Paper presented to Workshop on Crops - Livestock Research, April 25-28, IRRI, Philippines.
Debre Zeit Agricultural Research Station. 1982. Progress Report on Major Research Activities July 1980-June 1981. Debre Zeit, Ethiopia.
Dejene, Alemneh. 1985. Smallholder Perceptions of Rural Development and Emerging Institutions in Arssi Region Since the Ethiopian Revolution. Development Discussion Paper 192. Harvard Institute for International Development, Harvard University, Cambridge.
Dejene, Alemneh. 1987. Peasants, Agrarian Socialism and Rural ~ — i i_ J_ "*-'-; -piaT Westvie'" " J-1 "'---J--- — «•=
aer, Colorado Development in Ethiopia. Westview Special Studies on Africa. Westview Press, Boulae
Delgado, C.L. 1979. The southern Fulani farming system in Upper Volta: A model for the integration of crop and livestock production in the West African savanna. African Rural Economy Paper No. 20. Department of Agricultural Economics, Michigan State Universtiy, East Lansing.
Delgado, C.L. and Chandrashebhar G. Ranada. 1987. Technological Change and Agricultural Labor Use. In: J.W. Mellor, C.L. Delgado and M.J. Blackie (eds). Accelerating Food Production in Sub-Saharan Africa. John Hopkins University Press, Baltimore.
De Montgolfier-Kouevi, C. 1976. The Livestock Situation in Ethiopia. Mimeograph, ILCA, Addis Abeba.
De Montgolfier-Kouevi, C. and Vlavonou, A. 1983. Tendances et perspectives de l'agriculture et de l'élevage en Afrique Sub-Saharienne. Rapport de Recherche No.l. Centre International pour l'Elevage en Afrique (CIPEA), Addis Abeba.
De Pauw, E. 1987. Agro-Ecological Zones Map of Ethiopia. Land Use Planning and Regulatory Department, Ministry of Agriculture, Addis Abeba, (in press)
Dersch, D. 1985. The productivity of indigenous Zebu cows under traditional smallholder management conditions in the Debre Berhan area of the Ethiopian highlands. Dipl. Ag. Ing. Dissertation, University of Göttingen, Göttingen.
De Wilde, J.C. (ed). 1967. Experiences with Agricultural Development in Tropical Africa. Two volumes. John Hopkins Press for the World Bank, Baltimore.
Dillon, J.L. and Hardaker, J.B. 1980. Farm Management Research for Small Farmer Development. FAO Agricultural Services Bulletin No. 41. FAO, Rome.

224
Dillon, J.L. and Anderson, J.R. 1984. Concept and Practice of Farming Systems Research. In: Australian Centre for International Agricultural Research (ACIAR). Proceedings of the Eastern Africa-ACIAR Consultation on Agricultural Research, 18-22 July 1983, Nairobi, Kenya.
Doran, M.H., Low, A.R.C. and Kemp, R.L. 1979. Cattle as a Store of Wealth in Swaziland: Implications for Livestock Development and Overgrazing in Eastern and Southern Africa. American Journal of Agricultural Economics 61(1): pp. 41-47.
Eicher, C K . 1982. Facing Up to Africa's Food Crisis. Foreign Affairs 61(1): pp. 151-174.
Eicher, C K . and Baker, D.C 1982. Research on Agricultural Development in Sub-Saharan Africa: A Critical Survey. MSU International Development Paper No.l. Michigan State University, East Lansing.
Erich, Jacinta. 1983. Investigations on Fascioliasis in the Ethiopian Highlands Around Debre Berhan. Tracer Lamb Experiments. Report of a study period at ILCA. ILCA, Addis Abeba.
Ethiopian Nutrition Institute (ENI). 1980. First Round Nutritional Survey. ENI, Addis Abeba.
Ethiopian Science and Technology Commission. 1978. Proceedings of the Workshop on the Application of Science and Technology to the Development of the Livestock Sector of Ethiopia held at Nazret, March 22-24. ESTC, Addis Abeba.
Fafchamps, M. 1985. Labour Use and Productivity and Technological Change in African Smallholder Agriculture. Synthesis Report. Job and Skills Programme for Africa, International Labour Organization, Addis Abeba.
Fielding, D. 1987. Donkey Power in African Rural Transport. World Animal Review No. 63: pp. 23-30.
Fine, J.C. and Lattimore, R.G. (eds). 1982. Livestock in Asia: Issues and Policies. IDRC, Ottawa.
Fisk, E.K. 1975. The Réponse of Nonmonetary Production Units to Contact with the Exchange Economy. In: L.G. Reynolds. Agriculture in Development Theory. Yale University Press, New Haven and London.
Fitzhugh, H.A. and Byington, E.K. 1978. Systems Approach to Animal Agriculture. World Animal Review No. 27: pp. 2-6.
Fitzhugh, H.A., Hart, R.D., Moreno, R.A., Osuyi, P.O., Ruiz, M.E. and Singh, L. (eds). 1982. Research on Crop-Animal Systems. Proceedings of a Workshop organized by CATIE/CARDI/Winrock International, April 4-7, Turrialba, Costa Rica.
Food and Agriculture Organization of the United Nations (FAO). 1976. Integration of Livestock with Crop Production at a Small Farm Level. Report of the Expert Group on Livestock Programmes for Small Farmers and Agricultural Labourers in Asia and Far East. FAO, Bangkok.

225
Food and Agriculture Organization of the United Nations (FAO). 1978. Report on the Agro-Ecological Zones Project. Vol. 1: Methodology and Results for Africa. FAO, Rome.
Food and Agriculture Organization of the United Nations (FAO). 1981. Agriculture: Toward 2000. Economic and Social Development Series No. 23. FAO, Rome.
Food and Agriculture Organization of the United Nations (FAO). 1983a. The State of Food and Agriculture 1982. FAO Agriculture Series No. 15. FAO, Rome.
Food and Agriculture Organization of the United Nations (FAO). 1983b. Ethiopian Agricultural Research Project. Preparation Report. FAO/World Bank Cooperative Programme. Investment Centre. FAO, Rome.
Food and Agriculture Organization of the United Nations (FAO). 1984a. Animal Energy in Agriculture in Africa and Asia. FAO Animal Production and Health Paper No. 42. FAO, Rome.
Food and Agriculture Organization of the United Nations (FAO). 1984b. Report of the FAO Expert Consultation on Improving the Efficiency of Small-scale Livestock Production in Asia: A Systems Approach, held in Bangkok 6-10 December 1983. FAO, Rome.
Food and Agriculture Organization of the United Nations (FAO). 1985. FAQ Production Yearbook. FAO, Rome.
Food and Agriculture Organization of the United Nations (FAO). 1986a. African Agriculture: The Next 25 Years. FAD, Rome.
Food and Agriculture Organization of the United Nations (FAO). 1986b. Atlas of African Agriculture. African Agriculture: The Next 25 Years. FAO, Rome.
Food and Agriculture Organization of the United Nations (FAO). 1986c. Apports Publics aux pays en développement dans le secteur de l'élevage. Evolution et ventilation. Comité des produits: Groupe Intergouvernemental sur la viande. Douzième session 26-30 janvier, FAO, Rome.
Food and Agriculture Organization of the United Nations (FAO). 1986d. Highlands Reclamation Study Ethiopia. Final Report. Report in two volumes prepared for the Government of Ethiopia. FAO, Rome.
Food and Agriculture Organization of the United Nations (FAO). 1987a. The Fifth World Food Survey. FAO, Rome.
Food and Agriculture Organization of the United Nations (FAO). 1987b. Country Tables. Basic data on the agricultural sector. Economic and Social Policy Department FAO, Rome.
Friedrich, K.H., Slangen, A.V.E., Belette, S. 1973. Initial Farm Management Survey 1972-73. Institute of Agricultural Research, Addis Abeba.

226
Fresco, L. 1984. Comparing Anglophone and Francophone Approaches to Farming Systems Research and Extension. Paper prepared for the Fourth Annual Conference on Farming Systems Research at Kansas State University, October 1984, Manhattan, Kansas.
Galal, E.S.E., Awgichew Kassahun, Kebede Beyene, Gojjam Yohannes and O'Donovan, P.O.B. 1979. A study on fattening Ethiopian sheep: I. Performance of highland lambs under feed-lot conditions. Ethiopian Journal of Agricultural Sciences, 1(1): pp. 93-98.
Galal, E.S.E., Taylor, M.S., Tsadik, T.T. and Gojjam Yohannes. 1981. Dry season grazing of lambs on cultivated pasture and their subsequent finishing performance. Ethiopian Journal of Agricultural Sciences, 3(1): pp. 15-29.
Gebrehiwet, L. 1987. The Status of Pasture and Forage Research and Development in Ethiopia. In: Kebede, B. and L.J. Lambourne (eds). The Status of Livestock, Pasture and Forage Research and Development in Ethiopia. Proceedings of the workshop held in Addis Abeba, 8-10 January 1985. Institute of Agricultural Research, Addis Abeba.
Gebrewold, Alemu. 1987. The Status of Beef Cattle Research in Ethiopia. In: Kebede, B. and Lambourne, L.J. (eds). The Status of Livestock, Pasture and Forage Research and Development in Ethiopia. Proceedings of the workshop held in Addis Abeba, 8-10 January 1985. Institute of Agricultural Research, Addis Abeba.
Gemechu, Bahru and Ephraim Mamo. 1979. A Preliminary Survey of Bovine Fascioliasis in Ethiopia. Ethiopian Journal of Agricultural Sciences. Vol 1(1): pp. 5-lTi
Getahun, Amare. 1977. Raising the productivity of peasant farmers in Ethiopia. Journal of the Association for the Advancement of Agricultural Science in Africa 4(1): pp. 27-40.
Getahun, Amare. 1978a. Zonation of the Highlands of Tropical Africa: The Ethiopian Highlands. Working Paper. ILCA, Addis Abeba.
Getahun, Amare. 1978b. Agricultural Systems in Ethiopia. Journal of Agricultural Systems 3(4): pp. 281-294.
Getahun, Amare. 1980. Agro-Climates and Agricultural Systems in Ethiopia. Agricultural Systems 5(1): pp. 39-50.
Getahun, Amare. 1984. Stability and Instability of Mountain Ecosystems in Ethiopia. Mountain Research and Development 4(1): pp. 39-44.
Getahun, Amare and Kirkby, R. 1987. Tropical African Mountain Environments and their Farming Systems. Paper presented at the International Workshop on Mountain Agriculture and Crop Genetic Resources, Kathmandu, February 16-19.
Ghose, A.K. 1985. Transforming Feudal Agriculture: Agrarian Changes in Ethiopia Since 1974. The Journal of Development Studies 22(1): pp. 127-149.-

227
Giglietti, R. and Stevan, M.R. 1986. Agro-Ecologic Characteristics of Four Peasant Associations around ILCA Research Station of Debre Berhan. Report of a post-graduate training period. ILCA, Addis Abeba.
Gilbert, E.H., Norman, D.W. and Winch, F.E. 1980. Farming systems Research: A Critical Appraisal. MSU Rural Development Paper No. 6. Department of Agricultural Economics, Michigan State University, East Lansing.
Glenn, J.C., Tessema, S., Mziray, P. and Holland, G.L. 1963. Preliminary observation on the milk production of Borana type cattle in Ethiopia. East-African Agricultural and Forestry Journal. No. 28: pp. 221.
Goe, M.R. 1983. Current Status of Research on Animal Traction. World Animal Review No. 45: pp. 2-17. FAO, Rome.
Goe, M.R. 1987. Animal Traction on Smallholder Farms in the Ethiopian Highlands. Ph.D. Dissertation, Dept. Animal Science, Cornell University, Ithaca, N.Y.
Goe, M.R. and R.E. McDowell. 1980. Animal Traction: Guidelines for Utilisation. Cornell International Agricultural Development. Mimeograph No. 81. Cornell University, Ithaca, New York.
Goe, M.R. and Gryseels, G. 1983. Animal Traction: A Technology for Smallholder Farmer. "The Courier EEC-ACP" 8(2): pp. 56-58.
Goebel, W.A and Odenyo, V.A.O. 1984. Assistance to Land-use Planning, Ethiopia. Agroclimatic resources inventory for land-use planning. Technical report two in three volumes. AG: DP/ETH/78/003. FAO, Rome.
Goericke, F.V. 1979. Social and Political Factors Influencing the Application of Land Reform Measures in Ethiopia. Research Centre for International African Development, Verlag Breitenbach, Saarbrücken.
Government of Ethiopia. 1975. A Proclamation to Provide for the Public Ownership of Rural Lands. Proclamation No. 31, Addis Abeba.
Grandin, B.E. 1987. Pastoral culture and range management: Recent lessons from Maaisailand. ILCA Bulletin 28: pp. 7-13. ILCA, Addis Abeba.
Groenewold, H.H. 1983. Some Observations on Livestock in Asia. Mimeograph. FAO/World Bank Cooperative Programme. FAO, Rome.
Griffin, K. and Hay, R. 1985. Problems of Agricultural Development in Socialist Ethiopia: An overview and a suggested strategy. The Journal of Peasant Studies 13(1): pp. 37-66.
Gryseels, G. 1979. A Financial Analysis of Some Smallholder Dairy Farms. Report on the DDA Dairy Project. Mimeograph, ILCA, Addis Abeba.

228
Gryseels, G. and Astatke, A. 1982. On-Farm Evaluation of Improved Technologies: The Use by Smallholders of a Single Indigenous Ox for Crop Cultivation. Research Protocol, Highlands Programme, ILCA, Addis Abeba.
Gryseels, G. 1983a. Livestock in FSR for Smallholder Agriculture: ILCA's Highlands Programme. In: Government of the Republic of Rwanda and the International Service for National Agricultural Research. Report of a Seminar on Agricultural Research in Rwanda: Assessment and Perspectives. ISNAR, The Hague, Netherlands.
Gryseels, G. 1983b. La Recherche Zootechnique au Rwanda. Consultant's Report to the IBRD. ILCA, Addis Abeba.
Gryseels, G. and Anderson, F.M. 1983a. Research on Farm and Livestock Productivity in the Ethiopian Highlands. Initial Results 1977-1980. ILCA Research Report No.4. ILCA, Addis Abeba.
Gryseels G. and Anderson, F.M. 1983b. Farming Systems Research in ILCA's Highlands Programme. Farming Systems Support Project Newsletter 1(3): pp. 7-10. FSSP, University of Florida, Gainesville.
Gryseels, G. 1984. On-farm animal traction research: Experiences in Ethiopia with the Introduction of the Use of Single Oxen for Crop Cultivation. In: Cornelia Butler Flora (ed). Proceedings of Kansas State Univesity's 1983 Farming Systems Research Symposium. Animals in the Farming System. Paper No.6, Kansas State University, Manhattan!
Gryseels, G. and Goe, M.R. 1984. Energy Flows on Smallholder Farms in the Ethiopian Highlands. ILCA Bulletin 17: pp. 2-9. ILCA, Addis Abeba.
Gryseels, G. and Whalen, I.T. 1984. Incorporating Nutritional Goals into International Agricultural Research. An ILCA perspective. In: Per Pinstrup-Anderson, Alan Berg and Martin Forman (eds). International Agricultural Research and Human Nutrition. IFPRI/UN Administrative Committee on Coordination. Sub-Committee on Nutrition. IFPRI, Washington, D.C.
Gryseels, G., Wagenaar, M. and Anderson, F.M. 1984a. The Impact on Income and Human Nutrition of Improving Livestock Production in Smallholder Subsistence Farming Systems: A Case Study from the Ethiopian Highlands. Paper presented at the IFPRI/SCN Workshop on Economic and Nutrition Related Program and Policy Implications of Shifts from Semi-Subsistence to Commercial Agriculture: The Need for Research. Airlie House, Virginia, 3-5 December. ILCA, Addis Abeba.
Gryseels, G., Astatke, A., Anderson, F.M. and Assamenew G. 1984b. The Use of Single Oxen for Crop Cultivation in Ethiopia. ILCA Bulletin 18: pp. 20-25. ILCA, Addis Abeba.

229
Gryseels, G. 1985. Some considerations about livestock in the diagnostic phase of FSR. Background paper prepared for the "National Orientation Workshop on Farming Systems Research in Ethiopia", organized by the Institute of Agricultural Research 23-26 September. ILCA, Addis Abeba.
Gryseels, G. and Anderson, F.M. 1985. The Use of Crossbred Dairy Cows as Draft Animals: Experiences from the Ethiopian Highlands. In: T.L. Nordblom, A.K.H. Ahmed and G.R. Potts (eds). Research Methodology for Livestock On-Farm Trials. Proceedings of a workshop held at ICARDA, Aleppo, Syria, 25-28 March. IDRC, Ottawa and ICARDA, Aleppo.
Gryseels, G. and Assamenew, G. 1985. Links Between Livestock and Crop Production in the Ethiopian Highlands. ILCA Newsletter 4(2): pp. 5-6. ILCA, Addis Abeba.
Gryseels, G. 1986. Difficulties in Evaluating On-Farm Experiments with Livestock: examples from the Ethiopian highlands. In: Steve Kearl (ed). Livestock in Mixed Farming Systems: Research methods and priorities. FSSP Network Report No.2. Proceedings of the ILCA/FSSP Workshop on "Livestock in mixed farming systems" held at ILCA, 24-27 June 1985. FSSP, University of Florida, Gainesville.
Gryseels, G. and Durkin, J. 1986. Some factors affecting grain production in the Ethiopian highlands. Working document, Highlands Programme, ILCA, Addis Abeba.
Gryseels, G. and Jutzi, S. 1986a. Regenerating Farming Systems after Drought: ILCA's Ox/Seed Project. ILCA Newsletter 5(1): pp. 1-3 ILCA, Addis Abeba.
Gryseels, G. and Jutzi, S. 1986b. Regenerating Farming systems after Drought: ILCA's Ox/Seed Project, 1985 Results. Mimeograph Highlands Programme. ILCA, Addis Abeba.
Gryseels, G. and De Boodt, K. 1986. Integration of Crossbred Cows (Boran x Friesian) on Smallholder Farms in the Debre Zeit Area of the Ethiopian Highlands. Mimeograph Highlands Programme, ILCA, Addis Abeba.
Gryseels, G., Mclntire, J. and Anderson, F.M. 1986a. Research with a Farming Systems Perspective at ILCA. ILCA Bulletin 25: pp. 17-22. ILCA, Addis Abeba.
Gryseels, G., Anderson, F.M., Durkin, J. and Assamenew Getachew. 1986b. Draught Power and Smallholder Grain Production in the Ethiopian Highlands. ILCA Newsletter 5(4): pp. 5-7. ILCA, Addis Abeba.
Gryseels, G. 1987. The role of livestock in the generation of smallholder farm income in two distinct vertisol areas of the Central Ethiopian highlands. Paper presented at the ILCA/ICRISAT/Government of Ethiopia conference on 'Livestock and the Improved Management of Deep Black Clay Soils (Vertisols) in Sub-Saharan Africa', 31 August - 4 September 1987, ILCA, Addis Abeba.

230
Haile, Astatke. 1977. Results of experiments in forage crops and pasture management in the highlands of Ethiopia 1971-76. IAR Forage and Range Bulletin No. 1. IAR, Addis Abeba.
Haile, Astatke. 1983. Ecological factors influencing pasture growth and plant selection criteria in the central highlands of Ethiopia. Ethiopian Journal of Agricultural Sciences 5(1): pp. 50-63.
Haque, I. and Jutzi, S. 1984a. Effects of Improved Drainage and Fertilization on the Growth of Italian Ryegrass and Oats on a Soil with Vertic Properties at Debre Berhan, Ethiopia. ILCA Newsletter Vol. 3(4): pp. 5-6. ILCA, Addis Abeba.
Haque, I. and Jutzi, S. 1984b. Nitrogen Fixation by Forage Legumes in Sub-Saharan Africa: Potential and Limitations. ILCA Bulletin 20: pp. 2-13. ILCA, Addis Abeba.
Haque, I., Jutzi, S. and Neate, P.J.H. (eds). 1986. Potential of Forage Legumes in Farming Systems of Sub-Saharan Africa. Proceedings of a workshop held at ILCA, Addis Abeba, Ethiopia, 16-19 September 1985. I1CA, Addis Abeba.
Hardaker, J.B. 1979. A Review of Some Farm Management Research Methods for Small-Farm Development in LDC's. Journal of Agricultural Economics 30(3): pp. 315-327.
Hardaker, J.B., Anderson, J.R. and Dillon, J.L. 1984. Perspectives on Assessing the Impacts of Improved Agricultural Technologies in Developing Countries. Australian Journal of Agricultural Economics 28(2).
Harrington, L.W. and Tripp, R. 1984. Recommendation Domains: A Framework for On-Farm Research. Economics Program Working Paper 02/84. CIMMYT, Mexico.
Harrison, P. 1987. The Greening of Africa: Breaking Through in the Battle for Land and Food. An International Institute for Environment and Development-Earthscan Study. Paladin Grafton Books, London.
Harvey, W.R. 1977. User's guide to least-squares and maximum likelihood computer program. Ohio State University, Colombus.
Hawkesworth, D.L. (ed). 1984. Advancing Agricultural Production in Africa. Proceedings of CAB's First Scientific Conference, Arusha, Tanzania, 12-18 February 1984. Commonwealth Agricultural Bureaux, Slough U.K.
Hazell, P.B.R. and Norton, R.D. 1986. Mathematical Programming for Economic Analysis in Agriculture. Macmillan Publishing Company, New York.
Henricksen, B.L. and Durkin, J.W. 1985. Moisture availability, cropping period and the prospects for early warning of famine in Ethiopia. ILCA Bulletin 21: pp. 2-9. ILCA, Addis Abeba.

231
Heyer, J. 1971. A Linear Programming Analysis of Constraints on Peasant Farming. Food Research Institute Studies 10(1): pp. 55-68.
Hoben, A. 1979. Lessons from a Crtical Examination of Livestock Projects in Africa. AID Program Evaluation Working Paper No. 26. USAID, Washington, D.C.
Horton, D. 1986. Assessing the Impact of International Agricultural Research and Development Programs. World Development 14(4): pp. 453-458.
Hrabowszky, J.P. 1981. Livestock Development: Toward 2000 with special reference to developing countries. World Animal Review No. 40: pp. 2-16. FAO, Rome.
Huffnagel, H.P. 1961. Agriculture in Ethiopia. FAO, Rome.
Humphrey, J.M. 1980. The Classification of World Livestock Systems. Study Prepared for the Animal Production and Health Division. FAO, Rome.
Information Technology and Agricultural Development/Agricultural and Industrial Development Bank Ethiopia (ITAD/AID Bank). 1986. Draft oxen evaluation study report. Addis Abeba.
Institute of Agricultural Research (IAR). 1969. Holetta Research Station progress report for the period April 1969 to March 1970, IAR, Addis Abeba.
Institute of Agricultural Research (IAR). 1972. Progress report for the period April 1971 - March 1972. IAR, Addis Abeba.
Institute of Agricultural Research (IAR). 1976. Results of experiments in animal production, 1966/67-75. Animal Production Report No. 1. IAR, Addis Abeba.
Institute of Agricultural Research (IAR). 1979. Handbook for Crop Production in Ethiopia. IAR, Addis Abeba.
Institute of Agricultural Research (IAR). 1982a. Animal Science, Forage and Range Management Department progress report, 1980 to March 1982. IAR, Addis Abeba.
Institute of Agricultural Research. 1982b. Animal Science, Forage and Range Management Department progress report April 1981 to March 1982. Addis Abeba, Ethiopia.
Institute of Agricultural Research. 1983. Animal Science, Forage and Range Management Department progress report April 1982 to March 1983. Addis Abeba, Ethiopia.
International Agricultural Research Centers (iARCs). 1987. Proceedings of the Workshop on Farming Systems Research, 17-21 February 1986, ICRISAT Center, India. International Crops Research Institute for the Semi-Arid Tropics, India.

232
International Livestock Center for Africa (ILCA). 1978. Animal Production Systems in the high potential highlands of tropical Africa. Working paper Highlands Programme. ILCA, Addis Abeba.
International Livestock Center for Africa (ILCA). 1979a. Non Tariff Barriers Facing Beef Trade and their Impact on Exports from Tropical Africa. ILCA Bulletin No. 5: pp. 4-9. ILCA, Addis Abeba.
International Livestock Center for Africa (ILCA). 1979b. Trypanotolerant Livestock in West and Central Africa. 2. ILCA, Addis Abeba.
Monograph
International Livestock Center for Africa (ILCA). 1980a. Economic Trends. Livestock Production Prospects for Tropical Africa in the Year 2000. ILCA Bulletin No. 10, ILCA, Addis Abeba.
International Livestock Center for Africa (ILCA). 1980b. Pastoral Development Projects. Report on a workshop on the Design and Implementation of Pastoral Development Projects for Tropical Africa, Addis Abeba, 25-29 February. ILCA Bulletin No. 8, ILCA, Addis Abeba.
International Livestock Center for Africa (ILCA). 1981a. Animal Traction in Sub-Saharan Africa. ILCA Bulletin No. 14. ILCA, Addis Abeba.
International Livestock Center for Africa (ILCA). 1981b. ILCA Research 1980. ILCA Bulletin No. 13. ILCA, Addis Abeba.
International Livestock Center for Africa (ILCA). 1981c. Dairy Development. ILCA Bulletin 11. ILCA, Addis Abeba.
International Livestock Center for Africa (ILCA). Report 1982. ILCA, Addis Abeba, Ethiopia.
1982a. ILCA Annual
International Livestock Center for Africa (ILCA). 1982b. Debre Berhan Research Station Annual Report 1981. ILCA, Addis Abeba, Ethiopia.
International Livestock Center for Africa (ILCA). Report 1981. ILCA, Addis Abeba, Ethiopia.
1982c. ILCA Annual
International Livestock Center for Africa (ILCA). 1983a. Pastoral Systems Research in sub-Saharan Africa. Proceedings of the IDRC/ILCA Workshop held at ILCA, 21-24 March. ILCA, Addis Abeba.
International Livestock Center for Africa (ILCA). Report 1983. ILCA, Addis Abeba.
International Livestock Center for Africa (ILCA). Report 1984. ILCA, Addis Abeba.
1983b. ILCA Annual
1984. ILCA Annual
International Livestock Center for Africa (ILCA). 1986. ILCA Annual Report 1985/86. Serving African Agriculture. ILCA, Addis Abeba.

233
International Livestock Center for Africa (ILCA). 1987a. ILCA's Strategy and Long-Term Plan. Addis Abeba.
International Livestock Center for Africa (ILCA). 1987b. ILCA Annual Report 1986/87. A year of progress and change. ILCA, Addis Abeba.
International Service for National Agricultural Research (ISNAR). 1987. Review of Research Program Management and Manpower Planning at the Institute of Agricultural Research in Ethiopia. The Hague, Netherlands.
Jahnke, H.E. 1982. Livestock Production Systems and Livestock Development in Tropical Africa. Kieler Wissenschaftsverlag Vauk. Kiel, West Germany.
Jahnke, H.E., and Getachew Asamenew. 1983. An assessment of the recent past and present livestock situation in the Ethiopian highlands. Ethiopian Highlands Reclamation Study Working Paper No. 7. FAQ/Ministry of Agriculture, Addis Abeba.
Jahnke, H.E. 1984. Livestock Development in the Framework of a Highland Reclamation Study. Ethiopian Highlands Reclamation Study. Working Paper 16. FAO/Ministry of Agriculture, Addis Abeba.
Jahnke, H.E., Kirschke, D. and Lagemann, J. 1987. The Impact of Agricultural Research in Tropical Africa. A Study of the Collaboration between the International and National Research Systems. CGIAR Study Paper No. 21. World Bank, Washington, D.C.
Jasiorowski, H.A. 1973. Twenty Years with No Progress? World Animal Review No 5: pp. 1-5.
Jepsen, O.J. and Creek, M.J. 1976. Comparative fattening performance of two types of cattle in Ethiopia. World Review Animal Production 12(1): pp. 83-89.
Jolly, A.L. 1952. "Unit Farms". Tropical Agriculture Trin. 29: pp. 172-179.
Jones, W.I. and Egli, R. 1984. Farming Systems in Africa. The Great Lakes Highlands of Zaire, Rwanda and Burundi. World Bank Technical Paper No. 27. World Bank, Washington, D.C.
Jutzi, S. and Gryseels, G. 1984a. Farmers Switch to Oats in the Ethiopian Highlands. ILCA Newsletter 3(3): pp. 3-4. ILCA, Addis Abeba.
Jutzi, S. and Gryseels. 1984b. Oats, A New Crop in the Ethiopian Highlands. PGRC/E-ILCA Germplasm Newsletter No. 5. Plant Genetic Resource Centre, Addis Abeba.
Jutzi, S. and Haque, I. 1984. Some effects of P and N/P fertilization on three African clovers (Trifolium tembense, T. rueppellianum and T. steudneri) on a P-deficieht vertisol. ILCA Newsletter 3(2): pp. 5-6.
234
Jutzi, S. and Goe, M.R. 1987. Draught Animal Technologies for the Intensification of Smallholder Crop-Livestock Farming in the Ethiopian Highlands. Mimeograph, ILCA, Addis Abeba.
Jutzi, S. and Abebe, Mesfin. 1987. Improved Agricultural Utilisation of Vertisols in the Ethiopian Highlands. An Interinstitutional Approach. In: International Board for Soil Research and Management Inc. (IBSRAM). Management of Vertisols Under Semi-Arid Conditions. Proceedings of the First Regional Seminar on Management of Vertisols Under Semi-Arid Conditions, 1-6 December 1986, Nairobi.
Jutzi, S., Anderson, F.M. and Astatke, Abiye. 1987a. Low-cost modifications of the traditional Ethiopian tine plough for land shaping and surface drainage of heavy clay soils: Preliminary results from on-farm verification trials. ILCA Bulletin No. 27: pp. 28-31. ILCA, Addis Abeba.
Jutzi, S., Assamenew, Haque, I., Tedla, A. and Astatke, A. 1987b. Intermediate technology for increased food and feed production from deep black clay soils in the Ethiopian highlands. Paper presented at the FAO/SIDA Seminar on Increased Food Production through Low-Cost Food Crops Technology, held 1-17 March, Harare, Zimbabwe. ILCA, Addis Abeba.
Jutzi, S., Haque, I. and Tedla, A. 1987c. The production of animal feed in the Ethiopian highlands: potentials and limitations. Paper presented at the First National Livestock Conference, March 11-13, IAR, Addis Abeba.
Kahurananga, J. and Tsehay, A. 1984. Preliminary Assessment of Some Annual Ethiopian Trifolium Species for Hay Production. Tropical Grasslands 18(4): pp. 215-217.
Kearl, S. (ed). 1986. Livestock in mixed farming systems. Research Methods and Priorities. Proceedings of a workshop held at the International Livestock Center for Africa, Addis Abeba, Ethiopia, 24-27 June 1985. ILCA/FSSP, University of Florida.
Kebede, Beyene. 1987. The Status of Dairy Research and Development in Ethiopia. In: Kebede, B. and L.J. Lambourne (eds). The Status of Livestock, Pasture and Forage Research and Development in Ethiopia. Proceedings of the workshop held in Addis Abeba, 8-10 January 1985. Institute of Agricultural Research, Addis Abeba.
Kebede, Beyene and Lambourne, L.J. (eds). 1987. The Status of Livestock Pasture and Forage Research and Development in Ethiopia. Proceedings of the workshop held in Addis Abeba, 8-10 January 1985. IAR, Addis Abeba.
Kiros, Fassil G. 1976. An estimate of the proportion of the potential work-year allocated to socio-cultural observances in rural Ethiopia. Ethiopian Journal of Development Research 2(2): pp. 15-28.

235
Kiwuwa, G.M., Trail, J.C.M., Kurtu, M.Y., Worku, G., Anderson, F.M. and Durkin, J. 1983. Crossbred dairy cattle productivity in Arssi Region, Ethiopia. ILCA Research Report No. 11, ILCA, Addis Abeba.
Kjaerby, F. 1983. Problems and Contradictions in the Development of Ox-Cultivation in Tanzania. Research Report No. 66. Scandinavian Institute of African Studies, Uppsala.
Knipscheer, H.C. 1985. Definition of Research Problems. In: Nordblom, T.L., Ahmed, A.K.H. and Potts, G.R. (eds). 1985. Research Methodology for Livestock On-Farm Trials: Procceedings of a workshop held at Aleppo, Syria, 25-28 March. IDRC. Ottawa amd ICARDA. Aleppo.
Knutsson, K.E. and Selinus, R. 1970. Fasting in Ethiopia. An Anthropological and Nutritional Study. The American Journal of Clinical Nutrition 23(7): pp. 956-969.
Leander, L. 1969. A Case Study of Peasant Farming in the Digelu and Yeloma Areas, Chilalo Awraja, Ethiopia. CADU publication No. 22. Chilalo Agricultural Development Unit, Addis Abeba.
Lebbie, S.H.B. 1984. Food Security in Africa - The Role of Farm Livestock. In: A.O. Tantawy (ed). Proceedings of the AFAA Fifth General Conference on Food Security in Africa, Swaziland 22-28 April. Association of Faculties of Agriculture in Africa, Rabat.
Leithmann-Fruh, G.A. 1983. Scope of Quantitative Analysis of Development Strategies in Subsistence-Oriented Farms. The Case of Smallholder Development in the Ethiopian Highlands"! Marchai und Natzenbacher Wissenschaftsverlag, Krefeld.
Lele, Uma. 1975. The Design of Rural Development. Lessons from Africa. Published for the World Bank by the John Hopkins University Press, London and Baltimore.
Lele, Uma. 1984. Rural Africa: Modernization, Equity and Long-Term Development. In: C K . Eicher and J.M. Staatz (eds). Agricultural Development in the Third World. John Hopkins University Press, Baltimore and London.
Makonnen, Telahun. 1978. Agriculture in Tegulat and Bulga. Socio-Economic Study of Subsistence Farmers. Highlands Programme, ILCA, Addis Abeba.
Makonnen, Telahun and Getachew Assamenew. 1978. Traditional Agricultural Systems in Ada District, Ethiopia. Mimeograph, ILCA, Addis Abeba.
Marousek, G.E., Vrooman, C.W., Thompson, L.I. and Broadbent, E.E. 1969. Development of the Ethiopian Livestock Industry. Report No.7. Stanford Research Institute , Menlo Park.
Maynard, L.A., Loosli, J.K., Hintz, J.F., Warner, R.G. 1979. Animal Nutrition. 7th Edition, Mc Graw Hill Pub., New Delhi.

236
Maxwell, S. 1986a. The Role of Case Studies in Fanning Systems Research. Agricultural Administration No. 21: pp. 147-180.
Maxwell, S. 1986b. Food Aid to Ethiopia: Disincentive effects and commercial displacement. Institute of Development Studies, University of Sussex.
McCown, R.L., Haaland, G. and De Haan, C. 1979. The Interaction Between Cultivation and Livestock Production in Semi-Ar id Africa. In: A.E. Hall, G.H. Cannell and H.W. Lawton. Agriculture in Semi-Arid Environments, Springer-Verlag, New York.
McDowell, R.E. 1978a. Are We Prepared to Help Small Farmers in Developing Countries? Journal of Aminal Science 47(5): pp. 1184-1194.
McDowell, R.E. 1978b. Factors Limiting Animal Production in Mixed Farm Systems. Paper presented at the Conference on "Integrated Crop and Animal Production to Optimize Resource Utilisation on Small Farms in Developing Countries", Oct. 18-23, Rockefeller Foundation Conference Center, Bellagio, Italy. Cornell University, Ithaca.
McDowell, R.E. 1979. Improvement of Livestock Production in Warm Climates. W.H. Freeman and Company, San Francisco.
McDowell, R.E. and Hildebrand, P. 1980. Integrated Crop and Animal Production: Making the Most of Resources Available to Small Farms in Developing Countries. Proceedings of a conference organized by the Rockefeller Foundation, Bellagio October 18-23, 1978. Working Paper Rockefeller Foundation, New York.
Mclntire, J. 1984. Survey Costs and Rural Economics Research. In: P.J. Matlon, Cantrell, R., King, D. and Benoit-Cattin, M. (eds). Coming Full Circle: Farmer's Participation in the Development of Technology. IDRC, Ottawa.
Mclntire, J. 1985. Allocation of Livestock Research Resources in Sub-Saharan Africa. ILCA Bulletin No. 22: pp. 2-8. ILCA, Addis Abeba.
Mclntire J. 1986. On the Alleged Difficulties of On-Farm Research with Livestock. In: Kearl, S. (ed). Livestock in Mixed Farming Systems. Research Methods and Priorities. FSSP Network Report No. 2. Proceedings of the ILCA/FSSP Workshop held at ILCA, June 24-27 1985. FSSP, University of Florida, Gainesville.
Mclntire, J. and Seyoum, E. 1986. Herd Model for Economic Analysis. Mimeograph Livestock Economics Unit, ILCA, Addis Abeba.
Mclntire, J. and Debrah, S. 1986. Forage Research in Smallholder and Pastoral Production Systems. Paper presented at the ARNAB Workshop on "The Utilization of Crop Residues and Agro-Industrial By-Products with Special Emphasis on Technologies Applicable to Small-Scale African Farmers", Blantyre, Malawi, August 31-September 5. ILCA, Addis Abeba.

237
Mclntire, J. and Gryseels, G. 1987. Crop-Livestock Interactions in Sub-Saharan Africa and their Implications for Farming Systems Research. Experimental Agriculture 23(6): pp. 235-243.
Mekuria, M. and Franzel, S. 1987. Farming Systems Research in the Institute of Agricultural Research, Ethiopia: Evolution, Impact, Issues. FSSP Newsletter 5(3): pp. 16-20. FSSP, University of Florida, Gainesville.
Mela, Awole. 1985. An Empirical Approach for Establishing Research Priorities for Smallholder Agriculture in Ethiopia: An Economic Analysis. Ph.D. Thesis, University of Wales, Aberystwyth.
Mellor, J.W., Delgado, C.L. and Blackie, M.J. (ed). 1987. Accelerating Food Production in Sub-Saharan Africa. John Hopkins University Press, Baltimore.
Menz, K.M. and Knipscheer, H.C. 1981. Location Specificity Problem in Farming Systems Research. Agricultural Systems 7: pp. 95-103.
Merrill-Sands, D. 1986a. The Technology Applications Gap: Overcoming Constraints to Small-Farm Development. FAO Research and Technology Paper No. 1. FAO, Rome.
Merrill-Sands, D. 1986b. Farming Systems Research: Classification of Terms and Concepts. Experimental Agriculture 22(2): pp. 87-104.
Miller, D.S., Baker, J., Bowden, M., Evans, E., Holt, J., McKeag, R.J., Meinertzhagen, I., Mumford, P.M., Oddy, D.J., Rivers, J.P.W.R., Sevenhuysen, G., Stock, M.J., Watts, M., Kebede, A., Wolde-Gabriel, Y. and Wolde-Gabriel, Z. 1976. The Ethiopia Applied Nutrition Project. Proc. R. Soc. Lond. B 194, 23-48.
Ministry of Agriculture (Ethiopia). 1968. Fertilizer Demonstrations 1967/68. Freedom from Hunger Campaign, FAO Fertilizer Programme. MOA Extension Service, Addis Abeba.
Ministry of Agriculture (Ethiopia). 1975. National Policy on Sheep Research and Development. Report prepared by a Technical Committee. Addis Abeba'.
Ministry of Agriculture (Ethiopia). 1977. Report on the Small-Scale Agricultural Sample Census 1976/77. Vol. I: Land Utilization and Crop Production. Vol.11: Livestock and Poultry. Statistics Section, Planning and Programming Department, Addis Abeba.
Ministry of Agriculture (Ethiopia). 1979. Area, Production and Yield of Major Crops for the Whole Country and by Region in 1974/75 -1978/79. Addis Abeba.
Ministry of Agriculture (Ethiopia). 1980. Distribution of Land and Farm Inputs among the Farmers of Ethiopia with Special Reference to the Distribution of Traction Power. Addis Abeba.
Ministry of Agriculture (Ethiopia). 1986a. Farming Systems Surveys: Results and Analysis for Central Zone. Agricultural Advisory Team, Working Paper No. 14. Agricultural Development Department, Addis Abeba.
238
Ministry of Agriculture (Ethiopia). 1986b. Farm Models and Budgets for the Main Farming Systems in Central Zone. Agricultural Advisory Team Working Paper No. 23. Agricultural Development Department, Addis Abeba.
Ministry of Agriculture (Ethiopia). 1986c. Cattle Breeding Policy of Ethiopia. Animal and Fishery Resources Development Main Department, Addis Abeba.
Mitchelhill, B.K. 1986. Farmer Land Classifications and Their Implications. Agricultural Development Department, Ministry of Agriculture, Addis Abeba.
Montsma, G. 1962. Observations on Milk Yield, Calf Growth and Conversion Rate, on Three Types of Cattle in Ghana. II. Effects of Plane on Nutrition. Tropical Agriculture Trin. 39: pp. 123-129.
Mukassa-Mugerwa, E. 1981. A Study of Traditional Livestock Production in Ada District of Ethiopia. Mimeograph. ILCA, Addis Abeba.
Munzinger, P. (ed). 1982. Animal Traction in Africa. GTZ, Eschborn.
Musangi, R.S. 1971. The role of ruminant livestock in mixed farming in Tropical Africa. In: Papers presented to the Conference on Agricultural Research and Production in Africa September 1971. Supplement to Volume 2 of the Journal of the Association for the Advancement of Agricultural Sciences in Africa, Addis Abeba.
National Fertilizer and Inputs Unit (NFIU). 1987. Analysis of the Maize Trials and Fertilizer Recommandations Based on EPID Data (1971-1974). NFIU Working Paper No. 17. Ministry of Agriculture, Addis Abeba.
Nekby, B. 1971. CADU. An Ethiopian Experiment in Developing Peasant Farming. Prisma Publishers, Stockholm.
Nestel, B. (ed). 1984. Development of Animal Production Systems. World Animal Science, A2~ Elsevier, Amsterdam.
Nestel, B., Pratt, D.J., Thome, M. and Tribe, D. 1972. Animal Production and Research in Tropical Africa. Report of the Task Force Commissioned by the African Livestock Sub-Committee on the Consultative Group on International Agricultural Research. CGIAR, World Bank, Washington, D.C.
Newcombe, K. 1984. An Economic Justification for Rural Afforestation: The Case of Ethiopia. Energy Department Paper No. 16. World Bank, Washington D.C.
Nie, N.H, Hadlai Hull, C , Jenkins, J.G., Steinbrenner, K. and Bent, D.H. 1975. SPSS: Statistical Package for the Social Sciences. Second edition" McGraw-Hill, New York!

239
Nordblom, T.L., Ahmed, A.K.H, and Potts, G.R. (eds). 1985. Research Methodology for Livestock On-Farm Trials: Procceedings of a workshop held at Aleppo, Syria, 25-28 March. IDRC, Ottawa and ICARDA, Aleppo.
Norman, D.W. 1978. Farming Systems Research to Improve the Livelihood of Small Farmers. American Journal of Agricultural Economics 60: pp. 813-818.
Norman, D.W. 1980. The Farming systems Research Approach: Relevancy for the Small Farmer. MSU Development Paper No. 8. Michigan State University, East Lansing.
Norman, D. and Collinson, M. 1985. Farming Systems Research in Theory and Practice. In: J.V. Remenyi (ed). Agricultural Systems Research for Developing Countries: proceedings of an international workshop held at Hawkesbury Agricultural College, Richmond, N.S.W., 12-15 May. ACIAR proceedings No.11. ACIAR, Canberra.
Obradovic, 0. and Haile, A. 1971. Studies on the Potential of Borana Cattle. In: Papers presented to the Conference on Agricultural Research and Production in Africa September 1971. Supplement to Volume 2 of the Journal of the Association for the Advancement of Agricultural Sciences in Africa, pp. 303-308. Addis Abeba.
O'Donovan, P.B., Gebrewold, A., Kebede Beyene and Galal, E.S.E. 1978. Fattening studies with cross breeds (European X Zebu) bulls: 1. Performance on diets of native hay and concentrates. Journal of Agricultural Science 90: pp. 425-429.
O'Donovan, P.B. 1980. Cattle production in Ethiopia. IAR Animal Science Bulletin No. 9. IAR, Addis Abeba.
O'Mahoney, F. and Ephraim Bekele. 1985. Traditional Butter Making in Ethiopia and Possible Improvements. ILCA Bulletin No. 22: pp. 9-14. ILCA, Addis Abeba.
O'Mahoney, F. and Peters, K.J. 1987. Options for Smallholder Milk Processing in Sub-Saharan Africa. ILCA Bulletin No. 27: pp. 2-17. ILCA, Addis Abeba.
Pingali, Prabhu L., Bigot, Y. and Binswanger, H. 1986. Agricultural Mechanization and the Evolution of Farming Systems in Sub-Saharan Africa. John Hopkins University Press, Baltimore.
Pinstrup-Anderson, P. 1983. Incorporating Nutritional Goals into the Design of International Agricultural Research. Food and Nutrition Bulletin 5(3): pp. 47-56.
Powell, J.M. 1986. Manure for Cropping: A case study from Central Nigeria. Experimental Agriculture 22: pp. 15-24.
Powell, J.M. and Taylor-Powell, E. 1984. Cropping by Fulani Agropastoralists in Central Nigeria. ILCA Bulletin 19: pp. 21-27. ILCA, Addis Abeba.

240
Preston, T.R. and Lewis, K.G. 1984. The Use of Liquid Urea-Molasses Mixture for the Drought Feeding of Livestock. Mimeograph, ILCA, Addis Abeba.
Preston, T.R. 1985. Molasses as an Animal Feed/Supplement with particular reference to Ethiopia. Forage Network in Ethiopia Newsletter No. 7: pp. 14-19. ILCA, Addis Abeba.
Prince Leopold Institute of Tropical Medicine. 1982. Tropical Animal Production for the Benefit of Man. Proceedings of the International Colloquim 17-18 December. Prince Leopold Institute of Tropical Medicine, Antwerp.
Rahmato, Dessalegn. 1984. Agrarian Reform in Ethiopia. Scandinavian Institute of African Studies, Uppsala.
Relief and Rehabilitation Commission (RRC). 1985. The Challenges of Drought. Ethiopia's Decade of Struggle in Relief and Rehabilitation. RRC, Addis Abeba.
Remenyi, J.V. (ed). 1985. Agricultural systems research for developing countries: proceedings of an international workshop held at Hawkesbury Agricultural College, Richmond, N.S.W. 12-15 May. ACIAR Proceedings No. 11. ACIAR, Canberra.
Revilla, I.M. and Amir, P. 1986. On-Farm Livestock Research: A Partial Annotated Bibliography. Winrock International, Arkansas.
Rodriguez, G. and Anderson, F.M. 1985. Farm Risks: A study of a mixed farming system in highland Ethiopia. Paper presented at the IFPRI/DSE Workshop on Sources of Increased Variability in Cereal Yields, 26-29 November 1985, Feldafing, West Germany. ILCA, Addis Abeba.
Roorda, R.M.M. 1984. Effects of soil burning ("guie") on physics-chemical properties of soils in Sheno, Debre Berhan and Chacha areas of Ethiopia. Dissertation submitted to the National Agricultural College, Deventer, The Netherlands.
Ruthenberg, H. 1980. Farming Systems in the Tropics. Third Edition. Clarendon Press, Oxford.
Sandford, S. 1981. Review of World Bank Livestock Activities in Dry Tropical Africa. IBRD, Washington D.C.
Sandford, S. 1983. Management of Pastoral Development in the Third World. Overseas Development Institute, London, in association with John Wiley and sons,. Chichester.
Sandford, S. 1986. Livestock and Food Production in Sub-Saharan Africa. Mimeograph, ILCA, Addis Abeba.
Sands, M.W. 1983. Role of Livestock on Smallholder Farms in Western Kenya: Prospects for a Dual Purpose Goat. Ph.D. Thesis, Cornell University, Ithaca.

241
Sargent, M. W., Lichte, J.A., Matlon, P.J. and Bloom, E. 1981. An Assessment of Animal Traction in Francophone West Africa. African Rural Economy Working Paper No. 34, Michigan State University, East Lansing.
Sarma, J.S. and Yeung, P. 1985. Livestock Products in the Third World: Past Trends and Projections to 1990 and 2000. Research Report No. 49. International Food Policy Research Institute (IFPRI), Washington, D.C.
SAS Institute Inc. 1985. SAS User's Guide: Basics, Version 5 Edition. SAS Institute Inc., Cary, North Carolina.
Schaar, J., Brännäng, E. and Meskel, L.B. 1981. Breeding Activities of the Ethio-Swedish Integrated Rural Development Project: Milk Production of Zebu and Crossbreed Cattle. World Animal Review 37: pp. 31-36. FAO, Rome.
Schep, P. and Jutzi, S. 1985. A performance comparison of broadcast and row-planted wheat crops in the Ethiopian highlands. Mimeo. Highlands Programme, ILCA, Addis Abeba.
Schneider, H.K. 1984. Livestock in African Culture and Society: A Historical Perspective. In: J.R. Simpson and P. Evangelou (ed). Livestock Development in Sub-Saharan Africa. Constraints, Prospects, Policy"! Westview Press, Boulder, Colorado
Shaner, W.W., Philipps, P.F. and Schmehl, W.R. 1982. Farming Systems Research and Development: A Guidr'"-- ' — n — ' ~ —-—•--• -Westview Press, Boulder, Colorado
Showamare, Meseret (ed). 1983. Climatic Records for ILCA Research Sites. ILCA, Addis Abeba.
Showamare, Meseret (ed). 1984. Climatic Records for ILCA Research Sites. ILCA, Addis Abeba.
Showamare, Meseret (ed). 1985. Climatic Records for ILCA Research Sites. ILCA, Addis Abeba.
Showamare, Meseret (ed). 1986. Climatic Records for ILCA Research Sites. ILCA, Addis Abeba.
Shumba, E.M. 1985. Animal and Human Power in Communal Agriculture. Zimbabwe Science News Vol. 19(3-4): pp. 32-34. Harare.
Sidahmed, A.E., Onim, J.F.M. Mukhebi, A.W., Shavulimo, R.S., De Boer, A.J. and Fitzhugh, H.A. 1985. On-Farm Trials with Dual-purpose Goats on Small Farms in Western Kenya. In: Nordblom, T.L., Ahmed, A.K.H. and Potts, G.R. (eds). 1985. Research Methodology for Livestock On-Farm Trials: Proceedings of a workshop held at ICARDA, Aleppo, Syria, 25-28 March. IDRC, Ottawa and ICARDA, Aleppo.
Simmonds, N.W. 1985. Farming Systems Research. A Review. World Bank Technical Paper Nr. 43. World Bank, Washington D.C.

242
Simpson, J.R. and Evangelou, P. 1984. Livestock Development in Sub-Saharan Africa. Constraints, Prospects, Policy. Westview Press, Boulder, Colorado.
Simpson, J.R. 1985. World Livestock Systems: Economic Analysis and Project Planning. Draft. University of Florida, Gainesville.
Sisay, Asefa. 1983. An Analysis of Resource Allocation in a Household Farm Economy: Cases from Chilalo Province, Ethiopia. Ethiopian Journal of Development Research Vol. 5-7 (2). Institute of Development Research, Addis Abeba University.
Sisay, Seleshi. 1980. Agricultural Systems in Ethiopia - A Review Article. Agricultural Systems No. 5: pp. 29-38.
Slikkerveer, L.J. 1986. Ethiopie. Landendocumentatie Nr. 3. Koninklijk Instituut Voor de Tropen, Amsterdam.
Soller, H., Reed, J.D. and Butterworth, M.H. 1986. Intake and utilisation of feed by work oxen. ILCA Newsletter 5(2): pp. 5-7. ILCA, Addis Abeba.
Special Program for African Agricultural Research (SPAAR). 1987. Guidelines for Strengthening National Agricultural Research Systems in Sub-Saharan Africa. World Bank, Washington, D.C.
Sprague, H.B. 1976. Combined Crop/Livestock Farming Systems for Developing Countries of the Tropics and Sub-Tropics. Technical Series Bulletin No. 19. Office of Agriculture, Technical Assistance Bureau, Agency for International Development, Washington, D.C.
Stahl, M. 1973. Political Contradictions in Agricultural Development: A study of the MPP projects in southern Ethiopia. Research Report 14, Scandinanvian Institute of African Studies, Uppsala.
Steinfeld, H. 1984. The impact of storing water in excavated ponds on water constraints. Report of a study period at ILCA. Technical University, Berlin, West Germany.
Stommes, E. and Seleshi Sisaye. 1979. The Administration of Agricultural Development Programmes: A look at the Ethiopian Approach - Part 1. Agricultural Administration 6(3): pp. 221-239.
Stotz, D. 1983. Production Techniques and Economics of Smallholder Livestock Production Systems in Kenya. Farm Management Handbook of Kenya Volume IV. . Ministry of Livestock Development, Nairobi.
Stroud, A. 1985 A. On-Farm Experimentation: Concepts and Principles. Teaching notes, CIMMYT Eastern African Economics Programme, Nairobi.
Stroud, A. 1985b. Guidelines for Using OFE Methodology in Crops, Livestock and Agroforestry Experimentation. Teaching notes, CIMMYT Eastern African Economics Programme, Nairobi.

243
Stuart, H.C. and Stevensen, S.S. 1959. Growth and Development. In: Nelson, W.E. (ed). Textbook of Pediatrics 7th edition. Saunders, Philadelphia.
Swensson, C , Schaar, J., Brännäng, E. and Meskel, L.B. 1981. Breeding Activities of the Ethio-Swedish Integrated Rural Development Project: Reproductive Performance of Zebu and Crossbreed Cattle. World Animal Review 38: pp. 31-36.
Technical Advisory Committee of the Consultative Group on International Agricultural Research (TAC/CGIAR). 1978. Farming Systems Research at the International Agricultural Research Centers. TAC Secretariat, FAO, Rome.
Technical Advisory Committee of the Consultative Group on International Agricultural Research (TAC/CGIAR). 1982. Report of the TAC Quinquennial Review Mission to the International Livestock Centre for Africa (ILCA). TAC Secretariat, FAO, Rome.
Technical Advisory Committee of the Consultative Group on International Agricultural Research (TAC/CGIAR). 1986. Report of the Second External Program Review of the International Livestock Center for Africa (ILCA). TAC Secretariat, FAO, Rome.
Technical Advisory Committee of the Consultative Group on International Agricultural Research (TAC/CGIAR). 1987. Sustainable Agricultural Production: Implications for International Agricultural Research. Draft Report. TAC Secretariat, FAO, Rome.
Tecle, Tesfai. 1975. An Approach to Rural Development: A Case Study of the Ethiopian Package Projects. Rural Africana No. 28: pp. 87-105. Michigan State University, East Lansing.
Tegegne, Teka. 1984. Agrarian Transformation: The Ethiopian Experience. Mimeograph. FAO, Rome.
Tessema, Tesfaye and Dagnatchew Yirgou. 1973. Soil Burning "Gye": its problems and possible solutions. Miscellaneous Publications No. 35. College of Agriculture, Debre Zeit Agricultural Experiment Station, Ethiopia.
Toulmin, C. 1984. The Allocation of Resources to Livestock Research in Africa. LPU Working Paper No. 3. ILCA, Addis Abeba.
Trail, J.CM., Murray, M. and Wissocq, Y. 1984. The Trypranotolerant Livestock Network in West and Central Africa. ILCA Bulletin 18: pp. 16-19. ILCA, Addis Abeba.
Trail, J.CM., Sones, K., Jibbo, J.M.C, Durkin, J., Light, D.E. and Murray, M. 1985. Productivity of Boran cattle maintained by chemoprophylaxis under trypanosomiasis risk. ILCA Research Report 9. ILCA, Addis Abeba.
Tuiza, E.G. and Amir, P. 1986. Glossary of On-Farm Livestock Research Terms. Draft working paper. Winrock International, Arkansas.

244
Upton, H. 1985. Returns from Small Ruminant Production in South West Nigeria. Agricultural Systems No. 17: pp. 65-83.
USAID. 1982. African Bureau Livestock Development Assistance Strategy Paper. Agriculture and Rural Development Division, Washington D.C.
Vaidyanatman, A. 1983. Estimating Employment Potential in Animal Husbandry. Data base and methodology. AGDP Working Paper, FAO, Rome.
Valdes, A., Scobie, G.M. and Dillon, J.L. (eds). 1979. Economics and the Design of Small-Farmer Technology. Iowa State University Press, Ames, Iowa.
Van Eeghen, M. 1984. Trifolium Tembense: Exploratory study on its value as a fodder crop. Report of a study period at ILCA. Agricultural University, Wageningen.
Vandemaele, F.V. 1977. The Role of Animal Production in World Agriculture. World Animal Review No. 21: pp. 2-5.
Vincent, W.H. 1977. Economic conditions in Ada Wereda, Ethiopia during the cropping season of 1975-76. Working paper, Institute of Development Research, Addis Abeba and Michigan State University, East Lansing.
Von Kaufman, R., Chater, S. and Blench, R. (ed). 1986. Livestock Systems Research in Nigeria's Subhumid Zone. Proceedings of the Second ILCA/NAPRI Symposium held in Kaduna, Nigeria, 29 Oct - 2 Nov 1984, ILCA, Addis Abeba.
Wagenaar-Brouwer, M. 1986. Nutrition and health of Ethiopian mixed smallholder farmers in relation to the use of crossbred cows. Preliminary results. Draft paper. Highlands Programme, ILCA, Addis Abeba.
Wagner, D.G., Holland, G.L. Mpges, T. 1969a. Cross breeding studies with Ethiopian beef cattle using imported semen. East African Agricultural Forestry Journal 34(4).
Wagner, D.G., Wells, M.E., Holland G.L. and Teshome Wonde Afrash. 1969b. Development of college dairy crossbreeding studies. Experimental Station Bulletin No. 52, College of Agriculture, Alemayah.
Ward, G.M. 1974. Livestock Production on Small Farms as a Contribution to Economic Development. In: Biggs, H.H. and Tinnermeier, R.L. (eds). Small Farm Agricultural Development Problems. Colorado State University, Fort Collins, Colorado.
Westphal, E. 1975. Agricultural Systems in Ethiopia. Centre for Agricultural Publishing and Documentation, Wageningen.
Whalen, I.W. and Anderson, F.M. 1985. A note on farmers' perceptions of small scale water development using oxen excavated ponds. Mimeograph Highlands Programme. ILCA, Addis Abeba.

245
Wharton, C R . 1969. Subsistence Agriculture: Concepts and Scope. In: C R . Wharton (ed). Subsistence Agriculture and Economic Development. Aldine, Chicago.
Wheeler, R.O. 1982. Problems and Prospects for Increasing Livestock Production through improved Production Systems. In: Ted J. Davis (ed). Increasing Agricultural Productivity. Proceedings of the Third Annual Agricultural Sector Symposium. World Bank Technical Paper No.l, World Bank, Washington D.C.
Whyte, W.F. and Boynton, D. (eds). 1983. Higher Yielding Human Systems for Agriculture. Cornell University Press, ithacaT
Wiener, G. 1975. The Cattle and Sheep Breeding Research Programme at IAR. FAO, Rome.
Williamson, G. and Payne, W.J.A. 1978. An Introduction to Animal Husbandry in the Tropics. The English Language Book Society and Longmans, Longman Inc., London.
Wilson, T.R. 1984. Livestock Production in Central Mali: Long-Term Studies on Cattle and Small Ruminants in the Agropastoral System. ILCA Research Report 14, ILCA, Addis Abeba.
Winrock International. 1978. The Role of Ruminants in Support of Man. Winrock International Livestock Research and Training Center, Morrilton, Arkansas.
World Bank. 1981a. Accelerated Development in Sub-Saharan Africa: An Agenda for Action. Washington, D.C.
World Bank. 1981b. Ethiopia. Second Agricultural Minimum Package Project. Staff Appraisal Report. Northern Agriculture Division Report No. 1774 b-ET. Washington, D.C.
World Bank. 1981c. Economic Memorandum on Ethiopia. Report No. 3552 b-ET. Country Programs Department. Washington, D.C.
World Bank. 1983. Ethiopia: Review of Farmers Incentives and Agricultural Marketing and Distribution Efficiency. Addis Abeba.
World Bank. 1984a. Towards Sustained Development in Sub-Saharan Africa: a joint programme of action. World Bank, Washington, D.C.
World Bank. 1984b. Ethiopia. Recent Economic Developments and Future Prospects. Report No. 4683 a-ET in two volumes. Eastern Africa Regional Office. Washington, D.C.
World Bank. 1985a. The Smallholder Dimension of Livestock Development. A Review of Bank Experience (in two volumes). Operations Evaluation Department, Report No. 5979. Washington, D.C.
World Bank. 1985b. Ethiopia and the World Bank. Mimeograph, Information and Public Affairs Department, Washington, D.C.

246
World Bank. 1986a. Eastern and Southern African Agricultural Resarch Review. World Bank, Washington, D.C.
World Bank. 1986b. West Africa Agricultural Research Review. World Bank, Washington, D.C.
World Bank. 1987. World Development Report 1987. Oxford University Press, New York.
World Health Organisation (WHO). 1979. Measurement of Nutritional Impact. WHO, Geneva.
Zandstra, H.G., Price, E.C., Litsinger, J.A. and Morris, R.A. 1981. A Methodology for On-r Banos, Philippines. Methodology for On-Farm Cropping Systems Research. IRRI, Los = "Hili '
Zandstra, H.G. 1982. Experiences with research on crop-animal systems. In: Fitzhugh, H.A., Hart, R.D., Moreno, R.A., Osuyi, P.O., Ruiz, M.E. and Singh, L. (eds). 1982. Research on Crop-Animal Systems. Proceedings of a Workshop organized by CATIE/CARDI/Winrock International, April 4-7, Turrialba, Costa Rica.
Zandstra, H.G. 1985. The design and testing of improved livestock technology for mixed farms. Discussion paper prepared for the FSSP Network Workshop "Animal Traction in a Farming System Perspective", 4-8 March, Togo. FSSP, Florida.
Zegeye, T., Mulugetta, M. and Dixon, J. 1979a. Farming Systems Project Survey Bako Mixed Farming Zone (October-November 1977). IAR, Addis Abeba.
Zegeye, T., Mulugetta, M. and Dixon, J. 1979b. Farming Systems Project Survey Holetta Red Soil Mixed Farming Zone (December 1977-January 1978). IAR, Addis Abeba.
Zegeye, T., Mulugetta, M. and Dixon, J. 1979c. Farming Systems Project Survey Bedi Farming Zone (November 1977). IAR, Addis Abeba.

247
SAMENVATTING
De productiviteit van vee in Afrika ten zuiden van de Sahara behoort tot de laagste ter wereld, wat de productie van vlees en melk betreft. De resultaten van veeteeltprojecten zijn er meestal ontgoochelend. Een belangrijke reden voor de lage investeringsopbrengsten is vaak het slechte projectontwerp, ten gevolge van een onvoldoende kennis van de relevante veeproductiesystemen. In Afrika ten zuiden van de Sahara treft men het meeste vee aan op kleinschalige boerderijen, waar zowel aan veeteelt als aan gewasteelt wordt gedaan. De rol en het belang van vee in dergelijke "gemengde" landbouwsystemen en de interacties tussen de vee- en gewascomponenten, zijn nog onvoldoende bestudeerd.
Van alle belangrijke ecologische zones in Afrika ten zuiden van de Sahara hebben de hooglanden de hoogste dichtheid van zowel mensen als dieren. Vrijwel al het vee in deze zone vindt men op gemengde kleinschalige bedrijven. Ongeveer 50% van de Afrikaanse hooglanden bevindt zich in Ethiopie. Het land heeft ook de grootste veestapel op het Afrikaanse kontinent. In dit proefschrift worden de rol en het belang van vee in het gemengde kleinschalige landbouwsysteem van de Ethiopische hooglanden nagegaan.
In het onderzoek voor dit proefschrift werd gebruik gemaakt van een landbouwsysteembenadering. Het onderzoek werd uitgevoerd in het kader van het Hooglandenprogramma van het 'International Livestock Center for Africa' (ILCA). De noodzakelijke veldgegevens werden verzameld in de periode van 1979 tot 1985 door middel van enquêtes naar het boerderijbeheer en de economische aspecten van het huishouden bij 170 traditioneel werkende boeren uit vier verschillende boerenassociaties van het Baso en Worena district. Deze streek is representatief voor de hoogste gebieden van de Ethiopische hooglanden. Het bevindt zich in een granen-veeteeltzone. Het landbouwsysteem is er afhankelijk van de regen. Het is gebaseerd op kleinschalige overlevingslandbouw, met jaarlijkse gewassen waarvan het zaaigoed breed wordt uitgestrooid met de hand, en primitieve werktuigen waaronder de 'maresha', een traditionele houten ploeg, getrokken door een span ossen. Het onderzoek toont aan dat vee van cruciaal belang is in dit landbouwsysteem en dat er een hoge graad van integratie bestaat tussen gewas- en veeteelt. Vee zorgt voor het grootste deel van het geldelijk inkomen en de bruto marges van de boerderij. Rundvee levert vooral intermediaire producten die als input worden gebruikt voor gewasteelt, zoals trekkracht bij de bewerking van het land en het dorsen, of meststof om de vruchtbaarheid van de bodem te verhogen. Het kunnen beschikken over dierlijke trekkracht op het exacte ogenblik dat de nood hieraan bestaat, is een significante factor in het bepalen van het graanproductieniveau op de boerderij. Veehouderij creëert ook een belangrijke hoeveelheid arbeid en is van primordiaal belang als zekerheid en als bron van investering. Schapen worden verkocht naar gelang de behoefte aan cash geld en gekocht om rijkdom op te slaan. Ezels zorgen voor vrijwel het gehele transport van landbouwproducten van en naar de boerderij. De productiviteit van vee is laag wat betreft eindproducten, maar ze is hoog met betrekking tot intermediaire producten. Een aantal elementen in het overheidsbeleid, in het eigenlijke productieproces en in religieuze en culturele gebruiken, vormen een belemmering voor een verhoging van de boerderijproductie . Ze worden als zodanig

248
geïdentificeerd en besproken in het proefschrift. Het belang dat boeren hechten aan de intermediaire functies van vee vormt de grootste hinderpaal voor de ontwikkeling van de veeteelt in de Ethiopische hooglanden als men een verhoging van de vlees- en melkproductie voorop stelt.
De beschikbare onderzoeksresultaten i.v.m. een aangepaste technologie voor de verbetering van de veeproductiviteit in de Ethiopische hooglanden worden in dit proefschrift besproken. Op het ILCA proefstation te Debre Berhan werden een aantal mogelijke interventies in het productiesysteem van het Baso en Worena district onderzocht. Twee technieken leken veelbelovend voor een verbetering van de veeteelt op kleinschalige bedrijven : het gebruik van gekruist melkvee (Boran X Fries) voor de melkproductie en het gebruik van een nieuw ontwikkelde 'een-os ploeg'. Positieve resultaten op het proefstation en een ex-ante evaluatie door middel van een lineair programmatiemodel leidden tot het opzetten van door de boer zelf beheerde proeven met deze nieuwe technieken. De testboeren waren afkomstig uit dezelfde boerenassociaties waar eerder de diagnosestudies waren ondernomen. De resultaten van de testboeren werden vergeleken met de productiviteit van andere boeren die dienden als controlegroep. De gekruiste melkkoeien produceerden beduidend meer melk dan de autochtone koeien, de technologie werd zonder grote problemen overgenomen en de inkomens van de betrokken testboeren lagen significant boven die van de controleboeren. De belangrijkste belemmeringen voor een meer verspreide overname van gekruist melkvee in de regio zijn : een tekort aan voer tijdens het droge seizoen, een gebrek aan mogelijkheden tot commercialisatie van de melk vooral tijdens de lange vastenperiode, ziekteproblemen met het gekruiste vee en te weinig aangepaste fokmogelijkheden. Indien de Ethiopische regering echter voldoende voorlichtingsfaciliteiten kan organiseren, biedt de ontwikkeling van de kleinschalige melkveehouderij goede perspectieven. De andere techniek, die met boeren werd getest, was het gebruik van de 'een-os ploeg' bij het bewerken van het land. Het gebruik en de adoptie van deze aangepaste ploeg door de boeren was laag. De onvoldoende stabiliteit van deze ploeg, in vergelijking met de traditionele ploeg die door twee ossen wordt getrokken, bleek een belangrijke strukturele zwakheid te zijn. De onderzoeksresultaten tonen aan dat een 'een-os ploeg' weliswaar nuttig kan zijn bij het bedekken van het zaaigoed, maar dat het onwaarschijnlijk is dat ze het traditionele systeem met twee ossen kan vervangen tijdens de eerste ploegbeurten.
In de conclusie van dit proefschrift wordt een evaluatie gemaakt van de methodologie van het onderzoek en wordt de overdraagbaarheid van de bereikte resultaten nagegaan. De gevolgtrekkingen van deze studie voor verder onderzoek in verband met landbouw en veeteelt in de Ethiopische hooglanden worden eveneens besproken.
249
CURRICULUM VTTAE
Guido Gryseels, geboren op 11 augustus 1952 te Ukkel (België), volgde lager en middelbaar onderwijs in het Sint-Victor Instituut te Alsemberg en behaalde in 1969 het Diploma Hoger Middelbaar Onderwijs en het Maturiteitsgetuigschrift.
Vervolgens studeerde hij economische wetenschappen, richting economische ontwikkeling, aan de Katholieke Universiteit te Leuven. In 1975 behaalde hij het diploma van Licentiaat in de Economische Wetenschappen en in 1976 dat van Doctorandus in de Economische Wetenschappen. In 1976 verkreeg hij aan dezelfde universiteit ook het Bijzonder Diploma in de Audio-Visuele Communicatiemedia (Radio, Film en Televisie).
In 1977 en 1978 studeerde hij, met behulp van een beurs verleend onder het Australian-European Awards Programme, landbouweconomie aan de University of New England te Armidale (Australie) en behaalde er het Diploma of Agricultural Economics.
Begin 1979 trad hij in dienst bij het International Livestock Centre for Africa (ILCA) met standplaats te Addis Abeba (Ethiopie). Hij was er werkzaam als landbouweconoom in het onderzoeksprogramma voor de hooglanden en hield zich vooral bezig met het bestuderen van traditionele landbouwsystemen in de Ethiopische hooglanden. In 1983 was hij ook co-directeur van het 'Séminaire sur la Conception des Projets d'Elevage' dat door ILCA werd georganiseerd in samenwerking met het Economie Development Institute (EDI) van de Wereldbank te Washington, D.C.. In 1984 werd hij bij ILCA persoonlijk assistent van de directeur generaal en in 1986 onderdirekteur van het Department of Outreach. Tijdens zijn verblijf bij ILCA bereidde hij dit proefschrift voor. Tussen 1983 en 1985 ondernam hij ook verscheidene zendingen i.v.m. het evalueren van veeteeltonderzoek naar Rwanda en Burundi in opdracht van de Wereldbank en het United Nations Development Programme (UNDP).
Sinds mei 1987 is Guido Gryseels in dienst bij het FAO, de landbouw- en voedselorganisatie van de Verenigde Naties, te Rome (Italie). Hij is er werkzaam als Senior Agricultural Research Officer in de divisie voor Onderzoek en Technologie Ontwikkeling, meer bepaald bij het sekretariaat van de Technische Adviescommissie, het TAC, van de Consultatieve Groep voor Internationaal Landbouwonderzoek, de CGIAR.