role of membrane transporters in drug delivery, …
TRANSCRIPT
ROLE OF MEMBRANE TRANSPORTERS IN DRUG DELIVERY,
DRUG DISPOSITION AND DRUG-DRUG INTERACTIONS
A DISSERTATION IN
Pharmaceutical Sciences
and
Chemistry
Presented to the Faculty of University
of Missouri-Kansas City in partial fulfillment
of the requirements for the degree
DOCTOR OF PHILOSOPHY
By
VARUN KHURANA
B. Pharmacy, Guru Gobind Singh Indraprastha University, India, 2008
Kansas City, Missouri
2014

© 2013
VARUN KHURANA
ALL RIGHTS RESERVED
iii
ROLE OF MEMBRANE TRANSPORTERS IN DRUG DELIVERY,
DRUG DISPOSITION AND DRUG-DRUG INTERACTIONS
Varun Khurana, Candidate for the Doctor of Philosophy Degree
University of Missouri-Kansas City, 2014
ABSTRACT
Tissues such as liver, kidney, brain and intestine expresses membrane transporters which
play a vital role in drug absorption, distribution, metabolism and excretion. Understanding of
functionality and molecular expression of drug transporters can prove to be of utmost importance
in drug delivery or drug design by targeting specific transporter proteins. It’s a well-known fact
that drug transporters play an important role in governing drug disposition which act as potential
piece of information during the drug discovery and development process. By exploring the
transporter functionality chances of delivering a therapeutic agent to the target organ enhances.
Transporter targeted drug delivery helps in improving the bioavailability, controlling the
elimination process and also avoid distribution to non-specific organs, hence diminishes the odds
of toxic adverse effects. It is always suitable to choose a potential molecule which may or may not
interact with the membrane transporters, depending on whether such an interaction is of any use
or not. Activity of individual transport process can be examined by exploring the expression
system of transporters. Therapeutic efficacy many important drugs, directly or indirectly, get
affected due to genetic polymorphisms and drug-drug interactions involving membrane
transporters which ultimately effects the pharmacokinetics of a drug molecule. During the drug
discovery and development process, knowledge about the contribution of these transporters
iv
towards interindividual differences by regulating drug absorption, distribution, metabolism and
excretion will act as an important tool. The objective of this dissertation project was to understand
the role of hepatic uptake transporters (OATP-1B1 and -1B3) in governing the disposition of
tyrosine kinase inhibitors (TKIs). Since selected TKIs are the substrates and/or inhibitors of
OATP-1B1 and -1B3 expressed in hepatic tissue, these compounds can be regarded as molecular
targets for transporter mediated drug-drug interactions (DDIs). Any alteration in the function of
these hepatic OATPs might account for the pharmacokinetic variability of TKIs. These finding
also provide the basis of further pre-clinical and clinical studies investigating the transporter based
DDI potential of TKIs.
As a secondary aim of this investigation we developed novel pentablock (PB) copolymer
nanoparticles of pazopanib for treatment of ocular neovascularization. Our results indicated that
PB copolymer based drug delivery systems can serve as a platform technology for the development
of sustained release therapy along with evasion of drug efflux for the treatment of ocular
neovascularization. This drug delivery system can also be utilized for other chronic diseases as
well.
We also investigated the presence of ascorbic acid-specific transport system and delineate
the functional and molecular aspects of vitamin C transporter (SVCT2) in ocular and breast cancer
cells. SVCT2 system can be targeted for the design of ascorbic acid prodrugs or for NPs surface
modified with ascorbic acid to achieve enhanced permeability for highly potent but poorly
bioavailable drugs by evading drug efflux in the treatment of cancer and ocular diseases.
Interaction of TKIs with hepatic OATP-1B1 and -1B3 delineates the role of hepatic uptake
transporters in drug disposition and drug-drug interactions. These OATP transporters in
conjunction with the efflux proteins (P-gp, MRP and BCRP) may eventually decide on the overall
v
flux/loss of the therapeutic agents within the hepatic tissue. Similary, functionality of membrane
tranporters have been exploited and examined in terms of drug delivery. Pazopanib encapsulated
nanoparticles of novel pentablock polymers were successful in bypass drug efflux mediated via
efflux proteins. Also, influx transporters (vitamin C transporter, SVCT2) on ocular cell lines can
be further utilized as a potential target for enhancing absorption and permeability of AA-
conjugated drugs or drug delivery systems by evading drug efflux.
vi
APPROVAL PAGE
The faculty listed below, appointed by the Dean of the School of Graduate Studies have examined
a dissertation titled ‘Role of Membrane Transporters in Drug Delivery, Drug Disposition And
Drug-Drug Interactions’, presented by Varun Khurana, candidate for the Doctor of Philosophy
degree, and certify that in their opinion it is worthy of acceptance.
Supervisory Committee
Ashim K. Mitra, Ph.D., Committee Chair
Department of Pharmaceutical Sciences
Kun Cheng, Ph.D.
Department of Pharmaceutical Sciences
Betty Herndon, Ph.D.
Department of Basic Medical Science
Karen B. Williams, Ph.D.
Department of Medical Bioinformatics
James R. Durig, Ph.D.
Department of Chemistry

vii
TABLE OF CONTENTS
ABSTRACT ................................................................................................................................... iii
LIST OF ILLUSTRATIONS ......................................................................................................... ix
LIST OF TABLES ....................................................................................................................... xvi
ACKNOWLEDGEMENTS ....................................................................................................... xviii
THE CONVOLUTIONS INVOLVED IN HEPATIC DRUG TRANSPORT: FOCUS ON
MEMBRANE TRANSPORTERS .................................................................................................. 1
Rationale...................................................................................................................................... 1
Drug or Membrane Transporters of the Hepatic Basolateral Membrane .................................... 4
Drug or Membrane Transporters of the Hepatic Apical (Canalicular) Membrane ................... 17
Drug Interactions Involved In Hepatic Transport ..................................................................... 26
Future Of Hepatobiliary Drug Transport Research ................................................................... 33
ROLE OF OATP-1B1 AND/OR OATP-1B3 IN HEPATIC DISPOSITION OF TYROSINE
KINASE INHIBITORS ................................................................................................................ 35
Rationale.................................................................................................................................... 35
Materials And Methods ............................................................................................................. 37
Results ....................................................................................................................................... 40
Discussion ................................................................................................................................. 56
Conclusion ................................................................................................................................. 63
INHIBITION OF OATP-1B1 AND OATP-1B3 BY TYROSINE KINASE INHIBITORS ....... 64
Rationale.................................................................................................................................... 64
Materials And Methods ............................................................................................................. 66
Results ....................................................................................................................................... 70
Discussion ................................................................................................................................. 80
Conclusion ................................................................................................................................. 86
THE ROLE OF TRANSPORTERS AND EFFLUX SYSTEM IN DRUG DELIVERY ............ 87
Rationale.................................................................................................................................... 87
ABC Transporters ..................................................................................................................... 89
Strategies To Overcome Active Efflux ................................................................................... 106
Conclusion ............................................................................................................................... 128
NOVEL PENTABLOCK COPOLYMER BASED NANOPARTICLES CONTAINING
PAZOPANIB: A POTENTIAL THERAPY FOR OCULAR NEOVASCULARIZATION ..... 129
viii
Rationale.................................................................................................................................. 129
Material And Methods ............................................................................................................ 132
Results And Discussion ........................................................................................................... 141
Conclusion ............................................................................................................................... 156
FUNCTIONAL CHARACTERIZATION AND MOLECULAR IDENTIFICATION OF
VITAMIN C TRANSPORTER (SVCT2) IN HUMAN CORNEAL EPITHELIAL (HCEC) AND
RETINAL PIGMENT EPITHELIAL (D407) CELLS ............................................................... 158
Rationale.................................................................................................................................. 158
Material And Methods ............................................................................................................ 160
Results ..................................................................................................................................... 167
Discussion ............................................................................................................................... 186
Conclusion ............................................................................................................................... 191
MOLECULAR EXPRESSION AND FUNCTIONAL ACTIVITY OF VITAMIN C SPECIFIC
TRANSPORT SYSTEM (SVCT2) IN HUMAN BREAST CANCER CELLS ........................ 193
Rationale.................................................................................................................................. 193
Material And Methods ............................................................................................................ 196
Results ..................................................................................................................................... 203
Discussion ............................................................................................................................... 221
Conclusion ............................................................................................................................... 225
SUMMARY AND RECOMMENDATIONS............................................................................. 227
Summary ................................................................................................................................. 227
Recommendations ................................................................................................................... 232
APPENDIX ................................................................................................................................. 234
LIST OF REFERENCES ............................................................................................................ 241
VITA ........................................................................................................................................... 275
ix
LIST OF ILLUSTRATIONS
1.1: Human hepatic basolateral transport proteins. Schematic representation of three adjacent
hepatocytes with interconnecting canalicular spaces sealed by tight junctions. Sinuosoidal blood
flowing through the liver bathes hepatocytes and delivers solutes to the basolateral hepatic
membrane for uptake. Important basolateral transport proteins (protein name is in bold type with
gene symbol listed below) are depicted with arrows denoting the direction of transport and ATP-
dependent transporters designated by ●. For the OAT and OCT families, only mRNA have been
detected in human liver. Typical substrates are listed (OA-, organic anions; OC+, organic cations;
MTX, methotrexate; cAMP, adenosine 3’,5’-cyclic monophosphate; cGMP, guanosine 3’,5’cyclic
monophosphate)…………………………………………………………………………………...5
1.2: Human hepatic canalicular transport proteins. Schematic representation of two adjacent
hepatocytes as described in Fig.1.1. Important canalicular transport proteins (protein name is in
bold type with gene symbol listed below) are depicted with arrows denoting the direction of
transport and ATP-dependent transporters designated by ●. Typical substrates are listed (OA-,
organic anions; OC+, organic cations; TC, taurocholate; MX, mitoxantrone)……………………18
2.1: Cellular accumulation of TKIs at two concentrations (0.25 and 0.5µM) by OATP-1B1
transporter. TKIs were incubated with WT and CHO-OATP-1B1 transfected CHO cells for 10
minutes. Intracellular drug concentration was quantified using liquid chromatography tandem
mass spectrometry (LC/MS–MS). Data represent the mean±SD, n=4 (*p<0.05, **p<0.01)…….41
2.2: Cellular accumulation of TKIs at two concentrations (0.25 and 0.5µM) by OATP-1B3
transporter. TKIs were incubated with WT and OATP-1B3 transfected CHO cells for 10 minutes.
Intracellular drug concentration was quantified using liquid chromatography tandem mass
spectrometry (LC/MS–MS). Data represent the mean±SD, n=4 (*p<0.05, **p<0.01)………….42
2.3.1: Concentration dependent uptake of nilotinib in OATP-1B1 transfected CHO cells. OATP-
1B1 mediated nilotinib transport determined as the difference in uptake in OATP-1B1 and WT
CHO cells at each substrate concentration. Each data point is expressed as mean±SD, n=4……...44
2.3.2: Concentration dependent uptake of vandetanib in OATP-1B1 transfected CHO cells. OATP-
1B1 mediated vandetanib transport determined as the difference in uptake in OATP-1B1 and WT
CHO cells at each substrate concentration. Each data point is expressed as mean±SD,
n=4……………………………………………………………………………………………….45
2.3.3: Concentration dependent uptake of canertinib in WT and OATP-1B1 transfected CHO cells.
Each data point is expressed as mean±SD, n=4…………………………………………………..46
2.3.4: Concentration dependent uptake of pazopanib in WT and OATP-1B1 transfected CHO cells.
Each data point is expressed as mean±SD, n=4…………………………………………………..47
2.3.5. Concentration dependent uptake of erlotinib in WT and OATP-1B1 transfected CHO cells.
Each data point is expressed as mean±SD, n=4………………………………………………….48
x
2.4.1: Concentration dependent uptake of canertinib in OATP-1B3 transfected CHO cells. OATP-
1B3 mediated canertinib transport determined as the difference in uptake in OATP-1B3 and WT
CHO cells at each substrate concentration. Each data point is expressed as mean±SD,
n=4……………………………………………………………………………………………….49
2.4.2: Concentration dependent uptake of nilotinib in OATP-1B3 transfected CHO cells. OATP-
1B3 mediated nilotinib transport determined as the difference in uptake in OATP-1B3 and WT
CHO cells at each substrate concentration. Each data point is expressed as mean±SD, n=4…….50
2.4.3: Concentration dependent uptake of vandetanib in OATP-1B3 transfected CHO cells. OATP-
1B3 mediated vandetanib transport determined as the difference in uptake in OATP-1B3 and WT
CHO cells at each substrate concentration. Each data point is expressed as mean±SD,
n=4……………………………………………………………………………………………….51
2.4.4: Concentration dependent uptake of pazopanib in WT and OATP-1B3 transfected CHO cells.
Each data point is expressed as mean±SD, n=4…………………………………………………..52
2.4.5: Concentration dependent uptake of erlotinib in WT and OATP-1B3 transfected CHO cells.
Each data point is expressed as mean±SD, n=4…………………………………………………..53
2.5: Cytotoxicity in the presence of TKIs at highest studied concentration (50µM) on CHO-WT,
OATP-1B1 and -1B3 transfected cells. Data represent the mean±SD, n=4………………………55
3.1: Influence of 5 different TKIs and rifampicin at two different concentrations (25 and 50µM)
on the activity of OATP-1B1, expressed in CHO cells, as determined by the intracellular
accumulation of [3H] estrone sulfate ([3H] ES, 10 min incubation). Data is shown as mean±S.D.
n=4. S.D. means standard derivation. (*p<0.05)…………………………………………………70
3.2: Influence of 5 different TKIs and rifampicin at two different concentrations (25 and 50µM)
on the activity of OATP-1B3, expressed in CHO cells, as determined by the intracellular
accumulation of [3H] cholecystokinin octapeptide ([3H] CCK-8, 10 min incubation). Data is shown
as mean±S.D. n=4. (*p<0.05)…………………………………………………………………….71
3.3: Inhibitory potency of rifampicin towards OATP-1B1. Intracellular accumulation of OATP-
1B1 substrate [3H] ES in the presence of increasing concentrations of rifampicin (0.1-100µM).
Data is shown as mean±S.D. n=4…………………………………………………………………73
3.4: Inhibitory potency of pazopanib towards OATP-1B1. Intracellular accumulation of OATP-
1B1 substrate [3H] ES in the presence of increasing concentrations of pazopanib (0.1-100µM).
Data is shown as mean±S.D. n=4…………………………………………………………………74
3.5: Inhibitory potency of nilotinib towards OATP-1B1. Intracellular accumulation of OATP-1B1
substrate [3H] ES in the presence of increasing concentrations of nilotinib (0.1-100µM). Data is
shown as mean±S.D. n=4………………………………………………………………………...74
3.6: Inhibitory potency of vandetanib towards OATP-1B1. Intracellular accumulation of OATP-
1B1 substrate [3H] ES in the presence of increasing concentrations of vandetanib (0.1-100µM).
Data is shown as mean±S.D. n=4…………………………………………………………………75

xi
3.7: Inhibitory potency of canertinib towards OATP-1B1. Intracellular accumulation of OATP-
1B1 substrate [3H] ES in the presence of increasing concentrations of canertinib (0.1-100µM).
Data is shown as mean±S.D. n=4…………………………………………………………………75
3.8: Inhibitory potency of erlotinib towards OATP-1B1. Intracellular accumulation of OATP-1B1
substrate [3H] ES in the presence of increasing concentrations of erlotinib (0.1-100µM). Data is
shown as mean±S.D. n=4………………………………………………………………………...76
3.9: Inhibitory potency of rifampicin towards OATP-1B3. Intracellular accumulation of OATP-
1B3 substrate [3H] CCK-8 in the presence of increasing concentrations of rifampicin (0.1-100µM).
Data is shown as mean±S.D. n=4…………………………………………………………………76
3.10: Inhibitory potency of vandetanib towards OATP-1B3. Intracellular accumulation of OATP-
1B3 substrate [3H] CCK-8 in the presence of increasing concentrations of vandetanib (0.1-
100µM). Data is shown as mean±S.D. n=4………………………………………………………77
3.11: Inhibitory potency of pazopanib towards OATP-1B3. Intracellular accumulation of OATP-
1B3 substrate [3H] CCK-8 in the presence of increasing concentrations of pazopanib (0.1-100µM).
Data is shown as mean±S.D. n=4…………………………………………………………………77
3.12: Inhibitory potency of nilotinib towards OATP-1B3. Intracellular accumulation of OATP-
1B3 substrate [3H] CCK-8 in the presence of increasing concentrations of nilotinib (0.1-100µM).
Data is shown as mean±S.D. n=4…………………………………………………………………78
3.13: Inhibitory potency of canertinib towards OATP-1B3. Intracellular accumulation of OATP-
1B3 substrate [3H] CCK-8 in the presence of increasing concentrations of canertinib (0.1-100µM).
Data is shown as mean±S.D. n=4…………………………………………………………………78
3.14: Inhibitory potency of erlotinib towards OATP-1B3. Intracellular accumulation of OATP-
1B3 substrate [3H] CCK-8 in the presence of increasing concentrations of erlotinib (0.1-100µM).
Data is shown as mean±S.D. n=4…………………………………………………………………79
3.15: Cytotoxicity in the presence of TKIs at highest studied concentration (100µM) on OATP-
1B1 and -1B3 transfected cells. Data represent the mean±SD, n=4………………………………79
4.1: Localization of selected transporters in 4 tissues involved in ADME of drugs………………91
4.2: Human MRP gene family……………………………………………………………………98
4.3: Predicted secondary structures of drug efflux transporters of the ATP-binding cassette family:
four classes are distinguished here, based on predicted structure and amino acid sequence
homology. (1) P-glycoprotein consists of two transmembrane domains, each containing 6
transmembrane segments, and two nucleotide binding domains (NBDs). It is N-glycosylated
(branches) at the first extracellular loop; (2) MRP1, 2 and 3 have an additional amino terminal
extension containing 5 transmembrane segments and they are N-glycosylated near the N-terminus
and at the sixth extracellular loop; (3) MRP4 and 5 lack the amino terminal extension of MRP1–
3, and are N-glycosylated at the fourth extracellular loop; (4) BCRP is a ‘half transporter’
xii
consisting of one NBD and 6 transmembrane segments, and it is most likely N-glycosylated at the
third extracellular loop. Note that, in contrast to the other transporters, the NBD of BCRP is at the
amino terminal end of the polypeptide. BCRP almost certainly functions as a homodimer. N and
C denote amino- and carboxy-terminal ends of the proteins, respectively. Cytoplasmic (IN) and
extracellular (OUT) orientation indicated for BCRP applies to all transporters drawn
here……………………………………………………………………………………………...101
4.4: Combination Therapy Approach…………………………………………………………...106
4.5: Transporter targeted prodrug strategy: improved permeability could be achieved by
overcoming MDR efflux transporters upon chemical modification of parent drug molecule…..111
4.6: Evasion of MDR efflux proteins by surface-decorated nanoparticles: substrate drug molecules
encapsulated in the nanoparticles can evade MDR proteins upon endocytosis…………………112
4.7: Model of peptide transport in epithelial cells from intestine and kidney…………………..117
5.1: Synthesis scheme for triblock (TB) and pentablock (PB) copolymers……………………..133
5.2: 1H-NMR of TB in CDCl3 (PCL7000-PEG2000-PCL7000)……………………………………..143
5.3: 1H-NMR of PB CDCl3 (PLA3000-PCL7000-PEG2000-PCL7000-PLA3000)……………………..144
5.4: XRD patterns of TB and PB copolymers…………………………………………………..146
5.5: In vitro cytotoxicity (LDH) assay of PB copolymer at different concentrations were performed
on D407, CCL 20.2 and HCEC cells……………………………………………………………147
5.6: In vitro cytotoxicity (MTS) assay of PB copolymer at different concentrations were performed
on D407, CCL 20.2 and HCEC cells……………………………………………………………148
5.7: In vitro biocompatibility of PB copolymer were evaluated by estimating the levels of TNF-α,
IL-6 and IL-1β in the supernatants of polymer treated RAW 264.7 cells………………………149
5.8: In vitro release of pazopanib from NPs prepared with PB copolymer……………………..152
5.9: Intracellular accumulation of [3H] digoxin in absence and presence of GF 102918 (2µM),
pazopanib (0.1µM) and pazopanib NPs (containing pazopanib equivalent to 0.1µM) in MDCK-
MDR1 cells. Results are expressed as mean±S.D. n = 4 (*p < 0.05)……………………………154
5.10: Intracellular accumulation of [3H] abacavir in absence and presence of GF 102918 (2µM),
pazopanib (0.1µM) and pazopanib NPs (containing pazopanib equivalent to 0.1µM) in MDCK-
Bcrp1 cells. Results are expressed as mean±S.D. n = 4 (*p < 0.05)…………………………….155
6.1: Time course of [14C] AA uptake across HCEC and D407 cells. Uptake of [14C] ascorbic acid
([14C] AA) was measured in DPBS buffer (pH 7.4) at 37ºC. Data is shown as mean±S.D. n=4. S.D.
means standard derivation………………………………………………………………………167
6.2: Temperature dependent uptake study of [14C] AA uptake across HCEC and D407 cells in
DPBS (pH 7.4). The uptake is expressed as percentage of control (37°C). Data is shown as
xiii
mean±S.D. n=4. Asterisk (*) represents significant difference from the control (*p<0.05,
**p<0.01)……………………………………………………………………………………….168
6.3: Arrhenius plot of the effect of temperature on [14C] AA uptake across HCEC and D407 cells.
Uptake of [14C] AA was measured in DPBS buffer (pH 7.4) for 30min at 37, 25 and 4°C, across
HCEC and D407 cells. Data is shown as mean±S.D. n=4………………………………………169
6.4: Effect of pH on [14C] AA uptake across HCEC and D407cells. Uptake of [14C] AA was
determined in the presence of different pH (5.0, 6.0, 6.5, 7.4 and 8.0) at 37°C for 30 min across
HCEC and D407 cells. The uptake is expressed as percentage of control (pH 7.4). Data is shown
as mean±S.D. n=4. (*p<0.05, **p<0.01)………………………………………………………..170
6.5: Uptake of [14C] AA across HCEC and D407 cells in the presence of amiloride and absence of
sodium and chloride ions in DPBS buffer (pH 7.4) at 37°C. (*p<0.05, **p<0.01)……………..171
6.6: Uptake of [14C] AA across HCEC and D407 cells as a function of sodium concentration in
DPBS (pH 7.4) at 37°C. Data is shown as mean±S.D. n=4……………………………………..172
6.7: Hill plot of sodium-dependent uptake of [14C] AA across HCEC and D407 cells…………173
6.8: Concentration-dependent uptake of [14C] AA across HCEC cells. Data is shown as mean±S.D.
n=4 (● represents total uptake, ▲ represents passive uptake/non-saturable component and ■
represents carrier mediated uptake/saturable component)………………………………………174
6.9: Concentration-dependent uptake of [14C] AA across D407 cells. Data is shown as mean±S.D.
n=4 (● represents total uptake, ▲ represents passive uptake/non-saturable component and ■
represents carrier mediated uptake/saturable component)………………………………………175
6.10: Lineweaver–Burk transformation of the data demonstrated involvement of a single carrier
mediated process for the uptake of [14C] AA across HCEC and D407 cells………………..……177
6.11: Uptake of [14C] AA across HCEC and D407 cells in the presence of 1 mM concentrations of
metabolic inhibitors: ouabain, sodium azide, and 2,4-DNP. [14C] AA uptake was performed at
37°C with DPBS buffer (pH 7.4) for 30 min. Data is shown as mean±S.D. n=4. (*p<0.05,
**p<0.01)……………………………………………………………………………………….178
6.12. Uptake of [14C] AA across HCEC and D407 cells in the presence of 1 mM concentrations of
membrane inhibitors: SITC, DIDS and probenecid. [14C] AA uptake was performed at 37°C with
DPBS buffer (pH 7.4) for 30 min. Data is shown as mean±S.D. n=4. (*p<0.05,
**p<0.01).....................................................................................................................................179
6.13. Uptake of [14C] AA in presence of L-ascorbic acid (L-AA), D-isoascorbic acid (D-Iso AA),
dehydro ascorbic acid (DHAA), D-glucose, and para-amino hippuric acid (PAHA) at three
different concentrations across HCEC and D407 Cells. [14C] AA uptake was performed at 37°C
with DPBS buffer (pH 7.4) for 30 min. Data is shown as mean±S.D. n=4. (*p<0.05,
**p<0.01)……………………………………………………………………………………….180
xiv
6.14: RT-PCR studies showing the molecular evidence of SVCT2 in HCEC and D407 cells. Lane
1 and 3 represents 100 bp molecular ladder and lane 2 and 4 represents 626 bp PCR product
obtained from HCEC and D407 cells……………………………………………………………184
6.15: Real time-PCR comparing the expression of SVCT2 in HCEC and D407 cells. Data is shown
as mean±S.D. n=4. (*p<0.05, **p<0.01)………………………………………………………..185
7.1: Time course of [14C] AA uptake across MDA-MB231, T47D and ZR-75-1 cells. Uptake of
[14C] ascorbic acid ([14C] AA) was measured in DPBS buffer (pH 7.4) at 37ºC. Data is shown as
mean±S.D. n=4. S.D. means standard derivation……………………………………………….203
7.2: Temperature dependent uptake study of [14C] AA uptake across MDA-MB231, T47D and
ZR-75-1 cells in DPBS (pH 7.4). The uptake is expressed as percentage of control (37°C). Data is
shown as mean±S.D. n=4. Asterisk (*) represents significant difference from the control
(*p<0.05)………………………………………………………………………………………..204
7.3: Arrhenius plot of the effect of temperature on [14C] AA uptake across MDA-MB231, T47D
and ZR-75-1 cells. Uptake of [14C] AA was measured in DPBS buffer (pH 7.4) for 30min at 37,
25 and 4°C, across MDA-MB231, T47D and ZR-75-1 cells. Data is shown as mean±S.D.
n=4……………………………………………………………………………………………...205
7.4: Effect of pH on [14C] AA uptake across MDA-MB231, T47D and ZR-75-1 cells. Uptake of
[14C] AA was determined in the presence of different pH (5.0, 6.0, 6.5, 7.4 and 8.0) at 37°C for 30
min across MDA-MB231, T47D and ZR-75-1 cells. The uptake is expressed as percentage of
control (pH 7.4). Data is shown as mean±S.D. n=4. (*p<0.05)…………………………………206
7.5: Uptake of [14C] AA across MDA-MB231, T47D and ZR-75-1 cells in the presence of
amiloride and absence of sodium and chloride ions in DPBS buffer (pH 7.4) at 37°C.
(*p<0.05)………………………………………………………………………………………..207
7.6: Uptake of [14C] AA across MDA-MB231, T47D and ZR-75-1 cells as a function of sodium
concentration in DPBS (pH 7.4) at 37°C. Data is shown as mean±S.D. n=4……………………208
7.7: Hill plot of sodium-dependent uptake of [14C] AA across MDA-MB231, T47D and ZR-75-1
cells……………………………………………………………………………………………..209
7.8: Concentration-dependent uptake of [14C] AA across MDA-MB231 cells. Data is shown as
mean±S.D. n=4 (● represents total uptake, ▲ represents passive uptake/non-saturable component
and ■ represents carrier mediated uptake/saturable component)………………………………..210
7.9: Concentration-dependent uptake of [14C] AA across T47D cells. Data is shown as mean±S.D.
n=4 (● represents total uptake, ▲ represents passive uptake/non-saturable component and ■
represents carrier mediated uptake/saturable component)………………………………………211
xv
7.10: Concentration-dependent uptake of [14C] AA across ZR-75-1 cells. Data is shown as
mean±S.D. n=4 (● represents total uptake, ▲ represents passive uptake/non-saturable component
and ■ represents carrier mediated uptake/saturable component)………………………………..212
7.11: Uptake of [14C] AA across MDA-MB231, T47D and ZR-75-1 cells in the presence of
metabolic inhibitors (ouabain, sodium azide, and 2,4-DNP). [14C] AA uptake was performed at
37°C with DPBS buffer (pH 7.4) for 30 min. Data is shown as mean±S.D. n=4.
(*p<0.05)………………………………………………………………………………………..213
7.12. Uptake of [14C] AA across MDA-MB231, T47D and ZR-75-1 cells in the presence of
membrane inhibitors (SITC, DIDS and probenecid). [14C] AA uptake was performed at 37°C with
DPBS buffer (pH 7.4) for 30 min. Data is shown as mean±S.D. n=4. (*p<0.05)……………….214
7.13. Uptake of [14C] AA in presence of L-ascorbic acid (L-AA), D-isoascorbic acid (D-Iso AA),
dehydro ascorbic acid (DHAA), D-glucose, and para-amino hippuric acid (PAHA) at three
different concentrations across MDA-MB231, T47D and ZR-75-1 cells. [14C] AA uptake was
performed at 37°C with DPBS buffer (pH 7.4) for 30 min. Data is shown as mean±S.D. n=4.
(*p<0.05)………………………………………………………………………………………..215
7.14: RT-PCR studies showing the molecular evidence of SVCT2 in MDA-MB231, T47D and
ZR-75-1 cells. Lane 1 represents ZR-75-1, lane 2: T47D, lane 3: MDA-MB231 and lane 4: 1 Kb
molecular ladder………………………………………………………………………………...219
7.15: Real time-PCR comparing the expression of SVCT2 in MDA-MB231, T47D and ZR-75-1
cells. Data is shown as mean±S.D. n=4. (*p<0.05)……………………………………………..219
xvi
LIST OF TABLES
1.1: Human Hepatic Basolateral Transport Proteins……………………………………………...6
1.2: Human Hepatic Apical (Canalicular) Transport Proteins…………………………………...10
1.3: Characteristics of human OATP family members…………………………………………..13
1.4: Regulation of Hepatic Transport Proteins…………………………………………………..24
1.5: Transporter‑mediated clinical drug–drug interactions……………………………………...28
2.1: Michaelis–Menten kinetic parameters (Vmax and Km) and catalytic efficiency (Vmax/Km)
estimated for tested TKIs for OATP-1B1 and/or OATP-1B3 transporter proteins. Units of Km:
micromolar (µM), Vmax: nmoles/mg protein/min and Vmax/Km: ml/mg protein/min………………54
4.1: Tissue Distribution of P-gp, MRP and BCRP……………………………………………….92
4.2: P-gp Substrates and Inhibitors……………………………………………………………….95
4.3: Substrates and Inhibitors for MRP2………………………………………………………….99
4.4: Substrates and Inhibitors for BCRP………………………………………………………...102
4.5: Distribution of peptide transporters in tissues, cells and sub-cellular compartments………115
4.6: Example of various drugs/prodrugs acting as substrates/ competitive inhibitors of peptide
transporters……………………………………………………………………………………...117
4.7: Characteristics and selective substrates of human OATP family members……………….119
4.8: Expression of OATP in various cancer tissues…………………………………………….120
4.9: Tissue expression and prototypical substrates of OAT family members………………….122
4.10: Tissue expression and substrates of OCT family members……………………………….123
4.11: An overview of tissue distribution and kinetic parameters of SMVT on intracellular
accumulation……………………………………………………………………………………125
5.1: Characterization of TB and PB copolymers………………………………………………..145
5.2: Characterization of pazopanib loaded PB copolymer NPs………………………………...150
5.3: Coefficient of determination (R2) for various kinetic models for in vitro release of pazopanib
from PB copolymer NPs………………………………………………………………………..153
xvii
6.1: Michaelis–Menten kinetic parameters (Vmax and Km) and catalytic efficiency (Vmax/Km)
estimated for SVCT2 transporter system in HCEC and D407 cell lines. Units of Km: micromolar
(µM), Vmax: pmoles/mg protein/min and Vmax/Km: µl/mg protein/min………………………….176
6.2: Uptake of [14C] AA across HCEC and D407 cells in the presence of various concentrations
of Ca++/calmodulin pathway, PKC pathway, PKA pathway and PTK pathway modulators in DPBS
(pH 7.4) at 37 °C. The uptake is expressed as percentage of control (DPBS). Data is shown as
mean±S.D. n=4. (*p<0.05, **p<0.01)…………………………………………………………..181
7.1: Uptake of [14C] AA across MDA-MB231, T47D and ZR-75-1 cells in the presence of various
concentrations of Ca++/calmodulin pathway, PKC pathway, PKA pathway and PTK pathway
modulators in DPBS (pH 7.4) at 37 °C. The uptake is expressed as percentage of control (DPBS).
Data is shown as mean±S.D. n=4. (*p<0.05)……………………………………………………216
xviii
ACKNOWLEDGEMENTS
I would like to express my deepest gratitude to my advisor Dr. Ashim K Mitra, for his
guidance, kindness, patience and providing me with an outstanding atmosphere for doing research.
Also, Dr. Mitra always provided his valuable recommendation involved in practical issues beyond
the textbooks, patiently corrected my writing and financially supported my research. With his
wisdom, understanding and commitment to the highest standards, he always encouraged and
motivated me. I am also thankful to the members of my supervisory committee Drs. Kun Cheng,
Karen Williams, Betty Herndon and James Durig for both serving on my committee as well as all
their help and guidance throughout my graduate work. I sincerely thank Dr. Russell Melchert,
Dean, UMKC School of Pharmacy for his support and motivation at various stages of graduate
studies.
I am very thankful to Dr. Dhananjay Pal for sharing his insightful knowledge in the area of
in vitro techniques and drug-drug interactions, and giving me emotional support in the time of
need. A special thanks to Mrs. Ranjana Mitra for her cheerful encouragement and in particular for
her moral support throughout my graduate studies at UMKC. I am particularly grateful for the
assistance given by Dr. Ravinder Earla with respect to analytical method development and
troubleshooting. I would also like to recognize Joyce Johnson and Sharon Self for always being
there to help me with all my administrative needs. I appreciate support from Nancy Hoover and
Connie Mahone from School of Graduate Studies. I am thankful to National Institute of Health
and School of Graduate Studies for constant financial support. I would also express my sincere
thanks to Dr. James B. Murowchick (School of Geological Sciences) for his help in XRD analysis.
I would (particularly) like to thank Dr. Bruno Stieger (Department of Clinical Pharmacology and
Toxicology, University Hospital Zürich, Switzerland) for their generous gift of OATP transfected
xix
cell lines, and, Dr. Walter Jäger University of Vienna, Austria) and Dr. A.J. van Agthoven
(Josephine Nefkens Institute, Netherlands) for gifting breast cancer cell lines.
I am greatly thankful to Ravi Vaishya, Sujay Shah, Drs. Mukul Minocha, Sulabh Patel,
Ripal Gaudana and Mitan Gokulgandhi for their valuable suggestion and inputs for the betterment
of my career. We’ve laughed, cried and among other things, cursed together. I owe my deepest
gratitude to Dr. Deep Kwatra for not only helping me in professional matters but also for being
persistent and encouraging, for believing in me, and for the many priceless memories along the
way.
I thank my colleagues Mitesh Patel, Dr. Megha Barot, Asha Patel, Animikh Ray, Dr.
Aswani Dutt Vadlapudi, Ramya Krishna Vadlapatla, Kishore Cholkar, Vibhuti Agrahari,
Chandramouli Natrajan, Maria Joseph, Akshay Jain, Abhirup Mandal, Ashutosh Barve and
Anwesha Ray for their timely help and creating such a cheerful environment all through my
graduate career. My special thanks to Drs. Shuanghui Luo, Zhiying Wang, Durga Kalyani Paturi,
Sagar Boddu, Sriram Gunda and Nanda Kishore Mandava for providing their valuable inputs for
successful completion of my PhD.
My heartfelt appreciation goes to all my close friends Nilesh Gupta, Piyush Jain, Ashish
Kala, Sharad Sharma, Neel Fofaria, Anand Choubey, Priyanka Agarwal, Gurpreet Gill, Sohail
Anwar, Gulshan Mehta, Unnati Patel, Rutva Trivedi, Rajneet Oberoi, Nisha Kwatra, Mrinalini
Das, Nitika Anand and Kanika Malik for their contribution to the various domains in my
convoluted life.
Of course no acknowledgments would be complete without giving thanks to my parents
(Sh. Ashok Khurana and Shmt. Paramjit Khurana). Both have inculcated many worthy qualities in
me and set me with a good foundation to meet life. They have always taught me about hard work
xx
and self-respect, about how to be persistent and independent. Also, I would like to express the
deepest appreciation to my brother Tarun Khurana and sister-in-law Shikha Khurana for sharing
my joys and sorrows and giving me continuous support, inspiration, assistance and guidance. Last
but not the least, I would like to thank my niece Aashita Khurana (Gugli/Gapla). Her innocent and
sweet smile always keeps me motivated and acts as a stress buster in this last phase of my Ph.D
completion.

xxi
Dedicated to My Family
1
CHAPTER 1
THE CONVOLUTIONS INVOLVED IN HEPATIC DRUG TRANSPORT: FOCUS ON
MEMBRANE TRANSPORTERS
Rationale
Impact of hepatic transport systems in drug disposition [1]
Liver is mainly responsible for the metabolism and/or excretion of many endogenous and
exogenous compounds from the body. Research on the metabolic aspects of hepatic clearance has
been a prime area of interest since many decades, although, currently the focus has also been also
shifted to examine and evaluate the role of hepatic transport systems in the hepatobiliary
disposition of drugs and metabolites. It’s a known fact that translocation of lipophilic molecules
from plasma to hepatic cytosol is mediated via simple or facilitated diffusion. However, basolateral
transport proteins consist of several membrane transporters were involved in uptake of
amphipathic and polar organic compounds, in addition to some lipophilic molecules, from
sinusoidal plasma to hepatic cytosol. Hepatobiliary disposition of some compounds is also
influenced by hepatocellular protein binding and sequestration. As mentioned above that excretion
of drugs and metabolites from the hepatocyte is mediated via hepatic transport proteins.
Translocation of polar molecules from hepatic cytosol into blood is mediated via uni- or bi-
directional basolateral transport systems, however, biliary excretion of drugs and metabolites is
mediated via active canalicular transport systems. Recently, there has been a surge of interest in
the field of drug transport, and knowledge regarding hepatic transport systems has grown
substantially. There is widespread interest in the hepatic transport of drugs and metabolites among
pharmaceutical scientists, including medicinal chemists, pharmacologists, and clinicians, for
several reasons:
2
Drug Design (Drug Delivery)
Understanding of structure-transport relationships for hepatic transport proteins would
provide an extra edge in designing of compounds with finest transport properties. For a potential
drug candidate, extensive hepatic uptake or enhanced biliary excretion may be considered as
appropriate characteristic, whereas in others, reduce systemic exposure and limit pharmacological
activity due to extensive hepatic uptake and biliary excretion can be regarded as an unattractive
property of the potential molecule.
Bioavailability
The liver is an important organ of first-pass elimination. Dietary, disease, or drug-induced
alterations in hepatic transport systems may lead to reduced or erratic systemic availability of drugs
after oral administration. In some cases, diminished systemic availability of a drug after oral
administration has been attributed as an outcome of induction of a hepatic transport protein
responsible for the hepatic uptake or biliary excretion of that drug. Besides liver, membrane
transporters expressed on the basolateral and apical membranes of the gastrointestinal epithelial
cells also play an important role in altering the bioavailability of several drug molecules.
Biliary Excretion
ATP-dependent canalicular transport proteins are responsible for biliary excretion of
compounds. In humans, the degree to which most drugs and metabolites go through biliary
excretion is not freely valued due to the innate difficulties in directly accessing bile drainage in
healthy individuals. Extensive biliary secretion of therapeutic agents limits their systemic exposure
which leads to the exclusion of possibly beneficial therapeutic agents in the early stages of drug
development. Biliary excretion of drugs or metabolites can exert dose-limit toxicities on exposure
of intestinal epithelia to pharmacologically active or toxic species. Compounds that experience
3
biliary excretion undergoes systemic reabsorption followed by metabolism or elimination in feces.
Hepatic transport systems are considered as one of the critical factor of the enterohepatic recycling
of compounds.
Interindividual Variability In Drug Pharmacokinetics And Pharmacodynamics.
Disposition of many endogenous and exogenous compounds, including drugs and
metabolites may alter significantly on any disease-associated or genetic alterations in the
expression and/or function of hepatic transport proteins. Hepatic transporters are known to be
responsible for causing important variations in the disposition, pharmacological activity, and
toxicity of many therapeutic agents. A major prerequisite in order to achieve therapeutic outcomes
in varied patient population is the extensive knowledge about mechanism responsible causing
interpatient variability via hepatic drug transport systems.
Drug/Nutrient-Transport Interactions
Activity of hepatic transport protein may be enhanced or impaired on interacting with drug
and nutrients. These interactions may alter the expression and function of hepatic transporters and
can be direct or indirect in nature. In future, revelation of clinically important interaction with
hepatic transporters and the approaches to foresee these interactions may offer several exciting
prospects for membrane transporter related research.
Nomenclature [1]
Nomenclature of hepatic transport system is a challenging discipline. New proteins were
promptly recognized and termed with the introduction of molecular biology methods. Early
nomenclature of hepatic transporters is recognized as descriptive, cumbersome and duplicative. In
order to avoid this timeworn convoluted nomenclature, guidelines approved by HUGO Gene
Nomenclature Committee were employed. Hepatic transporters belongs two major families: (i)
4
solute carriers superfamily (SLC/SLCO) and (ii) ATP-binding cassette superfamily (ABC). As per
guidelines, upper case refers to the human and lower case refers to the rodent genes and gene
products.
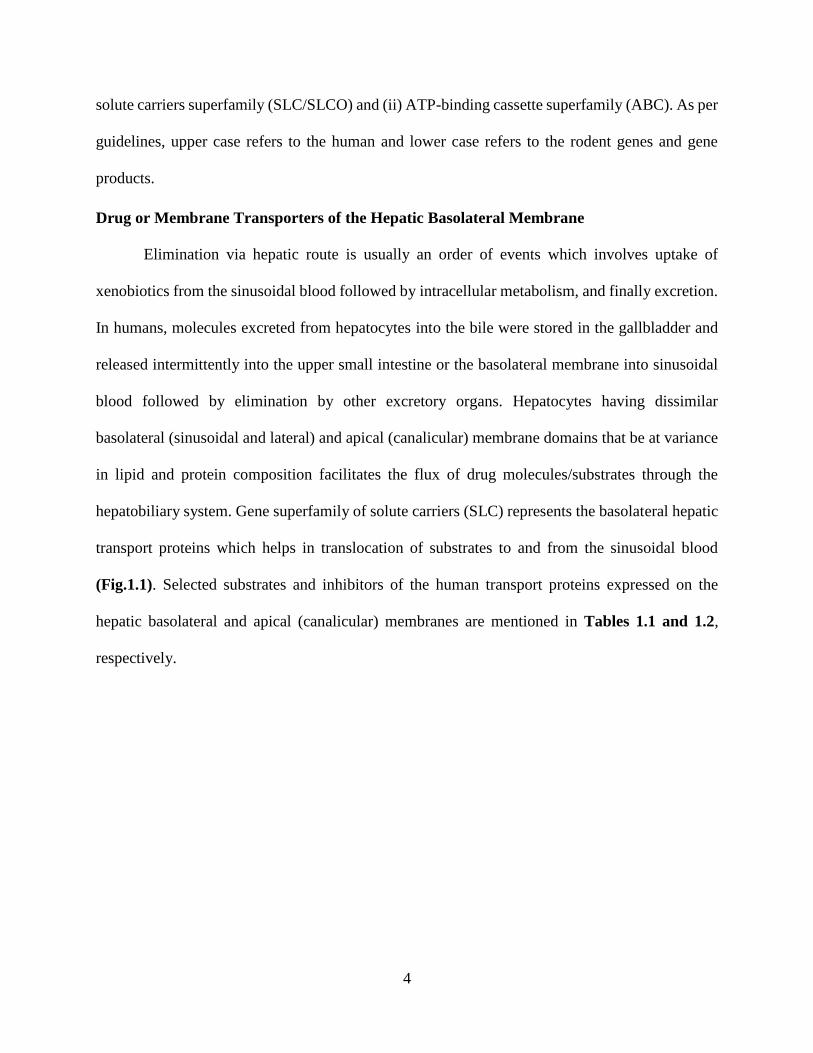
Drug or Membrane Transporters of the Hepatic Basolateral Membrane
Elimination via hepatic route is usually an order of events which involves uptake of
xenobiotics from the sinusoidal blood followed by intracellular metabolism, and finally excretion.
In humans, molecules excreted from hepatocytes into the bile were stored in the gallbladder and
released intermittently into the upper small intestine or the basolateral membrane into sinusoidal
blood followed by elimination by other excretory organs. Hepatocytes having dissimilar
basolateral (sinusoidal and lateral) and apical (canalicular) membrane domains that be at variance
in lipid and protein composition facilitates the flux of drug molecules/substrates through the
hepatobiliary system. Gene superfamily of solute carriers (SLC) represents the basolateral hepatic
transport proteins which helps in translocation of substrates to and from the sinusoidal blood
(Fig.1.1). Selected substrates and inhibitors of the human transport proteins expressed on the
hepatic basolateral and apical (canalicular) membranes are mentioned in Tables 1.1 and 1.2,
respectively.
5
Fig.1.1: Human hepatic basolateral transport proteins. Schematic representation of three adjacent
hepatocytes with interconnecting canalicular spaces sealed by tight junctions. Sinuosoidal blood
flowing through the liver bathes hepatocytes and delivers solutes to the basolateral hepatic
membrane for uptake. Important basolateral transport proteins (protein name is in bold type with
gene symbol listed below) are depicted with arrows denoting the direction of transport and ATP-
dependent transporters designated by ●. For the OAT and OCT families, only mRNA have been
detected in human liver. Typical substrates are listed (OA-, organic anions; OC+, organic cations;
MTX, methotrexate; cAMP, adenosine 3’,5’-cyclic monophosphate; cGMP, guanosine 3’,5’cyclic
monophosphate). (Reproduced with permission, Brouwer K.M. et al [1])
6
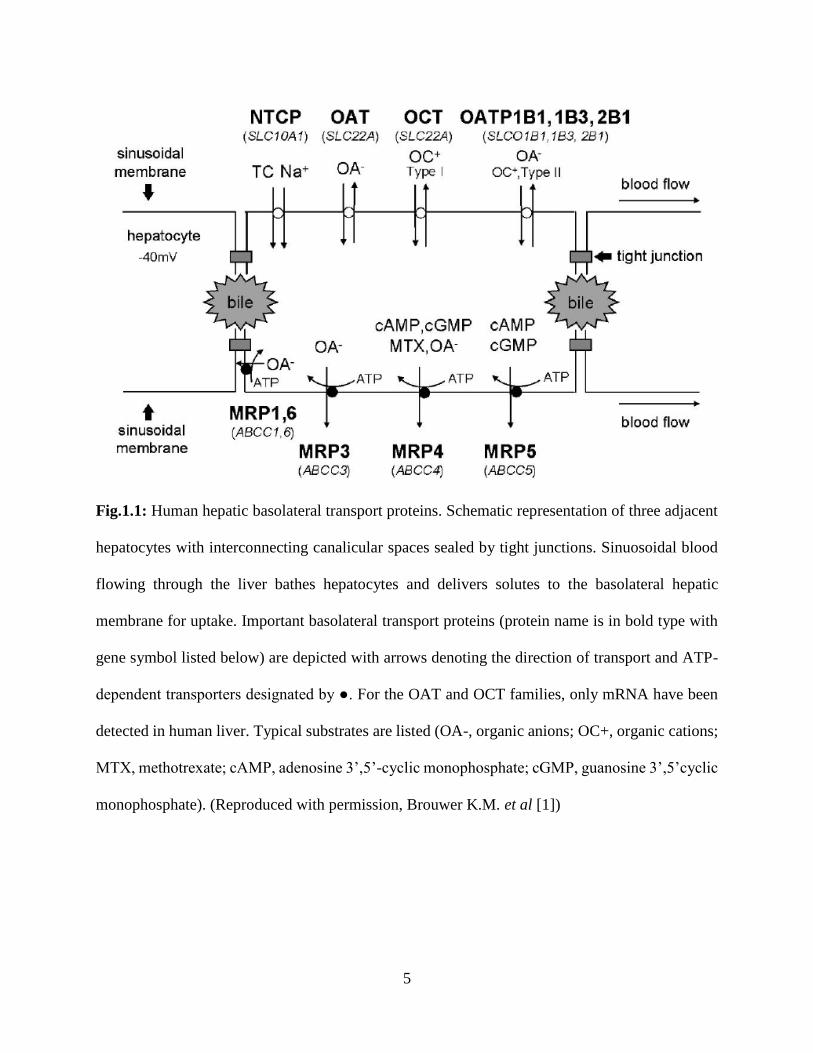
Table 1.1: Human Hepatic Basolateral Transport Proteins
(Reproduced and modified with permission, Brouwer K.M. et al [1])
Basolateral Protein Gene Symbol Substrates Inhibitors
NTCP SLC10A1 Bromosulphophthalein,
cholate, estrone-3-sulfate,
glycocholate
taurochenodeoxycholate,
tauroursodeoxycholate,
Cyclosporine,
irbesartan, ritonavir,
bendroflumethiazide,
doxazosin,
rifampicin
OATP1A2 SLCO1A2 Bile acids, methotrexate,
estrone-3-sulfate, n-methyl
quinine; ouabain,
dehydroepiandrosterone
sulphate, fexofenadine,
bromosulphophthalein,
digoxin, levofloxacin,statin
Naringin, ritonavir,
lopinavir, saquinavir,
rifampicin
OATP1B1 SLCO1B1 Bile acids, ouabain,
estrone-3-sulfate,
bromosulphophthalein,
estradiol-17β-glucuronide,
statins, repaglinide,
valsartan, olmesartan,
Saquinavir, ritonavir,
lopinavir, rifampicin,
cyclosporine
7
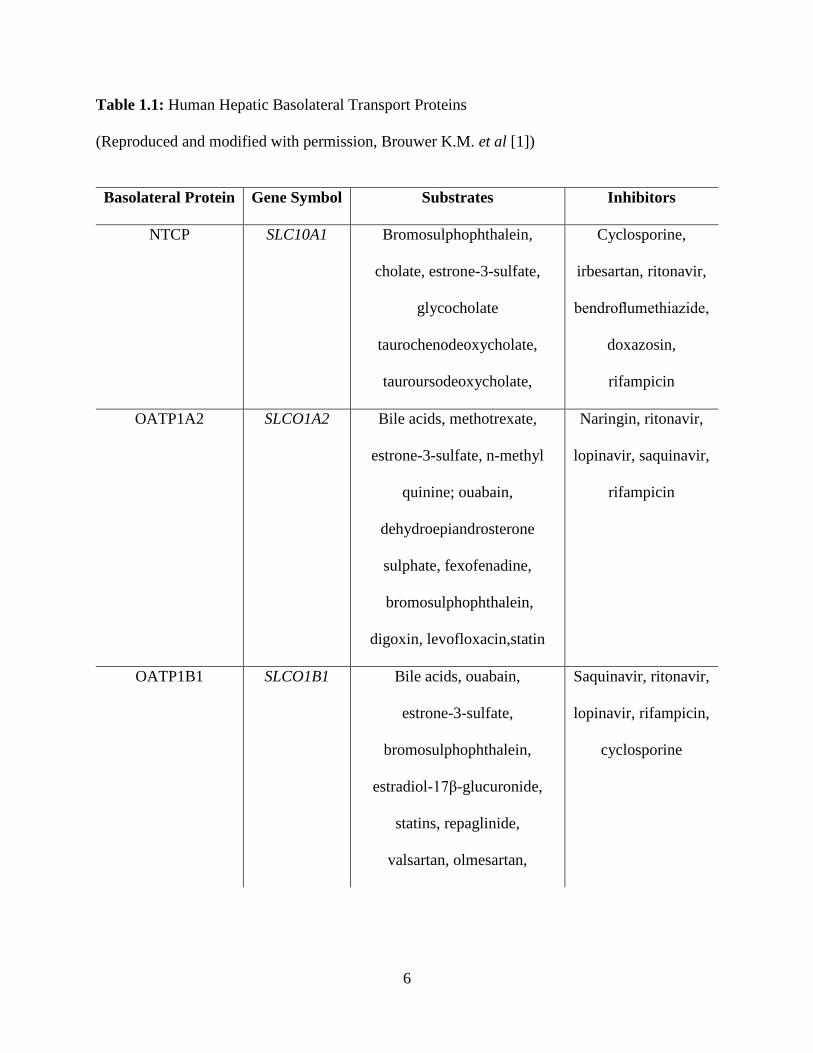
bilirubin glucuronide,
bilirubin,
OATP1B3 SLCO1B3 Bile acids, ouabain,
estrone-3-sulfate,
bromosulphophthalein,
estradiol-17β-glucuronide,
cholecystokinin 8, statins,
digoxin, fexofenadine,
telmisartan glucuronide,
telmisartan, valsartan,
olmesartan,
Rifampicin,
cyclosporine,
ritonavir,
lopinavir
OATP2B1 SLCO2B1 Benzylpenicillin, estrone-3-
sulfate, bromosulphophthalein,
taurocholate, statins,
fexofenadine, glyburide,
taurocholate
Rifampicin,
cyclosporine
OAT2 SLC22A7 Prostaglandin E2,
prostaglandin F2α, salicylate,
tetracycline,
zidovudine, paclitaxel,
theophylline
Diclofenac,
mefenamic acid,
bumetanide,
cyclothiazide
OAT4 SLC22A11 Bumetanide, estrone-3-sulfate
ketoprofen, salicylate,
Telmisartan, losartan,
valsartan,

8
methotrexate, ochratoxin A
prostaglandin E2,
prostaglandin F2α, tetracycline,
zidovudine, uric acid
olmesartan,
indomethacin,
furosemide
OCT1 SLC22A1 Azidoprocainamide
methoiodide, n-methyl-
quinidine, n-methyl-quinine,
tributylmethylammonium,
tetraethylammonium, 1-
methyl-4-phenylpyridinium
Imatinib, nilotinib,
gefitinib, erlotinib,
atropine, prazosin
OCT3 SLC22A3 Adrenaline, noradrenaline,
tyramine, agmatine, 1-methyl-
4-phenylpyridinium,
metformin, pindolol,
procainamide, ranitidine,
varenicline
Quinidine,
cimetidine,
testosterone
MRP1 ABCC1 Daunorubicin, doxorubicin,
etoposide, vincristine
MK-571, probenecid,
reversan, JS-2190
MRP3 ABCC3 Estradiol-17β-glucuronide,
methotrexate, fexofenadine,
glucuronate conjugates,
acetaminophen, monovalent
and sulfated bile salts
Delaviridine,
efavirenz,
emtricitabine

9
MRP4 ABCC4 Adefovir, tenofovir,
dehydroepiandrosterone
sulphate, methotrexate,
topotecan, furosemide,
adenosine 3’, 5’-cyclic
monophosphate, guanosine
3’,5’-cyclic monophosphate,
bile acids plus glutathione,
azidothymidine, 9-(2-
phosphonomethoxyethyl)
adenine
Celecoxib,
diclofenac
MRP5 ABCC5 adenosine 3’, 5’-cyclic
monophosphate, guanosine
3’,5’-cyclic monophosphate,
pemetrexed
Methotrexate,
sildenafil, 5-
fluorodeoxyuridine
monophosphate,
dipyridamole,
methotrexate
MRP6 ABCC6 9-(2-phosphonomethoxyethyl)
adenine, cisplatin,
daunorubicin, Leukotriene C4,
[cyclo(D-Trp-D-Asp-L-Pro-D-
Val-L-Leu)]
Benzbromarone,
indomethacin,
probenecid
10
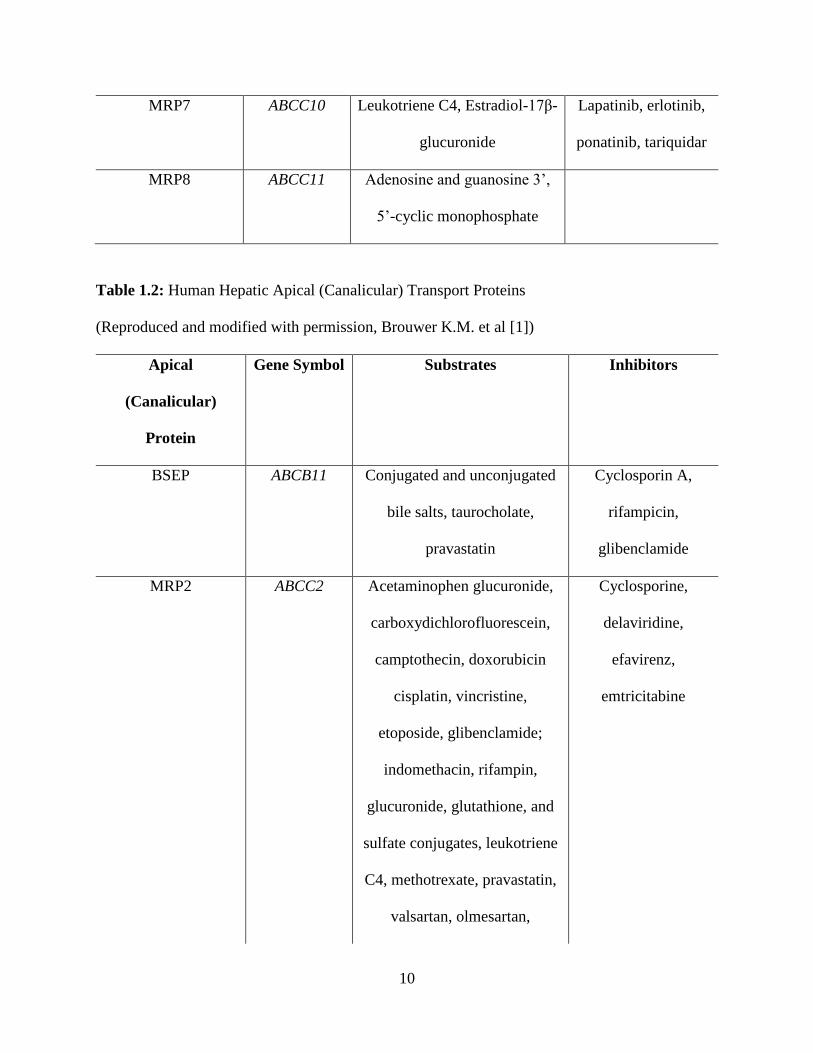
MRP7 ABCC10 Leukotriene C4, Estradiol-17β-
glucuronide
Lapatinib, erlotinib,
ponatinib, tariquidar
MRP8 ABCC11 Adenosine and guanosine 3’,
5’-cyclic monophosphate
Table 1.2: Human Hepatic Apical (Canalicular) Transport Proteins
(Reproduced and modified with permission, Brouwer K.M. et al [1])
Apical
(Canalicular)
Protein
Gene Symbol Substrates Inhibitors
BSEP ABCB11 Conjugated and unconjugated
bile salts, taurocholate,
pravastatin
Cyclosporin A,
rifampicin,
glibenclamide
MRP2 ABCC2 Acetaminophen glucuronide,
carboxydichlorofluorescein,
camptothecin, doxorubicin
cisplatin, vincristine,
etoposide, glibenclamide;
indomethacin, rifampin,
glucuronide, glutathione, and
sulfate conjugates, leukotriene
C4, methotrexate, pravastatin,
valsartan, olmesartan,
Cyclosporine,
delaviridine,
efavirenz,
emtricitabine
11
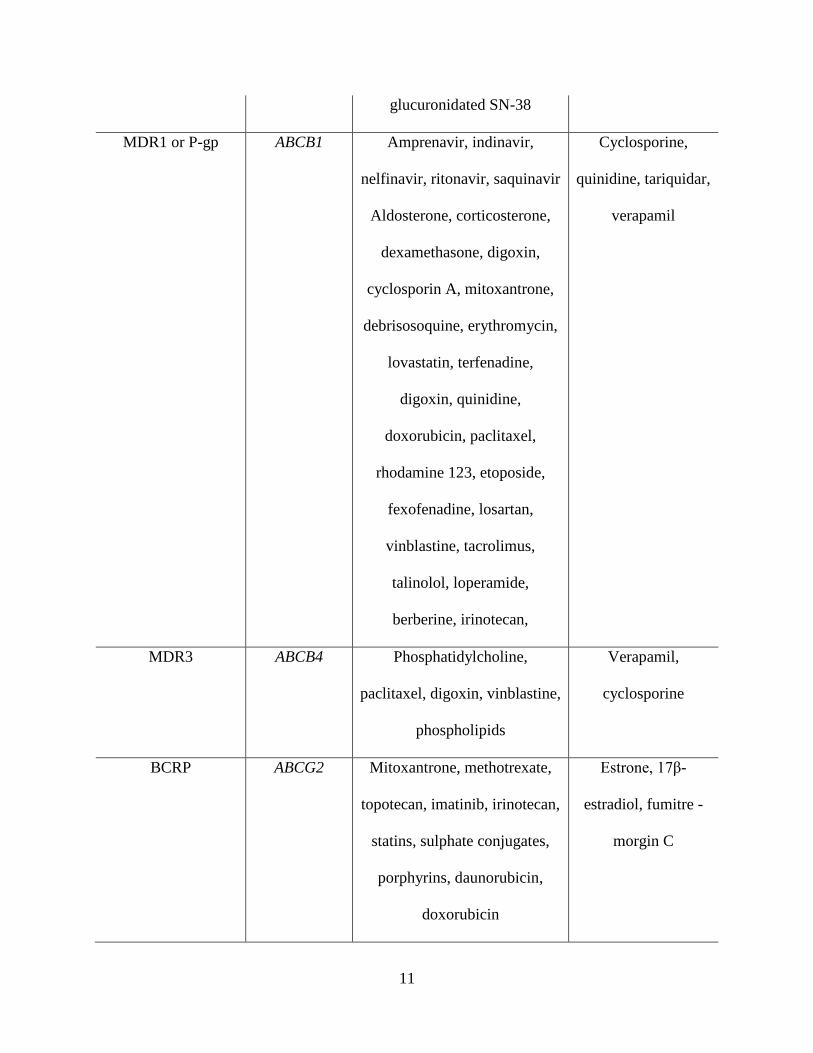
glucuronidated SN-38
MDR1 or P-gp ABCB1 Amprenavir, indinavir,
nelfinavir, ritonavir, saquinavir
Aldosterone, corticosterone,
dexamethasone, digoxin,
cyclosporin A, mitoxantrone,
debrisosoquine, erythromycin,
lovastatin, terfenadine,
digoxin, quinidine,
doxorubicin, paclitaxel,
rhodamine 123, etoposide,
fexofenadine, losartan,
vinblastine, tacrolimus,
talinolol, loperamide,
berberine, irinotecan,
Cyclosporine,
quinidine, tariquidar,
verapamil
MDR3 ABCB4 Phosphatidylcholine,
paclitaxel, digoxin, vinblastine,
phospholipids
Verapamil,
cyclosporine
BCRP ABCG2 Mitoxantrone, methotrexate,
topotecan, imatinib, irinotecan,
statins, sulphate conjugates,
porphyrins, daunorubicin,
doxorubicin
Estrone, 17β-
estradiol, fumitre -
morgin C
12
Na+-taurocholate co-transporting polypeptide (NTCP)
NTCP is a membrane transporter responsible for uptake of sodium-dependent bile salt [2].
This membrane transporters requires two sodium for translocation of each taurocholate (TC)
molecule and is also responsible for uptake of bile salt in rodents [3]. NTCP shows higher affinity
towards conjugated bile salts (TC, tauroursodeoxycholate, taurochenodeoxycholate) than
unconjugated bile salts (cholate). Non-bile salt substrate for this transporter protein are
dehydroepiandrosterone sulfate (DHEAS), thyroxine (T4), bromosulfophthalein (BSP), 3,3’,5-
triiodo-L-thyronine (T3) and estrone-3-sulfate [3] [4, 5].
Organic Anion Transporting Polypeptides (OATPs)
OATP family of transporter proteins play a vital role clearance of many drugs via hepatic
route. Substrates of OATPs are unrestrained rather than specific, which includes variety of organic
anions, few type II cations (bulky molecules with cationic groups located near the ring; e.g.,
quinidine) and neutral steroids. OATP transporter proteins may act in a bi-directional manner and
are sodium independent. High concentration of reduced glutathione within the hepatocyte may act
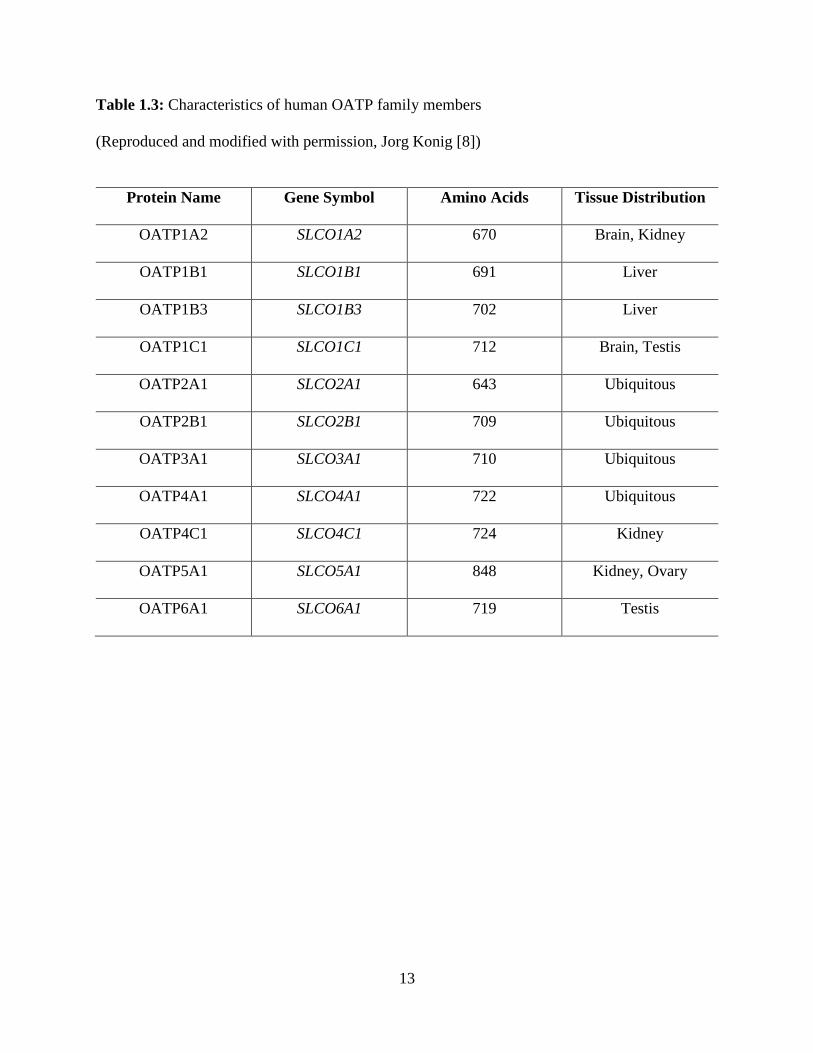
as the driving force for the translocation of substrates of hepatic OATPs [3, 6]. Eleven members
of the OATP transporter proteins have been identified in humans Table 1.3. Expression of OATPs
has been reported in various tissues including intestine, liver, kidney and brain, and are recognized
to play an important role in drug absorption, distribution and the elimination of endogenous and
exogenous compounds including drugs in clinical use [7].
13
Table 1.3: Characteristics of human OATP family members
(Reproduced and modified with permission, Jorg Konig [8])
Protein Name Gene Symbol Amino Acids Tissue Distribution
OATP1A2 SLCO1A2 670 Brain, Kidney
OATP1B1 SLCO1B1 691 Liver
OATP1B3 SLCO1B3 702 Liver
OATP1C1 SLCO1C1 712 Brain, Testis
OATP2A1 SLCO2A1 643 Ubiquitous
OATP2B1 SLCO2B1 709 Ubiquitous
OATP3A1 SLCO3A1 710 Ubiquitous
OATP4A1 SLCO4A1 722 Ubiquitous
OATP4C1 SLCO4C1 724 Kidney
OATP5A1 SLCO5A1 848 Kidney, Ovary
OATP6A1 SLCO6A1 719 Testis
14
Expression of OATP1A2, OATP1B1 and OATP1B3 has been predominantly found in
human liver. In comparison to OATP1A2 and OATP1B3, OATP1B1 plays a critical role in Na+-
independent bile salt uptake system in human liver, whereas OATP2B1 does not play any role in
translocation of bile salts. All four human OATP proteins transports bromosulphophthalein (BSP),
estrone-3-sulfate and dehydroepiandrosterone (DHEAS), however extent of uptake differs due to
varied affinity [9]. Affinity of OATP isoforms of rodent and human species cannot be predicted
on the basis of amino acid sequence, since the Slco gene products corresponding to rodents are not
orthologs of human OATP proteins [10]. This poses a major challenge in the process of drug
development as OATPs are involved in the hepatic uptake of many therapeutic agents. These
variability in the affinity of substrates towards OATPs of different species will make it difficult to
predict hepatic clearance or drug interactions in hepatic transport (if hepatic uptake is the rate-
limiting step in hepatic clearance of a compound) considering that distinct proteins exhibiting
different substrate specificities may be involved. Deltorphin II is a specific substrate for rat
Oatp1a1 whereas its other substrates include monovalent and sulfated bile salts, glucuronide, and
glutathione conjugates [11, 12]. Rat Oatp1a1 shares this substrate specificity except sulfate
conjugates with Oatp1a4. However, digoxin is a specific substrate of Oatp1b4 [3]. Oatp1b2 is
expressed on the basolateral membrane of liver and expresses high affinity towards DHEAS, BSP,
leukotriene C4 (LTC4), and anionic peptides [12]. mRNA expression of OATP3A1 and OATP4A1
has been reported in hepatic tissue, also translocation of estrone-3-sulfate is mediated via
OATP1B1, 2B1, 3A1, and 4A1 whereas OATP4A1 also was helps in transport of 3,3’,5-triiodo-
L-thyronine, thyroxine and taurocholate [10, 13]. Little information has been available so far
regarding the transport and biochemical properties of OATP5A1 [14].

15
Organic Anion Transporters (OATs)
OATs gene family (Slc22) was first cloned in kidney. Expression of Oat2 and Oat3 was
found to be predominant in rat hepatic tissue and helps in translocation of prototypic anionic
substrate paraaminohippurate. Also Oat 2 play a vital role in uptake of dicarboxylates,
indomethacin, methotrexate, salicylate, prostaglandinE2 (PGE2), and nucleoside derivatives,
whereas uptake of cimetidine, estrone-3-sulfate, and ochratoxin A is mediated via Oat3 [15] [16].
It has been postulated that Oat proteins expressed on basolateral membrane of hepatic tissue
physiologically function as excretion system. mRNA expression of Oat3 has been reported in
human liver [17, 18]. OAT2 and OAT4 exhibits overlapping substrate specificities including
prostaglandin F2α (PGF2α), tetracycline, salicylate, zidovudine, and PGE2 [19-23], also OAT4
shows its substrate specificity towards methotrexate and ochratoxin A [24, 25].
Organic Cation Transporters (OCTs and OCTNs)
OCTs are responsible for hepatic uptake of smaller type I organic cations (e.g.,
tetraethylammonium, azidoprocainamide methoiodide) [26, 27]. Expression of Oct1 has been
reported on basolateral membrane of rat hepatocytes [28]. Little information is available on the
expression and function of OCT3, however it has been reported that OCT3 helps in transport of -
methyl-4-phenylpuridinium iodide in the HepG2 hepatoma cell line [29]. Novel organic cation
transporters were classified as OCTN1 and OCTN2 of SLC22 gene family containing a nucleotide
binding site sequence motif [30, 31]. Information is still missing on exact membrane localization
and substrate specificity of these novel OCTs in rat and human liver.
Multidrug Resistance Associated Protein1 (MRP1)
MRP subfamily may play a major role in excretion of drugs or metabolites from the human
hepatocyte to sinusoidal blood. MRP family is classified into nine members, out of which, 7

16
members are responsible for hepatic elimination of organic anions. Expression of MRP1 is lower
in lateral levels and is primarily expressed in intracellular vesicles in human hepatocytes [32-34].
It has been reported that intracellular GSH has one of the requirement for transport of drugs
mediated via MRP1, however it’s not the case with the transport of conjugated drugs [35].
Multidrug Resistance Associated Protein3 (MRP3)
Mrp3 expressed on basolateral membrane of hepatic tissues mediates the hepatic
elimination of monovalent (e.g., taurocholate and glycocholate) and sulfated bile salts, as well as
other organic anions such as E217G, methotrexate and acetaminophen glucuronide [36-38]. Mrp3
shows higher affinity towards glucuronide conjugates than glutathione conjugates [37].
Phenobarbital and cholestatic conditions induces the expression level of Mrp3 in rats [39]. Humans
exhibiting naturally occurring hereditary defects in biliary excretion of organic anions shows
induced levels of MRP3/Mrp3 [40]. Induced expression of MRP3/Mrp3 acts as a compensatory
mechanism for the reduced ability to excrete organic anions into bile. Mrp3 is hypothesized to play
a vital role in enterohepatic circulation of bile salts [37].
Multidrug Resistance Associated Protein4 and 5 (MRP4 and MRP 5)
Translocation of cyclic nucleotides adenosine 3’, 5’-cyclic monophosphate (cAMP) and
guanosine 3’, 5’-cyclic monophosphate (cGMP) is mediated via MRP4 and MRP5 expressed on
the basolateral membrane of hepatic tissue [41]. Due to utilization of different in vitro systems,
various discrepancies has been reported in the Km values for MRP4 and MRP5 [42, 43]. These
transporter proteins also translocates methotrexate (42), the antiviral agent 9-(2-
phosphonomethoxyethyl) adenine and the reverse transcriptase inhibitor azidothymidine [44, 45].
Sulfated bile acids and steroids competitively inhibit transport of MRP4 substrates. Induced level
of expression of Mrp4 was reported with chronic elevation of bile acid levels [46, 47].
17
Multidrug Resistance Associated Protein6 (MRP6)
Expression of Mrp6 has been reported on both apical and basolateral in rat hepatocytes.
Mrp6 transporter protein does not play any vital role in governing hepatic excretion of phase II
biotransformation products (e.g., glucuronide, sulfate, and glutathione conjugates), since it is not
involved in the translocation of typical anionic substrates except cyclopentapeptide BQ-123. Mrp6
transporter exhibit high levels of expression in human liver and kidney, although information is
still lacking examining the role of this transporter in drug transport [48, 49].
Multidrug Resistance Associated Protein7 and 8 (MRP7 and MRP 8)
mRNA expression of MRP7 has been reported in various tissues including liver. Also,
E217G and LTC4 exhibited their substrate specificity towards MRP7 [50, 51]. Liver shows higher
mRNA expression of MRP8 in comparison to breast and testis. MRP8 shares overlapping substrate
specificity with MRP5 including transport of cyclic nucleotides [52, 53].
Drug or Membrane Transporters of the Hepatic Apical (Canalicular) Membrane
Bile Salt Export Pump (BSEP)
These export pumps transports xenobiotics and metabolites across the canalicular
membrane into bile via unidirectional ATP-dependent process (Fig.1.2). These canalicular
membrane transporters belong to the ABC superfamily of transporters [54]. This transporter is also
referred as sister gene of P-glycoprotein and eliminates conjugated and unconjugated bile salts into
the canalicular space [55]. Absence of BSEP from the apical membrane and mutation in ABCB11
gene in patients with progressive familial intrahepatic cholestasis type 2 (PFIC2) leads to
diminished biliary bile salt concentrations relative to normal patient [56, 57]. BSEP does not play
any important role in hepatic excretion of therapeutic agents, however it may act as an important
site for transporter mediated drug interactions.
18
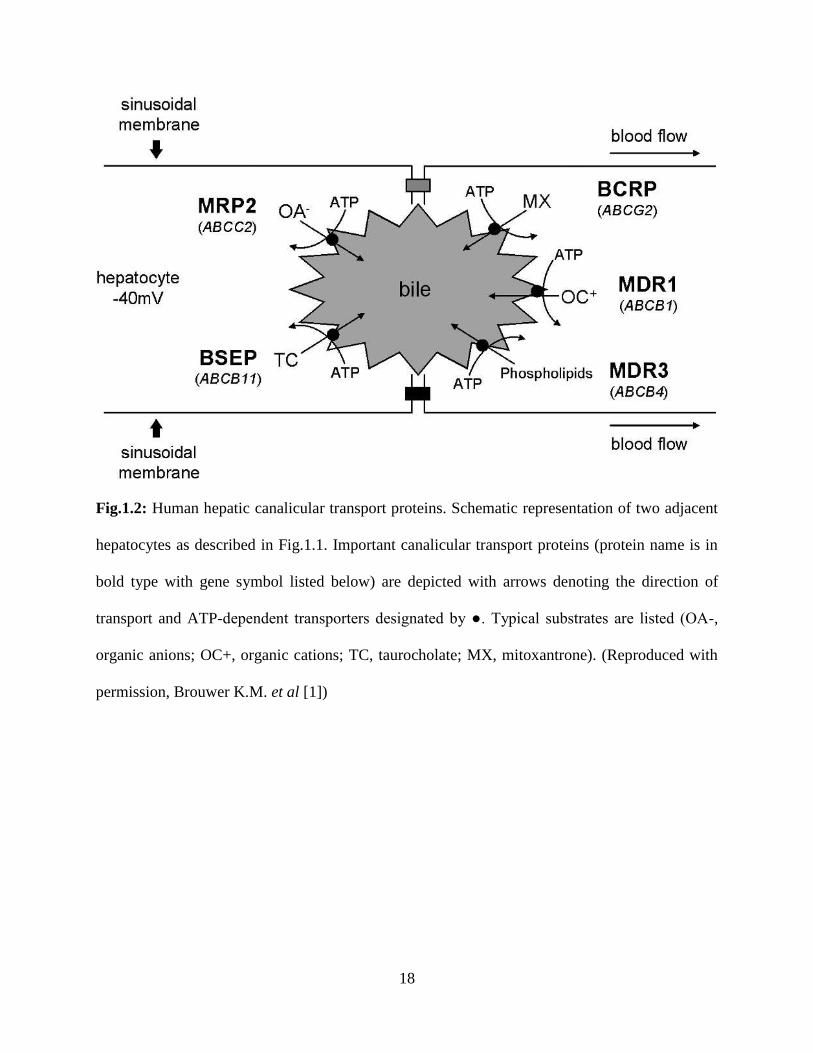
Fig.1.2: Human hepatic canalicular transport proteins. Schematic representation of two adjacent
hepatocytes as described in Fig.1.1. Important canalicular transport proteins (protein name is in
bold type with gene symbol listed below) are depicted with arrows denoting the direction of
transport and ATP-dependent transporters designated by ●. Typical substrates are listed (OA-,
organic anions; OC+, organic cations; TC, taurocholate; MX, mitoxantrone). (Reproduced with
permission, Brouwer K.M. et al [1])
19
Multidrug Resistance Associated Protein2 (MRP2)
This membrane transporter was earlier referred as the canalicular multispecific organic
anion transporter (cMOAT) and is the most extensively evaluated canalicular member of the
MRP/Mrp family. It is responsible for biliary excretion of organic anions including LTC4, divalent
bile salts, and glutathione, glucuronide, and sulfate conjugates [58]. In patients with Dubin-
Johnson syndrome, Groningen Yellow/Transport-deficient Wistar rats (GY/TR-) and Eisai
hyperbilirubinemic Sprague-Dawley rats (EHBR), absence of these apical hepatic transporter
forms the basis for the defect in biliary excretion of organic anions [40, 59-61]. In rats and patients
with downregulated expression of Mrp2, biliary excretion of organic anions, including conjugated
bile acids is compensated by upregulated expression of MRP3/Mrp3 which help in elimination of
organic anions, including conjugated bile acids [62]. Elimination profile of compound, whether
the compound gets eliminated in bile or urine, will determine its affinity towards canalicular and
basolateral excretory transporters, as well as the activity of the respective transporters. Hepatic
elimination of compounds get significantly influenced by altered transporter activity due to drug
or nutrient interactions or patient-specific factors such as disease, genetics.
Multidrug Resistance Protein1 or P-glycoprotein (MDR1 or P-gp)
It is the most widely studied and examined hepatic canalicular transporter. Interactio of
anti-cancer agents with P-gp has been postulated as one of the major reason for the development
of chemo resistance to an array of chemotherapeutic agents that exhibit a wide range of structures
and mechanisms of action [63]. Translocation of hydrophobic cations is mediated via MDR1
transporter protein. Characteristics of typical substrate of MDR1 are presence of planar aromatic
rings which interacts with a hypothesized “flat” hydrophobic region of the MDR1 drug-binding
domain, a cationic charge at physiological pH, a bulky structure having molecular weight >400

20
and a log partition coefficient >2 [64, 65]. Importance of MDR1 in the distribution and elimination
of relatively small, aliphatic and aromatic, permanently charged cationic molecules has been
demonstrated in several studies carried out on Mdr1 gene knockout mice [66, 67]. Various MDR1
substrates include
daunorubicin, doxorubicin, etoposide, paclitaxel, vinblastine, vincristine, pazopanib, vandetanib,
sorafenib, digoxin, methadone, morphine, rhodamine 123, cyclosporin A, etc [68]. In order to
narrow down the substrate affinities, specificities, structural requirement, binding sites of
modulators towards MDR1, a three-dimensional quantitative structure- activity relationship
(QSAR) models for MDR1 have been developed [69-71]. Evidently, in the hepatic excretion of a
xenobiotics including many drugs and metabolites, MDR1 plays an important role.
Protein-calorie malnutrition downregulates levels of expression and activity of Mdr1 in rat
canalicular plasma membrane vesicles by ∼22% and ∼35%, respectively [72]. Overexpression of
COX-2 has been directly related to overexpression Mdr1 protein levels in renal rat mesangial cells,
leading to increased Mdr1 activity as measured by rhodamine 123 efflux [73]. Also, upregulated
levels of Mdr1 expression has been reported on exposure to ultraviolet irradiation and heat shock,
however downregulation of Mdr1 expression has resulted in rodents from lipopolysaccharide
induced endotoxemia [74, 75]. Release of cytokines such as interleukin-1β and -6 also modulates
expression of Mdr1 [75]. In addition, Mdr1 may be regulated by a variety of factors.
Multidrug Resistance Protein3 (MDR3)
Uptake of phosphatidylcholine translocase is primarily mediated via MDR3 and its rodent
ortholog Mdr2. Biliary phospholipid secretion is regulated via MDR3 and Mdr2 in humans and
rodents, respectively. Mutation in ABCB4 gene has been reported in patients classified with PFIC

21
type 3 cholestasis. Still more information is needed in order to establish the physiologic role of
MDR3 as a drug transporter [76].
Breast Cancer Resistance Protein (BCRP)
Breast cancer resistance protein, a 72-kDa transporter protein also referred as half ABC
transporter [77]. It confers resistance to mitoxantrone, doxorubicin, daunorubicin and sulfated
conjugates by causing protein dimerization in the plasma membrane [78]. BCRP is reported to
express in several tissues placenta, small intestine, blood-brain barrier, colon, hepatic canalicular
membrane, breast, and venous and capillary endothelium [79]. Apart from other apical hepatic
transporters, biliary excretion of the sulfated conjugates of steroids and xenobiotics is also
mediated via BCRP.
Hepatobiliary Drug Transport Model Systems
Absence of suitable model systems that replicate hepatic anatomy, hepatocyte function and
bile formation is a major restriction in the field of hepatobiliary transport. The advantages of in
vivo and isolated perfused liver techniques, in terms of reflecting the true physiologic state of the
liver, are offset by difference in hepatic transport proteins and varied affinity of compounds may
exist between rodents and humans. Also, it is very difficult to examine individual hepatic uptake
and excretion mechanisms due to the complications associated with whole organ. It is very difficult
to assess the role of individual hepatic transporter on drug disposition due to the non-existence of
specific and potent inhibitors for the hepatic transport proteins. Relative to other in vitro systems,
hepatocytes are more advantageous in terms of providing liver-specific cellular functions (plasma
membrane vesicles; transport proteins transfected in non-mammalian cells) and can be utilized to
study function of specific transport proteins. Also, hepatocytes of free of any concerns related to
species differences in hepatobiliary disposition [80, 81]. For studying hepatic excretion, isolated
22
hepatocytes poses some challenges like loss of cell polarity and redistribution of canalicular
membrane proteins, however, these cells have been extensively employed to evaluate hepatic
transport mechanism [82]. In various transport trafficking and regulation studies, hepatocyte-
derived cell lines (WIF-B and HepG2) showing strong correlation to bile canaliculi has been
utilized [83-86]. Sandwich culture hepatocytes that demonstrates strong and intact canalicular
networks and also maintains hepatic transport protein expression and function are employed as an
important in vitro model system to study hepatobiliary disposition of therapeutic agent and
metabolites [87-89].
For uptake transporter analysis, human embryonic kidneys (HEK) and Chinese hamster
ovary (CHO) cells transfected with the respective transport protein were utilized. These cell
systems are employed to standardize uptake assays and also for comparing, for example, regarding
drug-drug interactions (DDIs). These analyzing of DDIs involves comparing the uptake of the
single drug with the uptake of the single drug in the presence of a drug which can modulate the
function of respective transporter protein. These cell systems provides great advantages regarding
the standardization of the uptake assay, by using the same cell density, different uptake assays can
be compared from different days. These in vitro model based systems are frequently employed for
the analysis of DDIs and also for the functional consequences of polymorphisms [90, 91].
Although, these transfected cell lines play a major role in demonstrating the uptake of a compound
via specific transporter but still may poses a challenge in predicting the role of specific transport
protein in overall hepatobiliary disposition of a compound when multiple transport systems are
present.
Sandwich cultured can be employed to evaluate analogs of specific transport properties
(limited or enhanced hepatobiliary uptake or efflux) at the early stages of lead optimization and
23
candidate selection in the process of drug development. At later stages of drug development,
tranfected cell lines or in vivo models systems may act beneficial in order to study the significance
of transport inhibition and/or identify contrivances responsible for hepatotoxicity [1].
Advancements In Hepatobiliary Drug Transport
In order to enhance understanding hepatic transport biology and how drugs and/or disease
affecting intracellular regulatory mechanisms may modify hepatic transport of endogenous and
exogenous compounds, one should have knowledge about the basic regulation hepatic transport.
Alteration in the membrane transporter function or deviations in the number of molecules
translocate across membrane defines the mechanism governing membrane transport. Modulation
of transporter protein expression can occur at any level protein synthesis including transcription,
translation, and post-translation. Modulation of transporter gene expression in hepatocytes is
governed by transcription factors [92]. Developmental as well as physiological responses to both
endogenous and exogenous compounds is mediated via nuclear hormone receptors comprising of
superfamily of ligand-activated transcription factors. Interaction of xenobiotics with these
receptors results in formation of complex with regulatory region of the gene leading modification
in expression these receptors. On binding of ligand to receptor, already formed complex binds with
heterodimeric partner retinoic acid X receptor (RXR) leading to initiation of transcription. Various
nuclear hormone receptor types were reported to be involved in the transcriptional regulation of
hepatic transport proteins: pregnane X receptor (PXR), peroxisome proliferator-activated receptor
α (PPARα), farnesoid X receptor (FXR), liver X receptor (LXR), and the constitutive androstane
receptor (CAR). Till now, research is still ongoing in order to decode the ligands essential or
required for these nuclear hormone receptors and the role they play in transcriptional control of
24
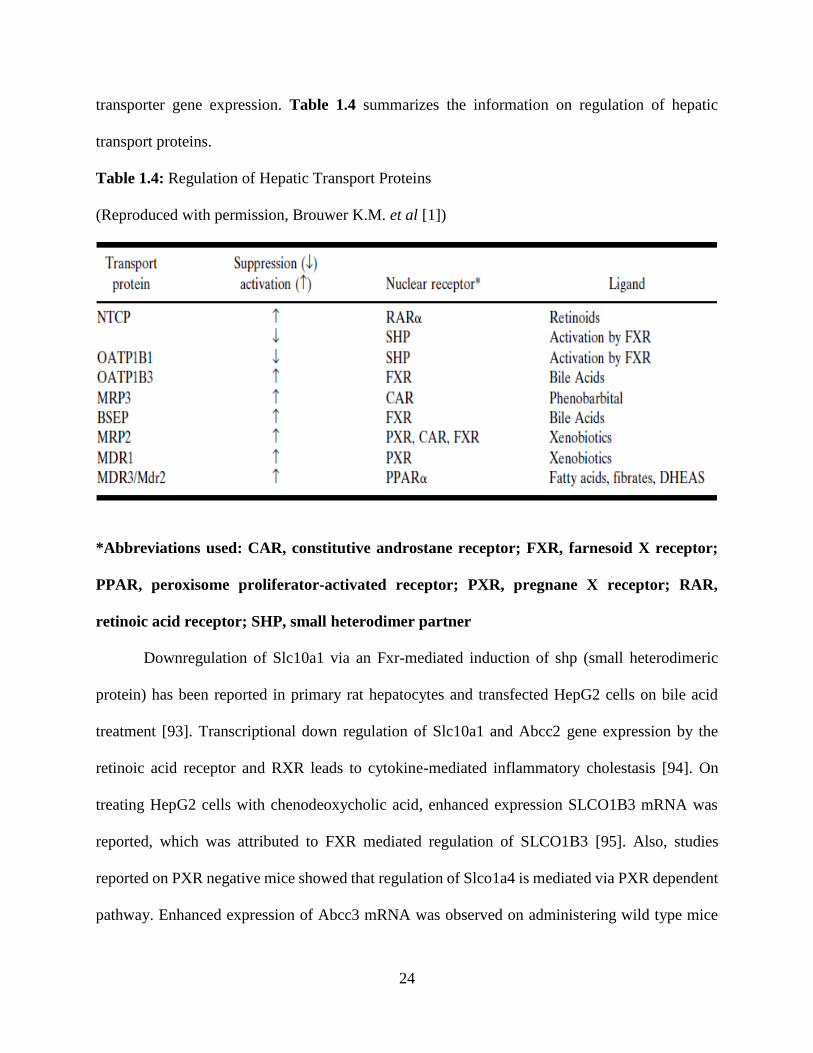
transporter gene expression. Table 1.4 summarizes the information on regulation of hepatic
transport proteins.
Table 1.4: Regulation of Hepatic Transport Proteins
(Reproduced with permission, Brouwer K.M. et al [1])
*Abbreviations used: CAR, constitutive androstane receptor; FXR, farnesoid X receptor;
PPAR, peroxisome proliferator-activated receptor; PXR, pregnane X receptor; RAR,
retinoic acid receptor; SHP, small heterodimer partner
Downregulation of Slc10a1 via an Fxr-mediated induction of shp (small heterodimeric
protein) has been reported in primary rat hepatocytes and transfected HepG2 cells on bile acid
treatment [93]. Transcriptional down regulation of Slc10a1 and Abcc2 gene expression by the
retinoic acid receptor and RXR leads to cytokine-mediated inflammatory cholestasis [94]. On
treating HepG2 cells with chenodeoxycholic acid, enhanced expression SLCO1B3 mRNA was
reported, which was attributed to FXR mediated regulation of SLCO1B3 [95]. Also, studies
reported on PXR negative mice showed that regulation of Slco1a4 is mediated via PXR dependent
pathway. Enhanced expression of Abcc3 mRNA was observed on administering wild type mice
25
with pregnenolone-16α-carbonitrile (PXR ligand), however PXR knockout mice did not show any
effect [96]. On the basis of studies carried out using Wistar Kyoto rats revealed that induction of
Mrp3 by phenobarbital does not involve any active involvement of CAR [97]. FXR/RXRα
heterodimer plays a vital role on transcriptional regulation of ABCB11 gene on exposure to bile
acid chenodeoxycholic acid [98]. Induction of ABCC1 and ABCC2 gene expression on exposure
to redox-active compounds has been reported by Kauffman et al [99]. On incubating rat
hepatocytes and Abcc2 promotor-transfected HepG2 cells with agonists of these nuclear hormone
receptors, induction in Abcc2 mRNA was observed in a PXR, CAR, and FXR-dependent manner
[100]. Transcription regulation of CYP3A4 and MDR1 is mediated via PXR [101-103]. Studies
using wild-type and PPARα-knockout mice demonstrated fibrates induced stimulation of the
phospholipid flippase MDR3 is mediated by PPARα [104].
Short-term regulation and trafficking of hepatic transporters has been examined and
reported in some of the recent work [105-107]. Recruitment and storage of transporters occurs
from a compartment referred as intracellular vesicles in which membrane protein resides [108,
109]. In response to several different cellular stimuli insertion or recruitment of transporter takes
place. Internalization of Mrp2 occurs on disruption of cell-cell contacts in hepatocytes [110].
Internalization of Mrp2 molecules in hepatic intracellular vesicles occurs in hyperosmotic
conditions, however increased Mrp2 content in the canalicular membrane was observed in
hypoosmolarity [111]. Various signaling pathways governs the transporter translocation to and
from the canalicular membrane. Protein content of Mdr1, Mdr2, Bsep, and Mrp2 increased 1.5-
fold by TC and 3-fold by 2’-O-dibutyryl adenosine 3’, 5’-cyclic monophosphate (DBcAMP), a
cell-permeable cAMP analog in canalicular membrane vesicles [112]. On treating Mdr1, Mdr2,
Bsep, and Mrp2 with colchicine (a microtubule inhibitor), the effect of TC was completed blocked
26
whereas the effect of DBcAMP was partially blocked, proposing that trafficking of these
transporters to the apical (canalicular) membrane occurs moderately through microtubules. The
short-term regulation of hepatic basolateral transporters also has been investigated. On treatment
with cAMP, trafficking of Ntcp from endosomes to the basolateral membrane was revealed by
employing cellular fractionation studies [106]. This mechanism involves several pathways
including phosphoinositide 3-kinase and protein kinase B and was sensitive to cytochalasin D
(actin filament formation inhibitor). cAMP directly affects protein activity via direct
phosphorylation of the transporter, apart from stimulating trafficking of proteins from endosomal
compartments to their respective membrane. Increased phosphorylation without internalization of
the protein has been recognized as a major reason for the loss of transport activity of Oatp1a1
[113]. The examples mentioned before demonstrates that intracellular cAMP levels can be
modulated in a therapeutic manner to regulate hepatocyte function in liver disease (i.e.,
cholestasis). Hepatic transport including the hepatobililary disposition and systemic exposure to
drugs and metabolites is a highly governed process and can be influenced translocation of proteins.
Drug Interactions Involved In Hepatic Transport
Several drug interaction in regards to hepatic transport have been reported in last decade
(Table 1.5). Partial inhibition of uptake of cerivastatin in human hepatocytes was observed on
treatment with cyclosporin A (CsA). CsA is an inhibitor of OATP1B1 transporter protein whereas
cerivastatin is a substrate of same transporter. Inhibition of OATP1B1 transporter results in 3 to 4
fold increase in the in the plasma AUC and Cmax of cerivastatin on coadministration of CsA in
kidney transplant patients [114, 115]. Quinidine is an inhibitor of MDR1 transporter. Co-
administration quinidine with digoxin (MDR1 substrate) resulted in diminished biliary excretion
of digoxin by 42% [116, 117]. Decrease in cumulative biliary excretion of doxorubicin and its
27
major metabolite, doxorubicinol, by 84% and 72%, respectively, was observed in comparison to
control, when doxorubicin, a Mdr1 substrate, was coadministered with GF120918 (MDR1/Mdr1
inhibitor) [118]. This transporter mediated drug interaction leading to diminished biliary excretion
of doxorubicin and doxorubicinol by 82% and 62%, respectively, in comparison to wild-type mice
was confirmed in vivo with bile-duct cannulated Abcb1a(−/−) mice [119]. Besides inhibition
interactions, increase biliary clearance of substrates of the hepatic transporters has been observed
when the expression of these transporters get induced. Example, long term treatment of rats with
tamoxifen (an Mdr1 substrate and inducer) leads to not only ∼12-fold increase in hepatic Abcb1b
mRNA but also enhanced biliary excretion of tamoxifen and metabolites from 8–51% [120].
Transporter mediated drug interaction has also been held responsible for drug-induced
hepatotoxicity. Inhibition of Bsep by bosentan leads to enhanced intracellular accumulation of
cytotoxic bile salts which may cause bile salt-induced liver damage which ultimately causes
cholestatic liver injury. Research is still going on in many laboratories in order to reveal the exact
mechanism accountable for hepatic transporter mediated drug interactions [121].
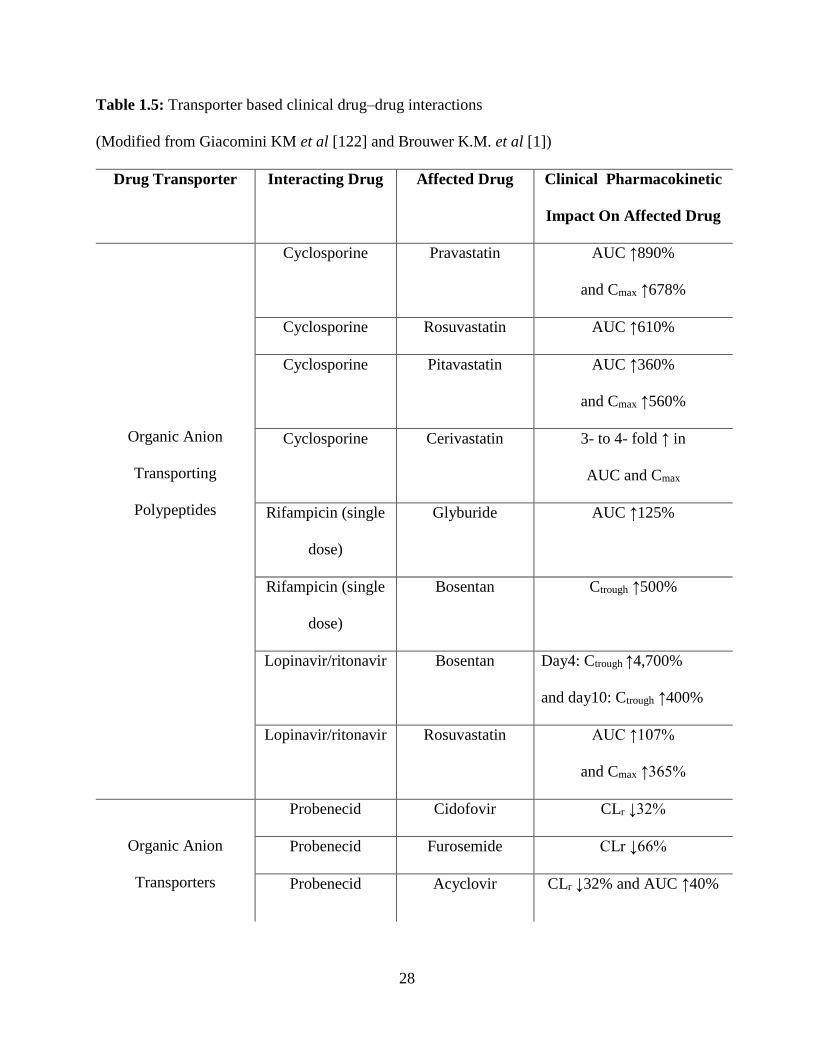
28
Table 1.5: Transporter based clinical drug–drug interactions
(Modified from Giacomini KM et al [122] and Brouwer K.M. et al [1])
Drug Transporter Interacting Drug
Affected Drug Clinical Pharmacokinetic
Impact On Affected Drug
Organic Anion
Transporting
Polypeptides
Cyclosporine Pravastatin AUC ↑890%
and Cmax ↑678%
Cyclosporine Rosuvastatin AUC ↑610%
Cyclosporine Pitavastatin AUC ↑360%
and Cmax ↑560%
Cyclosporine Cerivastatin 3- to 4- fold ↑ in
AUC and Cmax
Rifampicin (single
dose)
Glyburide AUC ↑125%
Rifampicin (single
dose)
Bosentan Ctrough ↑500%
Lopinavir/ritonavir Bosentan Day4: Ctrough ↑4,700%
and day10: Ctrough ↑400%
Lopinavir/ritonavir Rosuvastatin AUC ↑107%
and Cmax ↑365%
Organic Anion
Transporters
Probenecid Cidofovir CLr ↓32%
Probenecid Furosemide CLr ↓66%
Probenecid Acyclovir CLr ↓32% and AUC ↑40%
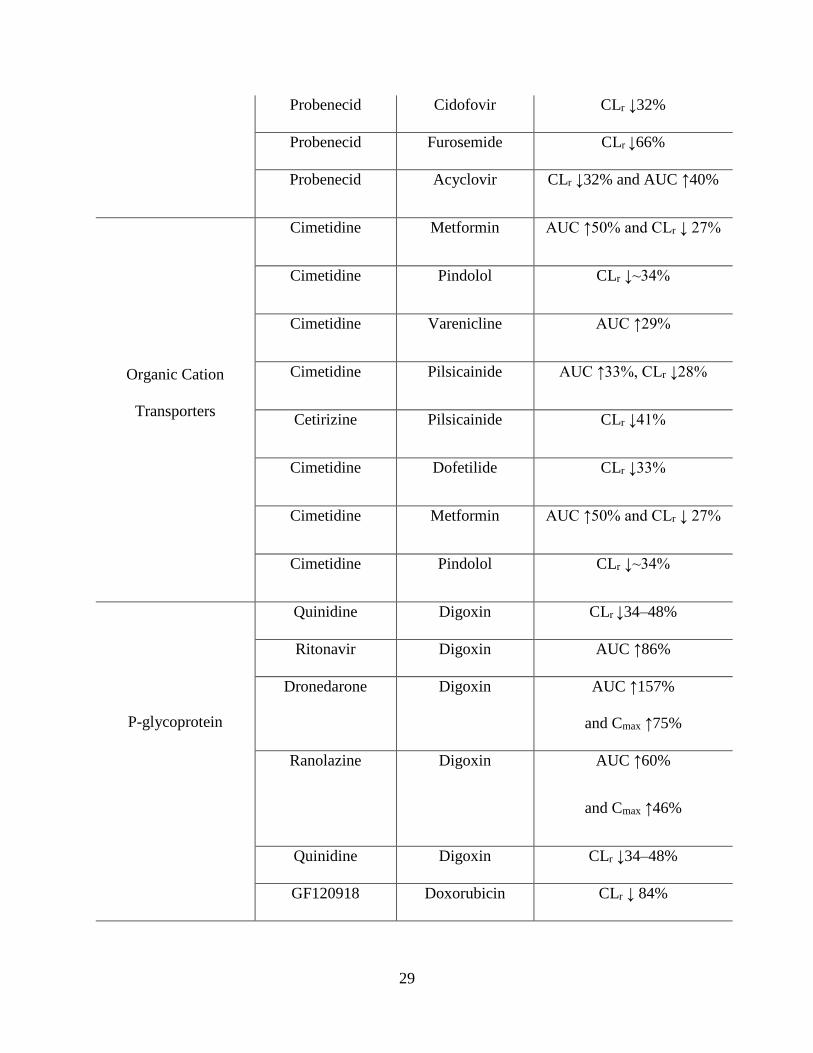
29
Probenecid Cidofovir CLr ↓32%
Probenecid Furosemide CLr ↓66%
Probenecid Acyclovir CLr ↓32% and AUC ↑40%
Organic Cation
Transporters
Cimetidine Metformin AUC ↑50% and CLr ↓ 27%
Cimetidine Pindolol CLr ↓~34%
Cimetidine Varenicline AUC ↑29%
Cimetidine Pilsicainide AUC ↑33%, CLr ↓28%
Cetirizine Pilsicainide CLr ↓41%
Cimetidine Dofetilide CLr ↓33%
Cimetidine Metformin AUC ↑50% and CLr ↓ 27%
Cimetidine Pindolol CLr ↓~34%
P-glycoprotein
Quinidine Digoxin CLr ↓34–48%
Ritonavir Digoxin AUC ↑86%
Dronedarone Digoxin AUC ↑157%
and Cmax ↑75%
Ranolazine Digoxin AUC ↑60%
and Cmax ↑46%
Quinidine Digoxin CLr ↓34–48%
GF120918 Doxorubicin CLr ↓ 84%
30
Breast Cancer
Resistance Protein
GF120918 Topotecan AUC ↑143%
Hepatic Drug Transport And Metabolic Systems Correlation
It has been reported that many drugs or metabolites exhibits significant overlap in substrate
specificities among MDR1 and CYP3A4 [123]. Induced levels of both intestinal Mdr1 and hepatic
CYP3A levels have been reported on exposure to protease inhibitors such as amprenavir and
nelfinavir [124]. Treatment with rifampin, reserpine, phenobarbital, and clotrimazole in a human
colon carcinoma cell line leads to induced expression of MDR1 and CYP3A4 proteins [125]. These
two proteins functions together in order to detoxify and eliminate xenobiotics from the body. Any
alteration in the levels of expression of these proteins will modify the concentration-time profile
and therapeutic effects of many drugs. Also, by changing the intracellular concentrations of
substrates that induce CYP enzymes, MDR1 plays an important role in altering the expression of
CYP3A4 [126]. This interaction may arise grave concerns for effective drug therapy. Combination
of vincristine- doxorubicin-dexamethasone (VAD) is used in treatment multiple myeloma.
Dexamethasone (inducer of both CYP3A4 and MDR1) induces MDR1 activity which will
ultimately leads to diminished intracellular concentrations of vincristine and doxorubicin, and
further lower intracellular concentrations of vincristine due to enhanced activity of CYP3A4 [123].
Also, dexamethasone long term treatment leads to induced levels both Mdr1 and CYP3A4 in male
and female rat livers [127]. MDR1 and CYP3A4 not only shares similar substrate specificities but
also have similar inhibitors too. Azole antifungals, ergot alkaloids, and macrolide antibiotics, not
only inhibits CYP3A4 but also leads to varied degree of inhibition of MDR1 function [128].
Inhibition of Mdr1 by GF120918 in isolated perfused rat livers leads to enhanced metabolism of
31
tacrolimus because of the increased availability of tacrolimus to metabolizing enzymes backing up
the idea of an relationship between CYP3A and Mdr1 [129]. Also, several reports were published
demonstrating the elevated levels of hepatic CYP3A4 in Abcb1b(−/−) mice suggesting some level
of coordinated regulation of both these proteins [130]. In Abcb1b(−/−) and Abcb1a(−/−) mice,
AUC of erythromycin (substrate of MDR1 and CYP3A4) metabolites was observed to be 1.9- and
1.5-fold higher in comparison to wild-type mice. This interaction or results supports the elevated
expression of CYP3A4 in Abcb1b(−/−) and Abcb1a(−/−) mice resulting in higher AUC of
erythromycin metabolites [131].
Several PXR ligands are known substrate of MDR1 and also PXR is a well-known key
modulator of CYP3A4 gene. Rifampicin induced MDR1 induction was identified because of
presence of a distinct PXR binding site (DR4 nuclear response element) in the 5’-upstream region
[102]. Similar to MDR1 knockout mice, diminished levels of Bsep and hence increased level of
hepatic bile acid due to enhanced activity of CYP3A and CYP2B drug-metabolizing enzymes was
observed in FXR nullizygous mice [47]. In order to have more advance knowledge about the
coordinate regulation of hepatic drug metabolizing enzymes and transporters by PXR or other
nuclear hormone receptors, in vitro models with hepatic transport and metabolic systems will be
required to reveal the contrivances of these multifaceted interactions.
Genetic Variations in Hepatic Transport
Alteration in disposition and pharmacokinetic parameters of several therapeutic agents
which arise due to deviations in levels of expression and activity of hepatic transporter may
significantly impact therapeutic efficacy of the drug molecule. Currently, many research based
studies have focused their area on elucidating the mechanism involved in governing these hepatic
transporters at protein level. In in vitro studies, polymorphisms in transport proteins resulted in
32
alteration of transport capacity of these proteins, whereas single nucleotide polymorphisms (SNPs)
associated with hepatic transporters have shown its effect in vivo also. No functional evidence has
been produced on various SNPs observed in the SLCO1A2 and SLCO1B3 genes in Japanese
subjects [132]. Decreased transport capacity of OATP2B1 to 42.5% in comparison to control
Japanese subjects has been attributed to the genetic polymorphism associated with SLCO2B1 gene
[133]. Genetic polymorphisms associated with hepatic OATP1B1 (SLCO1B1) has been examined
and evaluated comprehensively. In a study involving 81 human livers, genetic polymorphisms
associated with SLCO1B1 leads to diminished transport function of OATP1B1 [134]. Reduced
transport and diminished expression of OATP1B1 in European- and African- Americans has been
associated with the several SNPs identified in SLCO1B1 [135]. Population with genetic variants
of SLCO1B1 gene exhibited altered pravastatin (OATP1B1 substrate) kinetics [136]. Naturally
occurring mutation in MRP1 resulted due to amino acid substitution affected the transporter
capacity of MRP1 and resulted in 2-fold decreased transport of LTC4 via MRP1 [136]. It is not
necessary that all the genetic polymorphisms associated with transporter gene will yield beneficial
or harmful effects. Example, genetic polymorphism associated with MRP6 demonstrated no
effects on transport activity of MRP6 [137, 138]. Dubin-Johnson syndrome has been associated
with polymorphisms leading to non-functional activity of MRP2 which ultimately results in
hyperbilirubinemic condition [139]. Liver biopsies of patients suffering Dubin-Johnson syndrome
confirms the absence of MRP2 protein [140]. Impaired maturation and/or trafficking/localization
of the protein or compromised ATP-hydrolysis has been attributed to different mutations in the
MRP2 gene [141-143]. In recent years, revelation of genetic polymorphisms in hepatic transport
genes, evaluation and examination of their functional significance, and development of assays to

33
identify patients exhibiting clinically significant polymorphisms have gained significant interest
in the field of transporter based research [1].
Future Of Hepatobiliary Drug Transport Research
This chapter highlights the highlights the major hepatic transport systems identified so far
that mediate hepatic uptake, excretion, and/or interactions with xenobiotics, including therapeutic
agents and their metabolites. Although our understanding of hepatic transport from a physiologic,
pharmacological, and clinical perspective has amplified extensively during the past decade, we
clearly lack complete knowledge about the complex processes involved in hepatobiliary drug
disposition. Many vital questions still needs to be answered. Example, uptake/transport of
xenobiotics through hepatocyte from the basolateral domain to metabolic sites, and from sites of
metabolism to the basolateral or canalicular domains? Excretion of some drug molecules into bile
whereas translocation of other molecules across the basolateral membrane into sinusoidal blood?
Important concerns which governs the hepatic transport processes in normal and diseased liver
still needs proper understanding. Current research focused on the transporter mediated hepatic
uptake of substrates will enhance our current understanding of hepatobiliary drug transport by
identifying the transporter proteins responsible for uptake of drugs into hepatocytes prior to
metabolism and biliary excretion. This knowledge will provided an extra edge in the process of
drug development by representing a new and exciting aspect of the discipline. Also, research area
is focused towards identifying new chemical entities that are substrates for specific hepatic
transport systems by a moderate/high-throughput screening methods. These methods will help in
generating data which in turn will provide systematic characterization of structure-transport
relationships for both animal and human hepatic transport proteins. Various in vitro assays to
evaluate and examine hepatic drug transport will provide more in depth knowledge regarding
34
hepatobiliary drug disposition in humans. By elucidating the transporters responsible for uptake
of compounds into the hepatic tissue prior to metabolism and biliary excretion will not only
provided information about pharmacokinetics of the substrate molecule but will also provide
information about potential transporter based drug interactions. This information or knowledge
will act as a prerequisite in drug development process in order to achieve desirable clinical
outcomes [1].
35
CHAPTER 2
ROLE OF OATP-1B1 AND/OR OATP-1B3 IN HEPATIC DISPOSITION OF TYROSINE
KINASE INHIBITORS
Rationale
Hepatic uptake of drugs is mediated via various members of membrane transporter
families. Membrane transporters localized on the basolateral side of hepatic tissue are known to
play an important role in the uptake of therapeutic agents/metabolites from blood into the
hepatocytes. This uptake process is recognized as the first step in hepatocellular elimination and
plays a vital role in hepatic drug disposition. Organic anion transporting polypeptides (OATPs)
appear to play a critical role in bioavailability, distribution and excretion of numerous exogenous
amphipathic organic anionic compounds including anionic oligopeptides, steroid conjugates,
organic dyes, bile salts, thyroid hormones and many drugs such as pravastatin, rifampicin etc.[144-
147].
Tyrosine kinase inhibitors (TKIs) target intracellular tyrosine kinase domain of various
tyrosine kinase receptors which are often over expressed in cancer tissues. Human genome
sequence data have indicated that deregulation of protein kinase pathway is one of the main
mechanisms underlying tumor growth. Over the past few years, attention has been focused towards
the discovery of a targeted therapy which will act against defining characteristics of cancer
resulting from abnormal function of protein kinases [148, 149]. In the past decade, U.S. Food and
Drug Administration (FDA) has approved several TKIs. Many of these compounds have been
associated with low patient response along with unwanted effects of toxicity, which is unexpected
and largely unexplained. Comprehensive data from Phase I studies of these TKIs establishes the
optimized dose for Phase II. Even though TKIs offer theoretical advantages (selectively target/kill
36
the cancer precursor cells and protect normal tissues) over traditional anti-cancer agents, these
agents are still associated with unpredictable clinical effects because of inter-individual
pharmacokinetic variability and narrow therapeutic window [148, 150]. Substantial inter-
individual differences in the concentration-time profiles of TKIs range from 32-118% and is
mostly unexplained. Many TKIs exhibit limited efficacy with significant degree of unexpected and
unexplained toxicity [151]. Inter-individual pharmacokinetic variation in TKIs can have both
genetic and non-genetic origins. This pharmacokinetic variation can be due to many plausible
sources, including inter-individual differences in absorption, distribution, metabolism and
excretion (ADME). TKIs are primarily metabolized in liver by CYP enzymes (mainly CYP3A4)
and are eliminated via biliary excretion route into feces as unchanged drug or metabolites [151].
Hepatic uptake of TKIs can be attributed as a major source of pharmacokinetic variability, which
is also recognized as one of the most crucial and complex steps in drug disposition [148].
Currently, various OATP family transporters such as OATP-1B1, -1B3 and -2B1 have been
identified and characterized on sinusoidal membrane of hepatic tissue [144]. However the
mechanisms responsible for hepatocellular accumulation of TKIs prior to metabolism and biliary
secretion are still largely unexplained. Previous investigations have reported that organic anion
transporting polypeptide transporters (OATPs) namely OATP-1B1 and -1B3 are responsible for
uptake of TKIs into human liver cells [148]. Uptake of TKIs such as axitinib, lapatinib and
sorafenib into human hepatocytes is regulated by OATP-1B1 and/or -1B3. Also, some of the TKIs,
namely, pazopanib and lapatinib are known to inhibit the functional capacity of OATP-1B1 and/or
-1B3 transporter proteins [148]. However, there is still a need for systematic approach to delineate
the mechanism involved in hepatic uptake of these TKIs. Since, hepatic system possesses many
transporters (both influx and efflux), it is difficult to delineate the affinity of individual transporters

37
towards these TKIs. Hence, it is of utmost importance to estimate the relative contribution of
OATP-1B1 and -1B3 in hepatic uptake of TKIs [144]. In the present study, we evaluated the
interaction of the TKIs (pazopanib, erlotinib, canertinib, nilotinib and vandetanib) with the human
OATPs expressed on sinusoidal membrane of liver by employing in vitro model system with wild
type and transfected Chinese hamster ovary (CHO) cells.
Materials And Methods
Chemicals
Pazopanib, erlotinib, canertinib, nilotinib and vandetanib were purchased from LC
Laboratories (Woburn, MA). All other chemicals used were of high performance liquid
chromatography grade and were obtained from either Sigma Aldrich or Fisher Scientific.
In Vitro Studies
Cell Lines
Chinese hamster ovary (CHO) cells (passage number 17-50) were selected for all in vitro
experiments. Wild-type (WT), OATP-1B1 and -1B3 CHO transfected cells were a gift from Dr.
Bruno Stieger (Department of Clinical Pharmacology and Toxicology, University Hospital Zürich,
Switzerland). Cells were cultured in Dulbecco's modified Eagle's medium (DMEM),
supplemented with 10% heat inactivated fetal bovine serum (FBS), L-proline (50μg/mL), HEPES,
penicillin (100μg/ml), streptomycin (100μg/ml), and maintained at 37°C with 5% CO2 under
humidifying conditions. For OATP-1B1 and -1B3 expressing CHO cells, the medium was also
supplemented with geneticin (100μg/mL).
In Vitro Cellular Accumulation Studies
Cellular accumulation studies were conducted in 24 well polystyrene plates (Costar
Corning, NY). CHO cells (WT and transfected) were plated at a seeding density of 3 × 10⁵
38
cells/well. The medium was changed every alternate day. Cells formed confluent monolayers in
3–4 days. Twenty-four hours before any experiment, the cells were exposed to 10mM sodium
butyrate to induce higher expression of the transfected transporter. On the day of experiment,
medium was aspirated and cells were rinsed three times with cell assay buffer (116.4 mM NaCl,
5.3 mM KCl, 1 mM NaH2PO4, 0.8 mM MgSO4, 5.5 mM D-glucose and 20 mM Hepes/Tris; pH
7.4) pre-warmed at 37ºC. The uptake experiment was initiated by adding 0.5 mL of fresh serum
free medium containing 0.25 and 0.5μM of TKIs (pazopanib, erlotinib, canertinib, nilotinib and
vandetanib) in WT as well as OATP-1B type transfected cells. After incubating cells for 10
minutes with TKIs, uptake solution was aspirated and the cells were washed twice with 2 mL of
ice-cold uptake buffer. This resulted in removal of the non-specifically bound substrate from the
membrane as well as arrested further cellular accumulation. Finally, 0.5 mL of fresh DMEM was
added to each well and cell lysis was carried out by storing the culture plates overnight at −80°C.
On the following day, intracellular drug concentration was quantified using liquid chromatography
tandem mass spectrometry (LC/MS–MS) as described in previous publications from our group as
well as others [152-156]. Based on the time points for uptake the minimum concentration observed
were well beyond the detection limit. The amount of TKIs accumulated was normalized to the
protein content in each well with Bradford’s reagent (Bio-Rad, California). All stock solutions
were prepared in dimethyl sulfoxide (DMSO) and diluted using medium such that the final DMSO
concentration did not exceed 0.5% (v/v).
Estimation Of Michaelis-Menten Kinetics
To determine the kinetic basis for the differential uptake of OATP-1B1 and -1B3
transporter proteins, concentration dependent uptake of TKIs were carried out. Using a
concentrated stock solution of the TKIs, several working concentrations were prepared ranging
39
from (0.01μM - 50μM) in serum free fresh medium. Uptake was carried out at different
concentration of TKIs in WT, OATP-1B1 and -1B3 transfected CHO cells.
Data Analysis
Kinetic parameters of TKIs uptake via hepatic OATP-1B1 and -1B3 were calculated with
a nonlinear least squares regression analysis program KaleidaGraph version 3.5. The data was
plotted and fitted to Michaelis-Menten equation (1) and the maximum transport rate (Vmax) and
Michaelis-Menten constant (Km) were calculated.
𝒗 =𝑽𝒎𝒂𝒙[𝑪]
𝑲𝒎 + [𝑪] 𝐄𝐪. 𝟏
v is the initial uptake rate, Vmax is the maximal velocity, Km is Michaelis–Menten constant, and C
is the total concentration of TKIs.
Cytotoxicity Studies
Cell Titer 96® Aqueous Non-Radioactive Cell Proliferation Assay Kit (Promega, Madison,
WI) was employed to carry out cytotoxicity assay. WT, OATP-1B1 and -1B3 transfected CHO
cells were cultured in 96-well plate. Sterile drug solutions of highest concentration (50µM) of
TKIs are prepared in the culture medium using 0.22µm nylon sterile membrane filters. Aliquots of
TKIs having a volume of 100µL (previously made in culture medium) were added to each well
and incubated for 24h. Cell proliferation of the cells in the presence of TKIs was compared with a
negative control (medium without TKIs) and a positive control (Triton X). Twenty microliters of
dye solution was added to each well after 24h of incubation with TKIs. Cells were then incubated
for 4h in order to complete the reaction of cells with dye. UV absorbance of purple formazan
formed was quantified at a wavelength of 590nm with a 96-well micro titer plate reader
(SpectraFluor Plus, Tecan, Maennedorf, Switzerland). Toxicity of TKIs in WT and OATP-1B type
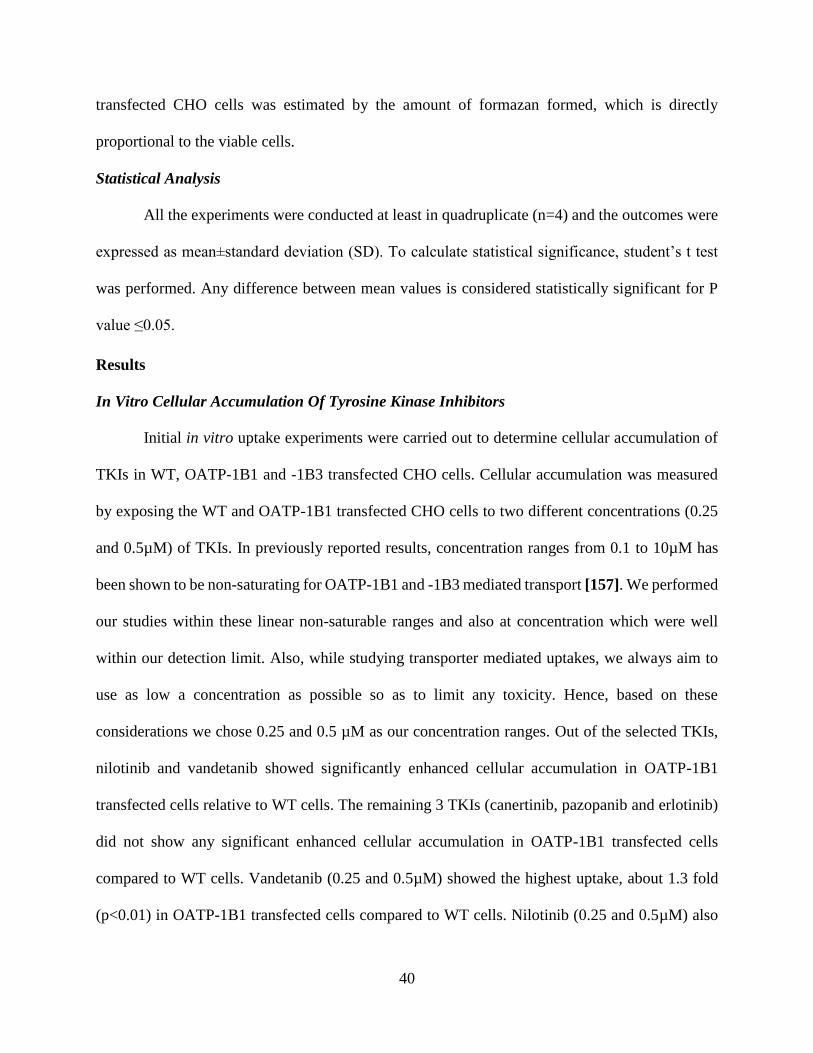
40
transfected CHO cells was estimated by the amount of formazan formed, which is directly
proportional to the viable cells.
Statistical Analysis
All the experiments were conducted at least in quadruplicate (n=4) and the outcomes were
expressed as mean±standard deviation (SD). To calculate statistical significance, student’s t test
was performed. Any difference between mean values is considered statistically significant for P
value ≤0.05.
Results
In Vitro Cellular Accumulation Of Tyrosine Kinase Inhibitors
Initial in vitro uptake experiments were carried out to determine cellular accumulation of
TKIs in WT, OATP-1B1 and -1B3 transfected CHO cells. Cellular accumulation was measured
by exposing the WT and OATP-1B1 transfected CHO cells to two different concentrations (0.25
and 0.5µM) of TKIs. In previously reported results, concentration ranges from 0.1 to 10µM has
been shown to be non-saturating for OATP-1B1 and -1B3 mediated transport [157]. We performed
our studies within these linear non-saturable ranges and also at concentration which were well
within our detection limit. Also, while studying transporter mediated uptakes, we always aim to
use as low a concentration as possible so as to limit any toxicity. Hence, based on these
considerations we chose 0.25 and 0.5 µM as our concentration ranges. Out of the selected TKIs,
nilotinib and vandetanib showed significantly enhanced cellular accumulation in OATP-1B1
transfected cells relative to WT cells. The remaining 3 TKIs (canertinib, pazopanib and erlotinib)
did not show any significant enhanced cellular accumulation in OATP-1B1 transfected cells
compared to WT cells. Vandetanib (0.25 and 0.5µM) showed the highest uptake, about 1.3 fold
(p<0.01) in OATP-1B1 transfected cells compared to WT cells. Nilotinib (0.25 and 0.5µM) also
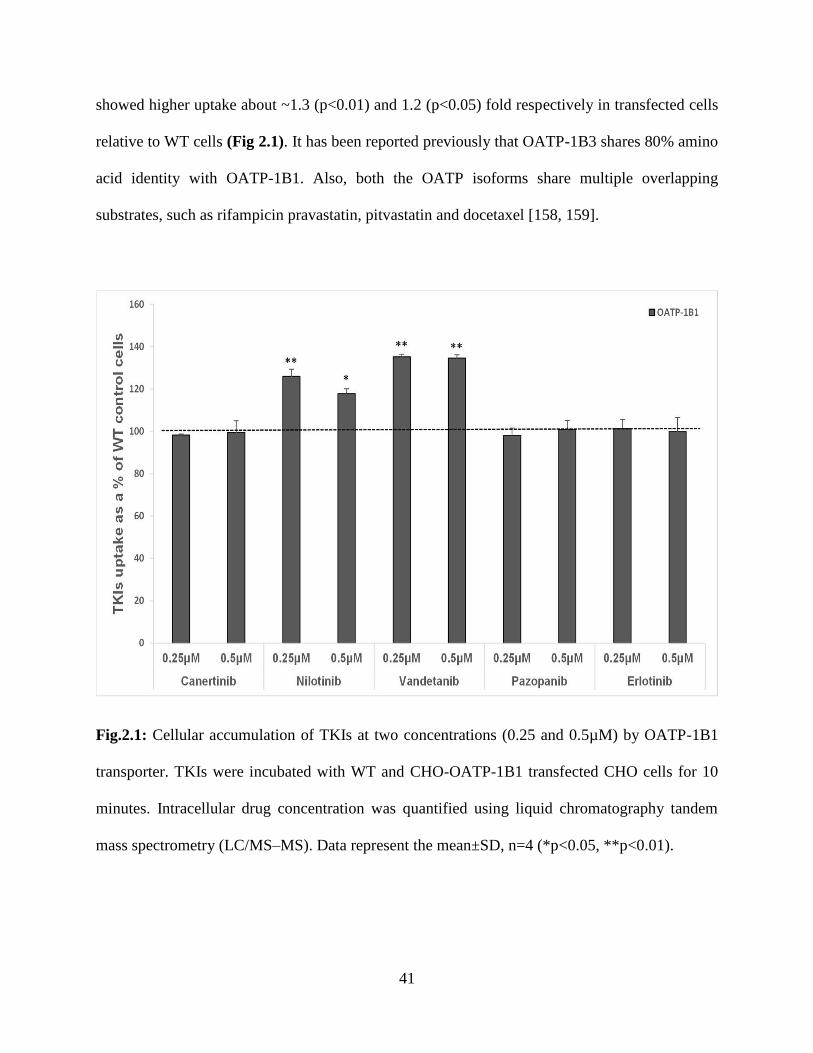
41
showed higher uptake about ~1.3 (p<0.01) and 1.2 (p<0.05) fold respectively in transfected cells
relative to WT cells (Fig 2.1). It has been reported previously that OATP-1B3 shares 80% amino
acid identity with OATP-1B1. Also, both the OATP isoforms share multiple overlapping
substrates, such as rifampicin pravastatin, pitvastatin and docetaxel [158, 159].
Fig.2.1: Cellular accumulation of TKIs at two concentrations (0.25 and 0.5µM) by OATP-1B1
transporter. TKIs were incubated with WT and CHO-OATP-1B1 transfected CHO cells for 10
minutes. Intracellular drug concentration was quantified using liquid chromatography tandem
mass spectrometry (LC/MS–MS). Data represent the mean±SD, n=4 (*p<0.05, **p<0.01).

42
In this study, we have also determined the cellular uptake of TKIs at two different
concentrations (0.25 and 0.5µM) in WT and OATP-1B3 transfected cells. Canertinib, nilotinib and
vandetanib at both concentrations showed significantly enhanced cellular accumulation in OATP-
1B3 transfected cells compared to WT cells (p<0.01). No difference was observed in cellular
accumulation of pazopanib and erlotinib in OATP-1B3 transfected cells compared to WT cells
(Fig 2.2). Highest uptake of canertinib (0.25 and 0.5µM) was observed, about 2 (p<0.01) and ~5
(p<0.01) times respectively, in OATP-1B3 transfected cells than the WT cells. A significantly
higher uptake of vandetanib and nilotinib was also evident in OATP-1B3 cells than WT (Fig 2.2).
No statistically significant changes in cellular accumulation of pazopanib and erlotinib were found
between WT and OATP-1B3 transfected cells (Fig.2.2). Nilotinib and vandetanib showed
overlapping substrate specificity towards OATP-1B1 and -1B3 while canertinib only showed
affinity towards OATP-1B3.
Fig 2.2: Cellular accumulation of TKIs at two concentrations (0.25 and 0.5µM) by OATP-1B3
transporter. TKIs were incubated with WT and OATP-1B3 transfected CHO cells for 10 minutes.
43
Intracellular drug concentration was quantified using liquid chromatography tandem mass
spectrometry (LC/MS–MS). Data represent the mean±SD, n=4 (*p<0.05, **p<0.01).
Estimation Of Michaelis-Menten (MM) Kinetics
For estimation of MM kinetics, WT, OATP-1B1 and -1B3 transfected CHO cells were
incubated with various concentration (0.01μM - 50μM) of TKIs. Previous studies have shown
time-dependent uptake on similar cell lines to be linear up to 15 minutes [160-162]. We incubated
our cells for 10 minutes as it falls within the linear range of uptake as well as gives us
concentrations that lie well within the detectable range. Figs 2.3 and 2.4 clearly demonstrate that
carrier mediated uptake of TKIs via OATP-1B1 and OATP-1B3 is concentration-dependent and
saturable at higher concentrations. This is the first study where Michaelis-Menten kinetic
parameters of OATP-1B1 and OATP-1B3 have been evaluated for selected TKIs (canertinib,
pazopanib, nilotinib, vandetanib and erlotinib). The values obtained for kinetic parameters have
been summarized in Table 2.1. Despite no significant changes in cellular accumulation of
canertinib and nilotinib at lower concentration (0.01-0.075μM), these drugs showed greater
accumulation at higher concentrations (0.1-50 μM) in OATP-1B1 and/or -1B3 cells in comparison
to CHO-WT cells. For vandetanib, kinetic parameter were evaluated in the concentration range of
0.01μM - 50μM. Intracellular accumulation of nilotinib and vandetanib was mediated via OATP-
1B1 transporter protein. Km value of 2.72 ± 0.25µM for vandetanib showed higher affinity towards
OATP-1B1 transporter than nilotinib (Km = 10.14 ± 1.91µM).
Three TKIs (vandetanib, nilotinib and canertinib) appeared to have affinity towards OATP-
1B3. Affinity of these TKIs towards OATP-1B3 transporter was in following order:
vandetanib>nilotinib>canertinib (Km = 4.37 ± 0.79, 7.84 ± 1.43 and 19.87 ± 2.20µM, respectively).
Also, vandetanib showed greater affinity towards OATP-1B1 than OATP-1B3 transporter protein
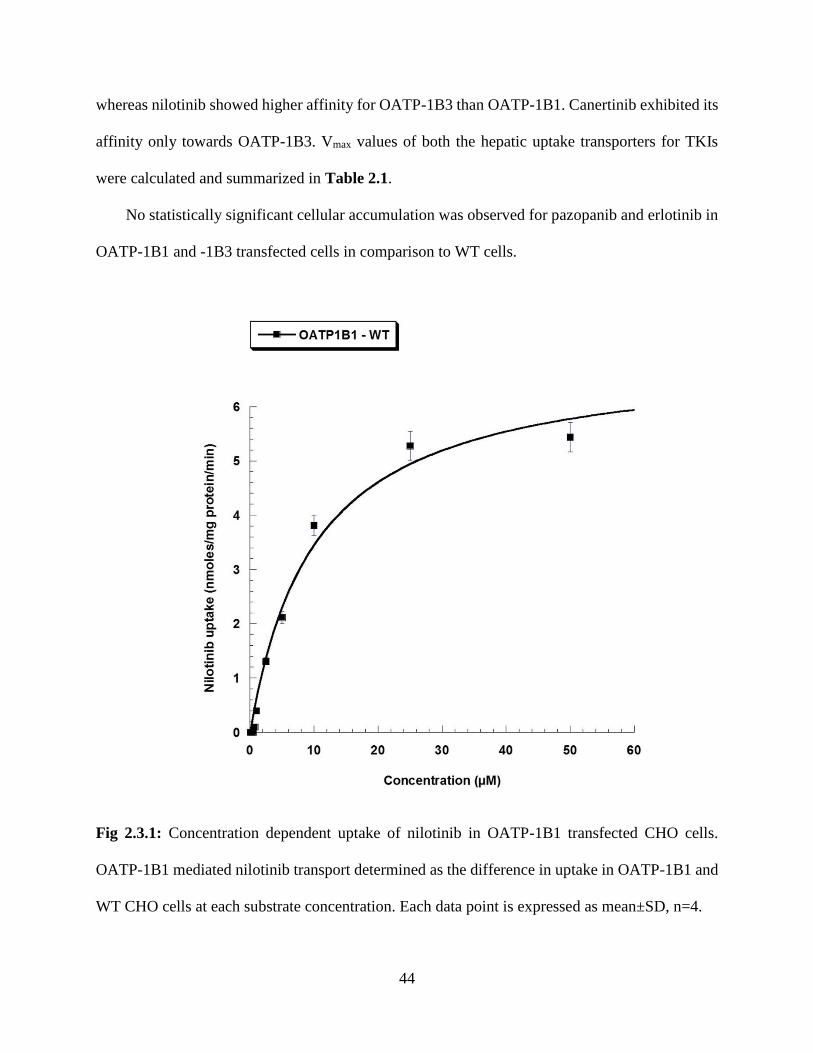
44
whereas nilotinib showed higher affinity for OATP-1B3 than OATP-1B1. Canertinib exhibited its
affinity only towards OATP-1B3. Vmax values of both the hepatic uptake transporters for TKIs
were calculated and summarized in Table 2.1.
No statistically significant cellular accumulation was observed for pazopanib and erlotinib in
OATP-1B1 and -1B3 transfected cells in comparison to WT cells.
Fig 2.3.1: Concentration dependent uptake of nilotinib in OATP-1B1 transfected CHO cells.
OATP-1B1 mediated nilotinib transport determined as the difference in uptake in OATP-1B1 and
WT CHO cells at each substrate concentration. Each data point is expressed as mean±SD, n=4.
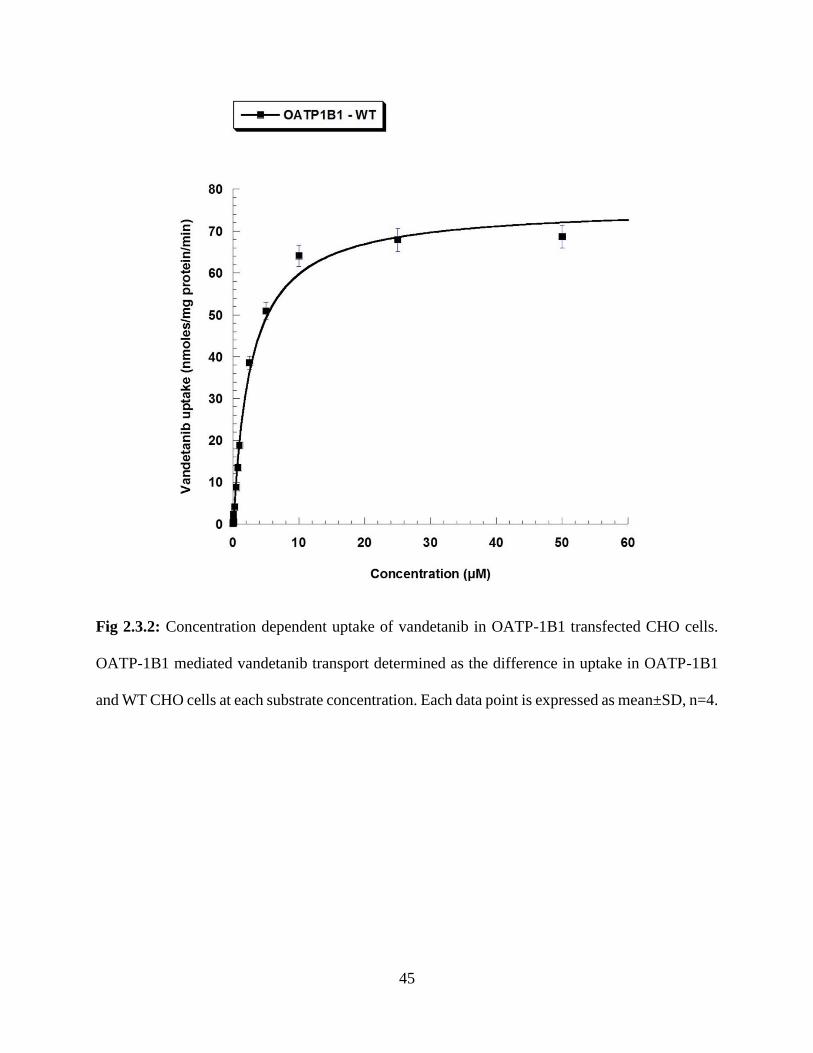
45
Fig 2.3.2: Concentration dependent uptake of vandetanib in OATP-1B1 transfected CHO cells.
OATP-1B1 mediated vandetanib transport determined as the difference in uptake in OATP-1B1
and WT CHO cells at each substrate concentration. Each data point is expressed as mean±SD, n=4.
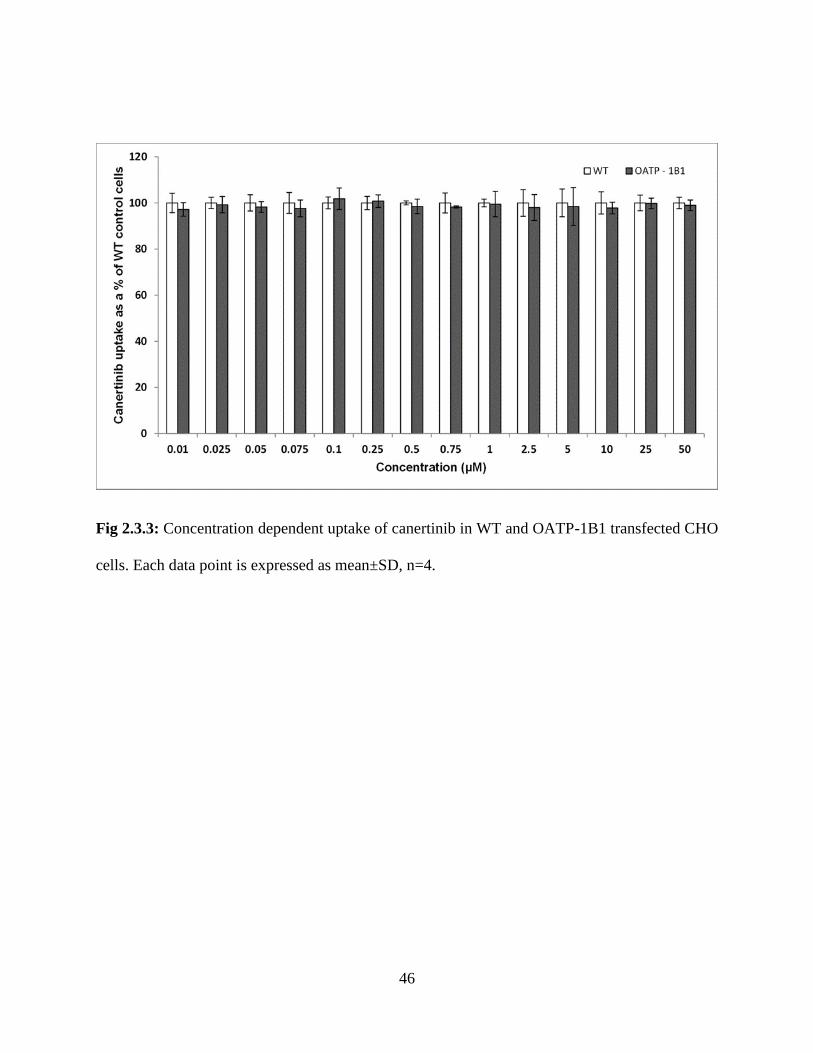
46
Fig 2.3.3: Concentration dependent uptake of canertinib in WT and OATP-1B1 transfected CHO
cells. Each data point is expressed as mean±SD, n=4.

47
Fig 2.3.4: Concentration dependent uptake of pazopanib in WT and OATP-1B1 transfected CHO
cells. Each data point is expressed as mean±SD, n=4.
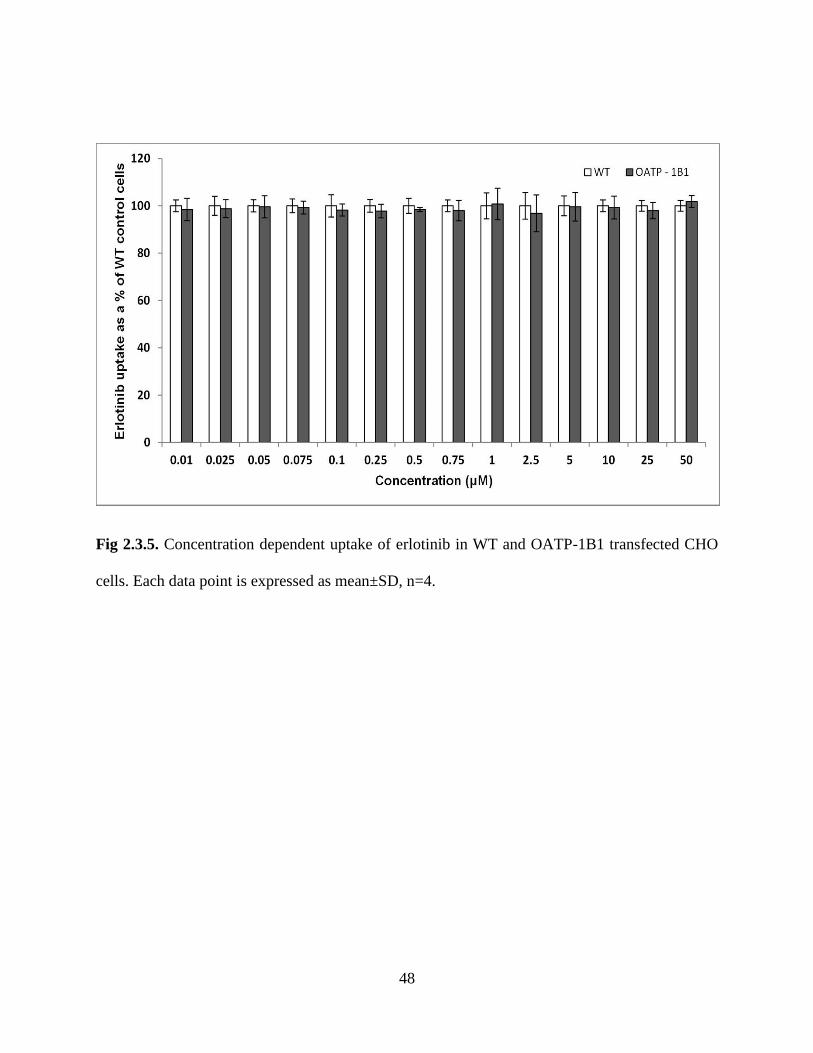
48
Fig 2.3.5. Concentration dependent uptake of erlotinib in WT and OATP-1B1 transfected CHO
cells. Each data point is expressed as mean±SD, n=4.

49
Fig 2.4.1: Concentration dependent uptake of canertinib in OATP-1B3 transfected CHO cells.
OATP-1B3 mediated canertinib transport determined as the difference in uptake in OATP-1B3
and WT CHO cells at each substrate concentration. Each data point is expressed as mean±SD, n=4.
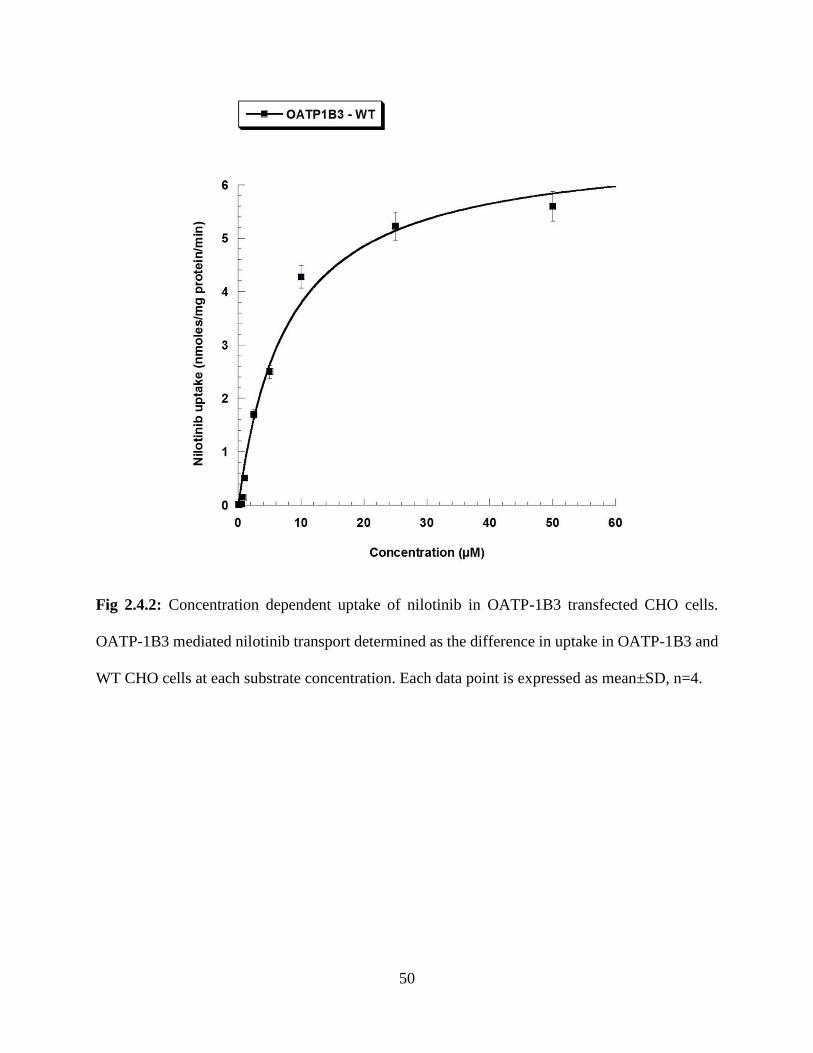
50
Fig 2.4.2: Concentration dependent uptake of nilotinib in OATP-1B3 transfected CHO cells.
OATP-1B3 mediated nilotinib transport determined as the difference in uptake in OATP-1B3 and
WT CHO cells at each substrate concentration. Each data point is expressed as mean±SD, n=4.
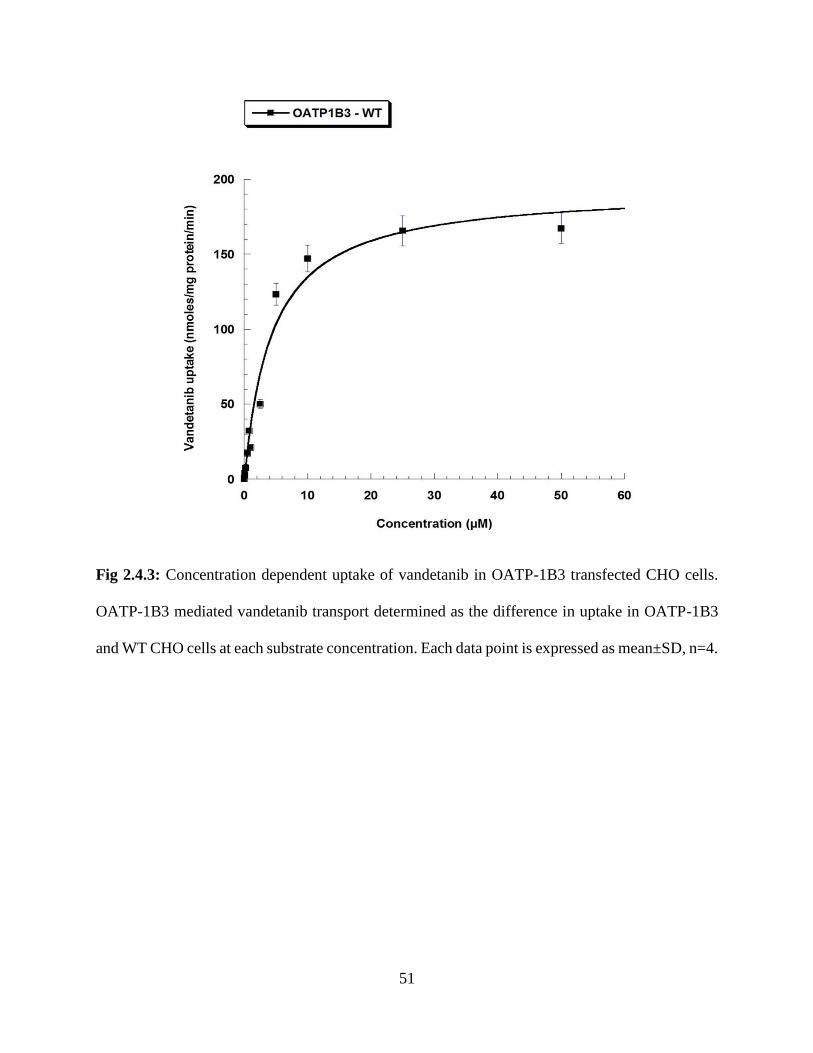
51
Fig 2.4.3: Concentration dependent uptake of vandetanib in OATP-1B3 transfected CHO cells.
OATP-1B3 mediated vandetanib transport determined as the difference in uptake in OATP-1B3
and WT CHO cells at each substrate concentration. Each data point is expressed as mean±SD, n=4.
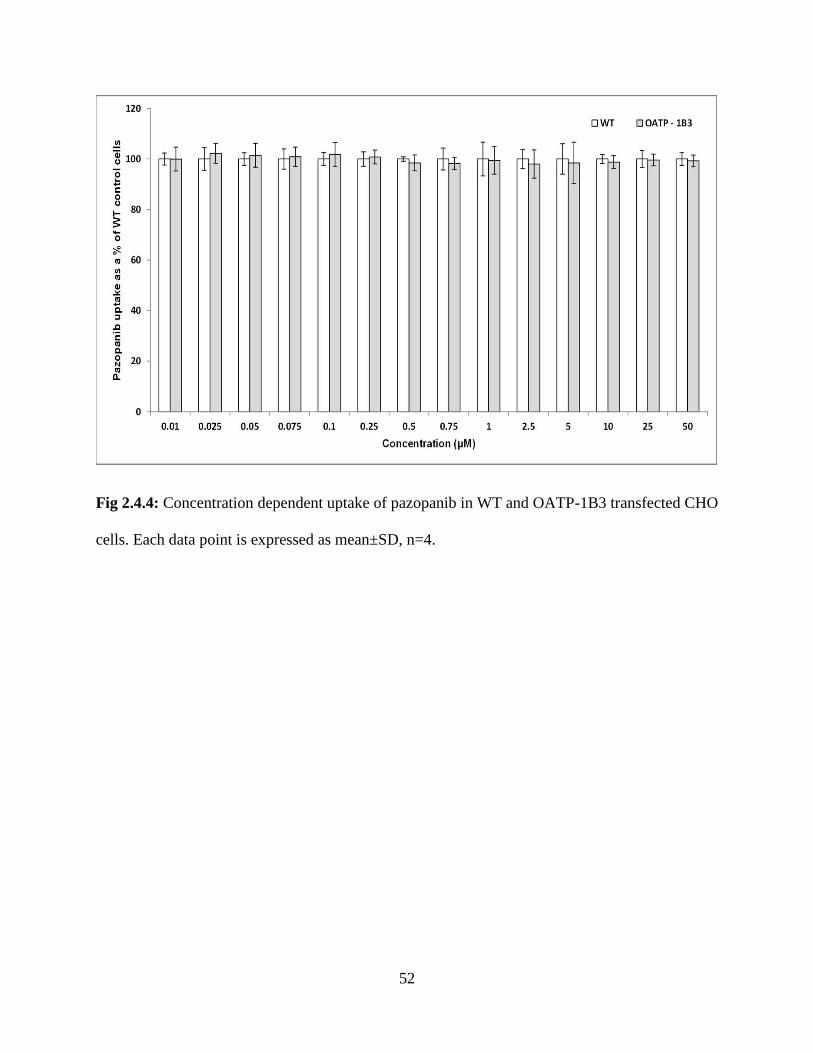
52
Fig 2.4.4: Concentration dependent uptake of pazopanib in WT and OATP-1B3 transfected CHO
cells. Each data point is expressed as mean±SD, n=4.
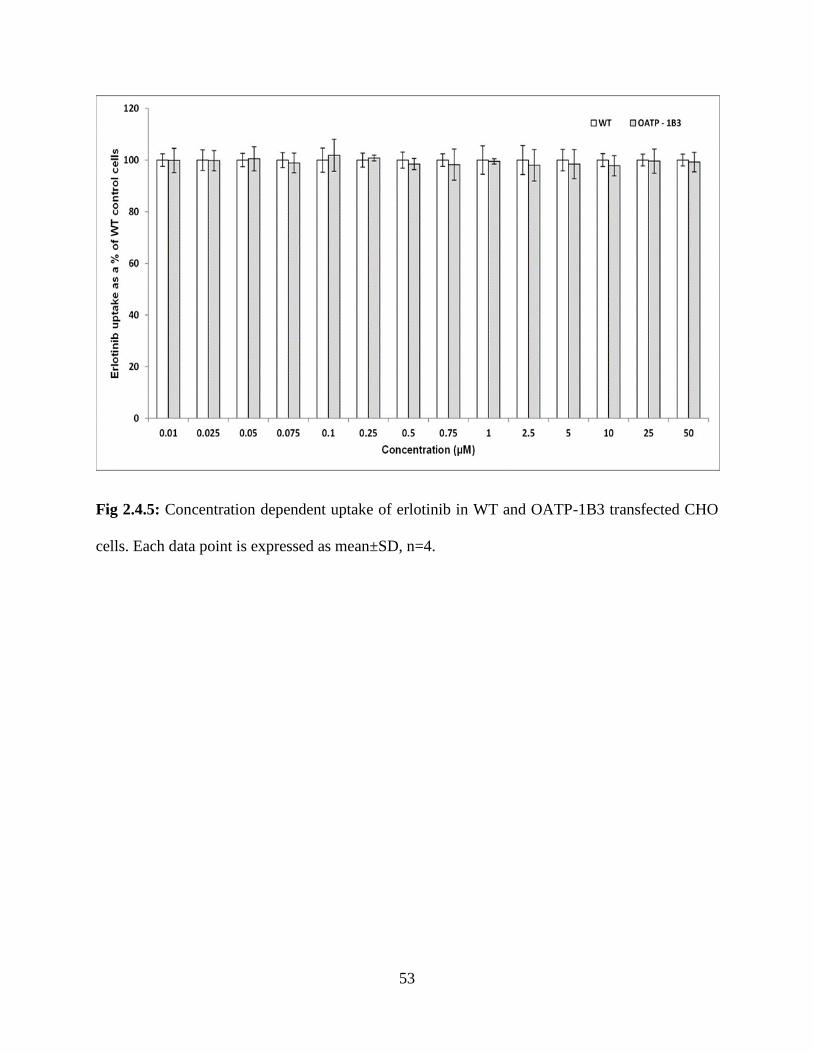
53
Fig 2.4.5: Concentration dependent uptake of erlotinib in WT and OATP-1B3 transfected CHO
cells. Each data point is expressed as mean±SD, n=4.

54
Table 2.1: Michaelis–Menten kinetic parameters (Vmax and Km) and catalytic efficiency (Vmax/Km)
estimated for tested TKIs for OATP-1B1 and/or OATP-1B3 transporter proteins. Units of Km:
micromolar (µM), Vmax: nmoles/mg protein/min and Vmax/Km: ml/mg protein/min
TKIs OATP-1B1 OATP-1B3
Km Vmax Vmax/Km Km Vmax Vmax/Km
Canertinib - - - 12.18 ± 3.32
15.34 ± 1.59 1.25
Nilotinib 10.14 ± 1.91
6.95 ± 0.47 0.68 7.84 ± 1.43 6.75 ± 0.42 0.86
Vandetanib 2.72 ± 0.25 75.95 ± 1.99 27.92 4.37 ± 0.79 193.64 ± 10.58 44.31
Erlotinib - - - - - -
Pazopanib - - - - - -

55
Cytotoxicity Studies
To evaluate the cytotoxic effect of the selected TKIs, a cell proliferation assay was
performed on cell monolayers of WT and transfected CHO cells for a period of 24h. No cytotoxic
effects of pazopanib, erlotinib, canertinib, vandetanib and nilotinib at a concentration of 50µM were
observed with WT and transfected cells in comparison to positive control (Triton X). The findings
from this study clearly demonstrate that the selected TKIs are non-cytotoxic at a concentration of
50µM (Fig 2.5).
Fig 2.5: Cytotoxicity in the presence of TKIs at highest studied concentration (50µM) on CHO-
WT, OATP-1B1 and -1B3 transfected cells. Data represent the mean±SD, n=4.
56
Discussion
In the present study, we investigated the role of OATP family transporters in the hepatic
uptake process of TKIs. This work also estimated the contribution of OATP-1B1 and -1B3 in
hepatocellular accumulation of TKIs with in vitro model based systems. For uptake transporter
analysis, we utilized CHO cells, WT as well as transfected with specifically expressing OATP
transport protein. CHO cells were originally selected for the transfection because of the lack of
expression of these family of proteins in the parent cell line resulting in minimal background
activity. Also, these cells can be maintained in culture for sustained periods and can be ready for
use in a specific experiment within few days. Our findings are in partial agreement with the study
done by Zimmerman et al.[148], where the authors reported the uptake of nilotinib (only at 0.1µM)
in HEK293 cells expressing OATP-1B1 and -1B3 and uptake of vandetanib (only at 0.1µM) via
OATP-1B3 transporter. Similar results were observed in the in vitro cellular accumulation studies
performed, demonstrating the uptake of nilotinib and vandetanib via OATP-1B1 and -1B3
transporter proteins. Zimmermann et al. [148] also reported the uptake of pazopanib in cells
expressing OATP-1B1 and -1B3 at a concentration of 0.1µM and no statistically significant uptake
of vandetanib (0.1µM) in cells expressing OATP-1B1 transporter protein. Conversely, our findings
demonstrate that there is no active involvement of OATP-1B1 and -1B3 in intracellular
accumulation of pazopanib while uptake of vandetanib in hepatic tissue is mediated via OATP-
1B1 and -1B3. These contrasting results suggests that utilization of different concentration of TKIs
and in vitro model based systems may affect the cellular accumulation of TKIs via OATP and can
lead to misinterpretation of the role of OATPs in cellular accumulation of TKIs. The current
concentrations used in this manuscript (0.25 and 0.5 µM) were selected based on previously
published results for in vitro uptake studies of TKIs and their toxicity for CHO cells. The

57
concentration ranges used were close to clinically observed Cmax values but may not exactly mimic
tissue concentration in clinic. These studies act as a proof of concept but further studies may be
needed to make the data more clinically relevant.
It has been already reported that the tyrosine kinase inhibitors are substrate of efflux
transporter proteins such as P-gp, MRPs and BCRP [152, 153, 163-166]. These efflux transporters
are also expressed in the bile canalicular membrane and are responsible for excretion of drug and
their metabolites from blood into bile. The membrane transporters (OATPs) along with efflux
transporters and metabolizing enzymes play a vital role in hepatic disposition of drugs. Seithel et
al. reported that coadministration of pravastatin together with macrolides (clarithromycin and
roxithromycin) results in increased plasma concentration of pravastatin. It is a substrate for OATP-
1B1, -1B3 and CYP3A4 whereas clarithromycin and roxithromycin are inhibitors of OATP-1B1,
-1B3 and CYP3A4. Since pravastatin is not extensively metabolized and is excreted almost
unchanged into bile and urine, this DDI studies suggests the major involvement of hepatic uptake
transporters than metabolizing enzymes for macrolide-induced altered plasma concentration of
pravastatin [167]. Similarly, Backman et al. demonstrated that co-administration of cerivastatin
and simvastatin (OATP-1B1 and CYP2C8 substrate) together with gemifibrozil resulted in a 6-
fold rise in the cerivastatin and simvastatin exposure. Such increase in plasma concentration of
cerivastatin and simvastatin was due to the inhibitory potency of gemifibrozil on OATP-1B1 [168,
169]. Uptake of drugs mediated via OATP can be considered as an important additional
mechanism essential for DDIs [170]. Unlike statins, information on the role of hepatic uptake
transporters (OATP-1B1 and -1B3) for TKIs is very sparse. Thus, it is of utmost importance to
understand the role of OATPs in hepatocellular accumulation of TKIs. The results obtained from
in vitro cellular accumulation studies, suggests for the very first time the involvement of OATP-
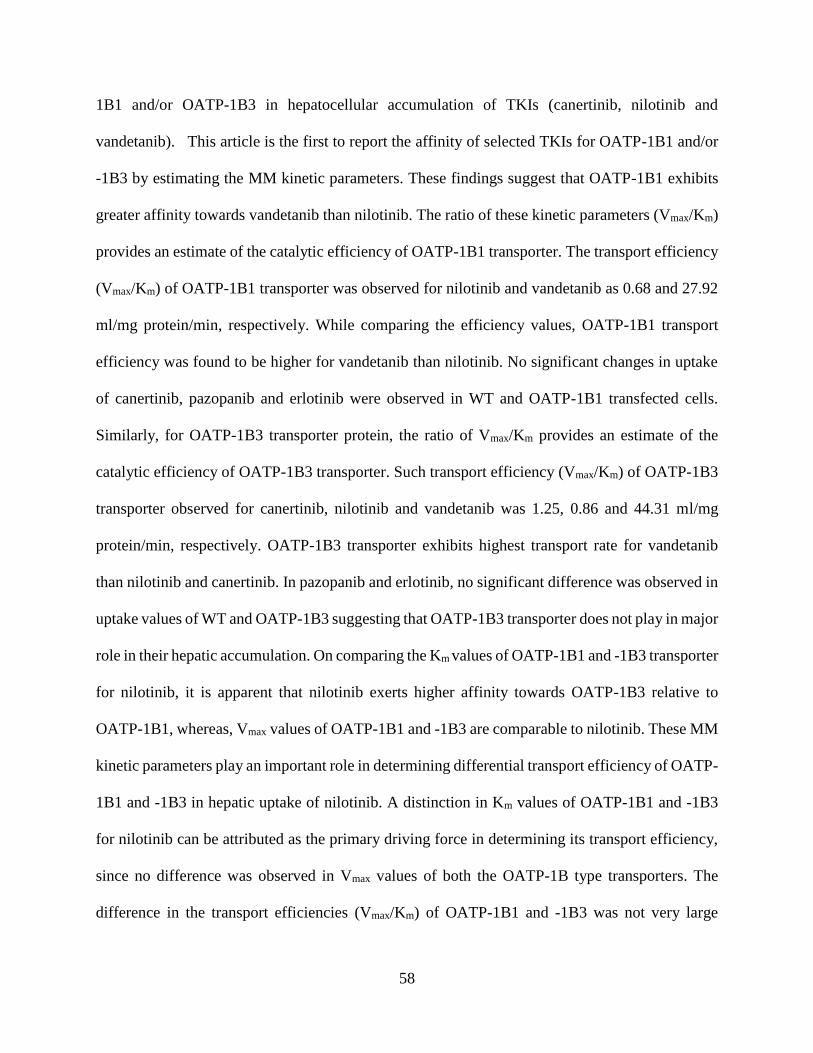
58
1B1 and/or OATP-1B3 in hepatocellular accumulation of TKIs (canertinib, nilotinib and
vandetanib). This article is the first to report the affinity of selected TKIs for OATP-1B1 and/or
-1B3 by estimating the MM kinetic parameters. These findings suggest that OATP-1B1 exhibits
greater affinity towards vandetanib than nilotinib. The ratio of these kinetic parameters (Vmax/Km)
provides an estimate of the catalytic efficiency of OATP-1B1 transporter. The transport efficiency
(Vmax/Km) of OATP-1B1 transporter was observed for nilotinib and vandetanib as 0.68 and 27.92
ml/mg protein/min, respectively. While comparing the efficiency values, OATP-1B1 transport
efficiency was found to be higher for vandetanib than nilotinib. No significant changes in uptake
of canertinib, pazopanib and erlotinib were observed in WT and OATP-1B1 transfected cells.
Similarly, for OATP-1B3 transporter protein, the ratio of Vmax/Km provides an estimate of the
catalytic efficiency of OATP-1B3 transporter. Such transport efficiency (Vmax/Km) of OATP-1B3
transporter observed for canertinib, nilotinib and vandetanib was 1.25, 0.86 and 44.31 ml/mg
protein/min, respectively. OATP-1B3 transporter exhibits highest transport rate for vandetanib
than nilotinib and canertinib. In pazopanib and erlotinib, no significant difference was observed in
uptake values of WT and OATP-1B3 suggesting that OATP-1B3 transporter does not play in major
role in their hepatic accumulation. On comparing the Km values of OATP-1B1 and -1B3 transporter
for nilotinib, it is apparent that nilotinib exerts higher affinity towards OATP-1B3 relative to
OATP-1B1, whereas, Vmax values of OATP-1B1 and -1B3 are comparable to nilotinib. These MM
kinetic parameters play an important role in determining differential transport efficiency of OATP-
1B1 and -1B3 in hepatic uptake of nilotinib. A distinction in Km values of OATP-1B1 and -1B3
for nilotinib can be attributed as the primary driving force in determining its transport efficiency,
since no difference was observed in Vmax values of both the OATP-1B type transporters. The
difference in the transport efficiencies (Vmax/Km) of OATP-1B1 and -1B3 was not very large
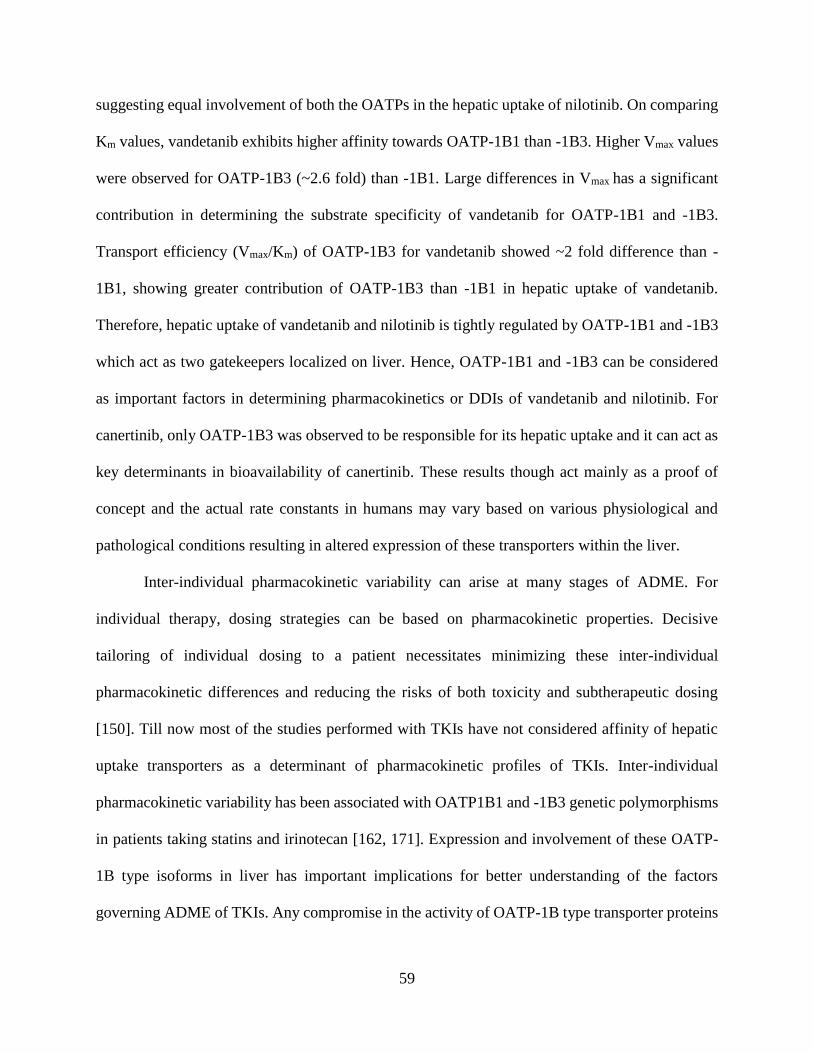
59
suggesting equal involvement of both the OATPs in the hepatic uptake of nilotinib. On comparing
Km values, vandetanib exhibits higher affinity towards OATP-1B1 than -1B3. Higher Vmax values
were observed for OATP-1B3 (~2.6 fold) than -1B1. Large differences in Vmax has a significant
contribution in determining the substrate specificity of vandetanib for OATP-1B1 and -1B3.
Transport efficiency (Vmax/Km) of OATP-1B3 for vandetanib showed ~2 fold difference than -
1B1, showing greater contribution of OATP-1B3 than -1B1 in hepatic uptake of vandetanib.
Therefore, hepatic uptake of vandetanib and nilotinib is tightly regulated by OATP-1B1 and -1B3
which act as two gatekeepers localized on liver. Hence, OATP-1B1 and -1B3 can be considered
as important factors in determining pharmacokinetics or DDIs of vandetanib and nilotinib. For
canertinib, only OATP-1B3 was observed to be responsible for its hepatic uptake and it can act as
key determinants in bioavailability of canertinib. These results though act mainly as a proof of
concept and the actual rate constants in humans may vary based on various physiological and
pathological conditions resulting in altered expression of these transporters within the liver.
Inter-individual pharmacokinetic variability can arise at many stages of ADME. For
individual therapy, dosing strategies can be based on pharmacokinetic properties. Decisive
tailoring of individual dosing to a patient necessitates minimizing these inter-individual
pharmacokinetic differences and reducing the risks of both toxicity and subtherapeutic dosing
[150]. Till now most of the studies performed with TKIs have not considered affinity of hepatic
uptake transporters as a determinant of pharmacokinetic profiles of TKIs. Inter-individual
pharmacokinetic variability has been associated with OATP1B1 and -1B3 genetic polymorphisms
in patients taking statins and irinotecan [162, 171]. Expression and involvement of these OATP-
1B type isoforms in liver has important implications for better understanding of the factors
governing ADME of TKIs. Any compromise in the activity of OATP-1B type transporter proteins
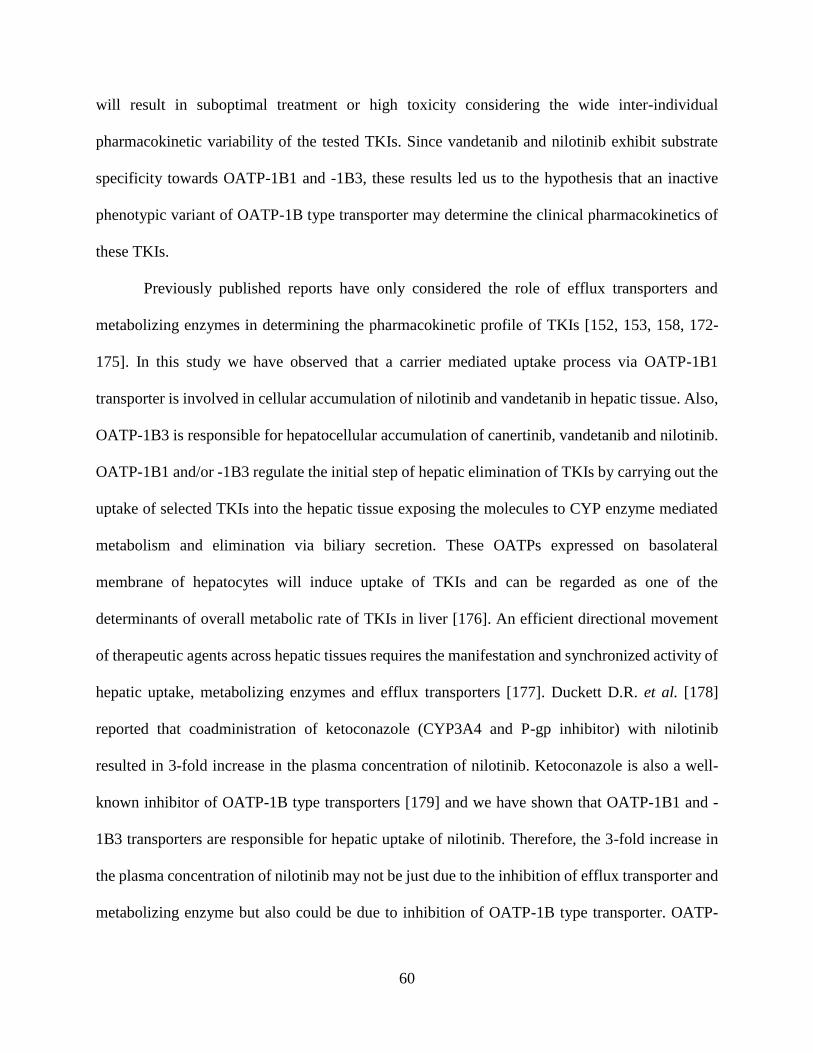
60
will result in suboptimal treatment or high toxicity considering the wide inter-individual
pharmacokinetic variability of the tested TKIs. Since vandetanib and nilotinib exhibit substrate
specificity towards OATP-1B1 and -1B3, these results led us to the hypothesis that an inactive
phenotypic variant of OATP-1B type transporter may determine the clinical pharmacokinetics of
these TKIs.
Previously published reports have only considered the role of efflux transporters and
metabolizing enzymes in determining the pharmacokinetic profile of TKIs [152, 153, 158, 172-
175]. In this study we have observed that a carrier mediated uptake process via OATP-1B1
transporter is involved in cellular accumulation of nilotinib and vandetanib in hepatic tissue. Also,
OATP-1B3 is responsible for hepatocellular accumulation of canertinib, vandetanib and nilotinib.
OATP-1B1 and/or -1B3 regulate the initial step of hepatic elimination of TKIs by carrying out the
uptake of selected TKIs into the hepatic tissue exposing the molecules to CYP enzyme mediated
metabolism and elimination via biliary secretion. These OATPs expressed on basolateral
membrane of hepatocytes will induce uptake of TKIs and can be regarded as one of the
determinants of overall metabolic rate of TKIs in liver [176]. An efficient directional movement
of therapeutic agents across hepatic tissues requires the manifestation and synchronized activity of
hepatic uptake, metabolizing enzymes and efflux transporters [177]. Duckett D.R. et al. [178]
reported that coadministration of ketoconazole (CYP3A4 and P-gp inhibitor) with nilotinib
resulted in 3-fold increase in the plasma concentration of nilotinib. Ketoconazole is also a well-
known inhibitor of OATP-1B type transporters [179] and we have shown that OATP-1B1 and -
1B3 transporters are responsible for hepatic uptake of nilotinib. Therefore, the 3-fold increase in
the plasma concentration of nilotinib may not be just due to the inhibition of efflux transporter and
metabolizing enzyme but also could be due to inhibition of OATP-1B type transporter. OATP-

61
1B1 and -1B3 transporters also play a vital role in hepatic uptake of nilotinib making it vulnerable
to metabolism by CYP3A4 and ultimately causing its elimination by biliary secretion via P-gp.
Since a major fraction of nilotinib is eliminated into feces in unchanged form suggesting that the
transmembrane localization of nilotinib by OATPs in liver has a major impact on its
pharmacokinetics than metabolization. Similarly, Minocha et al. reported that the coadministration
vandetanib and everolimus resulted in increased plasma concentration of vandetanib. Everolimus
increases plasma concentration of vandetanib by inhibiting efflux transporters (P-gp and BCRP)
which are also localized on the bile canalicular membrane. Everolimus is also a well-known
inhibitor for OATP-1B1 and -1B3 transporters which are responsible for hepatocellular
accumulation of therapeutic agents. In this article we have reported the involvement of OATP-1B1
and -1B3 in hepatic uptake of vandetanib. Taken together, it is reasonable to assume that elevation
in plasma concentration of vandetanib is not only due to the inhibition of P-gp and BCRP but also
due to inhibition of OATP-1B1 and -1B3 by everolimus. Complex interplay of OATPs (localized
on basloateral membrane of hepatic tissues) and efflux transporters (expressed on bile canalicular
membrane) may be responsible for the hepatobiliary excretion of TKIs. Inhibition of TKIs uptake
via hepatic OATPs by coadministration of drugs that are also substrate or inhibitor of these hepatic
uptake transporters is a plausible explanation of several in vivo observed DDIs. Inhibition of
metabolizing enzymes and/or efflux transporter could not be the only cause of the experimental
effects. Drug induced alteration of OATP-1B1 and -1B3 transporter function is, therefore, an
essential auxiliary mechanism underlying DDIs [170].
OATPs mediated DDIs have the potential to completely influence drug efficacy and
toxicity. Therefore, coadministration of canertinib, vandetanib and nilotinib (OATP-1B1 and/or -
1B3 substrates) along with other hepatic OATP substrates/inhibitors (paclitaxel, cyclosporine,

62
protease inhibitors, rifampicin, statins, telmisartan, valsartan, mTOR inhibitors, antibiotics etc.)
may result in altered pharmacokinetics and pharmacodynamics of TKIs. On the other hand,
induction of the expression of hepatic OATPs can also result in increased detoxification and
elimination of numerous OATP-1B1 and -1B3 substrates from the body [158, 180-182].
Pharmacokinetic profile of TKIs is likely to be modified in subjects with hepatic impairment, since
TKIs are primarily eliminated via hepatic metabolism and biliary excretion. Down-regulation of
OATP-1B type transporter protein in liver disease has been reported by Oswald M et al. and Kietel
V et al. [183, 184]. Also, reduced expression of OATP-1B1 and -1B3 in liver cancer compared to
non-cancerous liver tissues has been reported by various investigators [185-187]. For hepatically
impaired population, dose reduction of nilotinib has been proposed along with recommendation of
lower starting dose and monitoring of any liver function abnormalities [188, 189]. Also, dose of
vandetanib in patients with moderate and severe hepatic impairment has not been recommended
as its safety and efficacy has not been established [188, 189]. In vitro accumulation studies along
with estimation of MM kinetic profiles confirms the role of OATP-1B1 and -1B3 in hepatic uptake
of nilotinib and vandetanib. On the basis of our findings along with already published reports
mentioned above, we can hypothesize that higher plasma concentration of nilotinib or other TKIs
in patients with hepatic impairment can be attributed to compromised/downregulated expression
of OATP-1B1 and -1B3 transporter which can be responsible for any alteration in the
pharmacokinetic profile of nilotinib or other TKIs. Similar findings have been reported by Baker
SD et al., showing the involvement of OATP-1B1 and-1B3 in hepatic elimination of sorafenib and
longer systemic accumulation due to compromised activity of OATP-1B type transporter protein
[148].

63
Conclusion
In conclusion, we have shown OATP-1B1 and OATP-1B3 are responsible for
hepatocellular accumulation of nilotinib and vandetanib whereas only OATP-1B3 is responsible
for the carrier mediated uptake of canertinib in hepatic tissue. These findings delineate the
involvement of OATP-1B1 and/or -1B3 in hepatic uptake of tested TKIs and confirms the affinity
of these hepatic uptake transporters as a determinant of the pharmacokinetic profile of TKIs. Since
co-administration of TKIs with other therapeutic agents is becoming common in multi-drug
therapy, hepatic uptake transporters OATP-1B1 and -1B3 can be regarded as important molecular
targets for potential DDIs. Thus, hepatic uptake mediated by OATP-1B1 and -1B3 for selected
TKIs should be dynamically scrutinized in order to circumvent DDIs. These transporters in
conjunction with the efflux proteins may eventually decide on the overall flux of the TKIs within
the hepatic tissue. These studies act as a proof of concept substantiating the need for further clinical
studies investigating the OATP based DDI potential of TKIs. Further in vivo studies are required
for better understanding of the contribution of OATP-1B1 and/or -1B3 transporter proteins in the
hepatic disposition of TKIs and for predicting any adverse drug reactions associated with DDIs
[190].
Acknowledgement
This work was supported by National Institutes of Health grant 1R01 AI071199. The
authors highly appreciate Dr. Bruno Stieger for their generous gift of CHO-WT and OATP-1B
type transporter protein transfected cell lines.

64
CHAPTER 3
INHIBITION OF OATP-1B1 AND OATP-1B3 BY TYROSINE KINASE INHIBITORS
Rationale
Role of membrane transporters in drug disposition, safety and efficacy i.e., particularly
concerning drug-drug interactions (DDIs) has been extensively investigated [191]. Giacomini KM
et al recently emphasized drug development information on in vitro studies of drug-transporter
interactions can be extrapolated to clinical studies of transporter based DDIs. Such transporter
mediated DDIs can occur by (i) inhibition of membrane transporter resulting in potential DDI,
and/or (ii) interacting drug may be a substrate for the transporter. Attention has been drawn towards
various approaches and algorithms for predicting transporter mediated DDIs. In vitro and
preclinical transport studies are pre-requisites for drug development. Recent progress in clinical
translation of these results may impact on regulatory matters for delineation of transport mediated
DDIs [122]. In order to predict whether a potential DDI may occur, in vitro studies were performed
to compare concentration of an inhibitor (I, the maximum unbound plasma concentration) and it’s
half maximal inhibitory concentration (IC50) for a transporter. Lower IC50 of the drug relative to it
unbound plasma concentration is a strong indicator of a potential clinical DDIs. An I/IC50 value ≥
0.1 has been advocated as a measure to evaluate clinical transporter-based DDIs [122].
Tyrosine kinase inhibitors (TKIs) are the new class of anticancer drugs that specifically
targets tyrosine kinases which are fused, mutated and over expressed in cancer [191, 192]. Many
of these compounds have been associated with low patient response along with unwanted toxicity,
which is unexpected and also largely unexplained. Even though TKIs offer theoretical advantages
(selectively target/kill the cancer precursor cells and protect normal tissues) over traditional anti-

65
cancer agents, these agents are still associated with unpredictable toxicity [150, 157]. Many TKIs
exhibit limited efficacy with a high degree of unexpected and unexplained toxicity [151]. Most
common side effects associated with TKIs are diarrhea, hypertension, nausea, anorexia and
vomiting. The most common treatment-emergent laboratory abnormalities noticed were elevation
of total bilirubin, liver transaminases and alanine aminotransferases. Hepatotoxicity is the most
frequently reported toxicity among the TKIs with mandatory black box warnings [193]. There is a
possibility that treatment associated elevation in liver enzymes with TKIs reveal over-lapping on-
target and off-target class effects, however, exact mechanism needs to be clarified [191, 194, 195].
These hepatic abnormalities associated with TKIs may lead to treatment interruption,
compromising the potential treatment benefit to the patient. A clear understanding of the exact
mechanism responsible for hepatic abnormalities, will give a better chance to interpret and manage
these adverse effects which will ultimately benefit patients from continued chemotherapeutic
treatment [194].
Despite their frequent use as a chemotherapeutic agent, limited studies have been
performed to examine the interactions of these TKIs with hepatic uptake transporters such as
organic anion transporting polypeptide (OATP) transporters. Most studies examining interaction
of TKIs with these transporters have focused on substrate specificity instead of inhibition
interactions [153, 157, 172, 191, 196, 197]. Also, several TKIs have higher molecular weight,
polar surface area and lipophilicity, which are essential for OATP inhibition and therefore have
potential to inhibit OATPs including OATP-1B1 and OATP-1B3 [198]. Several in vitro and in
vivo studies have indicated that drugs inhibiting these OATPs are responsible for clinically relevant
drug-drug interactions. In such cases, inhibition of OATPs can lead to unexpected toxicity, causing
marked increase in plasma concentration and area under the plasma concentration time curve

66
(AUC) for compounds which are substrates of these hepatic transporters. DDIs caused by the
inhibition of these transporters represent a large number of drugs which act as substrate or inhibitor
of OATP-1B1 and/or -1B3 [199]. Hence, it is of utmost importance to estimate the inhibitory
potential of TKIs on OATP-1B1 and -1B3. In the present study, we have evaluated the interaction
of TKIs (pazopanib, erlotinib, canertinib, nilotinib and vandetanib) with human OATPs expressed
on sinusoidal membrane of liver by employing in vitro model system with transfected Chinese
hamster ovary (CHO) cells. In vitro studies were designed to compare the inhibitory potential of
TKIs on the transport of [3H] estrone sulfate (substrate for OATP-1B1) and cholecystokinin
octapeptide (CCK-8, substrate for OATP-1B3) in OATP-1B1 and -1B3 transfected CHO cells.
Materials And Methods
Chemicals
Pazopanib, erlotinib, canertinib, nilotinib and vandetanib were purchased from LC
Laboratories (Woburn, MA). Rifampicin was purchased from TCI America, PA. [3H] Estrone
sulfate ([3H] ES, specific activity 40-60 Ci/mmol) and [3H] cholecystokinin octapeptide ([3H]
CCK-8, specific activity 60-100 Ci/mmol) was procured from Perkin Elmer (Boston, MA, USA).
All other chemicals used were of high performance liquid chromatography grade and were
obtained from either Sigma Aldrich or Fisher Scientific. Cell culture medium and other ingredients
were purchased from Life Sciences. Fetal bovine serum was received from Atlanta Biologicals.
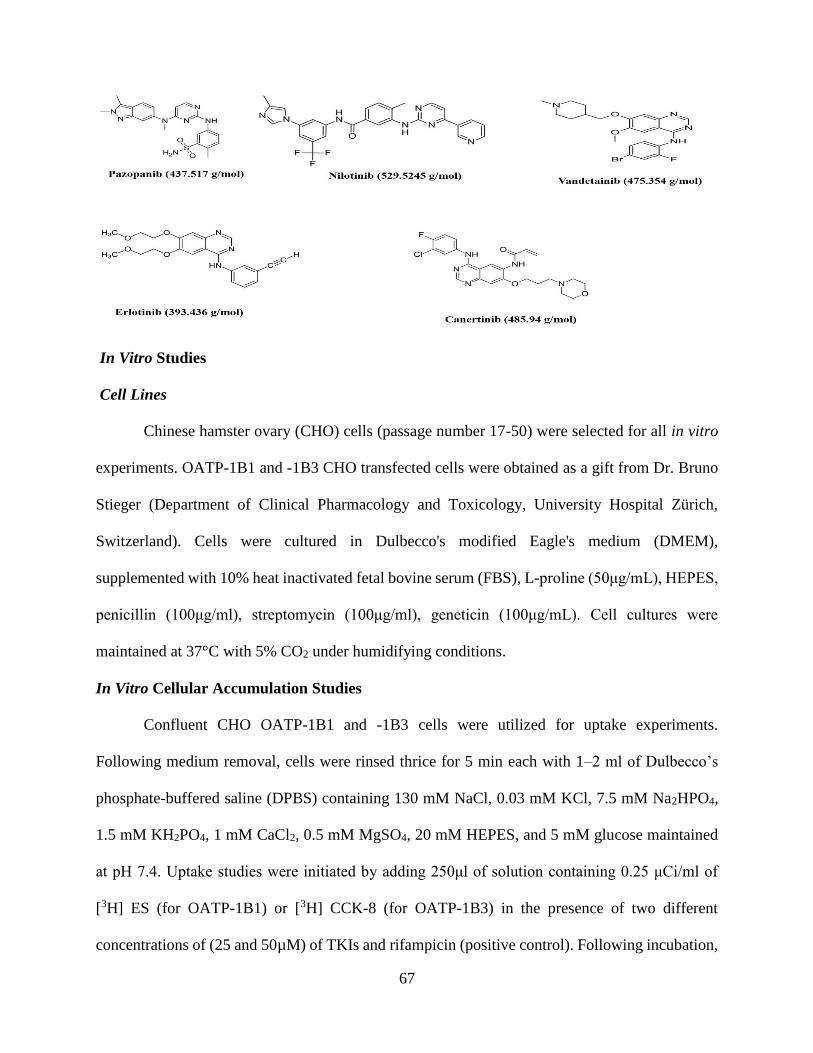
67
In Vitro Studies
Cell Lines
Chinese hamster ovary (CHO) cells (passage number 17-50) were selected for all in vitro
experiments. OATP-1B1 and -1B3 CHO transfected cells were obtained as a gift from Dr. Bruno
Stieger (Department of Clinical Pharmacology and Toxicology, University Hospital Zürich,
Switzerland). Cells were cultured in Dulbecco's modified Eagle's medium (DMEM),
supplemented with 10% heat inactivated fetal bovine serum (FBS), L-proline (50μg/mL), HEPES,
penicillin (100μg/ml), streptomycin (100μg/ml), geneticin (100μg/mL). Cell cultures were
maintained at 37°C with 5% CO2 under humidifying conditions.
In Vitro Cellular Accumulation Studies
Confluent CHO OATP-1B1 and -1B3 cells were utilized for uptake experiments.
Following medium removal, cells were rinsed thrice for 5 min each with 1–2 ml of Dulbecco’s
phosphate-buffered saline (DPBS) containing 130 mM NaCl, 0.03 mM KCl, 7.5 mM Na2HPO4,
1.5 mM KH2PO4, 1 mM CaCl2, 0.5 mM MgSO4, 20 mM HEPES, and 5 mM glucose maintained
at pH 7.4. Uptake studies were initiated by adding 250μl of solution containing 0.25 μCi/ml of
[3H] ES (for OATP-1B1) or [3H] CCK-8 (for OATP-1B3) in the presence of two different
concentrations of (25 and 50µM) of TKIs and rifampicin (positive control). Following incubation,
68
the solution was removed and uptake was terminated with 2 ml of ice-cold stop solution containing
200 mM KCl and 2 mM HEPES. The cell monolayer was washed thrice, 5 min each and 1ml of
lysis buffer (0.1% Triton-X solution in 0.3% NaOH) was added to each well and plates were stored
overnight at room temperature. Subsequently, cell lysate (400μl) from each well was transferred
to scintillation vials containing 3 ml of scintillation cocktail (Universal ES from MP Biomedicals).
Samples were analyzed by measuring the radioactivity in a liquid scintillation counter (Beckman
Instruments Inc., Fullerton, CA, USA, model LS-6500). Protein content of each sample was
estimated by BioRad Protein Estimation Kit (BioRad Protein Estimation Kit, Hercules, CA, USA).
Estimation Of Half Maximal Inhibitory Concentration (IC50)
To determine the half maximal inhibitory concentration (IC50) of TKIs for the differential
uptake of OATP-1B1 and -1B3 transporter proteins, intracellular accumulation of the probe
substrates (ES and CCK-8) in the presence of increasing concentrations (0.1-100µm) of TKIs was
measured. Using a concentrated stock solution of the TKIs, several working concentrations were
prepared ranging from (0.1μM - 100μM) in fresh DPBS buffer spiked with [3H] ES (0.25μCi/ml)
or [3H] CCK-8 (0.25μCi/ml). Uptake was carried out at different concentration of TKIs in OATP-
1B1 and -1B3 transfected CHO cells. The data was fitted to equation as shown in section 2.3 and
the IC50 values were calculated according to nonlinear least squares regression analysis program;
GraphPad Prism version 5.
Data Analysis
IC50 values of TKIs on intracellular accumulation of the probe substrates uptake via hepatic
OATP-1B1 and -1B3 were calculated with a nonlinear least squares regression analysis program
GraphPad Prism version 5. The data was plotted and fitted to (Eq.1) and the half maximal
inhibitory concentration (IC50) were calculated.
69
𝒀 = 𝒎𝒊𝒏 +𝒎𝒂𝒙 − 𝒎𝒊𝒏
𝟏 + 𝟏𝟎(𝑳𝒐𝒈𝑰𝑪𝟓𝟎−𝒙)∗𝑯 𝐄𝐪. 𝟏
x denotes the log conc. of the inhibitors, Y is the cellular accumulation of the probe substrate (ES
or CCK-8), IC50 represents the TKIs conc. where the influx of the substrate is inhibited by 50%
and H is the Hill constant. Y starts at a min value and then plateaus at a max value resulting in a
sigmoidal plot.
Cytotoxicity Studies
Cell Titer 96® Aqueous Non-Radioactive Cell Proliferation Assay Kit (Promega, Madison,
WI) was employed to carry out cytotoxicity assay. OATP-1B1 and -1B3 transfected CHO cells
were cultured in 96-well plate. Sterile drug solutions of highest concentration (100µM) of TKIs
are prepared in the culture medium using 0.22µm nylon sterile membrane filters. Aliquots of TKIs
having a volume of 100µL (previously made in culture medium) were added to each well and
incubated for 24h. Cell proliferation in the presence of TKIs was measured and compared with a
negative control (medium without TKIs) and a positive control (Triton X). Twenty microliters of
dye solution was added to each well after 24h of incubation with TKIs. Cells were then incubated
for 4h in order to complete the reaction with dye. UV absorbance of purple formazan product was
measured at a wavelength of 590nm with a 96-well micro titer plate reader (SpectraFluor Plus,
Tecan, Maennedorf, Switzerland). Toxicity of TKIs in OATP-1B type transfected CHO cells was
estimated by the amount of formazan formed, which is directly proportional to viable cells.
Statistical Analysis
All the experiments were conducted at least in quadruplicate (n=4) and the outcomes were
expressed as mean±standard deviation (SD). To calculate statistical significance, student’s t-test
was performed. Any difference between mean values is considered statistically significant for P
value ≤0.05.
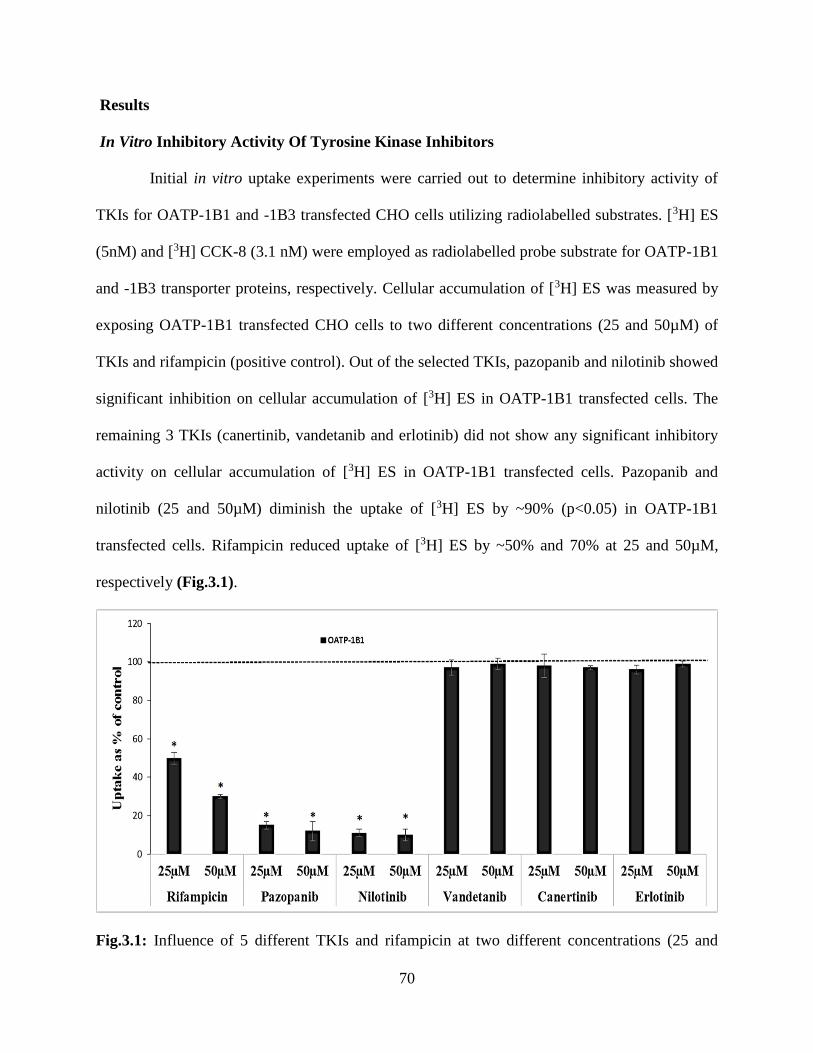
70
Results
In Vitro Inhibitory Activity Of Tyrosine Kinase Inhibitors
Initial in vitro uptake experiments were carried out to determine inhibitory activity of
TKIs for OATP-1B1 and -1B3 transfected CHO cells utilizing radiolabelled substrates. [3H] ES
(5nM) and [3H] CCK-8 (3.1 nM) were employed as radiolabelled probe substrate for OATP-1B1
and -1B3 transporter proteins, respectively. Cellular accumulation of [3H] ES was measured by
exposing OATP-1B1 transfected CHO cells to two different concentrations (25 and 50µM) of
TKIs and rifampicin (positive control). Out of the selected TKIs, pazopanib and nilotinib showed
significant inhibition on cellular accumulation of [3H] ES in OATP-1B1 transfected cells. The
remaining 3 TKIs (canertinib, vandetanib and erlotinib) did not show any significant inhibitory
activity on cellular accumulation of [3H] ES in OATP-1B1 transfected cells. Pazopanib and
nilotinib (25 and 50µM) diminish the uptake of [3H] ES by ~90% (p<0.05) in OATP-1B1
transfected cells. Rifampicin reduced uptake of [3H] ES by ~50% and 70% at 25 and 50µM,
respectively (Fig.3.1).
Fig.3.1: Influence of 5 different TKIs and rifampicin at two different concentrations (25 and
71
50µM) on the activity of OATP-1B1, expressed in CHO cells, as determined by the intracellular
accumulation of [3H] estrone sulfate ([3H] ES, 10 min incubation). Data are shown as mean±S.D.
n=4. S.D. means standard derivation. (*p<0.05)
It has been reported previously that OATP-1B3 shares 80% amino acid homolog with
OATP-1B1. Also, both the OATP isoforms share multiple overlapping substrates, such as
rifampicin pravastatin, pitvastatin and docetaxel [158, 159]. In this study, we have also determined
the inhibitory activity of TKIs and rifampicin (positive control) at two different concentrations (25
and 50µM) on cellular accumulation of [3H] CCK-8 in OATP-1B3 transfected cells. Only
vandetanib showed significant inhibition on cellular accumulation of [3H] CCK-8 in OATP-1B3
transfected cells. Pazopanib, nilotinib, canertinib and erlotinib at both concentrations did not
showed any significant effect on the cellular accumulation of [3H] CCK-8 in OATP-1B3
transfected cells. Reduced uptake of [3H] CCK-8 was aslo observed in the presence of rifampicin
in OATP-1B3 transfected cells. Uptake of [3H] CCK-8 in OATP-1B3 transfected cells was reduced
to ~10% to 20% and ~5% to 10% in the presence of vandetanib and rifampicin (25 and 50µM),
respectively (Fig.3.2). Pazopanib and nilotinib showed inhibitory activity towards OATP-1B1
while vandetanib only indicated inhibitory potential towards OATP-1B3.
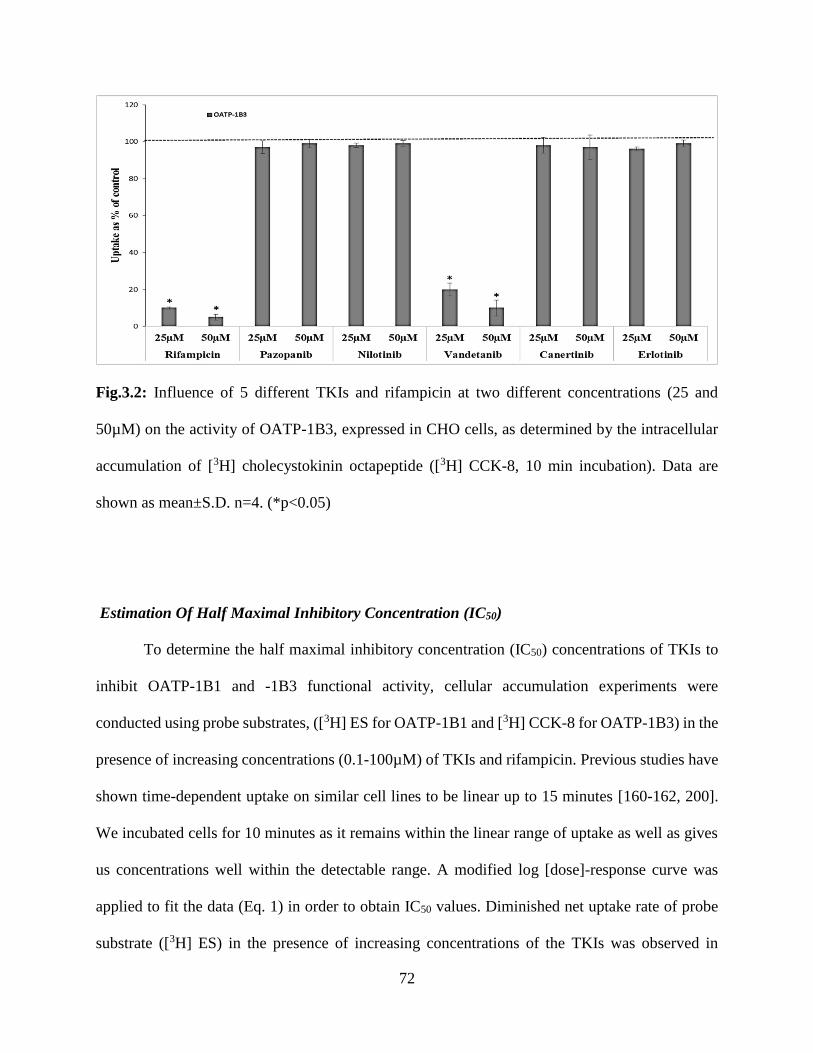
72
Fig.3.2: Influence of 5 different TKIs and rifampicin at two different concentrations (25 and
50µM) on the activity of OATP-1B3, expressed in CHO cells, as determined by the intracellular
accumulation of [3H] cholecystokinin octapeptide ([3H] CCK-8, 10 min incubation). Data are
shown as mean±S.D. n=4. (*p<0.05)
Estimation Of Half Maximal Inhibitory Concentration (IC50)
To determine the half maximal inhibitory concentration (IC50) concentrations of TKIs to
inhibit OATP-1B1 and -1B3 functional activity, cellular accumulation experiments were
conducted using probe substrates, ([3H] ES for OATP-1B1 and [3H] CCK-8 for OATP-1B3) in the
presence of increasing concentrations (0.1-100µM) of TKIs and rifampicin. Previous studies have
shown time-dependent uptake on similar cell lines to be linear up to 15 minutes [160-162, 200].
We incubated cells for 10 minutes as it remains within the linear range of uptake as well as gives
us concentrations well within the detectable range. A modified log [dose]-response curve was
applied to fit the data (Eq. 1) in order to obtain IC50 values. Diminished net uptake rate of probe
substrate ([3H] ES) in the presence of increasing concentrations of the TKIs was observed in
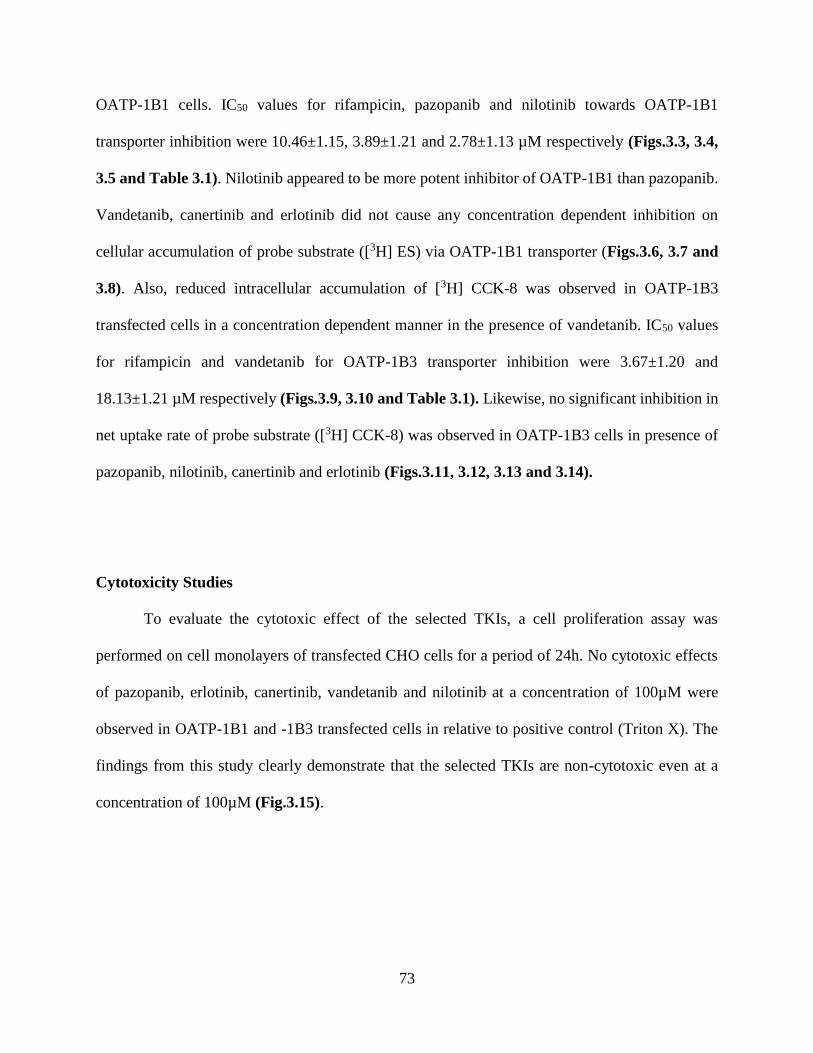
73
OATP-1B1 cells. IC50 values for rifampicin, pazopanib and nilotinib towards OATP-1B1
transporter inhibition were 10.46±1.15, 3.89±1.21 and 2.78±1.13 µM respectively (Figs.3.3, 3.4,
3.5 and Table 3.1). Nilotinib appeared to be more potent inhibitor of OATP-1B1 than pazopanib.
Vandetanib, canertinib and erlotinib did not cause any concentration dependent inhibition on
cellular accumulation of probe substrate ([3H] ES) via OATP-1B1 transporter (Figs.3.6, 3.7 and
3.8). Also, reduced intracellular accumulation of [3H] CCK-8 was observed in OATP-1B3
transfected cells in a concentration dependent manner in the presence of vandetanib. IC50 values
for rifampicin and vandetanib for OATP-1B3 transporter inhibition were 3.67±1.20 and
18.13±1.21 µM respectively (Figs.3.9, 3.10 and Table 3.1). Likewise, no significant inhibition in
net uptake rate of probe substrate ([3H] CCK-8) was observed in OATP-1B3 cells in presence of
pazopanib, nilotinib, canertinib and erlotinib (Figs.3.11, 3.12, 3.13 and 3.14).
Cytotoxicity Studies
To evaluate the cytotoxic effect of the selected TKIs, a cell proliferation assay was
performed on cell monolayers of transfected CHO cells for a period of 24h. No cytotoxic effects
of pazopanib, erlotinib, canertinib, vandetanib and nilotinib at a concentration of 100µM were
observed in OATP-1B1 and -1B3 transfected cells in relative to positive control (Triton X). The
findings from this study clearly demonstrate that the selected TKIs are non-cytotoxic even at a
concentration of 100µM (Fig.3.15).

74
Fig.3.3: Inhibitory potency of rifampicin towards OATP-1B1. Intracellular accumulation of
OATP-1B1 substrate [3H] ES in the presence of increasing concentrations of rifampicin (0.1-
100µM). Data is shown as mean±S.D. n=4.
Fig.3.4: Inhibitory potency of pazopanib towards OATP-1B1. Intracellular accumulation of
OATP-1B1 substrate [3H] ES in the presence of increasing concentrations of pazopanib (0.1-
100µM). Data is shown as mean±S.D. n=4.

75
Fig.3.5: Inhibitory potency of nilotinib towards OATP-1B1. Intracellular accumulation of OATP-
1B1 substrate [3H] ES in the presence of increasing concentrations of nilotinib (0.1-100µM). Data
is shown as mean±S.D. n=4.
Fig.3.6: Inhibitory potency of vandetanib towards OATP-1B1. Intracellular accumulation of
OATP-1B1 substrate [3H] ES in the presence of increasing concentrations of vandetanib (0.1-
100µM). Data is shown as mean±S.D. n=4.

76
Fig.3.7: Inhibitory potency of canertinib towards OATP-1B1. Intracellular accumulation of
OATP-1B1 substrate [3H] ES in the presence of increasing concentrations of canertinib (0.1-
100µM). Data is shown as mean±S.D. n=4.
Fig.3.8: Inhibitory potency of erlotinib towards OATP-1B1. Intracellular accumulation of OATP-
1B1 substrate [3H] ES in the presence of increasing concentrations of erlotinib (0.1-100µM). Data
is shown as mean±S.D. n=4.
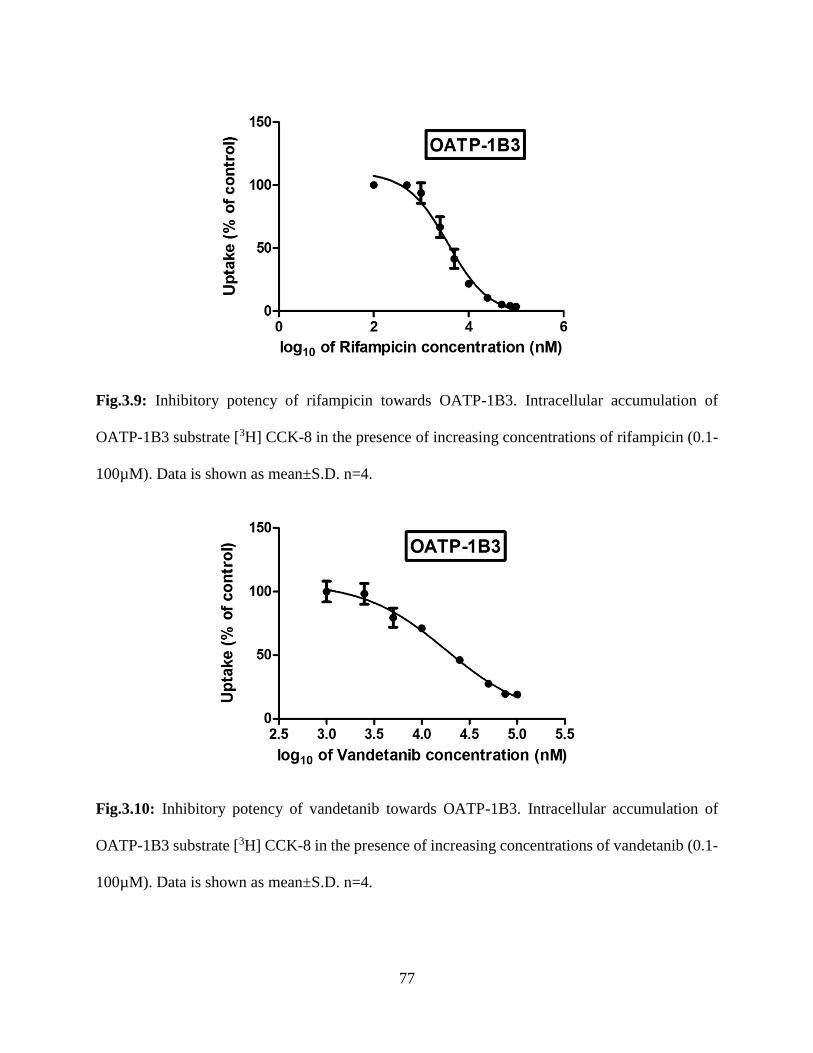
77
Fig.3.9: Inhibitory potency of rifampicin towards OATP-1B3. Intracellular accumulation of
OATP-1B3 substrate [3H] CCK-8 in the presence of increasing concentrations of rifampicin (0.1-
100µM). Data is shown as mean±S.D. n=4.
Fig.3.10: Inhibitory potency of vandetanib towards OATP-1B3. Intracellular accumulation of
OATP-1B3 substrate [3H] CCK-8 in the presence of increasing concentrations of vandetanib (0.1-
100µM). Data is shown as mean±S.D. n=4.

78
Fig.3.11: Inhibitory potency of pazopanib towards OATP-1B3. Intracellular accumulation of
OATP-1B3 substrate [3H] CCK-8 in the presence of increasing concentrations of pazopanib (0.1-
100µM). Data is shown as mean±S.D. n=4.
Fig.3.12: Inhibitory potency of nilotinib towards OATP-1B3. Intracellular accumulation of
OATP-1B3 substrate [3H] CCK-8 in the presence of increasing concentrations of nilotinib (0.1-
100µM). Data is shown as mean±S.D. n=4.
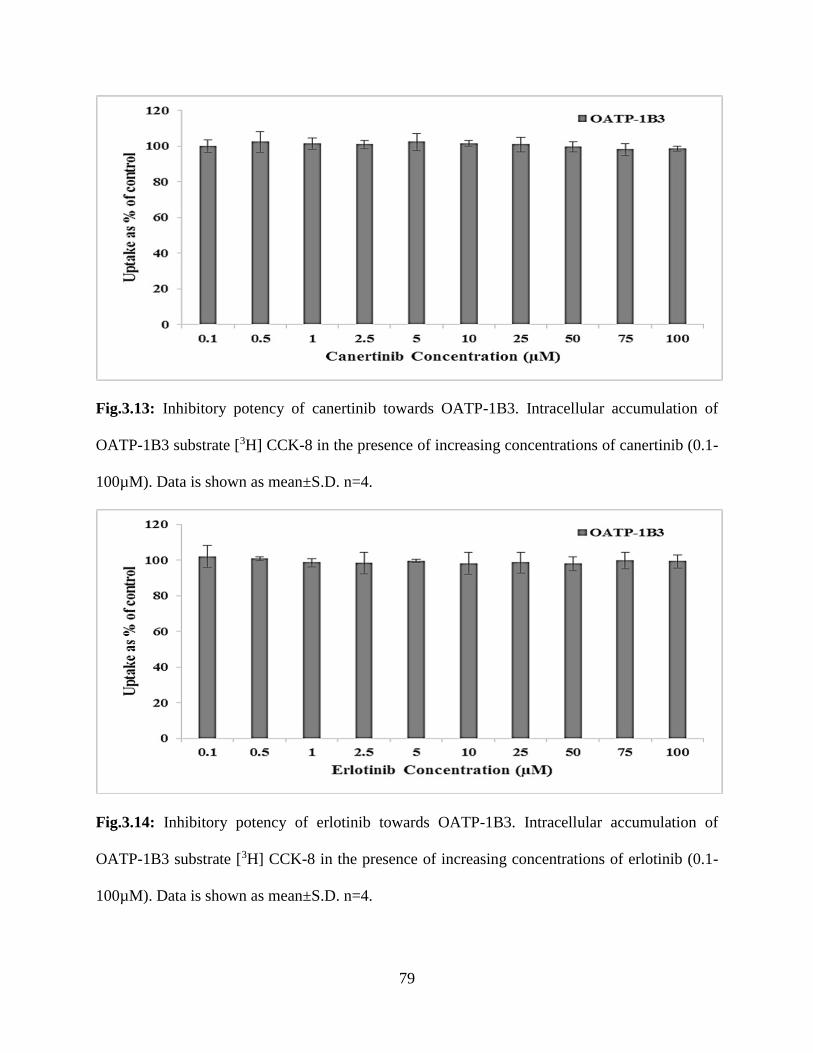
79
Fig.3.13: Inhibitory potency of canertinib towards OATP-1B3. Intracellular accumulation of
OATP-1B3 substrate [3H] CCK-8 in the presence of increasing concentrations of canertinib (0.1-
100µM). Data is shown as mean±S.D. n=4.
Fig.3.14: Inhibitory potency of erlotinib towards OATP-1B3. Intracellular accumulation of
OATP-1B3 substrate [3H] CCK-8 in the presence of increasing concentrations of erlotinib (0.1-
100µM). Data is shown as mean±S.D. n=4.
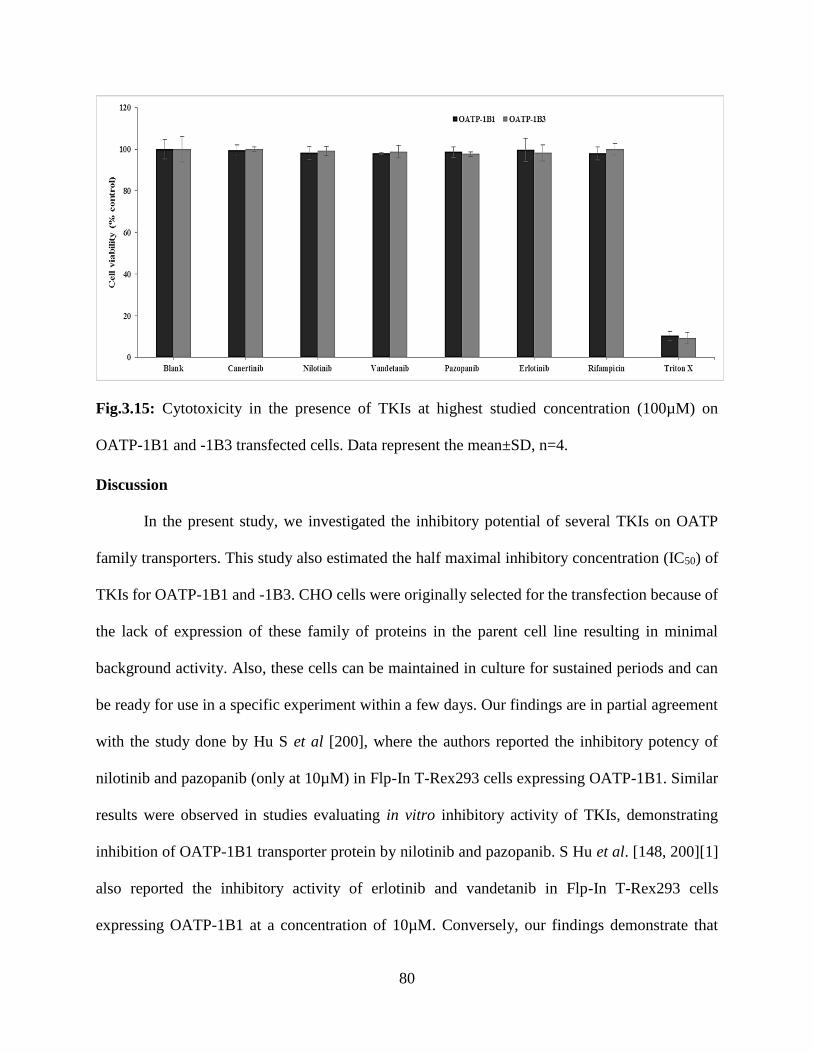
80
Fig.3.15: Cytotoxicity in the presence of TKIs at highest studied concentration (100µM) on
OATP-1B1 and -1B3 transfected cells. Data represent the mean±SD, n=4.
Discussion
In the present study, we investigated the inhibitory potential of several TKIs on OATP
family transporters. This study also estimated the half maximal inhibitory concentration (IC50) of
TKIs for OATP-1B1 and -1B3. CHO cells were originally selected for the transfection because of
the lack of expression of these family of proteins in the parent cell line resulting in minimal
background activity. Also, these cells can be maintained in culture for sustained periods and can
be ready for use in a specific experiment within a few days. Our findings are in partial agreement
with the study done by Hu S et al [200], where the authors reported the inhibitory potency of
nilotinib and pazopanib (only at 10µM) in Flp-In T-Rex293 cells expressing OATP-1B1. Similar
results were observed in studies evaluating in vitro inhibitory activity of TKIs, demonstrating
inhibition of OATP-1B1 transporter protein by nilotinib and pazopanib. S Hu et al. [148, 200][1]
also reported the inhibitory activity of erlotinib and vandetanib in Flp-In T-Rex293 cells
expressing OATP-1B1 at a concentration of 10µM. Conversely, our findings demonstrate that
81
there is no active involvement of erlotinib and vandetanib in the inhibition of OATP-1B1
transporter proteins. These contrasting results suggest that utilization of different radiolabelled
probe substrate and in vitro model based systems may affect the inhibitory action of TKIs on
cellular accumulation of probe substrate via OATP and can lead to misinterpretation of the role of
TKIs causing inhibition of OATPs.
Expression of OATP-1B1 and -1B3 have been exclusively reported on liver, suggesting
their vital role in hepatic uptake of many drugs. Moreover expression of OATP-1B3 has also been
reported on cancer tissues [90, 145, 199, 201-203]. Several substrates of OATP like statins,
paclitaxel, and docetaxel are taken and metabolized by liver. Rate of hepatic transporter mediated
uptake is considered as one of the important parameter of total metabolic rate [199, 204-207].
Hence, plasma concentration of drugs which undergo hepatic metabolism may be altered by
inhibition of hepatic uptake transporters (OATPs). Cyclosporin A (CsA) is a well-known inhibitor
of OATP-1B1, CYP3A4 and MDR1. It is a more potent inhibitor of OATP-1B1 (IC50: 0.2µM)
than CYP3A4 (IC50: >0.3µM). Coadministration of pravastatin, rosuvastatin and atorvastatin
together with CsA resulted in increased AUC by 9.93, 7.08 and 8.69 fold, espectively [199, 208,
209]. Considering this result, concentration of CsA in systemic circulation was not high enough
from oral administration to inhibit hepatic CYP3A4 function. Thus, increase in AUC of statins on
coadministring CsA was due to inhibition of OATP-1B1. Similarly, gemfibrozil is also a more
potent inhibitor of OATP-1B1 than metabolic enzymes, i.e., CYP1A2, 2C8, 2C9 and 2C19.
Coadministration of pravastatin, rosuvastatin and atorvastatin together with CsA results in higher
AUC by 2.01, 1.88 and 1.35 fold, respectively [199, 210-212]. Since, these statins are primarily
excreted from the liver in an unchanged form, magnitude of increase can be attributed as a result
of inhibition of OATP-1B1. Hence inhibition of hepatic uptake transporters (OATPs) can result in
82
many clinically relevant DDIs. Unlike statins, information on the inhibitory potency of TKIs on
hepatic uptake transporters (OATP-1B1 and -1B3) is very sparse. Thus, it is of utmost importance
to understand clinically relevant DDIs which may arise due to inhibitory action of TKIs on OATP-
1B1 and -1B3.
The results obtained from our studies evaluating in vitro inhibitory activity of TKIs reveals
inhibition of OATP-1B1 and/or-1B3 by selected TKIs. In this article, we have reported inhibitory
potential of TKIs for OATP-1B1 and/or -1B3 by estimating half maximal inhibitory concentration
(IC50). Our findings suggest that nilotinib is a more potent inhibitor of OATP-1B1 than pazopanib.
No significant inhibition in uptake of radiolabelled probe substrates were observed in OATP-1B1
transfected cells with vandetanib, canertinib and erlotinib indicating that all tested TKIs do not act
as inhibitor for OATP-1B1. Similarly for OATP-1B3 transporter protein, while vandetanib showed
its inhibitory action on the probe radiolabelled substrate intracellular accumulation, pazopanib,
nilotinib, canertinib and erlotinib did not produce any inhibitory effect on OATP-1B3. Hence,
OATP-1B1 and/or -1B3 can be considered as important factors in determining pharmacokinetics
or DDIs of pazopanib, nilotinib and vandetanib. These results though act mainly as a proof of
concept and the actual inhibitory potency/activity in humans may vary based on various
physiological and pathological conditions resulting in altered expression of these transporters in
liver.
Although TKIs share similar structural backbone but minor changes in the structure can lead to
drastic changes in binding affinities to OATP-1B1 and-1B3 transporter and hence, it might be a
reason for the large disparity in the inhibition potential among the various drugs for the hepatic
uptake transporters. Additionally, a single radioactive substrate was used to determine the
inhibition efficiency of the drugs for respective transporters. Since there can be multiple binding
83
sites on a single transporter for various substrates as previously reported [213, 214] the positive
inhibitors might only inhibit the specific substrate-transporter site interaction. It might happen that
if a different substrate that binds to a different binding site is used, then we might see the other
non-positive inhibitors to become active for OATP-1B1 and-1B3.
Currently, OATP-1B1 and -1B3 related DDIs involving clinical as well as pre-clinical
interactions has been published in many reports. These DDIs are considered as vital components
in discovery and development of drugs with safer profiles since these DDIs may lead to elevated
risk of drug induced adverse effects, even resulting in withdrawal from the market. Many
therapeutic agents are substrates or inhibitors of OATP-1B1 and/or -1B3. Alteration in the hepatic
uptake of these compounds via OATPs may result in clinically relevant DDIs. Expression and
involvement of these OATP-1B type isoforms in liver needs to be delineated for better
understanding of the factors governing absorption, distribution, metabolism and elimination
(ADME) of therapeutic agents. Any change in the activity of OATP-1B type transporter proteins
will result in suboptimal treatment or high toxicity. Thus it is necessary to investigate the role of
these transporters in order to avoid DDIs [199].
Previously published articles have focused on TKIs as substrates and not on the inhibition
potential of these agents with OATPs [153, 157, 172, 191, 196, 197]. In this study we have
observed concentration dependent inhibition of OATP-1B1 transporter by pazopanib and nilotinib
in in vitro model system. Also, concentration dependent inhibition of OATP-1B3 in presence of
vandetanib.
OATP-1B1 and/or -1B3 are responsible for regulating the initial step of hepatic elimination
of therapeutic agents (substrates of OATPs) by carrying out the uptake of selected agents into the
hepatic tissue exposing the molecules to CYP enzyme mediated metabolism followed by

84
elimination via biliary secretion. These OATPs expressed on basolateral membrane of hepatocytes
may induce drug uptake and can be regarded as one of the determinants of overall metabolic rate
in liver [147]. An efficient directional movement of therapeutic agents across hepatic tissues
requires synchronized activity of hepatic uptake, metabolizing enzymes and efflux transporters
[177]. Tan AR et al, reported that coadministration of pazopanib (weak CYP3A4 and CYP2C8
inhibitor) with paclitaxel resulted in 14% lower paclitaxel clearance and a 31% higher
concentration [215]. We have shown that pazopanib inhibits OATP-1B1 transporter which is
responsible for hepatic uptake of paclitaxel. Therefore, 31% higher plasma concentration of
paclitaxel may not be just due to the inhibition of metabolizing enzymes but also may be due to
inhibition of OATP-1B1 transporter. This hypothesis of OATP inhibition by TKIs resulting in
increased plasma taxol concentration (docetaxel) has also been reported by Hu S et al [200].
OATP-1B1 plays a vital role in hepatic uptake of paclitaxel making it vulnerable to metabolism
by CYP3A4 and ultimately accelerating elimination by biliary secretion via P-gp [216, 217].
Coadministration of vandetanib has been warranted with digoxin. Vandetanib is a weak
inhibitor of the efflux pump P-glycoprotein (P-gp). Coadministration of vandetanib and digoxin
(substrate of P-glycoprotein, P-gp) may result in increased plasma concentrations of digoxin
(caprelsa, product monograph). Also, digoxin is a well know substrate of OATP-1B3 as well [122].
We have shown that vandetanib inhibits OATP-1B3 transporter which is responsible for hepatic
uptake of digoxin. Hence, enhanced plasma concentration of digoxin will not be just because of
the inhibition of P-gp but also may be due to inhibition of OATP-1B3 transporter by vandetanib.
Inhibition of OATPs (localized on basloateral membrane of hepatic tissues), metabolizing
enzymes and efflux transporters (expressed on bile canalicular membrane) may be responsible for
enhance plasma concentration of OATP substrates.
85
OATPs mediated DDIs have the potential to influence drug efficacy and toxicity.
Therefore, coadministration of pazopanib, nilotinib and vandetanib (OATP-1B1 and/or -1B3
inhibitors) along with other hepatic OATP substrates (paclitaxel, docetaxel, cyclosporine, protease
inhibitors, rifampicin, statins, telmisartan, valsartan, mTOR inhibitors, antibiotics etc.) may result
in altered pharmacokinetics and pharmacodynamics of OATP substrates. Inhibition of hepatic
uptake of OATP substrates by coadministration of OATPs inhibitor is a plausible explanation of
several clinically observed DDIs. Inhibition of metabolizing enzymes and/or efflux transporter
may not be the only cause of DDI induced effects. Drug induced alteration of OATP-1B1 and -
1B3 transporter function is an essential auxiliary mechanism underlying DDIs [170].
Several TKIs are associated with drug induced hepatotoxicity. Rise in serum transaminase
levels and bilirubin were the common adverse effects associated with TKIs therapeutic regimen.
Xu CF et al [194], reported that higher bilirubin levels in plasma or hyperbilirubinemia is
associated with the inhibition of both OATP-1B1 and enzyme uridine diphosphate
glucuronosyltransferase 1A1 (UGT1A1). OATP-1B1 is responsible for hepatic uptake of bilirubin
whereas UGT1A1 is responsible for bilirubin metabolism prior to its elimination. Hence,
pazopanib induced hyperbilirubinemia may result due to inhibition of both OATP-1B1 and
UGT1A1. We have also here reported the inhibitory potency of pazopanib for OATP-1B1. This
result is consistent with the observation that pazopanib induced inhibition of OATP-1B1 may
cause diminished hepatic uptake of bilirubin resulting in hyperbilirubinemia. Similarly, we have
reported inhibitory activity of nilotinib towards OATP-1B1 transporter proteins. Singer JB et al
[218], reported that inhibition of UGT1A1 activity by nilotinib and genetic polymorphism can be
attributed as the cause of increased rate of hyperbilirubinemia. On the basis of our findings along

86
with published reports, we postulate that nilotinib induced hyperbilirubinemia may be the result of
inhibition of both OATP-1B1 and UGT1A1.
Conclusion
In conclusion, we have shown that selected TKIs may cause inhibition of OATP-1B1 and
OATP-1B3. Pazopanib and nilotinib exhibit concentration dependent inhibitory activity against
OATP-1B1 whereas vandetanib generates inhibitory action with OATP-1B3. These findings
delineate the involvement of TKIs in inhibiting hepatic uptake of OATP-1B1 and -1B3 substrate.
These findings also confirm that inhibitory activity of TKIs towards hepatic uptake transporters
and can be utilized as a vital determinant of the pharmacokinetic profile of coadministered
therapeutic agents. Since co-administration of TKIs with other drugs is fairly common in multi-
drug therapy, hepatic uptake transporters OATP-1B1 and -1B3 can be regarded as important
molecular targets for potential DDIs. Thus, hepatic uptake mediated by OATP-1B1 and -1B3 for
selected TKIs should be dynamically scrutinized in order to circumvent DDIs. These transporters
in conjunction with the metabolizing enzymes and efflux proteins may eventually decide on the
overall flux/loss of the therapeutic agents within the hepatic tissue. These studies act as a proof of
concept substantiating the need for further clinical studies investigating the OATP based DDI
potential of TKIs. Further in vivo studies are required for better understanding of the contribution
of OATP-1B1 and/or -1B3 transporter proteins in the hepatic disposition of drugs coadministered
with TKIs and for predicting any adverse drug reactions associated with these hepatic transporter
mediated DDIs [219].
Acknowledgement
87
This work was supported by National Institutes of Health grant 1R01 AI071199. The
authors highly appreciate Dr. Bruno Stieger for their generous gift of OATP-1B type transporter
protein transfected cell lines.
CHAPTER 4
THE ROLE OF TRANSPORTERS AND EFFLUX SYSTEM IN DRUG DELIVERY
Rationale
The transporters are membrane proteins and integral part of cell membrane. These proteins
are broadly involved in selective absorption of endogenous substances (substances such as anions
and cations, vitamins, sugars, nucleosides, amino acids, peptides, etc) and elimination of toxic
substances. In fact, transporters direct the influx of essential nutrients and ions and the efflux of
cellular metabolites and xenobiotics. These proteins also play a pivotal role in drug absorption,
distribution, elimination, and drug-drug interactions. Although the occurrence of multidrug
resistance of bacteria was noticed more than fifty years ago, the discovery of P-glycoprotein (P-
gp), a major factor for efflux of xenobiotics out of cell took twenty years, It is clear now that apart
88
from intestinal absorption barrier and blood brain barrier, different tumor cells express P-gp which
contributes a major role to the drug resistance in chemotherapy. In fact, these transporters take
part a considerable role in the process of drug absorption, distribution, metabolism and elimination
(ADME) of drugs. Almost 2000 genes have been identified for transporters or transporter-related
proteins [220]. Approximately 400 membrane transporters, in two superfamilies, have been
identified and characterized for specific tissue localization, and a number of these transporters
have been cloned [122]. From pharmacological point of view two major superfamilies, ABC (ATP
binding cassette) and SLC (solute carrier) transporters, are focused. The ABC, as active
transporters, operates by ATP hydrolysis to expel their substrate out of cells across lipid bilayer.
The ABC proteins are encoded by 49 genes and are categorized into seven subclasses [221] P-
glycoprotein (P-gp) is the most well documented transporter in the ABC superfamily and encoded
by the MDR1 (ABCB1) gene. The SLC superfamily consists of forty three families [221] which
participate in drug absorption. There are many well-known SLC transporters include serotonin
(SLC6A4) and dopamine (SLC6A3) transporters. Besides carrying nutrients or extruding cellular
waste or, toxins, the wide-ranging role of membrane transporters is drug absorption, distribution
and elimination. These transporters also participate in drug-drug interactions. The role of these
transporters in multidrug resistance has been well recognized. In addition to drug delivery service,
some of these transporter proteins also provide as a protective barrier to particular organ such as
the brain. For example, P-gp in the blood-brain-barrier (BBB) or blood-retinal barrier protects the
brain and eyes respectively from toxic influx of a variety of structurally diverse molecules through
efflux pump. The ABC transporters also work in concert with drug metabolizing enzymes by
eliminating drugs and their metabolites. Molecular cloning of transporter genes reveals the
association of multiple genes encoding subtypes with similar function with different tissue

89
distribution and specificity towards drugs. Studying these subtypes (eg. glucose transporters,
GLUT 1-4) can unravel the structure-activity correlation for drug transport which may allow
modulation of its activity when considered necessary. Sometimes transporters can be present in
the form of multiple alleles with functional defects resulting in defective drug binding or transport.
Although the importance of drug transporters in the process of ADME and drug-drug interactions
is well documented, our knowledge in this area is still emerging. The US Food and Drug
Administration (FDA) and International Transporter Consortium (ITC) recently selected few
transporters: organic anion transporter (OAT), organic anion transporting polypeptide (OATP),
organic cation transporter (OCT), peptide transporter (PEPT), P-gp, multidrug resistance
associated protein (MRP) and breast cancer resistance protein (BCRP) which are decisive to
xenobiotics absorption, and drug-drug interactions. From pharmacokinetic point of view,
localization and function of these transporters in the intestine, liver and kidney receives major
attention. However, current evidence suggests that some of these transporters, particularly ABC
transporters in the BBB also have drawn interest for delivering drugs to the brain. In this chapter,
we will discuss mainly those transporters as well as vitamin transporters which appear to be
significant for drug delivery.
ABC Transporters
ABC Proteins
ATP binding cassette (ABC) family is a superfamily of membrane proteins responsible for
translocation of various substances comprising sugars, amino acids, sterols, peptides, proteins,
antibiotics, toxins and xenobiotics. These proteins utilize the energy derived from hydrolysis of
ATP for translocations various substances across a concentration gradient. Forty eight different
ABC transporters have been in human genome. The ABC transporter genes stand for the largest
90
family of transmembrane proteins. Based on sequence homology and domain structure, they are
categorized into seven different classes (ABCA-ABCG). So far, thirteen different transporters
have been identified from classes A, B, C and G. These transporters play a significant role in the
development of multidrug resistance (MDR) [222, 223]. First, Biedler and Riehm (1970) reported
that Chinese hamster ovary (CHO) cells identified for resistance to Actinomycin D also
demonstrated cross-resistance to many other drugs such as duramycin, democoline, mithramycin,
mytomycin C, puromycin, vinblastin and vincristine [224-227]. It is also accountable for the efflux
of HIV-protease inhibitors, anti-cancer agents and many others drugs. It appeared that after
selection of a single cytotoxic drug, mammalian cells simultaneously developed cross-resistant to
a variety of therapeutic agents with different chemical structures and functions. This phenomenon
was referred to multidrug resistance. While it was believed that this drug resistance was due to
permeation alteration of cell membrane, Juliano and Ling (1976) revealed that drug resistance in
CHO cells was due to the presence of P-glycoprotein [225]. Why so many efflux transporters
present in life forms? Many toxins are present in the nature, and clinicians administer many toxins
to treat life threatening diseases (cancer, HIV, diabetes, etc). The amphiphilic drug molecules are
hydrophobic enough to diffuse through lipid bilayer, but hydrophilic enough to reach the target.
Once inside cells, these drugs can be inactivated by oxidation or conjugation to become more
hydrophilic and get trapped inside the cells. These efflux transporters help them get out. While P-
gp become warrior in effluxing wide range of therapeutic agents, MRP family deserves credit in
extruding drugs conjugated to GSH, glucuronate, or sulfate and many other organic anions such
as methotrexate.
These ABC transporters always function unidirectional as opposed to several others
transporters which function bidirectional [228]. All these ABC proteins show a minimal
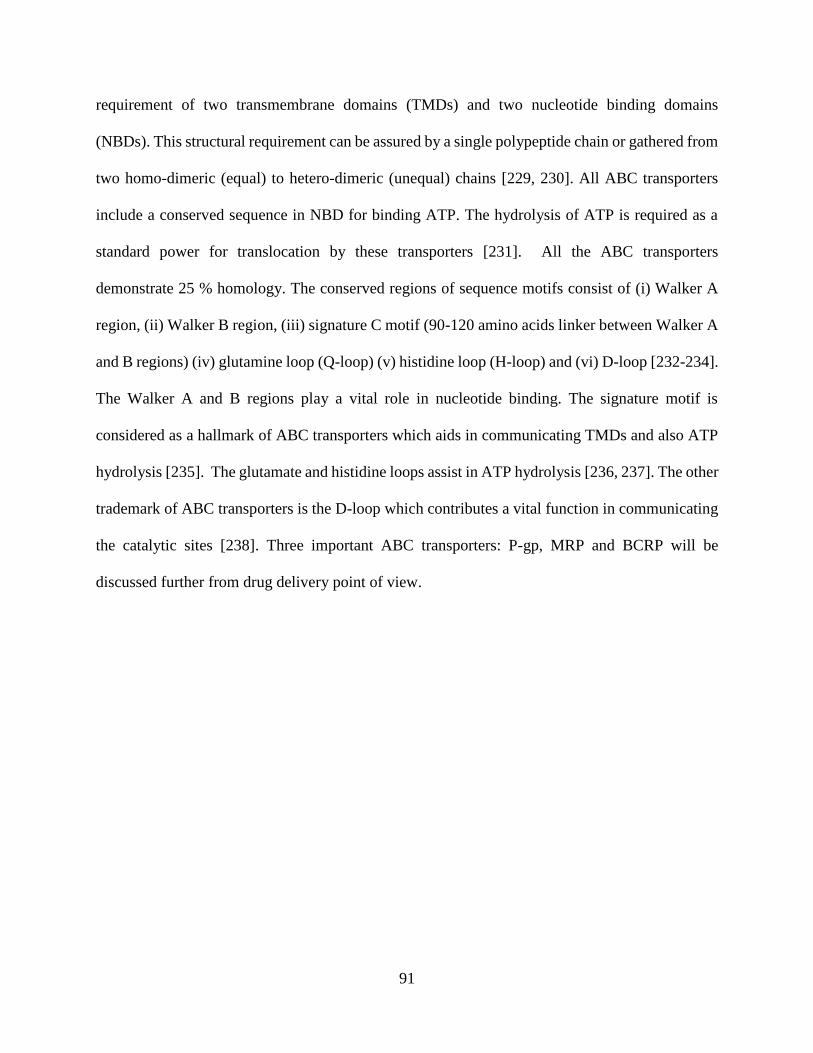
91
requirement of two transmembrane domains (TMDs) and two nucleotide binding domains
(NBDs). This structural requirement can be assured by a single polypeptide chain or gathered from
two homo-dimeric (equal) to hetero-dimeric (unequal) chains [229, 230]. All ABC transporters
include a conserved sequence in NBD for binding ATP. The hydrolysis of ATP is required as a
standard power for translocation by these transporters [231]. All the ABC transporters
demonstrate 25 % homology. The conserved regions of sequence motifs consist of (i) Walker A
region, (ii) Walker B region, (iii) signature C motif (90-120 amino acids linker between Walker A
and B regions) (iv) glutamine loop (Q-loop) (v) histidine loop (H-loop) and (vi) D-loop [232-234].
The Walker A and B regions play a vital role in nucleotide binding. The signature motif is
considered as a hallmark of ABC transporters which aids in communicating TMDs and also ATP
hydrolysis [235]. The glutamate and histidine loops assist in ATP hydrolysis [236, 237]. The other
trademark of ABC transporters is the D-loop which contributes a vital function in communicating
the catalytic sites [238]. Three important ABC transporters: P-gp, MRP and BCRP will be
discussed further from drug delivery point of view.
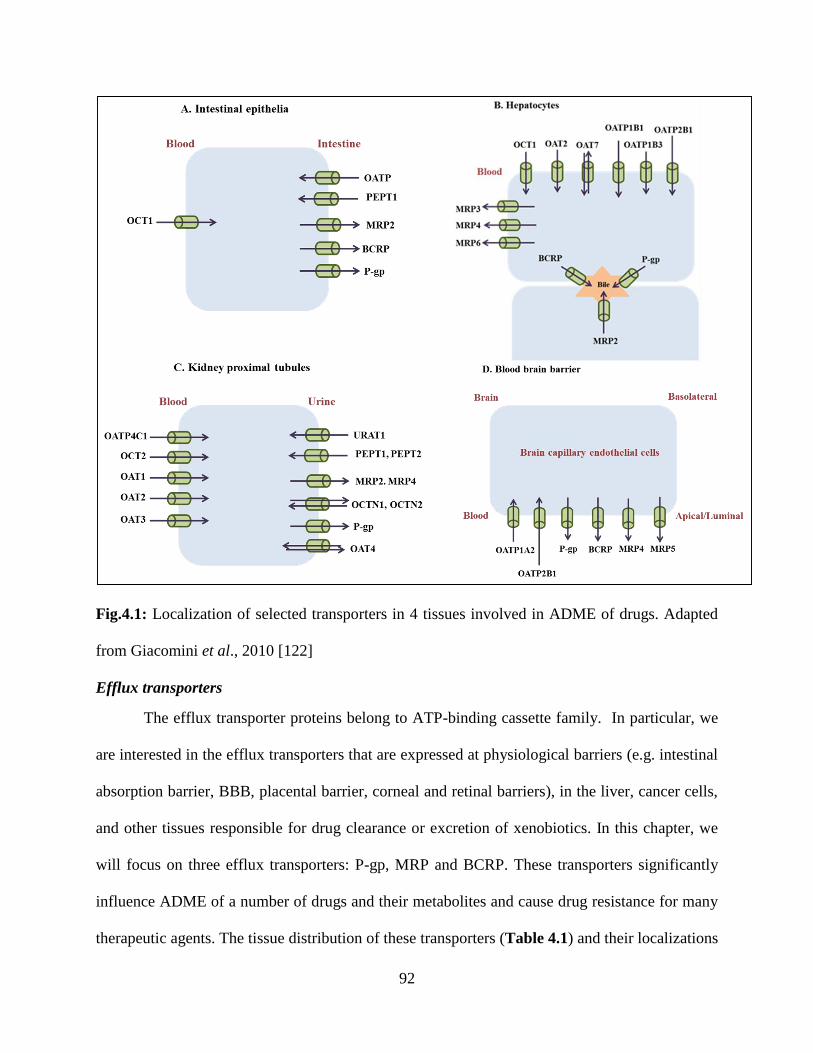
92
Fig.4.1: Localization of selected transporters in 4 tissues involved in ADME of drugs. Adapted
from Giacomini et al., 2010 [122]
Efflux transporters
The efflux transporter proteins belong to ATP-binding cassette family. In particular, we
are interested in the efflux transporters that are expressed at physiological barriers (e.g. intestinal
absorption barrier, BBB, placental barrier, corneal and retinal barriers), in the liver, cancer cells,
and other tissues responsible for drug clearance or excretion of xenobiotics. In this chapter, we
will focus on three efflux transporters: P-gp, MRP and BCRP. These transporters significantly
influence ADME of a number of drugs and their metabolites and cause drug resistance for many
therapeutic agents. The tissue distribution of these transporters (Table 4.1) and their localizations
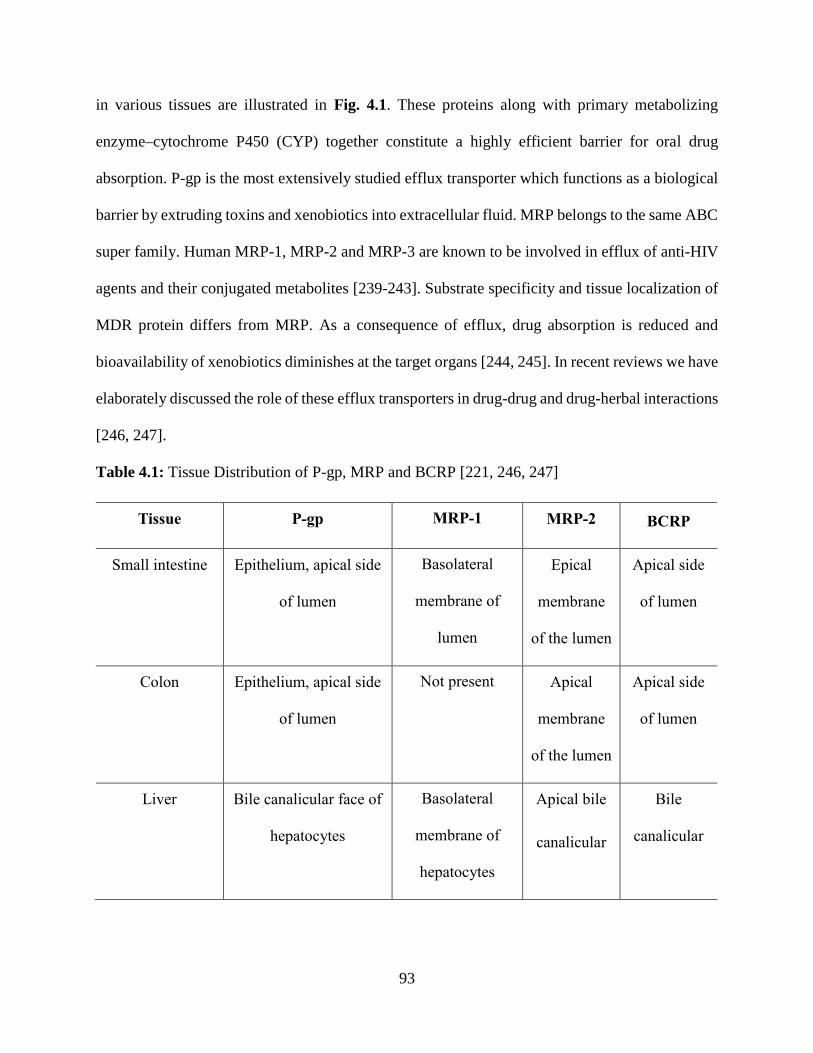
93
in various tissues are illustrated in Fig. 4.1. These proteins along with primary metabolizing
enzyme cytochrome P450 (CYP) together constitute a highly efficient barrier for oral drug
absorption. P-gp is the most extensively studied efflux transporter which functions as a biological
barrier by extruding toxins and xenobiotics into extracellular fluid. MRP belongs to the same ABC
super family. Human MRP-1, MRP-2 and MRP-3 are known to be involved in efflux of anti-HIV
agents and their conjugated metabolites [239-243]. Substrate specificity and tissue localization of
MDR protein differs from MRP. As a consequence of efflux, drug absorption is reduced and
bioavailability of xenobiotics diminishes at the target organs [244, 245]. In recent reviews we have
elaborately discussed the role of these efflux transporters in drug-drug and drug-herbal interactions
[246, 247].
Table 4.1: Tissue Distribution of P-gp, MRP and BCRP [221, 246, 247]
Tissue P-gp MRP-1 MRP-2 BCRP
Small intestine Epithelium, apical side
of lumen
Basolateral
membrane of
lumen
Epical
membrane
of the lumen
Apical side
of lumen
Colon Epithelium, apical side
of lumen
Not present Apical
membrane
of the lumen
Apical side
of lumen
Liver Bile canalicular face of
hepatocytes
Basolateral
membrane of
hepatocytes
Apical bile
canalicular
Bile
canalicular
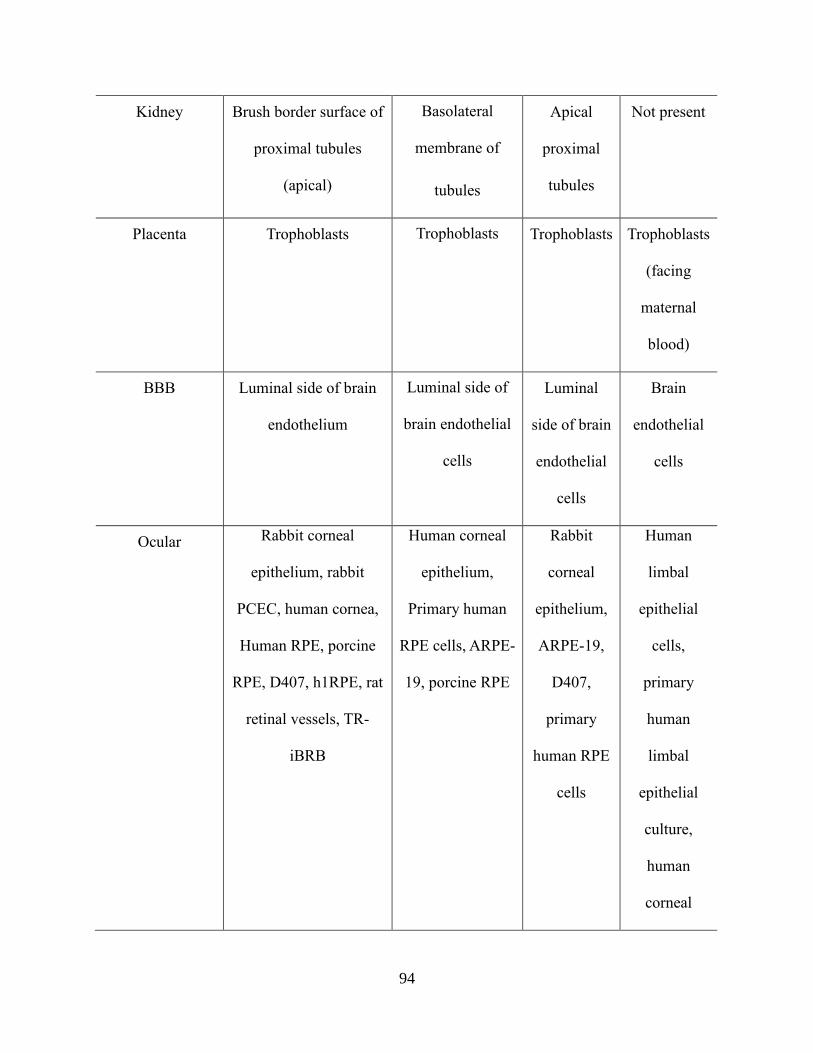
94
Kidney Brush border surface of
proximal tubules
(apical)
Basolateral
membrane of
tubules
Apical
proximal
tubules
Not present
Placenta Trophoblasts Trophoblasts Trophoblasts Trophoblasts
(facing
maternal
blood)
BBB Luminal side of brain
endothelium
Luminal side of
brain endothelial
cells
Luminal
side of brain
endothelial
cells
Brain
endothelial
cells
Ocular Rabbit corneal
epithelium, rabbit
PCEC, human cornea,
Human RPE, porcine
RPE, D407, h1RPE, rat
retinal vessels, TR-
iBRB
Human corneal
epithelium,
Primary human
RPE cells, ARPE-
19, porcine RPE
Rabbit
corneal
epithelium,
ARPE-19,
D407,
primary
human RPE
cells
Human
limbal
epithelial
cells,
primary
human
limbal
epithelial
culture,
human
corneal
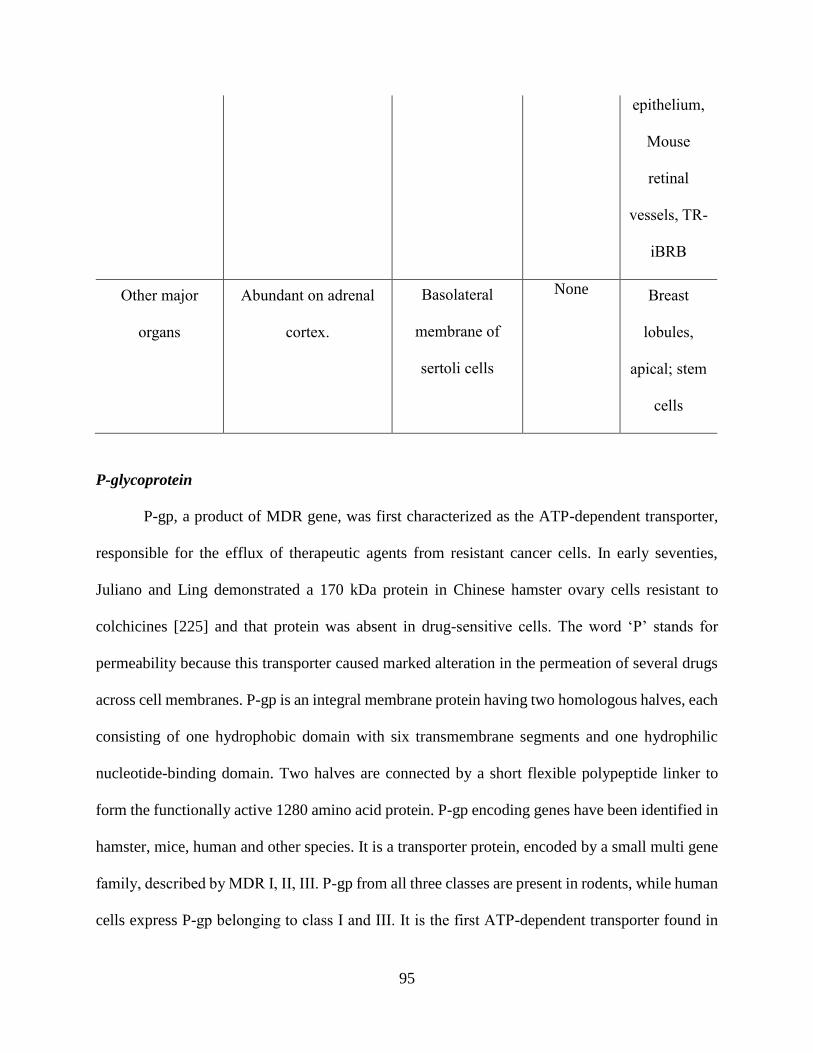
95
epithelium,
Mouse
retinal
vessels, TR-
iBRB
Other major
organs
Abundant on adrenal
cortex.
Basolateral
membrane of
sertoli cells
None Breast
lobules,
apical; stem
cells
P-glycoprotein
P-gp, a product of MDR gene, was first characterized as the ATP-dependent transporter,
responsible for the efflux of therapeutic agents from resistant cancer cells. In early seventies,
Juliano and Ling demonstrated a 170 kDa protein in Chinese hamster ovary cells resistant to
colchicines [225] and that protein was absent in drug-sensitive cells. The word ‘P’ stands for
permeability because this transporter caused marked alteration in the permeation of several drugs
across cell membranes. P-gp is an integral membrane protein having two homologous halves, each
consisting of one hydrophobic domain with six transmembrane segments and one hydrophilic
nucleotide-binding domain. Two halves are connected by a short flexible polypeptide linker to
form the functionally active 1280 amino acid protein. P-gp encoding genes have been identified in
hamster, mice, human and other species. It is a transporter protein, encoded by a small multi gene
family, described by MDR Ι, ΙΙ, ΙΙΙ. P-gp from all three classes are present in rodents, while human
cells express P-gp belonging to class Ι and ΙΙΙ. It is the first ATP-dependent transporter found in
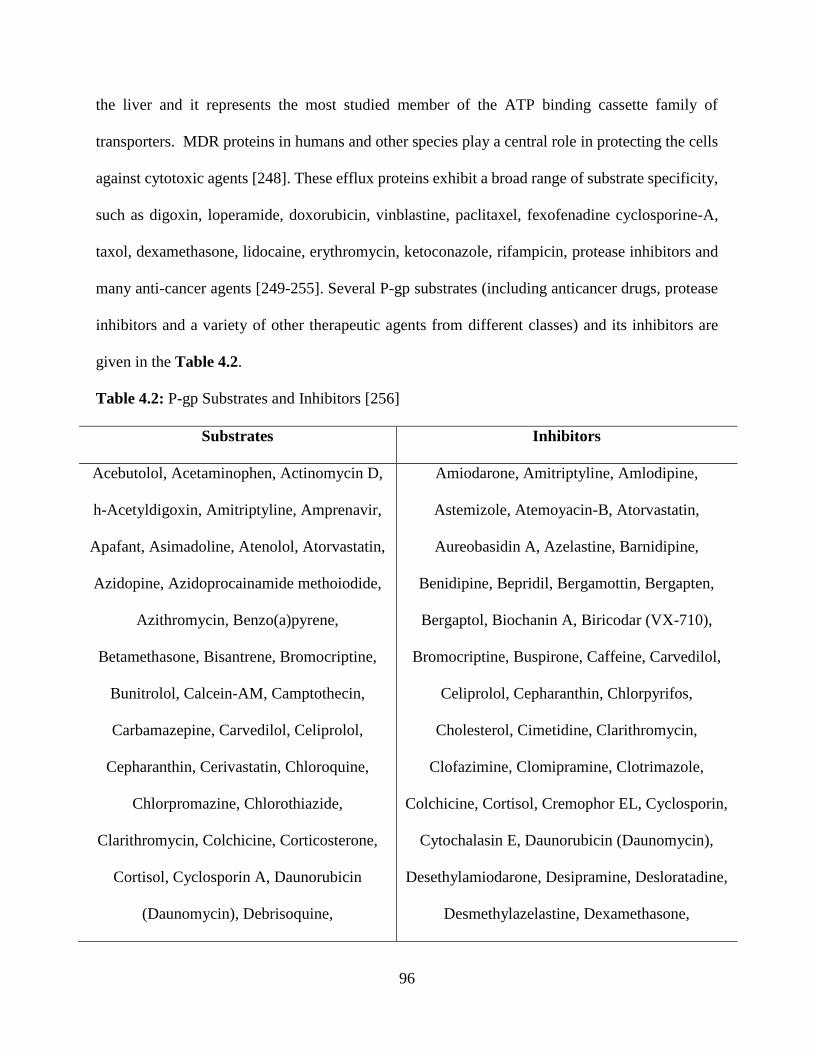
96
the liver and it represents the most studied member of the ATP binding cassette family of
transporters. MDR proteins in humans and other species play a central role in protecting the cells
against cytotoxic agents [248]. These efflux proteins exhibit a broad range of substrate specificity,
such as digoxin, loperamide, doxorubicin, vinblastine, paclitaxel, fexofenadine cyclosporine-A,
taxol, dexamethasone, lidocaine, erythromycin, ketoconazole, rifampicin, protease inhibitors and
many anti-cancer agents [249-255]. Several P-gp substrates (including anticancer drugs, protease
inhibitors and a variety of other therapeutic agents from different classes) and its inhibitors are
given in the Table 4.2.
Table 4.2: P-gp Substrates and Inhibitors [256]
Substrates Inhibitors
Acebutolol, Acetaminophen, Actinomycin D,
h-Acetyldigoxin, Amitriptyline, Amprenavir,
Apafant, Asimadoline, Atenolol, Atorvastatin,
Azidopine, Azidoprocainamide methoiodide,
Azithromycin, Benzo(a)pyrene,
Betamethasone, Bisantrene, Bromocriptine,
Bunitrolol, Calcein-AM, Camptothecin,
Carbamazepine, Carvedilol, Celiprolol,
Cepharanthin, Cerivastatin, Chloroquine,
Chlorpromazine, Chlorothiazide,
Clarithromycin, Colchicine, Corticosterone,
Cortisol, Cyclosporin A, Daunorubicin
(Daunomycin), Debrisoquine,
Amiodarone, Amitriptyline, Amlodipine,
Astemizole, Atemoyacin-B, Atorvastatin,
Aureobasidin A, Azelastine, Barnidipine,
Benidipine, Bepridil, Bergamottin, Bergapten,
Bergaptol, Biochanin A, Biricodar (VX-710),
Bromocriptine, Buspirone, Caffeine, Carvedilol,
Celiprolol, Cepharanthin, Chlorpyrifos,
Cholesterol, Cimetidine, Clarithromycin,
Clofazimine, Clomipramine, Clotrimazole,
Colchicine, Cortisol, Cremophor EL, Cyclosporin,
Cytochalasin E, Daunorubicin (Daunomycin),
Desethylamiodarone, Desipramine, Desloratadine,
Desmethylazelastine, Dexamethasone,
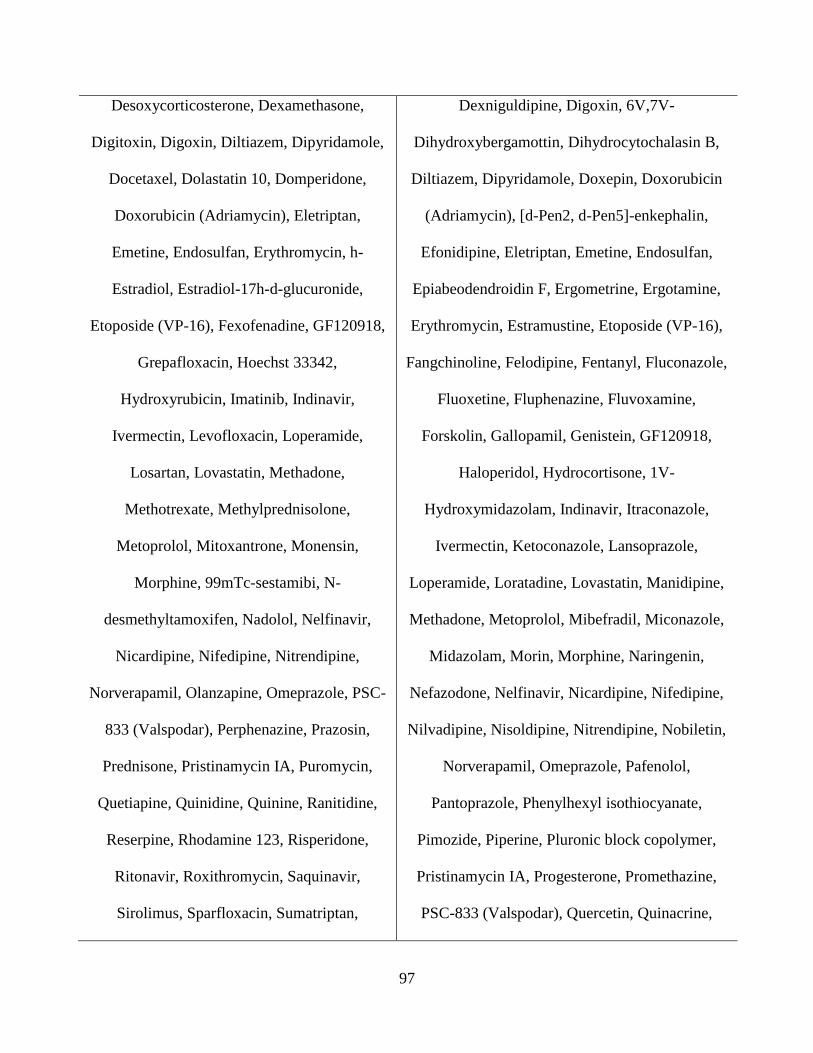
97
Desoxycorticosterone, Dexamethasone,
Digitoxin, Digoxin, Diltiazem, Dipyridamole,
Docetaxel, Dolastatin 10, Domperidone,
Doxorubicin (Adriamycin), Eletriptan,
Emetine, Endosulfan, Erythromycin, h-
Estradiol, Estradiol-17h-d-glucuronide,
Etoposide (VP-16), Fexofenadine, GF120918,
Grepafloxacin, Hoechst 33342,
Hydroxyrubicin, Imatinib, Indinavir,
Ivermectin, Levofloxacin, Loperamide,
Losartan, Lovastatin, Methadone,
Methotrexate, Methylprednisolone,
Metoprolol, Mitoxantrone, Monensin,
Morphine, 99mTc-sestamibi, N-
desmethyltamoxifen, Nadolol, Nelfinavir,
Nicardipine, Nifedipine, Nitrendipine,
Norverapamil, Olanzapine, Omeprazole, PSC-
833 (Valspodar), Perphenazine, Prazosin,
Prednisone, Pristinamycin IA, Puromycin,
Quetiapine, Quinidine, Quinine, Ranitidine,
Reserpine, Rhodamine 123, Risperidone,
Ritonavir, Roxithromycin, Saquinavir,
Sirolimus, Sparfloxacin, Sumatriptan,
Dexniguldipine, Digoxin, 6V,7V-
Dihydroxybergamottin, Dihydrocytochalasin B,
Diltiazem, Dipyridamole, Doxepin, Doxorubicin
(Adriamycin), [d-Pen2, d-Pen5]-enkephalin,
Efonidipine, Eletriptan, Emetine, Endosulfan,
Epiabeodendroidin F, Ergometrine, Ergotamine,
Erythromycin, Estramustine, Etoposide (VP-16),
Fangchinoline, Felodipine, Fentanyl, Fluconazole,
Fluoxetine, Fluphenazine, Fluvoxamine,
Forskolin, Gallopamil, Genistein, GF120918,
Haloperidol, Hydrocortisone, 1V-
Hydroxymidazolam, Indinavir, Itraconazole,
Ivermectin, Ketoconazole, Lansoprazole,
Loperamide, Loratadine, Lovastatin, Manidipine,
Methadone, Metoprolol, Mibefradil, Miconazole,
Midazolam, Morin, Morphine, Naringenin,
Nefazodone, Nelfinavir, Nicardipine, Nifedipine,
Nilvadipine, Nisoldipine, Nitrendipine, Nobiletin,
Norverapamil, Omeprazole, Pafenolol,
Pantoprazole, Phenylhexyl isothiocyanate,
Pimozide, Piperine, Pluronic block copolymer,
Pristinamycin IA, Progesterone, Promethazine,
PSC-833 (Valspodar), Quercetin, Quinacrine,
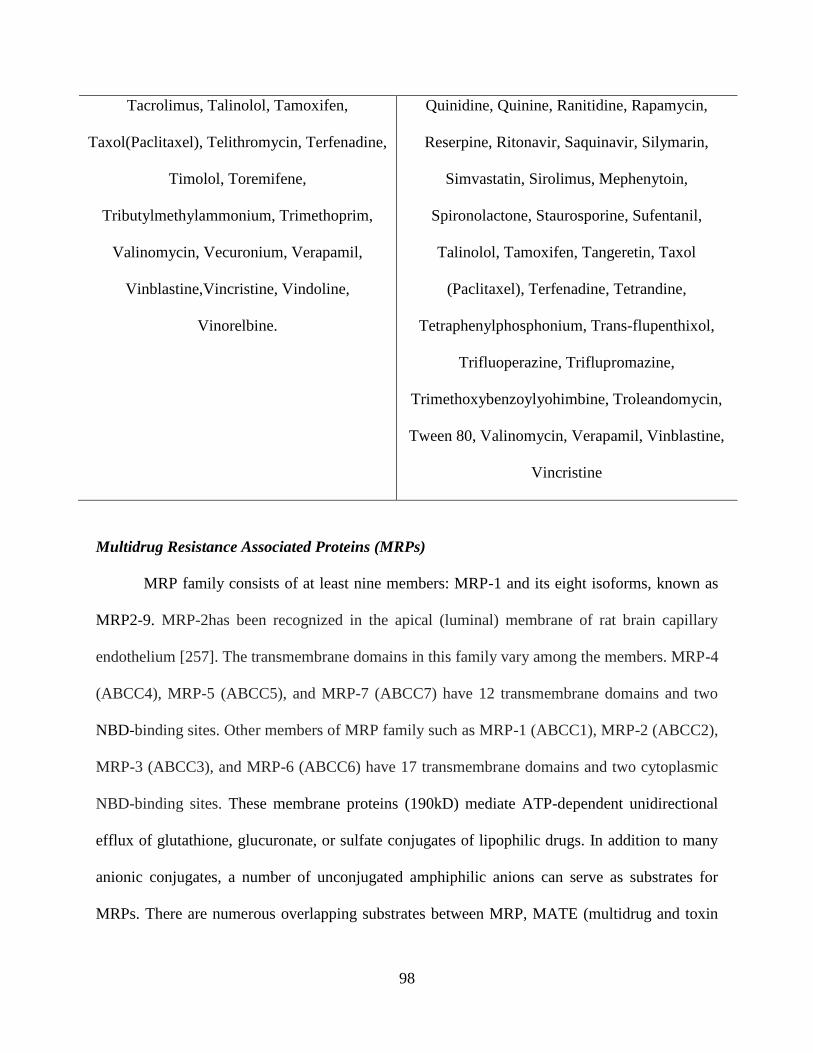
98
Tacrolimus, Talinolol, Tamoxifen,
Taxol(Paclitaxel), Telithromycin, Terfenadine,
Timolol, Toremifene,
Tributylmethylammonium, Trimethoprim,
Valinomycin, Vecuronium, Verapamil,
Vinblastine,Vincristine, Vindoline,
Vinorelbine.
Quinidine, Quinine, Ranitidine, Rapamycin,
Reserpine, Ritonavir, Saquinavir, Silymarin,
Simvastatin, Sirolimus, Mephenytoin,
Spironolactone, Staurosporine, Sufentanil,
Talinolol, Tamoxifen, Tangeretin, Taxol
(Paclitaxel), Terfenadine, Tetrandine,
Tetraphenylphosphonium, Trans-flupenthixol,
Trifluoperazine, Triflupromazine,
Trimethoxybenzoylyohimbine, Troleandomycin,
Tween 80, Valinomycin, Verapamil, Vinblastine,
Vincristine
Multidrug Resistance Associated Proteins (MRPs)
MRP family consists of at least nine members: MRP-1 and its eight isoforms, known as
MRP2-9. MRP-2has been recognized in the apical (luminal) membrane of rat brain capillary
endothelium [257]. The transmembrane domains in this family vary among the members. MRP-4
(ABCC4), MRP-5 (ABCC5), and MRP-7 (ABCC7) have 12 transmembrane domains and two
NBD-binding sites. Other members of MRP family such as MRP-1 (ABCC1), MRP-2 (ABCC2),
MRP-3 (ABCC3), and MRP-6 (ABCC6) have 17 transmembrane domains and two cytoplasmic
NBD-binding sites. These membrane proteins (190kD) mediate ATP-dependent unidirectional
efflux of glutathione, glucuronate, or sulfate conjugates of lipophilic drugs. In addition to many
anionic conjugates, a number of unconjugated amphiphilic anions can serve as substrates for
MRPs. There are numerous overlapping substrates between MRP, MATE (multidrug and toxin
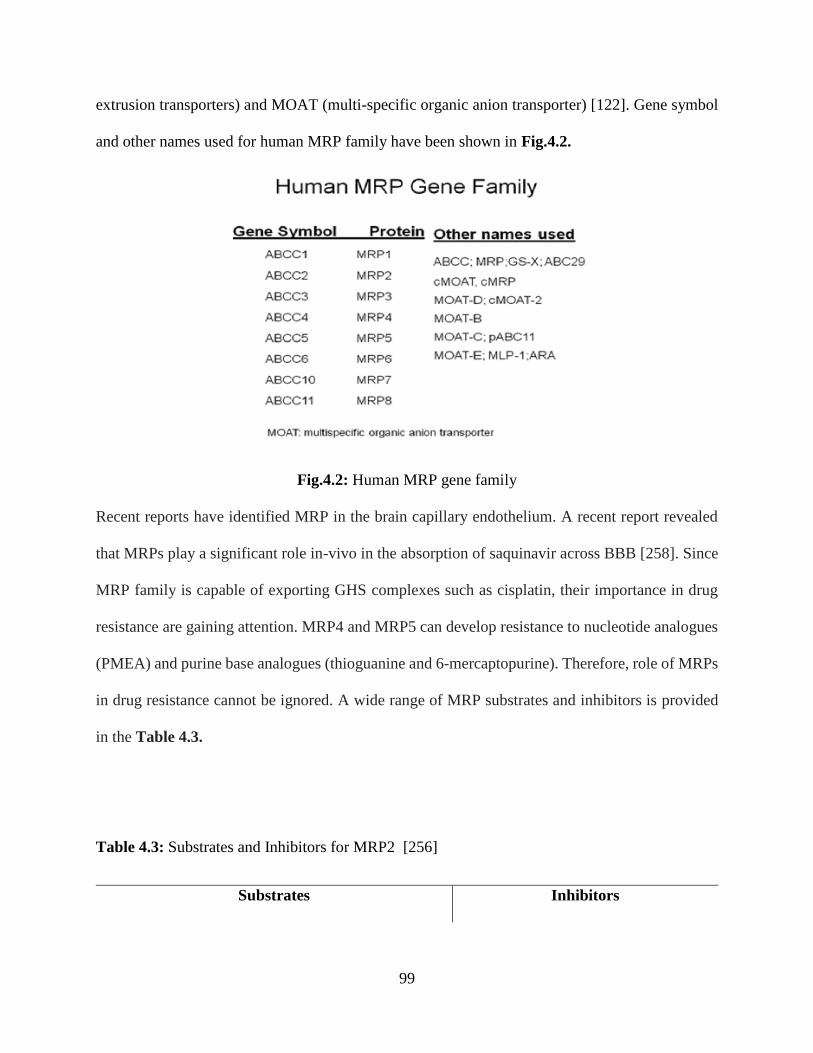
99
extrusion transporters) and MOAT (multi-specific organic anion transporter) [122]. Gene symbol
and other names used for human MRP family have been shown in Fig.4.2.
Fig.4.2: Human MRP gene family
Recent reports have identified MRP in the brain capillary endothelium. A recent report revealed
that MRPs play a significant role in-vivo in the absorption of saquinavir across BBB [258]. Since
MRP family is capable of exporting GHS complexes such as cisplatin, their importance in drug
resistance are gaining attention. MRP4 and MRP5 can develop resistance to nucleotide analogues
(PMEA) and purine base analogues (thioguanine and 6-mercaptopurine). Therefore, role of MRPs
in drug resistance cannot be ignored. A wide range of MRP substrates and inhibitors is provided
in the Table 4.3.
Table 4.3: Substrates and Inhibitors for MRP2 [256]
Substrates Inhibitors
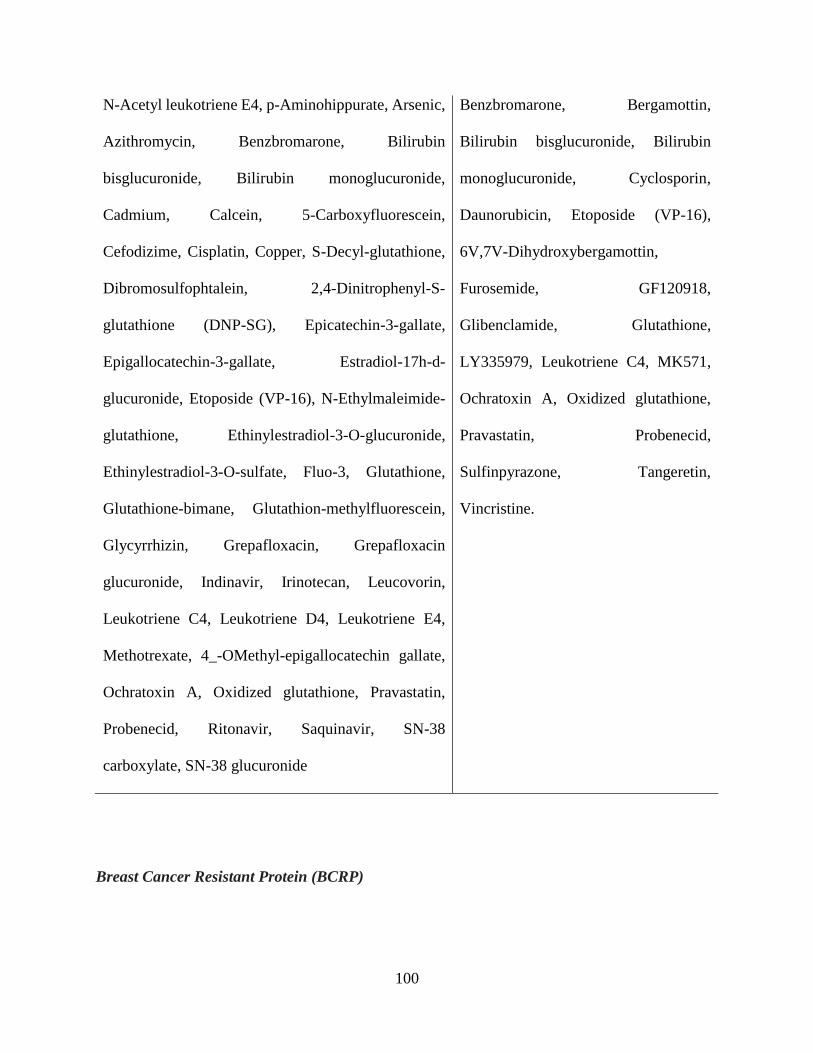
100
N-Acetyl leukotriene E4, p-Aminohippurate, Arsenic,
Azithromycin, Benzbromarone, Bilirubin
bisglucuronide, Bilirubin monoglucuronide,
Cadmium, Calcein, 5-Carboxyfluorescein,
Cefodizime, Cisplatin, Copper, S-Decyl-glutathione,
Dibromosulfophtalein, 2,4-Dinitrophenyl-S-
glutathione (DNP-SG), Epicatechin-3-gallate,
Epigallocatechin-3-gallate, Estradiol-17h-d-
glucuronide, Etoposide (VP-16), N-Ethylmaleimide-
glutathione, Ethinylestradiol-3-O-glucuronide,
Ethinylestradiol-3-O-sulfate, Fluo-3, Glutathione,
Glutathione-bimane, Glutathion-methylfluorescein,
Glycyrrhizin, Grepafloxacin, Grepafloxacin
glucuronide, Indinavir, Irinotecan, Leucovorin,
Leukotriene C4, Leukotriene D4, Leukotriene E4,
Methotrexate, 4_-OMethyl-epigallocatechin gallate,
Ochratoxin A, Oxidized glutathione, Pravastatin,
Probenecid, Ritonavir, Saquinavir, SN-38
carboxylate, SN-38 glucuronide
Benzbromarone, Bergamottin,
Bilirubin bisglucuronide, Bilirubin
monoglucuronide, Cyclosporin,
Daunorubicin, Etoposide (VP-16),
6V,7V-Dihydroxybergamottin,
Furosemide, GF120918,
Glibenclamide, Glutathione,
LY335979, Leukotriene C4, MK571,
Ochratoxin A, Oxidized glutathione,
Pravastatin, Probenecid,
Sulfinpyrazone, Tangeretin,
Vincristine.
Breast Cancer Resistant Protein (BCRP)
101
BCRP belongs to a novel branch, subfamily G, of the large ABC transporter super family.
The founding member of ABCG subfamily, ABCG1 has been implicated in the regulation of
cellular lipid homeostasis in macrophages through facilitating efflux of cellular lipids including
cholesterol and phospholipids. It is also known as mitoxantrone-resistance protein. BCRP is a 72
kD protein, described as a half transporter which contains only six transmembrane domains and
one NBD-binding site. Predicted secondary structures of these drug efflux transporters of the ATP-
binding cassette family are illustrated in the Fig.4.3.
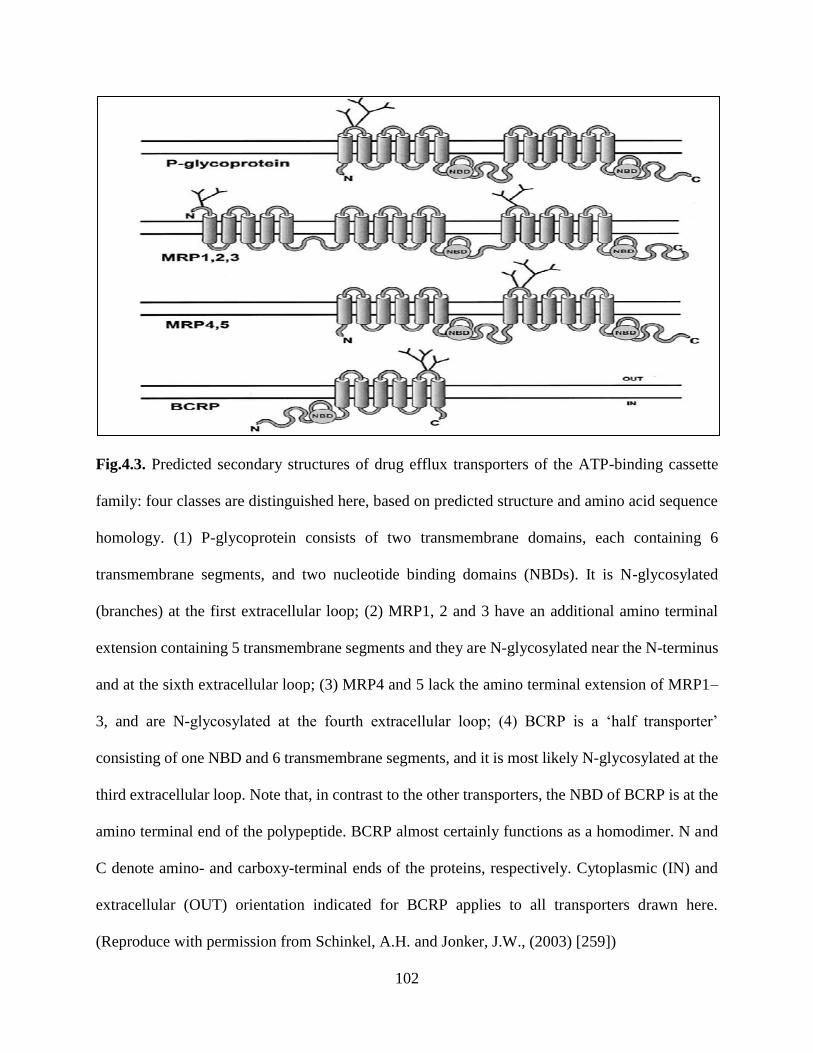
102
Fig.4.3. Predicted secondary structures of drug efflux transporters of the ATP-binding cassette
family: four classes are distinguished here, based on predicted structure and amino acid sequence
homology. (1) P-glycoprotein consists of two transmembrane domains, each containing 6
transmembrane segments, and two nucleotide binding domains (NBDs). It is N-glycosylated
(branches) at the first extracellular loop; (2) MRP1, 2 and 3 have an additional amino terminal
extension containing 5 transmembrane segments and they are N-glycosylated near the N-terminus
and at the sixth extracellular loop; (3) MRP4 and 5 lack the amino terminal extension of MRP1–
3, and are N-glycosylated at the fourth extracellular loop; (4) BCRP is a ‘half transporter’
consisting of one NBD and 6 transmembrane segments, and it is most likely N-glycosylated at the
third extracellular loop. Note that, in contrast to the other transporters, the NBD of BCRP is at the
amino terminal end of the polypeptide. BCRP almost certainly functions as a homodimer. N and
C denote amino- and carboxy-terminal ends of the proteins, respectively. Cytoplasmic (IN) and
extracellular (OUT) orientation indicated for BCRP applies to all transporters drawn here.
(Reproduce with permission from Schinkel, A.H. and Jonker, J.W., (2003) [259])

103
Two features that distinguish the subfamily G members from other ABC transporters are
their unique domain organization. Functional characterization has demonstrated that BCRP can
transport a wide range of substrates ranging from chemotherapeutic agents to organic anion
conjugates. P-gp substrates have a tendency to overlap BCRP but the later includes acids or drug
conjugates (mitoxantrone, methotrexate, topotecan, imatinib, irinotecan, statins, sulphate
conjugates, porphyrins, etc). More evidence is emerging to suggest that BCRP plays a significant
role in drug disposition. Hence, it is important to examine its effect on pharmacokinetics and drug-
drug interactions of therapeutic agents [260-266]. Information regarding various substrates and
inhibitors of BCRP has been depicted in the Table 4.4.
Table 4.4: Substrates and Inhibitors for BCRP [256]
Substrates Inhibitors
Actinomycin D, 9-Aminocamptothecin, 2-Amino-1-
methyl-6-phenylimidazole [4,5-b]pyridine (PhIP),
Azidodeoxythymidine, Bodipy-FLPrazosin, C6-NBD-
phosphatidylcholine, C6-NBD-phosphatidylserine,
Cholesterol, Cimetidine, Daunorubicin,
Dehydroepiandrosterone sulfate, Doxorubicin,
Epirubicin, 17h-Estradiol, 17h-Estradiol-glucuronide,
17h-Estradiol-3-sulfate, Estrone, Estrone-3-sulfate
Acacetin, Apigenin,
Beclomethasone, Biochanin A,
Chrysin, Corticosterone,
Cyclosporin A, Daidzein,
Dehydroepiandrostrone sulfate,
Diethylstilbestrol, Digoxin,
Dexamethasone, Doxorubicin
Genetic Factors In Drug Response
Growing evidence suggests that genetic factors influence inter-individual variation in drug
response. Polymorphism has been indicated to vary with ethnicity. Mutations in genes may lead
to genetic polymorphism. Several reports suggest that inter-individual variability in drug response
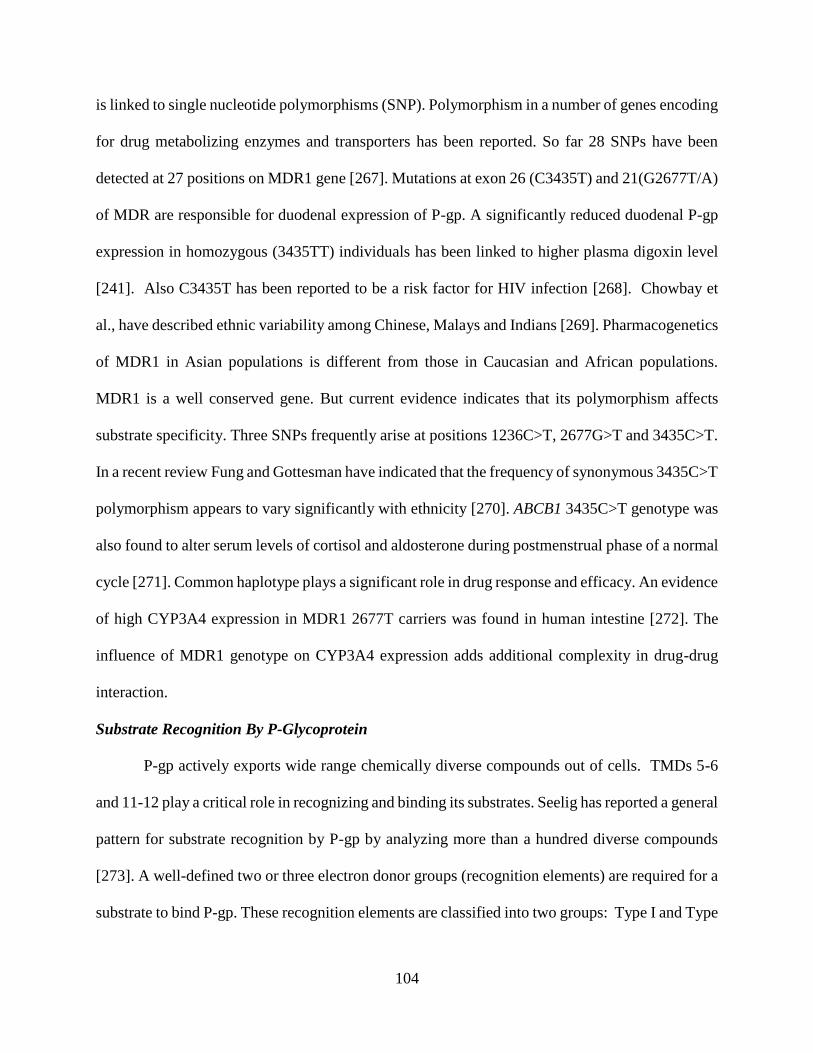
104
is linked to single nucleotide polymorphisms (SNP). Polymorphism in a number of genes encoding
for drug metabolizing enzymes and transporters has been reported. So far 28 SNPs have been
detected at 27 positions on MDR1 gene [267]. Mutations at exon 26 (C3435T) and 21(G2677T/A)
of MDR are responsible for duodenal expression of P-gp. A significantly reduced duodenal P-gp
expression in homozygous (3435TT) individuals has been linked to higher plasma digoxin level
[241]. Also C3435T has been reported to be a risk factor for HIV infection [268]. Chowbay et
al., have described ethnic variability among Chinese, Malays and Indians [269]. Pharmacogenetics
of MDR1 in Asian populations is different from those in Caucasian and African populations.
MDR1 is a well conserved gene. But current evidence indicates that its polymorphism affects
substrate specificity. Three SNPs frequently arise at positions 1236C>T, 2677G>T and 3435C>T.
In a recent review Fung and Gottesman have indicated that the frequency of synonymous 3435C>T
polymorphism appears to vary significantly with ethnicity [270]. ABCB1 3435C>T genotype was
also found to alter serum levels of cortisol and aldosterone during postmenstrual phase of a normal
cycle [271]. Common haplotype plays a significant role in drug response and efficacy. An evidence
of high CYP3A4 expression in MDR1 2677T carriers was found in human intestine [272]. The
influence of MDR1 genotype on CYP3A4 expression adds additional complexity in drug-drug
interaction.
Substrate Recognition By P-Glycoprotein
P-gp actively exports wide range chemically diverse compounds out of cells. TMDs 5-6
and 11-12 play a critical role in recognizing and binding its substrates. Seelig has reported a general
pattern for substrate recognition by P-gp by analyzing more than a hundred diverse compounds
[273]. A well-defined two or three electron donor groups (recognition elements) are required for a
substrate to bind P-gp. These recognition elements are classified into two groups: Type I and Type

105
II. Type I units compose of two electron donor groups with a spatial separation of 2.5 ± 0.3 Ǻ
whereas type II units either consist of two or three electron donor groups with a spatial separation
of 4.6 ± 0.6 Ǻ. Accordingly, if a compound contains at least type I or type II unit is expected to
be recognized by P-gp. On the basis of the type and number of recognition elements, various
compounds can be classified as non-substrate, weak substrate or strong substrate. The structural
elements responsible for a substrate-P-gp interaction reside in specific hydrogen bonding acceptor
units. P-gp-substrate binding and its over-expression enhance with the number and strength of
hydrogen bonding acceptor units [273].
Substrate And Inhibitor Selectivity
P-gp mediated efflux of substrates or therapeutic agents plays a major role in drug
disposition across biological barrier. Apart from cancer cells, P-gp is expressed in many organs
such as the intestine, liver, kidney, eye and brain [274]. It has been proven that the oral absorption
and brain penetration of P-gp substrates are significantly enhanced in mdr1 knockout mice
compared to normal mice [275]. The oral bioavailability and brain permeability of P-gp substrates
can be significantly enhanced by co-administration of P-gp modulators [276, 277]. Both biliary
excretion and renal clearance are significantly reduced in the presence of P-gp inhibitors [278,
279]. Now it is well accepted that appropriate P-gp inhibitors should be co-administrated with P-
gp substrates for therapeutic effectiveness. The activity of P-gp mediated efflux is a saturable
process. This is a complex area of drug-drug or drug-inhibitor interactions. Such interactions can
give rise to competitive inhibition, noncompetitive inhibition, and cooperative simulation [224].
These interactions can take place either at the P-gp binding site or at ATP binding domains. There
is more than one P-gp binding locations. The exact numbers of P-gp binding locations are yet to
be confirmed. However, P-gp substrates and inhibitors can bind at different locations. In general,

106
the substrate binding site and the two ATP-binding domains act together to operate efflux pump.
Therefore, inhibition of P-gp mediated drug efflux could potentially take place either due to the
contest of P-gp-binding site and ATP-binding domains or due to blockage of ATP hydrolysis.
Strategies To Overcome Active Efflux
As we mentioned that MDR mediated efflux poses a major impediment for successful drug
delivery. Hence strategies to overcome efflux proteins are warranted. We have briefly discussed
the recent developments and research strategies to circumvent MDR mediated efflux.
Pharmacological Inhibition Of Efflux Proteins
Co-administration of chemical agents that can inhibit the activity of efflux proteins by
either competitive or non-competitive binding appears to be an attractive strategy to avoid drug
efflux. An ideal efflux modulator can inhibit the activity of efflux pumps at the apical membrane
and subsequently enhance permeability of drug molecule in desired tissues. A schematic of this
mechanism is depicted in Fig.4.4
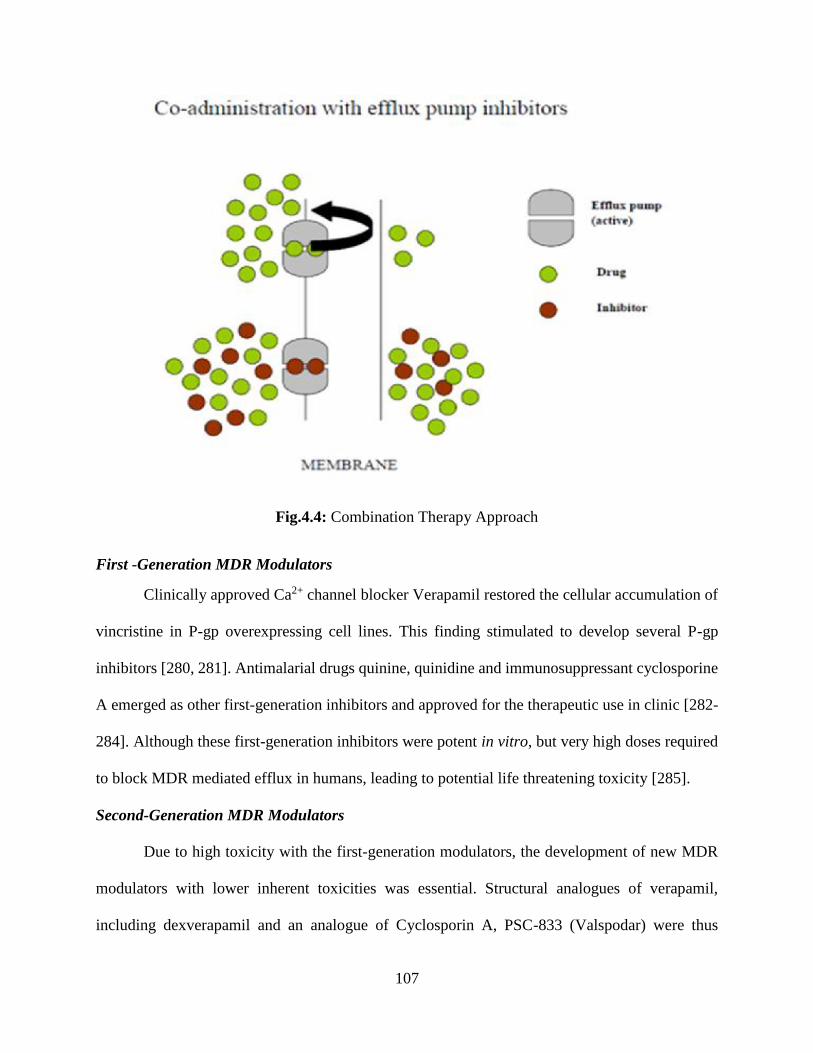
107
Fig.4.4: Combination Therapy Approach
First -Generation MDR Modulators
Clinically approved Ca2+ channel blocker Verapamil restored the cellular accumulation of
vincristine in P-gp overexpressing cell lines. This finding stimulated to develop several P-gp
inhibitors [280, 281]. Antimalarial drugs quinine, quinidine and immunosuppressant cyclosporine
A emerged as other first-generation inhibitors and approved for the therapeutic use in clinic [282-
284]. Although these first-generation inhibitors were potent in vitro, but very high doses required
to block MDR mediated efflux in humans, leading to potential life threatening toxicity [285].
Second-Generation MDR Modulators
Due to high toxicity with the first-generation modulators, the development of new MDR
modulators with lower inherent toxicities was essential. Structural analogues of verapamil,
including dexverapamil and an analogue of Cyclosporin A, PSC-833 (Valspodar) were thus
108
developed as second-generation modulators [286, 287]. However, these compounds appeared to
alter the pharmacokinetic properties of co-administered anticancer drugs, such as paclitaxel, and
doxorubicin, producing dose dependent haematological side effects [288, 289]. This altered
pharmacokinetic profile of co-administered drugs, and caused nonspecific interactions with CYP
enzymes [290]. As a consequence, the dose adjustment of anticancer drugs appeared imminent to
prevent adverse outcome of the therapy.
Third Generation MDR Modulators
These agents were designed to overcome the limitations of these previous modulators.
These new set of efflux modulators are highly specific for MDR efflux pumps sparing any
interaction with drug metabolizing (CYP-450) enzymes and do not alter pharmacokinetic
interaction with other therapeutic agents. For example, zosuquidar [291], tariquidar [292]and
elacridar [293]are the MDR inhibitors that have shown promise in pre-clinical mouse model and
more recently in the clinic. Zosuquidar and tariquidar are specific inhibitors of P-gp. A non-
competitive inhibitory mechanism has been suggested since these are neither substrates for P-gp
and nor be transported by the ABC transporter [294]. Preclinical studies using such inhibitors with
anticancer drugs showed significantly prolonged survival and reduction of MDR-bearing human
tumours engrafted in mice [294]. No alterations in pharmacokinetic parameters of anticancer drugs
such as doxorubicin, etoposide, daunorubicin, vincristine and paclitaxel have been demonstrated
upon such co-administrations. Various Phase1 and phase II studies have been conducted upon co-
administration of zosuquidar with docetaxel and Daunorubicin and doxorubicin for the treatment
of breast cancer, leukaemia and non-Hodgkin’s lymphoma [295-298]. Elacridar is a dual inhibitor
of P-gp and BCRP. Co-administration of elacridar has been reported to increase the oral
109
bioavailability of topotecan in patients [299]. Pre-clinical studies suggest effective reversal of
chemo-resistance upon co-administration of elacridar [300].
Herbal Modulation Of MDR Efflux Proteins
Flavonoids such as chalcones, flavonols, flavones, procyanidins, flavan-3-ols (catechins),
flavanones, and isoflavones are the major constituents among numerous other constituents of many
naturally occurring herbal products in the market. There have been well documented reports in the
literature suggesting their interactions with efflux transporters particularly P-gp [247]. To name a
few, St.john’s wort, garlic, ginseng and grapefruit juice are well known as over the counter herbal
products as dietary supplements, and medications. Both in preclinical and clinical settings these
products have been shown to interact with drugs that are substrates for P-gp. These herbal
ingredients can either inhibit the ATPase activity of efflux pumps or act as competitive inhibitors
for other drug molecules. Patel et al demonstrated that P-gp mediated efflux of ritonavir was
greatly reduced by quercetin in Caco-2 cells and MDCKII-MDR1 cells [301]. Similarly,
intracellular accumulation of daunomycin was greatly enhanced in P-gp over-expressing K562
cells, with co-administration of various flavonoids [302]. Similar interactions of herbal products
with other efflux transporters such as MRP2 and BCRP have also been reported in the literature.
Flavonols such as myricetin and robinetin were shown to inhibit MRP2 mediated efflux of calcein
in MRP2-over expressing MDCKII cells [303]. Zhang et al. showed that chrysin, biochanin A and
7,8-benzoflavone, were the most potent flavonoids for inhibiting the efflux of mitoxantrone among
25 naturally occurring flavonoids tested in MCF-7 cells overexpressing BCRP [304, 305].
Likewise, genistein and naringenin were shown to reverse BCRP-mediated resistance [306].
Although exact mechanism of P-gp-mediated drug-drug interaction during co-
administration of modulators and substrates yet to be comprehended, it appears that substrate
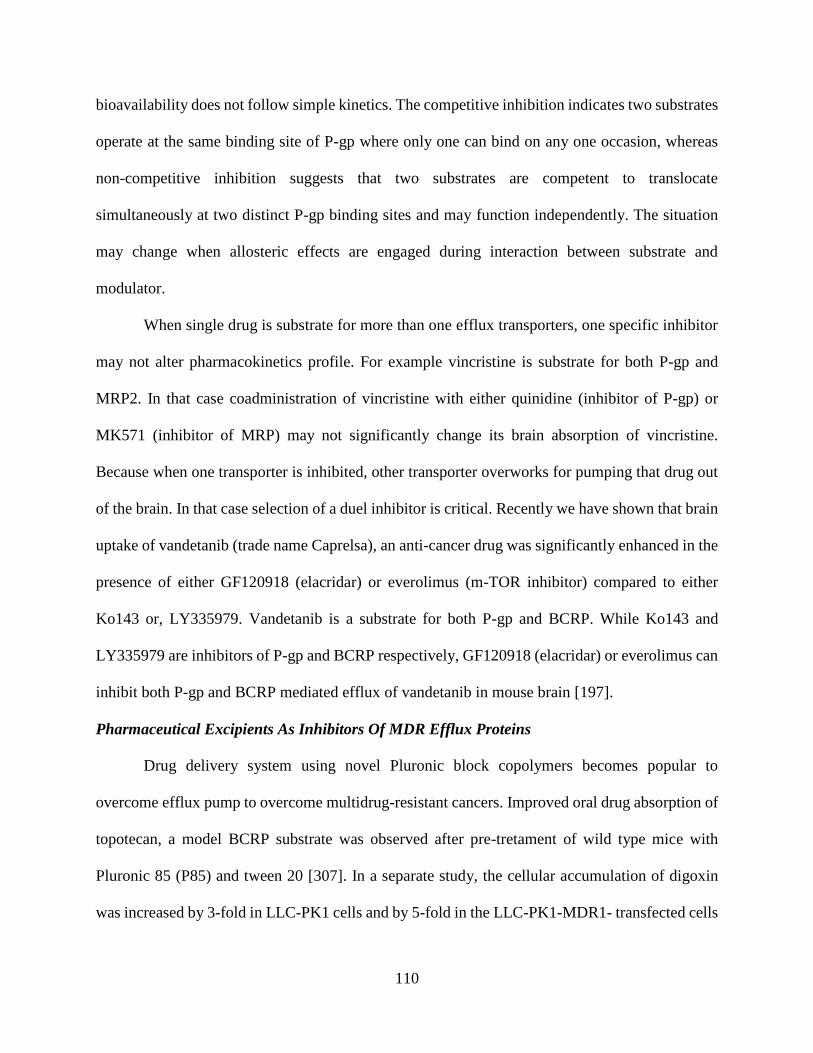
110
bioavailability does not follow simple kinetics. The competitive inhibition indicates two substrates
operate at the same binding site of P-gp where only one can bind on any one occasion, whereas
non-competitive inhibition suggests that two substrates are competent to translocate
simultaneously at two distinct P-gp binding sites and may function independently. The situation
may change when allosteric effects are engaged during interaction between substrate and
modulator.
When single drug is substrate for more than one efflux transporters, one specific inhibitor
may not alter pharmacokinetics profile. For example vincristine is substrate for both P-gp and
MRP2. In that case coadministration of vincristine with either quinidine (inhibitor of P-gp) or
MK571 (inhibitor of MRP) may not significantly change its brain absorption of vincristine.
Because when one transporter is inhibited, other transporter overworks for pumping that drug out
of the brain. In that case selection of a duel inhibitor is critical. Recently we have shown that brain
uptake of vandetanib (trade name Caprelsa), an anti-cancer drug was significantly enhanced in the
presence of either GF120918 (elacridar) or everolimus (m-TOR inhibitor) compared to either
Ko143 or, LY335979. Vandetanib is a substrate for both P-gp and BCRP. While Ko143 and
LY335979 are inhibitors of P-gp and BCRP respectively, GF120918 (elacridar) or everolimus can
inhibit both P-gp and BCRP mediated efflux of vandetanib in mouse brain [197].
Pharmaceutical Excipients As Inhibitors Of MDR Efflux Proteins
Drug delivery system using novel Pluronic block copolymers becomes popular to
overcome efflux pump to overcome multidrug-resistant cancers. Improved oral drug absorption of
topotecan, a model BCRP substrate was observed after pre-tretament of wild type mice with
Pluronic 85 (P85) and tween 20 [307]. In a separate study, the cellular accumulation of digoxin
was increased by 3-fold in LLC-PK1 cells and by 5-fold in the LLC-PK1-MDR1- transfected cells
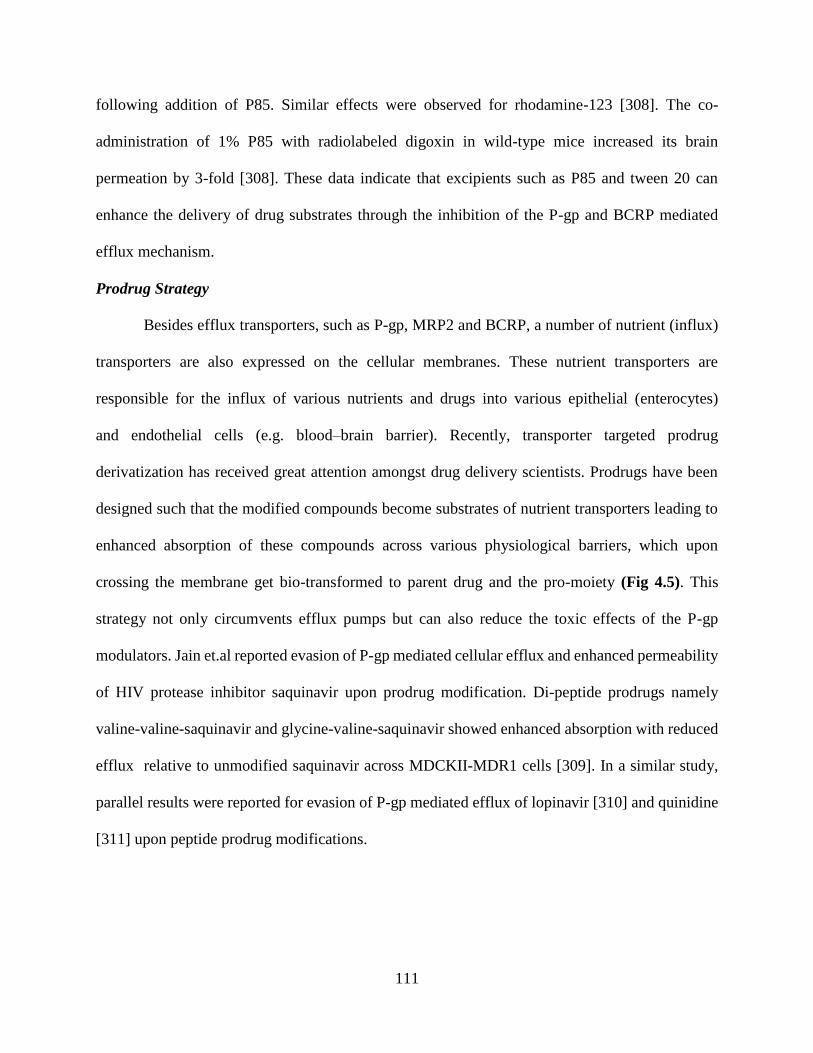
111
following addition of P85. Similar effects were observed for rhodamine-123 [308]. The co-
administration of 1% P85 with radiolabeled digoxin in wild-type mice increased its brain
permeation by 3-fold [308]. These data indicate that excipients such as P85 and tween 20 can
enhance the delivery of drug substrates through the inhibition of the P-gp and BCRP mediated
efflux mechanism.
Prodrug Strategy
Besides efflux transporters, such as P-gp, MRP2 and BCRP, a number of nutrient (influx)
transporters are also expressed on the cellular membranes. These nutrient transporters are
responsible for the influx of various nutrients and drugs into various epithelial (enterocytes)
and endothelial cells (e.g. blood–brain barrier). Recently, transporter targeted prodrug
derivatization has received great attention amongst drug delivery scientists. Prodrugs have been
designed such that the modified compounds become substrates of nutrient transporters leading to
enhanced absorption of these compounds across various physiological barriers, which upon
crossing the membrane get bio-transformed to parent drug and the pro-moiety (Fig 4.5). This
strategy not only circumvents efflux pumps but can also reduce the toxic effects of the P-gp
modulators. Jain et.al reported evasion of P-gp mediated cellular efflux and enhanced permeability
of HIV protease inhibitor saquinavir upon prodrug modification. Di-peptide prodrugs namely
valine-valine-saquinavir and glycine-valine-saquinavir showed enhanced absorption with reduced
efflux relative to unmodified saquinavir across MDCKII-MDR1 cells [309]. In a similar study,
parallel results were reported for evasion of P-gp mediated efflux of lopinavir [310] and quinidine
[311] upon peptide prodrug modifications.
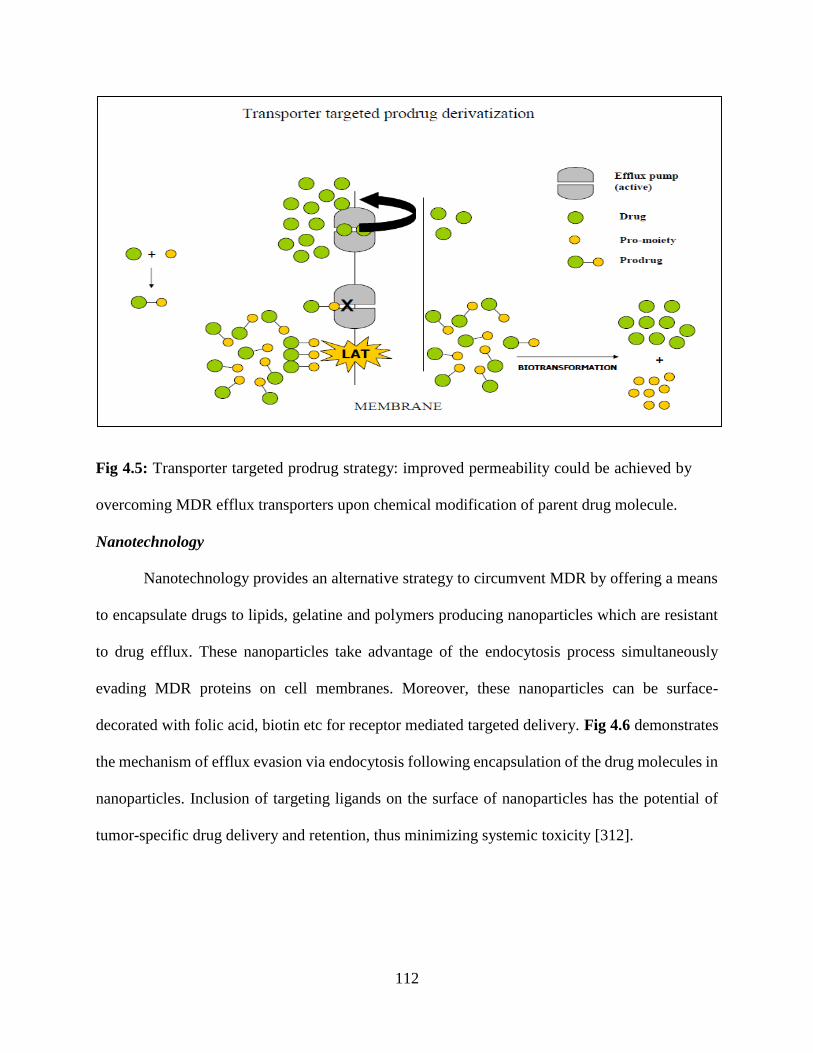
112
Fig 4.5: Transporter targeted prodrug strategy: improved permeability could be achieved by
overcoming MDR efflux transporters upon chemical modification of parent drug molecule.
Nanotechnology
Nanotechnology provides an alternative strategy to circumvent MDR by offering a means
to encapsulate drugs to lipids, gelatine and polymers producing nanoparticles which are resistant
to drug efflux. These nanoparticles take advantage of the endocytosis process simultaneously
evading MDR proteins on cell membranes. Moreover, these nanoparticles can be surface-
decorated with folic acid, biotin etc for receptor mediated targeted delivery. Fig 4.6 demonstrates
the mechanism of efflux evasion via endocytosis following encapsulation of the drug molecules in
nanoparticles. Inclusion of targeting ligands on the surface of nanoparticles has the potential of
tumor-specific drug delivery and retention, thus minimizing systemic toxicity [312].
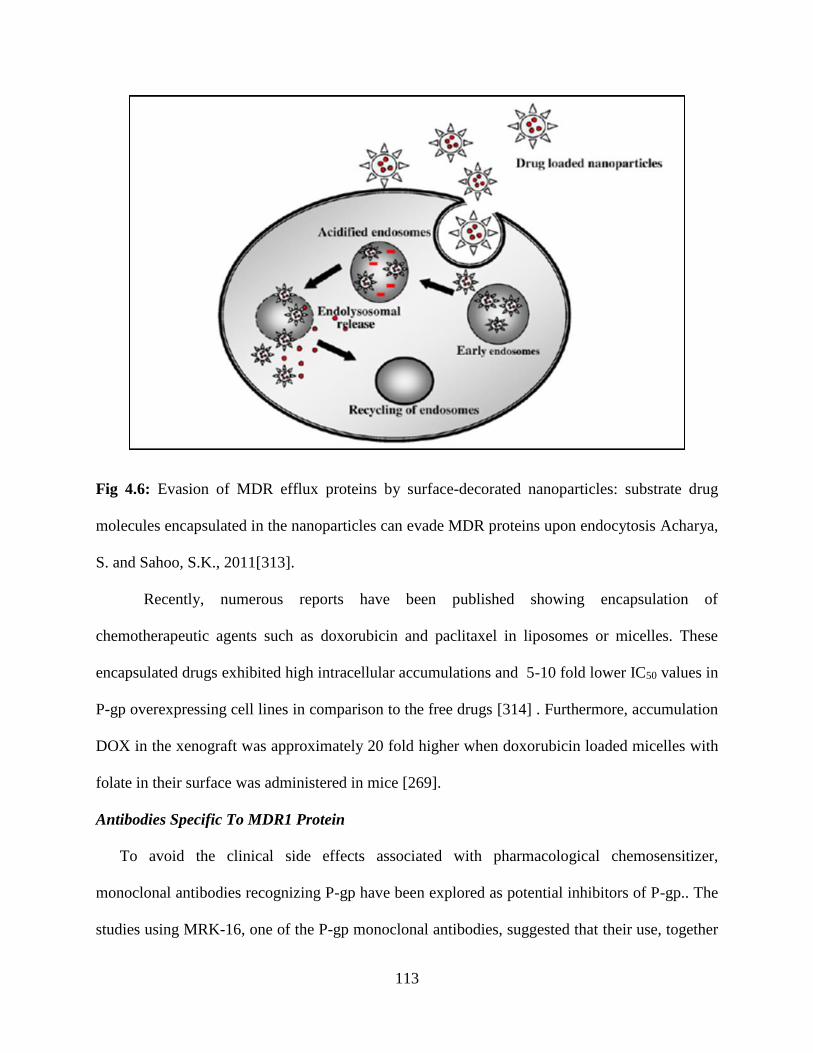
113
Fig 4.6: Evasion of MDR efflux proteins by surface-decorated nanoparticles: substrate drug
molecules encapsulated in the nanoparticles can evade MDR proteins upon endocytosis Acharya,
S. and Sahoo, S.K., 2011[313].
Recently, numerous reports have been published showing encapsulation of
chemotherapeutic agents such as doxorubicin and paclitaxel in liposomes or micelles. These
encapsulated drugs exhibited high intracellular accumulations and 5-10 fold lower IC50 values in
P-gp overexpressing cell lines in comparison to the free drugs [314] . Furthermore, accumulation
DOX in the xenograft was approximately 20 fold higher when doxorubicin loaded micelles with
folate in their surface was administered in mice [269].
Antibodies Specific To MDR1 Protein
To avoid the clinical side effects associated with pharmacological chemosensitizer,
monoclonal antibodies recognizing P-gp have been explored as potential inhibitors of P-gp.. The
studies using MRK-16, one of the P-gp monoclonal antibodies, suggested that their use, together
114
with MDR-related cytotoxic drugs with or without chemosensitizer, may have a potential effect as
an anti-MDR therapy [315, 316]. Besides MRK-16, another monoclonal antibody UIC2 that
targets extracellular domain of P-gp has been characterized [252]. However, an effective delivery
of these large molecular weight monoclonal antibodies is a challenging task. To overcome this
issue recombinant DNA technology can be exercised to isolate new recombinant scFv antibodies
which have much smaller molecular weight with desired specificity and affinity directed toward a
large array of antigens such as MDR1 protein. Haus-Cohen et al. isolated and characterized such
recombinant scFv fragment capable of disrupting P-gp efflux activity thereby reversing the MDR
phenotype of drug-resistant human tumor cell lines [317].
Influx Transporters
Influx transporters are integral plasma membrane proteins that control the influx of
essential nutrients and ions. The presence of these transporters has been reported on various tissues
and cell lines. These proteins play an important role in drug delivery. These influx transporters
belong to SLC (solute carrier) transporter family. These include carriers for peptides, vitamins,
organic anions, organic cations, glucose and other nutrients. These transporters are involved in
pharmacokinetic and pharmacodynamic pathways of drug molecule. A number of drug molecules
are modified chemically in order to achieve desired lipophilicity and solubility which will
ultimately improve drug bioavailability. Designing a transporter targeted drug can be considered
as a rational approach for improving drug bioavailability. These modified drugs are often called
‘prodrugs’ that are designed to target influx transporters. In this part, we will be discussing about
the influx transporters that can be exploited as molecular targets for tissue-selective drug delivery
which may reduce systemic toxicity [318, 319]
115
Peptide Transporters
The cellular intake of dipeptides and tripeptides along with other peptidomimetics is
mediated by peptide transporters. In mammals two peptide transporters have been identified,
peptide transporter 1 (PEPT1, SLC15A1) and peptide transporter 2 (PEPT2, SLC15A2). PEPT1
and PEPT2 share similar topology and consist of 708 and 709 amino acid residues, respectively.
Apart from the intestine PEPT is present in many tissues such colon, kidney, liver, lung, mammary
gland, pancreas, eye and CNS (Table 4.5). Various drugs and prodrugs are substrates for peptide
transporters like β – lactam antibiotics (cefadroxil, cefime, cefadrine, cycleacilin and ceftibuten),
angiotensin converting enzyme (ACE) inhibitors (captopril, enalapril and fosinopril),
aminopeptidase inhibitors (bestatin), and prodrugs & non – peptidic compounds (L- DOPA and
valacyclovir) (Table 4.6) [320]. Drug molecules can be chemically modified by introducing
structural fragments (valyl, leucyl, isoleucyl or glycine residues) for the recognition by peptide
transporters. Such strategy has been successfully employed to nucleoside drugs such as acyclovir
[321-323], ganciclovir [321, 324], azidothymidine [321, 325], floxuridine [321, 326], HIV
protease inhibitors [310, 321] and L-DOPA [321, 327, 328] resulting in a significant improvement
of oral absorption of these drugs by making use of the peptide transporter pathways [321]. In order
to exert their pharmacological activity, these peptide prodrugs are metabolized by peptidase to
release the free active drugs required for desired therapeutic effects.
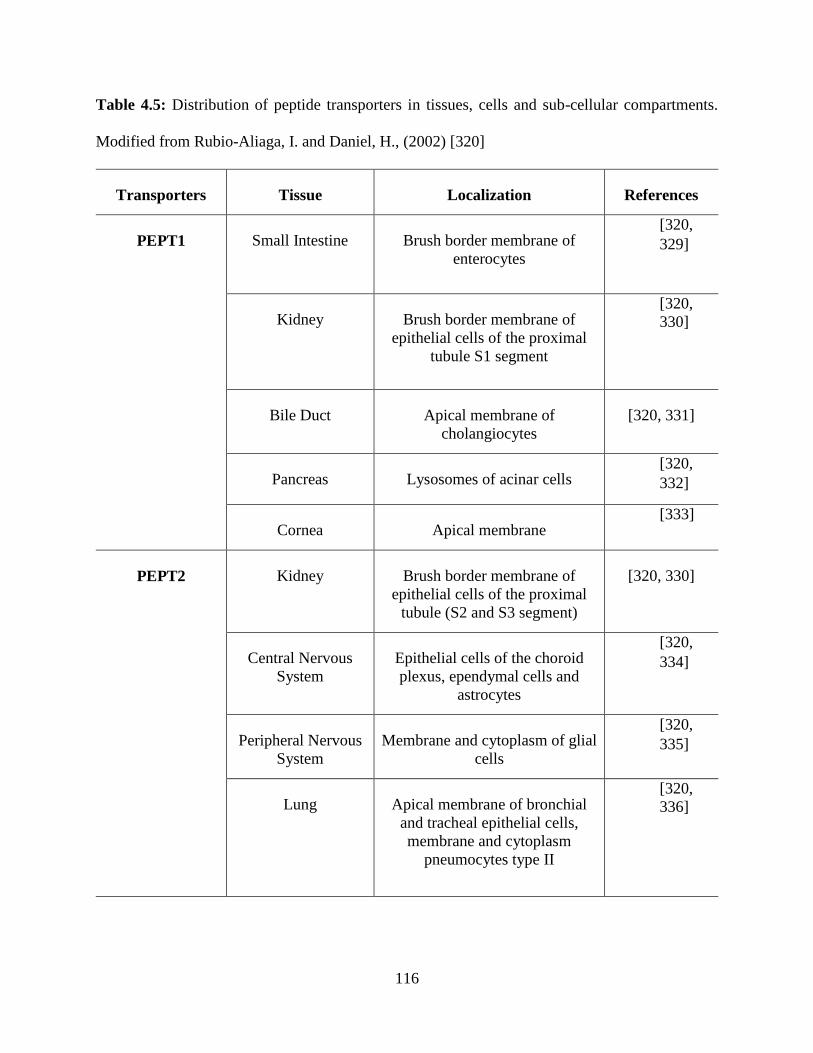
116
Table 4.5: Distribution of peptide transporters in tissues, cells and sub-cellular compartments.
Modified from Rubio-Aliaga, I. and Daniel, H., (2002) [320]
Transporters Tissue Localization References
PEPT1
Small Intestine Brush border membrane of
enterocytes
[320,
329]
Kidney Brush border membrane of
epithelial cells of the proximal
tubule S1 segment
[320,
330]
Bile Duct Apical membrane of
cholangiocytes
[320, 331]
Pancreas Lysosomes of acinar cells [320,
332]
Cornea Apical membrane [333]
PEPT2
Kidney Brush border membrane of
epithelial cells of the proximal
tubule (S2 and S3 segment)
[320, 330]
Central Nervous
System
Epithelial cells of the choroid
plexus, ependymal cells and
astrocytes
[320,
334]
Peripheral Nervous
System
Membrane and cytoplasm of glial
cells
[320,
335]
Lung Apical membrane of bronchial
and tracheal epithelial cells,
membrane and cytoplasm
pneumocytes type II
[320,
336]
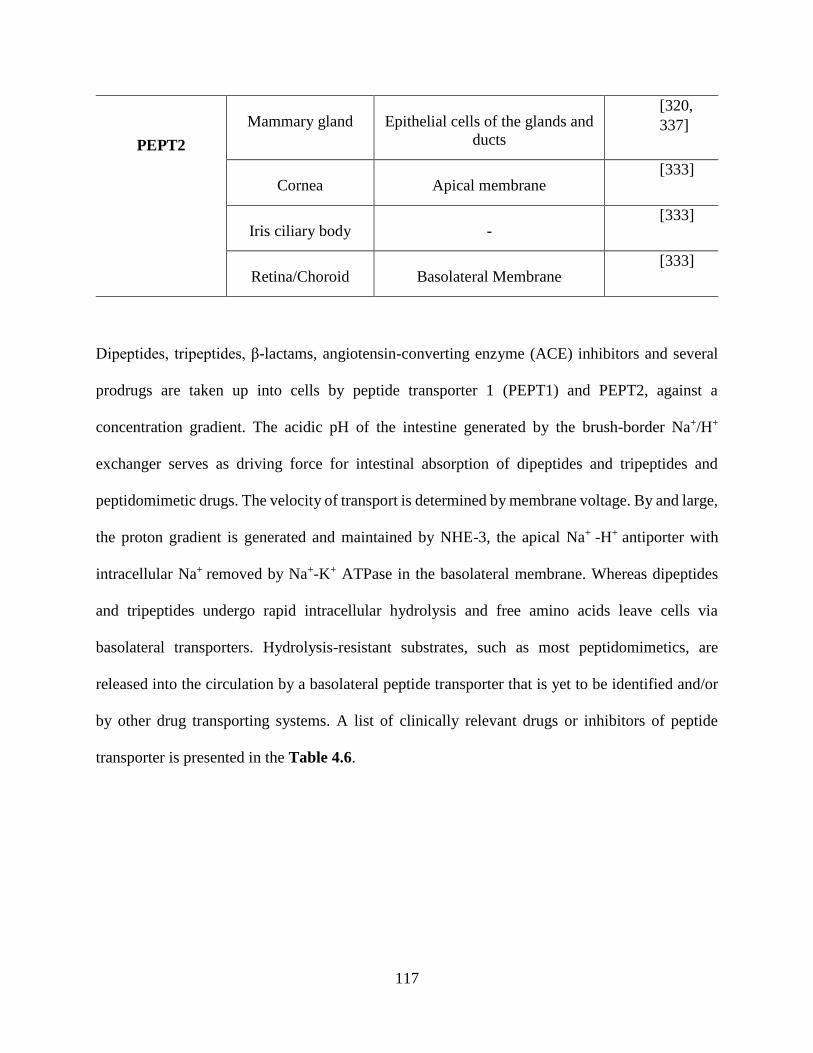
117
PEPT2
Mammary gland Epithelial cells of the glands and
ducts
[320,
337]
Cornea Apical membrane [333]
Iris ciliary body - [333]
Retina/Choroid Basolateral Membrane [333]
Dipeptides, tripeptides, β-lactams, angiotensin-converting enzyme (ACE) inhibitors and several
prodrugs are taken up into cells by peptide transporter 1 (PEPT1) and PEPT2, against a
concentration gradient. The acidic pH of the intestine generated by the brush-border Na+/H+
exchanger serves as driving force for intestinal absorption of dipeptides and tripeptides and
peptidomimetic drugs. The velocity of transport is determined by membrane voltage. By and large,
the proton gradient is generated and maintained by NHE-3, the apical Na+ -H+ antiporter with
intracellular Na+ removed by Na+-K+ ATPase in the basolateral membrane. Whereas dipeptides
and tripeptides undergo rapid intracellular hydrolysis and free amino acids leave cells via
basolateral transporters. Hydrolysis-resistant substrates, such as most peptidomimetics, are
released into the circulation by a basolateral peptide transporter that is yet to be identified and/or
by other drug transporting systems. A list of clinically relevant drugs or inhibitors of peptide
transporter is presented in the Table 4.6.
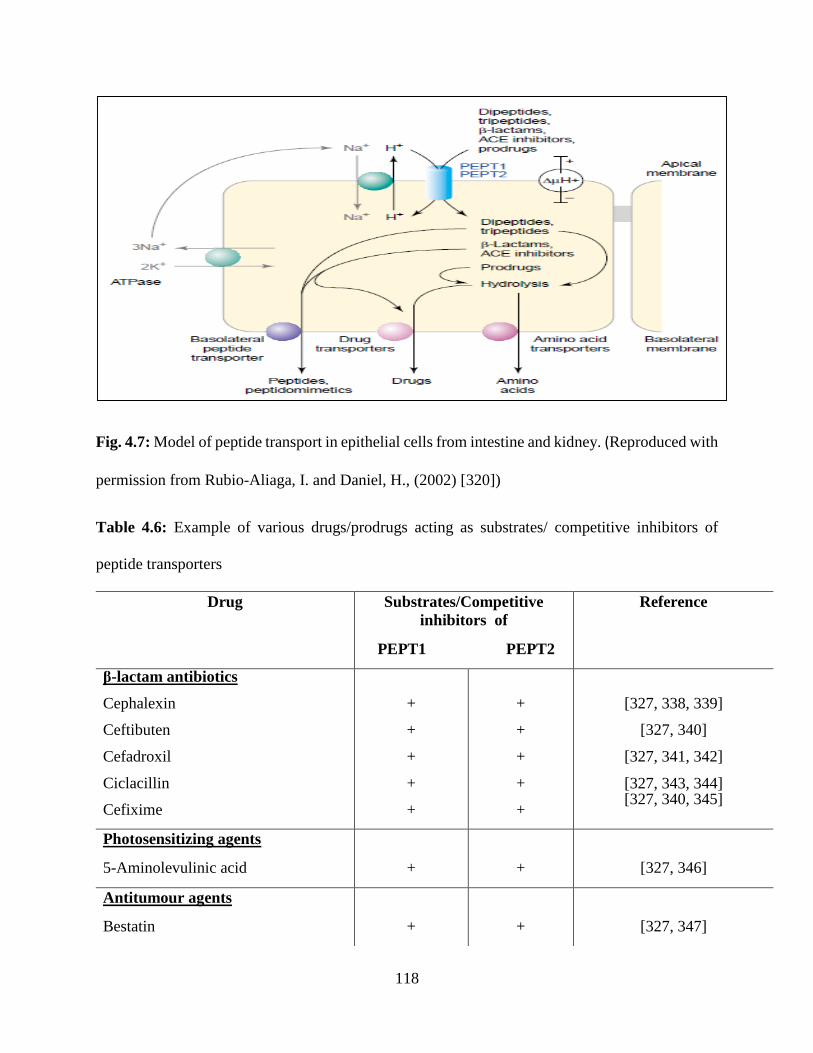
118
Fig. 4.7: Model of peptide transport in epithelial cells from intestine and kidney. (Reproduced with
permission from Rubio-Aliaga, I. and Daniel, H., (2002) [320])
Table 4.6: Example of various drugs/prodrugs acting as substrates/ competitive inhibitors of
peptide transporters
Drug Substrates/Competitive
inhibitors of
PEPT1 PEPT2
Reference
β-lactam antibiotics
Cephalexin
Ceftibuten
Cefadroxil
Ciclacillin
Cefixime
+
+
+
+
+
+
+
+
+
+
[327, 338, 339]
[327, 340]
[327, 341, 342]
[327, 343, 344] [327, 340, 345]
Photosensitizing agents
5-Aminolevulinic acid
+
+
[327, 346]
Antitumour agents
Bestatin
+
+
[327, 347]
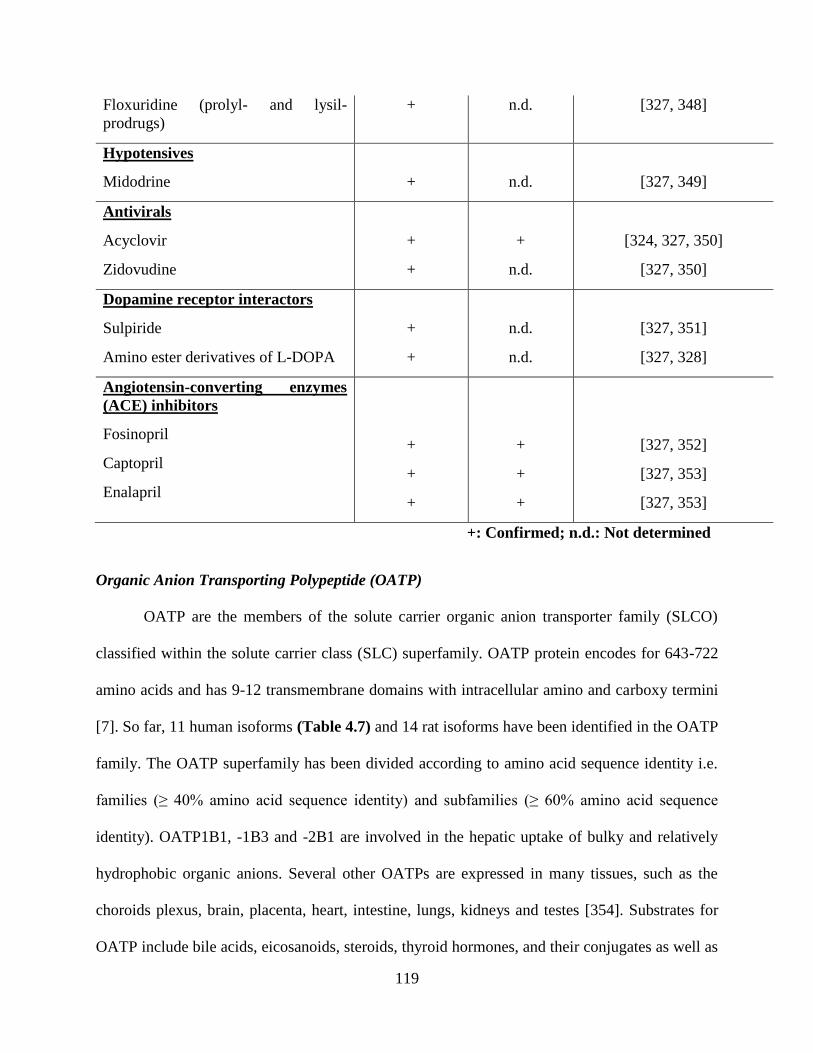
119
Floxuridine (prolyl- and lysil-
prodrugs)
+ n.d. [327, 348]
Hypotensives
Midodrine
+
n.d.
[327, 349]
Antivirals
Acyclovir
Zidovudine
+
+
+
n.d.
[324, 327, 350]
[327, 350]
Dopamine receptor interactors
Sulpiride
Amino ester derivatives of L-DOPA
+
+
n.d.
n.d.
[327, 351]
[327, 328]
Angiotensin-converting enzymes
(ACE) inhibitors
Fosinopril
Captopril
Enalapril
+
+
+
+
+
+
[327, 352]
[327, 353]
[327, 353]
+: Confirmed; n.d.: Not determined
Organic Anion Transporting Polypeptide (OATP)
OATP are the members of the solute carrier organic anion transporter family (SLCO)
classified within the solute carrier class (SLC) superfamily. OATP protein encodes for 643-722
amino acids and has 9-12 transmembrane domains with intracellular amino and carboxy termini
[7]. So far, 11 human isoforms (Table 4.7) and 14 rat isoforms have been identified in the OATP
family. The OATP superfamily has been divided according to amino acid sequence identity i.e.
families (≥ 40% amino acid sequence identity) and subfamilies (≥ 60% amino acid sequence
identity). OATP1B1, -1B3 and -2B1 are involved in the hepatic uptake of bulky and relatively
hydrophobic organic anions. Several other OATPs are expressed in many tissues, such as the
choroids plexus, brain, placenta, heart, intestine, lungs, kidneys and testes [354]. Substrates for
OATP include bile acids, eicosanoids, steroids, thyroid hormones, and their conjugates as well as
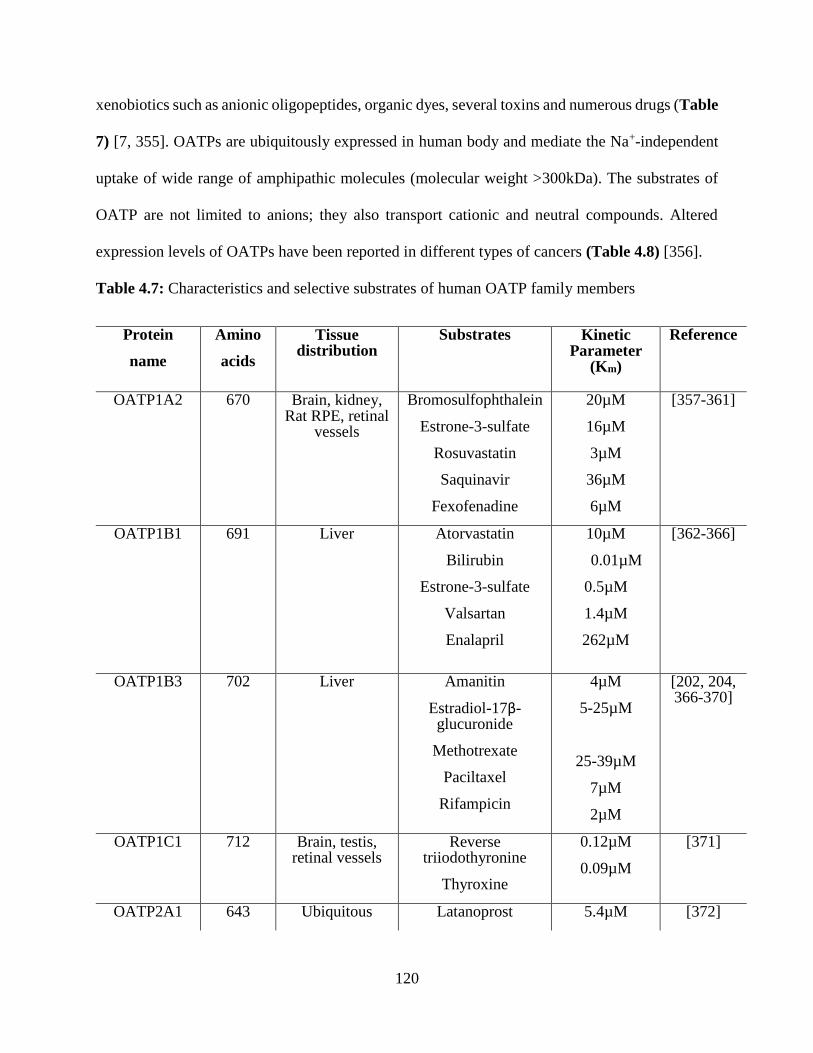
120
xenobiotics such as anionic oligopeptides, organic dyes, several toxins and numerous drugs (Table
7) [7, 355]. OATPs are ubiquitously expressed in human body and mediate the Na+-independent
uptake of wide range of amphipathic molecules (molecular weight >300kDa). The substrates of
OATP are not limited to anions; they also transport cationic and neutral compounds. Altered
expression levels of OATPs have been reported in different types of cancers (Table 4.8) [356].
Table 4.7: Characteristics and selective substrates of human OATP family members
Protein
name
Amino
acids
Tissue distribution
Substrates Kinetic Parameter
(Km)
Reference
OATP1A2 670 Brain, kidney, Rat RPE, retinal
vessels
Bromosulfophthalein
Estrone-3-sulfate
Rosuvastatin
Saquinavir
Fexofenadine
20µM
16µM
3µM
36µM
6µM
[357-361]
OATP1B1
691
Liver
Atorvastatin
Bilirubin
Estrone-3-sulfate
Valsartan
Enalapril
10µM
0.01µM
0.5µM
1.4µM
262µM
[362-366]
OATP1B3 702 Liver Amanitin
Estradiol-17β-glucuronide
Methotrexate
Paciltaxel
Rifampicin
4µM
5-25µM
25-39µM
7µM
2µM
[202, 204, 366-370]
OATP1C1 712 Brain, testis, retinal vessels
Reverse triiodothyronine
Thyroxine
0.12µM
0.09µM
[371]
OATP2A1 643 Ubiquitous Latanoprost 5.4µM [372]
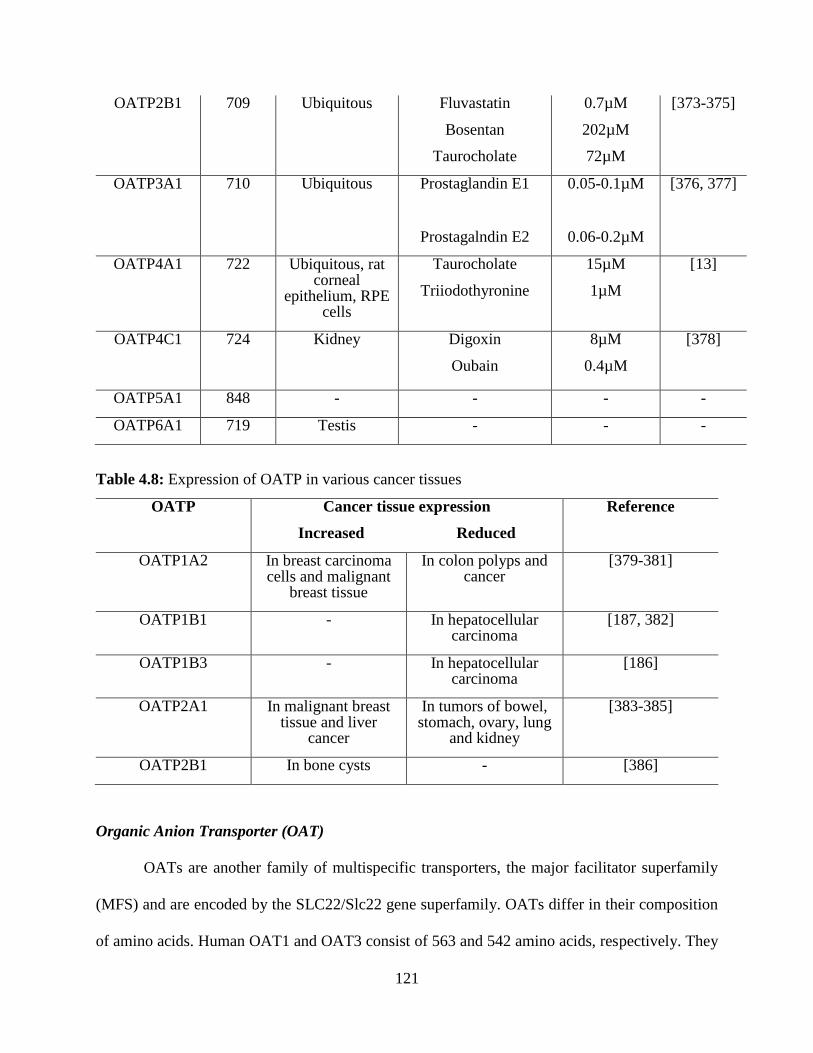
121
OATP2B1 709 Ubiquitous Fluvastatin
Bosentan
Taurocholate
0.7µM
202µM
72µM
[373-375]
OATP3A1 710 Ubiquitous Prostaglandin E1
Prostagalndin E2
0.05-0.1µM
0.06-0.2µM
[376, 377]
OATP4A1 722 Ubiquitous, rat corneal
epithelium, RPE cells
Taurocholate
Triiodothyronine
15µM
1µM
[13]
OATP4C1 724 Kidney Digoxin
Oubain
8µM
0.4µM
[378]
OATP5A1 848 - - - -
OATP6A1 719 Testis - - -
Table 4.8: Expression of OATP in various cancer tissues
OATP Cancer tissue expression
Increased Reduced
Reference
OATP1A2 In breast carcinoma cells and malignant
breast tissue
In colon polyps and cancer
[379-381]
OATP1B1 - In hepatocellular carcinoma
[187, 382]
OATP1B3 - In hepatocellular carcinoma
[186]
OATP2A1 In malignant breast tissue and liver
cancer
In tumors of bowel, stomach, ovary, lung
and kidney
[383-385]
OATP2B1 In bone cysts - [386]
Organic Anion Transporter (OAT)
OATs are another family of multispecific transporters, the major facilitator superfamily
(MFS) and are encoded by the SLC22/Slc22 gene superfamily. OATs differ in their composition
of amino acids. Human OAT1 and OAT3 consist of 563 and 542 amino acids, respectively. They
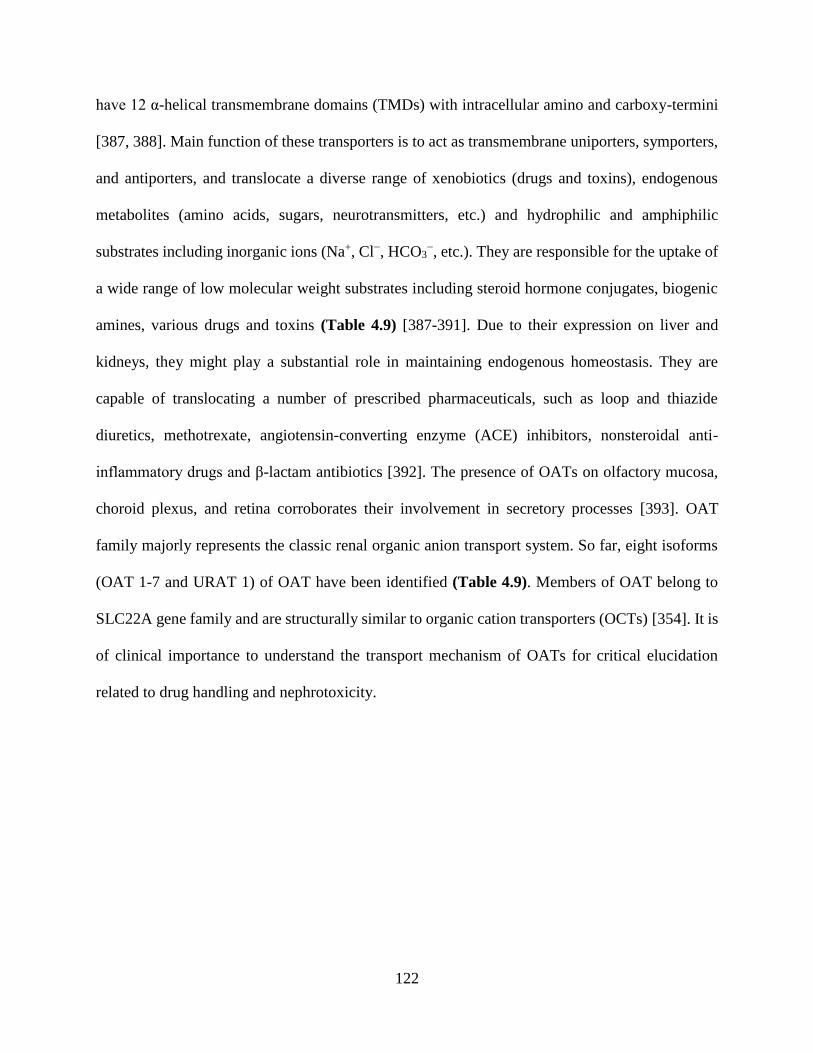
122
have 12 α-helical transmembrane domains (TMDs) with intracellular amino and carboxy-termini
[387, 388]. Main function of these transporters is to act as transmembrane uniporters, symporters,
and antiporters, and translocate a diverse range of xenobiotics (drugs and toxins), endogenous
metabolites (amino acids, sugars, neurotransmitters, etc.) and hydrophilic and amphiphilic
substrates including inorganic ions (Na+, Cl−, HCO3−, etc.). They are responsible for the uptake of
a wide range of low molecular weight substrates including steroid hormone conjugates, biogenic
amines, various drugs and toxins (Table 4.9) [387-391]. Due to their expression on liver and
kidneys, they might play a substantial role in maintaining endogenous homeostasis. They are
capable of translocating a number of prescribed pharmaceuticals, such as loop and thiazide
diuretics, methotrexate, angiotensin-converting enzyme (ACE) inhibitors, nonsteroidal anti-
inflammatory drugs and β-lactam antibiotics [392]. The presence of OATs on olfactory mucosa,
choroid plexus, and retina corroborates their involvement in secretory processes [393]. OAT
family majorly represents the classic renal organic anion transport system. So far, eight isoforms
(OAT 1-7 and URAT 1) of OAT have been identified (Table 4.9). Members of OAT belong to
SLC22A gene family and are structurally similar to organic cation transporters (OCTs) [354]. It is
of clinical importance to understand the transport mechanism of OATs for critical elucidation
related to drug handling and nephrotoxicity.
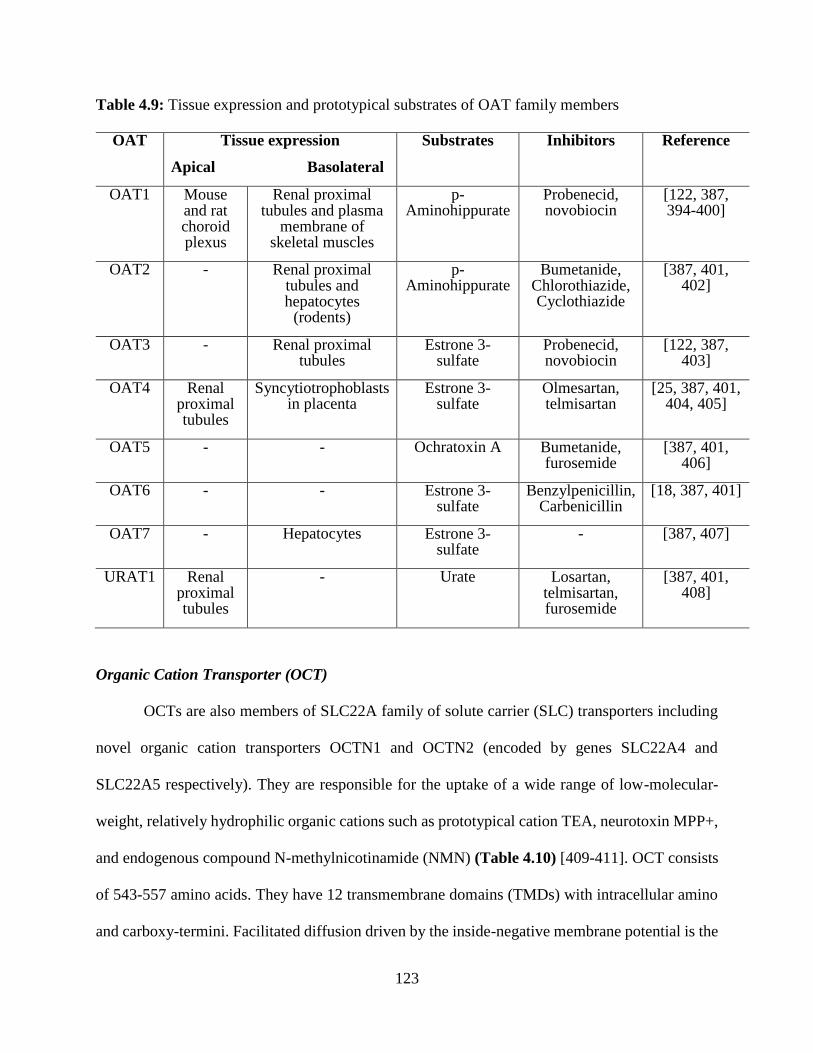
123
Table 4.9: Tissue expression and prototypical substrates of OAT family members
OAT Tissue expression
Apical Basolateral
Substrates Inhibitors Reference
OAT1 Mouse and rat choroid plexus
Renal proximal tubules and plasma
membrane of skeletal muscles
p-Aminohippurate
Probenecid, novobiocin
[122, 387, 394-400]
OAT2 - Renal proximal tubules and hepatocytes
(rodents)
p-Aminohippurate
Bumetanide, Chlorothiazide, Cyclothiazide
[387, 401, 402]
OAT3 - Renal proximal tubules
Estrone 3-sulfate
Probenecid, novobiocin
[122, 387, 403]
OAT4 Renal proximal tubules
Syncytiotrophoblasts in placenta
Estrone 3-sulfate
Olmesartan, telmisartan
[25, 387, 401, 404, 405]
OAT5 - - Ochratoxin A Bumetanide, furosemide
[387, 401, 406]
OAT6 - - Estrone 3-sulfate
Benzylpenicillin, Carbenicillin
[18, 387, 401]
OAT7 - Hepatocytes Estrone 3-sulfate
- [387, 407]
URAT1 Renal proximal tubules
- Urate Losartan, telmisartan, furosemide
[387, 401, 408]
Organic Cation Transporter (OCT)
OCTs are also members of SLC22A family of solute carrier (SLC) transporters including
novel organic cation transporters OCTN1 and OCTN2 (encoded by genes SLC22A4 and
SLC22A5 respectively). They are responsible for the uptake of a wide range of low-molecular-
weight, relatively hydrophilic organic cations such as prototypical cation TEA, neurotoxin MPP+,
and endogenous compound N-methylnicotinamide (NMN) (Table 4.10) [409-411]. OCT consists
of 543-557 amino acids. They have 12 transmembrane domains (TMDs) with intracellular amino
and carboxy-termini. Facilitated diffusion driven by the inside-negative membrane potential is the

124
mechanism of uptake of organic cations via OCT [387, 409, 412-417]. The substrates of the OCTs
are mostly cations with rare exception for anionic or neutral compounds at physiological pH. Three
isoforms of OCTs (OCT 1-3) has been cloned from human, rabbits, rats and mice. The paralogs of
OCT1 and OCT2 share about 68–69% sequence homology for humans, rats, and mice, and 71%
for rabbits [418]. Substrate specificity for orthologous OCT may vary due to difference in species.
For example, the transport of tetrapropylammonium (TPA) or tetrabutylammonium (TBA) is
mediated by human and rabbit OCT1 but not by rat and mouse Oct1. This example acts as a
supporting statement for differences in recognition of OCT substrates across species [419]. Both
the tissue expression and localization of OCTs (Table 4.10) show that these transporters play a
governing role in the excretion of toxic xenobiotic and endogenous organic cations. Their crucial
involvement in drug disposition or drug response depicts tissue expression, substrate and inhibitors
specificity of OCT family.
Table 4.10: Tissue expression and substrates of OCT family members
OCT Tissue expression
Apical Basolateral
Substrates Inhibitors Reference
OCT1 Lung epithelial cells
Hepatocytes, Rodents
enterocytes and
proximal tubule
epithelial cells
(rodents)
Acyclovir, famotidine, metformin
etc.
Quinine, quinidine,
disopyramide
[122, 387, 409, 420-
423]
OCT2 Lung epithelial cells
Distal convoluted
tubules
Cimetidin, dopamine, metformin
etc.
Cimetidine, pilsicainide,
cetirizine, testosterone,
quinidine
[122, 387, 410, 411, 420, 422,
424]

125
OCT3 Lung epithelial cells and
enterocytes
Hepatocytes, and
trophoblasts
Cimetidine,
histamine, serotonin
etc.
β-Estradiol, Corticosterone,
Deoxycorticosterone, Progesterone
[387, 410, 411, 422, 425-428]
OCTN1
Renal epithelial cells (rodents),
intestinal epithelial cells and lung epithelial cells
- - - [30, 387]
OCTN2
Renal proximal tubules,
syncytiotrophoblasts in placenta and
lung epithelial cells
- - - [31, 387, 429]
Sodium Dependent Multivitamin Transporter (SMVT)
SMVT is an important plasma membrane protein which facilitates the cellular uptake of
vitamins and other essential cofactors such as biotin, pantothenic acid and lipoic acid. SMVT
primarily facilitates the cellular uptake of biotin (vitamin B7) and is a highly sodium dependent
specific vitamin carrier system. It has been referred as sodium dependent multivitamin transporter
because of its sodium and substrate specificity. SMVT protein encodes for 635 amino acids and
has 12 transmembrane domains. The expression of SMVT has been reported in various tissues
such as placenta, intestine, brain, liver, lung, kidney, cornea, retina and heart. Biotin has been
utilized in drug delivery by covalently attaching or by surface modification of various therapeutic
molecules [430]. Russel-Jones et al. reported enhanced tumor accumulation of biotinylated
fluorescently-labelled N-(2-hydroxypropyl) methacrylamide (HPMA) polymers following
intravenous administration in mice [431]. Biotin has also been employed as a target moiety to
deliver large peptides orally by varying the absorptive transport pathways and improving intestinal
permeability. Ramanathan et al. demonstrated enhanced cellular accumulation of biotinylated
PEG-based conjugates of Tat9 via SMVT in Caco-2 and transfected CHO cells. The 29 kDa
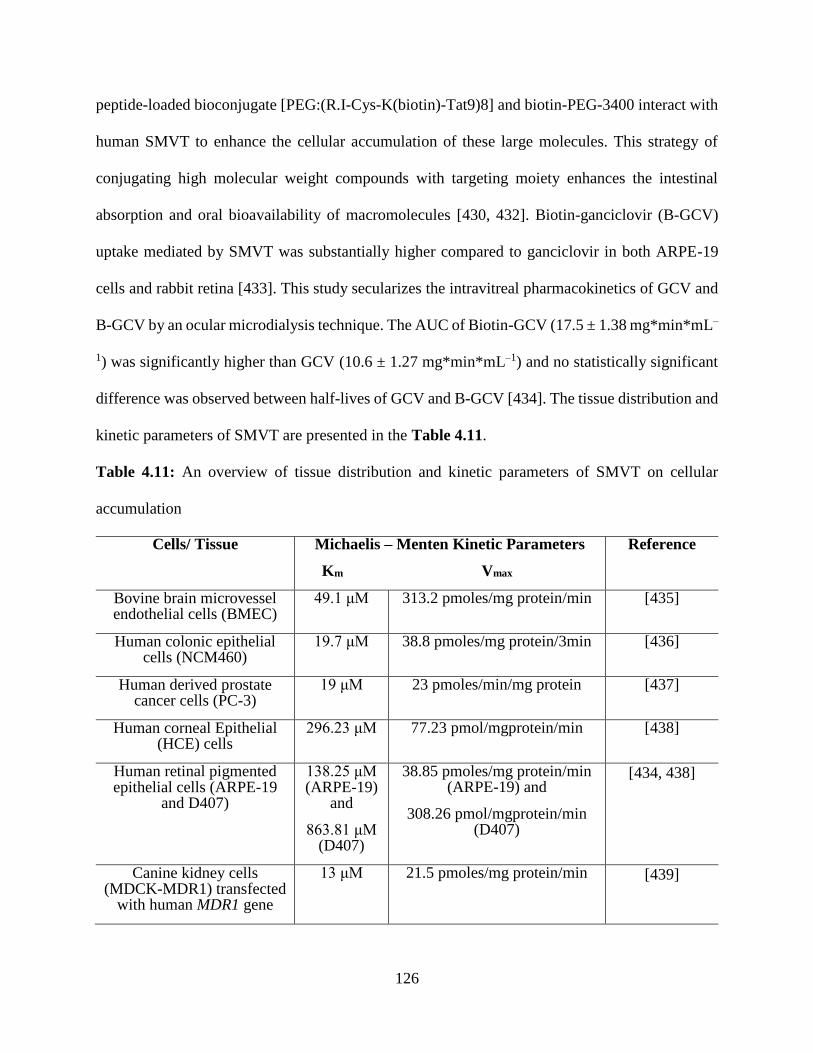
126
peptide-loaded bioconjugate [PEG:(R.I-Cys-K(biotin)-Tat9)8] and biotin-PEG-3400 interact with
human SMVT to enhance the cellular accumulation of these large molecules. This strategy of
conjugating high molecular weight compounds with targeting moiety enhances the intestinal
absorption and oral bioavailability of macromolecules [430, 432]. Biotin-ganciclovir (B-GCV)
uptake mediated by SMVT was substantially higher compared to ganciclovir in both ARPE-19
cells and rabbit retina [433]. This study secularizes the intravitreal pharmacokinetics of GCV and
B-GCV by an ocular microdialysis technique. The AUC of Biotin-GCV (17.5 ± 1.38 mg*min*mL–
1) was significantly higher than GCV (10.6 ± 1.27 mg*min*mL–1) and no statistically significant
difference was observed between half-lives of GCV and B-GCV [434]. The tissue distribution and
kinetic parameters of SMVT are presented in the Table 4.11.
Table 4.11: An overview of tissue distribution and kinetic parameters of SMVT on cellular
accumulation
Cells/ Tissue Michaelis – Menten Kinetic Parameters
Km Vmax
Reference
Bovine brain microvessel endothelial cells (BMEC)
49.1 μM 313.2 pmoles/mg protein/min [435]
Human colonic epithelial cells (NCM460)
19.7 μM 38.8 pmoles/mg protein/3min [436]
Human derived prostate cancer cells (PC-3)
19 μM 23 pmoles/min/mg protein [437]
Human corneal Epithelial (HCE) cells
296.23 μM 77.23 pmol/mgprotein/min [438]
Human retinal pigmented epithelial cells (ARPE-19
and D407)
138.25 μM (ARPE-19)
and
863.81 μM (D407)
38.85 pmoles/mg protein/min (ARPE-19) and
308.26 pmol/mgprotein/min (D407)
[434, 438]
Canine kidney cells (MDCK-MDR1) transfected
with human MDR1 gene
13 μM 21.5 pmoles/mg protein/min [439]
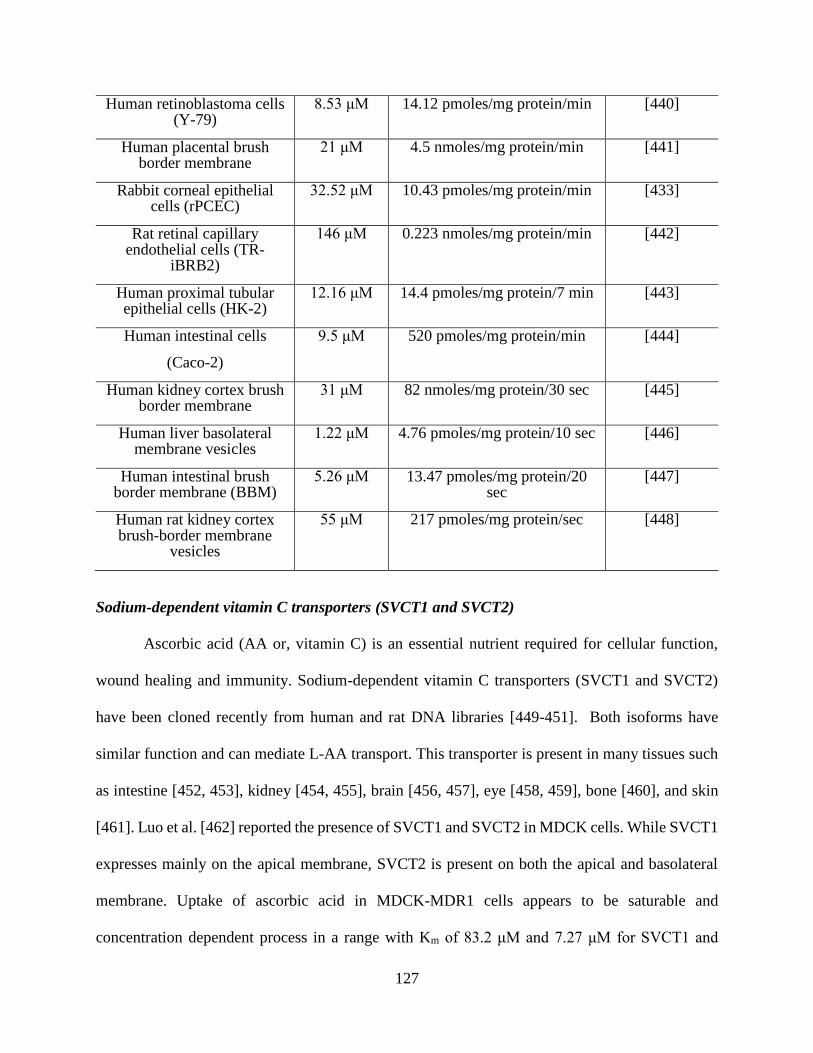
127
Human retinoblastoma cells (Y-79)
8.53 μM 14.12 pmoles/mg protein/min [440]
Human placental brush border membrane
21 μM 4.5 nmoles/mg protein/min [441]
Rabbit corneal epithelial cells (rPCEC)
32.52 μM 10.43 pmoles/mg protein/min [433]
Rat retinal capillary endothelial cells (TR-
iBRB2)
146 μM 0.223 nmoles/mg protein/min [442]
Human proximal tubular epithelial cells (HK-2)
12.16 μM 14.4 pmoles/mg protein/7 min [443]
Human intestinal cells
(Caco-2)
9.5 μM 520 pmoles/mg protein/min [444]
Human kidney cortex brush border membrane
31 μM 82 nmoles/mg protein/30 sec [445]
Human liver basolateral membrane vesicles
1.22 μM 4.76 pmoles/mg protein/10 sec [446]
Human intestinal brush border membrane (BBM)
5.26 μM 13.47 pmoles/mg protein/20 sec
[447]
Human rat kidney cortex brush-border membrane
vesicles
55 μM 217 pmoles/mg protein/sec [448]
Sodium-dependent vitamin C transporters (SVCT1 and SVCT2)
Ascorbic acid (AA or, vitamin C) is an essential nutrient required for cellular function,
wound healing and immunity. Sodium-dependent vitamin C transporters (SVCT1 and SVCT2)
have been cloned recently from human and rat DNA libraries [449-451]. Both isoforms have
similar function and can mediate L-AA transport. This transporter is present in many tissues such
as intestine [452, 453], kidney [454, 455], brain [456, 457], eye [458, 459], bone [460], and skin
[461]. Luo et al. [462] reported the presence of SVCT1 and SVCT2 in MDCK cells. While SVCT1
expresses mainly on the apical membrane, SVCT2 is present on both the apical and basolateral
membrane. Uptake of ascorbic acid in MDCK-MDR1 cells appears to be saturable and
concentration dependent process in a range with Km of 83.2 μM and 7.27 μM for SVCT1 and
128
SVCT2 respectively. Analysis of deduced primary amino acid sequence of hSVCT1 and hSVCT2
suggests the presence of five putative PKC phosphorylation sites while SVCT1 possess an
additional PKA site [463].Various inter and intra cellular stimuli (hormones, paracrine factors,
signaling molecules, etc.) are engaged in the expression of SVCT [464].
Conclusion
Complex nature of disease and presence of barrier in ocular and cancerous tissues provides
a significant challenge for the treatment of ocular and other diseases. Identification and
characterization of novel influx transporters and exploring them in terms of drug delivery helps in
partially meeting these challenges in drug delivery to ocular or various tissues. Lower side effects
with significant improvement in bioavailability are the major advantages provided by targeting
specific transporters in specific tissues. Drug delivery has been revolutionized by development of
non-invasive or less invasive drug delivery techniques. New polymers and polymeric drug delivery
systems have been examined and evaluated for the purpose of controlled and sustained delivery
for treating vision-threatening diseases and cancer. Progress in nanotechnology, influx transporter
and non-invasive drug delivery techniques will lead the race for development of new and novel
drug delivery systems.
129
CHAPTER 5
NOVEL PENTABLOCK COPOLYMER BASED NANOPARTICLES CONTAINING
PAZOPANIB: A POTENTIAL THERAPY FOR OCULAR NEOVASCULARIZATION
Rationale
Several pathologic conditions such as infection, trauma, and loss of the limbal stem cells
result in invasion of vessels from the limbal arcade to normally avascular cornea leading to corneal
neovascularization (CNV) [465-467]. It leads to loss of ocular immunity due to induction of allo-
immunity which ultimately leads to penetrating keratoplasty [465, 468-471]. Furthermore, graft
rejection is also triggered due to ingrowth of neovessels into avascular recipient tissue following
corneal surgery [465, 472]. Apart from CNV, one of the most common cause of vision loss is
choroidal neovascularization (ChNV). It is mostly associated with age-related macular
degeneration (AMD) leading to pathological myopia, ocular histoplasmosis, angioid streaks, and
several other diseases. Limited information is available regarding the pathogenesis of
neovascularization (NV). However understanding the role of vascular endothelial growth factor
(VEGF) in development of neovessels is considered to be major advancement [473, 474].
Intraocular injections of ranibizumab, an anti-VEGF agent that binds with all isoforms of VEGF-
A demonstrated substantial vision improvement in 34% to 40% of patients with ChNV [475, 476].
Also, bevacizumab (anti-VEGF agent that binds with all isoforms of VEGF-A) has shown positive
indication in patients with ChNV from AMD [477-483]. Reduction in subretinal and intraretinal
fluid accompanied by improvement in visual acuity was observed following administrations of
ranibizumab and bevacizumab (antagonists of VEGF-A). However, monthly injections of
ranibizumab only halted growth of ChNV and did not cause any significant effect on the regression
of existing ChNV, possibly due to the involvement of factors other than VEGF-A [475]. These
130
factors are responsible for endothelial cell survival and once the levels of ranibizumab reaches
below the critical level, onset of vascular leakage and growth of CNV is noted. Apart from VEGF
family members, several factors such as pericytes, are platelet derived growth factor B (PDGF-B)
are also responsible for survival of endothelial cells [484].
As mentioned above, neovascularization is triggered by a cascade of cellular and molecular
events [485-487]. Development of neovessels is mainly triggered by VEGF such as VEGF-A, B,
C and D [488]. Retinal pigmented epithelial cells, vascular endothelial cells, macrophages,
fibroblasts and corneal epithelial cells are the main source of VEGF in cornea and retina
respectively [489]. Expression of VEGF is highly upregulated in inflamed and vascularized
cornea. Accelerated growth, migration, and survival of the endothelial cells are attributed to
VEGF-triggered effects mediated via tyrosine kinase receptors (VEGFR1, 2, 3) [490, 491].
Tyrosine kinases selectively phosphorylate tyrosine residues by binding to extracellular domain of
receptors that induce receptor dimerization of VEGF and VEGFR. This induction leads to tyrosine
kinase activation and transcription of VEGF. Blockage of VEGF not only inhibits CNV but also
promotes corneal graft survival [492-494]. VEGF transcription is also stimulated by PDGF via
tyrosine kinase PDGF receptors (α and β) which play a vital role in recruitment of pericytes to
neovessels. Growth of pericyte and endothelial cells are interdependent. Pericyte recruitment can
be disrupted by inhibition of PDGF signaling pathways. PDGF is secreted by endothelial cells.
Pericytes express PDGFR-β and the resulting signal stmulates pericyte growth. By inhibiting
PDGF signaling pathways, endothelial cells undergo apoptosis because of lack of pericyte support
and absence of VEGF signaling [484, 494-500]. From this information, it can be postulated that
modulation of VEGF and PDGF may provide better therapeutic outcome in ocular NV [501].
131
Pazopanib, a small molecule tyrosine kinase inhibitor, not only inhibits VEGF but also
targets PDGF receptors inhibiting angiogenesis [502, 503]. It has been approved by U.S. FDA for
the treatment of renal cell carcinoma and soft tissue sarcoma [195, 504]. In preclinical studies,
pazopanib exhibited proven beneficial effect in ocular complications. Following oral
administration, pazopanib induced inhibition of VEGF and PDGF pathways leading to lowering
of laser induced ChNV [505]. In rats, topical eye drops of pazopanib causes inhibition of laser
induced ChNV, diabetic retinal vascular leukostasis, and leakage [506, 507].
Recently, Csaky G et al have reported that in phase 2B clinical trial no statistically
significant differences were observed between pazopanib eye drops and monthly ranibizumab with
regard to optical coherence tomography (OCT) parameter, including retinal morphology and CNV
lesion size (abstract presented at Annual meeting of the American Academy of Ophthalmology,
Louisiana, 2013). Expression of efflux transports on corneal epithelium and blood-retina barrier
(i.e. retinal capillaries and retinal pigment epithelium (RPE) has been reported. These efflux
transporters play a significant role in ocular pharmacokinetics and drug disposition [508].
Pazopanib is a substrate of efflux transporters which can limit uptake into the target tissue [152,
153, 509]. Thus by inhibiting or bypassing the efflux transporters, pazoapanib tissue penetration
can be improved. However, inhibitors or specific efflux modulators may lead to systemic toxicity
at doses required to modulate efflux activity. Hence, we have developed pazopanib encapsulated
nanoparticles (NP) which not only eliminates efflux inhibitor related toxicity but also enhances
tissue penetration of pazopanib along with controlled drug release. In this study, we have examined
a novel pentablock copolymer (PB) composed of FDA approved polymer blocks such as PEG,
PCL, and PLA/PGA. We have prepared a PB copolymer with block arrangements of PLA3000-
PCL7000-PEG2000-PCL7000-PLA3000. This polymer was utilized to prepare pazopanib loaded NP for
132
the treatment of ocular neovascularization. Characterization of PB polymer has been carried out
with NMR, GPC, X-ray diffraction, cytotoxicity and biocompatibility studies. Also, several NP
parameters such as entrapment efficiency, drug loading, in vitro drug release and effect of
pazopanib NP in evading efflux transporters were studied.
Material And Methods
Materials
PEG (2 kDa), stannous octoate, ε-caprolactone, poly (vinyl alcohol) (PVA),
lipopolysaccharide were procured from Sigma-Aldarich (St. Louis, MO; USA). L-lactide was
purchased from Acros organics (Morris Plains, NJ; USA). Mouse TNF-α, IL-6 and IL-1β (Ready-
Set-Go) ELISA kits were obtained from eBioscience Inc. Lactate dehydrogenase estimation kit
and CellTiter 96® AQueous non-radioactive cell proliferation assay (MTS) kit were obtained from
Takara Bio Inc. and Promega Corp., respectively. [3H] Digoxin (specific activity 35.4 Ci/mmol)
and [3H] Abacavir (specific activity 0.1 Ci/mmol) were procured from Perkin Elmer (Boston, MA,
USA). All other reagents utilized in this study were of analytical grade. Human conjunctival (CCL
20.2) and mouse leukaemic monocyte macrophage cells (RAW-264.7) were procured from
American Type Culture Collection (ATCC). Human corneal epithelial (HCEC) and human retinal
pigmental cells (D407) were generous gifts from Dr. Araki-Sasaki (Kinki Central Hospital, Japan)
and Dr. Richard Hunt (University or South Carolina, Columbia, SC, USA), respectively.
Synthesis Of TB And PB Copolymers
Triblock (TB) and pentablock (PB) copolymers were synthesized by ring-opening bulk
copolymerization [510]. Briefly, PCL-PEG-PCL copolymers (TB) were synthesized by
copolymerization of ε-caprolactone on the hydroxyl ends of PEG (2kDa). In this reaction, PEG
was used as a macro-initiator and stannous octoate (0.5wt%) as catalyst. To synthesize PCL-PEG-
133
PCL, pre-determined amount of PEG was vacuum-dried for 4 h followed by addition of ε-
caprolactone and catalyst. The reaction was carried out in close vessel under nitrogen environment,
at 130°C for 36 h. The reaction mixture was solubilized in DCM followed by precipitation in ice-
cold diethyl ether. Precipitated polymer was vacuum-dried to remove any residual solvent and
characterized to evaluate the reaction yield. Structure and molecular weight of TB copolymers
were confirmed by 1H-NMR and GPC.
In order to synthesize PB copolymers, predetermined amount of TB copolymer was
employed as a macro-initiator and stannous octoate (0.5wt%) as catalyst. For the synthesis of PB,
L-lactide was polymerized on the hydroxyl ends of TB copolymer. Reaction was carried out at
130°C for 36 h. In order to remove catalyst and unreacted monomers. The reaction mixture was
dissolved in DCM and precipitated by addition of ice-cold diethyl ether. Polymers were vacuum-
dried and characterized for structure and polydispersity by employing 1H-NMR and GPC as
analytical techniques. Purified polymers were stored at -20 °C until further use. Reaction scheme
for the synthesis of TB and PB are described in Fig.5.1
Characterization Of Polymers
1H-NMR and GPC analysis were performed to characterize polymers for purity, molecular
weight and polydispersity. Further, XRD studies were performed to understand the crystalline
nature of polymers.
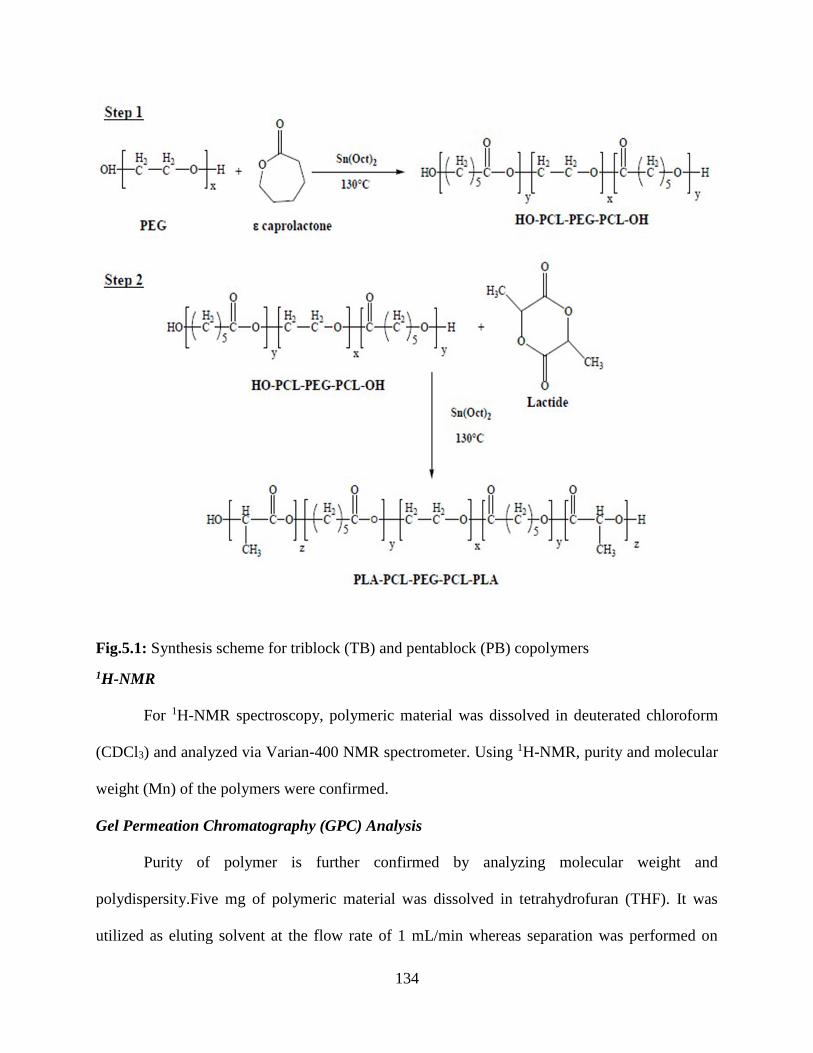
134
Fig.5.1: Synthesis scheme for triblock (TB) and pentablock (PB) copolymers
1H-NMR
For 1H-NMR spectroscopy, polymeric material was dissolved in deuterated chloroform
(CDCl3) and analyzed via Varian-400 NMR spectrometer. Using 1H-NMR, purity and molecular
weight (Mn) of the polymers were confirmed.
Gel Permeation Chromatography (GPC) Analysis
Purity of polymer is further confirmed by analyzing molecular weight and
polydispersity.Five mg of polymeric material was dissolved in tetrahydrofuran (THF). It was
utilized as eluting solvent at the flow rate of 1 mL/min whereas separation was performed on
135
Styragel HR-3 column. Polystyrene samples with narrow molecular weight distribution were
employed as standards.
X-Ray Diffraction (XRD) Analysis Of Copolymers
Diffraction patterns of samples were analyzed in order to understand the effects of polymer
composition (TB vs PB) on the crystallinity of copolymers. MiniFlex automated X-ray
diffractometer (Rigaku, The Woodlands, Texas) with Ni-filtered Cu-kα radiation (30 kV and 15
mA) was employed to obtain diffraction patterns. XRD analysis was performed at room
temperature.
In Vitro Cytotoxicity Studies
Cell Culture
RAW-264.7 cells were cultured and maintained in Dubelcco's modified Eagle medium
(DMEM) supplemented with 10% FBS, 100 mg/L of streptomycin and 100 U/L of penicillin.
HCEC cells were cultured according to previously published protocol [511-513]. Cells of passage
numbers between 25 and 30 were cultured at 37°C, humidified 5% CO2/95% air atmosphere in a
DMEM/F-12 culture medium supplemented with 15% (v/v) FBS (heat inactivated), 15 mM
HEPES, 22 mM NaHCO3, 100 mg of penicillin and streptomycin each, 5 μg/ml insulin, and 10
ng/ml of human epidermal growth factor. D407 cells (passage numbers between 75 and 80) were
grown at 37°C, humidified 5% CO2/95% air atmosphere in a DMEM culture medium
supplemented with 10% (v/v) FBS (heat inactivated), 29 mM NaHCO3, 20 mM HEPES, 100 mg
of penicillin and streptomycin each, and 1% nonessential amino acids at pH 7.4 [514, 515]. Chang's
conjunctival cell line (CCL 20.2) were grown at 37°C, humidified 5% CO2/95% air atmosphere in
a Medium 199 containing Earle's BSS supplemented with 10% (v/v) FBS (heat inactivated), 29

136
mM NaHCO3, 20 mM HEPES, 100 mg of penicillin and streptomycin each, and 1% nonessential
amino acids at pH 7.4.
Lactate Dehydrogenase (LDH) Assay
Cytotoxicity of PB copolymer was evaluated according to previously published protocol
with minor modifications [516]. Briefly, different concentrations (1-20 mg/mL) of PB copolymer
were prepared in acetonitrile (ACN). A 100μL of solutions was aliquoted in each well of 96-well
cell culture plates. In order to evaporate ACN and to sterilize block copolymers, cell culture plates
were exposed overnight under UV light in a hood with laminar flow. Once the ACN is evaporated,
1.0 x 10⁴ of HCEC cells were seeded in each well on the film of PB polymer formed after
evaporation of ACN and incubated for 48 h at 37°C and 5% CO2 in humidified atmosphere. After
appropriate incubation time, LDH assay kit was utilized to analyze the supernatant for the levels
of LDH. LDH assay was performed according to the supplier’s protocol. Samples were analyzed
using 96-well plate reader at 450 nm. Amount of released LDH is directly proportional to
cytotoxicity of the polymers. In this study, LDH release >10% was considered as cytotoxic. To
evaluate toxicity of block copolymers on or retinal and conjunctival cells, similar experiment was
performed with D407 and CCL 20.2 cells. LDH release (%) was calculated by utilizing following
equation:
𝑳𝑫𝑯 𝒓𝒆𝒍𝒆𝒂𝒔𝒆 (%) =𝑨𝒃𝒔. 𝒐𝒇 𝒔𝒂𝒎𝒑𝒍𝒆 − 𝑨𝒃𝒔. 𝒐𝒇 𝒏𝒆𝒈𝒂𝒕𝒊𝒗𝒆 𝒄𝒐𝒏𝒕𝒓𝒐𝒍
𝑨𝒃𝒔. 𝒐𝒇 𝒑𝒐𝒔𝒊𝒕𝒊𝒗𝒆 𝒄𝒐𝒏𝒕𝒓𝒐𝒍 − 𝑨𝒃𝒔. 𝒐𝒇 𝒏𝒆𝒈𝒂𝒕𝒊𝒗𝒆 𝒄𝒐𝒏𝒕𝒓𝒐𝒍∗ 𝟏𝟎𝟎
MTS Assay
In vitro cell viability (MTS) assay was performed in order to confirm the safety of PB
copolymer. MTS assay was carried out according to previously published protocol with minor
modifications [517]. Four different concentrations of block copolymer solutions were prepared,
aliquoted and sterilized according to the previously mentioned procedure. After sterilization,
137
HCEC cells at the density of 1.0 x 10⁴ cells per well were seeded in 96-well plate. Cells were
incubated for 48 h at 37°C and 5% CO2 in humidified atmosphere. After incubation, cell culture
medium was replaced with 100μL of serum free medium containing 20μL of MTS solution. Cells
were further incubated for 4h at 37°C and 5% CO2. Absorbance of each well was determined at
450 nm. Polymer concentrations at which viability of cell is > 90% was observed, were considered
as non-toxic. Percent cell viability was estimated by the following equation. The similar
experiment was repeated with CCL 20.2 and D407 cells.
𝑪𝒆𝒍𝒍 𝒗𝒊𝒂𝒃𝒊𝒍𝒊𝒕𝒚 (%) =𝑨𝒃𝒔. 𝒐𝒇 𝒔𝒂𝒎𝒑𝒍𝒆 − 𝑨𝒃𝒔. 𝒐𝒇 𝒏𝒆𝒈𝒂𝒕𝒊𝒗𝒆 𝒄𝒐𝒏𝒕𝒓𝒐𝒍
𝑨𝒃𝒔. 𝒐𝒇 𝒑𝒐𝒔𝒊𝒕𝒊𝒗𝒆 𝒄𝒐𝒏𝒕𝒓𝒐𝒍 − 𝑨𝒃𝒔. 𝒐𝒇 𝒏𝒆𝒈𝒂𝒕𝒊𝒗𝒆 𝒄𝒐𝒏𝒕𝒓𝒐𝒍∗ 𝟏𝟎𝟎
In Vitro Biocompatibility Studies
Different concentrations (1-20 mg/mL) of block copolymer solutions were prepared in
ACN and were added (200µl) in each well of 48-well cell culture plate. These plates were
incubated overnight under UV light in a laminar flow hood for sterilization as well as for
evaporation of ACN. After sterilization, RAW-264.7 cells were plated at the cell density of 5.0 x
104 per well. Cells were exposed to polymer for 48 h at 37 °C and 5% CO2. After appropriate
incubation time, cell supernatant was analyzed for the quantification of three different cytokines,
i.e., TNF-α, IL-6 and IL-1β. ELISA method was employed to estimate the levels of cytokines.
ELISA was performed according to the manufacturer’s instruction. Calibration curves for TNF-α,
IL-6 and IL-1β were prepared in the range of 10-750 pg/mL, 5-500 pg/mL and 10-500 pg/mL,
respectively.
Preparation Of Nanoparticles
Nanoparticles were prepared using PB copolymer. An earlier published process
(spontaneous emulsion solvent diffusion method) was adopted with minor modifications for the
preparation of nanoparticles [518]. Briefly, 1 mg of pazopanib and 5mg of PB copolymer (1:5)

138
was dissolved in 1 ml of DMSO. This solution was added drop wise from a syringe into 5 ml of
1% poloxamer solution under constant stirring. Nanoparticles were formed instantaneously on
mixing of both the solutions. Prepared nanoparticles were stirred for 1 hr followed by
centrifugation. Finally, nanoparticles were washed two times with DDW to remove surface bound
pazopanib, poloxamer, and DMSO. Several batches of nanoparticles were prepared with different
ratios of pazopanib to PB copolymer (1:5 and 1:10). NPs were freeze-dried in 5% mannitol solution
and stored at -20 °C until further characterization. NPs were prepared utilizing two different drug
to polymer ratios i.e., 1:5 and 1:10. Freeze-dried NPs were characterized for particle size,
entrapment efficiency (EE), drug loading (DL) and in vitro drug release behavior. This study was
carried out in triplicate. Blank nanoparticles were also prepared by employing only polymer in
similar amounts.
Characterization Of NPs
Particle size
NPs (1 mg/mL) suspended in DDW were subjected to particle size analysis. NPs mean size
was evaluated at room temperature and 90° scattering angel utilizing Zeta sizer (Zetasizer Nano
ZS, Malvern Instruments Ltd, Worcestershire, UK). All the samples were analyzed in triplicate.
The size analysis consisted of 30 measurements per sample, and the results are expressed as mean
size ± SD.
Entrapment efficiency (EE %) and drug loading (DL %)
Pazopanib-loaded freeze-dried NPs were examined for the estimation of DL and EE.
Supernatant collected during NP preparation were analyzed to evaluate EE utilizing Micro
BCATM protein estimation kit. Two milligram equivalent of pazopanib-encapsulated NPs were
dissolved in 200μL of DMSO in order to evaluate DL. Resulting solution was subjected for
139
estimation of pazopanib via UV absorbance spectroscopy at 275nm. Standard curve of pazopanib
ranging from 0.97 to 1000μg/mL was prepared in DMSO. EE (%) and DL (%) were estimated as
per to the following equations.
%𝑬𝑬 =𝑻𝒐𝒕𝒂𝒍 𝒂𝒎𝒐𝒖𝒏𝒕 𝒐𝒇 𝒅𝒓𝒖𝒈 − 𝑨𝒎𝒐𝒖𝒏𝒕 𝒐𝒇 𝒅𝒓𝒖𝒈 𝒊𝒏 𝒔𝒖𝒑𝒆𝒓𝒏𝒂𝒕𝒂𝒏𝒕
𝑻𝒐𝒕𝒂𝒍 𝒂𝒎𝒐𝒖𝒏𝒕 𝒐𝒇 𝒅𝒓𝒖𝒈∗ 𝟏𝟎𝟎
%𝑫𝑳 =𝑨𝒎𝒐𝒖𝒏𝒕 𝒐𝒇 𝒅𝒓𝒖𝒈 𝒊𝒏 𝒏𝒂𝒏𝒐𝒑𝒂𝒓𝒕𝒊𝒄𝒍𝒆𝒔
𝑻𝒐𝒕𝒂𝒍 𝒂𝒎𝒐𝒖𝒏𝒕 𝒐𝒇 𝒅𝒓𝒖𝒈 𝒂𝒏𝒅 𝒑𝒐𝒍𝒚𝒎𝒆𝒓∗ 𝟏𝟎𝟎
In Vitro Release Studies
Dialysis Bag Method
A volume of 0.6 mL of NP formulation (1:5) was put in a dialysis bag (3.8 cm in length).
Dialysis tubing consisted of regenerated cellulose, a material chemically and physically treated to
increase its resistance (Avg. flat width 9 mm (0.35 in.), MWCO 2000, Sigma Aldrich, MO, USA).
Both ends were tied. The dialysis bag was suspended in 10 mL of 0.1M phosphate buffer saline
(pH - 7.4) at 37°C. The tube containing dialysis bag was placed in a shaker with water bath at
37°C. At predetermined time intervals dialysis bag was exchanged into a tube containing 10 mL
of fresh 0.1M phosphate buffer saline (pH - 7.4) at 37°C. Drug concentrations were quantified
using NanoDrop 2000c UV-Vis Spectrophotometer at 275nm and all experiments were conducted
in triplicate
Release Kinetics
Release data were fitted in various kinetic models described below for the investigation of release
mechanism of pazopanib from PB NPs.
140
Korsmeyer-Peppas Equation
𝑀𝑡
𝑀∞= 𝑘𝑡𝑛
Where k is the kinetic constant and n is the diffusion exponent describes release mechanism.
Mt and M∞ represent the cumulative pazopanib release at time t and at the equilibrium,
respectively.
Higuchi Equation
𝑄𝑡 = 𝐾𝑡1/2
K denotes the Higuchi rate kinetic constant, Qt is the amount of released pazopanib at time t, and
t is time (hour).
Hixon-Crowell Equation
𝐶01/3− 𝐶𝑡
1/3 = 𝑘𝑡
C0 and Ct represents the initial amount and remaining amount of pazopanib, respectively. k is the
constant incorporating surface-volume relation and t is time in hour.
First Order Equation
𝐿𝑜𝑔𝐶=𝐿𝑜𝑔𝐶0− 𝐾𝑡/2.303
K denotes the first order rate constant, C0 is the initial pazopanib concentration and t represents
time in hour.
Zero Order Equation
𝐶= 𝐾0𝑡
K0 is the zero-order rate constant and t is time in hour.
In Vitro Cellular Accumulation Studies
Twelve well polyester plates (Coaster Corning, NY) were utilized to conduct cellular
accumulation studies. Following media removal, MDCK-MDR1 cells were rinsed thrice for 5 min
141
each with 1–2 ml of Dulbecco’s phosphate-buffered saline (DPBS) containing 140 mM NaCl, 0.03
mM KCl, 7.5 mM Na2HPO4, 1.5 mM KH2PO4, 1 mM CaCl2, 0.5 mM MgSO4, 20 mM HEPES,
and 5 mM glucose maintained at pH 7.4. Uptake studies were initiated by adding 250μl of solution
containing 0.25 μCi/ml of [3H] Digoxin (probe radiolabelled substrate for P-gp) in the absence and
presence of GF 120918, pazopanib and pazopanib NPs. Following incubation, the solution was
removed and uptake was terminated with 2 ml of ice-cold stop solution containing 200 mM KCl
and 2 mM HEPES. The cell monolayer was washed thrice, 5 min each and 1ml of lysis buffer
(0.1% Triton-X solution in 0.3% NaOH) was added to each well and plates were stored overnight
at room temperature. Subsequently, the cell lysate (400μl) from each well was transferred to
scintillation vials containing 3 ml of scintillation cocktail (Fisher Scientific, Fairlawn, NJ, USA).
Samples were quantified by measuring the radioactivity using liquid scintillation
spectrophotometer coulter (Beckman Instruments Inc., Fullerton, CA, USA, model LS-6500).
Protein content of each sample was estimated by BioRad Protein Estimation Kit (BioRad Protein
Estimation Kit, Hercules, CA, USA). Similarly, experiment was repeated in MDCK-Bcrp1 cells
by utilizing 0.25 μCi/ml of [3H] Abacavir (probe radiolabelled substrate for Bcrp1).
Results And Discussion
Inhibition of VEGFR and PDGFR tyrosine kinases has been explored as a new target for
treatment of ocular neovascularization. In a recently concluded Phase 2b trial, pazopanib failed to
demonstrate any significant effect on neovascularization lesion size over the control arm
(ranibizumab) (abstract presented at Annual meeting of the American Academy of
Ophthalmology, Louisiana, 2013). Expression and functional role of active efflux at the ocular
tissues has been very well established [508]. Such efflux transporters may vary the ocular
pharmacokinetics of the therapeutic agent. Higher affinity of efflux transporters (P-gp and BCRP)
142
toward this particular class of molecularly targeted agents has been reported before [152, 153,
509]. Reason behind failure of pazopanib in the treatment of ocular neovascularization has not
been clearly revealed so far.
In this study, we have prepared novel PB copolymers which are composed of FDA
approved polymer blocks such as PEG, PCL, and PLA. Each block plays a vital role such as
presence of Stability of NPs is improved by incorporating PEG which ultimately reduces NP
aggregation and helps in escaping phagocytosis by macrophages resulting in improved half-life.
Sustain drug release can be improved by incorporating PCL, which is a slow degrading semi-
crystalline polymer. Extremely slow degradation profile of polymer is not advantageous if the
formulation is administered via intravitreal route. Synchronization of polymer degradation profile
with the drug release profile is an important aspect to be considered by formulation scientists in
order to avoid accumulation of empty formulation in limited vitreous cavity. As per previously
published reports, reduction in the crystallinity of PCL may improve its hydrolytic and enzymatic
degradation, since poor degradation of PCL has been attributed to its crystalline nature [519].
According to Huang et al, crystallinity of PCL can be significantly reduced by conjugation of PLA
to PCL which will result in faster degradation of PCL [520]. The final formulation (pazopanib
loaded NPs) will not only help in evading efflux transporters but will also exhibit sustain release
of pazopanib from NPs.
Synthesis And Characterization Of TB And PB Copolymers
We have synthesized various PB copolymers with different molecular weights of
PEG/PCL. For this whole study we have only utilized the PB copolymer with highest PCL content
out of the various PB copolymers. Since one of our main goal was to sustain release of pazopanib
143
from formulation, that’s the reason we utilized the PB copolymer having highest PCL content
which imparts enhanced hydrophobicity to the polymer.
Ring-opening bulk copolymerization of ε-caprolactone, and L-lactide leads to successful synthesis
of TB and PB copolymers. First step involves synthesis of TB copolymers (PCL-PEG-PCL) with
different molecular weight of PEG/PCL utilizing PEG (4kDa) as macroinitiator and stannous
octoate as catalyst. Purified TB copolymer was employed as macroinitiator for the synthesis of PB
copolymers. Molecular weight (Mn) and purity of TB and PB copolymers were confirmed by 1H-
NMR spectroscopy. As described in Fig.5.2, typical 1H-NMR characteristic peaks of PCL units
were observed at 1.40, 1.65, 2.30 and 4.06 δ ppm representing methylene protons of -(CH2)3-, -
OCO-CH2-, and -CH2OOC-, respectively. A sharp proton peak observed at 3.65 δ ppm was
attributed to methylene protons (-CH2CH2O-) of PEG. 1H-NMR spectrograms of PB copolymers
with PLA as terminals (PB-A, PB-B, PB-D and PB-E) exhibited two additional peaks at 1.50 (-
CH3) and 5.17 (-CH-) δ ppm (Fig.5.3).
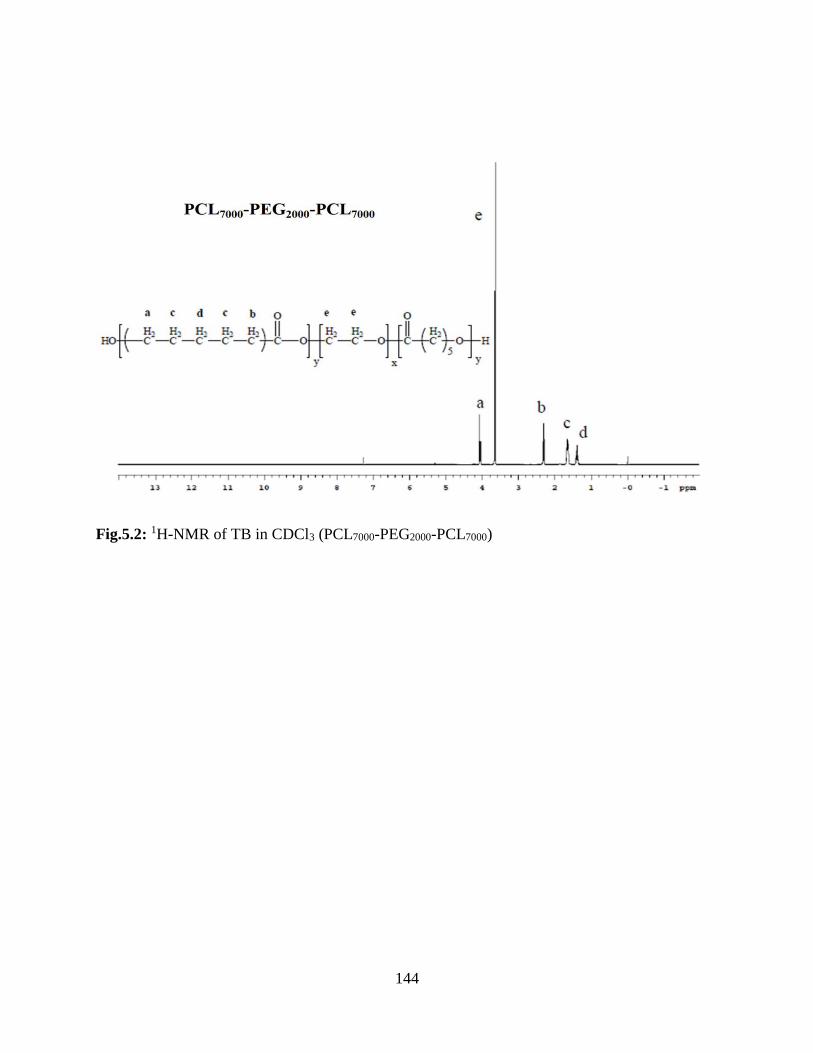
144
Fig.5.2: 1H-NMR of TB in CDCl3 (PCL7000-PEG2000-PCL7000)
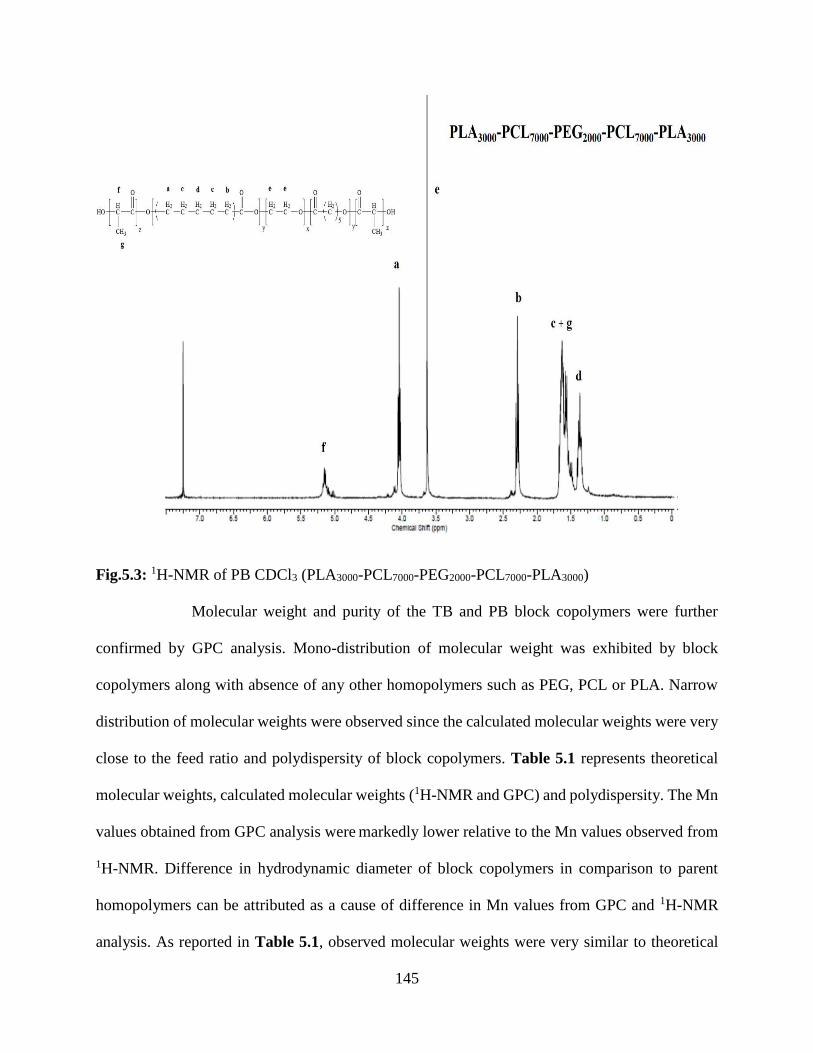
145
Fig.5.3: 1H-NMR of PB CDCl3 (PLA3000-PCL7000-PEG2000-PCL7000-PLA3000)
Molecular weight and purity of the TB and PB block copolymers were further
confirmed by GPC analysis. Mono-distribution of molecular weight was exhibited by block
copolymers along with absence of any other homopolymers such as PEG, PCL or PLA. Narrow
distribution of molecular weights were observed since the calculated molecular weights were very
close to the feed ratio and polydispersity of block copolymers. Table 5.1 represents theoretical
molecular weights, calculated molecular weights (1H-NMR and GPC) and polydispersity. The Mn
values obtained from GPC analysis were markedly lower relative to the Mn values observed from
1H-NMR. Difference in hydrodynamic diameter of block copolymers in comparison to parent
homopolymers can be attributed as a cause of difference in Mn values from GPC and 1H-NMR
analysis. As reported in Table 5.1, observed molecular weights were very similar to theoretical
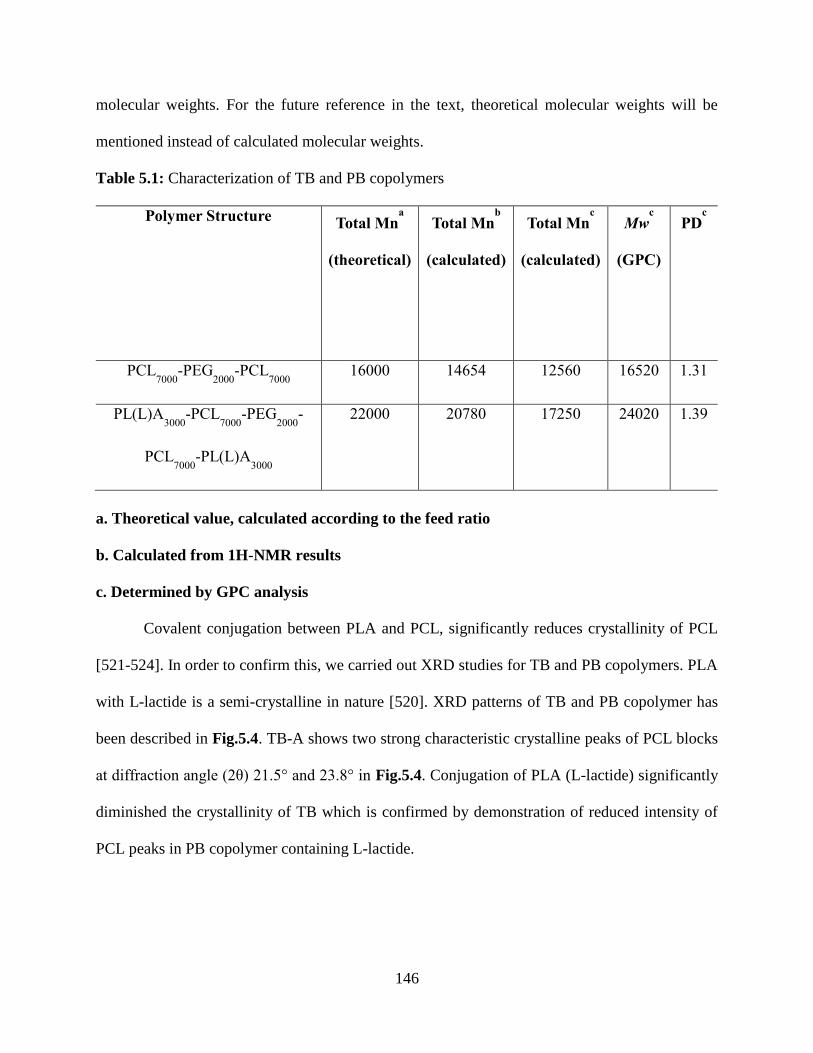
146
molecular weights. For the future reference in the text, theoretical molecular weights will be
mentioned instead of calculated molecular weights.
Table 5.1: Characterization of TB and PB copolymers
Polymer Structure Total Mn
a
(theoretical)
Total Mnb
(calculated)
Total Mnc
(calculated)
Mwc
(GPC)
PDc
PCL7000
-PEG2000
-PCL7000
16000 14654 12560 16520 1.31
PL(L)A3000
-PCL7000
-PEG2000
-
PCL7000
-PL(L)A3000
22000 20780 17250 24020 1.39
a. Theoretical value, calculated according to the feed ratio
b. Calculated from 1H-NMR results
c. Determined by GPC analysis
Covalent conjugation between PLA and PCL, significantly reduces crystallinity of PCL
[521-524]. In order to confirm this, we carried out XRD studies for TB and PB copolymers. PLA
with L-lactide is a semi-crystalline in nature [520]. XRD patterns of TB and PB copolymer has
been described in Fig.5.4. TB-A shows two strong characteristic crystalline peaks of PCL blocks
at diffraction angle (2θ) 21.5° and 23.8° in Fig.5.4. Conjugation of PLA (L-lactide) significantly
diminished the crystallinity of TB which is confirmed by demonstration of reduced intensity of
PCL peaks in PB copolymer containing L-lactide.
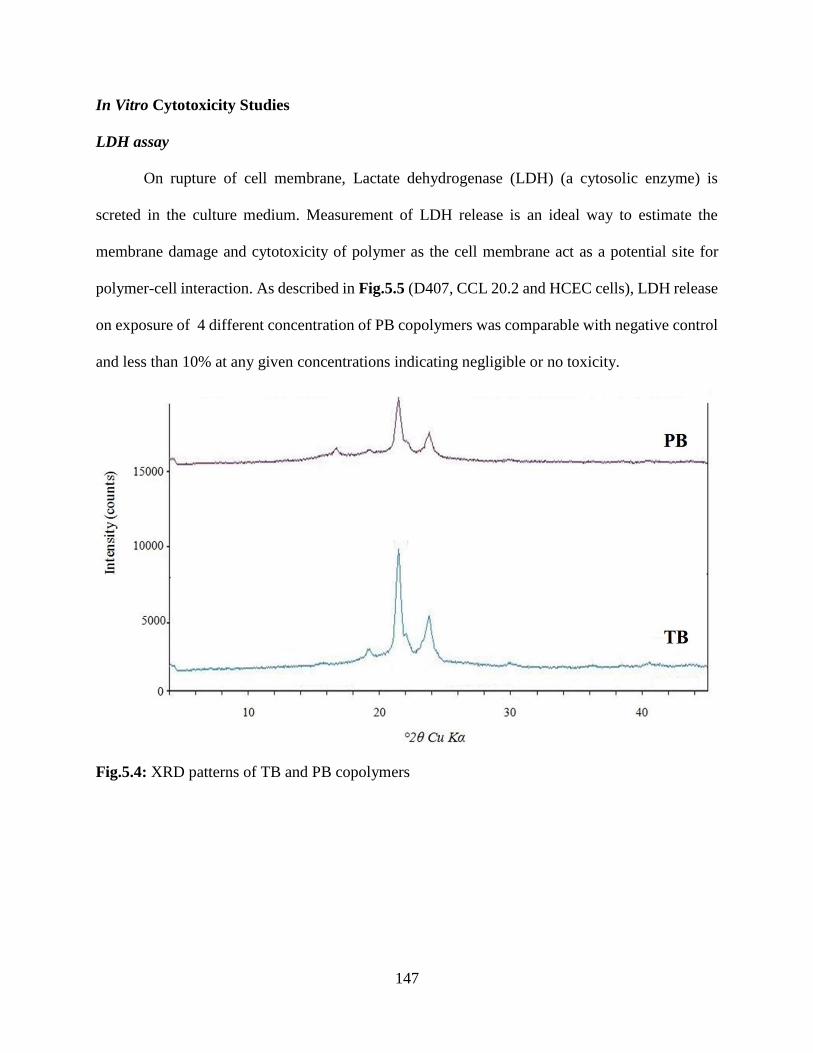
147
In Vitro Cytotoxicity Studies
LDH assay
On rupture of cell membrane, Lactate dehydrogenase (LDH) (a cytosolic enzyme) is
screted in the culture medium. Measurement of LDH release is an ideal way to estimate the
membrane damage and cytotoxicity of polymer as the cell membrane act as a potential site for
polymer-cell interaction. As described in Fig.5.5 (D407, CCL 20.2 and HCEC cells), LDH release
on exposure of 4 different concentration of PB copolymers was comparable with negative control
and less than 10% at any given concentrations indicating negligible or no toxicity.
Fig.5.4: XRD patterns of TB and PB copolymers
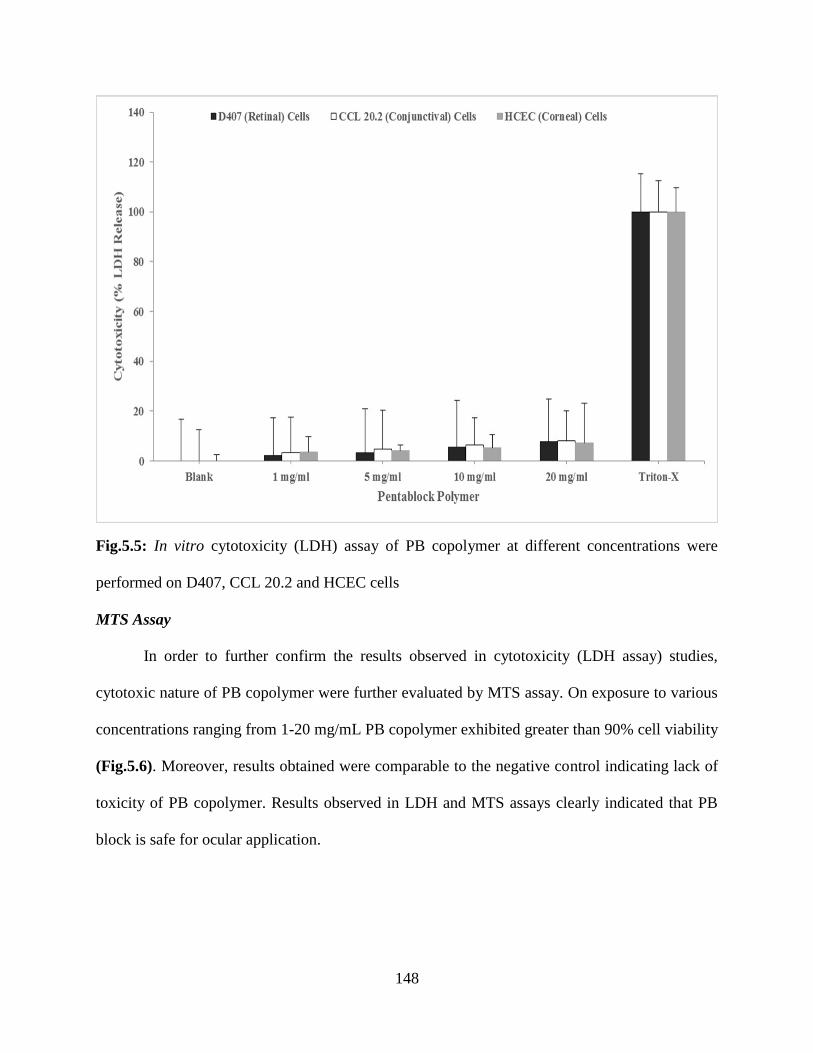
148
Fig.5.5: In vitro cytotoxicity (LDH) assay of PB copolymer at different concentrations were
performed on D407, CCL 20.2 and HCEC cells
MTS Assay
In order to further confirm the results observed in cytotoxicity (LDH assay) studies,
cytotoxic nature of PB copolymer were further evaluated by MTS assay. On exposure to various
concentrations ranging from 1-20 mg/mL PB copolymer exhibited greater than 90% cell viability
(Fig.5.6). Moreover, results obtained were comparable to the negative control indicating lack of
toxicity of PB copolymer. Results observed in LDH and MTS assays clearly indicated that PB
block is safe for ocular application.
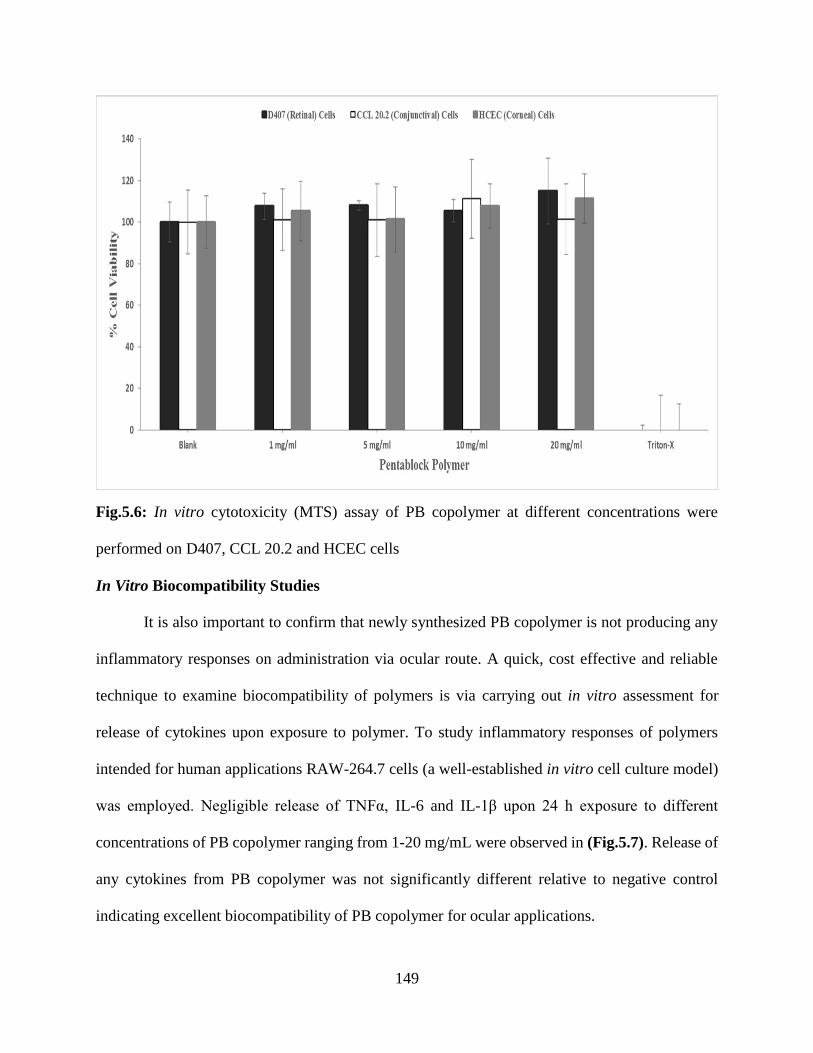
149
Fig.5.6: In vitro cytotoxicity (MTS) assay of PB copolymer at different concentrations were
performed on D407, CCL 20.2 and HCEC cells
In Vitro Biocompatibility Studies
It is also important to confirm that newly synthesized PB copolymer is not producing any
inflammatory responses on administration via ocular route. A quick, cost effective and reliable
technique to examine biocompatibility of polymers is via carrying out in vitro assessment for
release of cytokines upon exposure to polymer. To study inflammatory responses of polymers
intended for human applications RAW-264.7 cells (a well-established in vitro cell culture model)
was employed. Negligible release of TNFα, IL-6 and IL-1β upon 24 h exposure to different
concentrations of PB copolymer ranging from 1-20 mg/mL were observed in (Fig.5.7). Release of
any cytokines from PB copolymer was not significantly different relative to negative control
indicating excellent biocompatibility of PB copolymer for ocular applications.
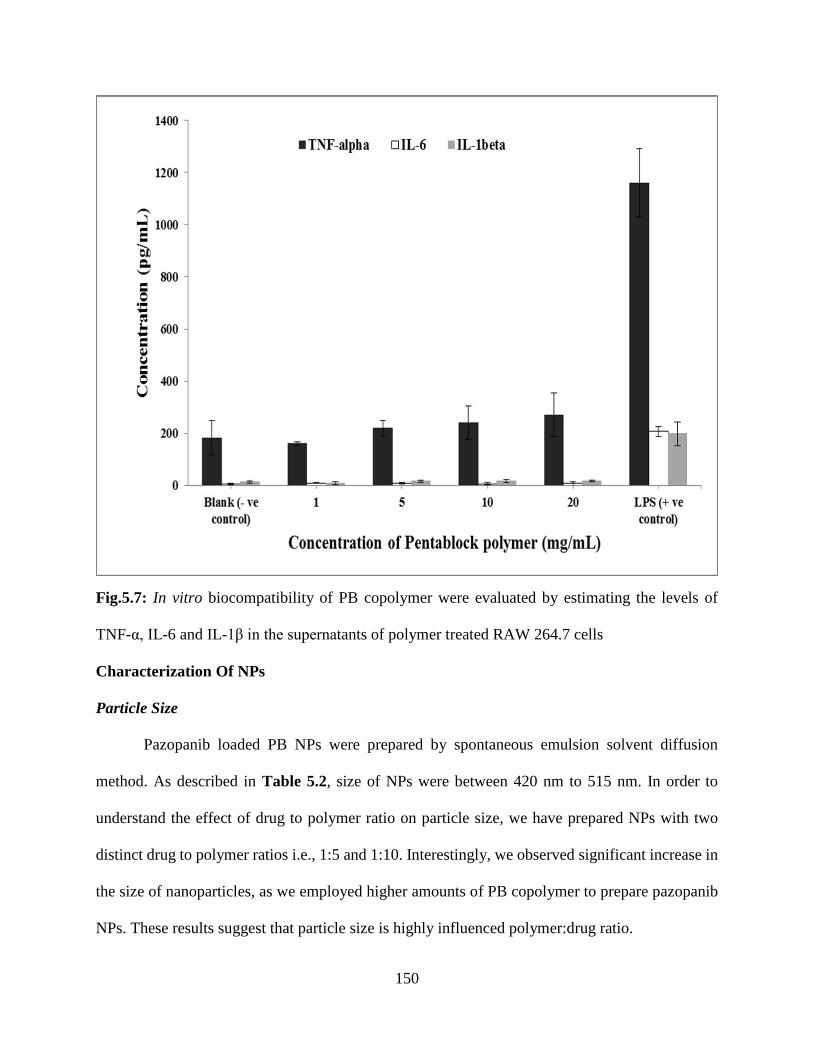
150
Fig.5.7: In vitro biocompatibility of PB copolymer were evaluated by estimating the levels of
TNF-α, IL-6 and IL-1β in the supernatants of polymer treated RAW 264.7 cells
Characterization Of NPs
Particle Size
Pazopanib loaded PB NPs were prepared by spontaneous emulsion solvent diffusion
method. As described in Table 5.2, size of NPs were between 420 nm to 515 nm. In order to
understand the effect of drug to polymer ratio on particle size, we have prepared NPs with two
distinct drug to polymer ratios i.e., 1:5 and 1:10. Interestingly, we observed significant increase in
the size of nanoparticles, as we employed higher amounts of PB copolymer to prepare pazopanib
NPs. These results suggest that particle size is highly influenced polymer:drug ratio.
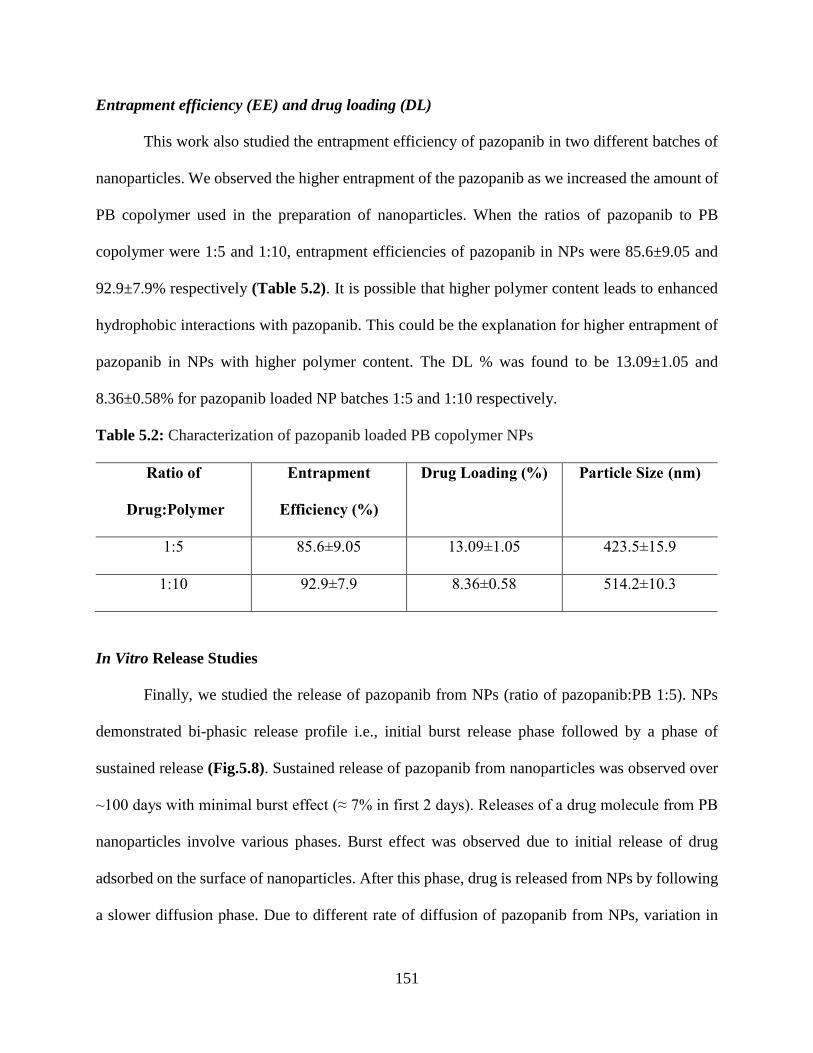
151
Entrapment efficiency (EE) and drug loading (DL)
This work also studied the entrapment efficiency of pazopanib in two different batches of
nanoparticles. We observed the higher entrapment of the pazopanib as we increased the amount of
PB copolymer used in the preparation of nanoparticles. When the ratios of pazopanib to PB
copolymer were 1:5 and 1:10, entrapment efficiencies of pazopanib in NPs were 85.6±9.05 and
92.9±7.9% respectively (Table 5.2). It is possible that higher polymer content leads to enhanced
hydrophobic interactions with pazopanib. This could be the explanation for higher entrapment of
pazopanib in NPs with higher polymer content. The DL % was found to be 13.09±1.05 and
8.36±0.58% for pazopanib loaded NP batches 1:5 and 1:10 respectively.
Table 5.2: Characterization of pazopanib loaded PB copolymer NPs
Ratio of
Drug:Polymer
Entrapment
Efficiency (%)
Drug Loading (%) Particle Size (nm)
1:5 85.6±9.05 13.09±1.05 423.5±15.9
1:10 92.9±7.9 8.36±0.58 514.2±10.3
In Vitro Release Studies
Finally, we studied the release of pazopanib from NPs (ratio of pazopanib:PB 1:5). NPs
demonstrated bi-phasic release profile i.e., initial burst release phase followed by a phase of
sustained release (Fig.5.8). Sustained release of pazopanib from nanoparticles was observed over
~100 days with minimal burst effect (≈ 7% in first 2 days). Releases of a drug molecule from PB
nanoparticles involve various phases. Burst effect was observed due to initial release of drug
adsorbed on the surface of nanoparticles. After this phase, drug is released from NPs by following
a slower diffusion phase. Due to different rate of diffusion of pazopanib from NPs, variation in
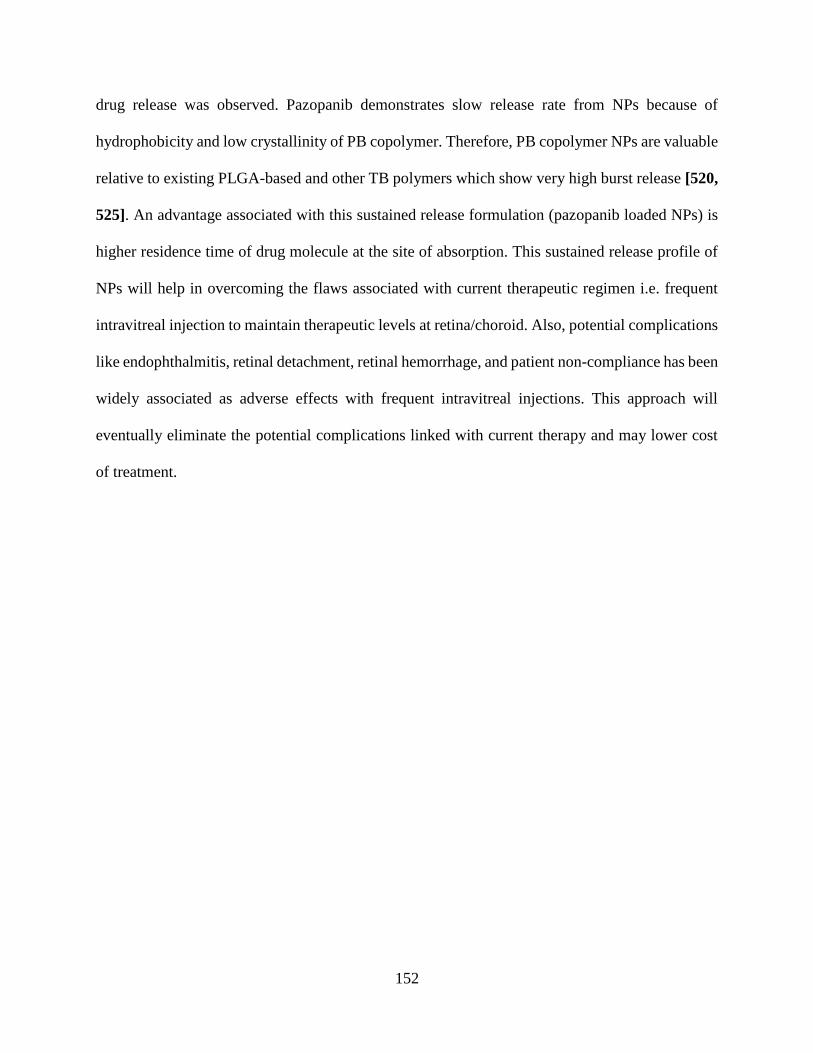
152
drug release was observed. Pazopanib demonstrates slow release rate from NPs because of
hydrophobicity and low crystallinity of PB copolymer. Therefore, PB copolymer NPs are valuable
relative to existing PLGA-based and other TB polymers which show very high burst release [520,
525]. An advantage associated with this sustained release formulation (pazopanib loaded NPs) is
higher residence time of drug molecule at the site of absorption. This sustained release profile of
NPs will help in overcoming the flaws associated with current therapeutic regimen i.e. frequent
intravitreal injection to maintain therapeutic levels at retina/choroid. Also, potential complications
like endophthalmitis, retinal detachment, retinal hemorrhage, and patient non-compliance has been
widely associated as adverse effects with frequent intravitreal injections. This approach will
eventually eliminate the potential complications linked with current therapy and may lower cost
of treatment.
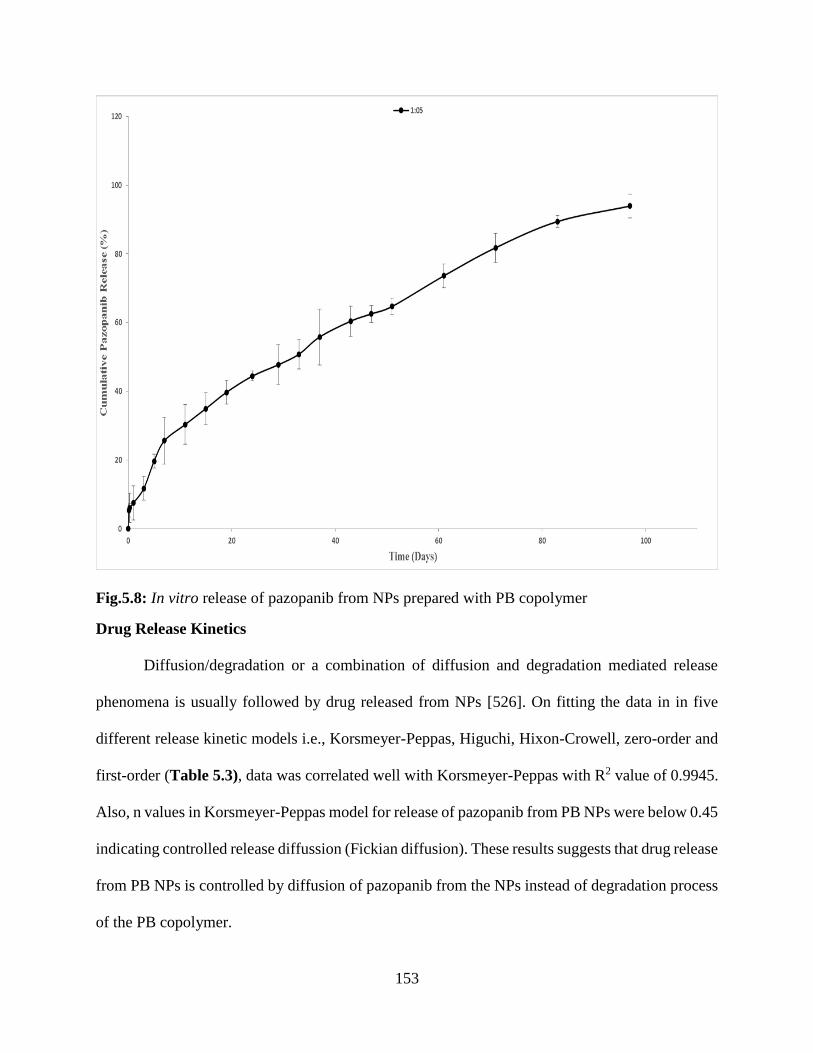
153
Fig.5.8: In vitro release of pazopanib from NPs prepared with PB copolymer
Drug Release Kinetics
Diffusion/degradation or a combination of diffusion and degradation mediated release
phenomena is usually followed by drug released from NPs [526]. On fitting the data in in five
different release kinetic models i.e., Korsmeyer-Peppas, Higuchi, Hixon-Crowell, zero-order and
first-order (Table 5.3), data was correlated well with Korsmeyer-Peppas with R2 value of 0.9945.
Also, n values in Korsmeyer-Peppas model for release of pazopanib from PB NPs were below 0.45
indicating controlled release diffussion (Fickian diffusion). These results suggests that drug release
from PB NPs is controlled by diffusion of pazopanib from the NPs instead of degradation process
of the PB copolymer.
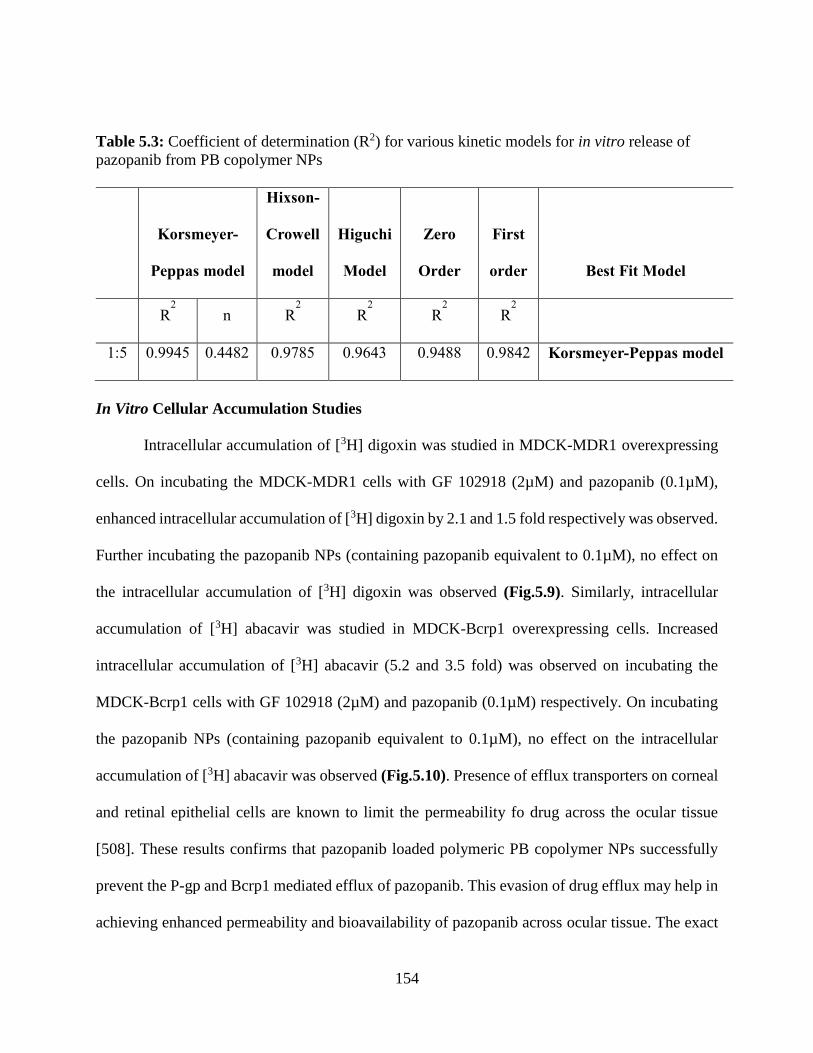
154
Table 5.3: Coefficient of determination (R2) for various kinetic models for in vitro release of
pazopanib from PB copolymer NPs
Korsmeyer-
Peppas model
Hixson-
Crowell
model
Higuchi
Model
Zero
Order
First
order Best Fit Model
R2
n R2
R2
R2
R2
1:5 0.9945 0.4482 0.9785 0.9643 0.9488 0.9842 Korsmeyer-Peppas model
In Vitro Cellular Accumulation Studies
Intracellular accumulation of [3H] digoxin was studied in MDCK-MDR1 overexpressing
cells. On incubating the MDCK-MDR1 cells with GF 102918 (2µM) and pazopanib (0.1µM),
enhanced intracellular accumulation of [3H] digoxin by 2.1 and 1.5 fold respectively was observed.
Further incubating the pazopanib NPs (containing pazopanib equivalent to 0.1µM), no effect on
the intracellular accumulation of [3H] digoxin was observed (Fig.5.9). Similarly, intracellular
accumulation of [3H] abacavir was studied in MDCK-Bcrp1 overexpressing cells. Increased
intracellular accumulation of [3H] abacavir (5.2 and 3.5 fold) was observed on incubating the
MDCK-Bcrp1 cells with GF 102918 (2µM) and pazopanib (0.1µM) respectively. On incubating
the pazopanib NPs (containing pazopanib equivalent to 0.1µM), no effect on the intracellular
accumulation of [3H] abacavir was observed (Fig.5.10). Presence of efflux transporters on corneal
and retinal epithelial cells are known to limit the permeability fo drug across the ocular tissue
[508]. These results confirms that pazopanib loaded polymeric PB copolymer NPs successfully
prevent the P-gp and Bcrp1 mediated efflux of pazopanib. This evasion of drug efflux may help in
achieving enhanced permeability and bioavailability of pazopanib across ocular tissue. The exact
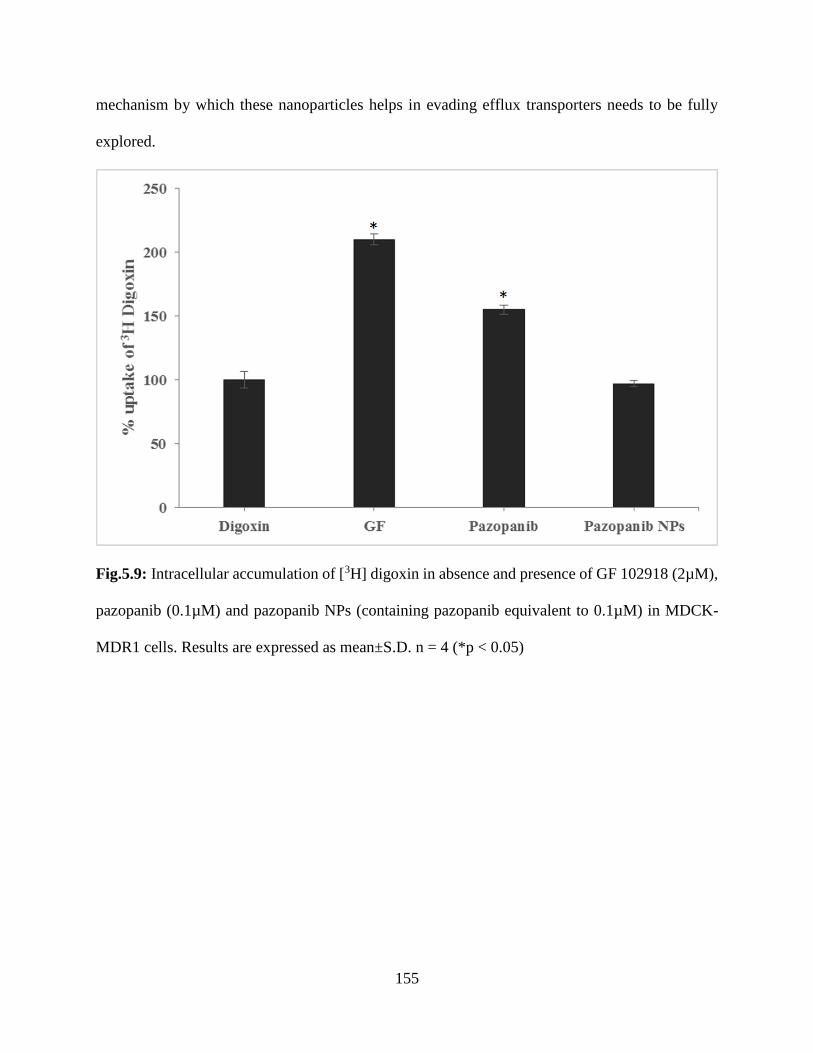
155
mechanism by which these nanoparticles helps in evading efflux transporters needs to be fully
explored.
Fig.5.9: Intracellular accumulation of [3H] digoxin in absence and presence of GF 102918 (2µM),
pazopanib (0.1µM) and pazopanib NPs (containing pazopanib equivalent to 0.1µM) in MDCK-
MDR1 cells. Results are expressed as mean±S.D. n = 4 (*p < 0.05)
156
Fig.5.10: Intracellular accumulation of [3H] abacavir in absence and presence of GF 102918
(2µM), pazopanib (0.1µM) and pazopanib NPs (containing pazopanib equivalent to 0.1µM) in
MDCK-Bcrp1 cells. Results are expressed as mean±S.D. n = 4 (*p < 0.05)
Conclusion
We have successfully synthesized and characterized novel PB copolymer. These PB
copolymers were studied for the development of pazopanib loaded NPs in the treatment of ocular
neovascularization. Our results demonstrate that the synthesized PB polymers does not exhibit any
cytotoxicity on ocular cell lines. Also, in vitro inflammatory studies confirmed that PB copolymer
is an excellent biomaterial for the development of pazopanib loaded sustained delivery formulation
for the treatment of ocular neovascularization. Pazopanib loaded PB NPs were successful in
evading drug efflux. Nanoparticles prepared from PB copolymers had overcome the restrictions
associated with existing PLGA or TB based copolymer NPs such as burst release effect and
provided sustained release for longer duration. Novel PB copolymers are excellent biomaterials
157
and could serve as a vehicle not only for ocular drug delivery but also for other disorders where
sustained levels of tyrosine kinase inhibitors is vital.
Acknowledgement
This work was supported by National Institutes of Health grant R01EY09171-16 and
R01EY010659-14.
158
CHAPTER 6
FUNCTIONAL CHARACTERIZATION AND MOLECULAR IDENTIFICATION OF
VITAMIN C TRANSPORTER (SVCT2) IN HUMAN CORNEAL EPITHELIAL (HCEC) AND
RETINAL PIGMENT EPITHELIAL (D407) CELLS
Rationale
Ascorbic acid (AA, vitamin C) is an essential water-soluble vitamin required for various
physiological and metabolic functions. It is a potent reducing agent that effectively quenches
various reactive oxygen species (ROS), absorbs ultraviolet (UV) radiation and protects cornea,
lens and other intraocular tissues against light-induced damage [458, 527]. Levels of antioxidant
AA in aqueous humor plays an important role in the prevention of cataract. Human ocular tissues
contain considerably higher amounts of ascorbic acid (1.33mg/g wet weight in corneal epithelium,
0.20mg/ml in aqueous humor, 23mg/100g in neural retina and 5mg/100mg in retinal pigment
epithelium (RPE)/choroid) [458, 528]. Concentration of ascorbic acid in human tear fluid (23μM)
is responsible for rapid wound healing and tear stability during ocular infections. Protective role
of AA against various ocular infections and UV induced damage of ocular tissue suggests the need
to scrutinize the mechanism of AA transport across ocular tissues (mainly, cornea and retina)
[458].
Human and other primates cannot synthesize AA thus making this vitamin an essential
dietary requirement. Therefore, AA is usually obtained from exogenous sources through the
dietary intake [462]. AA uptake has already been reported in intestine [453], brain [457], kidney
[454], skin [461], eye [458, 459] and bone [460] via specific transporter system. Human SLC23
family consists of two isoforms of sodium-dependent vitamin C transporters (SVCT) namely
SVCT1 and SVCT2 [529]. Comparative analysis of two isoforms reveals that AA exhibits higher
159
affinity towards SVCT2 than SVCT1. Both SVCT1 and SVCT2 express close sequence homology
and functional similarity but vary in distribution [458]. Structural and functional studies shows
that transport of AA across various epithelial cells is mainly mediated via SVCT [458, 462].
In recent years, transporter targeted drug delivery has been widely employed to improve
the drug absorption across biological membranes. In order to enhance drug permeation and
absorption, active agent is chemically modified with transporter targeted moieties. Interaction
between targeting moiety and the transporter will facilitate transport of conjugated drug across the
cell membrane [437]. Many investigators have exploited SVCT2 as an important target for drug
delivery across various membranes. AA conjugated saquinavir shows higher absorptive
permeability and metabolic stability compared to saquinavir alone [530]. Conjugation of nipecotic,
kynurenic and diclophenamic acids with AA has been utilized as an important tool in studying the
mechanism of AA prodrugs interactions with vitamin C transporters across RPE cells. This
approach has provided a new perspective for transporter/receptor targeted prodrug delivery by
means of SVCT2 transporter system [531].
Hence, SVCT targeted drug delivery can be utilized as a vital strategy for enhancing
intracellular accumulation of drugs in ocular complications. The aim of this study is to investigate
the presence of a specialized carrier mediated transport system (SVCT2) across human corneal
(HCEC) and retinal (D407) cells.
The presence of SVCT on rabbit cornea and Madin-Darby canine kidney cells has been
previously reported from our laboratory [458, 462]. Variation in structural and biological
properties between the rabbit and human eye suggest that the expression of transporters and
receptors can highly differ. These anatomical and functional disparities among various species
make it difficult to determine their impact on ocular drug absorption in human [438]. This
160
compelled us to study the practicality of human derived ocular cell lines as in vitro models for
ocular drug absorption.
In the present study, we evaluated the ascorbic acid uptake process, kinetics as well as the
expression, relative contribution, and regulation of the SVCT2 in HCEC and D407 cells. No
information currently exists with regard to a comprehensive study of AA carrier mediated uptake
across HCEC and D407 cells. Results obtained from this study may indicate involvement of a
specific and high affinity carrier transport system (SVCT2) for translocation of AA.
Material And Methods
Materials
[14C] Ascorbic acid ([14C] AA specific activity 8.5 mCi/mM) was procured from Perkin
Elmer (Boston, MA, USA). Unlabeled L-ascorbic acid, D-iso-ascorbic acid, dehydro-ascorbic acid
(DHAA), glucose, para amino hippuric acid (PAHA), sodium azide, ouabain, 2,4-dinitrophenol,
choline chloride, HEPES, bovine insulin, human epidermal growth factor, Triton X-100, phorbol-
12-myristate-13-acetate (PMA), bisindolylmaleimide I (BIS), 3-isobutyl-1-methylxanthine
(IBMX), 4,4’-di-isothiocyanatostilbene- 2,2’-disulphonic acid (DIDS), 4-acetamido-4’-
isothiocyanostilbene-2,2’-disulfonic acid (SITC), and D-glucose were purchased from Sigma
Chemical Co (St. Louis, MO, USA). Dulbecco’s modified Eagle’s medium (DMEM) and
Dulbecco’s Modified Eagle Medium: Nutrient Mixture F-12 (DMEM/F-12) were purchased from
Invitrogen (Carlsbad, CA, USA). Fetal bovine serum (FBS) was obtained from Atlanta biologicals
(Lawrenceville, GA, USA). Culture flasks (75 cm2 growth area) and uptake plates (3.8 cm2 growth
area) were obtained from Corning Costar Corp. (Cambridge, MA, USA). The buffers for cDNA
synthesis and amplification (oligodT, dNTP, MgCl2, M-MLV reverse transcriptase and Taq
polymerase) were procured from Promega Corporation (Madison, WI, USA). Light Cycler 480®
161
SYBR I green master mix was obtained from Roche Applied Science (Indianapolis, IN, USA).
Qualitative and quantitative primers used in the study were custom-designed and obtained from
Invitrogen Life Technologies (Carlsbad, CA, USA). All other chemicals were obtained from Fisher
Scientific Co. (Fair Lawn, NJ, USA) and utilized without further purification.
Cell Culture
HCEC and D407 cells were generous gifts from Dr.Araki-Sasaki (Kinki Central Hospital,
Japan) and Dr.Richard Hunt (University or South Carolina, Columbia, SC, USA), respectively.
HCEC cells were cultured according to previously published protocol [511, 512] [513]. Cells of
passage numbers between 25 and 30 were cultured at 37°C, humidified 5% CO2/95% air
atmosphere in a DMEM/F-12 culture medium supplemented with 15% (v/v) FBS (heat
inactivated), 15 mM HEPES, 22 mM NaHCO3, 100 mg of penicillin and streptomycin each, 5
μg/ml insulin, and 10 ng/ml of human epidermal growth factor.
D407 cells (passage numbers between 75 and 80) were grown at 37°C, humidified 5%
CO2/95% air atmosphere in a DMEM culture medium supplemented with 10% (v/v) FBS (heat
inactivated), 29 mM NaHCO3, 20 mM HEPES, 100 mg of penicillin and streptomycin each, and
1% nonessential amino acids at pH 7.4 [514, 515]. The growth medium was changed every
alternate day. Both HCEC and D407 cells were cultured in 75 cm2 flasks, harvested at 80–90%
confluency with TrypLE™ Express (Invitrogen, Carlsbad, CA, USA). Cells were then plated in
24-well uptake plates at a density of 300,000 cells/well. Cells were grown in a similar way as
mentioned above and utilized for additional studies.
Uptake Studies
Confluent HCEC and D407 cells were utilized for uptake experiments. Following media
removal, cells were rinsed thrice for 5 min each with 1–2 ml of Dulbecco’s phosphate-buffered

162
saline (DPBS) containing 130 mM NaCl, 0.03 mM KCl, 7.5 mM Na2HPO4, 1.5 mM KH2PO4, 1
mM CaCl2, 0.5 mM MgSO4, 20 mM HEPES, and 5 mM glucose maintained at pH 7.4. Uptake
studies were initiated by adding 250μl of solution containing 0.25 μCi/ml of [14C] AA in the
presence and absence of various competing substrates. Following incubation, the solution was
removed and uptake was terminated with 2 ml of ice-cold stop solution containing 200 mM KCl
and 2 mM HEPES. The cell monolayer was washed thrice, 5 min each and 1ml of lysis buffer
(0.1% Triton-X solution in 0.3% NaOH) was added to each well and plates were stored overnight
at room temperature. Subsequently, the cell lysate (400μl) from each well was transferred to
scintillation vials containing 3 ml of scintillation cocktail (Fisher Scientific, Fairlawn, NJ, USA).
Samples were quantified by measuring the radioactivity using liquid scintillation counter
(Beckman Instruments Inc., Fullerton, CA, USA, model LS-6500). Protein content of each sample
was estimated by BioRad Protein Estimation Kit (BioRad Protein Estimation Kit, Hercules, CA,
USA).
Time And Temperature Dependency
Optimum time for [14C] AA uptake was determined by performing the uptake studies over
various time points (5, 10, 15, 30, 45 and 60 min). The uptake study was conducted according to
previously published protocol [511-513].
The effect of temperature on [14C] AA uptake was determined by carrying out the uptake
study at different temperatures i.e. 4ºC, 25ºC and 37ºC.
pH And Ion Dependency
The effect of pH on [14C] AA uptake was observed by adjusting the buffer pH to 5, 6, 6.5,
7.4 and 8. For delineating the role of sodium ions on [14C] AA uptake, sodium chloride (NaCl) and
sodium phosphate dibasic (Na2HPO4) in DPBS were substituted with equimolar quantities of
163
choline chloride and potassium phosphate dibasic (KH2PO4), respectively. Hill coefficient for AA
uptake, as function of Na+ was determined. In a similar way, buffer solution containing sodium
(130 mM), potassium (0.03 mM), and calcium (1 mM) chlorides were replaced with equimolar
quantities of sodium phosphate, potassium phosphate, and calcium acetate, respectively.
In another study, cells were pre-incubated with 1 mM amiloride (sodium channel inhibitor)
and the uptake study was carried out as mentioned earlier.
Concentration Dependency
Several working concentrations of L-AA were prepared ranging from (0.12μM - 1000μM)
in DPBS (pH 7.4) spiked with [14C] AA (0.25μCi/ml). The data was fitted to Michaelis -Menten
equation and the maximum transport rate (Vmax) and Michaelis-Menten constant (Km) were
calculated according to nonlinear least squares regression analysis program; GraphPad Prism
version 5.
Role Of Metabolic And Membrane Transport Inhibitors
For energy dependency, simultaneous incubation of [14C] AA along with metabolic
inhibitors such as ouabain (Na+/K+ ATPase inhibitor), 2,4-dinitrophenol (intracellular ATP
reducer) and sodium azide (oxidative phosphorylation inhibitor) was performed for 1h. In order to
examine the effect of anionic membrane transport inhibitors, cells were pre-incubated with 1mM
SITC, DIDS and probenecid for 1h.
Substrate Specificity
The substrate specificity for SVCT was delineated by carrying out [14C] AA uptake in the
presence of three different concentrations of (250, 500 and 1000µM) unlabeled L-AA and
structural analogs such as D-Iso AA and DHAA. A similar study was carried out at three different
164
concentrations of (250, 500 and 1000µM) various structurally unrelated analogs such as glucose
(Glucose transporter/GLUT substrate) and PAHA (organic anion transporter/OAT substrate).
Intracellular Regulation
The influence of various intracellular regulatory pathways such as Ca++/calmodulin, PTK
(protein tyrosine kinase), PKC (protein kinase C) and PKA (protein kinase A) pathway on [14C]
AA uptake was also investigated. Cells were pre-incubated with three different concentrations of
modulators such as calmidazolium (CaM) and KN-62 to delineate if the process is dependent on
Ca++/calmodulin pathway or not. In order to examine the role of PTK pathway in [14C] AA uptake,
cells were pre-incubated with three different concentrations of genistin and tyrphostin A25. For
studying the effect of PKC pathway, cells were pre-incubated with three different concentrations
of BIS and PMA. The effect of PKA pathway was studied by incubating cells with three different
concentrations of IBMX and forskolin. Uptake of [14C] AA was then performed according to the
procedure.
Reverse Transcription–Polymerase Chain Reaction
Reverse transcription– polymerase chain reaction (RT-PCR) analysis was employed to
determine the expression of SVCT2 on HCEC and D407 at the molecular level. TRIzol® reagent
(Invitrogen, USA) was used to carry out the cell lysis and chloroform was added to the lysate for
phase separation. Following separation of aqueous phase containing RNA, isopropanol was added
to precipitate RNA. Obtained RNA was rinsed twice with 75% ethanol followed by resuspension
in RNase-DNase free water. The concentration and purity of RNA was determined using Nanodrop
(Thermo Fisher Scientific, Wilmington, DE, USA). RNA was reverse-transcribed to obtain cDNA
using oligodT as a template and M-MLV reverse transcriptase. The conditions for reverse
transcription were: denaturation of the template RNA for 5 min at 70°C; reverse transcription for
165
60 min at 42°C followed by final extension at 72°C for 5 min. cDNA obtained was then subjected
to PCR for amplification of SVCT with specific primers. The primers (5′→3′) designed for SVCT2
were: forward: CCAGCGGTGAGCAGGACAAT, reverse primer:
TAGGGCCACCGTGGGTGTAA. These primers correspond to a 626 base pair (bp) product in
human SVCT2 cDNA. The conditions of PCR amplification were: denaturation for 30 s at 94°C,
annealing for 1 min at 56°C, and extension for 1 min at 72°C, for 45 cycles followed by a final
extension for 5 min at 72°C. PCR product was analyzed by gel electrophoresis on 1.5% agarose in
TAE buffer and visualized under UV [438].
Quantitative Real-Time PCR
Following reverse transcription, quantitative real-time PCR (qPCR) was performed with
LightCycler® SYBR green technology (Roche). cDNA equivalent to 80 ng in each well was
subjected to amplification with specific primers. Glyceraldehyde-3-phosphate dehydrogenase
(GAPDH) was selected as an internal control to normalize the amount of cDNA in each well. The
sequences of real-time primers (5′→3′) used for SVCT2 were: forward:
CCAGCGGTGAGCAGGACAAT, reverse primer: TAGGGCCACCGTGGGTGTAA, GAPDH:
forward—ATCCCTCCAAAATCAAGTGG and reverse—GTTGTCATGGATGACCTTGG. A
preliminary experiment was performed to ensure that SVCT2 and GAPDH were amplified with
equal efficiencies. The specificity of these primers was also confirmed with melting-curve
analysis. The comparative threshold method was applied to calculate the relative amount of
SVCT2 in HCEC and D407 cells [438, 532].

166
Data Analysis
Radioactive Sample Analysis
Uptake of [14C] AA was calculated using disintegrations per minute (DPM) of sample and
donor solutions as represented in Eq. 1
𝑪𝒔𝒂𝒎𝒑𝒍𝒆 =𝑫𝑷𝑴𝒔𝒂𝒎𝒑𝒍𝒆 ∗ 𝑪𝒅𝒐𝒏𝒐𝒓
𝑫𝑷𝑴𝒅𝒐𝒏𝒐𝒓 𝐄𝐪. 𝟏
DPMsample and DPMdonor represent average values of DPM counts of sample and donor
respectively (n=4); Cdonor denotes concentration of donor used and Csample represents the
concentration of sample.
Calculation Of Michaelis-Menten Kinetic Parameters
In order to determine Km and Vmax associated with [14C] AA uptake, concentration-
dependency data was fitted to a modified Michaelis–Menten equation (Eq.2)
𝒗 =𝑽𝒎𝒂𝒙[𝑪]
𝑲𝒎 + [𝑪]+ 𝑲𝒅[𝑪] 𝐄𝐪. 𝟐
v represents the total uptake, Vmax stands for the maximum uptake rate for the carrier-
mediated process, Km is Michaelis–Menten constant which represents the concentration at half
saturation, Kd is a non-saturable diffusion rate constant and C is substrate concentration. In Eq.
(2), (Vmax*C)/(Km+C) represents carrier mediated saturable process whereas Kd(C) gives the non-
saturable diffusion component. Data was fitted to a non-linear least-square regression analysis
program (GraphPad Prism 5.0). Michaelis Menten kinetic parameters were calculated to determine
saturable and non-saturable component of the total uptake.
Calculation Of Hill Ratio
Na+:L-Ascorbic acid coupling ratio was determined using the logarithmic form of the Hill
equation (Eq. 3)
167
𝑳𝒐𝒈 [𝒗′
𝑽𝒎𝒂𝒙− 𝒗′] = 𝒏𝒍𝒐𝒈(𝑺) − 𝒍𝒐𝒈𝑲′ 𝐄𝐪. 𝟑
v’ denotes initial velocity, Vmax represents the maximal velocity, n is number of substrate
binding sites, S denotes the substrate concentration, and K’ is a constant comprising multiple
interaction factors and intrinsic dissociation constant.
Statistical Analysis
All the experiments were conducted at least in quadruplicate (n=4) and the outcomes were
expressed as mean±standard deviation (SD). To calculate statistical significance, student’s t test
was performed. Any difference between mean values is considered statistically significant for P
value ≤0.05.
Results
Time And Temperature Dependency
Time dependent uptake of [14C] AA (29.4µM) in HCEC and D407 cells is depicted in
Fig.6.1. Linear uptake of [14C] AA was noticed upto 60 min of incubation period. Therefore, 30
min uptake time was selected for further uptake experiments.
Effect of temperature on the uptake of AA by HCEC and D407 cells was studied. Fig.6.2
clearly depicts that the uptake of [14C] AA in HCEC and D407 cells was maximal at 37 °C. Uptake
of [14C] AA in HCEC shows 45% and 80% decrease when the temperature was reduced to 25°C
and 4°C respectively. In D407 cells, uptake was reduced to 60% and 20% when measured at 25°C
and 4°C respectively, suggesting that the process may be carrier mediated in both cell lines.
Activation energy (Ea) was calculated by plotting the temperature dependent data i.e. Uptake rate
Ln(v) vs. 1/T (Fig.6.3) Ea was calculated to be 7.80 kcal/mol and 7.23 kcal/mol in HCEC and
D407 cells respectively.

168
Fig.6.1: Time course of [14C] AA uptake across HCEC and D407 cells. Uptake of [14C] ascorbic
acid ([14C] AA) was measured in DPBS buffer (pH 7.4) at 37ºC. Data is shown as mean±S.D. n=4.
S.D. means standard derivation.
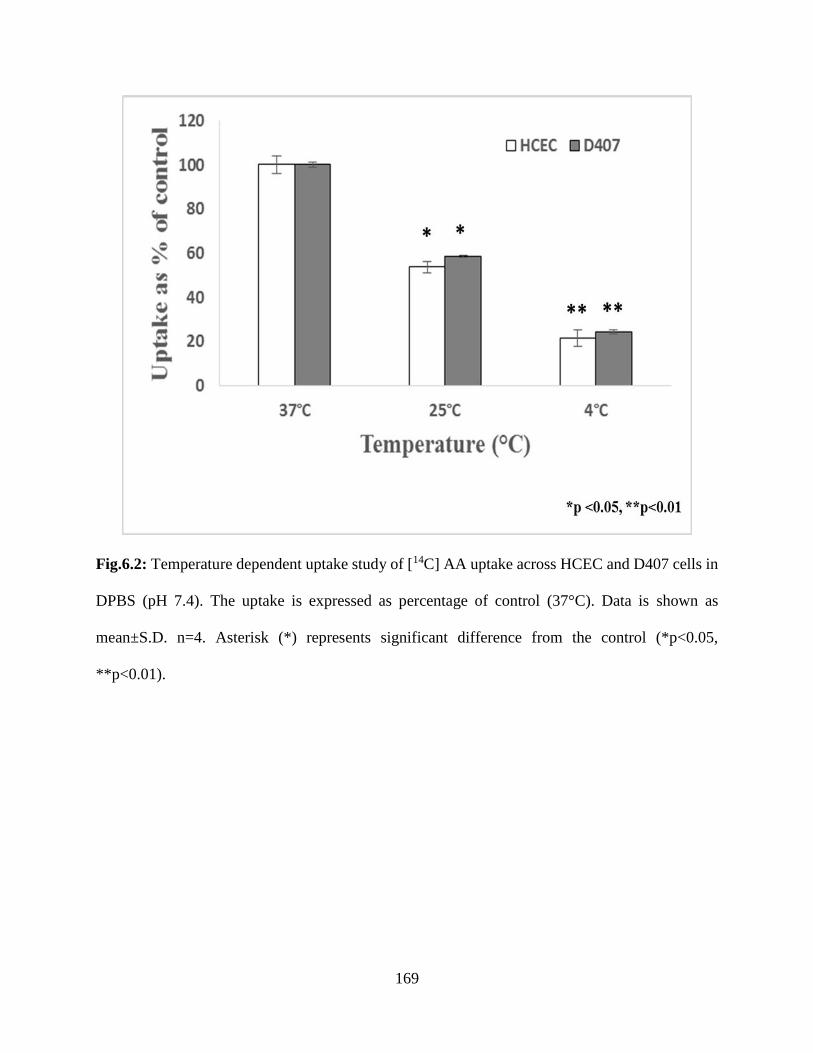
169
Fig.6.2: Temperature dependent uptake study of [14C] AA uptake across HCEC and D407 cells in
DPBS (pH 7.4). The uptake is expressed as percentage of control (37°C). Data is shown as
mean±S.D. n=4. Asterisk (*) represents significant difference from the control (*p<0.05,
**p<0.01).
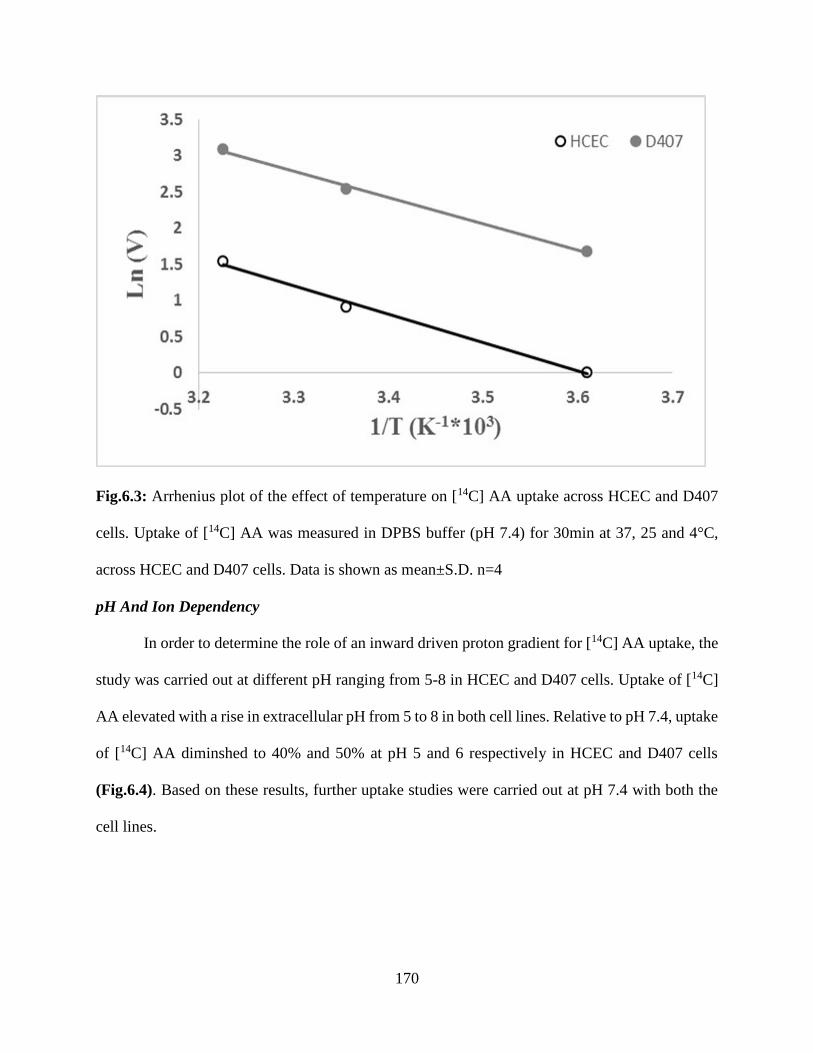
170
Fig.6.3: Arrhenius plot of the effect of temperature on [14C] AA uptake across HCEC and D407
cells. Uptake of [14C] AA was measured in DPBS buffer (pH 7.4) for 30min at 37, 25 and 4°C,
across HCEC and D407 cells. Data is shown as mean±S.D. n=4
pH And Ion Dependency
In order to determine the role of an inward driven proton gradient for [14C] AA uptake, the
study was carried out at different pH ranging from 5-8 in HCEC and D407 cells. Uptake of [14C]
AA elevated with a rise in extracellular pH from 5 to 8 in both cell lines. Relative to pH 7.4, uptake
of [14C] AA diminshed to 40% and 50% at pH 5 and 6 respectively in HCEC and D407 cells
(Fig.6.4). Based on these results, further uptake studies were carried out at pH 7.4 with both the
cell lines.
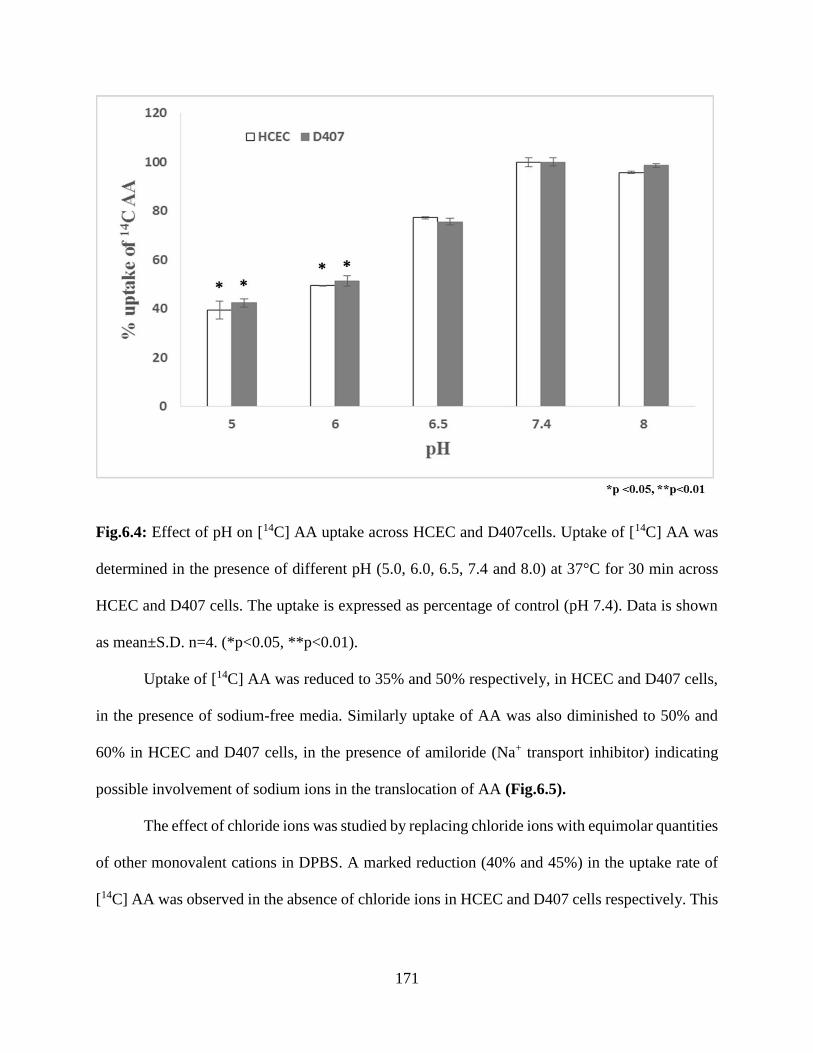
171
Fig.6.4: Effect of pH on [14C] AA uptake across HCEC and D407cells. Uptake of [14C] AA was
determined in the presence of different pH (5.0, 6.0, 6.5, 7.4 and 8.0) at 37°C for 30 min across
HCEC and D407 cells. The uptake is expressed as percentage of control (pH 7.4). Data is shown
as mean±S.D. n=4. (*p<0.05, **p<0.01).
Uptake of [14C] AA was reduced to 35% and 50% respectively, in HCEC and D407 cells,
in the presence of sodium-free media. Similarly uptake of AA was also diminished to 50% and
60% in HCEC and D407 cells, in the presence of amiloride (Na+ transport inhibitor) indicating
possible involvement of sodium ions in the translocation of AA (Fig.6.5).
The effect of chloride ions was studied by replacing chloride ions with equimolar quantities
of other monovalent cations in DPBS. A marked reduction (40% and 45%) in the uptake rate of
[14C] AA was observed in the absence of chloride ions in HCEC and D407 cells respectively. This
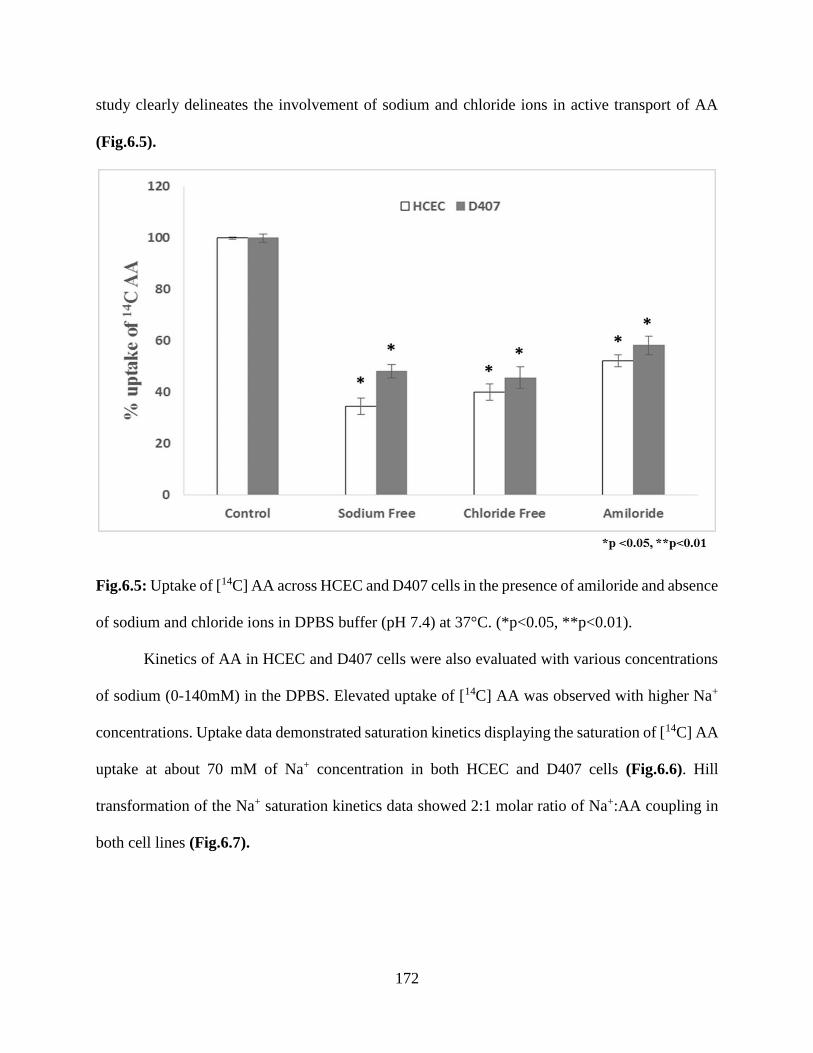
172
study clearly delineates the involvement of sodium and chloride ions in active transport of AA
(Fig.6.5).
Fig.6.5: Uptake of [14C] AA across HCEC and D407 cells in the presence of amiloride and absence
of sodium and chloride ions in DPBS buffer (pH 7.4) at 37°C. (*p<0.05, **p<0.01).
Kinetics of AA in HCEC and D407 cells were also evaluated with various concentrations
of sodium (0-140mM) in the DPBS. Elevated uptake of [14C] AA was observed with higher Na+
concentrations. Uptake data demonstrated saturation kinetics displaying the saturation of [14C] AA
uptake at about 70 mM of Na+ concentration in both HCEC and D407 cells (Fig.6.6). Hill
transformation of the Na+ saturation kinetics data showed 2:1 molar ratio of Na+:AA coupling in
both cell lines (Fig.6.7).
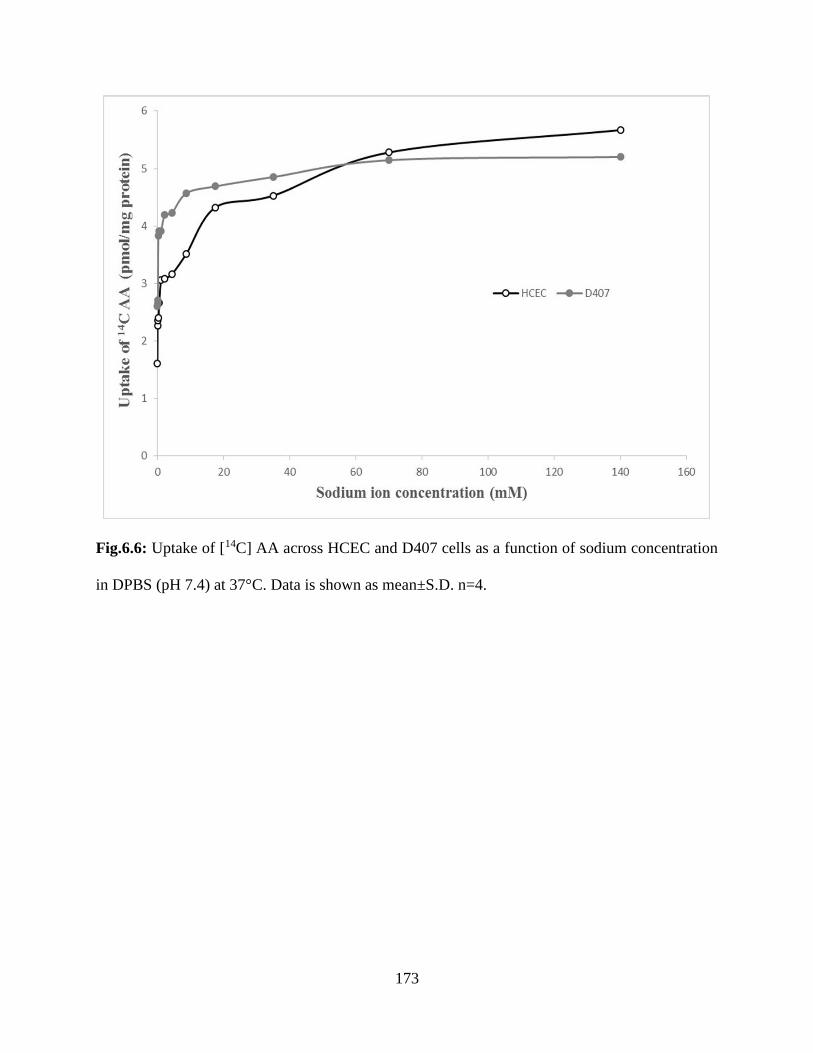
173
Fig.6.6: Uptake of [14C] AA across HCEC and D407 cells as a function of sodium concentration
in DPBS (pH 7.4) at 37°C. Data is shown as mean±S.D. n=4.

174
Fig.6.7: Hill plot of sodium-dependent uptake of [14C] AA across HCEC and D407 cells.
Concentration Dependency
Michaelis Menten saturation kinetics of AA uptake were investigated by incubating HCEC
and D407 cells with various concentrations (0.12-1000µM) of unlabeled AA for 30 min at 37°C.
The uptake process involves both the saturable carrier mediated pathway and non-saturable
diffusional process in both HCEC and D407 cells.
Uptake study performed at 4°C clearly delineated the passive diffusion component from
the AA transport in both HCEC and D407 cells. The carrier mediated process of AA uptake in
both the cell lines was plotted as the difference of total uptake of AA at 37°C and passive uptake
of AA at 4°C. Uptake of [14C] AA in HCEC cells was found to be concentration-dependent and
saturable with Km and Vmax values of 46.14±6.03 μM and 17.34±0.58 pmol/mg protein/min,
respectively (Fig.6.8 and Table 6.1).
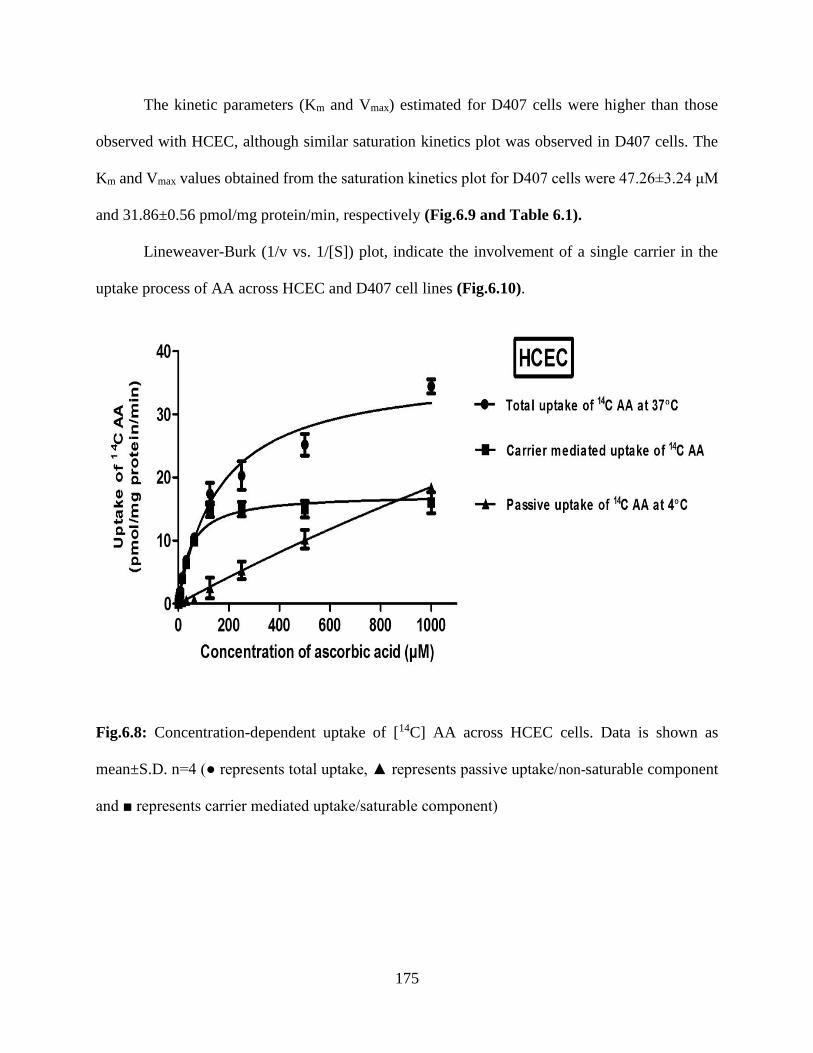
175
The kinetic parameters (Km and Vmax) estimated for D407 cells were higher than those
observed with HCEC, although similar saturation kinetics plot was observed in D407 cells. The
Km and Vmax values obtained from the saturation kinetics plot for D407 cells were 47.26±3.24 μM
and 31.86±0.56 pmol/mg protein/min, respectively (Fig.6.9 and Table 6.1).
Lineweaver-Burk (1/v vs. 1/[S]) plot, indicate the involvement of a single carrier in the
uptake process of AA across HCEC and D407 cell lines (Fig.6.10).
Fig.6.8: Concentration-dependent uptake of [14C] AA across HCEC cells. Data is shown as
mean±S.D. n=4 (● represents total uptake, ▲ represents passive uptake/non-saturable component
and ■ represents carrier mediated uptake/saturable component)
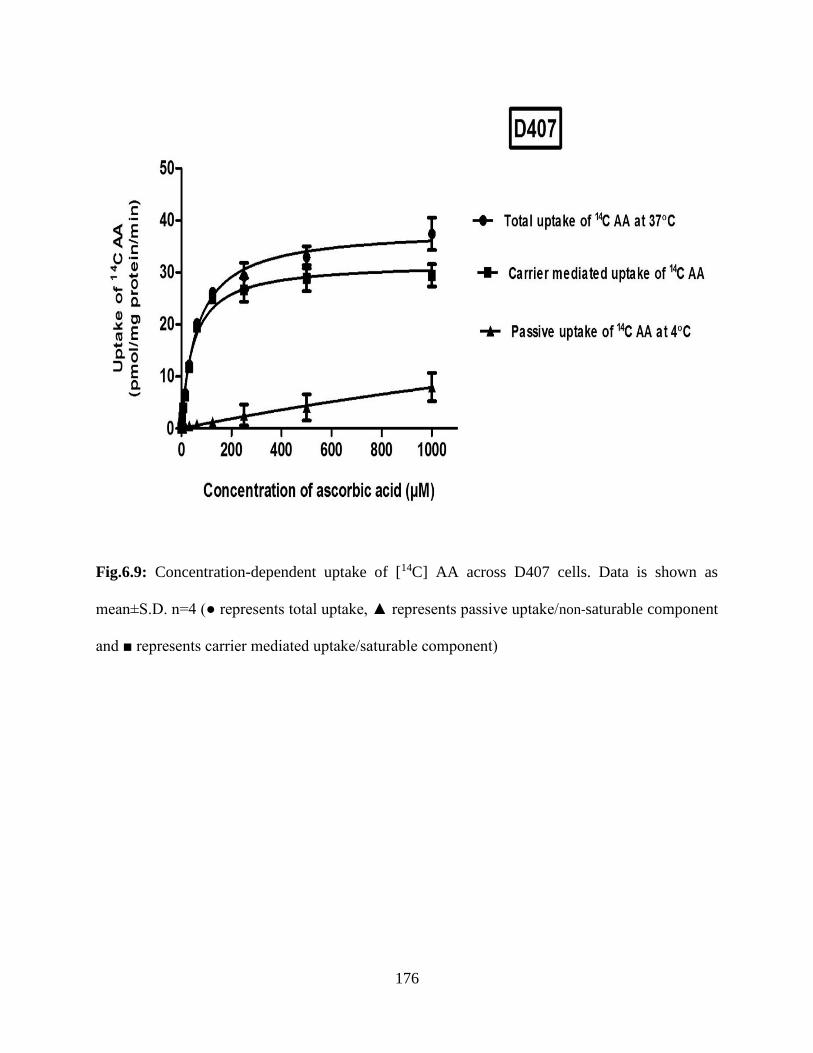
176
Fig.6.9: Concentration-dependent uptake of [14C] AA across D407 cells. Data is shown as
mean±S.D. n=4 (● represents total uptake, ▲ represents passive uptake/non-saturable component
and ■ represents carrier mediated uptake/saturable component)

177
Table 6.1: Michaelis–Menten kinetic parameters (Vmax and Km) and catalytic efficiency (Vmax/Km)
estimated for SVCT2 transporter system in HCEC and D407 cell lines. Units of Km: micromolar
(µM), Vmax: pmoles/mg protein/min and Vmax/Km: µl/mg protein/min.
Kinetic Parameters of SVCT2 HCEC D407
Km 46.14±6.03 47.26±3.24
Vmax 17.34±0.58 31.86±0.56
Vmax/Km 0.37 0.67
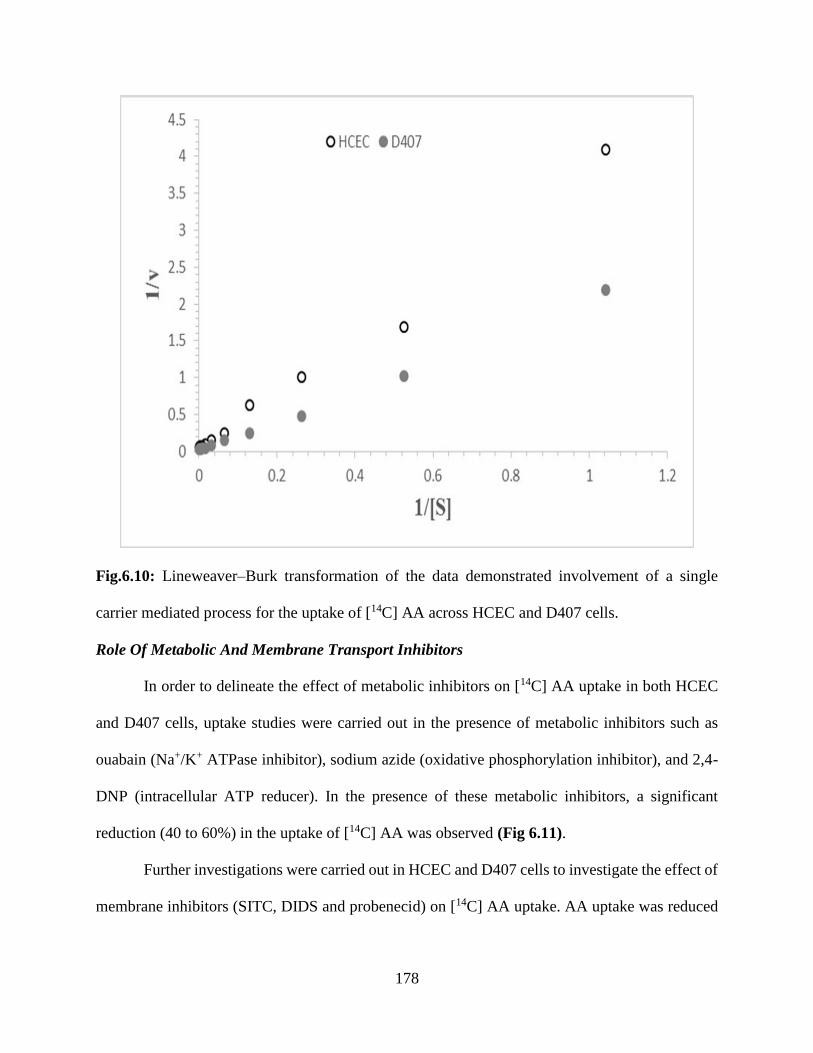
178
Fig.6.10: Lineweaver–Burk transformation of the data demonstrated involvement of a single
carrier mediated process for the uptake of [14C] AA across HCEC and D407 cells.
Role Of Metabolic And Membrane Transport Inhibitors
In order to delineate the effect of metabolic inhibitors on [14C] AA uptake in both HCEC
and D407 cells, uptake studies were carried out in the presence of metabolic inhibitors such as
ouabain (Na+/K+ ATPase inhibitor), sodium azide (oxidative phosphorylation inhibitor), and 2,4-
DNP (intracellular ATP reducer). In the presence of these metabolic inhibitors, a significant
reduction (40 to 60%) in the uptake of [14C] AA was observed (Fig 6.11).
Further investigations were carried out in HCEC and D407 cells to investigate the effect of
membrane inhibitors (SITC, DIDS and probenecid) on [14C] AA uptake. AA uptake was reduced
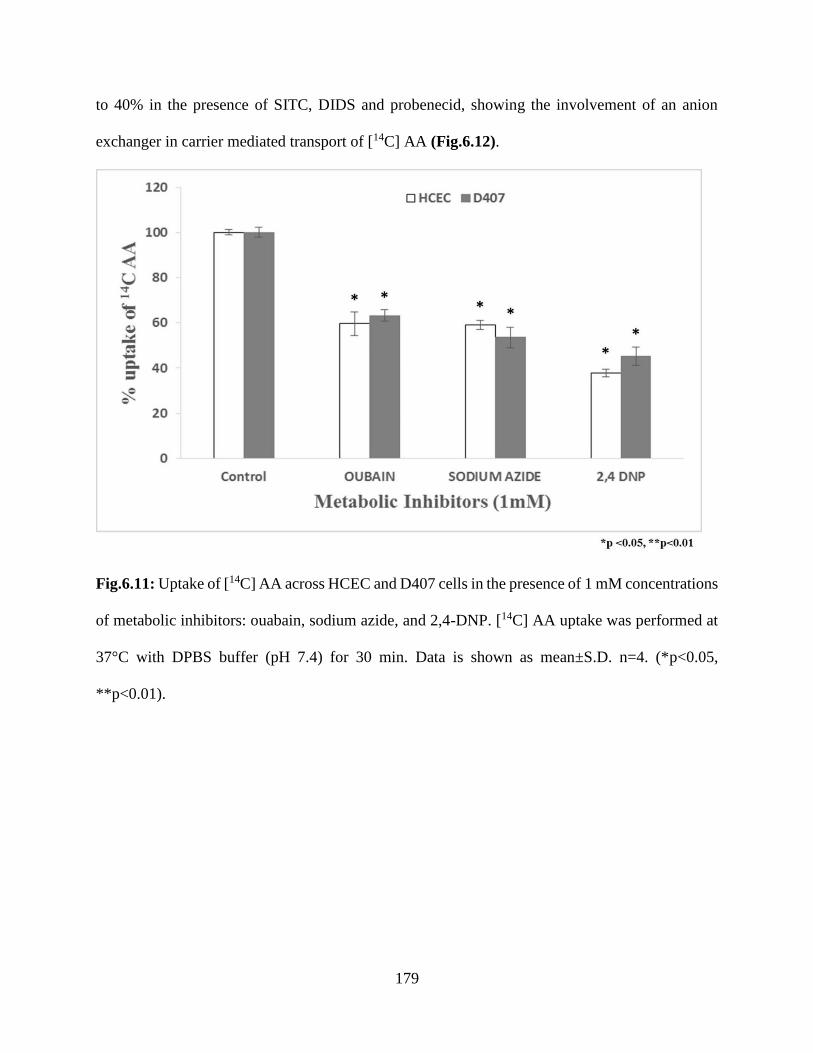
179
to 40% in the presence of SITC, DIDS and probenecid, showing the involvement of an anion
exchanger in carrier mediated transport of [14C] AA (Fig.6.12).
Fig.6.11: Uptake of [14C] AA across HCEC and D407 cells in the presence of 1 mM concentrations
of metabolic inhibitors: ouabain, sodium azide, and 2,4-DNP. [14C] AA uptake was performed at
37°C with DPBS buffer (pH 7.4) for 30 min. Data is shown as mean±S.D. n=4. (*p<0.05,
**p<0.01).
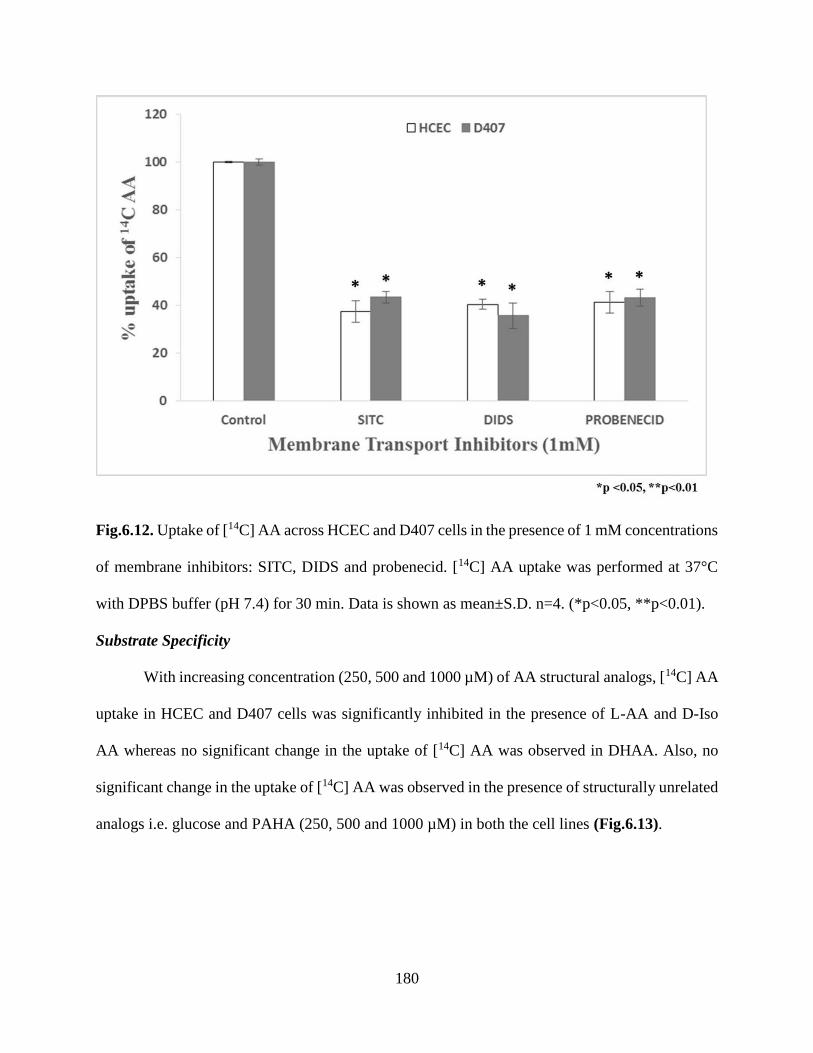
180
Fig.6.12. Uptake of [14C] AA across HCEC and D407 cells in the presence of 1 mM concentrations
of membrane inhibitors: SITC, DIDS and probenecid. [14C] AA uptake was performed at 37°C
with DPBS buffer (pH 7.4) for 30 min. Data is shown as mean±S.D. n=4. (*p<0.05, **p<0.01).
Substrate Specificity
With increasing concentration (250, 500 and 1000 µM) of AA structural analogs, [14C] AA
uptake in HCEC and D407 cells was significantly inhibited in the presence of L-AA and D-Iso
AA whereas no significant change in the uptake of [14C] AA was observed in DHAA. Also, no
significant change in the uptake of [14C] AA was observed in the presence of structurally unrelated
analogs i.e. glucose and PAHA (250, 500 and 1000 µM) in both the cell lines (Fig.6.13).

181
Fig.6.13. Uptake of [14C] AA in presence of L-ascorbic acid (L-AA), D-isoascorbic acid (D-Iso
AA), dehydro ascorbic acid (DHAA), D-glucose, and para-amino hippuric acid (PAHA) at three
different concentrations across HCEC and D407 Cells. [14C] AA uptake was performed at 37°C
with DPBS buffer (pH 7.4) for 30 min. Data is shown as mean±S.D. n=4. (*p<0.05, **p<0.01).
Intracellular Regulation
The role of different cellular regulation pathways on [14C] AA uptake was also
investigated. With increasing concentrations of calmidazolium and KN-62 ( modulators of
Ca++/calmodium (Ca++/CaM) pathway), reduced uptake of [14C] AA ranging from 25-41% and 27-
41% respectively in HCEC, and, 20-47% and 20-40% respectively in D407 cells were observed.
PKC activator, PMA (10-100 µM), significantly inhibited uptake of AA in the HCEC and D407
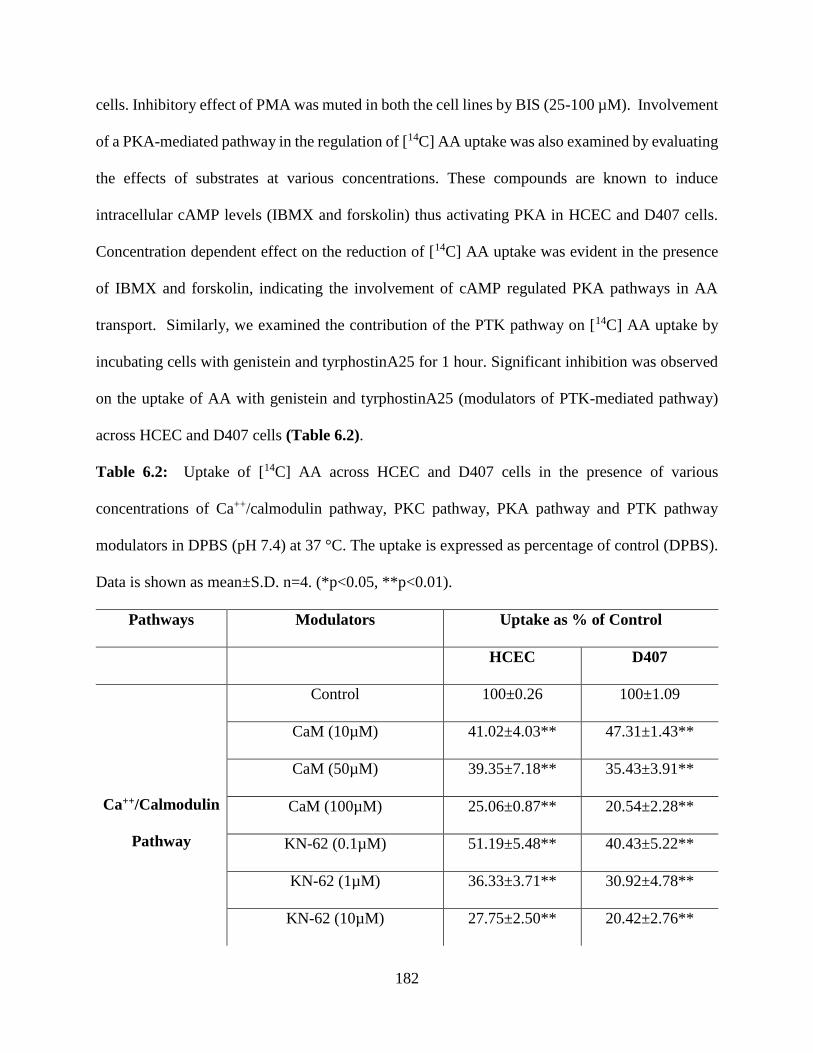
182
cells. Inhibitory effect of PMA was muted in both the cell lines by BIS (25-100 µM). Involvement
of a PKA-mediated pathway in the regulation of [14C] AA uptake was also examined by evaluating
the effects of substrates at various concentrations. These compounds are known to induce
intracellular cAMP levels (IBMX and forskolin) thus activating PKA in HCEC and D407 cells.
Concentration dependent effect on the reduction of [14C] AA uptake was evident in the presence
of IBMX and forskolin, indicating the involvement of cAMP regulated PKA pathways in AA
transport. Similarly, we examined the contribution of the PTK pathway on [14C] AA uptake by
incubating cells with genistein and tyrphostinA25 for 1 hour. Significant inhibition was observed
on the uptake of AA with genistein and tyrphostinA25 (modulators of PTK-mediated pathway)
across HCEC and D407 cells (Table 6.2).
Table 6.2: Uptake of [14C] AA across HCEC and D407 cells in the presence of various
concentrations of Ca++/calmodulin pathway, PKC pathway, PKA pathway and PTK pathway
modulators in DPBS (pH 7.4) at 37 °C. The uptake is expressed as percentage of control (DPBS).
Data is shown as mean±S.D. n=4. (*p<0.05, **p<0.01).
Pathways Modulators Uptake as % of Control
HCEC D407
Ca++/Calmodulin
Pathway
Control 100±0.26 100±1.09
CaM (10µM) 41.02±4.03** 47.31±1.43**
CaM (50µM) 39.35±7.18** 35.43±3.91**
CaM (100µM) 25.06±0.87** 20.54±2.28**
KN-62 (0.1µM) 51.19±5.48** 40.43±5.22**
KN-62 (1µM) 36.33±3.71** 30.92±4.78**
KN-62 (10µM) 27.75±2.50** 20.42±2.76**
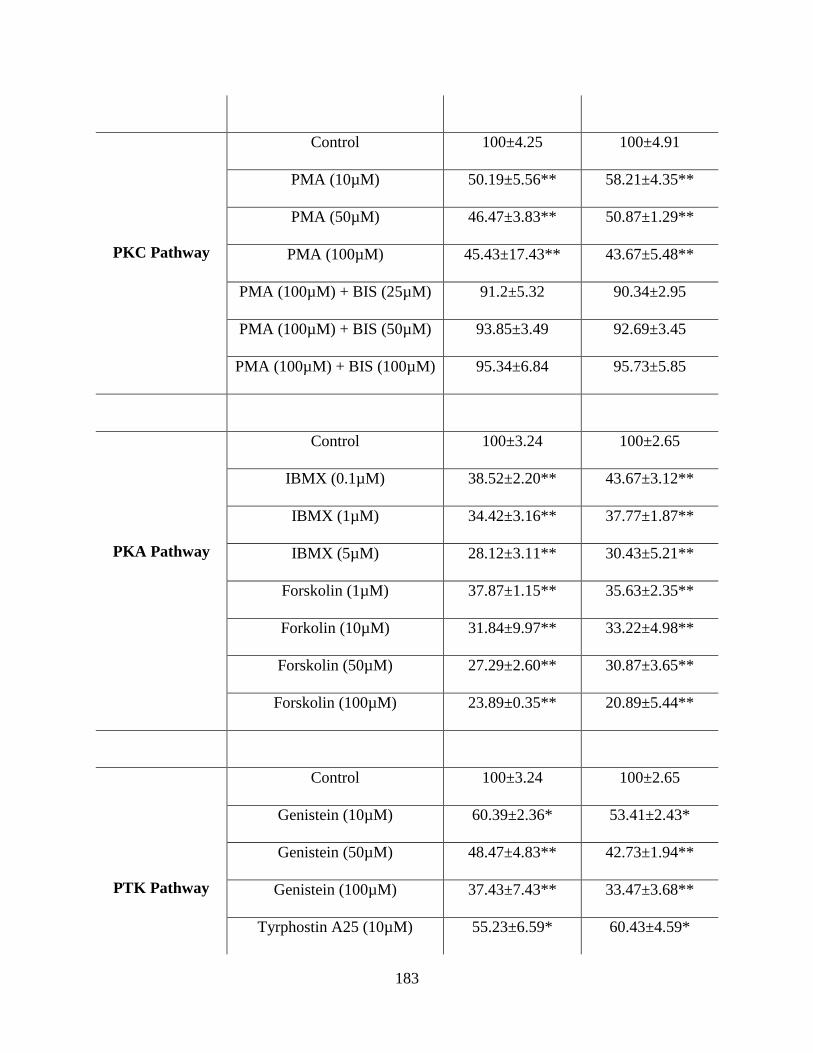
183
PKC Pathway
Control 100±4.25 100±4.91
PMA (10µM) 50.19±5.56** 58.21±4.35**
PMA (50µM) 46.47±3.83** 50.87±1.29**
PMA (100µM) 45.43±17.43** 43.67±5.48**
PMA (100µM) + BIS (25µM) 91.2±5.32 90.34±2.95
PMA (100µM) + BIS (50µM) 93.85±3.49 92.69±3.45
PMA (100µM) + BIS (100µM) 95.34±6.84 95.73±5.85
PKA Pathway
Control 100±3.24 100±2.65
IBMX (0.1µM) 38.52±2.20** 43.67±3.12**
IBMX (1µM) 34.42±3.16** 37.77±1.87**
IBMX (5µM) 28.12±3.11** 30.43±5.21**
Forskolin (1µM) 37.87±1.15** 35.63±2.35**
Forkolin (10µM) 31.84±9.97** 33.22±4.98**
Forskolin (50µM) 27.29±2.60** 30.87±3.65**
Forskolin (100µM) 23.89±0.35** 20.89±5.44**
PTK Pathway
Control 100±3.24 100±2.65
Genistein (10µM) 60.39±2.36* 53.41±2.43*
Genistein (50µM) 48.47±4.83** 42.73±1.94**
Genistein (100µM) 37.43±7.43** 33.47±3.68**
Tyrphostin A25 (10µM) 55.23±6.59* 60.43±4.59*
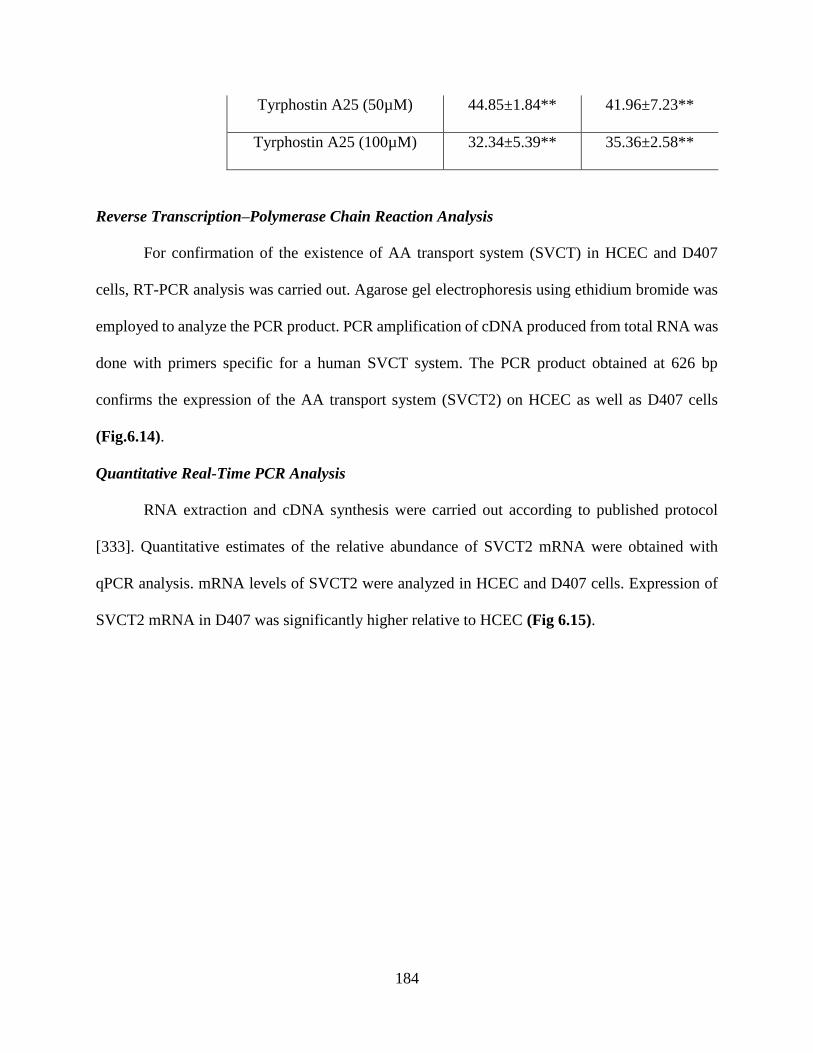
184
Tyrphostin A25 (50µM) 44.85±1.84** 41.96±7.23**
Tyrphostin A25 (100µM) 32.34±5.39** 35.36±2.58**
Reverse Transcription–Polymerase Chain Reaction Analysis
For confirmation of the existence of AA transport system (SVCT) in HCEC and D407
cells, RT-PCR analysis was carried out. Agarose gel electrophoresis using ethidium bromide was
employed to analyze the PCR product. PCR amplification of cDNA produced from total RNA was
done with primers specific for a human SVCT system. The PCR product obtained at 626 bp
confirms the expression of the AA transport system (SVCT2) on HCEC as well as D407 cells
(Fig.6.14).
Quantitative Real-Time PCR Analysis
RNA extraction and cDNA synthesis were carried out according to published protocol
[333]. Quantitative estimates of the relative abundance of SVCT2 mRNA were obtained with
qPCR analysis. mRNA levels of SVCT2 were analyzed in HCEC and D407 cells. Expression of
SVCT2 mRNA in D407 was significantly higher relative to HCEC (Fig 6.15).
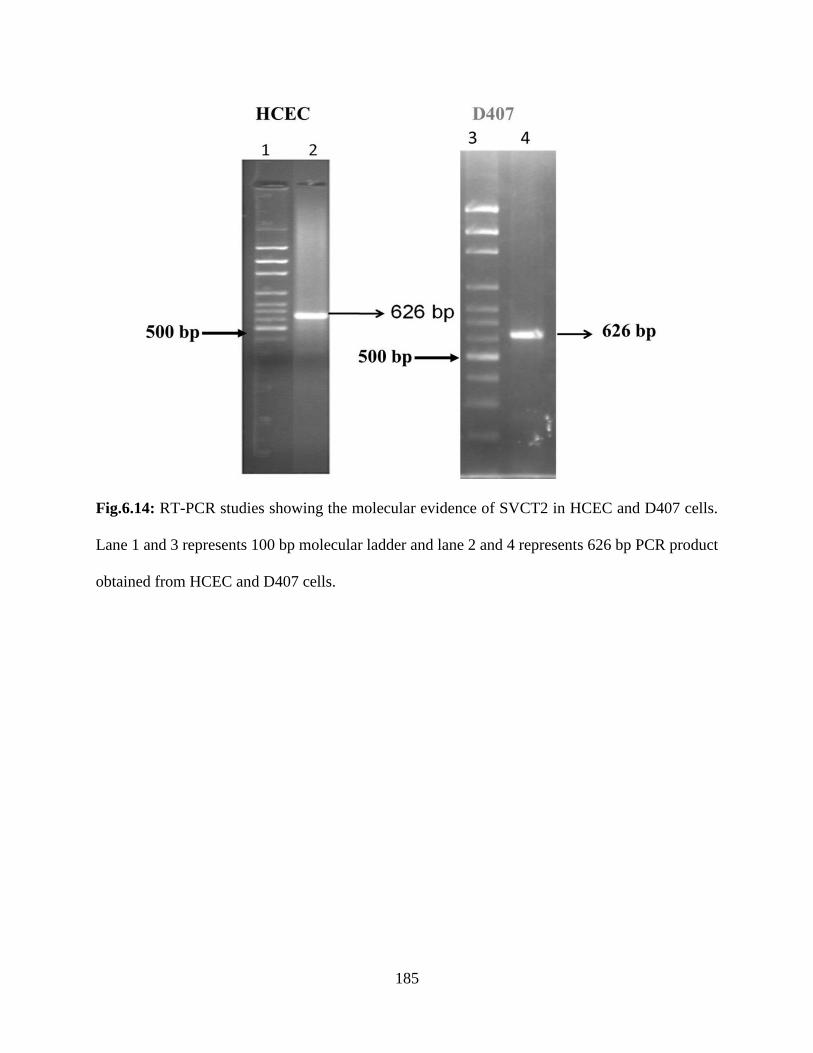
185
Fig.6.14: RT-PCR studies showing the molecular evidence of SVCT2 in HCEC and D407 cells.
Lane 1 and 3 represents 100 bp molecular ladder and lane 2 and 4 represents 626 bp PCR product
obtained from HCEC and D407 cells.
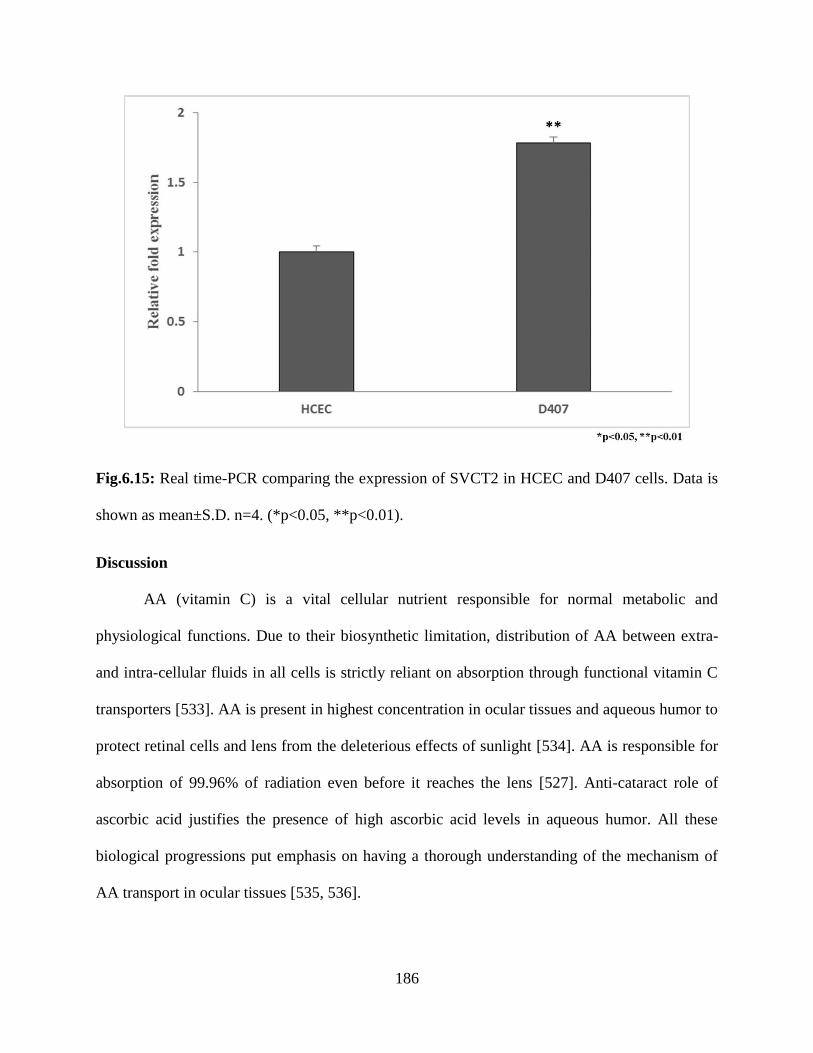
186
Fig.6.15: Real time-PCR comparing the expression of SVCT2 in HCEC and D407 cells. Data is
shown as mean±S.D. n=4. (*p<0.05, **p<0.01).
Discussion
AA (vitamin C) is a vital cellular nutrient responsible for normal metabolic and
physiological functions. Due to their biosynthetic limitation, distribution of AA between extra-
and intra-cellular fluids in all cells is strictly reliant on absorption through functional vitamin C
transporters [533]. AA is present in highest concentration in ocular tissues and aqueous humor to
protect retinal cells and lens from the deleterious effects of sunlight [534]. AA is responsible for
absorption of 99.96% of radiation even before it reaches the lens [527]. Anti-cataract role of
ascorbic acid justifies the presence of high ascorbic acid levels in aqueous humor. All these
biological progressions put emphasis on having a thorough understanding of the mechanism of
AA transport in ocular tissues [535, 536].
187
In the present study, we have evaluated the AA uptake process, as well as the expression,
contribution, and regulation of the SVCT2 across HCEC and D407 cells. Recently, in vitro culture
models have been applied as prized tools to predict ocular drug permeation. These cell culture
models have provided a platform for additional investigation on ocular drug delivery in lieu of in
vivo studies. Evaluation of drug transport across ocular tissues has been traditionally done utilizing
primary cultures of rabbit corneal (rPCEC) and human retinal pigment epithelial (ARPE-19).
[537]. Unlike primary cultures, immortalized cell cultures can be subcultured many times without
losing their metabolic and physiological characteristics including enzymatic activity and
cytoskeletal polarization. These immortalized human ocular cell culture models have been utilized
for cell biology, toxicity, ocular irritancy, drug delivery, drug permeability and transport studies
[438, 537].
Time course of AA uptake showed the linear uptake till 60 min. Hence, an incubation time
of 30 min is selected for further uptake studies in HCEC as well as D407 cells (Fig.6.1). AA uptake
process appears to be temperature dependent with significant rapid rate at physiological
temperature (37ºC) in comparison to 25ºC and 4ºC. Rise in pH results in enhanced uptake of AA
(Figs. 6.2 & 6.3). Since the pKa1 of AA is 4.17, it exists primarily in ascorbate form (-1 charge)
above the pH range of 5.0. As a result AA enhanced uptake with increase in pH may not be due to
the ionic state of AA. It can be concluded from pH dependency results that SVCT2 shows higher
affinity towards ascorbate at higher pH (Fig.6.4) [451, 463]. Ion–ion and/or ion–polarity
interactions between SVCT and its substrates are the major forces responsible for the binding of
SVCT2 with the ionized form of AA. At lower pH, protonation of histidine residues reduces the
binding affinity of SVCT2 with its substrates [463].
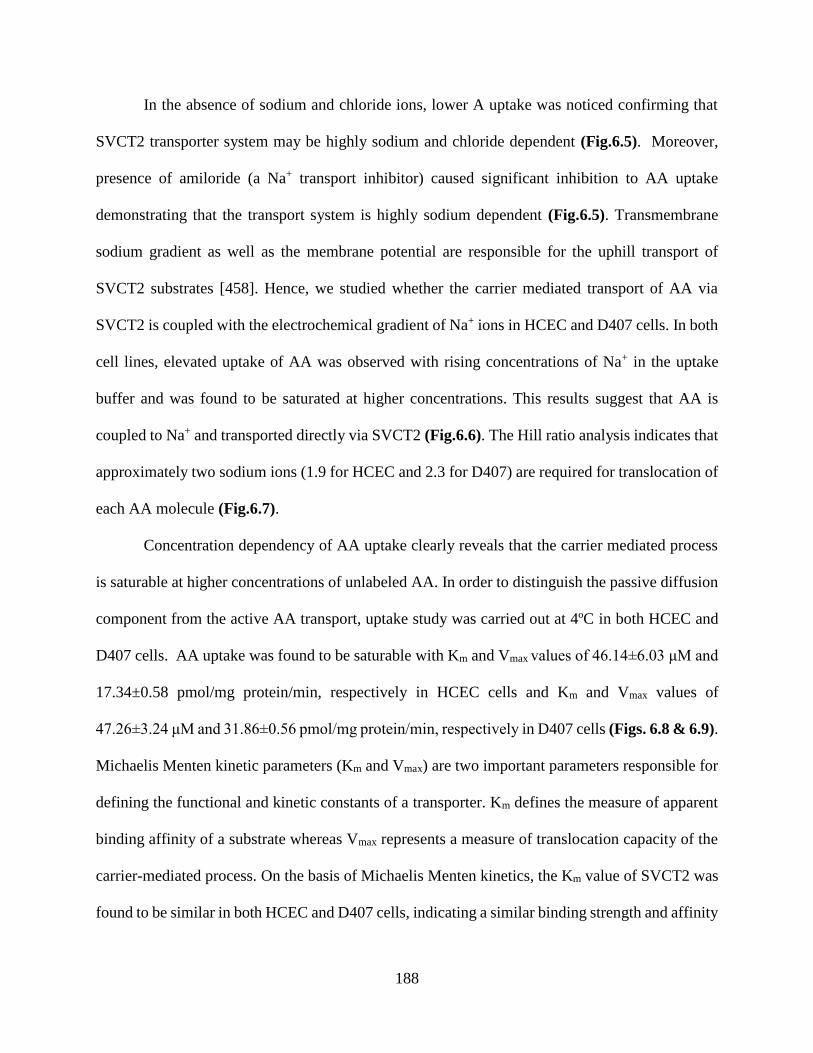
188
In the absence of sodium and chloride ions, lower A uptake was noticed confirming that
SVCT2 transporter system may be highly sodium and chloride dependent (Fig.6.5). Moreover,
presence of amiloride (a Na+ transport inhibitor) caused significant inhibition to AA uptake
demonstrating that the transport system is highly sodium dependent (Fig.6.5). Transmembrane
sodium gradient as well as the membrane potential are responsible for the uphill transport of
SVCT2 substrates [458]. Hence, we studied whether the carrier mediated transport of AA via
SVCT2 is coupled with the electrochemical gradient of Na+ ions in HCEC and D407 cells. In both
cell lines, elevated uptake of AA was observed with rising concentrations of Na+ in the uptake
buffer and was found to be saturated at higher concentrations. This results suggest that AA is
coupled to Na+ and transported directly via SVCT2 (Fig.6.6). The Hill ratio analysis indicates that
approximately two sodium ions (1.9 for HCEC and 2.3 for D407) are required for translocation of
each AA molecule (Fig.6.7).
Concentration dependency of AA uptake clearly reveals that the carrier mediated process
is saturable at higher concentrations of unlabeled AA. In order to distinguish the passive diffusion
component from the active AA transport, uptake study was carried out at 4ºC in both HCEC and
D407 cells. AA uptake was found to be saturable with Km and Vmax values of 46.14±6.03 μM and
17.34±0.58 pmol/mg protein/min, respectively in HCEC cells and Km and Vmax values of
47.26±3.24 μM and 31.86±0.56 pmol/mg protein/min, respectively in D407 cells (Figs. 6.8 & 6.9).
Michaelis Menten kinetic parameters (Km and Vmax) are two important parameters responsible for
defining the functional and kinetic constants of a transporter. Km defines the measure of apparent
binding affinity of a substrate whereas Vmax represents a measure of translocation capacity of the
carrier-mediated process. On the basis of Michaelis Menten kinetics, the Km value of SVCT2 was
found to be similar in both HCEC and D407 cells, indicating a similar binding strength and affinity
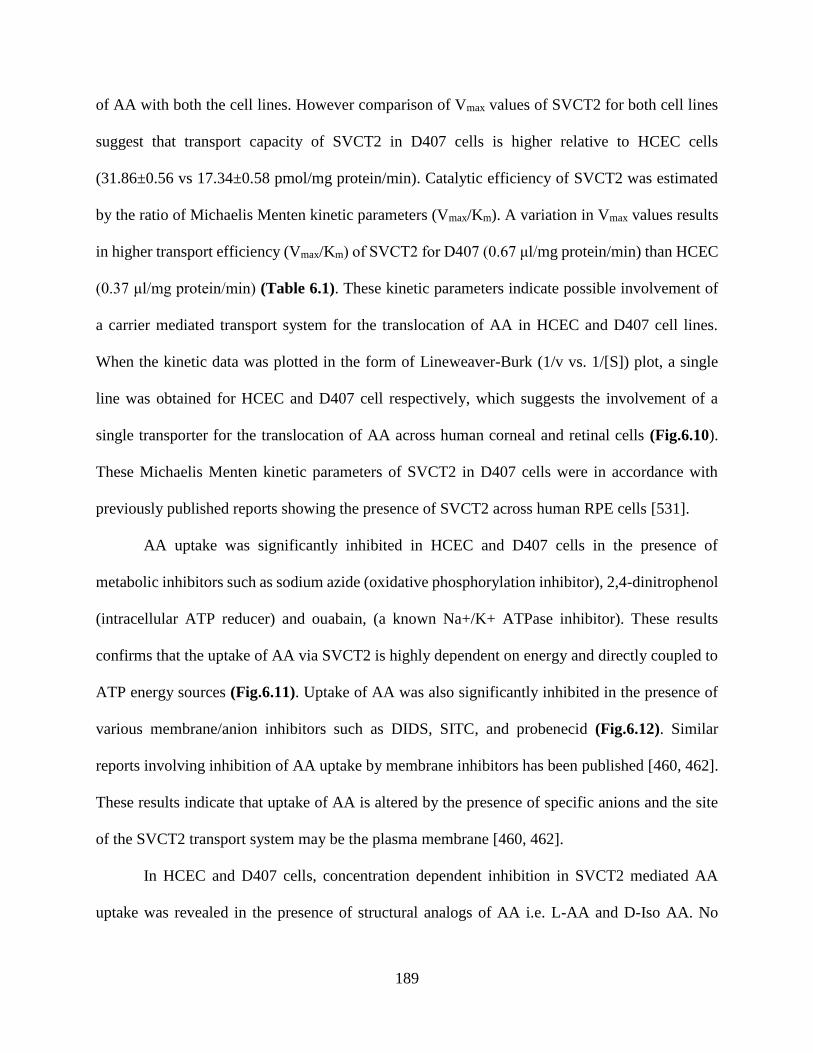
189
of AA with both the cell lines. However comparison of Vmax values of SVCT2 for both cell lines
suggest that transport capacity of SVCT2 in D407 cells is higher relative to HCEC cells
(31.86±0.56 vs 17.34±0.58 pmol/mg protein/min). Catalytic efficiency of SVCT2 was estimated
by the ratio of Michaelis Menten kinetic parameters (Vmax/Km). A variation in Vmax values results
in higher transport efficiency (Vmax/Km) of SVCT2 for D407 (0.67 μl/mg protein/min) than HCEC
(0.37 μl/mg protein/min) (Table 6.1). These kinetic parameters indicate possible involvement of
a carrier mediated transport system for the translocation of AA in HCEC and D407 cell lines.
When the kinetic data was plotted in the form of Lineweaver-Burk (1/v vs. 1/[S]) plot, a single
line was obtained for HCEC and D407 cell respectively, which suggests the involvement of a
single transporter for the translocation of AA across human corneal and retinal cells (Fig.6.10).
These Michaelis Menten kinetic parameters of SVCT2 in D407 cells were in accordance with
previously published reports showing the presence of SVCT2 across human RPE cells [531].
AA uptake was significantly inhibited in HCEC and D407 cells in the presence of
metabolic inhibitors such as sodium azide (oxidative phosphorylation inhibitor), 2,4-dinitrophenol
(intracellular ATP reducer) and ouabain, (a known Na+/K+ ATPase inhibitor). These results
confirms that the uptake of AA via SVCT2 is highly dependent on energy and directly coupled to
ATP energy sources (Fig.6.11). Uptake of AA was also significantly inhibited in the presence of
various membrane/anion inhibitors such as DIDS, SITC, and probenecid (Fig.6.12). Similar
reports involving inhibition of AA uptake by membrane inhibitors has been published [460, 462].
These results indicate that uptake of AA is altered by the presence of specific anions and the site
of the SVCT2 transport system may be the plasma membrane [460, 462].
In HCEC and D407 cells, concentration dependent inhibition in SVCT2 mediated AA
uptake was revealed in the presence of structural analogs of AA i.e. L-AA and D-Iso AA. No
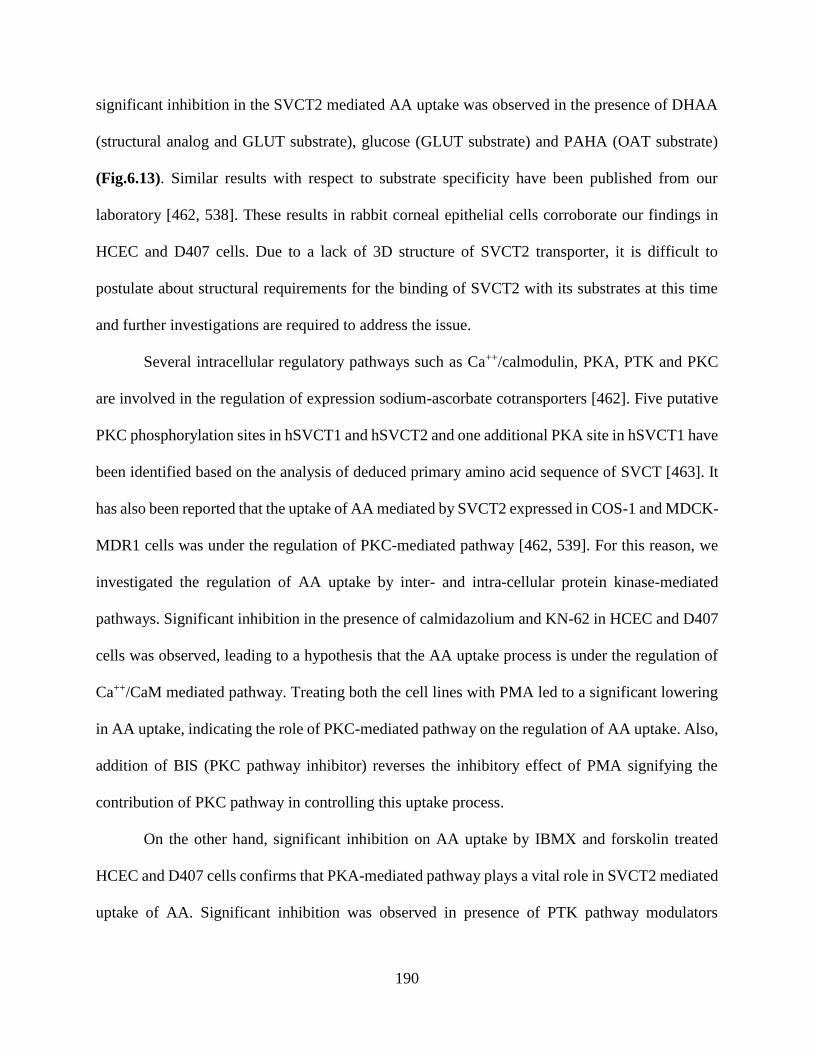
190
significant inhibition in the SVCT2 mediated AA uptake was observed in the presence of DHAA
(structural analog and GLUT substrate), glucose (GLUT substrate) and PAHA (OAT substrate)
(Fig.6.13). Similar results with respect to substrate specificity have been published from our
laboratory [462, 538]. These results in rabbit corneal epithelial cells corroborate our findings in
HCEC and D407 cells. Due to a lack of 3D structure of SVCT2 transporter, it is difficult to
postulate about structural requirements for the binding of SVCT2 with its substrates at this time
and further investigations are required to address the issue.
Several intracellular regulatory pathways such as Ca++/calmodulin, PKA, PTK and PKC
are involved in the regulation of expression sodium-ascorbate cotransporters [462]. Five putative
PKC phosphorylation sites in hSVCT1 and hSVCT2 and one additional PKA site in hSVCT1 have
been identified based on the analysis of deduced primary amino acid sequence of SVCT [463]. It
has also been reported that the uptake of AA mediated by SVCT2 expressed in COS-1 and MDCK-
MDR1 cells was under the regulation of PKC-mediated pathway [462, 539]. For this reason, we
investigated the regulation of AA uptake by inter- and intra-cellular protein kinase-mediated
pathways. Significant inhibition in the presence of calmidazolium and KN-62 in HCEC and D407
cells was observed, leading to a hypothesis that the AA uptake process is under the regulation of
Ca++/CaM mediated pathway. Treating both the cell lines with PMA led to a significant lowering
in AA uptake, indicating the role of PKC-mediated pathway on the regulation of AA uptake. Also,
addition of BIS (PKC pathway inhibitor) reverses the inhibitory effect of PMA signifying the
contribution of PKC pathway in controlling this uptake process.
On the other hand, significant inhibition on AA uptake by IBMX and forskolin treated
HCEC and D407 cells confirms that PKA-mediated pathway plays a vital role in SVCT2 mediated
uptake of AA. Significant inhibition was observed in presence of PTK pathway modulators
191
(genistein and tyrphostin A25) showing a possible role of PTK pathway in intracellular regulation
of AA (Table 6.2). Molecular mechanism by which the protein kinase and calmodulin pathway
exert their effect on AA uptake process is yet to be fully established.
Finally, RT-PCR analysis confirms the molecular evidence of a vitamin C/AA specific
carrier system in HCEC and D407 cells. The PCR product obtained at 626 bp is specific for the
SVCT2 transporter system (Fig.6.14). qPCR analysis revealed that the expression of SVCT2 was
significantly higher in D407 in comparison to HCEC cells (Fig.6.15). Higher expression of SVCT2
in D407 provides the justification of greater catalytic transporter efficiency of SVCT2 in D407
relative to HCEC cells.
Conclusion
In summary, this study clearly delineates the detailed study of functional activity and
molecular evidence as well as the expression, contribution, and regulation of the sodium-
dependent vitamin C transporter 2 (SVCT2) across HCEC and D407 cell lines. AA uptake across
HCEC and D407 cells involves a carrier-mediated active process that is modulated by both protein
kinases as well as Ca++/CaM mediated pathways. This transporter is highly pH dependent and
requires coupling to an electrochemical Na+ gradient and ATP sources for cellular uptake of AA.
This membrane transporter (SVCT2) can be utilized as a potential target for enhancing ocular
bioavailability of AA conjugated prodrugs. This investigation demonstrates complete profiling of
SVCT2 mediated AA uptake showing its dependence on calmodulin, protein kinases and
intracellular ions. Also, HCEC and D407 cell line can be utilized as a valuable in vitro model than
primary culture models to investigate ocular drug absorption of AA-conjugated therapeutics.

192
Acknowledgement
This work was supported by National Institutes of Health grant R01EY09171-16 and
R01EY010659-14.

193
CHAPTER 7
MOLECULAR EXPRESSION AND FUNCTIONAL ACTIVITY OF VITAMIN C SPECIFIC
TRANSPORT SYSTEM (SVCT2) IN HUMAN BREAST CANCER CELLS
Rationale
In United States, 1 in 8 women develop breast cancer during their lifespan. In 2013 about
232,340 new cases of breast cancer were diagnosed among American women. Breast cancer
represents 14.1% of all new cancer cases in the U.S (cancer.gov-recent statistics). Although,
chemotherapy has shown promising results in treating breast cancer, it frequently leads to systemic
side effects. Also, acquired drug resistance has been reported due to the frequent use of multiple
chemotherapeutic drugs during treatment of advanced breast cancer [77, 540]. During lactating
period, breast epithelial cells are responsible for transport of amino acids and vitamins across cell
membranes in order to meet the requirements of accelerated milk-protein synthesis. However,
information is still limited with respect to transport of amino acids and vitamins across breast
epithelial cells and its regulation in various biological and pathological progressions [541] [542,
543]. Presence of efflux transporter proteins i.e., P-glycoprotein (P-gp or MDR1), multidrug
resistance proteins (MRPs) and breast cancer resistance protein (BCRP) render drug delivery to
the breast cancer cells at therapeutic doses highly challenging [77, 543-548]. In cancer patients,
overcoming multidrug resistance by exploring strategies such as evasion or modulation of these
efflux transporters may play a vital role [153, 154, 543]. Several reports suggested high level
expressions of influx/nutrient transporters, such as biotin [543], nucleoside/nucleobase [549, 550],
glucose [551], monocarboxylic acid [552, 553], folate [554, 555], organic anion and cation
transporters [556] on various breast cancer cells. This information, in turn, facilitates the rational
194
design of novel anti-cancer therapeutic targeting a specific carrier mediated transporter expressed
in breast cancer cells [557].
Ascorbic acid (AA, vitamin C) is an essential water-soluble vitamin required for
physiological and metabolic functions. It is an important nutrient required as a cofactor by various
metabolic enzymes [558-561]. Efficacy of AA in cancer treatment has a controversial history
[561, 562]. Many published reports described beneficial effects of AA in cancer treatment. AA
has shown inhibitory effects on various cancer cells including breast, brain, prostate and stomach
[561, 563-566]. Also, pharmacologic doses of AA, 10 g daily, showed effective results in the
average survival of advanced cancer patients, improved patient well-being and reduced pain [561,
567-570]. In human breast carcinoma cells, AA appears to potentiate the antineoplastic activity of
doxorubicin, cisplatin, and paclitaxel [571]. AA plays an important role in enhancing natural
immunity and may cause lowest toxicity of all the vitamins [570].
AA cannot be synthesized by human and other primates, thus making this vitamin an
essential dietary requirement. Therefore, AA is usually obtained from exogenous sources through
the dietary intake [462]. AA uptake via specific transport system has already been reported in
intestine [453], brain [457], kidney [454], skin [461], eye [458, 459] and bone [460]. Human
SLC23A2 family consists of two isoforms of sodium-dependent vitamin C transporters (SVCT)
namely SVCT1 and SVCT2 [529]. A relative study of two isoforms discloses that AA exhibits
higher structural and functional tropisms towards SVCT2 than SVCT1. Both SVCT1 and SVCT2
vary in distribution but express close sequence homology and functional similarity [458].
Structural and functional studies reveal that transport of AA across epithelial cells is primarily
facilitated via SVCT [458, 462].
195
Transporter targeted drug delivery, in recent years, has been widely explored to improve
targeted drug delivery across biological membranes. An active agent is chemically modified with
transporter targeted moieties, this bioreversible conjugate enhances drug permeation and
absorption. Facilitated transport of conjugated drug interacts with targeting moiety and the
transporter resulting in elevated absorption [437]. SVCT2 has been exploited by many
investigators as an important target for drug delivery across epithelial membranes. Higher
absorptive permeability and metabolic stability compared to saquinavir alone has been observed
with AA conjugated saquinavir [530]. Conjugation of nipecotic, kynurenic and diclophenamic
acids with AA has been employed to enhance transport of therapeutic agents. This approach has
provided a new perspective for transporter/receptor targeted prodrug design targeted to SVCT2
transporter [531]. Hence, SVCT targeted drug delivery can be utilized as a vital strategy for
enhancing intracellular accumulation of anti-cancer in cancer cells. The aim of this study is to
investigate the expression of a specialized carrier mediated transport system (SVCT2) on the
epithelia of breast cancer cells (MDA-MB231, T47D and ZR-75-1).
The presence of SVCT on corneal cells and Madin-Darby canine kidney cells has been
previously reported from our laboratory [458, 462]. Also, SVCT expression was shown on breast
cancer epithelial cells (MDA-MB231 and T47D cells). However, no information currently exists
regarding mechanistic and functional processes as well as molecular expression of AA carrier
mediated uptake by breast cancer cells. In the present study, we evaluated the ascorbic acid uptake
process, kinetics as well as expression, relative contribution, and regulation of SVCT2 in MDA-
MB231, T47D and ZR-75-1 cells. Results obtained from this study may indicate involvement of a
specific and high affinity carrier transport system (SVCT2) for translocation of AA.
196
Material And Methods
Materials
[14C] Ascorbic acid ([14C] AA specific activity 8.5 mCi/mM) was procured from Perkin
Elmer (Boston, MA, USA). Unlabeled L-ascorbic acid, D-iso-ascorbic acid, dehydro-ascorbic acid
(DHAA), glucose, para amino hippuric acid (PAHA), sodium azide, ouabain, 2,4-dinitrophenol,
choline chloride, HEPES, bovine insulin, human epidermal growth factor, Triton X-100, phorbol-
12-myristate-13-acetate (PMA), bisindolylmaleimide I (BIS), 3-isobutyl-1-methylxanthine
(IBMX), 4,4’-di-isothiocyanatostilbene- 2,2’-disulphonic acid (DIDS), 4-acetamido-4’-
isothiocyanostilbene-2,2’-disulfonic acid (SITC), and D-glucose were purchased from Sigma
Chemical Co (St. Louis, MO, USA). Culture media (Dulbecco’s modified Eagle’s medium
(DMEM), RPMI 1640 culture medium and DMEM/F-12) were procured from Invitrogen
(Carlsbad, CA, USA). Fetal bovine serum (FBS) was obtained from Atlanta biologicals
(Lawrenceville, GA, USA). Culture flasks (75 cm2 growth area) and uptake plates (3.8 cm2 growth
area) were purchased from Corning Costar Corp. (Cambridge, MA, USA). The buffers for cDNA
synthesis and amplification (oligodT, dNTP, MgCl2, M-MLV reverse transcriptase and Taq
polymerase) were obtained from Promega Corporation (Madison, WI, USA). Light Cycler 480®
SYBR I green master mix was obtained from Roche Applied Science (Indianapolis, IN, USA).
Qualitative and quantitative primers used in the study were custom-designed and obtained from
Invitrogen Life Technologies (Carlsbad, CA, USA). All other chemicals were obtained from Fisher
Scientific Co. (Fair Lawn, NJ, USA) and utilized without further purification.
Cell Culture
T47D cells were obtained from American Type Culture Collection (ATCC). MDA-MB-
231 and ZR-75-1 cells were generous gifts from Dr. Walter Jäger University of Vienna, Austria)

197
and Dr. A.J. van Agthoven (Josephine Nefkens Institute, Netherlands), respectively. T47D cells
were cultured according to a previously published protocol [543]. Cells of passage numbers
between 20 and 30 were cultured at 37°C, humidified 5% CO2/95% air atmosphere in a DMEM
culture medium supplemented with 10% (v/v) FBS (heat inactivated), 1% nonessential amino
acids, 20 mM HEPES, 29 mM sodium bicarbonate, 100 mg of penicillin and streptomycin.
ZR-75-1 cells were cultured at 37°C, humidified 5% CO2/95% air atmosphere in a RPMI 1640
culture medium supplemented with 10% (v/v) FBS (heat inactivated), 29 mM NaHCO3, 20 mM
HEPES, 100 mg of penicillin and streptomycin each, and 1 nM estradiol. (0.5 ml/ 500 ml medium)
at pH 7.4 [514, 515]. The growth medium was changed every alternate day.
MDA-MB-231 cells were cultured at 37°C, humidified 5% CO2/95% air atmosphere in a
DMEM/F12 culture medium supplemented with 10% (v/v) FBS, 29 mM NaHCO3, 20 mM
HEPES, 100 mg of penicillin and streptomycin each.
All breast cancer cell lines were cultured in 75 cm2 flasks, harvested at 80–90% confluency
with TrypLE™ Express (Invitrogen, Carlsbad, CA, USA). Cells were then plated in 24-well uptake
plates at a density of 300,000 cells/well. Cells were grown in a similar way as mentioned above
and utilized for additional studies.
Uptake Studies
Confluent breast cancer cells were employed for uptake experiments. Following media
removal, cells were rinsed thrice for 5 min each with 1–2 ml of Dulbecco’s phosphate-buffered
saline (DPBS) containing 140 mM NaCl, 0.03 mM KCl, 7.5 mM Na2HPO4, 1.5 mM KH2PO4, 1
mM CaCl2, 0.5 mM MgSO4, 20 mM HEPES, and 5 mM glucose maintained at pH 7.4. Uptake
studies were initiated by adding 250μl of solution containing 0.25 μCi/ml (29.4µM) of [14C] AA
in the presence and absence of various competing substrates. Following specific period of
198
incubation, the solution was removed and uptake process was terminated with 2 ml of ice-cold
stop solution containing 200 mM KCl and 2 mM HEPES. The cell monolayer was washed thrice,
5 min each and 1ml of lysis buffer (0.1% Triton-X solution in 0.3% NaOH) was added to each
well and plates were stored overnight at room temperature. Subsequently, the cell lysate (400μl)
from each well was transferred to scintillation vials containing 3 ml of scintillation cocktail (Fisher
Scientific, Fairlawn, NJ, USA). Samples were quantified by measuring the radioactivity using
liquid scintillation spectrophotometer coulter (Beckman Instruments Inc., Fullerton, CA, USA,
model LS-6500). Protein content of each sample was estimated by BioRad Protein Estimation Kit
(BioRad Protein Estimation Kit, Hercules, CA, USA).
Time And Temperature Dependency
The optimum time for uptake studies of [14C] AA were determined by performing the
uptake studies over various time points (5, 10, 15, 30, 45 and 60 min). The uptake study was
conducted as per method described earlier.
The effect of temperature on [14C] AA uptake was determined by carrying out the uptake
study at different temperatures i.e. 4ºC, 25ºC and 37ºC. The buffer temperature was adjusted to
4ºC, 25ºC and 37ºC prior to the initiation of [14C] AA uptake.
pH And Ion Dependency
The effect of pH on [14C] AA uptake was observed by adjusting the pH to 5, 6, 6.5, 7.4 and
8. For delineating the role of sodium ions on [14C] AA uptake, sodium chloride (NaCl) and sodium
phosphate dibasic (Na2HPO4) in DPBS were substituted with equimolar quantities of choline
chloride and potassium phosphate dibasic (KH2PO4), respectively. Hill coefficient for uptake of
AA as function of Na+ was determined. In a similar manner, buffer solution containing sodium
199
(140 mM), potassium (0.03 mM), and calcium (1 mM) chlorides were replaced with equimolar
quantities of sodium phosphate, potassium phosphate, and calcium acetate, respectively.
In another study, cells were pre-incubated with 1 mM amiloride (sodium channel inhibitor)
and the uptake study was carried out as mentioned earlier.
Concentration Dependency
Several concentrations of L-AA were prepared ranging from (0.12-2000μM) in DPBS (pH
7.4) and spiked with [14C] AA (29.4µM). The uptake studies were performed according to a
previously described method [543]. The data was fitted to Michaelis-Menten equation as shown
in section 3.2 and the maximum transport rate (Vmax) and Michaelis-Menten constant (Km) were
calculated according to nonlinear least squares regression analysis program; GraphPad Prism
version 5.
Role Of Metabolic And Membrane Transport Inhibitors
For energy dependency studies, simultaneous incubation of [14C] AA along with metabolic
inhibitors such as ouabain (Na+/K+ ATPase inhibitor), 2,4-dinitrophenol (intracellular ATP
reducer) and sodium azide (oxidative phosphorylation inhibitor) were performed for 1h. In order
to examine the effect of anionic membrane transport inhibitors, cells were pre-incubated with 1mM
SITC, DIDS and probenecid for 1h.
Substrate Specificity
The substrate specificity for SVCT was delineated by carrying out [14C] AA uptake in the
presence of three concentrations of (500, 1000 and 2000µM) unlabeled L-AA and structural
analogs such as D-Iso AA and DHAA. A similar study was carried out at three different
concentrations of (500, 1000 and 2000µM) of various structurally unrelated analogs such as

200
glucose (Glucose transporter/GLUT substrate) and PAHA (organic anion transporter/OAT
substrate).
Intracellular Regulation
Involvement of various intracellular regulatory pathways such as Ca++/calmodulin, PTK
(protein tyrosine kinase), PKC (protein kinase C) and PKA (protein kinase A) pathway on [14C]
AA uptake was also investigated. Cells were pre-incubated with modulators such as calmidazolium
(CaM) and KN-62 to delineate the process. In order to examine the role of PTK pathway in [14C]
AA uptake, cells were pre-incubated with genistin and tyrphostin A25. For studying the effect of
PKC pathway, cells were pre-incubated with BIS and PMA (modulators of PKC pathway). The
effect of PKA pathway was studied by incubating the cells with IBMX and forskolin (modulators
of PKA pathway). Uptake of [14C] AA was then performed according to the procedure as
previously described.
Reverse Transcription–Polymerase Chain Reaction
Reverse transcription– polymerase chain reaction (RT-PCR) analysis was carried out to
determine the expression of SVCT2 on T47D, MDA-MD-231 and ZR-75-1 at molecular level.
TRIzol® reagent (Invitrogen, USA) was used to perform cell lysis. Chloroform was added to the
lysate for phase separation. Following separation of aqueous phase containing RNA, isopropanol
was added to precipitate RNA which was rinsed twice with 75% ethanol followed by resuspension
in RNase-DNase free water. The concentration and purity of RNA was determined with Nanodrop
(Thermo Fisher Scientific, Wilmington, DE, USA). RNA was reverse-transcribed to obtain cDNA
using oligodT as a template and M-MLV reverse transcriptase. The conditions for reverse
transcription were: denaturation of the template RNA for 5 min at 70°C; reverse transcription for
60 min at 42°C followed by final extension at 72°C for 5 min. cDNA obtained was then subjected
201
to PCR for amplification of SVCT using specific set of primers. Set of primers (5′→3′) designed
for SVCT2 were: forward: CCAGCGGTGAGCAGGACAAT, reverse primer:
TAGGGCCACCGTGGGTGTAA. These primers correspond to a 626 base pair (bp) product in
human SVCT2 cDNA. The conditions of PCR amplification were: denaturation for 30 s at 94°C,
annealing for 1 min at 56°C, and extension for 1 min at 72°C, for 45 cycles followed by a final
extension for 5 min at 72°C. PCR product obtained was analyzed by gel electrophoresis on 1.5%
agarose in TAE buffer and visualized under UV [438].
Quantitative Real-Time PCR
Following reverse transcription, quantitative real-time PCR (qPCR) was performed with
LightCycler® SYBR green technology (Roche). cDNA equivalent to 80 ng in each well was
subjected to amplification with specific primers. Glyceraldehyde-3-phosphate dehydrogenase
(GAPDH) was used as an internal standard to normalize the amount of cDNA in each well. The
sequences of real-time primers (5′→3′) used for SVCT2 were: forward:
GCCAGCTAGGTCTTGACTCC, reverse primer: GATGTGGCGTAGACCTGTCC, GAPDH:
forward—ATCCCTCCAAAATCAAGTGG and reverse—GTTGTCATGGATGACCTTGG. A
preliminary experiment was performed to ensure that SVCT2 and GAPDH were amplified with
equal efficiencies. The specificity of these primers was also confirmed by melting-curve analysis.
The comparative threshold method was used to calculate the relative amount of SVCT2 in breast
cancer cell lines [438, 532].
Data Analysis
Radioactive Sample Analysis
The uptake of [14C] AA was calculated using disintegrations per minute (DPM) of sample
and donor solutions as shown in Eq. 1
202
𝑪𝒔𝒂𝒎𝒑𝒍𝒆 =𝑫𝑷𝑴𝒔𝒂𝒎𝒑𝒍𝒆 ∗ 𝑪𝒅𝒐𝒏𝒐𝒓
𝑫𝑷𝑴𝒅𝒐𝒏𝒐𝒓 𝐄𝐪. 𝟏
where, DPMsample and DPMdonor represent average values of DPM counts of sample and
donor (n=4) respectively; Cdonor denotes the concentration of donor used and Csample represents the
concentration of sample.
Calculation of Michaelis-Menten Kinetic Parameters
In order to determine Km and Vmax associated with [14C] AA uptake, concentration-
dependency data was fitted in a modified Michaelis–Menten equation as shown in Eq.2
𝒗 =𝑽𝒎𝒂𝒙[𝑪]
𝑲𝒎 + [𝑪]+ 𝑲𝒅[𝑪] 𝐄𝐪. 𝟐
v represents the total uptake, Vmax stands for the maximum uptake rate for the carrier-
mediated process, Km is Michaelis–Menten constant which represents the concentration at half
saturation, Kd is a non-saturable diffusion rate constant and C is substrate concentration. In Eq.
(2), (Vmax*C)/(Km+C) represents carrier mediated saturable process whereas Kd(C) denotes the
non-saturable component. Data was fitted to a non-linear least-square regression analysis program
(GraphPad Prism 5.0). The Michaelis-Menten kinetic parameters were calculated to determine
saturable and non-saturable component of the total uptake.
Calculation Of Hill Ratio
Na+:L-Ascorbic acid coupling ratio was determined using the logarithmic form of the Hill
equation (Eq. 3)
𝑳𝒐𝒈 [𝒗′
𝑽𝒎𝒂𝒙− 𝒗′] = 𝒏𝒍𝒐𝒈(𝑺) − 𝒍𝒐𝒈𝑲′ 𝐄𝐪. 𝟑
203
v’ denotes initial velocity, Vmax represents the maximal velocity, n is number of substrate
binding sites, S denotes the substrate concentration, and K’ is a constant comprising multiple
interaction factors and the intrinsic dissociation constant.
Statistical Analysis
All the experiments were conducted at least in quadruplicate (n=4) and the outcomes were
expressed as mean±standard deviation (SD). To calculate statistical significance, student’s t test
was applied and the difference between mean values is considered statistically significant for P
value ≤0.05.
Results
Time And Temperature Dependency
Time dependent uptake of [14C] AA (29.4µM) in MDA-MB231, T47D and ZR-75-1 cells
is depicted in Fig.7.1. Linear uptake of [14C] AA was noticed upto 60 min of incubation period.
Therefore, 30 min uptake time was selected for all uptake experiments.
Effect of temperature on the uptake of AA was studied on MDA-MB231, T47D and ZR-
75-1 cells. Uptake of [14C] AA in the three breast cancer cell lines was maximal at 37°C (Fig.7.2).
Uptake of [14C] AA in MDA-MB231 showed ~40% and 70% decrease when the temperature was
reduced to 25°C and 4°C respectively. In T47D cells, uptake was reduced to ~55% and 25% when
measured at 25°C and 4°C respectively, whereas, in ZR-75-1 cells uptake of [14C] AA diminished
to ~50% and 20% respectively, at 25°C and 4°C, suggesting that the process may be carrier
mediated in all the studied breast cancer cell lines. Activation energy (Ea) was calculated by
plotting the temperature dependent data i.e. Uptake rate Ln(v) vs. 1/T (Fig.7.3) Ea was calculated
to be 8.08, 9.71 and 9.99 kcal/mol in MDA-MB231, T47D and ZR-75-1 cells respectively.
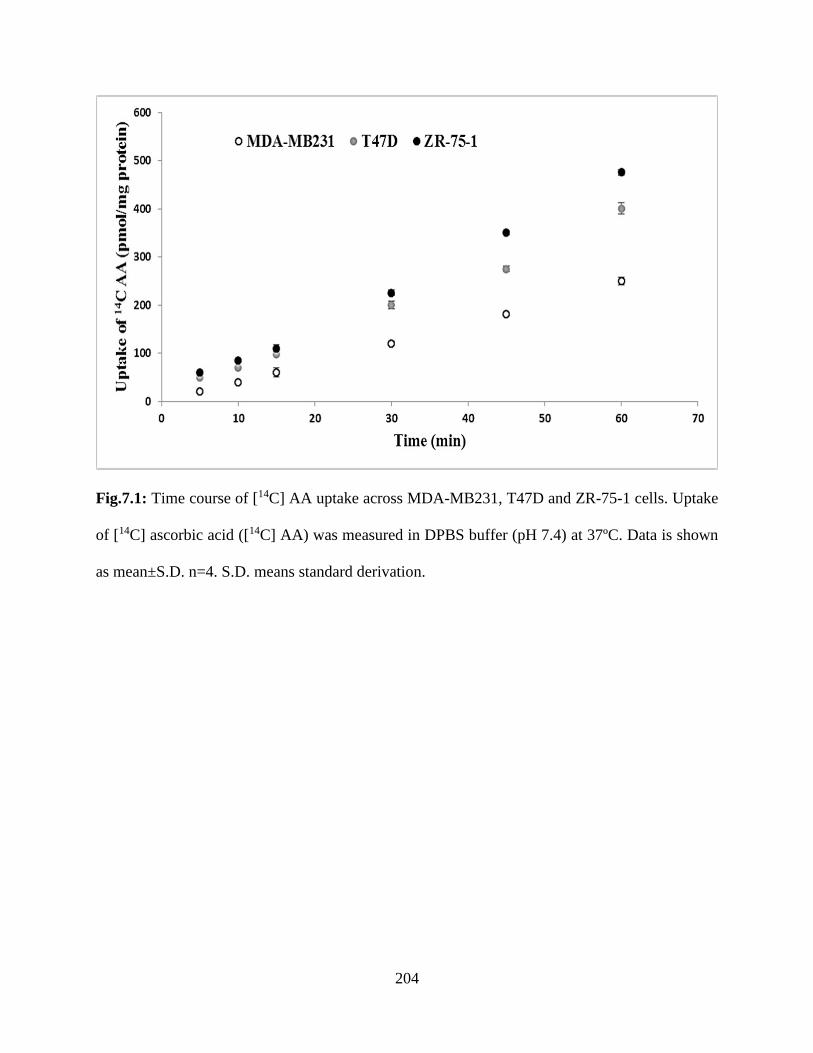
204
Fig.7.1: Time course of [14C] AA uptake across MDA-MB231, T47D and ZR-75-1 cells. Uptake
of [14C] ascorbic acid ([14C] AA) was measured in DPBS buffer (pH 7.4) at 37ºC. Data is shown
as mean±S.D. n=4. S.D. means standard derivation.
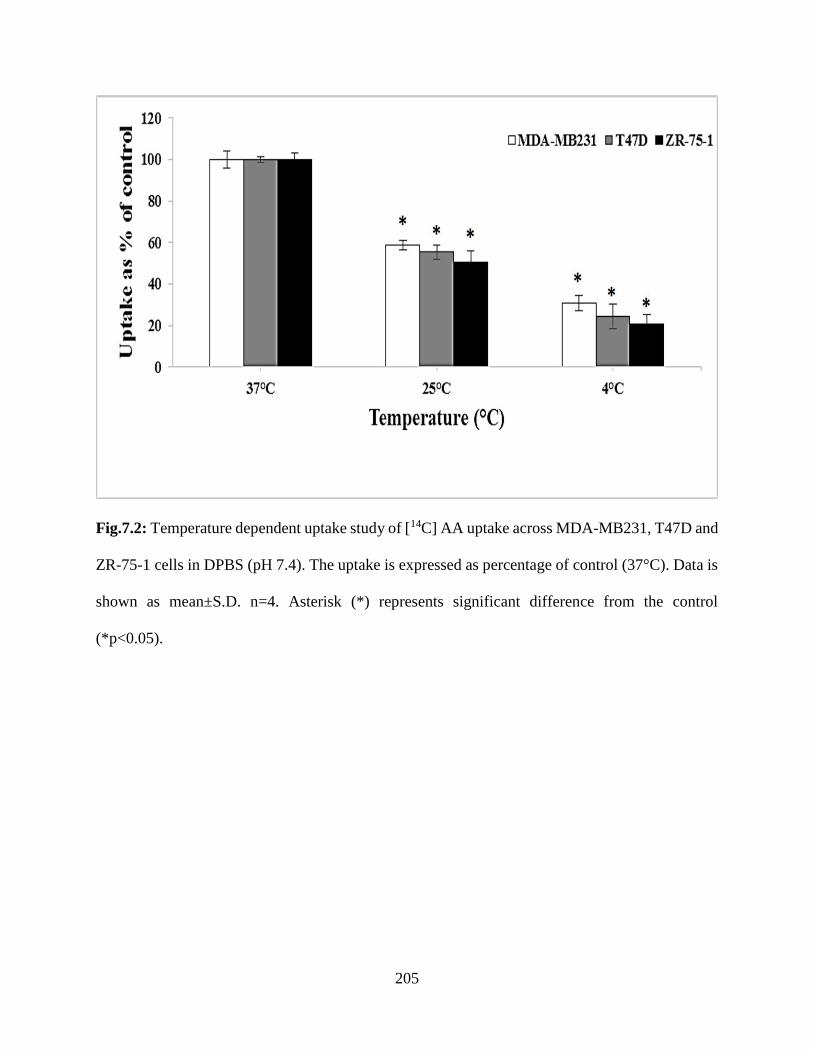
205
Fig.7.2: Temperature dependent uptake study of [14C] AA uptake across MDA-MB231, T47D and
ZR-75-1 cells in DPBS (pH 7.4). The uptake is expressed as percentage of control (37°C). Data is
shown as mean±S.D. n=4. Asterisk (*) represents significant difference from the control
(*p<0.05).
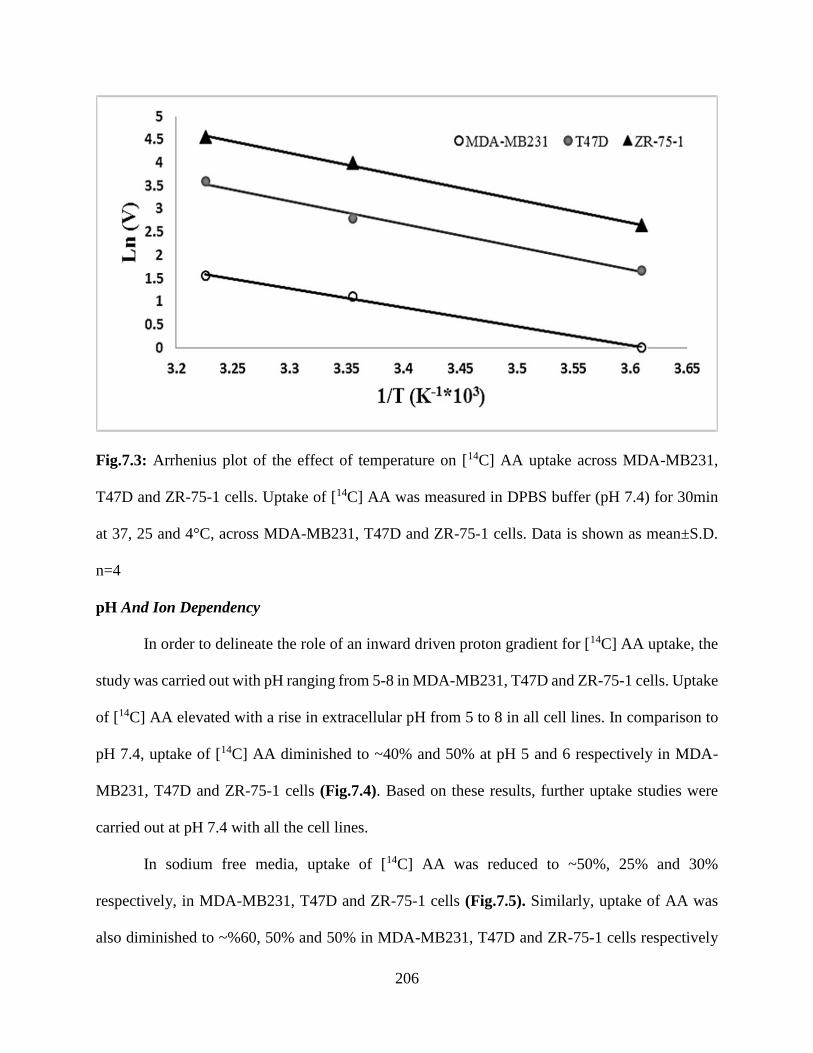
206
Fig.7.3: Arrhenius plot of the effect of temperature on [14C] AA uptake across MDA-MB231,
T47D and ZR-75-1 cells. Uptake of [14C] AA was measured in DPBS buffer (pH 7.4) for 30min
at 37, 25 and 4°C, across MDA-MB231, T47D and ZR-75-1 cells. Data is shown as mean±S.D.
n=4
pH And Ion Dependency
In order to delineate the role of an inward driven proton gradient for [14C] AA uptake, the
study was carried out with pH ranging from 5-8 in MDA-MB231, T47D and ZR-75-1 cells. Uptake
of [14C] AA elevated with a rise in extracellular pH from 5 to 8 in all cell lines. In comparison to
pH 7.4, uptake of [14C] AA diminished to ~40% and 50% at pH 5 and 6 respectively in MDA-
MB231, T47D and ZR-75-1 cells (Fig.7.4). Based on these results, further uptake studies were
carried out at pH 7.4 with all the cell lines.
In sodium free media, uptake of [14C] AA was reduced to ~50%, 25% and 30%
respectively, in MDA-MB231, T47D and ZR-75-1 cells (Fig.7.5). Similarly, uptake of AA was
also diminished to ~%60, 50% and 50% in MDA-MB231, T47D and ZR-75-1 cells respectively
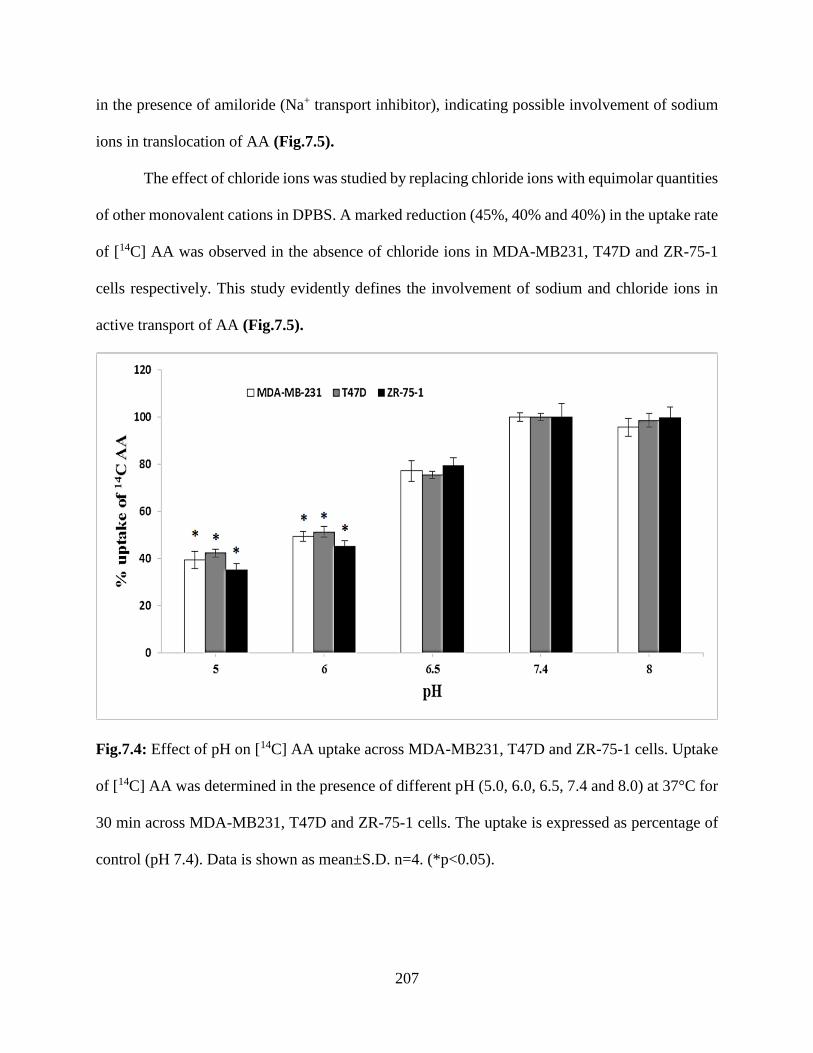
207
in the presence of amiloride (Na+ transport inhibitor), indicating possible involvement of sodium
ions in translocation of AA (Fig.7.5).
The effect of chloride ions was studied by replacing chloride ions with equimolar quantities
of other monovalent cations in DPBS. A marked reduction (45%, 40% and 40%) in the uptake rate
of [14C] AA was observed in the absence of chloride ions in MDA-MB231, T47D and ZR-75-1
cells respectively. This study evidently defines the involvement of sodium and chloride ions in
active transport of AA (Fig.7.5).
Fig.7.4: Effect of pH on [14C] AA uptake across MDA-MB231, T47D and ZR-75-1 cells. Uptake
of [14C] AA was determined in the presence of different pH (5.0, 6.0, 6.5, 7.4 and 8.0) at 37°C for
30 min across MDA-MB231, T47D and ZR-75-1 cells. The uptake is expressed as percentage of
control (pH 7.4). Data is shown as mean±S.D. n=4. (*p<0.05).
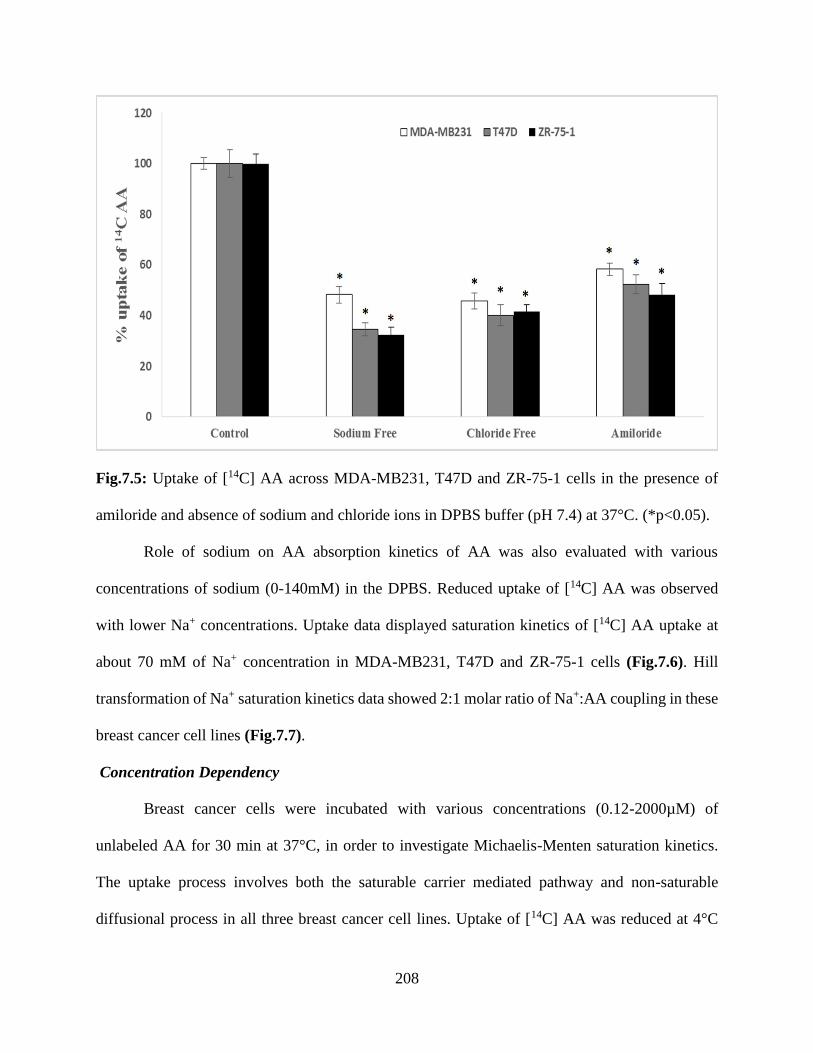
208
Fig.7.5: Uptake of [14C] AA across MDA-MB231, T47D and ZR-75-1 cells in the presence of
amiloride and absence of sodium and chloride ions in DPBS buffer (pH 7.4) at 37°C. (*p<0.05).
Role of sodium on AA absorption kinetics of AA was also evaluated with various
concentrations of sodium (0-140mM) in the DPBS. Reduced uptake of [14C] AA was observed
with lower Na+ concentrations. Uptake data displayed saturation kinetics of [14C] AA uptake at
about 70 mM of Na+ concentration in MDA-MB231, T47D and ZR-75-1 cells (Fig.7.6). Hill
transformation of Na+ saturation kinetics data showed 2:1 molar ratio of Na+:AA coupling in these
breast cancer cell lines (Fig.7.7).
Concentration Dependency
Breast cancer cells were incubated with various concentrations (0.12-2000µM) of
unlabeled AA for 30 min at 37°C, in order to investigate Michaelis-Menten saturation kinetics.
The uptake process involves both the saturable carrier mediated pathway and non-saturable
diffusional process in all three breast cancer cell lines. Uptake of [14C] AA was reduced at 4°C
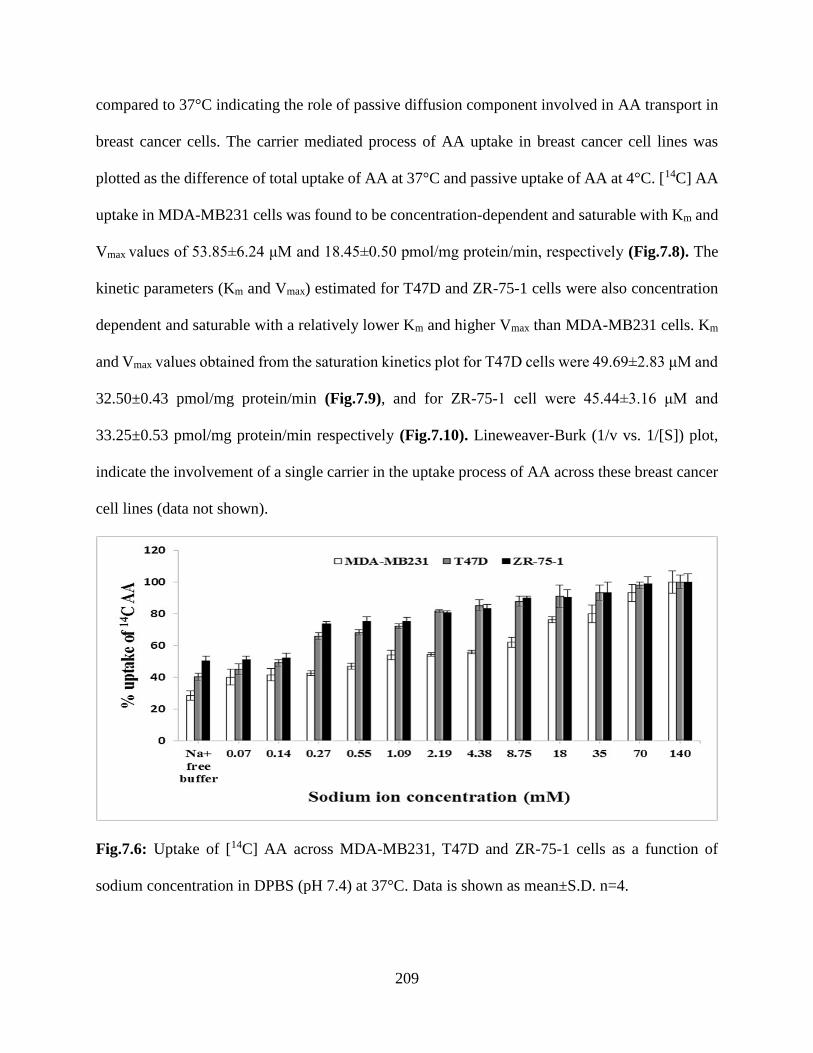
209
compared to 37°C indicating the role of passive diffusion component involved in AA transport in
breast cancer cells. The carrier mediated process of AA uptake in breast cancer cell lines was
plotted as the difference of total uptake of AA at 37°C and passive uptake of AA at 4°C. [14C] AA
uptake in MDA-MB231 cells was found to be concentration-dependent and saturable with Km and
Vmax values of 53.85±6.24 μM and 18.45±0.50 pmol/mg protein/min, respectively (Fig.7.8). The
kinetic parameters (Km and Vmax) estimated for T47D and ZR-75-1 cells were also concentration
dependent and saturable with a relatively lower Km and higher Vmax than MDA-MB231 cells. Km
and Vmax values obtained from the saturation kinetics plot for T47D cells were 49.69±2.83 μM and
32.50±0.43 pmol/mg protein/min (Fig.7.9), and for ZR-75-1 cell were 45.44±3.16 μM and
33.25±0.53 pmol/mg protein/min respectively (Fig.7.10). Lineweaver-Burk (1/v vs. 1/[S]) plot,
indicate the involvement of a single carrier in the uptake process of AA across these breast cancer
cell lines (data not shown).
Fig.7.6: Uptake of [14C] AA across MDA-MB231, T47D and ZR-75-1 cells as a function of
sodium concentration in DPBS (pH 7.4) at 37°C. Data is shown as mean±S.D. n=4.
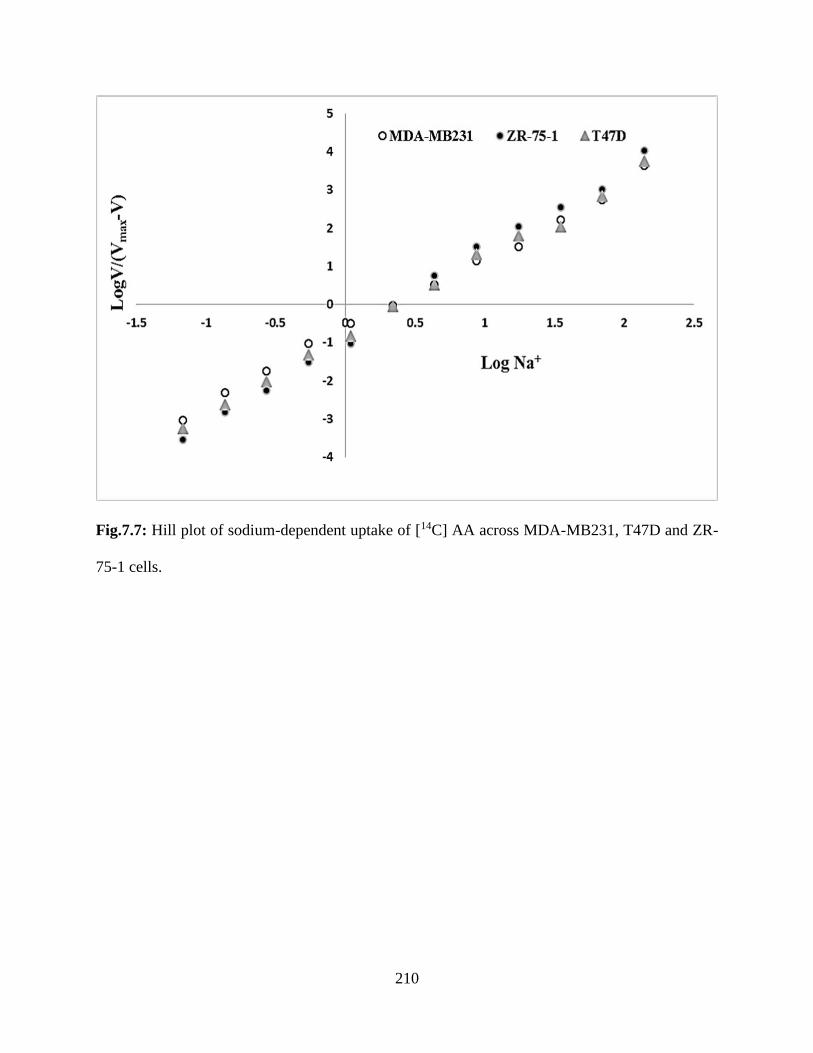
210
Fig.7.7: Hill plot of sodium-dependent uptake of [14C] AA across MDA-MB231, T47D and ZR-
75-1 cells.
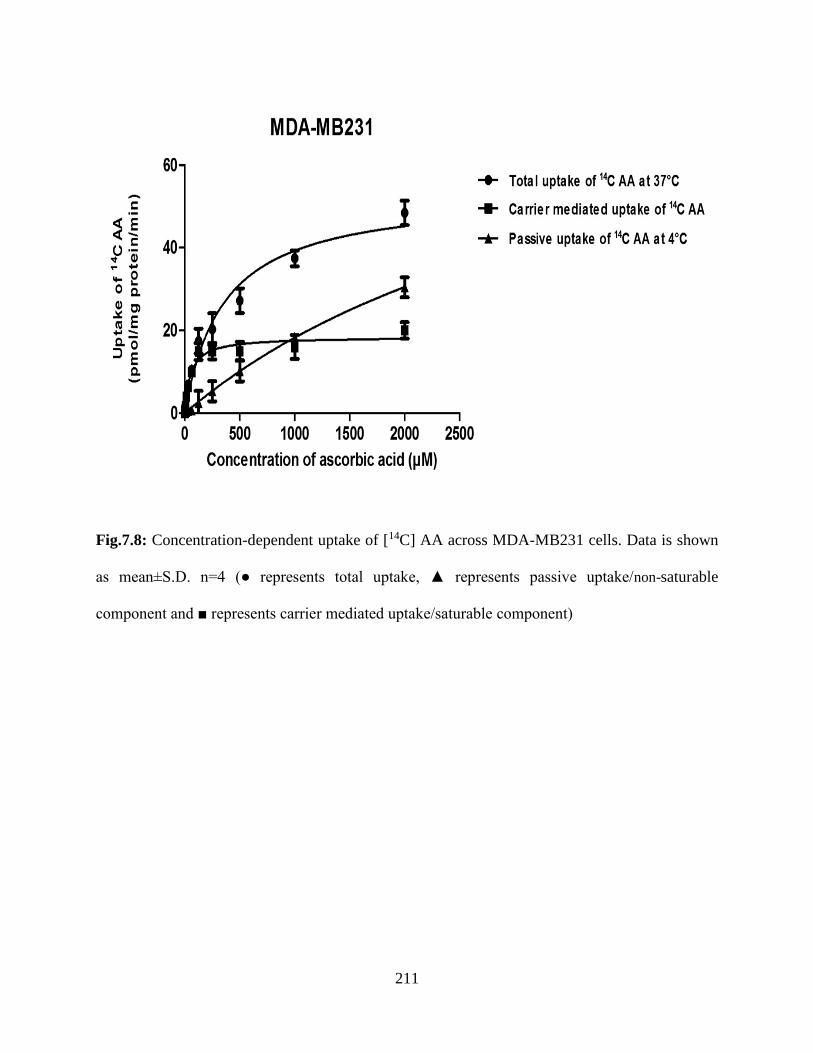
211
Fig.7.8: Concentration-dependent uptake of [14C] AA across MDA-MB231 cells. Data is shown
as mean±S.D. n=4 (● represents total uptake, ▲ represents passive uptake/non-saturable
component and ■ represents carrier mediated uptake/saturable component)
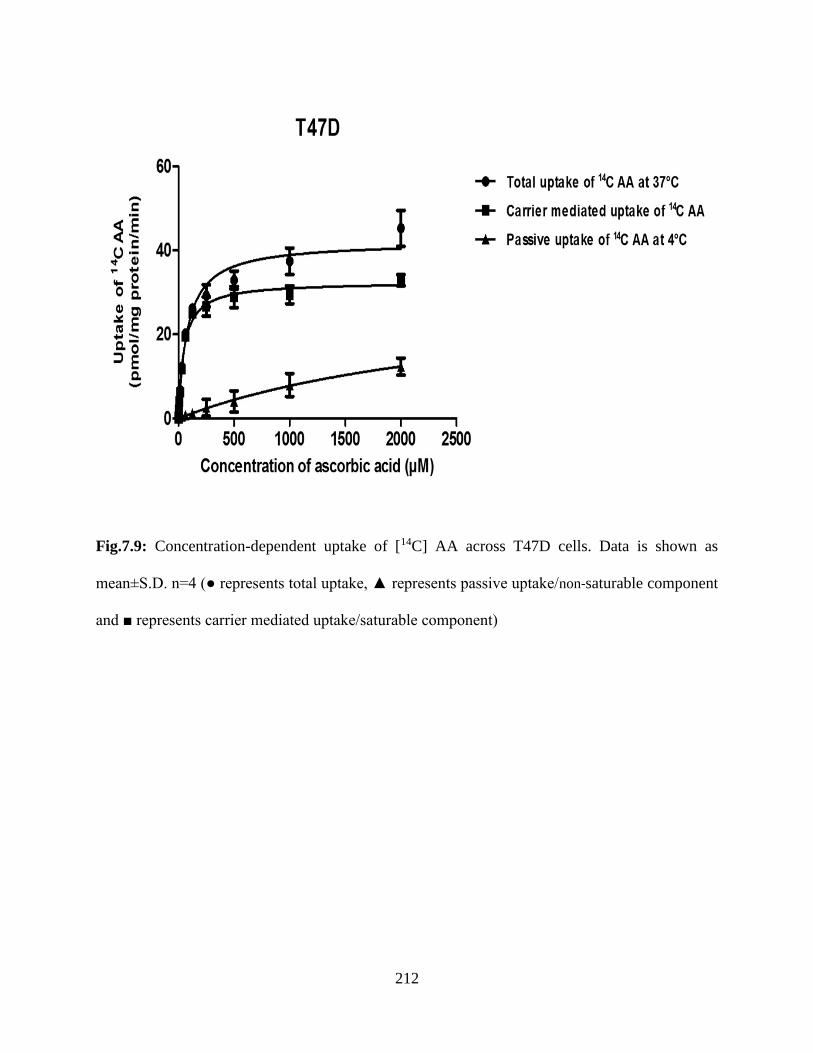
212
Fig.7.9: Concentration-dependent uptake of [14C] AA across T47D cells. Data is shown as
mean±S.D. n=4 (● represents total uptake, ▲ represents passive uptake/non-saturable component
and ■ represents carrier mediated uptake/saturable component)
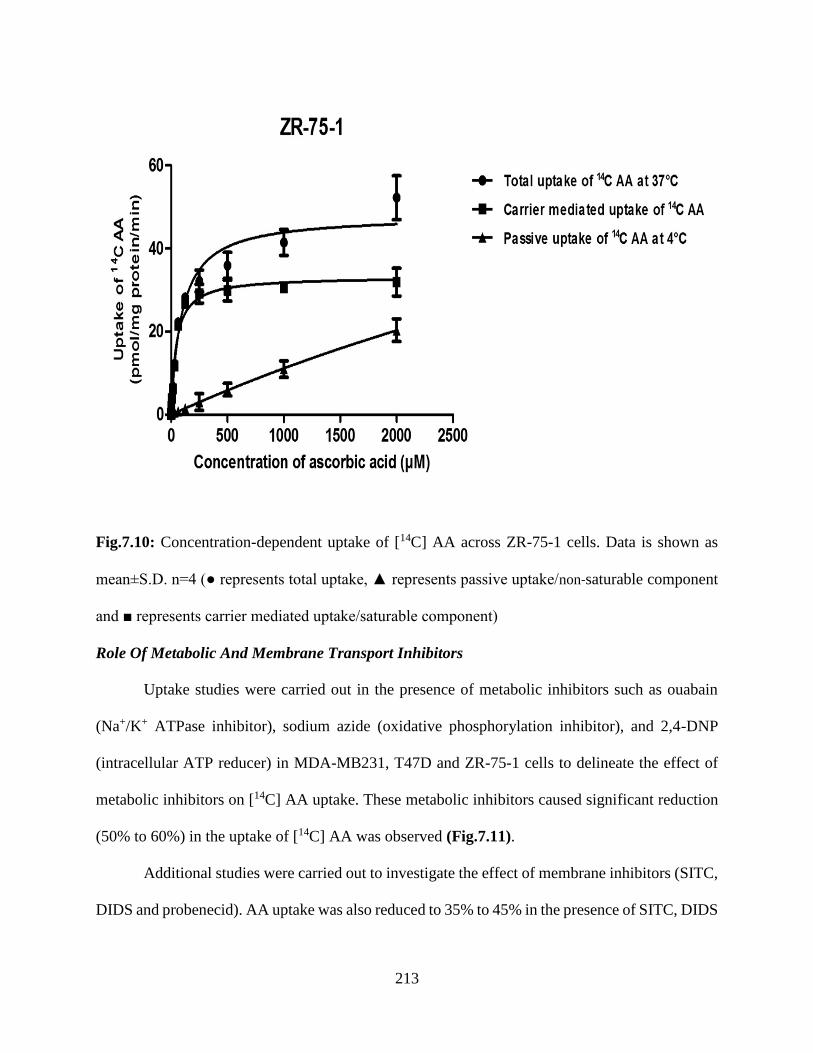
213
Fig.7.10: Concentration-dependent uptake of [14C] AA across ZR-75-1 cells. Data is shown as
mean±S.D. n=4 (● represents total uptake, ▲ represents passive uptake/non-saturable component
and ■ represents carrier mediated uptake/saturable component)
Role Of Metabolic And Membrane Transport Inhibitors
Uptake studies were carried out in the presence of metabolic inhibitors such as ouabain
(Na+/K+ ATPase inhibitor), sodium azide (oxidative phosphorylation inhibitor), and 2,4-DNP
(intracellular ATP reducer) in MDA-MB231, T47D and ZR-75-1 cells to delineate the effect of
metabolic inhibitors on [14C] AA uptake. These metabolic inhibitors caused significant reduction
(50% to 60%) in the uptake of [14C] AA was observed (Fig.7.11).
Additional studies were carried out to investigate the effect of membrane inhibitors (SITC,
DIDS and probenecid). AA uptake was also reduced to 35% to 45% in the presence of SITC, DIDS
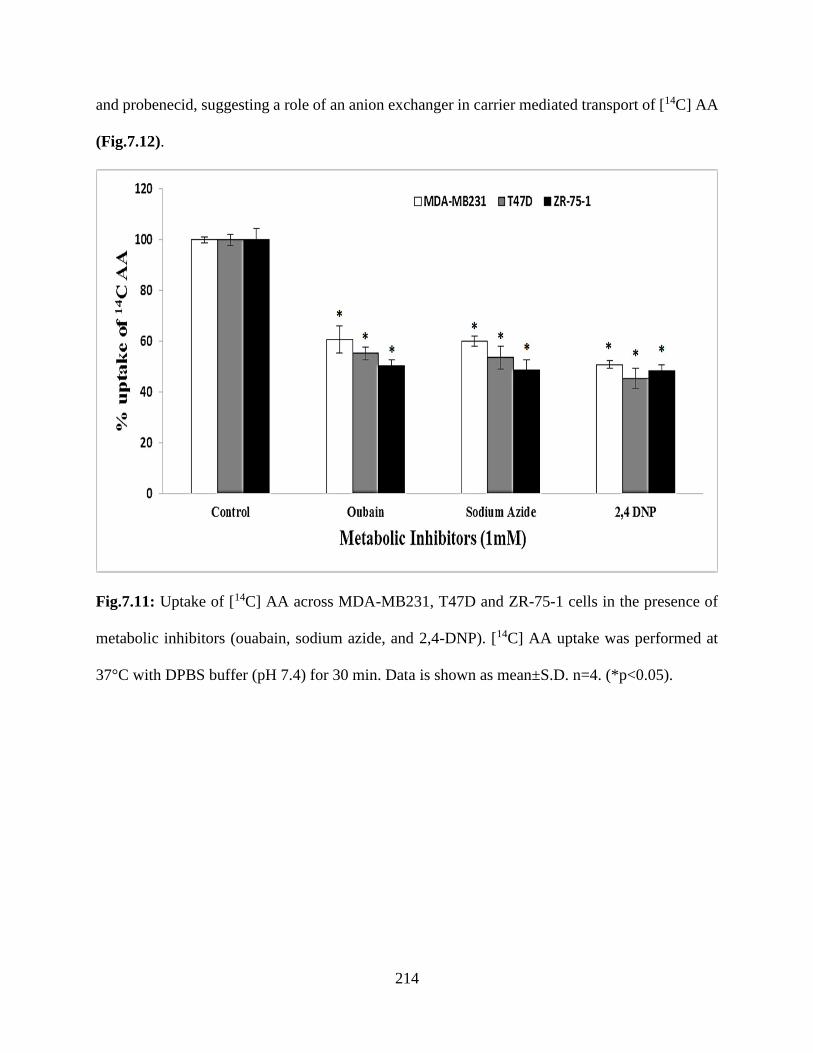
214
and probenecid, suggesting a role of an anion exchanger in carrier mediated transport of [14C] AA
(Fig.7.12).
Fig.7.11: Uptake of [14C] AA across MDA-MB231, T47D and ZR-75-1 cells in the presence of
metabolic inhibitors (ouabain, sodium azide, and 2,4-DNP). [14C] AA uptake was performed at
37°C with DPBS buffer (pH 7.4) for 30 min. Data is shown as mean±S.D. n=4. (*p<0.05).
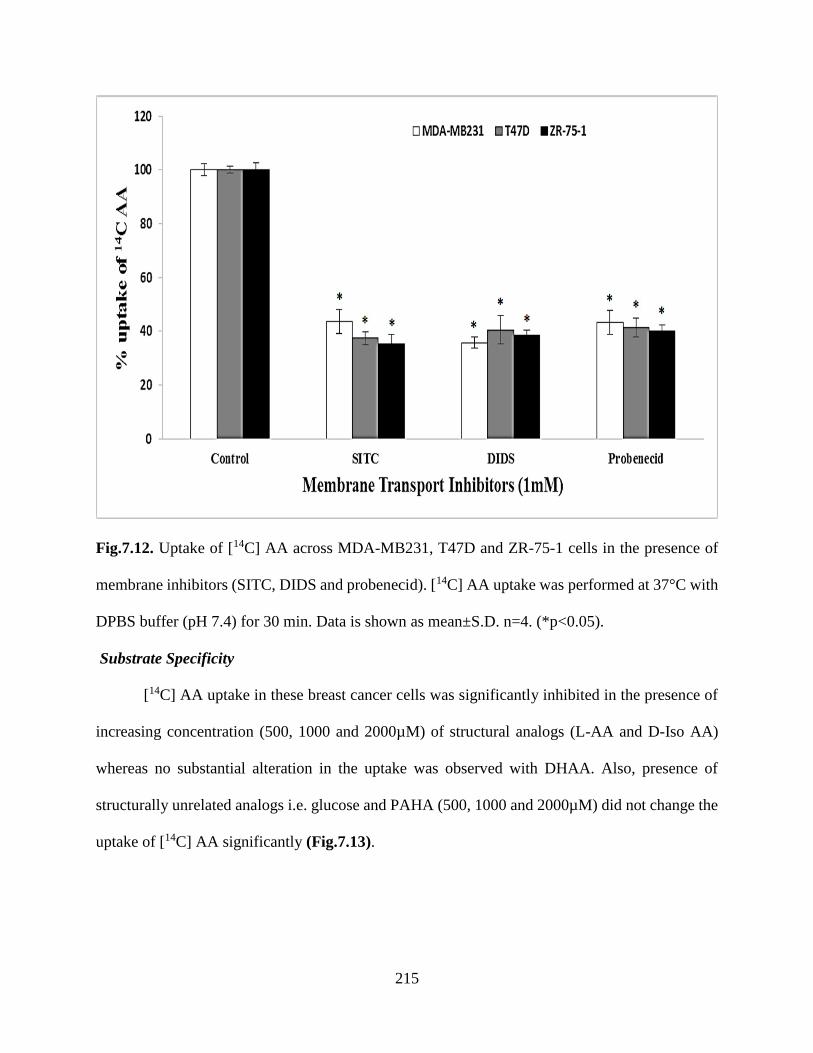
215
Fig.7.12. Uptake of [14C] AA across MDA-MB231, T47D and ZR-75-1 cells in the presence of
membrane inhibitors (SITC, DIDS and probenecid). [14C] AA uptake was performed at 37°C with
DPBS buffer (pH 7.4) for 30 min. Data is shown as mean±S.D. n=4. (*p<0.05).
Substrate Specificity
[14C] AA uptake in these breast cancer cells was significantly inhibited in the presence of
increasing concentration (500, 1000 and 2000µM) of structural analogs (L-AA and D-Iso AA)
whereas no substantial alteration in the uptake was observed with DHAA. Also, presence of
structurally unrelated analogs i.e. glucose and PAHA (500, 1000 and 2000µM) did not change the
uptake of [14C] AA significantly (Fig.7.13).

216
Fig.7.13. Uptake of [14C] AA in presence of L-ascorbic acid (L-AA), D-isoascorbic acid (D-Iso
AA), dehydro ascorbic acid (DHAA), D-glucose, and para-amino hippuric acid (PAHA) at three
different concentrations across MDA-MB231, T47D and ZR-75-1 cells. [14C] AA uptake was
performed at 37°C with DPBS buffer (pH 7.4) for 30 min. Data is shown as mean±S.D. n=4.
(*p<0.05).
Intracellular Regulation
The role of different intracellular regulation pathways on [14C] AA uptake was also
investigated. With higher concentrations of calmidazolium and KN-62 (modulators of
Ca++/calmodium (Ca++/CaM) pathway), significantly reduced uptake of [14C] AA was observed in
breast cancer cells. PKC activator, PMA (10-100 µM) also caused significant inhibition of AA
uptake in all breast cancer cell lines. Inhibitory effect of PMA was muted by BIS (25-100 µM)
across all breast cancer cells (Table 7.1).
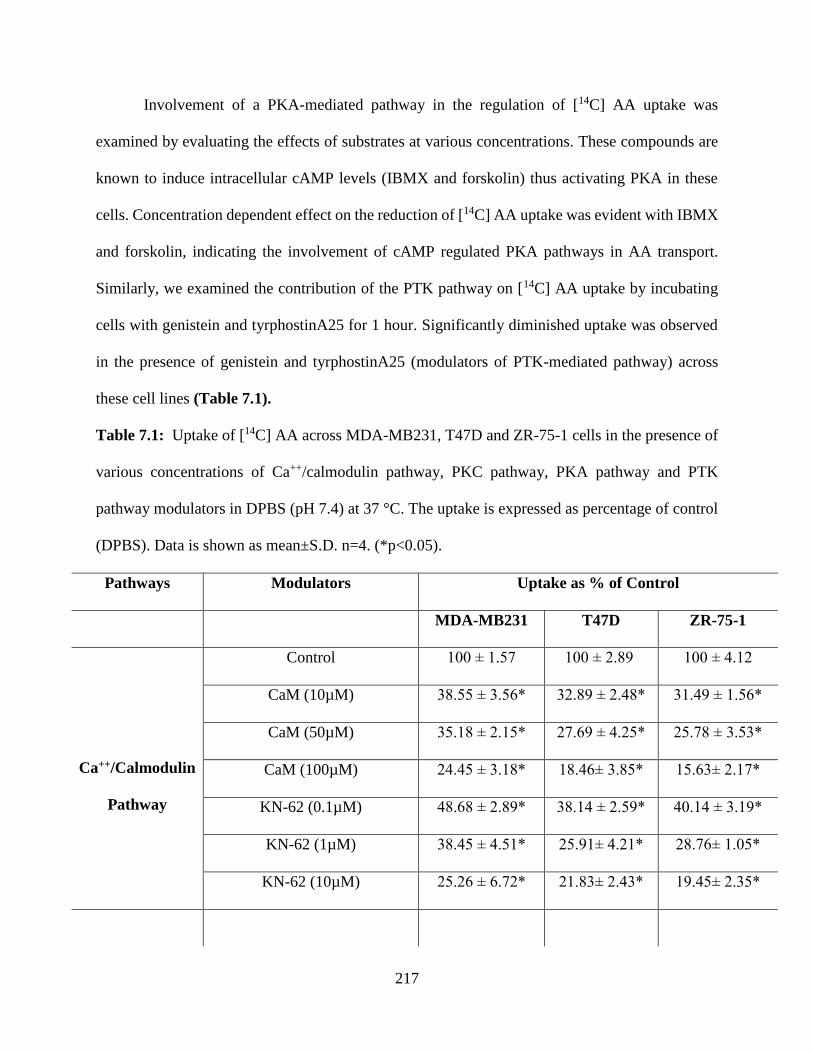
217
Involvement of a PKA-mediated pathway in the regulation of [14C] AA uptake was
examined by evaluating the effects of substrates at various concentrations. These compounds are
known to induce intracellular cAMP levels (IBMX and forskolin) thus activating PKA in these
cells. Concentration dependent effect on the reduction of [14C] AA uptake was evident with IBMX
and forskolin, indicating the involvement of cAMP regulated PKA pathways in AA transport.
Similarly, we examined the contribution of the PTK pathway on [14C] AA uptake by incubating
cells with genistein and tyrphostinA25 for 1 hour. Significantly diminished uptake was observed
in the presence of genistein and tyrphostinA25 (modulators of PTK-mediated pathway) across
these cell lines (Table 7.1).
Table 7.1: Uptake of [14C] AA across MDA-MB231, T47D and ZR-75-1 cells in the presence of
various concentrations of Ca++/calmodulin pathway, PKC pathway, PKA pathway and PTK
pathway modulators in DPBS (pH 7.4) at 37 °C. The uptake is expressed as percentage of control
(DPBS). Data is shown as mean±S.D. n=4. (*p<0.05).
Pathways Modulators Uptake as % of Control
MDA-MB231 T47D ZR-75-1
Ca++/Calmodulin
Pathway
Control 100 ± 1.57 100 ± 2.89 100 ± 4.12
CaM (10µM) 38.55 ± 3.56* 32.89 ± 2.48* 31.49 ± 1.56*
CaM (50µM) 35.18 ± 2.15* 27.69 ± 4.25* 25.78 ± 3.53*
CaM (100µM) 24.45 ± 3.18* 18.46± 3.85* 15.63± 2.17*
KN-62 (0.1µM) 48.68 ± 2.89* 38.14 ± 2.59* 40.14 ± 3.19*
KN-62 (1µM) 38.45 ± 4.51* 25.91± 4.21* 28.76± 1.05*
KN-62 (10µM) 25.26 ± 6.72* 21.83± 2.43* 19.45± 2.35*
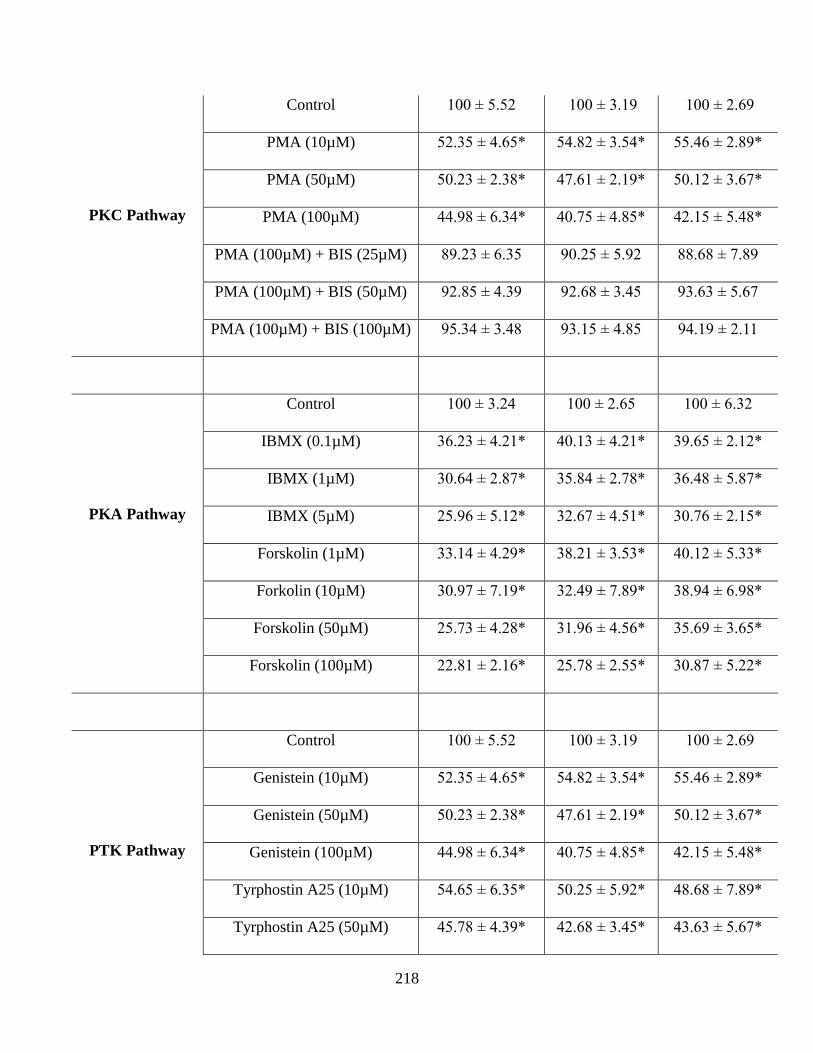
218
PKC Pathway
Control 100 ± 5.52 100 ± 3.19 100 ± 2.69
PMA (10µM) 52.35 ± 4.65* 54.82 ± 3.54* 55.46 ± 2.89*
PMA (50µM) 50.23 ± 2.38* 47.61 ± 2.19* 50.12 ± 3.67*
PMA (100µM) 44.98 ± 6.34* 40.75 ± 4.85* 42.15 ± 5.48*
PMA (100µM) + BIS (25µM) 89.23 ± 6.35 90.25 ± 5.92 88.68 ± 7.89
PMA (100µM) + BIS (50µM) 92.85 ± 4.39 92.68 ± 3.45 93.63 ± 5.67
PMA (100µM) + BIS (100µM) 95.34 ± 3.48 93.15 ± 4.85 94.19 ± 2.11
PKA Pathway
Control 100 ± 3.24 100 ± 2.65 100 ± 6.32
IBMX (0.1µM) 36.23 ± 4.21* 40.13 ± 4.21* 39.65 ± 2.12*
IBMX (1µM) 30.64 ± 2.87* 35.84 ± 2.78* 36.48 ± 5.87*
IBMX (5µM) 25.96 ± 5.12* 32.67 ± 4.51* 30.76 ± 2.15*
Forskolin (1µM) 33.14 ± 4.29* 38.21 ± 3.53* 40.12 ± 5.33*
Forkolin (10µM) 30.97 ± 7.19* 32.49 ± 7.89* 38.94 ± 6.98*
Forskolin (50µM) 25.73 ± 4.28* 31.96 ± 4.56* 35.69 ± 3.65*
Forskolin (100µM) 22.81 ± 2.16* 25.78 ± 2.55* 30.87 ± 5.22*
PTK Pathway
Control 100 ± 5.52 100 ± 3.19 100 ± 2.69
Genistein (10µM) 52.35 ± 4.65* 54.82 ± 3.54* 55.46 ± 2.89*
Genistein (50µM) 50.23 ± 2.38* 47.61 ± 2.19* 50.12 ± 3.67*
Genistein (100µM) 44.98 ± 6.34* 40.75 ± 4.85* 42.15 ± 5.48*
Tyrphostin A25 (10µM) 54.65 ± 6.35* 50.25 ± 5.92* 48.68 ± 7.89*
Tyrphostin A25 (50µM) 45.78 ± 4.39* 42.68 ± 3.45* 43.63 ± 5.67*
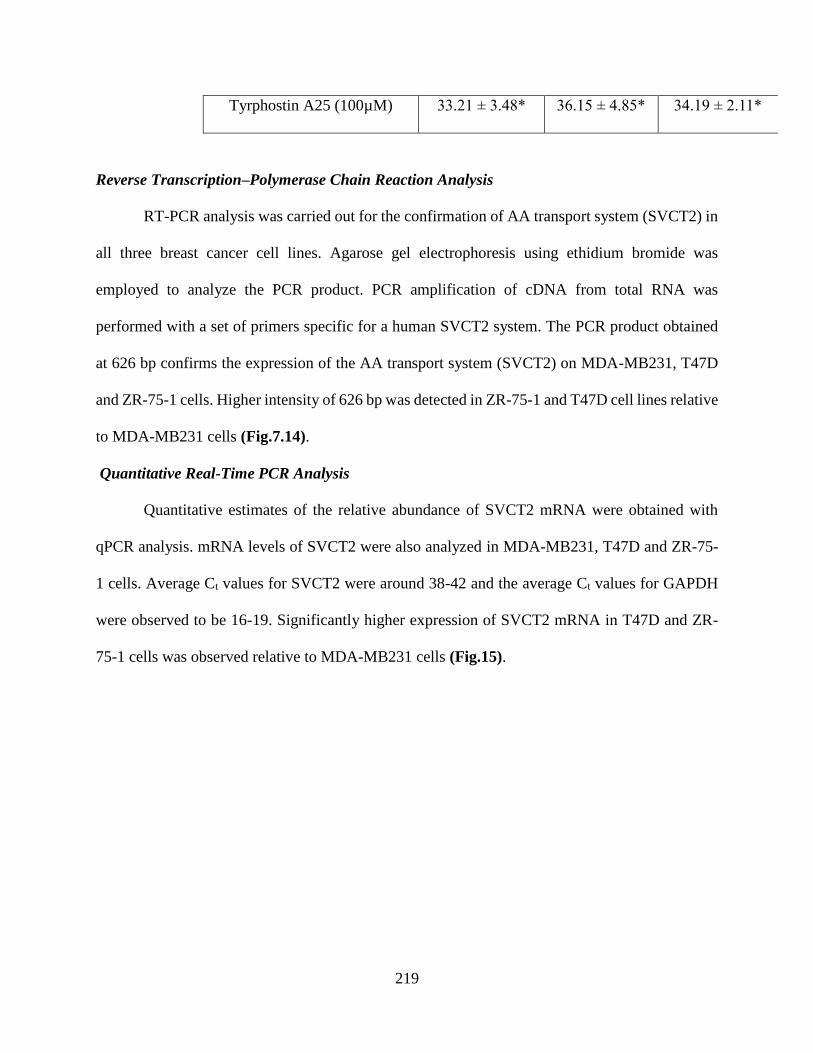
219
Tyrphostin A25 (100µM) 33.21 ± 3.48* 36.15 ± 4.85* 34.19 ± 2.11*
Reverse Transcription–Polymerase Chain Reaction Analysis
RT-PCR analysis was carried out for the confirmation of AA transport system (SVCT2) in
all three breast cancer cell lines. Agarose gel electrophoresis using ethidium bromide was
employed to analyze the PCR product. PCR amplification of cDNA from total RNA was
performed with a set of primers specific for a human SVCT2 system. The PCR product obtained
at 626 bp confirms the expression of the AA transport system (SVCT2) on MDA-MB231, T47D
and ZR-75-1 cells. Higher intensity of 626 bp was detected in ZR-75-1 and T47D cell lines relative
to MDA-MB231 cells (Fig.7.14).
Quantitative Real-Time PCR Analysis
Quantitative estimates of the relative abundance of SVCT2 mRNA were obtained with
qPCR analysis. mRNA levels of SVCT2 were also analyzed in MDA-MB231, T47D and ZR-75-
1 cells. Average Ct values for SVCT2 were around 38-42 and the average Ct values for GAPDH
were observed to be 16-19. Significantly higher expression of SVCT2 mRNA in T47D and ZR-
75-1 cells was observed relative to MDA-MB231 cells (Fig.15).
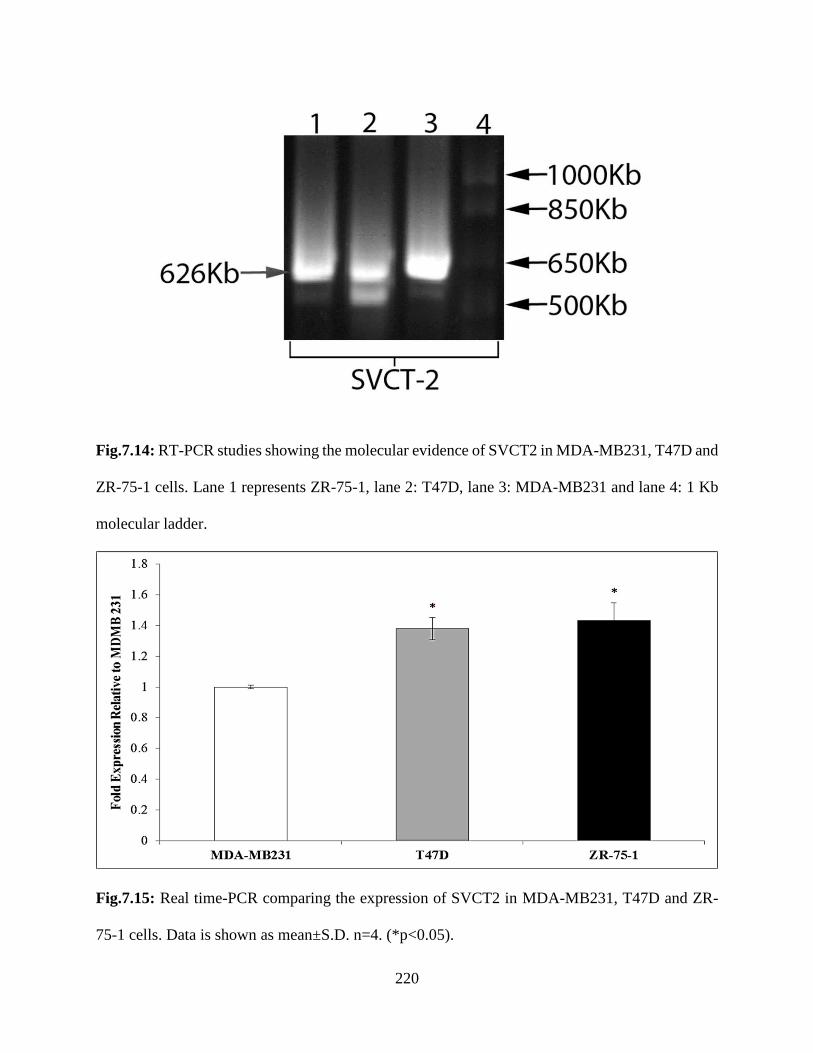
220
Fig.7.14: RT-PCR studies showing the molecular evidence of SVCT2 in MDA-MB231, T47D and
ZR-75-1 cells. Lane 1 represents ZR-75-1, lane 2: T47D, lane 3: MDA-MB231 and lane 4: 1 Kb
molecular ladder.
Fig.7.15: Real time-PCR comparing the expression of SVCT2 in MDA-MB231, T47D and ZR-
75-1 cells. Data is shown as mean±S.D. n=4. (*p<0.05).
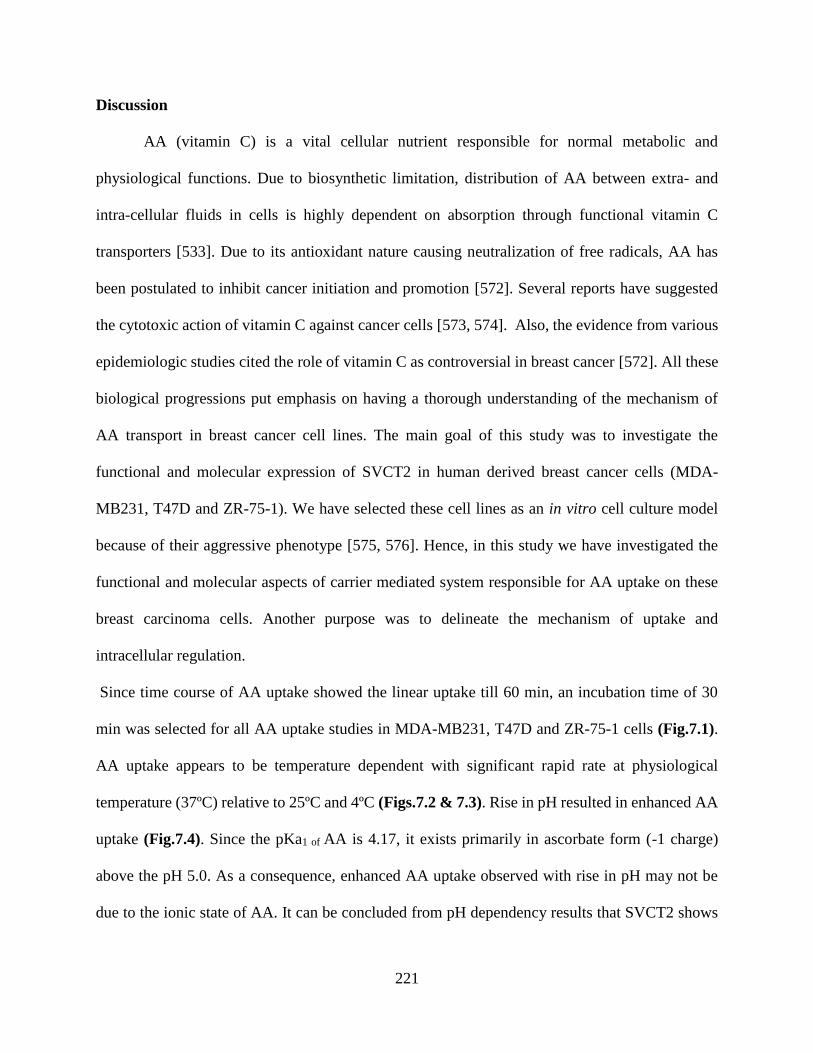
221
Discussion
AA (vitamin C) is a vital cellular nutrient responsible for normal metabolic and
physiological functions. Due to biosynthetic limitation, distribution of AA between extra- and
intra-cellular fluids in cells is highly dependent on absorption through functional vitamin C
transporters [533]. Due to its antioxidant nature causing neutralization of free radicals, AA has
been postulated to inhibit cancer initiation and promotion [572]. Several reports have suggested
the cytotoxic action of vitamin C against cancer cells [573, 574]. Also, the evidence from various
epidemiologic studies cited the role of vitamin C as controversial in breast cancer [572]. All these
biological progressions put emphasis on having a thorough understanding of the mechanism of
AA transport in breast cancer cell lines. The main goal of this study was to investigate the
functional and molecular expression of SVCT2 in human derived breast cancer cells (MDA-
MB231, T47D and ZR-75-1). We have selected these cell lines as an in vitro cell culture model
because of their aggressive phenotype [575, 576]. Hence, in this study we have investigated the
functional and molecular aspects of carrier mediated system responsible for AA uptake on these
breast carcinoma cells. Another purpose was to delineate the mechanism of uptake and
intracellular regulation.
Since time course of AA uptake showed the linear uptake till 60 min, an incubation time of 30
min was selected for all AA uptake studies in MDA-MB231, T47D and ZR-75-1 cells (Fig.7.1).
AA uptake appears to be temperature dependent with significant rapid rate at physiological
temperature (37ºC) relative to 25ºC and 4ºC (Figs.7.2 & 7.3). Rise in pH resulted in enhanced AA
uptake (Fig.7.4). Since the pKa1 of AA is 4.17, it exists primarily in ascorbate form (-1 charge)
above the pH 5.0. As a consequence, enhanced AA uptake observed with rise in pH may not be
due to the ionic state of AA. It can be concluded from pH dependency results that SVCT2 shows
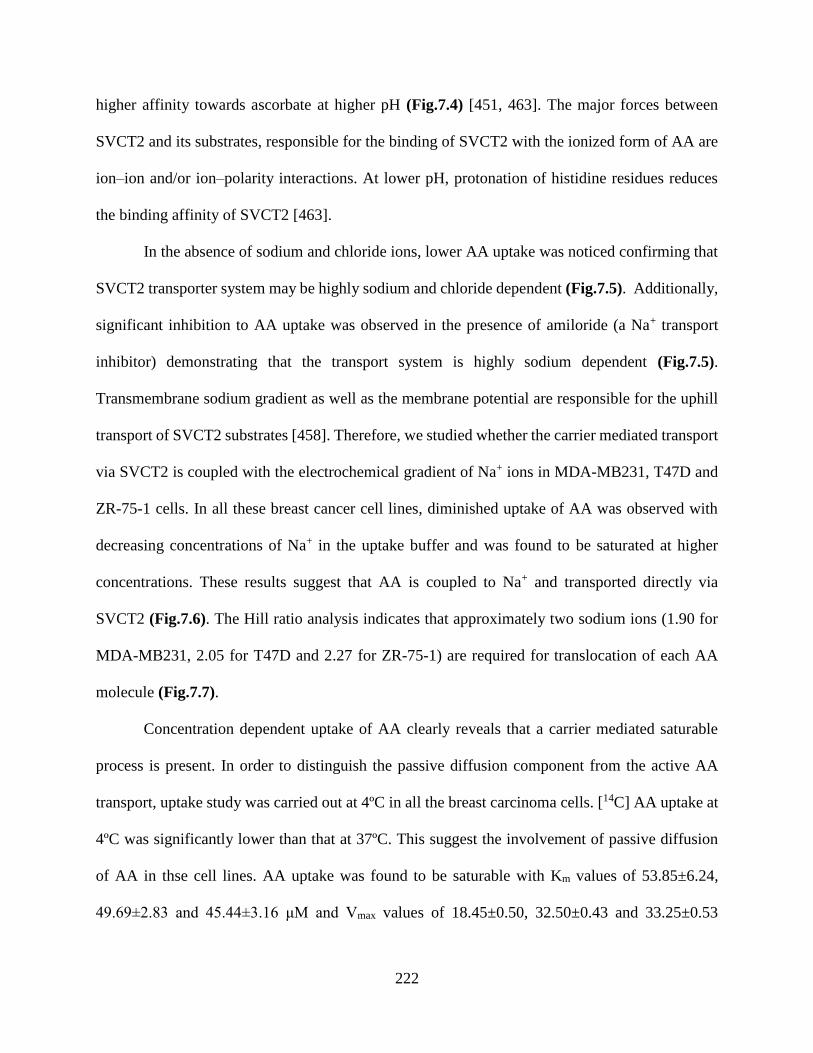
222
higher affinity towards ascorbate at higher pH (Fig.7.4) [451, 463]. The major forces between
SVCT2 and its substrates, responsible for the binding of SVCT2 with the ionized form of AA are
ion–ion and/or ion–polarity interactions. At lower pH, protonation of histidine residues reduces
the binding affinity of SVCT2 [463].
In the absence of sodium and chloride ions, lower AA uptake was noticed confirming that
SVCT2 transporter system may be highly sodium and chloride dependent (Fig.7.5). Additionally,
significant inhibition to AA uptake was observed in the presence of amiloride (a Na+ transport
inhibitor) demonstrating that the transport system is highly sodium dependent (Fig.7.5).
Transmembrane sodium gradient as well as the membrane potential are responsible for the uphill
transport of SVCT2 substrates [458]. Therefore, we studied whether the carrier mediated transport
via SVCT2 is coupled with the electrochemical gradient of Na+ ions in MDA-MB231, T47D and
ZR-75-1 cells. In all these breast cancer cell lines, diminished uptake of AA was observed with
decreasing concentrations of Na+ in the uptake buffer and was found to be saturated at higher
concentrations. These results suggest that AA is coupled to Na+ and transported directly via
SVCT2 (Fig.7.6). The Hill ratio analysis indicates that approximately two sodium ions (1.90 for
MDA-MB231, 2.05 for T47D and 2.27 for ZR-75-1) are required for translocation of each AA
molecule (Fig.7.7).
Concentration dependent uptake of AA clearly reveals that a carrier mediated saturable
process is present. In order to distinguish the passive diffusion component from the active AA
transport, uptake study was carried out at 4ºC in all the breast carcinoma cells. [14C] AA uptake at
4ºC was significantly lower than that at 37ºC. This suggest the involvement of passive diffusion
of AA in thse cell lines. AA uptake was found to be saturable with Km values of 53.85±6.24,
49.69±2.83 and 45.44±3.16 μM and Vmax values of 18.45±0.50, 32.50±0.43 and 33.25±0.53
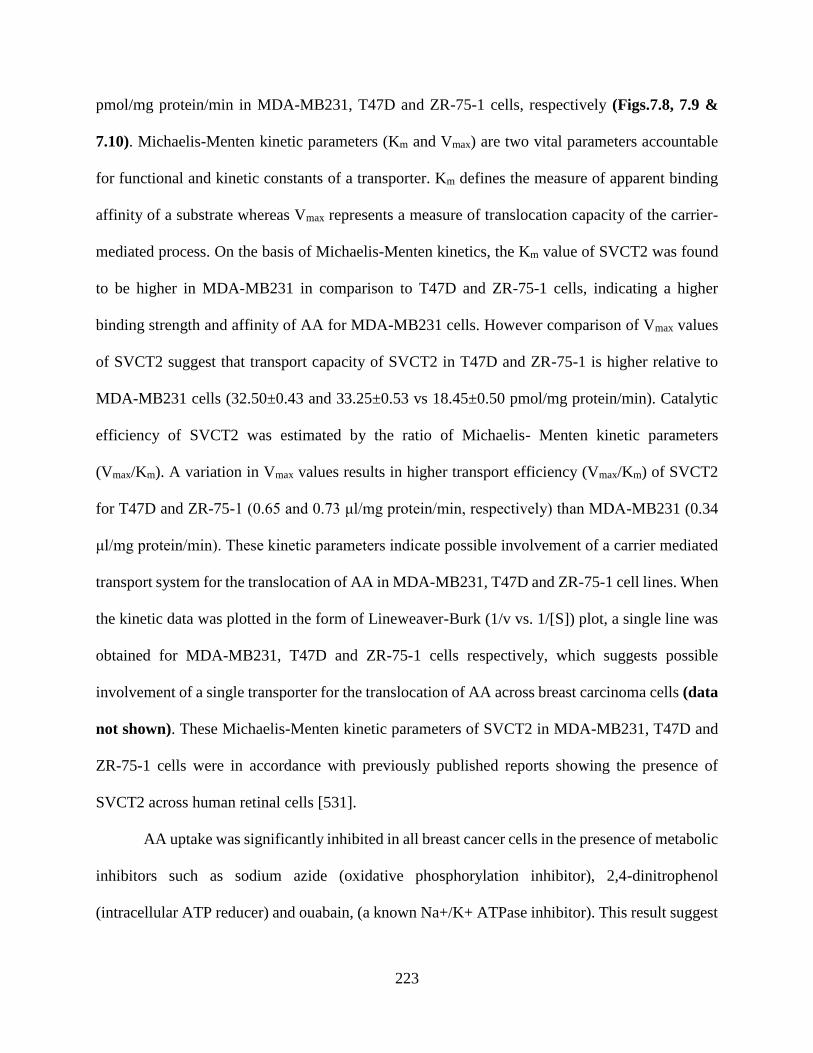
223
pmol/mg protein/min in MDA-MB231, T47D and ZR-75-1 cells, respectively (Figs.7.8, 7.9 &
7.10). Michaelis-Menten kinetic parameters (Km and Vmax) are two vital parameters accountable
for functional and kinetic constants of a transporter. Km defines the measure of apparent binding
affinity of a substrate whereas Vmax represents a measure of translocation capacity of the carrier-
mediated process. On the basis of Michaelis-Menten kinetics, the Km value of SVCT2 was found
to be higher in MDA-MB231 in comparison to T47D and ZR-75-1 cells, indicating a higher
binding strength and affinity of AA for MDA-MB231 cells. However comparison of Vmax values
of SVCT2 suggest that transport capacity of SVCT2 in T47D and ZR-75-1 is higher relative to
MDA-MB231 cells (32.50±0.43 and 33.25±0.53 vs 18.45±0.50 pmol/mg protein/min). Catalytic
efficiency of SVCT2 was estimated by the ratio of Michaelis- Menten kinetic parameters
(Vmax/Km). A variation in Vmax values results in higher transport efficiency (Vmax/Km) of SVCT2
for T47D and ZR-75-1 (0.65 and 0.73 μl/mg protein/min, respectively) than MDA-MB231 (0.34
μl/mg protein/min). These kinetic parameters indicate possible involvement of a carrier mediated
transport system for the translocation of AA in MDA-MB231, T47D and ZR-75-1 cell lines. When
the kinetic data was plotted in the form of Lineweaver-Burk (1/v vs. 1/[S]) plot, a single line was
obtained for MDA-MB231, T47D and ZR-75-1 cells respectively, which suggests possible
involvement of a single transporter for the translocation of AA across breast carcinoma cells (data
not shown). These Michaelis-Menten kinetic parameters of SVCT2 in MDA-MB231, T47D and
ZR-75-1 cells were in accordance with previously published reports showing the presence of
SVCT2 across human retinal cells [531].
AA uptake was significantly inhibited in all breast cancer cells in the presence of metabolic
inhibitors such as sodium azide (oxidative phosphorylation inhibitor), 2,4-dinitrophenol
(intracellular ATP reducer) and ouabain, (a known Na+/K+ ATPase inhibitor). This result suggest
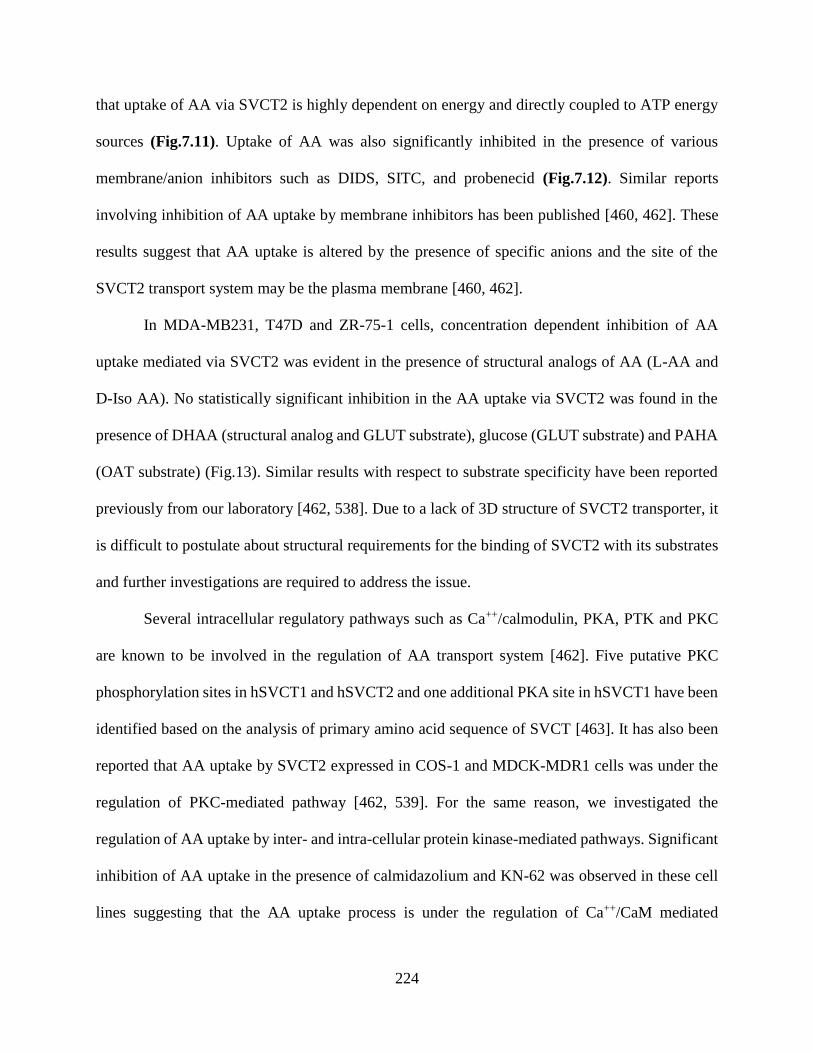
224
that uptake of AA via SVCT2 is highly dependent on energy and directly coupled to ATP energy
sources (Fig.7.11). Uptake of AA was also significantly inhibited in the presence of various
membrane/anion inhibitors such as DIDS, SITC, and probenecid (Fig.7.12). Similar reports
involving inhibition of AA uptake by membrane inhibitors has been published [460, 462]. These
results suggest that AA uptake is altered by the presence of specific anions and the site of the
SVCT2 transport system may be the plasma membrane [460, 462].
In MDA-MB231, T47D and ZR-75-1 cells, concentration dependent inhibition of AA
uptake mediated via SVCT2 was evident in the presence of structural analogs of AA (L-AA and
D-Iso AA). No statistically significant inhibition in the AA uptake via SVCT2 was found in the
presence of DHAA (structural analog and GLUT substrate), glucose (GLUT substrate) and PAHA
(OAT substrate) (Fig.13). Similar results with respect to substrate specificity have been reported
previously from our laboratory [462, 538]. Due to a lack of 3D structure of SVCT2 transporter, it
is difficult to postulate about structural requirements for the binding of SVCT2 with its substrates
and further investigations are required to address the issue.
Several intracellular regulatory pathways such as Ca++/calmodulin, PKA, PTK and PKC
are known to be involved in the regulation of AA transport system [462]. Five putative PKC
phosphorylation sites in hSVCT1 and hSVCT2 and one additional PKA site in hSVCT1 have been
identified based on the analysis of primary amino acid sequence of SVCT [463]. It has also been
reported that AA uptake by SVCT2 expressed in COS-1 and MDCK-MDR1 cells was under the
regulation of PKC-mediated pathway [462, 539]. For the same reason, we investigated the
regulation of AA uptake by inter- and intra-cellular protein kinase-mediated pathways. Significant
inhibition of AA uptake in the presence of calmidazolium and KN-62 was observed in these cell
lines suggesting that the AA uptake process is under the regulation of Ca++/CaM mediated
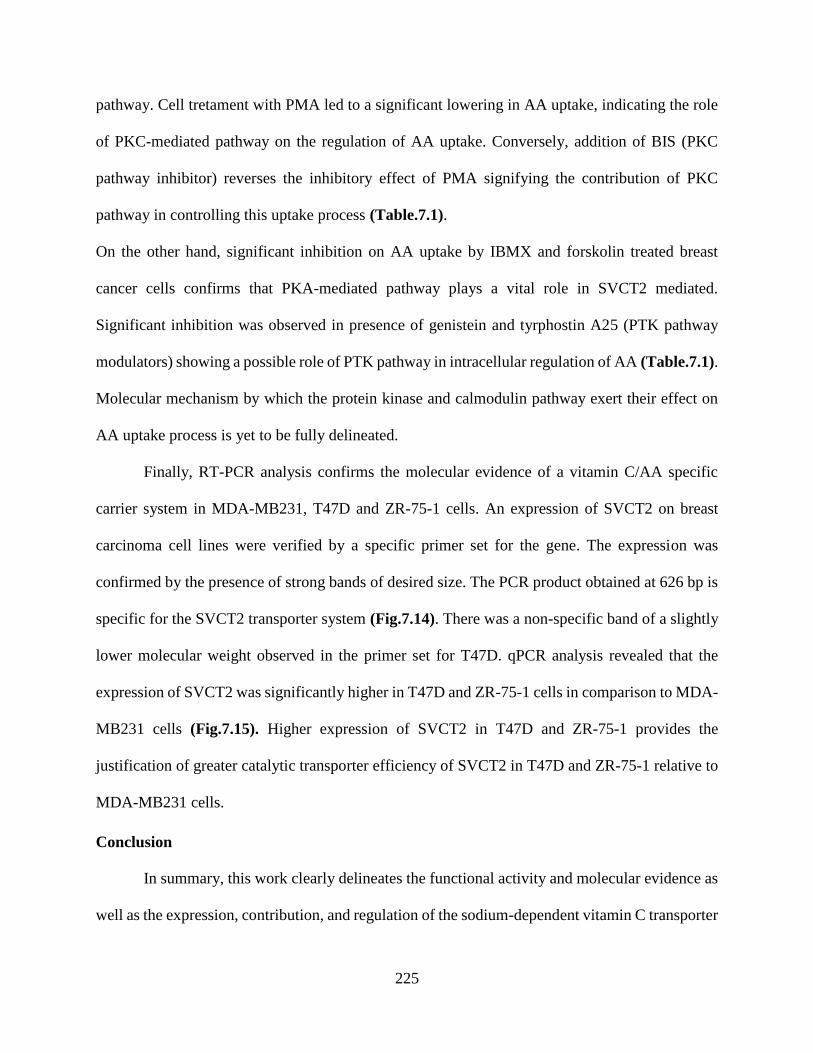
225
pathway. Cell tretament with PMA led to a significant lowering in AA uptake, indicating the role
of PKC-mediated pathway on the regulation of AA uptake. Conversely, addition of BIS (PKC
pathway inhibitor) reverses the inhibitory effect of PMA signifying the contribution of PKC
pathway in controlling this uptake process (Table.7.1).
On the other hand, significant inhibition on AA uptake by IBMX and forskolin treated breast
cancer cells confirms that PKA-mediated pathway plays a vital role in SVCT2 mediated.
Significant inhibition was observed in presence of genistein and tyrphostin A25 (PTK pathway
modulators) showing a possible role of PTK pathway in intracellular regulation of AA (Table.7.1).
Molecular mechanism by which the protein kinase and calmodulin pathway exert their effect on
AA uptake process is yet to be fully delineated.
Finally, RT-PCR analysis confirms the molecular evidence of a vitamin C/AA specific
carrier system in MDA-MB231, T47D and ZR-75-1 cells. An expression of SVCT2 on breast
carcinoma cell lines were verified by a specific primer set for the gene. The expression was
confirmed by the presence of strong bands of desired size. The PCR product obtained at 626 bp is
specific for the SVCT2 transporter system (Fig.7.14). There was a non-specific band of a slightly
lower molecular weight observed in the primer set for T47D. qPCR analysis revealed that the
expression of SVCT2 was significantly higher in T47D and ZR-75-1 cells in comparison to MDA-
MB231 cells (Fig.7.15). Higher expression of SVCT2 in T47D and ZR-75-1 provides the
justification of greater catalytic transporter efficiency of SVCT2 in T47D and ZR-75-1 relative to
MDA-MB231 cells.
Conclusion
In summary, this work clearly delineates the functional activity and molecular evidence as
well as the expression, contribution, and regulation of the sodium-dependent vitamin C transporter
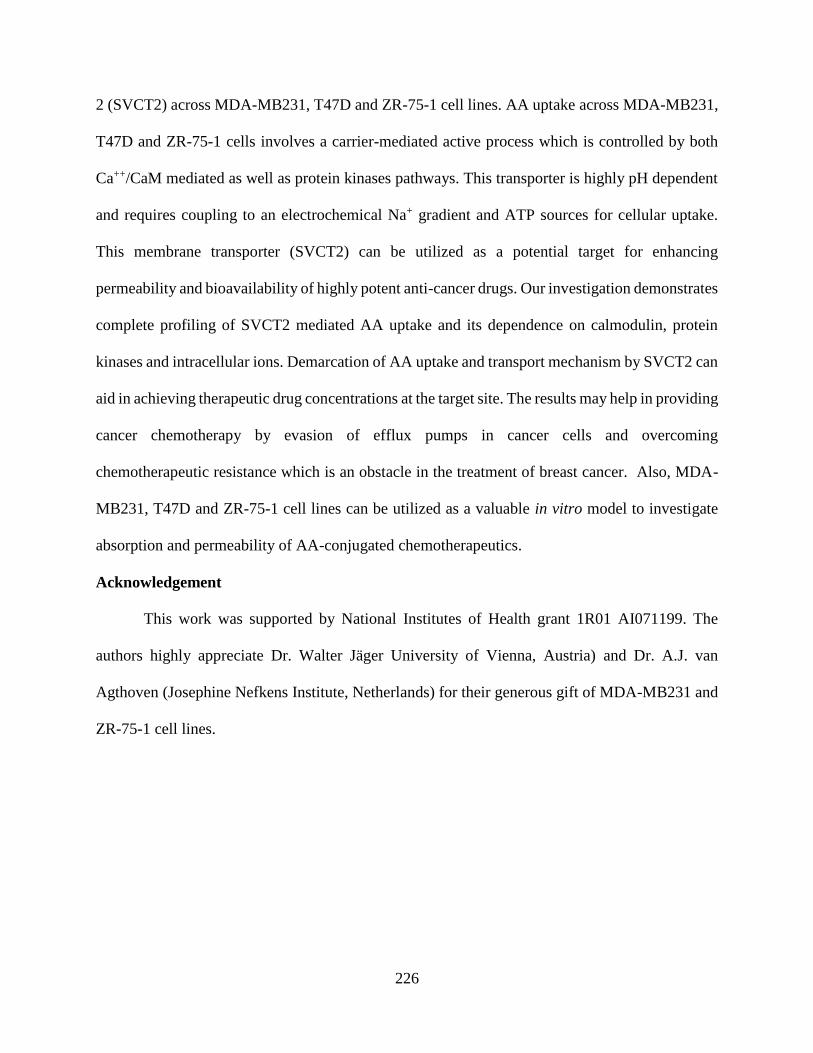
226
2 (SVCT2) across MDA-MB231, T47D and ZR-75-1 cell lines. AA uptake across MDA-MB231,
T47D and ZR-75-1 cells involves a carrier-mediated active process which is controlled by both
Ca++/CaM mediated as well as protein kinases pathways. This transporter is highly pH dependent
and requires coupling to an electrochemical Na+ gradient and ATP sources for cellular uptake.
This membrane transporter (SVCT2) can be utilized as a potential target for enhancing
permeability and bioavailability of highly potent anti-cancer drugs. Our investigation demonstrates
complete profiling of SVCT2 mediated AA uptake and its dependence on calmodulin, protein
kinases and intracellular ions. Demarcation of AA uptake and transport mechanism by SVCT2 can
aid in achieving therapeutic drug concentrations at the target site. The results may help in providing
cancer chemotherapy by evasion of efflux pumps in cancer cells and overcoming
chemotherapeutic resistance which is an obstacle in the treatment of breast cancer. Also, MDA-
MB231, T47D and ZR-75-1 cell lines can be utilized as a valuable in vitro model to investigate
absorption and permeability of AA-conjugated chemotherapeutics.
Acknowledgement
This work was supported by National Institutes of Health grant 1R01 AI071199. The
authors highly appreciate Dr. Walter Jäger University of Vienna, Austria) and Dr. A.J. van
Agthoven (Josephine Nefkens Institute, Netherlands) for their generous gift of MDA-MB231 and
ZR-75-1 cell lines.

227
CHAPTER 8
SUMMARY AND RECOMMENDATIONS
Summary
Currently, hepatic transport processes has been recognized as a vital factor in determining
drug disposition. Hence, evaluation of the hepatic transport and biliary excretion properties of
prospective drug candidates plays a major role in drug development process. This information
provides understanding of any altered hepatic disposition of therapeutic agents due to drug
interactions and diseased states. Translocation of drug molecules across the sinusoidal membrane
is mediated via basolateral transport system, whereas the biliary excretion of therapeutic agents
and metabolites is mediated via active canalicular transport. Basolateral transport proteins consist
of several membrane transporters including organic anion transporting polypeptides [OATPs
(SLCO family)], organic anion and cation transporters [OATs, OCTs (SLC22A family)], Na+-
taurocholate co-transporting polypeptide [NTCP (SLC10A1)] and multidrug resistance-associated
proteins [MRPs (ABCC family)]. P-glycoprotein (ABCB1), MRP2 (ABCC2), breast cancer
resistance protein [BCRP (ABCG2)] and the bile salt export pump [BSEP (ABCB11)] forms the
active canalicular transport system [1].
Metabolism of tyrosine kinase inhibitors (TKIs) is mainly mediated via hepatic route, but
the mechanism responsible for their hepatocellular accumulation is still unknown. This study was
designed to understand the contribution of organic anion transporting polypeptides (OATPs) in the
hepatic uptake of selected TKIs - pazopanib, canertinib, erlotinib, vandetanib and nilotinib
(Chapter 2). Michaelis-Menten (MM) kinetic parameters for TKIs were determined by
concentration dependent cellular accumulation of selected TKIs using Chinese Hamster Ovary
(CHO) cells - wild type as well as transfected with humanized OATP-1B1 and OATP-1B3

228
transporter proteins. The MM constant, Km values of OATP-1B1 for nilotinib and vandetanib are
10.14±1.91 and 2.72±0.25µM respectively and Vmax values of OATP-1B1 for nilotinib and
vandetanib were 6.95±0.47 and 75.95±1.99 nmoles/mg protein/min respectively. Likewise, Km
values of OATP-1B3 for canertinib, nilotinib and vandetanib were 12.18±3.32, 7.84±1.43 and
4.37±0.79µM respectively and Vmax values of OATP-1B3 for canertinib, nilotinib and vandetanib
were 15.34±1.59, 6.75±0.42 and 194.64±10.58 nmoles/mg protein/min respectively. Canertinib
did not exhibit any substrate specificity towards OATP-1B1. Also, erlotinib and pazopanib did not
exhibit any substrate specificity towards OATP-1B1 and -1B3. Since selected TKIs are the
substrates of OATP-1B1 and -1B3 expressed in hepatic tissue, these compounds can be regarded
as molecular targets for transporter mediated DDIs. Any alteration in the function of these hepatic
OATPs might account for the pharmacokinetic variability of TKIs.
The potential of tyrosine kinase inhibitors (TKIs) as interacting drugs through hepatic
uptake transporter inhibition has not been fully exploited in drug-drug interactions (DDIs). This
study was designed to estimate the half maximal inhibitory concentration (IC50) values of 5 small
molecule TKIs (pazopanib, nilotinib, vandetanib, canertinib and erlotinib) for organic anion
transporting polypeptides (OATPs): OATP-1B1 and -1B3 (Chapter 3). The half maximal
inhibitory concentration (IC50) values of TKIs and rifampicin (positive control) were determined
by concentration dependent inhibition of TKIs on cellular accumulation of probe radiolabelled
substrates [3H] ES and [3H] CCK-8. Chinese Hamster Ovary (CHO) cells transfected with
humanized OATP-1B1 and OATP-1B3 transporter proteins, respectively, were utilized to carry
out these studies. Pazopanib and nilotinib shows its inhibitory activity on OATP-1B1 transporter
protein. The IC50 values for rifampicin, pazopanib and nilotinib were 10.46±1.15, 3.89±1.21 and
2.78±1.13 µM respectively for OATP-1B1 transporter. Vandetanib, canertinib and erlotinib did
229
not exhibit any inhibitory potency towards OATP-1B1 transporter protein. Only vandetanib
showed tis inhibitory potential towards OATP-1B3 transporter proteins out of the 5 selected TKIs.
The IC50 values for rifampicin and vandetanib for OATP-1B3 transporter inhibition were
3.67±1.20 and 18.13±1.21 µM respectively. No significant inhibition in the presence of increasing
concentrations of pazopanib, nilotinib, canertinib and erlotinib were observed towards OATP-1B3
transporter. Since selected TKIs are the inhibitors of OATP-1B1 and -1B3 expressed in hepatic
tissue, these compounds can be regarded as molecular targets for transporter mediated DDIs. These
finding provide the basis of further pre-clinical and clinical studies investigating the transporter
based DDI potential of TKIs.
Expression of drug transporters across various tissues like brain, ocular, liver, kidney and
intestine has been reported before. These membrane transporters play an important role in drug
absorption, distribution, metabolism and excretion. Also, the functionality of these transporters
can be exploited and explored in terms of drug delivery in order to improve the absorption and
permeation of drug across membrane by targeting specific transporter proteins [577]. Corneal
epithelium and blood-retina barrier (i.e. retinal capillaries and retinal pigment epithelium (RPE))
acts as vital membranes governing the admittance of xenobiotics into the ocular tissues. Following
topical administration, corneal epithelium limits the absorption of drug from the lacrimal fluid into
the anterior chamber, while restriction of drug entry from systemic circulation to the posterior
segment is regulated via blood-retina barrier. Involvement of membrane transporters for
translocating drug across the membranes is quite limited relative to passive diffusion. However,
after revelation of functionality of these membrane transporters, it has been attributed that these
transporters play a vital role in modulating the pharmacokinetics of the therapeutic agent. Many
drugs are known substrates of the transporters, however, the understanding about studies involving
230
expression and functionality of these transporters in ocular tissues is limited. Hence, these
transporters have a vital role in regulating the ocular pharmacokinetics of a drug molecule [508].
The main aim of this study was to design novel pentablock (PB) (PLA–PCL–PEG–PCL–
PLA) polymer to prepare nanoparticles (NP) in order to achieve sustain delivery of pazopanib with
minimal burst effect for the treatment of ocular neovascularization. Another purpose was to
evaluate the effect of pazopanib loaded NP to bypass drug efflux (Chapter 5). PB copolymer was
successfully synthesized using ring opening polymerization reaction mechanism and characterized
using 1H NMR, GPC and XRD analysis. Synthesized PB copolymer was found to non-cytotoxic,
non-immunogenic and biocompatible with ocular cell lines. Also, several parameters such as
entrapment efficiency, drug loading, in vitro drug release profiling and effect of pazopanib NP in
evading efflux transporters were examined. PB copolymer-based NP exhibited continuous release
of pazopanib. It can be utilized to achieve continuous first order delivery of pazopanib upto 100
days from nanoparticles without any significant burst effect. Pazopanib loaded NP were successful
in evading drug efflux mediated via efflux transporters. This formulation can be employed to
circumvent ocular barriers without altering ocular protective mechanisms. Our results indicated
that PB copolymer based drug delivery systems can serve as a platform technology for the
development of sustained release therapy for the treatment of ocular neovascularization. This drug
delivery system can also be applicable for other ocular complications.
Ascorbic Acid (AA, Vitamin C) is an essential vitamin responsible for normal cellular
growth and physiological and metabolic functions. AA act as an anti-oxidant and absorbs the UV
radiation, thus protecting the cornea, retina and other intraocular tissues against radiation induced
damage. AA relieves the oxidative stress accompanying various eye infections. However, the
uptake mechanism of AA in human corneal and retinal cells along with its cellular translocation
231
and intracellular trafficking are poorly understood. The main goal of this study is to investigate the
existence of sodium dependent vitamin C transport system (SVCT2) and to define time dependent
uptake mechanism and intracellular regulation of AA in human corneal epithelial (HCEC) and
human retinal pigment epithelial (D407) cells (Chapter 6). Uptake of [14C] AA was observed to be
sodium, chloride, temperature, pH and energy dependent in both cell lines. [14C] AA uptake was
found to be saturable, with Km values of 46.14±6.03 and 47.26±3.24 μM and Vmax values of
17.34±0.58 and 31.86±0.56 pmol/min/mg protein, across HCEC and D407 cells, respectively. The
process is inhibited by structural analogs (L-AA and D-Iso AA) but not by structurally unrelated
substrates (glucose and PAHA). Ca++/calmodulin and protein kinase C (PKC) pathways play an
important role in modulating uptake of AA. A 626 bp band corresponding to a vitamin C
transporter (SVCT2) has been identified by RT-PCR analysis in both the cell lines. This study
reports the ascorbic acid uptake mechanism, kinetics, and regulation by sodium dependent vitamin
C transporter (SVCT2) in HCEC and D407 cells. Also, SVCT2 can be utilized for targeted delivery
in enhancing ocular permeation and bioavailability of highly potent ophthalmic drugs.
The main goal of this study is to investigate the existence of sodium dependent vitamin C
transport system (SVCT2) and to define uptake mechanism and intracellular regulation of ascorbic
acid (AA) in human breast cancer cells (MDA-MB231, T47D and ZR-75-1) (Chapter 7). Uptake
of [14C] AA was studied in MDA-MB231, T47D and ZR-75-1 cells. Functional aspects of [14C]
AA uptake were studied in the presence of different concentrations of unlabeled AA, pH,
temperature, metabolic inhibitors, substrates and structural analogs. Molecular identification of
SVCT2 was examined with reverse transcription–polymerase chain reaction (RT-PCR). Uptake of
[14C] AA was observed to be sodium, chloride, temperature, pH and energy dependent in all the
breast cancer cell lines. [14C] AA uptake was found to be saturable, with Km values of 53.85±6.24,
232
49.69±2.83 and 45.44±3.16 μM and Vmax values of 18.45±0.50, 32.50±0.43 and 33.25±0.53
pmol/min/mg protein, across MDA-MB231, T47D and ZR-75-1, respectively. The process is
inhibited by structural analogs (L-AA and D-Iso AA) but not by structurally unrelated substrates
(glucose and PAHA). Ca++/calmodulin and protein kinase pathways were found to play a crucial
role in modulating uptake of AA. A 626 bp band corresponding to a vitamin C transporter (SVCT2)
based on the primer design was observed by RT-PCR analysis in all the breast cancer cell lines.
This study reports AA uptake mechanism, kinetics, and regulation by sodium dependent vitamin
C transporter (SVCT2) in MDA-MB231, T47D and ZR-75-1 cells. Also, SVCT2 can be utilized
for designing targeted delivery to circumvent efflux and enhance permeation and bioavailability
of highly potent chemotherapeutic drugs.
Recommendations
The above studies aimed at understanding the disposition of tyrosine kinase inhibitors (TKIs) on
interaction with hepatic OATP-1B1 and -1B3. A few recommendations that can be made based on
the results obtained from the above studies are:
To study transcellular transport of TKIs across a double-transfected MDCKII cell
monolayer expressing both Human OATP and MRP2. This study can help in delineating
the role of hepatic uptake and efflux transporters in governing disposition of TKIs.
To study transcellular transport of TKIs across a double-transfected MDCKII cell
monolayer expressing both Human OATP and CYP3A4. This study can help in delineating
the role of hepatic uptake and metabolizing enzymes in governing disposition of TKIs.
These are proof of concept studies performed on in vitro transfected cell culture model.
Further in vivo studies on transgenic mouse model are required for better understanding of
233
the contribution of OATP-1B1 and/or -1B3 transporter proteins in the hepatic disposition
of TKIs and for predicting any adverse drug reactions associated with DDIs.
The other project was aimed at enhancing the bioavailability of therapeutic agents by evading drug
efflux by formulating into NPs. The influx transporters were also characterized across ocular and
breast cancer cells. These transporters can be utilized as a target for designing of better therapeutic
agents.
A novel approach of a NPs embedded in thermosensitive gel can be utilized to further
sustain the release of small and macromolecules and it will also imparts stability to the
drug molecule.
Since Pazopanib is a substrate for efflux transporter. Surface modified NPs can be utilized
for targeted drug delivery. Ascorbic acid surface modified PB NPs might be recognized by
vitamin C transporter (SVCT2) located on the apical site of the corneal and retinal pigment
epithelial cells. Hence via surface modification approach, uptake of NPs across target site
can be enhanced. Our composite formulation approach may serve as a platform technology
for the delivery of small and macro molecules in the treatment of ocular diseases.
Also, these surface modified PB NPs can be utilized to target breast cancer cells expressing
vitamin C transporter (SVCT2). Targeted delivery to SVCT2 will not only circumvent
efflux but also enhance permeation and bioavailability of highly potent chemotherapeutic
drugs.
Ascorbic acid prodrugs of pazopanib can be synthesized to circumvent efflux. These
ascorbic acid conjugated pazopanib may enhance permeability and bioavailability of
pazopanib across targeted tissue.
234
APPENDIX
235
236
237
238
239
240
241
LIST OF REFERENCES
1. Chandra P, Brouwer KL. The complexities of hepatic drug transport: current knowledge
and emerging concepts. Pharm Res. 2004;21719-35.
2. Hagenbuch B, Stieger B, Foguet M, Lubbert H, Meier PJ. Functional expression cloning
and characterization of the hepatocyte Na+/bile acid cotransport system. Proc Natl Acad Sci U S
A. 1991;8810629-33.
3. Meier PJ, Eckhardt U, Schroeder A, Hagenbuch B, Stieger B. Substrate specificity of
sinusoidal bile acid and organic anion uptake systems in rat and human liver. Hepatology.
1997;261667-77.
4. Kullak-Ublick GA, Ismair MG, Kubitz R, Schmitt M, Haussinger D, Stieger B, et al. Stable
expression and functional characterization of a Na+-taurocholate cotransporting green fluorescent
protein in human hepatoblastoma HepG2 cells. Cytotechnology. 2000;341-9.
5. Friesema EC, Docter R, Moerings EP, Stieger B, Hagenbuch B, Meier PJ, et al.
Identification of thyroid hormone transporters. Biochem Biophys Res Commun. 1999;254497-
501.
6. Li L, Lee TK, Meier PJ, Ballatori N. Identification of glutathione as a driving force and
leukotriene C4 as a substrate for oatp1, the hepatic sinusoidal organic solute transporter. J Biol
Chem. 1998;27316184-91.
7. Hagenbuch B, Gui C. Xenobiotic transporters of the human organic anion transporting
polypeptides (OATP) family. Xenobiotica. 2008;38778-801.
8. Konig J. Uptake transporters of the human OATP family: molecular characteristics,
substrates, their role in drug-drug interactions, and functional consequences of polymorphisms.
Handb Exp Pharmacol. 20111-28.
9. Kullak-Ublick GA, Ismair MG, Stieger B, Landmann L, Huber R, Pizzagalli F, et al.
Organic anion-transporting polypeptide B (OATP-B) and its functional comparison with three
other OATPs of human liver. Gastroenterology. 2001;120525-33.
10. Tamai I, Nezu J, Uchino H, Sai Y, Oku A, Shimane M, et al. Molecular identification and
characterization of novel members of the human organic anion transporter (OATP) family.
Biochem Biophys Res Commun. 2000;273251-60.
11. Kullak-Ublick GA, Hagenbuch B, Stieger B, Wolkoff AW, Meier PJ. Functional
characterization of the basolateral rat liver organic anion transporting polypeptide. Hepatology.
1994;20411-6.
12. Cattori V, van Montfoort JE, Stieger B, Landmann L, Meijer DK, Winterhalter KH, et al.
Localization of organic anion transporting polypeptide 4 (Oatp4) in rat liver and comparison of its
substrate specificity with Oatp1, Oatp2 and Oatp3. Pflugers Arch. 2001;443188-95.
13. Fujiwara K, Adachi H, Nishio T, Unno M, Tokui T, Okabe M, et al. Identification of
thyroid hormone transporters in humans: different molecules are involved in a tissue-specific
manner. Endocrinology. 2001;1422005-12.
14. Tirona RG, Kim RB. Pharmacogenomics of organic anion-transporting polypeptides
(OATP). Adv Drug Deliv Rev. 2002;541343-52.
15. Sekine T, Cha SH, Tsuda M, Apiwattanakul N, Nakajima N, Kanai Y, et al. Identification
of multispecific organic anion transporter 2 expressed predominantly in the liver. FEBS Lett.
1998;429179-82.
242
16. Kusuhara H, Sekine T, Utsunomiya-Tate N, Tsuda M, Kojima R, Cha SH, et al. Molecular
cloning and characterization of a new multispecific organic anion transporter from rat brain. J Biol
Chem. 1999;27413675-80.
17. Kullak-Ublick GA, Beuers U, Paumgartner G. Hepatobiliary transport. J Hepatol.
2000;323-18.
18. Sun W, Wu RR, van Poelje PD, Erion MD. Isolation of a family of organic anion
transporters from human liver and kidney. Biochem Biophys Res Commun. 2001;283417-22.
19. Enomoto A, Takeda M, Shimoda M, Narikawa S, Kobayashi Y, Kobayashi Y, et al.
Interaction of human organic anion transporters 2 and 4 with organic anion transport inhibitors. J
Pharmacol Exp Ther. 2002;301797-802.
20. Kimura H, Takeda M, Narikawa S, Enomoto A, Ichida K, Endou H. Human organic anion
transporters and human organic cation transporters mediate renal transport of prostaglandins. J
Pharmacol Exp Ther. 2002;301293-8.
21. Babu E, Takeda M, Narikawa S, Kobayashi Y, Yamamoto T, Cha SH, et al. Human organic
anion transporters mediate the transport of tetracycline. Jpn J Pharmacol. 2002;8869-76.
22. Khamdang S, Takeda M, Noshiro R, Narikawa S, Enomoto A, Anzai N, et al. Interactions
of human organic anion transporters and human organic cation transporters with nonsteroidal anti-
inflammatory drugs. J Pharmacol Exp Ther. 2002;303534-9.
23. Takeda M, Khamdang S, Narikawa S, Kimura H, Kobayashi Y, Yamamoto T, et al. Human
organic anion transporters and human organic cation transporters mediate renal antiviral transport.
J Pharmacol Exp Ther. 2002;300918-24.
24. Takeda M, Khamdang S, Narikawa S, Kimura H, Hosoyamada M, Cha SH, et al.
Characterization of methotrexate transport and its drug interactions with human organic anion
transporters. J Pharmacol Exp Ther. 2002;302666-71.
25. Babu E, Takeda M, Narikawa S, Kobayashi Y, Enomoto A, Tojo A, et al. Role of human
organic anion transporter 4 in the transport of ochratoxin A. Biochim Biophys Acta. 2002;159064-
75.
26. Grundemann D, Gorboulev V, Gambaryan S, Veyhl M, Koepsell H. Drug excretion
mediated by a new prototype of polyspecific transporter. Nature. 1994;372549-52.
27. Zhang L, Dresser MJ, Gray AT, Yost SC, Terashita S, Giacomini KM. Cloning and
functional expression of a human liver organic cation transporter. Mol Pharmacol. 1997;51913-
21.
28. Meyer-Wentrup F, Karbach U, Gorboulev V, Arndt P, Koepsell H. Membrane localization
of the electrogenic cation transporter rOCT1 in rat liver. Biochem Biophys Res Commun.
1998;248673-8.
29. Hayer-Zillgen M, Bruss M, Bonisch H. Expression and pharmacological profile of the
human organic cation transporters hOCT1, hOCT2 and hOCT3. Br J Pharmacol. 2002;136829-36.
30. Tamai I, Yabuuchi H, Nezu J, Sai Y, Oku A, Shimane M, et al. Cloning and
characterization of a novel human pH-dependent organic cation transporter, OCTN1. FEBS Lett.
1997;419107-11.
31. Wu X, Prasad PD, Leibach FH, Ganapathy V. cDNA sequence, transport function, and
genomic organization of human OCTN2, a new member of the organic cation transporter family.
Biochem Biophys Res Commun. 1998;246589-95.
32. Borst P, Evers R, Kool M, Wijnholds J. The multidrug resistance protein family. Biochim
Biophys Acta. 1999;1461347-57.

243
33. Roelofsen H, Muller M, Jansen PL. Regulation of organic anion transport in the liver. Yale
J Biol Med. 1997;70435-45.
34. Flens MJ, Zaman GJ, van der Valk P, Izquierdo MA, Schroeijers AB, Scheffer GL, et al.
Tissue distribution of the multidrug resistance protein. Am J Pathol. 1996;1481237-47.
35. Loe DW, Deeley RG, Cole SP. Characterization of vincristine transport by the M(r)
190,000 multidrug resistance protein (MRP): evidence for cotransport with reduced glutathione.
Cancer Res. 1998;585130-6.
36. Hirohashi T, Suzuki H, Sugiyama Y. Characterization of the transport properties of cloned
rat multidrug resistance-associated protein 3 (MRP3). J Biol Chem. 1999;27415181-5.
37. Hirohashi T, Suzuki H, Takikawa H, Sugiyama Y. ATP-dependent transport of bile salts
by rat multidrug resistance-associated protein 3 (Mrp3). J Biol Chem. 2000;2752905-10.
38. Xiong H, Turner KC, Ward ES, Jansen PL, Brouwer KL. Altered hepatobiliary disposition
of acetaminophen glucuronide in isolated perfused livers from multidrug resistance-associated
protein 2-deficient TR(-) rats. J Pharmacol Exp Ther. 2000;295512-8.
39. Ogawa K, Suzuki H, Hirohashi T, Ishikawa T, Meier PJ, Hirose K, et al. Characterization
of inducible nature of MRP3 in rat liver. Am J Physiol Gastrointest Liver Physiol. 2000;278G438-
46.
40. Konig J, Rost D, Cui Y, Keppler D. Characterization of the human multidrug resistance
protein isoform MRP3 localized to the basolateral hepatocyte membrane. Hepatology.
1999;291156-63.
41. Reid G, Wielinga P, Zelcer N, De Haas M, Van Deemter L, Wijnholds J, et al.
Characterization of the transport of nucleoside analog drugs by the human multidrug resistance
proteins MRP4 and MRP5. Mol Pharmacol. 2003;631094-103.
42. Chen ZS, Lee K, Kruh GD. Transport of cyclic nucleotides and estradiol 17-beta-D-
glucuronide by multidrug resistance protein 4. Resistance to 6-mercaptopurine and 6-thioguanine.
J Biol Chem. 2001;27633747-54.
43. Jedlitschky G, Burchell B, Keppler D. The multidrug resistance protein 5 functions as an
ATP-dependent export pump for cyclic nucleotides. J Biol Chem. 2000;27530069-74.
44. Chen ZS, Lee K, Walther S, Raftogianis RB, Kuwano M, Zeng H, et al. Analysis of
methotrexate and folate transport by multidrug resistance protein 4 (ABCC4): MRP4 is a
component of the methotrexate efflux system. Cancer Res. 2002;623144-50.
45. Schuetz JD, Connelly MC, Sun D, Paibir SG, Flynn PM, Srinivas RV, et al. MRP4: A
previously unidentified factor in resistance to nucleoside-based antiviral drugs. Nat Med.
1999;51048-51.
46. Zelcer N, Reid G, Wielinga P, Kuil A, van der Heijden I, Schuetz JD, et al. Steroid and
bile acid conjugates are substrates of human multidrug-resistance protein (MRP) 4 (ATP-binding
cassette C4). Biochem J. 2003;371361-7.
47. Schuetz EG, Strom S, Yasuda K, Lecureur V, Assem M, Brimer C, et al. Disrupted bile
acid homeostasis reveals an unexpected interaction among nuclear hormone receptors,
transporters, and cytochrome P450. J Biol Chem. 2001;27639411-8.
48. Madon J, Hagenbuch B, Landmann L, Meier PJ, Stieger B. Transport function and
hepatocellular localization of mrp6 in rat liver. Mol Pharmacol. 2000;57634-41.
49. Kool M, van der Linden M, de Haas M, Baas F, Borst P. Expression of human MRP6, a
homologue of the multidrug resistance protein gene MRP1, in tissues and cancer cells. Cancer Res.
1999;59175-82.
244
50. Hopper E, Belinsky MG, Zeng H, Tosolini A, Testa JR, Kruh GD. Analysis of the structure
and expression pattern of MRP7 (ABCC10), a new member of the MRP subfamily. Cancer Lett.
2001;162181-91.
51. Chen ZS, Hopper-Borge E, Belinsky MG, Shchaveleva I, Kotova E, Kruh GD.
Characterization of the transport properties of human multidrug resistance protein 7 (MRP7,
ABCC10). Mol Pharmacol. 2003;63351-8.
52. Bera TK, Lee S, Salvatore G, Lee B, Pastan I. MRP8, a new member of ABC transporter
superfamily, identified by EST database mining and gene prediction program, is highly expressed
in breast cancer. Mol Med. 2001;7509-16.
53. Guo Y, Kotova E, Chen ZS, Lee K, Hopper-Borge E, Belinsky MG, et al. MRP8, ATP-
binding cassette C11 (ABCC11), is a cyclic nucleotide efflux pump and a resistance factor for
fluoropyrimidines 2',3'-dideoxycytidine and 9'-(2'-phosphonylmethoxyethyl)adenine. J Biol
Chem. 2003;27829509-14.
54. Hyde SC, Emsley P, Hartshorn MJ, Mimmack MM, Gileadi U, Pearce SR, et al. Structural
model of ATP-binding proteins associated with cystic fibrosis, multidrug resistance and bacterial
transport. Nature. 1990;346362-5.
55. Gerloff T, Stieger B, Hagenbuch B, Madon J, Landmann L, Roth J, et al. The sister of P-
glycoprotein represents the canalicular bile salt export pump of mammalian liver. J Biol Chem.
1998;27310046-50.
56. Strautnieks SS, Bull LN, Knisely AS, Kocoshis SA, Dahl N, Arnell H, et al. A gene
encoding a liver-specific ABC transporter is mutated in progressive familial intrahepatic
cholestasis. Nat Genet. 1998;20233-8.
57. Jansen PL, Strautnieks SS, Jacquemin E, Hadchouel M, Sokal EM, Hooiveld GJ, et al.
Hepatocanalicular bile salt export pump deficiency in patients with progressive familial
intrahepatic cholestasis. Gastroenterology. 1999;1171370-9.
58. Konig J, Nies AT, Cui Y, Leier I, Keppler D. Conjugate export pumps of the multidrug
resistance protein (MRP) family: localization, substrate specificity, and MRP2-mediated drug
resistance. Biochim Biophys Acta. 1999;1461377-94.
59. Jansen PL, Groothuis GM, Peters WH, Meijer DF. Selective hepatobiliary transport defect
for organic anions and neutral steroids in mutant rats with hereditary-conjugated
hyperbilirubinemia. Hepatology. 1987;771-6.
60. Paulusma CC, Bosma PJ, Zaman GJ, Bakker CT, Otter M, Scheffer GL, et al. Congenital
jaundice in rats with a mutation in a multidrug resistance-associated protein gene. Science.
1996;2711126-8.
61. Ito K, Suzuki H, Hirohashi T, Kume K, Shimizu T, Sugiyama Y. Molecular cloning of
canalicular multispecific organic anion transporter defective in EHBR. Am J Physiol.
1997;272G16-22.
62. Hirohashi T, Suzuki H, Ito K, Ogawa K, Kume K, Shimizu T, et al. Hepatic expression of
multidrug resistance-associated protein-like proteins maintained in eisai hyperbilirubinemic rats.
Mol Pharmacol. 1998;531068-75.
63. Pastan I, Gottesman M. Multiple-drug resistance in human cancer. N Engl J Med.
1987;3161388-93.
64. Oude Elferink RP, Meijer DK, Kuipers F, Jansen PL, Groen AK, Groothuis GM.
Hepatobiliary secretion of organic compounds; molecular mechanisms of membrane transport.
Biochim Biophys Acta. 1995;1241215-68.
245
65. Schmid D, Ecker G, Kopp S, Hitzler M, Chiba P. Structure-activity relationship studies of
propafenone analogs based on P-glycoprotein ATPase activity measurements. Biochem
Pharmacol. 1999;581447-56.
66. Smit JW, Schinkel AH, Muller M, Weert B, Meijer DK. Contribution of the murine mdr1a
P-glycoprotein to hepatobiliary and intestinal elimination of cationic drugs as measured in mice
with an mdr1a gene disruption. Hepatology. 1998;271056-63.
67. Smit JW, Weert B, Schinkel AH, Meijer DK. Heterologous expression of various P-
glycoproteins in polarized epithelial cells induces directional transport of small (type 1) and bulky
(type 2) cationic drugs. J Pharmacol Exp Ther. 1998;286321-7.
68. Matheny CJ, Lamb MW, Brouwer KR, Pollack GM. Pharmacokinetic and
pharmacodynamic implications of P-glycoprotein modulation. Pharmacotherapy. 2001;21778-96.
69. Ekins S, Kim RB, Leake BF, Dantzig AH, Schuetz EG, Lan LB, et al. Application of three-
dimensional quantitative structure-activity relationships of P-glycoprotein inhibitors and
substrates. Mol Pharmacol. 2002;61974-81.
70. Ekins S, Kim RB, Leake BF, Dantzig AH, Schuetz EG, Lan LB, et al. Three-dimensional
quantitative structure-activity relationships of inhibitors of P-glycoprotein. Mol Pharmacol.
2002;61964-73.
71. Stouch TR, Gudmundsson O. Progress in understanding the structure-activity relationships
of P-glycoprotein. Adv Drug Deliv Rev. 2002;54315-28.
72. Lee YM, Song IS, Kim SG, Lee MG, Chung SJ, Shim CK. The suppressed expression and
functional activity of hepatic P-glycoprotein in rats with protein-calorie malnutrition. J Pharm Sci.
2003;921323-30.
73. Patel VA, Dunn MJ, Sorokin A. Regulation of MDR-1 (P-glycoprotein) by
cyclooxygenase-2. J Biol Chem. 2002;27738915-20.
74. Sukhai M, Piquette-Miller M. Regulation of the multidrug resistance genes by stress
signals. J Pharm Pharm Sci. 2000;3268-80.
75. McRae MP, Brouwer KL, Kashuba AD. Cytokine regulation of P-glycoprotein. Drug
Metab Rev. 2003;3519-33.
76. Smith AJ, van Helvoort A, van Meer G, Szabo K, Welker E, Szakacs G, et al. MDR3 P-
glycoprotein, a phosphatidylcholine translocase, transports several cytotoxic drugs and directly
interacts with drugs as judged by interference with nucleotide trapping. J Biol Chem.
2000;27523530-9.
77. Doyle LA, Yang W, Abruzzo LV, Krogmann T, Gao Y, Rishi AK, et al. A multidrug
resistance transporter from human MCF-7 breast cancer cells. Proc Natl Acad Sci U S A.
1998;9515665-70.
78. Suzuki M, Suzuki H, Sugimoto Y, Sugiyama Y. ABCG2 transports sulfated conjugates of
steroids and xenobiotics. J Biol Chem. 2003;27822644-9.
79. Maliepaard M, Scheffer GL, Faneyte IF, van Gastelen MA, Pijnenborg AC, Schinkel AH,
et al. Subcellular localization and distribution of the breast cancer resistance protein transporter in
normal human tissues. Cancer Res. 2001;613458-64.
80. Houssin D, Capron M, Celier C, Cresteil T, Demaugre F, Beaune P. Evaluation of isolated
human hepatocytes. Life Sci. 1983;331805-9.
81. Tee LB, Seddon T, Boobis AR, Davies DS. Drug metabolising activity of freshly isolated
human hepatocytes. Br J Clin Pharmacol. 1985;19279-94.
82. Groothuis GM, Hulstaert CE, Kalicharan D, Hardonk MJ. Plasma membrane specialization
and intracellular polarity of freshly isolated rat hepatocytes. Eur J Cell Biol. 1981;2643-51.

246
83. Ihrke G, Neufeld EB, Meads T, Shanks MR, Cassio D, Laurent M, et al. WIF-B cells: an
in vitro model for studies of hepatocyte polarity. J Cell Biol. 1993;1231761-75.
84. Sai Y, Nies AT, Arias IM. Bile acid secretion and direct targeting of mdr1-green
fluorescent protein from Golgi to the canalicular membrane in polarized WIF-B cells. J Cell Sci.
1999;112 ( Pt 24)4535-45.
85. Zegers MM, Hoekstra D. Mechanisms and functional features of polarized membrane
traffic in epithelial and hepatic cells. Biochem J. 1998;336 ( Pt 2)257-69.
86. Dranoff JA, McClure M, Burgstahler AD, Denson LA, Crawford AR, Crawford JM, et al.
Short-term regulation of bile acid uptake by microfilament-dependent translocation of rat ntcp to
the plasma membrane. Hepatology. 1999;30223-9.
87. Liu X, LeCluyse EL, Brouwer KR, Lightfoot RM, Lee JI, Brouwer KL. Use of Ca2+
modulation to evaluate biliary excretion in sandwich-cultured rat hepatocytes. J Pharmacol Exp
Ther. 1999;2891592-9.
88. Liu X, Chism JP, LeCluyse EL, Brouwer KR, Brouwer KL. Correlation of biliary excretion
in sandwich-cultured rat hepatocytes and in vivo in rats. Drug Metab Dispos. 1999;27637-44.
89. Liu X, LeCluyse EL, Brouwer KR, Gan LS, Lemasters JJ, Stieger B, et al. Biliary excretion
in primary rat hepatocytes cultured in a collagen-sandwich configuration. Am J Physiol.
1999;277G12-21.
90. Smith NF, Figg WD, Sparreboom A. Role of the liver-specific transporters OATP1B1 and
OATP1B3 in governing drug elimination. Expert Opin Drug Metab Toxicol. 2005;1429-45.
91. Tamai I, Nakanishi T. OATP transporter-mediated drug absorption and interaction. Curr
Opin Pharmacol. 2013;13859-63.
92. Muller M. Transcriptional control of hepatocanalicular transporter gene expression. Semin
Liver Dis. 2000;20323-37.
93. Denson LA, Sturm E, Echevarria W, Zimmerman TL, Makishima M, Mangelsdorf DJ, et
al. The orphan nuclear receptor, shp, mediates bile acid-induced inhibition of the rat bile acid
transporter, ntcp. Gastroenterology. 2001;121140-7.
94. Denson LA, Auld KL, Schiek DS, McClure MH, Mangelsdorf DJ, Karpen SJ. Interleukin-
1beta suppresses retinoid transactivation of two hepatic transporter genes involved in bile
formation. J Biol Chem. 2000;2758835-43.
95. Jung D, Podvinec M, Meyer UA, Mangelsdorf DJ, Fried M, Meier PJ, et al. Human organic
anion transporting polypeptide 8 promoter is transactivated by the farnesoid X receptor/bile acid
receptor. Gastroenterology. 2002;1221954-66.
96. Staudinger JL, Madan A, Carol KM, Parkinson A. Regulation of drug transporter gene
expression by nuclear receptors. Drug Metab Dispos. 2003;31523-7.
97. Xiong H, Yoshinari K, Brouwer KL, Negishi M. Role of constitutive androstane receptor
in the in vivo induction of Mrp3 and CYP2B1/2 by phenobarbital. Drug Metab Dispos.
2002;30918-23.
98. Ananthanarayanan M, Balasubramanian N, Makishima M, Mangelsdorf DJ, Suchy FJ.
Human bile salt export pump promoter is transactivated by the farnesoid X receptor/bile acid
receptor. J Biol Chem. 2001;27628857-65.
99. Kauffmann HM, Pfannschmidt S, Zoller H, Benz A, Vorderstemann B, Webster JI, et al.
Influence of redox-active compounds and PXR-activators on human MRP1 and MRP2 gene
expression. Toxicology. 2002;171137-46.
100. Kast HR, Goodwin B, Tarr PT, Jones SA, Anisfeld AM, Stoltz CM, et al. Regulation of
multidrug resistance-associated protein 2 (ABCC2) by the nuclear receptors pregnane X receptor,

247
farnesoid X-activated receptor, and constitutive androstane receptor. J Biol Chem. 2002;2772908-
15.
101. Kliewer SA, Moore JT, Wade L, Staudinger JL, Watson MA, Jones SA, et al. An orphan
nuclear receptor activated by pregnanes defines a novel steroid signaling pathway. Cell.
1998;9273-82.
102. Geick A, Eichelbaum M, Burk O. Nuclear receptor response elements mediate induction
of intestinal MDR1 by rifampin. J Biol Chem. 2001;27614581-7.
103. Synold TW, Dussault I, Forman BM. The orphan nuclear receptor SXR coordinately
regulates drug metabolism and efflux. Nat Med. 2001;7584-90.
104. Kok T, Bloks VW, Wolters H, Havinga R, Jansen PL, Staels B, et al. Peroxisome
proliferator-activated receptor alpha (PPARalpha)-mediated regulation of multidrug resistance 2
(Mdr2) expression and function in mice. Biochem J. 2003;369539-47.
105. Boyer JL, Soroka CJ. Vesicle targeting to the apical domain regulates bile excretory
function in isolated rat hepatocyte couplets. Gastroenterology. 1995;1091600-11.
106. Mukhopadhayay S, Ananthanarayanan M, Stieger B, Meier PJ, Suchy FJ, Anwer MS.
cAMP increases liver Na+-taurocholate cotransport by translocating transporter to plasma
membranes. Am J Physiol. 1997;273G842-8.
107. Kipp H, Arias IM. Intracellular trafficking and regulation of canalicular ATP-binding
cassette transporters. Semin Liver Dis. 2000;20339-51.
108. Durand-Schneider AM, Bouanga JC, Feldmann G, Maurice M. Microtubule disruption
interferes with the structural and functional integrity of the apical pole in primary cultures of rat
hepatocytes. Eur J Cell Biol. 1991;56260-8.
109. Oude Elferink RP, Bakker CT, Roelofsen H, Middelkoop E, Ottenhoff R, Heijn M, et al.
Accumulation of organic anion in intracellular vesicles of cultured rat hepatocytes is mediated by
the canalicular multispecific organic anion transporter. Hepatology. 1993;17434-44.
110. Roelofsen H, Soroka CJ, Keppler D, Boyer JL. Cyclic AMP stimulates sorting of the
canalicular organic anion transporter (Mrp2/cMoat) to the apical domain in hepatocyte couplets. J
Cell Sci. 1998;111 ( Pt 8)1137-45.
111. Kubitz R, D'Urso D, Keppler D, Haussinger D. Osmodependent dynamic localization of
the multidrug resistance protein 2 in the rat hepatocyte canalicular membrane. Gastroenterology.
1997;1131438-42.
112. Gatmaitan ZC, Nies AT, Arias IM. Regulation and translocation of ATP-dependent apical
membrane proteins in rat liver. Am J Physiol. 1997;272G1041-9.
113. Glavy JS, Wu SM, Wang PJ, Orr GA, Wolkoff AW. Down-regulation by extracellular ATP
of rat hepatocyte organic anion transport is mediated by serine phosphorylation of oatp1. J Biol
Chem. 2000;2751479-84.
114. Shitara Y, Itoh T, Sato H, Li AP, Sugiyama Y. Inhibition of transporter-mediated hepatic
uptake as a mechanism for drug-drug interaction between cerivastatin and cyclosporin A. J
Pharmacol Exp Ther. 2003;304610-6.
115. Muck W, Mai I, Fritsche L, Ochmann K, Rohde G, Unger S, et al. Increase in cerivastatin
systemic exposure after single and multiple dosing in cyclosporine-treated kidney transplant
recipients. Clin Pharmacol Ther. 1999;65251-61.
116. Angelin B, Arvidsson A, Dahlqvist R, Hedman A, Schenck-Gustafsson K. Quinidine
reduces biliary clearance of digoxin in man. Eur J Clin Invest. 1987;17262-5.
117. Horio M, Gottesman MM, Pastan I. ATP-dependent transport of vinblastine in vesicles
from human multidrug-resistant cells. Proc Natl Acad Sci U S A. 1988;853580-4.

248
118. Booth CL, Brouwer KR, Brouwer KL. Effect of multidrug resistance modulators on the
hepatobiliary disposition of doxorubicin in the isolated perfused rat liver. Cancer Res.
1998;583641-8.
119. van Asperen J, van Tellingen O, Beijnen JH. The role of mdr1a P-glycoprotein in the biliary
and intestinal secretion of doxorubicin and vinblastine in mice. Drug Metab Dispos. 2000;28264-
7.
120. Riley J, Styles J, Verschoyle RD, Stanley LA, White IN, Gant TW. Association of
tamoxifen biliary excretion rate with prior tamoxifen exposure and increased mdr1b expression.
Biochem Pharmacol. 2000;60233-9.
121. Fattinger K, Funk C, Pantze M, Weber C, Reichen J, Stieger B, et al. The endothelin
antagonist bosentan inhibits the canalicular bile salt export pump: a potential mechanism for
hepatic adverse reactions. Clin Pharmacol Ther. 2001;69223-31.
122. Giacomini KM, Huang SM, Tweedie DJ, Benet LZ, Brouwer KL, Chu X, et al. Membrane
transporters in drug development. Nat Rev Drug Discov. 2010;9215-36.
123. Wacher VJ, Wu CY, Benet LZ. Overlapping substrate specificities and tissue distribution
of cytochrome P450 3A and P-glycoprotein: implications for drug delivery and activity in cancer
chemotherapy. Mol Carcinog. 1995;13129-34.
124. Huang L, Wring SA, Woolley JL, Brouwer KR, Serabjit-Singh C, Polli JW. Induction of
P-glycoprotein and cytochrome P450 3A by HIV protease inhibitors. Drug Metab Dispos.
2001;29754-60.
125. Schuetz EG, Beck WT, Schuetz JD. Modulators and substrates of P-glycoprotein and
cytochrome P4503A coordinately up-regulate these proteins in human colon carcinoma cells. Mol
Pharmacol. 1996;49311-8.
126. Schuetz EG, Schinkel AH, Relling MV, Schuetz JD. P-glycoprotein: a major determinant
of rifampicin-inducible expression of cytochrome P4503A in mice and humans. Proc Natl Acad
Sci U S A. 1996;934001-5.
127. Salphati L, Benet LZ. Modulation of P-glycoprotein expression by cytochrome P450 3A
inducers in male and female rat livers. Biochem Pharmacol. 1998;55387-95.
128. Yasuda K, Lan LB, Sanglard D, Furuya K, Schuetz JD, Schuetz EG. Interaction of
cytochrome P450 3A inhibitors with P-glycoprotein. J Pharmacol Exp Ther. 2002;303323-32.
129. Wu CY, Benet LZ. Disposition of tacrolimus in isolated perfused rat liver: influence of
troleandomycin, cyclosporine, and gg918. Drug Metab Dispos. 2003;311292-5.
130. Schuetz EG, Umbenhauer DR, Yasuda K, Brimer C, Nguyen L, Relling MV, et al. Altered
expression of hepatic cytochromes P-450 in mice deficient in one or more mdr1 genes. Mol
Pharmacol. 2000;57188-97.
131. Lan LB, Dalton JT, Schuetz EG. Mdr1 limits CYP3A metabolism in vivo. Mol Pharmacol.
2000;58863-9.
132. Iida A, Saito S, Sekine A, Mishima C, Kondo K, Kitamura Y, et al. Catalog of 258 single-
nucleotide polymorphisms (SNPs) in genes encoding three organic anion transporters, three
organic anion-transporting polypeptides, and three NADH:ubiquinone oxidoreductase
flavoproteins. J Hum Genet. 2001;46668-83.
133. Nozawa T, Nakajima M, Tamai I, Noda K, Nezu J, Sai Y, et al. Genetic polymorphisms of
human organic anion transporters OATP-C (SLC21A6) and OATP-B (SLC21A9): allele
frequencies in the Japanese population and functional analysis. J Pharmacol Exp Ther.
2002;302804-13.
249
134. Michalski C, Cui Y, Nies AT, Nuessler AK, Neuhaus P, Zanger UM, et al. A naturally
occurring mutation in the SLC21A6 gene causing impaired membrane localization of the
hepatocyte uptake transporter. J Biol Chem. 2002;27743058-63.
135. Tirona RG, Leake BF, Merino G, Kim RB. Polymorphisms in OATP-C: identification of
multiple allelic variants associated with altered transport activity among European- and African-
Americans. J Biol Chem. 2001;27635669-75.
136. Nishizato Y, Ieiri I, Suzuki H, Kimura M, Kawabata K, Hirota T, et al. Polymorphisms of
OATP-C (SLC21A6) and OAT3 (SLC22A8) genes: consequences for pravastatin
pharmacokinetics. Clin Pharmacol Ther. 2003;73554-65.
137. Conrad S, Kauffmann HM, Ito K, Leslie EM, Deeley RG, Schrenk D, et al. A naturally
occurring mutation in MRP1 results in a selective decrease in organic anion transport and in
increased doxorubicin resistance. Pharmacogenetics. 2002;12321-30.
138. Ito S, Ieiri I, Tanabe M, Suzuki A, Higuchi S, Otsubo K. Polymorphism of the ABC
transporter genes, MDR1, MRP1 and MRP2/cMOAT, in healthy Japanese subjects.
Pharmacogenetics. 2001;11175-84.
139. Germain DP, Remones V, Perdu J, Jeunemaitre X. Identification of two polymorphisms
(c189G>C; c190T>C) in exon 2 of the human MRP6 gene (ABCC6) by screening of
Pseudoxanthoma elasticum patients: possible sequence correction? Hum Mutat. 2000;16449.
140. Dubin IN, Johnson FB. Chronic idiopathic jaundice with unidentified pigment in liver
cells; a new clinicopathologic entity with a report of 12 cases. Medicine (Baltimore). 1954;33155-
97.
141. Kartenbeck J, Leuschner U, Mayer R, Keppler D. Absence of the canalicular isoform of
the MRP gene-encoded conjugate export pump from the hepatocytes in Dubin-Johnson syndrome.
Hepatology. 1996;231061-6.
142. Keitel V, Kartenbeck J, Nies AT, Spring H, Brom M, Keppler D. Impaired protein
maturation of the conjugate export pump multidrug resistance protein 2 as a consequence of a
deletion mutation in Dubin-Johnson syndrome. Hepatology. 2000;321317-28.
143. Hashimoto K, Uchiumi T, Konno T, Ebihara T, Nakamura T, Wada M, et al. Trafficking
and functional defects by mutations of the ATP-binding domains in MRP2 in patients with Dubin-
Johnson syndrome. Hepatology. 2002;361236-45.
144. Shimizu M, Fuse K, Okudaira K, Nishigaki R, Maeda K, Kusuhara H, et al. Contribution
of OATP (organic anion-transporting polypeptide) family transporters to the hepatic uptake of
fexofenadine in humans. Drug Metab Dispos. 2005;331477-81.
145. Hagenbuch B, Meier PJ. Organic anion transporting polypeptides of the OATP/ SLC21
family: phylogenetic classification as OATP/ SLCO superfamily, new nomenclature and
molecular/functional properties. Pflugers Arch. 2004;447653-65.
146. Barton HA, Lai Y, Goosen TC, Jones HM, El-Kattan AF, Gosset JR, et al. Model-based
approaches to predict drug-drug interactions associated with hepatic uptake transporters:
preclinical, clinical and beyond. Expert Opin Drug Metab Toxicol. 2013;9459-72.
147. Shitara Y, Maeda K, Ikejiri K, Yoshida K, Horie T, Sugiyama Y. Clinical significance of
organic anion transporting polypeptides (OATPs) in drug disposition: their roles in hepatic
clearance and intestinal absorption. Biopharm Drug Dispos. 2013;3445-78.
148. Zimmerman EI, Hu S, Roberts JL, Gibson AA, Orwick SJ, Li L, et al. Contribution of
OATP1B1 and OATP1B3 to the disposition of sorafenib and sorafenib-glucuronide. Clin Cancer
Res.191458-66.
250
149. Pearson MA, Fabbro D. Targeting protein kinases in cancer therapy: a success? Expert Rev
Anticancer Ther. 2004;41113-24.
150. Undevia SD, Gomez-Abuin G, Ratain MJ. Pharmacokinetic variability of anticancer
agents. Nat Rev Cancer. 2005;5447-58.
151. van Erp NP, Gelderblom H, Guchelaar HJ. Clinical pharmacokinetics of tyrosine kinase
inhibitors. Cancer Treat Rev. 2009;35692-706.
152. Minocha M, Khurana V, Mitra AK. Determination of pazopanib (GW-786034) in mouse
plasma and brain tissue by liquid chromatography-tandem mass spectrometry (LC/MS-MS). J
Chromatogr B Analyt Technol Biomed Life Sci.90185-92.
153. Minocha M, Khurana V, Qin B, Pal D, Mitra AK. Enhanced brain accumulation of
pazopanib by modulating P-gp and Bcrp1 mediated efflux with canertinib or erlotinib. Int J
Pharm.436127-34.
154. Minocha M, Khurana V, Qin B, Pal D, Mitra AK. Co-administration strategy to enhance
brain accumulation of vandetanib by modulating P-glycoprotein (P-gp/Abcb1) and breast cancer
resistance protein (Bcrp1/Abcg2) mediated efflux with m-TOR inhibitors. Int J Pharm.434306-14.
155. Gotze L, Hegele A, Metzelder SK, Renz H, Nockher WA. Development and clinical
application of a LC-MS/MS method for simultaneous determination of various tyrosine kinase
inhibitors in human plasma. Clin Chim Acta. 2012;413143-9.
156. Lankheet NA, Hillebrand MJ, Rosing H, Schellens JH, Beijnen JH, Huitema AD. Method
development and validation for the quantification of dasatinib, erlotinib, gefitinib, imatinib,
lapatinib, nilotinib, sorafenib and sunitinib in human plasma by liquid chromatography coupled
with tandem mass spectrometry. Biomed Chromatogr. 2013;27466-76.
157. Zimmerman EI, Hu S, Roberts JL, Gibson AA, Orwick SJ, Li L, et al. Contribution of
OATP1B1 and OATP1B3 to the disposition of sorafenib and sorafenib-glucuronide. Clin Cancer
Res. 2013;191458-66.
158. Kalliokoski A, Niemi M. Impact of OATP transporters on pharmacokinetics. Br J
Pharmacol. 2009;158693-705.
159. Konig J, Cui Y, Nies AT, Keppler D. Localization and genomic organization of a new
hepatocellular organic anion transporting polypeptide. J Biol Chem. 2000;27523161-8.
160. De Bruyn T, van Westen GJ, Ijzerman AP, Stieger B, de Witte P, Augustijns PF, et al.
Structure-based identification of OATP1B1/3 inhibitors. Mol Pharmacol. 2013;831257-67.
161. Gui C, Obaidat A, Chaguturu R, Hagenbuch B. Development of a cell-based high-
throughput assay to screen for inhibitors of organic anion transporting polypeptides 1B1 and 1B3.
Curr Chem Genomics. 2010;41-8.
162. Nozawa T, Minami H, Sugiura S, Tsuji A, Tamai I. Role of organic anion transporter
OATP1B1 (OATP-C) in hepatic uptake of irinotecan and its active metabolite, 7-ethyl-10-
hydroxycamptothecin: in vitro evidence and effect of single nucleotide polymorphisms. Drug
Metab Dispos. 2005;33434-9.
163. Agarwal S, Mittapalli RK, Zellmer DM, Gallardo JL, Donelson R, Seiler C, et al. Active
efflux of Dasatinib from the brain limits efficacy against murine glioblastoma: broad implications
for the clinical use of molecularly targeted agents. Mol Cancer Ther.112183-92.
164. Agarwal S, Elmquist WF. Insight into the cooperation of P-glycoprotein (ABCB1) and
breast cancer resistance protein (ABCG2) at the blood-brain barrier: a case study examining
sorafenib efflux clearance. Mol Pharm.9678-84.
165. Wang T, Agarwal S, Elmquist WF. Brain distribution of cediranib is limited by active
efflux at the blood-brain barrier. J Pharmacol Exp Ther.341386-95.
251
166. Agarwal S, Sane R, Gallardo JL, Ohlfest JR, Elmquist WF. Distribution of gefitinib to the
brain is limited by P-glycoprotein (ABCB1) and breast cancer resistance protein (ABCG2)-
mediated active efflux. J Pharmacol Exp Ther.334147-55.
167. Seithel A, Eberl S, Singer K, Auge D, Heinkele G, Wolf NB, et al. The influence of
macrolide antibiotics on the uptake of organic anions and drugs mediated by OATP1B1 and
OATP1B3. Drug Metab Dispos. 2007;35779-86.
168. Backman JT, Kyrklund C, Neuvonen M, Neuvonen PJ. Gemfibrozil greatly increases
plasma concentrations of cerivastatin. Clin Pharmacol Ther. 2002;72685-91.
169. Backman JT, Kyrklund C, Kivisto KT, Wang JS, Neuvonen PJ. Plasma concentrations of
active simvastatin acid are increased by gemfibrozil. Clin Pharmacol Ther. 2000;68122-9.
170. Fahrmayr C, Fromm MF, Konig J. Hepatic OATP and OCT uptake transporters: their role
for drug-drug interactions and pharmacogenetic aspects. Drug Metab Rev.42380-401.
171. Romaine SP, Bailey KM, Hall AS, Balmforth AJ. The influence of SLCO1B1 (OATP1B1)
gene polymorphisms on response to statin therapy. Pharmacogenomics J.101-11.
172. Hu S, Franke RM, Filipski KK, Hu C, Orwick SJ, de Bruijn EA, et al. Interaction of
imatinib with human organic ion carriers. Clin Cancer Res. 2008;143141-8.
173. Burger H, van Tol H, Brok M, Wiemer EA, de Bruijn EA, Guetens G, et al. Chronic
imatinib mesylate exposure leads to reduced intracellular drug accumulation by induction of the
ABCG2 (BCRP) and ABCB1 (MDR1) drug transport pumps. Cancer Biol Ther. 2005;4747-52.
174. Burger H, van Tol H, Boersma AW, Brok M, Wiemer EA, Stoter G, et al. Imatinib mesylate
(STI571) is a substrate for the breast cancer resistance protein (BCRP)/ABCG2 drug pump. Blood.
2004;1042940-2.
175. Hamada A, Miyano H, Watanabe H, Saito H. Interaction of imatinib mesilate with human
P-glycoprotein. J Pharmacol Exp Ther. 2003;307824-8.
176. Shitara Y, Maeda K, Ikejiri K, Yoshida K, Horie T, Sugiyama Y. Clinical significance of
organic anion transporting polypeptides (OATPs) in drug disposition: their roles in hepatic
clearance and intestinal absorption. Biopharm Drug Dispos.3445-78.
177. Kim RB. Organic anion-transporting polypeptide (OATP) transporter family and drug
disposition. Eur J Clin Invest. 2003;33 Suppl 21-5.
178. Duckett DR, Cameron MD. Metabolism considerations for kinase inhibitors in cancer
treatment. Expert Opin Drug Metab Toxicol. 2010;61175-93.
179. Choi MK, Jin QR, Choi YL, Ahn SH, Bae MA, Song IS. Inhibitory effects of ketoconazole
and rifampin on OAT1 and OATP1B1 transport activities: considerations on drug-drug
interactions. Biopharm Drug Dispos.32175-84.
180. Koenen A, Kroemer HK, Grube M, Meyer zu Schwabedissen HE. Current understanding
of hepatic and intestinal OATP-mediated drug-drug interactions. Expert Rev Clin
Pharmacol.4729-42.
181. Muller F, Fromm MF. Transporter-mediated drug-drug interactions.
Pharmacogenomics.121017-37.
182. Niemi M. Role of OATP transporters in the disposition of drugs. Pharmacogenomics.
2007;8787-802.
183. Keitel V, Burdelski M, Warskulat U, Kuhlkamp T, Keppler D, Haussinger D, et al.
Expression and localization of hepatobiliary transport proteins in progressive familial intrahepatic
cholestasis. Hepatology. 2005;411160-72.
184. Oswald M, Kullak-Ublick GA, Paumgartner G, Beuers U. Expression of hepatic
transporters OATP-C and MRP2 in primary sclerosing cholangitis. Liver. 2001;21247-53.
252
185. Wlcek K, Svoboda M, Riha J, Zakaria S, Olszewski U, Dvorak Z, et al. The analysis of
organic anion transporting polypeptide (OATP) mRNA and protein patterns in primary and
metastatic liver cancer. Cancer Biol Ther.11801-11.
186. Vavricka SR, Jung D, Fried M, Grutzner U, Meier PJ, Kullak-Ublick GA. The human
organic anion transporting polypeptide 8 (SLCO1B3) gene is transcriptionally repressed by
hepatocyte nuclear factor 3beta in hepatocellular carcinoma. J Hepatol. 2004;40212-8.
187. Cui Y, Konig J, Nies AT, Pfannschmidt M, Hergt M, Franke WW, et al. Detection of the
human organic anion transporters SLC21A6 (OATP2) and SLC21A8 (OATP8) in liver and
hepatocellular carcinoma. Lab Invest. 2003;83527-38.
188. Di Gion P, Kanefendt F, Lindauer A, Scheffler M, Doroshyenko O, Fuhr U, et al. Clinical
pharmacokinetics of tyrosine kinase inhibitors: focus on pyrimidines, pyridines and pyrroles. Clin
Pharmacokinet.50551-603.
189. Feng B, Xu JJ, Bi YA, Mireles R, Davidson R, Duignan DB, et al. Role of hepatic
transporters in the disposition and hepatotoxicity of a HER2 tyrosine kinase inhibitor CP-724,714.
Toxicol Sci. 2009;108492-500.
190. Khurana V, Minocha M, Pal D, Mitra AK. Role of OATP-1B1 and/or OATP-1B3 in
hepatic disposition of tyrosine kinase inhibitors. Drug Metabol Drug Interact. 2014.
191. Minematsu T, Giacomini KM. Interactions of tyrosine kinase inhibitors with organic cation
transporters and multidrug and toxic compound extrusion proteins. Mol Cancer Ther. 2011;10531-
9.
192. Hartmann JT, Haap M, Kopp HG, Lipp HP. Tyrosine kinase inhibitors - a review on
pharmacology, metabolism and side effects. Curr Drug Metab. 2009;10470-81.
193. Teo YL, Ho HK, Chan A. Risk of tyrosine kinase inhibitors-induced hepatotoxicity in
cancer patients: a meta-analysis. Cancer Treat Rev. 2013;39199-206.
194. Xu CF, Reck BH, Xue Z, Huang L, Baker KL, Chen M, et al. Pazopanib-induced
hyperbilirubinemia is associated with Gilbert's syndrome UGT1A1 polymorphism. Br J Cancer.
2010;1021371-7.
195. Sternberg CN, Davis ID, Mardiak J, Szczylik C, Lee E, Wagstaff J, et al. Pazopanib in
locally advanced or metastatic renal cell carcinoma: results of a randomized phase III trial. J Clin
Oncol. 2010;281061-8.
196. Swift B, Nebot N, Lee JK, Han T, Proctor WR, Thakker DR, et al. Sorafenib hepatobiliary
disposition: mechanisms of hepatic uptake and disposition of generated metabolites. Drug Metab
Dispos. 2013;411179-86.
197. Minocha M, Khurana V, Qin B, Pal D, Mitra AK. Co-administration strategy to enhance
brain accumulation of vandetanib by modulating P-glycoprotein (P-gp/Abcb1) and breast cancer
resistance protein (Bcrp1/Abcg2) mediated efflux with m-TOR inhibitors. Int J Pharm.
2012;434306-14.
198. Karlgren M, Vildhede A, Norinder U, Wisniewski JR, Kimoto E, Lai Y, et al. Classification
of inhibitors of hepatic organic anion transporting polypeptides (OATPs): influence of protein
expression on drug-drug interactions. J Med Chem. 2012;554740-63.
199. Shitara Y. Clinical importance of OATP1B1 and OATP1B3 in drug-drug interactions.
Drug Metab Pharmacokinet. 2011;26220-7.
200. Hu S, Mathijssen RH, de Bruijn P, Baker SD, Sparreboom A. Inhibition of OATP1B1 by
tyrosine kinase inhibitors: in vitro-in vivo correlations. Br J Cancer. 2014;110894-8.
201. Hagenbuch B, Meier PJ. The superfamily of organic anion transporting polypeptides.
Biochim Biophys Acta. 2003;16091-18.
253
202. Abe T, Unno M, Onogawa T, Tokui T, Kondo TN, Nakagomi R, et al. LST-2, a human
liver-specific organic anion transporter, determines methotrexate sensitivity in gastrointestinal
cancers. Gastroenterology. 2001;1201689-99.
203. Muto M, Onogawa T, Suzuki T, Ishida T, Rikiyama T, Katayose Y, et al. Human liver-
specific organic anion transporter-2 is a potent prognostic factor for human breast carcinoma.
Cancer Sci. 2007;981570-6.
204. Smith NF, Acharya MR, Desai N, Figg WD, Sparreboom A. Identification of OATP1B3
as a high-affinity hepatocellular transporter of paclitaxel. Cancer Biol Ther. 2005;4815-8.
205. de Graan AJ, Lancaster CS, Obaidat A, Hagenbuch B, Elens L, Friberg LE, et al. Influence
of polymorphic OATP1B-type carriers on the disposition of docetaxel. Clin Cancer Res.
2012;184433-40.
206. Yamazaki M, Suzuki H, Sugiyama Y. Recent advances in carrier-mediated hepatic uptake
and biliary excretion of xenobiotics. Pharm Res. 1996;13497-513.
207. Shitara Y, Horie T, Sugiyama Y. Transporters as a determinant of drug clearance and tissue
distribution. Eur J Pharm Sci. 2006;27425-46.
208. Asberg A, Hartmann A, Fjeldsa E, Bergan S, Holdaas H. Bilateral pharmacokinetic
interaction between cyclosporine A and atorvastatin in renal transplant recipients. Am J
Transplant. 2001;1382-6.
209. Hedman M, Neuvonen PJ, Neuvonen M, Holmberg C, Antikainen M. Pharmacokinetics
and pharmacodynamics of pravastatin in pediatric and adolescent cardiac transplant recipients on
a regimen of triple immunosuppression. Clin Pharmacol Ther. 2004;75101-9.
210. Nakagomi-Hagihara R, Nakai D, Tokui T, Abe T, Ikeda T. Gemfibrozil and its glucuronide
inhibit the hepatic uptake of pravastatin mediated by OATP1B1. Xenobiotica. 2007;37474-86.
211. Kyrklund C, Backman JT, Neuvonen M, Neuvonen PJ. Gemfibrozil increases plasma
pravastatin concentrations and reduces pravastatin renal clearance. Clin Pharmacol Ther.
2003;73538-44.
212. Whitfield LR, Porcari AR, Alvey C, Abel R, Bullen W, Hartman D. Effect of gemfibrozil
and fenofibrate on the pharmacokinetics of atorvastatin. J Clin Pharmacol. 2011;51378-88.
213. Liu X, Huang J, Sun Y, Zhan K, Zhang Z, Hong M. Identification of multiple binding sites
for substrate transport in bovine organic anion transporting polypeptide 1a2. Drug Metab Dispos.
2013;41602-7.
214. Weaver YM, Hagenbuch B. Several conserved positively charged amino acids in
OATP1B1 are involved in binding or translocation of different substrates. J Membr Biol.
2010;236279-90.
215. Tan AR, Dowlati A, Jones SF, Infante JR, Nishioka J, Fang L, et al. Phase I study of
pazopanib in combination with weekly paclitaxel in patients with advanced solid tumors.
Oncologist. 2010;151253-61.
216. Jang SH, Wientjes MG, Au JL. Kinetics of P-glycoprotein-mediated efflux of paclitaxel. J
Pharmacol Exp Ther. 2001;2981236-42.
217. Kemper EM, van Zandbergen AE, Cleypool C, Mos HA, Boogerd W, Beijnen JH, et al.
Increased penetration of paclitaxel into the brain by inhibition of P-Glycoprotein. Clin Cancer Res.
2003;92849-55.
218. Singer JB, Shou Y, Giles F, Kantarjian HM, Hsu Y, Robeva AS, et al. UGT1A1 promoter
polymorphism increases risk of nilotinib-induced hyperbilirubinemia. Leukemia. 2007;212311-5.
219. Khurana V, Minocha M, Pal D, Mitra AK. Inhibition of OATP-1B1 and OATP-1B3 by
tyrosine kinase inhibitors. Drug Metabol Drug Interact. 2014.

254
220. Giacomini KM, Sugiyama Y. Membrane Transporters and Drug Response: Introduction.
In: Brunton LL CB, Knollmann BC, editor. Brunton LL, Chabner BA, Knollmann BC. 12e ed.
New York: The McGraw-Hill Companies; 2011.
221. Borst P, Elferink RO. Mammalian ABC transporters in health and disease. Annu Rev
Biochem. 2002;71537-92.
222. Ambudkar SV, Kimchi-Sarfaty C, Sauna ZE, Gottesman MM. P-glycoprotein: from
genomics to mechanism. Oncogene. 2003;227468-85.
223. Gottesman MM. Mechanisms of cancer drug resistance. Annu Rev Med. 2002;53615-27.
224. Lin JH, Yamazaki M. Clinical relevance of P-glycoprotein in drug therapy. Drug Metab
Rev. 2003;35417-54.
225. Juliano RL, Ling V. A surface glycoprotein modulating drug permeability in Chinese
hamster ovary cell mutants. Biochim Biophys Acta. 1976;455152-62.
226. Kessel D, Bosmann HB. Effects of L-asparaginase on protein and glycoprotein synthesis.
FEBS Lett. 1970;1085-8.
227. Biedler JL, Riehm H. Cellular resistance to actinomycin D in Chinese hamster cells in
vitro: cross-resistance, radioautographic, and cytogenetic studies. Cancer Res. 1970;301174-84.
228. Higgins CF. ABC transporters: from microorganisms to man. Annu Rev Cell Biol.
1992;867-113.
229. Tusnady GE, Bakos E, Varadi A, Sarkadi B. Membrane topology distinguishes a subfamily
of the ATP-binding cassette (ABC) transporters. FEBS Lett. 1997;4021-3.
230. Kast C, Canfield V, Levenson R, Gros P. Membrane topology of P-glycoprotein as
determined by epitope insertion: transmembrane organization of the N-terminal domain of mdr3.
Biochemistry. 1995;344402-11.
231. Locher KP, Borths E. ABC transporter architecture and mechanism: implications from the
crystal structures of BtuCD and BtuF. FEBS Lett. 2004;564264-8.
232. Kerr ID. Structure and association of ATP-binding cassette transporter nucleotide-binding
domains. Biochim Biophys Acta. 2002;156147-64.
233. Dean M, Rzhetsky A, Allikmets R. The human ATP-binding cassette (ABC) transporter
superfamily. Genome Res. 2001;111156-66.
234. Linton KJ, Higgins CF. The Escherichia coli ATP-binding cassette (ABC) proteins. Mol
Microbiol. 1998;285-13.
235. Hrycyna CA, Airan LE, Germann UA, Ambudkar SV, Pastan I, Gottesman MM. Structural
flexibility of the linker region of human P-glycoprotein permits ATP hydrolysis and drug transport.
Biochemistry. 1998;3713660-73.
236. Sauna ZE, Nandigama K, Ambudkar SV. Exploiting reaction intermediates of the ATPase
reaction to elucidate the mechanism of transport by P-glycoprotein (ABCB1). J Biol Chem.
2006;28126501-11.
237. Zaitseva J, Jenewein S, Oswald C, Jumpertz T, Holland IB, Schmitt L. A molecular
understanding of the catalytic cycle of the nucleotide-binding domain of the ABC transporter
HlyB. Biochem Soc Trans. 2005;33990-5.
238. Jones PM, George AM. The ABC transporter structure and mechanism: perspectives on
recent research. Cell Mol Life Sci. 2004;61682-99.
239. Hulot JS, Villard E, Maguy A, Morel V, Mir L, Tostivint I, et al. A mutation in the drug
transporter gene ABCC2 associated with impaired methotrexate elimination. Pharmacogenet
Genomics. 2005;15277-85.
255
240. Letourneau IJ, Bowers RJ, Deeley RG, Cole SP. Limited modulation of the transport
activity of the human multidrug resistance proteins MRP1, MRP2 and MRP3 by nicotine
glucuronide metabolites. Toxicol Lett. 2005;1579-19.
241. Huisman MT, Smit JW, Crommentuyn KM, Zelcer N, Wiltshire HR, Beijnen JH, et al.
Multidrug resistance protein 2 (MRP2) transports HIV protease inhibitors, and transport can be
enhanced by other drugs. AIDS. 2002;162295-301.
242. Naruhashi K, Tamai I, Inoue N, Muraoka H, Sai Y, Suzuki N, et al. Involvement of
multidrug resistance-associated protein 2 in intestinal secretion of grepafloxacin in rats.
Antimicrob Agents Chemother. 2002;46344-9.
243. Bakos E, Evers R, Sinko E, Varadi A, Borst P, Sarkadi B. Interactions of the human
multidrug resistance proteins MRP1 and MRP2 with organic anions. Mol Pharmacol. 2000;57760-
8.
244. Wacher VJ, Silverman JA, Zhang Y, Benet LZ. Role of P-glycoprotein and cytochrome
P450 3A in limiting oral absorption of peptides and peptidomimetics. J Pharm Sci. 1998;871322-
30.
245. Sharom FJ. The P-glycoprotein efflux pump: how does it transport drugs? J Membr Biol.
1997;160161-75.
246. Pal D, Kwatra D, Minocha M, Paturi DK, Budda B, Mitra AK. Efflux transporters- and
cytochrome P-450-mediated interactions between drugs of abuse and antiretrovirals. Life Sci.
2011;88959-71.
247. Pal D, Mitra AK. MDR- and CYP3A4-mediated drug-herbal interactions. Life Sci.
2006;782131-45.
248. Borst P, Evers R, Kool M, Wijnholds J. A family of drug transporters: the multidrug
resistance-associated proteins. J Natl Cancer Inst. 2000;921295-302.
249. Borst P, Schinkel AH, Smit JJ, Wagenaar E, Van Deemter L, Smith AJ, et al. Classical and
novel forms of multidrug resistance and the physiological functions of P-glycoproteins in
mammals. Pharmacol Ther. 1993;60289-99.
250. Gottesman MM, Pastan I. Biochemistry of multidrug resistance mediated by the multidrug
transporter. Annu Rev Biochem. 1993;62385-427.
251. Ueda K, Okamura N, Hirai M, Tanigawara Y, Saeki T, Kioka N, et al. Human P-
glycoprotein transports cortisol, aldosterone, and dexamethasone, but not progesterone. J Biol
Chem. 1992;26724248-52.
252. Mechetner EB, Roninson IB. Efficient inhibition of P-glycoprotein-mediated multidrug
resistance with a monoclonal antibody. Proc Natl Acad Sci U S A. 1992;895824-8.
253. Hofsli E, Nissen-Meyer J. Reversal of drug resistance by erythromycin: erythromycin
increases the accumulation of actinomycin D and doxorubicin in multidrug-resistant cells. Int J
Cancer. 1989;44149-54.
254. Roninson IB, Abelson HT, Housman DE, Howell N, Varshavsky A. Amplification of
specific DNA sequences correlates with multi-drug resistance in Chinese hamster cells. Nature.
1984;309626-8.
255. Bech-Hansen NT, Till JE, Ling V. Pleiotropic phenotype of colchicine-resistant CHO cells:
cross-resistance and collateral sensitivity. J Cell Physiol. 1976;8823-31.
256. Takano M, Yumoto R, Murakami T. Expression and function of efflux drug transporters
in the intestine. Pharmacol Ther. 2006;109137-61.
256
257. Miller DS, Nobmann SN, Gutmann H, Toeroek M, Drewe J, Fricker G. Xenobiotic
transport across isolated brain microvessels studied by confocal microscopy. Mol Pharmacol.
2000;581357-67.
258. Park S, Sinko PJ. P-glycoprotein and mutlidrug resistance-associated proteins limit the
brain uptake of saquinavir in mice. J Pharmacol Exp Ther. 2005;3121249-56.
259. Schinkel AH, Jonker JW. Mammalian drug efflux transporters of the ATP binding cassette
(ABC) family: an overview. Adv Drug Deliv Rev. 2003;553-29.
260. Staud F, Pavek P. Breast cancer resistance protein (BCRP/ABCG2). Int J Biochem Cell
Biol. 2005;37720-5.
261. Zhang Z, Wu JY, Hait WN, Yang JM. Regulation of the stability of P-glycoprotein by
ubiquitination. Mol Pharmacol. 2004;66395-403.
262. Sarkadi B, Ozvegy-Laczka C, Nemet K, Varadi A. ABCG2 -- a transporter for all seasons.
FEBS Lett. 2004;567116-20.
263. Haimeur A, Conseil G, Deeley RG, Cole SP. The MRP-related and BCRP/ABCG2
multidrug resistance proteins: biology, substrate specificity and regulation. Curr Drug Metab.
2004;521-53.
264. Abbott BL. ABCG2 (BCRP) expression in normal and malignant hematopoietic cells.
Hematol Oncol. 2003;21115-30.
265. Doyle LA, Ross DD. Multidrug resistance mediated by the breast cancer resistance protein
BCRP (ABCG2). Oncogene. 2003;227340-58.
266. Ejendal KF, Hrycyna CA. Multidrug resistance and cancer: the role of the human ABC
transporter ABCG2. Curr Protein Pept Sci. 2002;3503-11.
267. Hoffmeyer S, Burk O, von Richter O, Arnold HP, Brockmoller J, Johne A, et al. Functional
polymorphisms of the human multidrug-resistance gene: multiple sequence variations and
correlation of one allele with P-glycoprotein expression and activity in vivo. Proc Natl Acad Sci
U S A. 2000;973473-8.
268. Fellay J, Marzolini C, Meaden ER, Back DJ, Buclin T, Chave JP, et al. Response to
antiretroviral treatment in HIV-1-infected individuals with allelic variants of the multidrug
resistance transporter 1: a pharmacogenetics study. Lancet. 2002;35930-6.
269. Chowbay B, Zhou S, Lee EJ. An interethnic comparison of polymorphisms of the genes
encoding drug-metabolizing enzymes and drug transporters: experience in Singapore. Drug Metab
Rev. 2005;37327-78.
270. Fung KL, Gottesman MM. A synonymous polymorphism in a common MDR1 (ABCB1)
haplotype shapes protein function. Biochim Biophys Acta. 2009;1794860-71.
271. Nakamura T, Okamura N, Yagi M, Omatsu H, Yamamori M, Kuwahara A, et al. Effects
of ABCB1 3435C>T genotype on serum levels of cortisol and aldosterone in women with normal
menstrual cycles. Genet Mol Res. 2009;8397-403.
272. Lamba J, Strom S, Venkataramanan R, Thummel KE, Lin YS, Liu W, et al. MDR1
genotype is associated with hepatic cytochrome P450 3A4 basal and induction phenotype. Clin
Pharmacol Ther. 2006;79325-38.
273. Seelig A. A general pattern for substrate recognition by P-glycoprotein. Eur J Biochem.
1998;251252-61.
274. Ambudkar SV, Dey S, Hrycyna CA, Ramachandra M, Pastan I, Gottesman MM.
Biochemical, cellular, and pharmacological aspects of the multidrug transporter. Annu Rev
Pharmacol Toxicol. 1999;39361-98.

257
275. Schinkel AH. Pharmacological insights from P-glycoprotein knockout mice. Int J Clin
Pharmacol Ther. 1998;369-13.
276. Agarwal S, Hartz AM, Elmquist WF, Bauer B. Breast cancer resistance protein and P-
glycoprotein in brain cancer: two gatekeepers team up. Curr Pharm Des. 2011;172793-802.
277. Mayer U, Wagenaar E, Dorobek B, Beijnen JH, Borst P, Schinkel AH. Full blockade of
intestinal P-glycoprotein and extensive inhibition of blood-brain barrier P-glycoprotein by oral
treatment of mice with PSC833. J Clin Invest. 1997;1002430-6.
278. Kiso S, Cai SH, Kitaichi K, Furui N, Takagi K, Nabeshima T, et al. Inhibitory effect of
erythromycin on P-glycoprotein-mediated biliary excretion of doxorubicin in rats. Anticancer Res.
2000;202827-34.
279. Song S, Suzuki H, Kawai R, Sugiyama Y. Effect of PSC 833, a P-glycoprotein modulator,
on the disposition of vincristine and digoxin in rats. Drug Metab Dispos. 1999;27689-94.
280. Harker WG, Bauer D, Etiz BB, Newman RA, Sikic BI. Verapamil-mediated sensitization
of doxorubicin-selected pleiotropic resistance in human sarcoma cells: selectivity for drugs which
produce DNA scission. Cancer Res. 1986;462369-73.
281. Inaba M, Kobayashi H, Sakurai Y, Johnson RK. Active efflux of daunorubicin and
adriamycin in sensitive and resistant sublines of P388 leukemia. Cancer Res. 1979;392200-3.
282. Kuhl JS, Sikic BI, Blume KG, Chao NJ. Use of etoposide in combination with cyclosporin
for purging multidrug-resistant leukemic cells from bone marrow in a mouse model. Exp Hematol.
1992;201048-54.
283. Eliason JF, Ramuz H, Kaufmann F. Human multi-drug-resistant cancer cells exhibit a high
degree of selectivity for stereoisomers of verapamil and quinidine. Int J Cancer. 1990;46113-7.
284. Sehested M, Jensen PB, Skovsgaard T, Bindslev N, Demant EJ, Friche E, et al. Inhibition
of vincristine binding to plasma membrane vesicles from daunorubicin-resistant Ehrlich ascites
cells by multidrug resistance modulators. Br J Cancer. 1989;60809-14.
285. Ozols RF, Cunnion RE, Klecker RW, Jr., Hamilton TC, Ostchega Y, Parrillo JE, et al.
Verapamil and adriamycin in the treatment of drug-resistant ovarian cancer patients. J Clin Oncol.
1987;5641-7.
286. Jonsson B, Nilsson K, Nygren P, Larsson R. SDZ PSC-833--a novel potent in vitro
chemosensitizer in multiple myeloma. Anticancer Drugs. 1992;3641-6.
287. Pirker R, FitzGerald DJ, Raschack M, Frank Z, Willingham MC, Pastan I. Enhancement
of the activity of immunotoxins by analogues of verapamil. Cancer Res. 1989;494791-5.
288. Giaccone G, Linn SC, Welink J, Catimel G, Stieltjes H, van der Vijgh WJ, et al. A dose-
finding and pharmacokinetic study of reversal of multidrug resistance with SDZ PSC 833 in
combination with doxorubicin in patients with solid tumors. Clin Cancer Res. 1997;32005-15.
289. Wilson WH, Jamis-Dow C, Bryant G, Balis FM, Klecker RW, Bates SE, et al. Phase I and
pharmacokinetic study of the multidrug resistance modulator dexverapamil with EPOCH
chemotherapy. J Clin Oncol. 1995;131985-94.
290. Lum BL, Gosland MP. MDR expression in normal tissues. Pharmacologic implications for
the clinical use of P-glycoprotein inhibitors. Hematol Oncol Clin North Am. 1995;9319-36.
291. Dantzig AH, Shepard RL, Cao J, Law KL, Ehlhardt WJ, Baughman TM, et al. Reversal of
P-glycoprotein-mediated multidrug resistance by a potent cyclopropyldibenzosuberane modulator,
LY335979. Cancer Res. 1996;564171-9.
292. Dale IL, Tuffley W, Callaghan R, Holmes JA, Martin K, Luscombe M, et al. Reversal of
P-glycoprotein-mediated multidrug resistance by XR9051, a novel diketopiperazine derivative. Br
J Cancer. 1998;78885-92.
258
293. Hyafil F, Vergely C, Du Vignaud P, Grand-Perret T. In vitro and in vivo reversal of
multidrug resistance by GF120918, an acridonecarboxamide derivative. Cancer Res.
1993;534595-602.
294. Dantzig AH, Law KL, Cao J, Starling JJ. Reversal of multidrug resistance by the P-
glycoprotein modulator, LY335979, from the bench to the clinic. Curr Med Chem. 2001;839-50.
295. Ruff P, Vorobiof DA, Jordaan JP, Demetriou GS, Moodley SD, Nosworthy AL, et al. A
randomized, placebo-controlled, double-blind phase 2 study of docetaxel compared to docetaxel
plus zosuquidar (LY335979) in women with metastatic or locally recurrent breast cancer who have
received one prior chemotherapy regimen. Cancer Chemother Pharmacol. 2009;64763-8.
296. Lancet JE, Baer MR, Duran GE, List AF, Fielding R, Marcelletti JF, et al. A phase I trial
of continuous infusion of the multidrug resistance inhibitor zosuquidar with daunorubicin and
cytarabine in acute myeloid leukemia. Leuk Res. 2009;331055-61.
297. Morschhauser F, Zinzani PL, Burgess M, Sloots L, Bouafia F, Dumontet C. Phase I/II trial
of a P-glycoprotein inhibitor, Zosuquidar.3HCl trihydrochloride (LY335979), given orally in
combination with the CHOP regimen in patients with non-Hodgkin's lymphoma. Leuk
Lymphoma. 2007;48708-15.
298. Sandler A, Gordon M, De Alwis DP, Pouliquen I, Green L, Marder P, et al. A Phase I trial
of a potent P-glycoprotein inhibitor, zosuquidar trihydrochloride (LY335979), administered
intravenously in combination with doxorubicin in patients with advanced malignancy. Clin Cancer
Res. 2004;103265-72.
299. Kruijtzer CM, Beijnen JH, Rosing H, ten Bokkel Huinink WW, Schot M, Jewell RC, et al.
Increased oral bioavailability of topotecan in combination with the breast cancer resistance protein
and P-glycoprotein inhibitor GF120918. J Clin Oncol. 2002;202943-50.
300. Cisternino S, Mercier C, Bourasset F, Roux F, Scherrmann JM. Expression, up-regulation,
and transport activity of the multidrug-resistance protein Abcg2 at the mouse blood-brain barrier.
Cancer Res. 2004;643296-301.
301. Patel J, Buddha B, Dey S, Pal D, Mitra AK. In vitro interaction of the HIV protease
inhibitor ritonavir with herbal constituents: changes in P-gp and CYP3A4 activity. Am J Ther.
2004;11262-77.
302. Di Pietro A, Conseil G, Perez-Victoria JM, Dayan G, Baubichon-Cortay H, Trompier D,
et al. Modulation by flavonoids of cell multidrug resistance mediated by P-glycoprotein and related
ABC transporters. Cell Mol Life Sci. 2002;59307-22.
303. Zhang L, Lin G, Kovacs B, Jani M, Krajcsi P, Zuo Z. Mechanistic study on the intestinal
absorption and disposition of baicalein. Eur J Pharm Sci. 2007;31221-31.
304. Zhang S, Yang X, Coburn RA, Morris ME. Structure activity relationships and quantitative
structure activity relationships for the flavonoid-mediated inhibition of breast cancer resistance
protein. Biochem Pharmacol. 2005;70627-39.
305. Zhang S, Yang X, Morris ME. Combined effects of multiple flavonoids on breast cancer
resistance protein (ABCG2)-mediated transport. Pharm Res. 2004;211263-73.
306. Imai Y, Tsukahara S, Asada S, Sugimoto Y. Phytoestrogens/flavonoids reverse breast
cancer resistance protein/ABCG2-mediated multidrug resistance. Cancer Res. 2004;644346-52.
307. Yamagata T, Kusuhara H, Morishita M, Takayama K, Benameur H, Sugiyama Y.
Improvement of the oral drug absorption of topotecan through the inhibition of intestinal
xenobiotic efflux transporter, breast cancer resistance protein, by excipients. Drug Metab Dispos.
2007;351142-8.

259
308. Batrakova EV, Miller DW, Li S, Alakhov VY, Kabanov AV, Elmquist WF. Pluronic P85
enhances the delivery of digoxin to the brain: in vitro and in vivo studies. J Pharmacol Exp Ther.
2001;296551-7.
309. Jain R, Agarwal S, Majumdar S, Zhu X, Pal D, Mitra AK. Evasion of P-gp mediated
cellular efflux and permeability enhancement of HIV-protease inhibitor saquinavir by prodrug
modification. Int J Pharm. 2005;3038-19.
310. Agarwal S, Boddu SH, Jain R, Samanta S, Pal D, Mitra AK. Peptide prodrugs: improved
oral absorption of lopinavir, a HIV protease inhibitor. Int J Pharm. 2008;3597-14.
311. Jain R, Majumdar S, Nashed Y, Pal D, Mitra AK. Circumventing P-glycoprotein-mediated
cellular efflux of quinidine by prodrug derivatization. Mol Pharm. 2004;1290-9.
312. Fenske DB, Cullis PR. Liposomal nanomedicines. Expert Opin Drug Deliv. 2008;525-44.
313. Acharya S, Sahoo SK. PLGA nanoparticles containing various anticancer agents and
tumour delivery by EPR effect. Adv Drug Deliv Rev. 2011;63170-83.
314. Dong X, Mattingly CA, Tseng MT, Cho MJ, Liu Y, Adams VR, et al. Doxorubicin and
paclitaxel-loaded lipid-based nanoparticles overcome multidrug resistance by inhibiting P-
glycoprotein and depleting ATP. Cancer Res. 2009;693918-26.
315. Naito M, Watanabe T, Tsuge H, Koyama T, Oh-hara T, Tsuruo T. Potentiation of the
reversal activity of SDZ PSC833 on multi-drug resistance by an anti-P-glycoprotein monoclonal
antibody MRK-16. Int J Cancer. 1996;67435-40.
316. Pearson JW, Fogler WE, Volker K, Usui N, Goldenberg SK, Gruys E, et al. Reversal of
drug resistance in a human colon cancer xenograft expressing MDR1 complementary DNA by in
vivo administration of MRK-16 monoclonal antibody. J Natl Cancer Inst. 1991;831386-91.
317. Haus-Cohen M, Assaraf YG, Binyamin L, Benhar I, Reiter Y. Disruption of P-glycoprotein
anticancer drug efflux activity by a small recombinant single-chain Fv antibody fragment targeted
to an extracellular epitope. Int J Cancer. 2004;109750-8.
318. Gaudana R, Ananthula HK, Parenky A, Mitra AK. Ocular drug delivery. AAPS J.
2010;12348-60.
319. Nakanishi T. Drug transporters as targets for cancer chemotherapy. Cancer Genomics
Proteomics. 2007;4241-54.
320. Rubio-Aliaga I, Daniel H. Mammalian peptide transporters as targets for drug delivery.
Trends Pharmacol Sci. 2002;23434-40.
321. Kramer W. Transporters, Trojan horses and therapeutics: suitability of bile acid and peptide
transporters for drug delivery. Biol Chem. 2011;39277-94.
322. Balimane PV, Tamai I, Guo A, Nakanishi T, Kitada H, Leibach FH, et al. Direct evidence
for peptide transporter (PepT1)-mediated uptake of a nonpeptide prodrug, valacyclovir. Biochem
Biophys Res Commun. 1998;250246-51.
323. Ganapathy ME, Huang W, Wang H, Ganapathy V, Leibach FH. Valacyclovir: a substrate
for the intestinal and renal peptide transporters PEPT1 and PEPT2. Biochem Biophys Res
Commun. 1998;246470-5.
324. Sugawara M, Huang W, Fei YJ, Leibach FH, Ganapathy V, Ganapathy ME. Transport of
valganciclovir, a ganciclovir prodrug, via peptide transporters PEPT1 and PEPT2. J Pharm Sci.
2000;89781-9.
325. Santos C, Morais J, Gouveia L, de Clercq E, Pannecouque C, Nielsen CU, et al. Dipeptide
derivatives of AZT: synthesis, chemical stability, activation in human plasma, hPEPT1 affinity,
and antiviral activity. ChemMedChem. 2008;3970-8.

260
326. Tsume Y, Vig BS, Sun J, Landowski CP, Hilfinger JM, Ramachandran C, et al. Enhanced
absorption and growth inhibition with amino acid monoester prodrugs of floxuridine by targeting
hPEPT1 transporters. Molecules. 2008;131441-54.
327. Rubio-Aliaga I, Daniel H. Peptide transporters and their roles in physiological processes
and drug disposition. Xenobiotica. 2008;381022-42.
328. Tamai I, Nakanishi T, Nakahara H, Sai Y, Ganapathy V, Leibach FH, et al. Improvement
of L-dopa absorption by dipeptidyl derivation, utilizing peptide transporter PepT1. J Pharm Sci.
1998;871542-6.
329. Ogihara H, Saito H, Shin BC, Terado T, Takenoshita S, Nagamachi Y, et al. Immuno-
localization of H+/peptide cotransporter in rat digestive tract. Biochem Biophys Res Commun.
1996;220848-52.
330. Shen H, Smith DE, Yang T, Huang YG, Schnermann JB, Brosius FC, 3rd. Localization of
PEPT1 and PEPT2 proton-coupled oligopeptide transporter mRNA and protein in rat kidney. Am
J Physiol. 1999;276F658-65.
331. Knutter I, Rubio-Aliaga I, Boll M, Hause G, Daniel H, Neubert K, et al. H+-peptide
cotransport in the human bile duct epithelium cell line SK-ChA-1. Am J Physiol Gastrointest Liver
Physiol. 2002;283G222-9.
332. Bockman DE, Ganapathy V, Oblak TG, Leibach FH. Localization of peptide transporter
in nuclei and lysosomes of the pancreas. Int J Pancreatol. 1997;22221-5.
333. Zhang T, Xiang CD, Gale D, Carreiro S, Wu EY, Zhang EY. Drug transporter and
cytochrome P450 mRNA expression in human ocular barriers: implications for ocular drug
disposition. Drug Metab Dispos. 2008;361300-7.
334. Berger UV, Hediger MA. Distribution of peptide transporter PEPT2 mRNA in the rat
nervous system. Anat Embryol (Berl). 1999;199439-49.
335. Groneberg DA, Doring F, Nickolaus M, Daniel H, Fischer A. Expression of PEPT2 peptide
transporter mRNA and protein in glial cells of rat dorsal root ganglia. Neurosci Lett. 2001;304181-
4.
336. Groneberg DA, Nickolaus M, Springer J, Doring F, Daniel H, Fischer A. Localization of
the peptide transporter PEPT2 in the lung: implications for pulmonary oligopeptide uptake. Am J
Pathol. 2001;158707-14.
337. Groneberg DA, Doring F, Theis S, Nickolaus M, Fischer A, Daniel H. Peptide transport in
the mammary gland: expression and distribution of PEPT2 mRNA and protein. Am J Physiol
Endocrinol Metab. 2002;282E1172-9.
338. Bretschneider B, Brandsch M, Neubert R. Intestinal transport of beta-lactam antibiotics:
analysis of the affinity at the H+/peptide symporter (PEPT1), the uptake into Caco-2 cell
monolayers and the transepithelial flux. Pharm Res. 1999;1655-61.
339. Daniel H, Adibi SA. Transport of beta-lactam antibiotics in kidney brush border
membrane. Determinants of their affinity for the oligopeptide/H+ symporter. J Clin Invest.
1993;922215-23.
340. Ganapathy ME, Prasad PD, Mackenzie B, Ganapathy V, Leibach FH. Interaction of anionic
cephalosporins with the intestinal and renal peptide transporters PEPT 1 and PEPT 2. Biochim
Biophys Acta. 1997;1324296-308.
341. Ocheltree SM, Shen H, Hu Y, Xiang J, Keep RF, Smith DE. Mechanisms of cefadroxil
uptake in the choroid plexus: studies in wild-type and PEPT2 knockout mice. J Pharmacol Exp
Ther. 2004;308462-7.
261
342. Boll M, Markovich D, Weber WM, Korte H, Daniel H, Murer H. Expression cloning of a
cDNA from rabbit small intestine related to proton-coupled transport of peptides, beta-lactam
antibiotics and ACE-inhibitors. Pflugers Arch. 1994;429146-9.
343. Ganapathy ME, Brandsch M, Prasad PD, Ganapathy V, Leibach FH. Differential
recognition of beta -lactam antibiotics by intestinal and renal peptide transporters, PEPT 1 and
PEPT 2. J Biol Chem. 1995;27025672-7.
344. Fei YJ, Kanai Y, Nussberger S, Ganapathy V, Leibach FH, Romero MF, et al. Expression
cloning of a mammalian proton-coupled oligopeptide transporter. Nature. 1994;368563-6.
345. Wenzel U, Gebert I, Weintraut H, Weber WM, Clauss W, Daniel H. Transport
characteristics of differently charged cephalosporin antibiotics in oocytes expressing the cloned
intestinal peptide transporter PepT1 and in human intestinal Caco-2 cells. J Pharmacol Exp Ther.
1996;277831-9.
346. Doring F, Walter J, Will J, Focking M, Boll M, Amasheh S, et al. Delta-aminolevulinic
acid transport by intestinal and renal peptide transporters and its physiological and clinical
implications. J Clin Invest. 1998;1012761-7.
347. Saito H, Terada T, Okuda M, Sasaki S, Inui K. Molecular cloning and tissue distribution
of rat peptide transporter PEPT2. Biochim Biophys Acta. 1996;1280173-7.
348. Landowski CP, Vig BS, Song X, Amidon GL. Targeted delivery to PEPT1-overexpressing
cells: acidic, basic, and secondary floxuridine amino acid ester prodrugs. Mol Cancer Ther.
2005;4659-67.
349. Tsuda M, Terada T, Irie M, Katsura T, Niida A, Tomita K, et al. Transport characteristics
of a novel peptide transporter 1 substrate, antihypotensive drug midodrine, and its amino acid
derivatives. J Pharmacol Exp Ther. 2006;318455-60.
350. Han H, de Vrueh RL, Rhie JK, Covitz KM, Smith PL, Lee CP, et al. 5'-Amino acid esters
of antiviral nucleosides, acyclovir, and AZT are absorbed by the intestinal PEPT1 peptide
transporter. Pharm Res. 1998;151154-9.
351. Watanabe C, Kato Y, Ito S, Kubo Y, Sai Y, Tsuji A. Na+/H+ exchanger 3 affects transport
property of H+/oligopeptide transporter 1. Drug Metab Pharmacokinet. 2005;20443-51.
352. Shu C, Shen H, Hopfer U, Smith DE. Mechanism of intestinal absorption and renal
reabsorption of an orally active ace inhibitor: uptake and transport of fosinopril in cell cultures.
Drug Metab Dispos. 2001;291307-15.
353. Zhu T, Chen XZ, Steel A, Hediger MA, Smith DE. Differential recognition of ACE
inhibitors in Xenopus laevis oocytes expressing rat PEPT1 and PEPT2. Pharm Res. 2000;17526-
32.
354. Sekine T, Miyazaki H, Endou H. Molecular physiology of renal organic anion transporters.
Am J Physiol Renal Physiol. 2006;290F251-61.
355. Konig J, Seithel A, Gradhand U, Fromm MF. Pharmacogenomics of human OATP
transporters. Naunyn Schmiedebergs Arch Pharmacol. 2006;372432-43.
356. Obaidat A, Roth M, Hagenbuch B. The expression and function of organic anion
transporting polypeptides in normal tissues and in cancer. Annu Rev Pharmacol Toxicol.
2012;52135-51.
357. Ho RH, Tirona RG, Leake BF, Glaeser H, Lee W, Lemke CJ, et al. Drug and bile acid
transporters in rosuvastatin hepatic uptake: function, expression, and pharmacogenetics.
Gastroenterology. 2006;1301793-806.
262
358. Su Y, Zhang X, Sinko PJ. Human organic anion-transporting polypeptide OATP-A
(SLC21A3) acts in concert with P-glycoprotein and multidrug resistance protein 2 in the vectorial
transport of Saquinavir in Hep G2 cells. Mol Pharm. 2004;149-56.
359. Lee W, Glaeser H, Smith LH, Roberts RL, Moeckel GW, Gervasini G, et al.
Polymorphisms in human organic anion-transporting polypeptide 1A2 (OATP1A2): implications
for altered drug disposition and central nervous system drug entry. J Biol Chem. 2005;2809610-7.
360. Cvetkovic M, Leake B, Fromm MF, Wilkinson GR, Kim RB. OATP and P-glycoprotein
transporters mediate the cellular uptake and excretion of fexofenadine. Drug Metab Dispos.
1999;27866-71.
361. Kullak-Ublick GA, Hagenbuch B, Stieger B, Schteingart CD, Hofmann AF, Wolkoff AW,
et al. Molecular and functional characterization of an organic anion transporting polypeptide
cloned from human liver. Gastroenterology. 1995;1091274-82.
362. Lau YY, Huang Y, Frassetto L, Benet LZ. effect of OATP1B transporter inhibition on the
pharmacokinetics of atorvastatin in healthy volunteers. Clin Pharmacol Ther. 2007;81194-204.
363. Liu L, Cui Y, Chung AY, Shitara Y, Sugiyama Y, Keppler D, et al. Vectorial transport of
enalapril by Oatp1a1/Mrp2 and OATP1B1 and OATP1B3/MRP2 in rat and human livers. J
Pharmacol Exp Ther. 2006;318395-402.
364. Yamashiro W, Maeda K, Hirouchi M, Adachi Y, Hu Z, Sugiyama Y. Involvement of
transporters in the hepatic uptake and biliary excretion of valsartan, a selective antagonist of the
angiotensin II AT1-receptor, in humans. Drug Metab Dispos. 2006;341247-54.
365. Briz O, Serrano MA, MacIas RI, Gonzalez-Gallego J, Marin JJ. Role of organic anion-
transporting polypeptides, OATP-A, OATP-C and OATP-8, in the human placenta-maternal liver
tandem excretory pathway for foetal bilirubin. Biochem J. 2003;371897-905.
366. Cui Y, Konig J, Leier I, Buchholz U, Keppler D. Hepatic uptake of bilirubin and its
conjugates by the human organic anion transporter SLC21A6. J Biol Chem. 2001;2769626-30.
367. Letschert K, Faulstich H, Keller D, Keppler D. Molecular characterization and inhibition
of amanitin uptake into human hepatocytes. Toxicol Sci. 2006;91140-9.
368. Hirano M, Maeda K, Shitara Y, Sugiyama Y. Contribution of OATP2 (OATP1B1) and
OATP8 (OATP1B3) to the hepatic uptake of pitavastatin in humans. J Pharmacol Exp Ther.
2004;311139-46.
369. Tirona RG, Leake BF, Wolkoff AW, Kim RB. Human organic anion transporting
polypeptide-C (SLC21A6) is a major determinant of rifampin-mediated pregnane X receptor
activation. J Pharmacol Exp Ther. 2003;304223-8.
370. Vavricka SR, Van Montfoort J, Ha HR, Meier PJ, Fattinger K. Interactions of rifamycin
SV and rifampicin with organic anion uptake systems of human liver. Hepatology. 2002;36164-
72.
371. Pizzagalli F, Hagenbuch B, Stieger B, Klenk U, Folkers G, Meier PJ. Identification of a
novel human organic anion transporting polypeptide as a high affinity thyroxine transporter. Mol
Endocrinol. 2002;162283-96.
372. Kraft ME, Glaeser H, Mandery K, Konig J, Auge D, Fromm MF, et al. The prostaglandin
transporter OATP2A1 is expressed in human ocular tissues and transports the antiglaucoma
prostanoid latanoprost. Invest Ophthalmol Vis Sci. 2010;512504-11.
373. Treiber A, Schneiter R, Hausler S, Stieger B. Bosentan is a substrate of human OATP1B1
and OATP1B3: inhibition of hepatic uptake as the common mechanism of its interactions with
cyclosporin A, rifampicin, and sildenafil. Drug Metab Dispos. 2007;351400-7.

263
374. Noe J, Portmann R, Brun ME, Funk C. Substrate-dependent drug-drug interactions
between gemfibrozil, fluvastatin and other organic anion-transporting peptide (OATP) substrates
on OATP1B1, OATP2B1, and OATP1B3. Drug Metab Dispos. 2007;351308-14.
375. Nozawa T, Imai K, Nezu J, Tsuji A, Tamai I. Functional characterization of pH-sensitive
organic anion transporting polypeptide OATP-B in human. J Pharmacol Exp Ther. 2004;308438-
45.
376. Huber RD, Gao B, Sidler Pfandler MA, Zhang-Fu W, Leuthold S, Hagenbuch B, et al.
Characterization of two splice variants of human organic anion transporting polypeptide 3A1
isolated from human brain. Am J Physiol Cell Physiol. 2007;292C795-806.
377. Adachi H, Suzuki T, Abe M, Asano N, Mizutamari H, Tanemoto M, et al. Molecular
characterization of human and rat organic anion transporter OATP-D. Am J Physiol Renal Physiol.
2003;285F1188-97.
378. Mikkaichi T, Suzuki T, Onogawa T, Tanemoto M, Mizutamari H, Okada M, et al. Isolation
and characterization of a digoxin transporter and its rat homologue expressed in the kidney. Proc
Natl Acad Sci U S A. 2004;1013569-74.
379. Meyer zu Schwabedissen HE, Tirona RG, Yip CS, Ho RH, Kim RB. Interplay between the
nuclear receptor pregnane X receptor and the uptake transporter organic anion transporter
polypeptide 1A2 selectively enhances estrogen effects in breast cancer. Cancer Res. 2008;689338-
47.
380. Ballestero MR, Monte MJ, Briz O, Jimenez F, Gonzalez-San Martin F, Marin JJ.
Expression of transporters potentially involved in the targeting of cytostatic bile acid derivatives
to colon cancer and polyps. Biochem Pharmacol. 2006;72729-38.
381. Miki Y, Suzuki T, Kitada K, Yabuki N, Shibuya R, Moriya T, et al. Expression of the
steroid and xenobiotic receptor and its possible target gene, organic anion transporting
polypeptide-A, in human breast carcinoma. Cancer Res. 2006;66535-42.
382. Tsuboyama T, Onishi H, Kim T, Akita H, Hori M, Tatsumi M, et al. Hepatocellular
carcinoma: hepatocyte-selective enhancement at gadoxetic acid-enhanced MR imaging--
correlation with expression of sinusoidal and canalicular transporters and bile accumulation.
Radiology. 2010;255824-33.
383. Wlcek K, Svoboda M, Riha J, Zakaria S, Olszewski U, Dvorak Z, et al. The analysis of
organic anion transporting polypeptide (OATP) mRNA and protein patterns in primary and
metastatic liver cancer. Cancer Biol Ther. 2011;11801-11.
384. Holla VR, Backlund MG, Yang P, Newman RA, DuBois RN. Regulation of prostaglandin
transporters in colorectal neoplasia. Cancer Prev Res (Phila). 2008;193-9.
385. Wlcek K, Svoboda M, Thalhammer T, Sellner F, Krupitza G, Jaeger W. Altered expression
of organic anion transporter polypeptide (OATP) genes in human breast carcinoma. Cancer Biol
Ther. 2008;71450-5.
386. Liedauer R, Svoboda M, Wlcek K, Arrich F, Ja W, Toma C, et al. Different expression
patterns of organic anion transporting polypeptides in osteosarcomas, bone metastases and
aneurysmal bone cysts. Oncol Rep. 2009;221485-92.
387. Roth M, Obaidat A, Hagenbuch B. OATPs, OATs and OCTs: the organic anion and cation
transporters of the SLCO and SLC22A gene superfamilies. Br J Pharmacol. 2012;1651260-87.
388. Pao SS, Paulsen IT, Saier MH, Jr. Major facilitator superfamily. Microbiol Mol Biol Rev.
1998;621-34.
389. Ren Q, Kang KH, Paulsen IT. TransportDB: a relational database of cellular membrane
transport systems. Nucleic Acids Res. 2004;32D284-8.
264
390. Saier MH, Jr., Beatty JT, Goffeau A, Harley KT, Heijne WH, Huang SC, et al. The major
facilitator superfamily. J Mol Microbiol Biotechnol. 1999;1257-79.
391. Reizer J, Finley K, Kakuda D, MacLeod CL, Reizer A, Saier MH, Jr. Mammalian integral
membrane receptors are homologous to facilitators and antiporters of yeast, fungi, and eubacteria.
Protein Sci. 1993;220-30.
392. Eraly SA, Bush KT, Sampogna RV, Bhatnagar V, Nigam SK. The molecular
pharmacology of organic anion transporters: from DNA to FDA? Mol Pharmacol. 2004;65479-87.
393. Cha SH, Sekine T, Kusuhara H, Yu E, Kim JY, Kim DK, et al. Molecular cloning and
characterization of multispecific organic anion transporter 4 expressed in the placenta. J Biol
Chem. 2000;2754507-12.
394. Ljubojevic M, Balen D, Breljak D, Kusan M, Anzai N, Bahn A, et al. Renal expression of
organic anion transporter OAT2 in rats and mice is regulated by sex hormones. Am J Physiol Renal
Physiol. 2007;292F361-72.
395. Sykes D, Sweet DH, Lowes S, Nigam SK, Pritchard JB, Miller DS. Organic anion transport
in choroid plexus from wild-type and organic anion transporter 3 (Slc22a8)-null mice. Am J
Physiol Renal Physiol. 2004;286F972-8.
396. Alebouyeh M, Takeda M, Onozato ML, Tojo A, Noshiro R, Hasannejad H, et al.
Expression of human organic anion transporters in the choroid plexus and their interactions with
neurotransmitter metabolites. J Pharmacol Sci. 2003;93430-6.
397. Takeda M, Noshiro R, Onozato ML, Tojo A, Hasannejad H, Huang XL, et al. Evidence for
a role of human organic anion transporters in the muscular side effects of HMG-CoA reductase
inhibitors. Eur J Pharmacol. 2004;483133-8.
398. Motohashi H, Sakurai Y, Saito H, Masuda S, Urakami Y, Goto M, et al. Gene expression
levels and immunolocalization of organic ion transporters in the human kidney. J Am Soc Nephrol.
2002;13866-74.
399. Pritchard JB, Sweet DH, Miller DS, Walden R. Mechanism of organic anion transport
across the apical membrane of choroid plexus. J Biol Chem. 1999;27433382-7.
400. Hosoyamada M, Sekine T, Kanai Y, Endou H. Molecular cloning and functional
expression of a multispecific organic anion transporter from human kidney. Am J Physiol.
1999;276F122-8.
401. Burckhardt G. Drug transport by Organic Anion Transporters (OATs). Pharmacol Ther.
2012;136106-30.
402. Enomoto A, Takeda M, Shimoda M, Narikawa S, Kobayashi Y, Yamamoto T, et al.
Interaction of human organic anion transporters 2 and 4 with organic anion transport inhibitors. J
Pharmacol Exp Ther. 2002;301797-802.
403. Cha SH, Sekine T, Fukushima JI, Kanai Y, Kobayashi Y, Goya T, et al. Identification and
characterization of human organic anion transporter 3 expressing predominantly in the kidney.
Mol Pharmacol. 2001;591277-86.
404. Ekaratanawong S, Anzai N, Jutabha P, Miyazaki H, Noshiro R, Takeda M, et al. Human
organic anion transporter 4 is a renal apical organic anion/dicarboxylate exchanger in the proximal
tubules. J Pharmacol Sci. 2004;94297-304.
405. Ugele B, St-Pierre MV, Pihusch M, Bahn A, Hantschmann P. Characterization and
identification of steroid sulfate transporters of human placenta. Am J Physiol Endocrinol Metab.
2003;284E390-8.
265
406. Asif AR, Steffgen J, Metten M, Grunewald RW, Muller GA, Bahn A, et al. Presence of
organic anion transporters 3 (OAT3) and 4 (OAT4) in human adrenocortical cells. Pflugers Arch.
2005;45088-95.
407. Shin HJ, Anzai N, Enomoto A, He X, Kim do K, Endou H, et al. Novel liver-specific
organic anion transporter OAT7 that operates the exchange of sulfate conjugates for short chain
fatty acid butyrate. Hepatology. 2007;451046-55.
408. Enomoto A, Kimura H, Chairoungdua A, Shigeta Y, Jutabha P, Cha SH, et al. Molecular
identification of a renal urate anion exchanger that regulates blood urate levels. Nature.
2002;417447-52.
409. Koepsell H. Polyspecific organic cation transporters: their functions and interactions with
drugs. Trends Pharmacol Sci. 2004;25375-81.
410. Jonker JW, Schinkel AH. Pharmacological and physiological functions of the polyspecific
organic cation transporters: OCT1, 2, and 3 (SLC22A1-3). J Pharmacol Exp Ther. 2004;3082-9.
411. Dresser MJ, Leabman MK, Giacomini KM. Transporters involved in the elimination of
drugs in the kidney: organic anion transporters and organic cation transporters. J Pharm Sci.
2001;90397-421.
412. Wright SH. Role of organic cation transporters in the renal handling of therapeutic agents
and xenobiotics. Toxicol Appl Pharmacol. 2005;204309-19.
413. Wright SH, Dantzler WH. Molecular and cellular physiology of renal organic cation and
anion transport. Physiol Rev. 2004;84987-1049.
414. Koepsell H, Endou H. The SLC22 drug transporter family. Pflugers Arch. 2004;447666-
76.
415. Koepsell H, Schmitt BM, Gorboulev V. Organic cation transporters. Rev Physiol Biochem
Pharmacol. 2003;15036-90.
416. Koepsell H, Gorboulev V, Arndt P. Molecular pharmacology of organic cation transporters
in kidney. J Membr Biol. 1999;167103-17.
417. Takeda Y, Inoue H. [Polyamines and cell multiplication]. Horumon To Rinsho.
1975;23111-9.
418. Choi MK, Song IS. Organic cation transporters and their pharmacokinetic and
pharmacodynamic consequences. Drug Metab Pharmacokinet. 2008;23243-53.
419. Dresser MJ, Gray AT, Giacomini KM. Kinetic and selectivity differences between rodent,
rabbit, and human organic cation transporters (OCT1). J Pharmacol Exp Ther. 2000;2921146-52.
420. Kimura N, Masuda S, Tanihara Y, Ueo H, Okuda M, Katsura T, et al. Metformin is a
superior substrate for renal organic cation transporter OCT2 rather than hepatic OCT1. Drug
Metab Pharmacokinet. 2005;20379-86.
421. Bourdet DL, Pritchard JB, Thakker DR. Differential substrate and inhibitory activities of
ranitidine and famotidine toward human organic cation transporter 1 (hOCT1; SLC22A1), hOCT2
(SLC22A2), and hOCT3 (SLC22A3). J Pharmacol Exp Ther. 2005;3151288-97.
422. Lips KS, Volk C, Schmitt BM, Pfeil U, Arndt P, Miska D, et al. Polyspecific cation
transporters mediate luminal release of acetylcholine from bronchial epithelium. Am J Respir Cell
Mol Biol. 2005;3379-88.
423. Karbach U, Kricke J, Meyer-Wentrup F, Gorboulev V, Volk C, Loffing-Cueni D, et al.
Localization of organic cation transporters OCT1 and OCT2 in rat kidney. Am J Physiol Renal
Physiol. 2000;279F679-87.

266
424. Gorboulev V, Ulzheimer JC, Akhoundova A, Ulzheimer-Teuber I, Karbach U, Quester S,
et al. Cloning and characterization of two human polyspecific organic cation transporters. DNA
Cell Biol. 1997;16871-81.
425. Nies AT, Koepsell H, Winter S, Burk O, Klein K, Kerb R, et al. Expression of organic
cation transporters OCT1 (SLC22A1) and OCT3 (SLC22A3) is affected by genetic factors and
cholestasis in human liver. Hepatology. 2009;501227-40.
426. Muller J, Lips KS, Metzner L, Neubert RH, Koepsell H, Brandsch M. Drug specificity and
intestinal membrane localization of human organic cation transporters (OCT). Biochem
Pharmacol. 2005;701851-60.
427. Sata R, Ohtani H, Tsujimoto M, Murakami H, Koyabu N, Nakamura T, et al. Functional
analysis of organic cation transporter 3 expressed in human placenta. J Pharmacol Exp Ther.
2005;315888-95.
428. Wu X, Kekuda R, Huang W, Fei YJ, Leibach FH, Chen J, et al. Identity of the organic
cation transporter OCT3 as the extraneuronal monoamine transporter (uptake2) and evidence for
the expression of the transporter in the brain. J Biol Chem. 1998;27332776-86.
429. Masuda S, Terada T, Yonezawa A, Tanihara Y, Kishimoto K, Katsura T, et al.
Identification and functional characterization of a new human kidney-specific H+/organic cation
antiporter, kidney-specific multidrug and toxin extrusion 2. J Am Soc Nephrol. 2006;172127-35.
430. Vadlapudi AD, Vadlapatla RK, Mitra AK. Sodium dependent multivitamin transporter
(SMVT): a potential target for drug delivery. Curr Drug Targets. 2012;13994-1003.
431. Russell-Jones G, McTavish K, McEwan J, Rice J, Nowotnik D. Vitamin-mediated
targeting as a potential mechanism to increase drug uptake by tumours. J Inorg Biochem.
2004;981625-33.
432. Ramanathan S, Qiu B, Pooyan S, Zhang G, Stein S, Leibowitz MJ, et al. Targeted PEG-
based bioconjugates enhance the cellular uptake and transport of a HIV-1 TAT nonapeptide. J
Control Release. 2001;77199-212.
433. Janoria KG, Hariharan S, Paturi D, Pal D, Mitra AK. Biotin uptake by rabbit corneal
epithelial cells: role of sodium-dependent multivitamin transporter (SMVT). Curr Eye Res.
2006;31797-809.
434. Janoria KG, Boddu SH, Wang Z, Paturi DK, Samanta S, Pal D, et al. Vitreal
pharmacokinetics of biotinylated ganciclovir: role of sodium-dependent multivitamin transporter
expressed on retina. J Ocul Pharmacol Ther. 2009;2539-49.
435. Park S, Sinko PJ. The blood-brain barrier sodium-dependent multivitamin transporter: a
molecular functional in vitro-in situ correlation. Drug Metab Dispos. 2005;331547-54.
436. Said HM, Ortiz A, McCloud E, Dyer D, Moyer MP, Rubin S. Biotin uptake by human
colonic epithelial NCM460 cells: a carrier-mediated process shared with pantothenic acid. Am J
Physiol. 1998;275C1365-71.
437. Patel M, Vadlapatla RK, Shah S, Mitra AK. Molecular expression and functional activity
of sodium dependent multivitamin transporter in human prostate cancer cells. Int J Pharm.
2012;436324-31.
438. Vadlapudi AD, Vadlapatla RK, Pal D, Mitra AK. Functional and Molecular Aspects of
Biotin Uptake via SMVT in Human Corneal Epithelial (HCEC) and Retinal Pigment Epithelial
(D407) Cells. AAPS J. 2012.
439. Luo S, Kansara VS, Zhu X, Mandava NK, Pal D, Mitra AK. Functional characterization
of sodium-dependent multivitamin transporter in MDCK-MDR1 cells and its utilization as a target
for drug delivery. Mol Pharm. 2006;3329-39.
267
440. Kansara V, Luo S, Balasubrahmanyam B, Pal D, Mitra AK. Biotin uptake and cellular
translocation in human derived retinoblastoma cell line (Y-79): a role of hSMVT system. Int J
Pharm. 2006;31243-52.
441. Grassl SM. Human placental brush-border membrane Na(+)-biotin cotransport. J Biol
Chem. 1992;26717760-5.
442. Ohkura Y, Akanuma S, Tachikawa M, Hosoya K. Blood-to-retina transport of biotin via
Na+-dependent multivitamin transporter (SMVT) at the inner blood-retinal barrier. Exp Eye Res.
2010;91387-92.
443. Balamurugan K, Vaziri ND, Said HM. Biotin uptake by human proximal tubular epithelial
cells: cellular and molecular aspects. Am J Physiol Renal Physiol. 2005;288F823-31.
444. Ma TY, Dyer DL, Said HM. Human intestinal cell line Caco-2: a useful model for studying
cellular and molecular regulation of biotin uptake. Biochim Biophys Acta. 1994;118981-8.
445. Baur B, Baumgartner ER. Na(+)-dependent biotin transport into brush-border membrane
vesicles from human kidney cortex. Pflugers Arch. 1993;422499-505.
446. Said HM, Hoefs J, Mohammadkhani R, Horne DW. Biotin transport in human liver
basolateral membrane vesicles: a carrier-mediated, Na+ gradient-dependent process.
Gastroenterology. 1992;1022120-5.
447. Said HM, Redha R, Nylander W. A carrier-mediated, Na+ gradient-dependent transport
for biotin in human intestinal brush-border membrane vesicles. Am J Physiol. 1987;253G631-6.
448. Baur B, Wick H, Baumgartner ER. Na(+)-dependent biotin transport into brush-border
membrane vesicles from rat kidney. Am J Physiol. 1990;258F840-7.
449. Daruwala R, Song J, Koh WS, Rumsey SC, Levine M. Cloning and functional
characterization of the human sodium-dependent vitamin C transporters hSVCT1 and hSVCT2.
FEBS Lett. 1999;460480-4.
450. Wang H, Dutta B, Huang W, Devoe LD, Leibach FH, Ganapathy V, et al. Human Na(+)-
dependent vitamin C transporter 1 (hSVCT1): primary structure, functional characteristics and
evidence for a non-functional splice variant. Biochim Biophys Acta. 1999;14611-9.
451. Tsukaguchi H, Tokui T, Mackenzie B, Berger UV, Chen XZ, Wang Y, et al. A family of
mammalian Na+-dependent L-ascorbic acid transporters. Nature. 1999;39970-5.
452. Said HM, Mohammed ZM. Intestinal absorption of water-soluble vitamins: an update. Curr
Opin Gastroenterol. 2006;22140-6.
453. Maulen NP, Henriquez EA, Kempe S, Carcamo JG, Schmid-Kotsas A, Bachem M, et al.
Up-regulation and polarized expression of the sodium-ascorbic acid transporter SVCT1 in post-
confluent differentiated CaCo-2 cells. J Biol Chem. 2003;2789035-41.
454. Bowers-Komro DM, McCormick DB. Characterization of ascorbic acid uptake by isolated
rat kidney cells. J Nutr. 1991;12157-64.
455. Rose RC. Ascorbic acid transport in mammalian kidney. Am J Physiol. 1986;250F627-32.
456. Astuya A, Caprile T, Castro M, Salazar K, Garcia Mde L, Reinicke K, et al. Vitamin C
uptake and recycling among normal and tumor cells from the central nervous system. J Neurosci
Res. 2005;79146-56.
457. Castro M, Caprile T, Astuya A, Millan C, Reinicke K, Vera JC, et al. High-affinity sodium-
vitamin C co-transporters (SVCT) expression in embryonic mouse neurons. J Neurochem.
2001;78815-23.
458. Talluri RS, Katragadda S, Pal D, Mitra AK. Mechanism of L-ascorbic acid uptake by rabbit
corneal epithelial cells: evidence for the involvement of sodium-dependent vitamin C transporter
2. Curr Eye Res. 2006;31481-9.
268
459. Garland DL. Ascorbic acid and the eye. Am J Clin Nutr. 1991;541198S-202S.
460. Dixon SJ, Kulaga A, Jaworski EM, Wilson JX. Ascorbate uptake by ROS 17/2.8
osteoblast-like cells: substrate specificity and sensitivity to transport inhibitors. J Bone Miner Res.
1991;6623-9.
461. Padh H, Aleo JJ. Characterization of the ascorbic acid transport by 3T6 fibroblasts.
Biochim Biophys Acta. 1987;901283-90.
462. Luo S, Wang Z, Kansara V, Pal D, Mitra AK. Activity of a sodium-dependent vitamin C
transporter (SVCT) in MDCK-MDR1 cells and mechanism of ascorbate uptake. Int J Pharm.
2008;358168-76.
463. Liang WJ, Johnson D, Jarvis SM. Vitamin C transport systems of mammalian cells. Mol
Membr Biol. 2001;1887-95.
464. Wilson JX. Regulation of vitamin C transport. Annu Rev Nutr. 2005;25105-25.
465. Amparo F, Sadrai Z, Jin Y, Alfonso-Bartolozzi B, Wang H, Shikari H, et al. Safety and
efficacy of the multitargeted receptor kinase inhibitor pazopanib in the treatment of corneal
neovascularization. Invest Ophthalmol Vis Sci. 2013;54537-44.
466. Chang JH, Gabison EE, Kato T, Azar DT. Corneal neovascularization. Curr Opin
Ophthalmol. 2001;12242-9.
467. Epstein RJ, Stulting RD, Hendricks RL, Harris DM. Corneal neovascularization.
Pathogenesis and inhibition. Cornea. 1987;6250-7.
468. Hajrasouliha AR, Funaki T, Sadrai Z, Hattori T, Chauhan SK, Dana R. Vascular
endothelial growth factor-C promotes alloimmunity by amplifying antigen-presenting cell
maturation and lymphangiogenesis. Invest Ophthalmol Vis Sci. 2012;531244-50.
469. Niederkorn JY. Immune privilege and immune regulation in the eye. Adv Immunol.
1990;48191-226.
470. Dana MR, Streilein JW. Loss and restoration of immune privilege in eyes with corneal
neovascularization. Invest Ophthalmol Vis Sci. 1996;372485-94.
471. Maguire MG, Stark WJ, Gottsch JD, Stulting RD, Sugar A, Fink NE, et al. Risk factors for
corneal graft failure and rejection in the collaborative corneal transplantation studies.
Collaborative Corneal Transplantation Studies Research Group. Ophthalmology. 1994;1011536-
47.
472. Bachmann BO, Bock F, Wiegand SJ, Maruyama K, Dana MR, Kruse FE, et al. Promotion
of graft survival by vascular endothelial growth factor a neutralization after high-risk corneal
transplantation. Arch Ophthalmol. 2008;12671-7.
473. Kwak N, Okamoto N, Wood JM, Campochiaro PA. VEGF is major stimulator in model of
choroidal neovascularization. Invest Ophthalmol Vis Sci. 2000;413158-64.
474. Krzystolik MG, Afshari MA, Adamis AP, Gaudreault J, Gragoudas ES, Michaud NA, et
al. Prevention of experimental choroidal neovascularization with intravitreal anti-vascular
endothelial growth factor antibody fragment. Arch Ophthalmol. 2002;120338-46.
475. Rosenfeld PJ, Brown DM, Heier JS, Boyer DS, Kaiser PK, Chung CY, et al. Ranibizumab
for neovascular age-related macular degeneration. N Engl J Med. 2006;3551419-31.
476. Brown DM, Michels M, Kaiser PK, Heier JS, Sy JP, Ianchulev T, et al. Ranibizumab versus
verteporfin photodynamic therapy for neovascular age-related macular degeneration: Two-year
results of the ANCHOR study. Ophthalmology. 2009;11657-65 e5.
477. Michels S, Rosenfeld PJ, Puliafito CA, Marcus EN, Venkatraman AS. Systemic
bevacizumab (Avastin) therapy for neovascular age-related macular degeneration twelve-week
results of an uncontrolled open-label clinical study. Ophthalmology. 2005;1121035-47.

269
478. Nguyen QD, Shah S, Tatlipinar S, Do DV, Anden EV, Campochiaro PA. Bevacizumab
suppresses choroidal neovascularisation caused by pathological myopia. Br J Ophthalmol.
2005;891368-70.
479. Avery RL, Pearlman J, Pieramici DJ, Rabena MD, Castellarin AA, Nasir MA, et al.
Intravitreal bevacizumab (Avastin) in the treatment of proliferative diabetic retinopathy.
Ophthalmology. 2006;1131695 e1-15.
480. Laud K, Spaide RF, Freund KB, Slakter J, Klancnik JM, Jr. Treatment of choroidal
neovascularization in pathologic myopia with intravitreal bevacizumab. Retina. 2006;26960-3.
481. Spaide RF, Laud K, Fine HF, Klancnik JM, Jr., Meyerle CB, Yannuzzi LA, et al.
Intravitreal bevacizumab treatment of choroidal neovascularization secondary to age-related
macular degeneration. Retina. 2006;26383-90.
482. Nguyen QD, Shah SM, Hafiz G, Do DV, Haller JA, Pili R, et al. Intravenous bevacizumab
causes regression of choroidal neovascularization secondary to diseases other than age-related
macular degeneration. Am J Ophthalmol. 2008;145257-66.
483. Sakaguchi H, Ikuno Y, Gomi F, Kamei M, Sawa M, Tsujikawa M, et al. Intravitreal
injection of bevacizumab for choroidal neovascularisation associated with pathological myopia.
Br J Ophthalmol. 2007;91161-5.
484. Lindblom P, Gerhardt H, Liebner S, Abramsson A, Enge M, Hellstrom M, et al. Endothelial
PDGF-B retention is required for proper investment of pericytes in the microvessel wall. Genes
Dev. 2003;171835-40.
485. Risau W. Mechanisms of angiogenesis. Nature. 1997;386671-4.
486. Nehls V, Denzer K, Drenckhahn D. Pericyte involvement in capillary sprouting during
angiogenesis in situ. Cell Tissue Res. 1992;270469-74.
487. Naldini A, Carraro F. Role of inflammatory mediators in angiogenesis. Curr Drug Targets
Inflamm Allergy. 2005;43-8.
488. Folkman J. Angiogenesis in cancer, vascular, rheumatoid and other disease. Nat Med.
1995;127-31.
489. Azar DT. Corneal angiogenic privilege: angiogenic and antiangiogenic factors in corneal
avascularity, vasculogenesis, and wound healing (an American Ophthalmological Society thesis).
Trans Am Ophthalmol Soc. 2006;104264-302.
490. Amano S, Rohan R, Kuroki M, Tolentino M, Adamis AP. Requirement for vascular
endothelial growth factor in wound- and inflammation-related corneal neovascularization. Invest
Ophthalmol Vis Sci. 1998;3918-22.
491. Philipp W, Speicher L, Humpel C. Expression of vascular endothelial growth factor and
its receptors in inflamed and vascularized human corneas. Invest Ophthalmol Vis Sci.
2000;412514-22.
492. Cursiefen C, Cao J, Chen L, Liu Y, Maruyama K, Jackson D, et al. Inhibition of
hemangiogenesis and lymphangiogenesis after normal-risk corneal transplantation by neutralizing
VEGF promotes graft survival. Invest Ophthalmol Vis Sci. 2004;452666-73.
493. Dastjerdi MH, Saban DR, Okanobo A, Nallasamy N, Sadrai Z, Chauhan SK, et al. Effects
of topical and subconjunctival bevacizumab in high-risk corneal transplant survival. Invest
Ophthalmol Vis Sci. 2010;512411-7.
494. Song S, Ewald AJ, Stallcup W, Werb Z, Bergers G. PDGFRbeta+ perivascular progenitor
cells in tumours regulate pericyte differentiation and vascular survival. Nat Cell Biol. 2005;7870-
9.
270
495. Finkenzeller G, Marme D, Weich HA, Hug H. Platelet-derived growth factor-induced
transcription of the vascular endothelial growth factor gene is mediated by protein kinase C.
Cancer Res. 1992;524821-3.
496. Abramsson A, Lindblom P, Betsholtz C. Endothelial and nonendothelial sources of PDGF-
B regulate pericyte recruitment and influence vascular pattern formation in tumors. J Clin Invest.
2003;1121142-51.
497. Jain RK, Booth MF. What brings pericytes to tumor vessels? J Clin Invest. 2003;1121134-
6.
498. Hasumi Y, Klosowska-Wardega A, Furuhashi M, Ostman A, Heldin CH, Hellberg C.
Identification of a subset of pericytes that respond to combination therapy targeting PDGF and
VEGF signaling. Int J Cancer. 2007;1212606-14.
499. Erber R, Thurnher A, Katsen AD, Groth G, Kerger H, Hammes HP, et al. Combined
inhibition of VEGF and PDGF signaling enforces tumor vessel regression by interfering with
pericyte-mediated endothelial cell survival mechanisms. FASEB J. 2004;18338-40.
500. Bergers G, Song S, Meyer-Morse N, Bergsland E, Hanahan D. Benefits of targeting both
pericytes and endothelial cells in the tumor vasculature with kinase inhibitors. J Clin Invest.
2003;1111287-95.
501. Jo N, Mailhos C, Ju M, Cheung E, Bradley J, Nishijima K, et al. Inhibition of platelet-
derived growth factor B signaling enhances the efficacy of anti-vascular endothelial growth factor
therapy in multiple models of ocular neovascularization. Am J Pathol. 2006;1682036-53.
502. Harris PA, Boloor A, Cheung M, Kumar R, Crosby RM, Davis-Ward RG, et al. Discovery
of 5-[[4-[(2,3-dimethyl-2H-indazol-6-yl)methylamino]-2-pyrimidinyl]amino]-2-methyl-b
enzenesulfonamide (Pazopanib), a novel and potent vascular endothelial growth factor receptor
inhibitor. J Med Chem. 2008;514632-40.
503. Kumar R, Knick VB, Rudolph SK, Johnson JH, Crosby RM, Crouthamel MC, et al.
Pharmacokinetic-pharmacodynamic correlation from mouse to human with pazopanib, a
multikinase angiogenesis inhibitor with potent antitumor and antiangiogenic activity. Mol Cancer
Ther. 2007;62012-21.
504. van der Graaf WT, Blay JY, Chawla SP, Kim DW, Bui-Nguyen B, Casali PG, et al.
Pazopanib for metastatic soft-tissue sarcoma (PALETTE): a randomised, double-blind, placebo-
controlled phase 3 trial. Lancet. 2012;3791879-86.
505. Takahashi K, Saishin Y, Saishin Y, King AG, Levin R, Campochiaro PA. Suppression and
regression of choroidal neovascularization by the multitargeted kinase inhibitor pazopanib. Arch
Ophthalmol. 2009;127494-9.
506. Yafai Y, Yang XM, Niemeyer M, Nishiwaki A, Lange J, Wiedemann P, et al. Anti-
angiogenic effects of the receptor tyrosine kinase inhibitor, pazopanib, on choroidal
neovascularization in rats. Eur J Pharmacol. 2011;66612-8.
507. Thakur A, Scheinman RI, Rao VR, Kompella UB. Pazopanib, a multitargeted tyrosine
kinase inhibitor, reduces diabetic retinal vascular leukostasis and leakage. Microvasc Res.
2011;82346-50.
508. Mannermaa E, Vellonen KS, Urtti A. Drug transport in corneal epithelium and blood-retina
barrier: emerging role of transporters in ocular pharmacokinetics. Adv Drug Deliv Rev.
2006;581136-63.
509. Katragadda S, Budda B, Anand BS, Mitra AK. Role of efflux pumps and metabolising
enzymes in drug delivery. Expert Opin Drug Deliv. 2005;2683-705.
271
510. Gou M, Gong C, Zhang J, Wang X, Wang X, Gu Y, et al. Polymeric matrix for drug
delivery: honokiol-loaded PCL-PEG-PCL nanoparticles in PEG-PCL-PEG thermosensitive
hydrogel. J Biomed Mater Res A. 2010;93219-26.
511. Karla PK, Quinn TL, Herndon BL, Thomas P, Pal D, Mitra A. Expression of multidrug
resistance associated protein 5 (MRP5) on cornea and its role in drug efflux. J Ocul Pharmacol
Ther. 2009;25121-32.
512. Karla PK, Pal D, Quinn T, Mitra AK. Molecular evidence and functional expression of a
novel drug efflux pump (ABCC2) in human corneal epithelium and rabbit cornea and its role in
ocular drug efflux. Int J Pharm. 2007;33612-21.
513. Karla PK, Earla R, Boddu SH, Johnston TP, Pal D, Mitra A. Molecular expression and
functional evidence of a drug efflux pump (BCRP) in human corneal epithelial cells. Curr Eye
Res. 2009;341-9.
514. Davis AA, Bernstein PS, Bok D, Turner J, Nachtigal M, Hunt RC. A human retinal pigment
epithelial cell line that retains epithelial characteristics after prolonged culture. Invest Ophthalmol
Vis Sci. 1995;36955-64.
515. Constable PA, Lawrenson JG, Dolman DE, Arden GB, Abbott NJ. P-Glycoprotein
expression in human retinal pigment epithelium cell lines. Exp Eye Res. 2006;8324-30.
516. Pissuwan D, Boyer C, Gunasekaran K, Davis TP, Bulmus V. In vitro cytotoxicity of RAFT
polymers. Biomacromolecules. 2010;11412-20.
517. Prabhu A, Shelburne CE, Gibbons DF. Cellular proliferation and cytokine responses of
murine macrophage cell line J774A.1 to polymethylmethacrylate and cobalt-chrome alloy
particles. J Biomed Mater Res. 1998;42655-63.
518. Yoo HS, Choi HK, Park TG. Protein-fatty acid complex for enhanced loading and stability
within biodegradable nanoparticles. J Pharm Sci. 2001;90194-201.
519. Tuzlakoglu K, Reis RL. Biodegradable polymeric fiber structures in tissue engineering.
Tissue Eng Part B Rev. 2009;1517-27.
520. Tamboli V, Mishra GP, Mitra AK. Novel pentablock copolymer (PLA-PCL-PEG-PCL-
PLA) based nanoparticles for controlled drug delivery: Effect of copolymer compositions on the
crystallinity of copolymers and in vitro drug release profile from nanoparticles. Colloid Polym Sci.
2013;2911235-45.
521. Frank A, Rath SK, Venkatraman SS. Controlled release from bioerodible polymers: effect
of drug type and polymer composition. J Control Release. 2005;102333-44.
522. Huang MH, Li S, Hutmacher DW, Schantz JT, Vacanti CA, Braud C, et al. Degradation
and cell culture studies on block copolymers prepared by ring opening polymerization of epsilon-
caprolactone in the presence of poly(ethylene glycol). J Biomed Mater Res A. 2004;69417-27.
523. Li S, Molina I, Martinez MB, Vert M. Hydrolytic and enzymatic degradations of physically
crosslinked hydrogels prepared from PLA/PEO/PLA triblock copolymers. J Mater Sci Mater Med.
2002;1381-6.
524. Li S, Dobrzynski P, Kasperczyk J, Bero M, Braud C, Vert M. Structure-property
relationships of copolymers obtained by ring-opening polymerization of glycolide and epsilon-
caprolactone. Part 2. Influence of composition and chain microstructure on the hydrolytic
degradation. Biomacromolecules. 2005;6489-97.
525. Gomez-Gaete C, Tsapis N, Besnard M, Bochot A, Fattal E. Encapsulation of
dexamethasone into biodegradable polymeric nanoparticles. Int J Pharm. 2007;331153-9.
526. Wu DQ, Chu CC. Biodegradable hydrophobic-hydrophilic hybrid hydrogels: swelling
behavior and controlled drug release. J Biomater Sci Polym Ed. 2008;19411-29.

272
527. Brubaker RF, Bourne WM, Bachman LA, McLaren JW. Ascorbic acid content of human
corneal epithelium. Invest Ophthalmol Vis Sci. 2000;411681-3.
528. Delamere NA. Ascorbic acid and the eye. Subcell Biochem. 1996;25313-29.
529. Burzle M, Suzuki Y, Ackermann D, Miyazaki H, Maeda N, Clemencon B, et al. The
sodium-dependent ascorbic acid transporter family SLC23. Mol Aspects Med. 2013;34436-54.
530. Luo S, Wang Z, Patel M, Khurana V, Zhu X, Pal D, et al. Targeting SVCT for enhanced
drug absorption: synthesis and in vitro evaluation of a novel vitamin C conjugated prodrug of
saquinavir. Int J Pharm. 2011;41477-85.
531. Manfredini S, Pavan B, Vertuani S, Scaglianti M, Compagnone D, Biondi C, et al. Design,
synthesis and activity of ascorbic acid prodrugs of nipecotic, kynurenic and diclophenamic acids,
liable to increase neurotropic activity. J Med Chem. 2002;45559-62.
532. Pfaffl MW. A new mathematical model for relative quantification in real-time RT-PCR.
Nucleic Acids Res. 2001;29e45.
533. Savini I, Rossi A, Pierro C, Avigliano L, Catani MV. SVCT1 and SVCT2: key proteins for
vitamin C uptake. Amino Acids. 2008;34347-55.
534. Koskela TK, Reiss GR, Brubaker RF, Ellefson RD. Is the high concentration of ascorbic
acid in the eye an adaptation to intense solar irradiation? Invest Ophthalmol Vis Sci. 1989;302265-
7.
535. Varma SD, Richards RD. Ascorbic acid and the eye lens. Ophthalmic Res. 1988;20164-
73.
536. Devamanoharan PS, Henein M, Morris S, Ramachandran S, Richards RD, Varma SD.
Prevention of selenite cataract by vitamin C. Exp Eye Res. 1991;52563-8.
537. Barar J, Asadi M, Mortazavi-Tabatabaei SA, Omidi Y. Ocular Drug Delivery; Impact of
in vitro Cell Culture Models. J Ophthalmic Vis Res. 2009;4238-52.
538. Katragadda S, Talluri RS, Pal D, Mitra AK. Identification and characterization of a Na+-
dependent neutral amino acid transporter, ASCT1, in rabbit corneal epithelial cell culture and
rabbit cornea. Curr Eye Res. 2005;30989-1002.
539. Liang WJ, Johnson D, Ma LS, Jarvis SM, Wei-Jun L. Regulation of the human vitamin C
transporters expressed in COS-1 cells by protein kinase C [corrected]. Am J Physiol Cell Physiol.
2002;283C1696-704.
540. Stebbing J, Ellis P. An overview of drug development for metastatic breast cancer. Br J
Nurs. 2012;21S18-22.
541. Bareford LM, Phelps MA, Foraker AB, Swaan PW. Intracellular processing of riboflavin
in human breast cancer cells. Mol Pharm. 2008;5839-48.
542. Shennan DB. Mammary gland membrane transport systems. J Mammary Gland Biol
Neoplasia. 1998;3247-58.
543. Vadlapudi AD, Vadlapatla RK, Pal D, Mitra AK. Biotin uptake by T47D breast cancer
cells: functional and molecular evidence of sodium-dependent multivitamin transporter (SMVT).
Int J Pharm. 2013;441535-43.
544. Cole SP, Bhardwaj G, Gerlach JH, Mackie JE, Grant CE, Almquist KC, et al.
Overexpression of a transporter gene in a multidrug-resistant human lung cancer cell line. Science.
1992;2581650-4.
545. Gros P, Ben Neriah YB, Croop JM, Housman DE. Isolation and expression of a
complementary DNA that confers multidrug resistance. Nature. 1986;323728-31.
546. Kessel D, Botterill V, Wodinsky I. Uptake and retention of daunomycin by mouse
leukemic cells as factors in drug response. Cancer Res. 1968;28938-41.
273
547. Ling V, Thompson LH. Reduced permeability in CHO cells as a mechanism of resistance
to colchicine. J Cell Physiol. 1974;83103-16.
548. Riehm H, Biedler JL. Cellular resistance to daunomycin in Chinese hamster cells in vitro.
Cancer Res. 1971;31409-12.
549. Marshman E, Taylor GA, Thomas HD, Newell DR, Curtin NJ. Hypoxanthine transport in
human tumour cell lines: relationship to the inhibition of hypoxanthine rescue by dipyridamole.
Biochem Pharmacol. 2001;61477-84.
550. Plagemann PG, Wohlhueter RM, Woffendin C. Nucleoside and nucleobase transport in
animal cells. Biochim Biophys Acta. 1988;947405-43.
551. Rivenzon-Segal D, Rushkin E, Polak-Charcon S, Degani H. Glucose transporters and
transport kinetics in retinoic acid-differentiated T47D human breast cancer cells. Am J Physiol
Endocrinol Metab. 2000;279E508-19.
552. Gallagher SM, Castorino JJ, Wang D, Philp NJ. Monocarboxylate transporter 4 regulates
maturation and trafficking of CD147 to the plasma membrane in the metastatic breast cancer cell
line MDA-MB-231. Cancer Res. 2007;674182-9.
553. Harris T, Eliyahu G, Frydman L, Degani H. Kinetics of hyperpolarized 13C1-pyruvate
transport and metabolism in living human breast cancer cells. Proc Natl Acad Sci U S A.
2009;10618131-6.
554. Jhaveri MS, Rait AS, Chung KN, Trepel JB, Chang EH. Antisense oligonucleotides
targeted to the human alpha folate receptor inhibit breast cancer cell growth and sensitize the cells
to doxorubicin treatment. Mol Cancer Ther. 2004;31505-12.
555. Pinard MF, Jolivet J, Ratnam M, Kathmann I, Molthoff C, Westerhof R, et al. Functional
aspects of membrane folate receptors in human breast cancer cells with transport-related resistance
to methotrexate. Cancer Chemother Pharmacol. 1996;38281-8.
556. Okabe M, Szakacs G, Reimers MA, Suzuki T, Hall MD, Abe T, et al. Profiling SLCO and
SLC22 genes in the NCI-60 cancer cell lines to identify drug uptake transporters. Mol Cancer
Ther. 2008;73081-91.
557. Tamai I. Oral drug delivery utilizing intestinal OATP transporters. Adv Drug Deliv Rev.
2012;64508-14.
558. Menniti FS, Knoth J, Diliberto EJ, Jr. Role of ascorbic acid in dopamine beta-
hydroxylation. The endogenous enzyme cofactor and putative electron donor for cofactor
regeneration. J Biol Chem. 1986;26116901-8.
559. Murad S, Grove D, Lindberg KA, Reynolds G, Sivarajah A, Pinnell SR. Regulation of
collagen synthesis by ascorbic acid. Proc Natl Acad Sci U S A. 1981;782879-82.
560. Patak P, Willenberg HS, Bornstein SR. Vitamin C is an important cofactor for both adrenal
cortex and adrenal medulla. Endocr Res. 2004;30871-5.
561. Hong SW, Lee SH, Moon JH, Hwang JJ, Kim DE, Ko E, et al. SVCT-2 in breast cancer
acts as an indicator for L-ascorbate treatment. Oncogene. 2013;321508-17.
562. Padayatty SJ, Levine M. Reevaluation of ascorbate in cancer treatment: emerging
evidence, open minds and serendipity. J Am Coll Nutr. 2000;19423-5.
563. Baader SL, Bill E, Trautwein AX, Bruchelt G, Matzanke BF. Mobilization of iron from
cellular ferritin by ascorbic acid in neuroblastoma SK-N-SH cells: an EPR study. FEBS Lett.
1996;381131-4.
564. Head KA. Ascorbic acid in the prevention and treatment of cancer. Altern Med Rev.
1998;3174-86.
274
565. Kang JS, Cho D, Kim YI, Hahm E, Kim YS, Jin SN, et al. Sodium ascorbate (vitamin C)
induces apoptosis in melanoma cells via the down-regulation of transferrin receptor dependent iron
uptake. J Cell Physiol. 2005;204192-7.
566. Maramag C, Menon M, Balaji KC, Reddy PG, Laxmanan S. Effect of vitamin C on prostate
cancer cells in vitro: effect on cell number, viability, and DNA synthesis. Prostate. 1997;32188-
95.
567. Cameron E, Campbell A. The orthomolecular treatment of cancer. II. Clinical trial of high-
dose ascorbic acid supplements in advanced human cancer. Chem Biol Interact. 1974;9285-315.
568. Cameron E, Pauling L. Supplemental ascorbate in the supportive treatment of cancer:
Prolongation of survival times in terminal human cancer. Proc Natl Acad Sci U S A. 1976;733685-
9.
569. Cameron E, Pauling L. Supplemental ascorbate in the supportive treatment of cancer:
reevaluation of prolongation of survival times in terminal human cancer. Proc Natl Acad Sci U S
A. 1978;754538-42.
570. Ohno S, Ohno Y, Suzuki N, Soma G, Inoue M. High-dose vitamin C (ascorbic acid)
therapy in the treatment of patients with advanced cancer. Anticancer Res. 2009;29809-15.
571. Kurbacher CM, Wagner U, Kolster B, Andreotti PE, Krebs D, Bruckner HW. Ascorbic
acid (vitamin C) improves the antineoplastic activity of doxorubicin, cisplatin, and paclitaxel in
human breast carcinoma cells in vitro. Cancer Lett. 1996;103183-9.
572. Harris HR, Bergkvist L, Wolk A. Vitamin C intake and breast cancer mortality in a cohort
of Swedish women. Br J Cancer. 2013;109257-64.
573. Chen Q, Espey MG, Sun AY, Pooput C, Kirk KL, Krishna MC, et al. Pharmacologic doses
of ascorbate act as a prooxidant and decrease growth of aggressive tumor xenografts in mice. Proc
Natl Acad Sci U S A. 2008;10511105-9.
574. Ullah MF, Khan HY, Zubair H, Shamim U, Hadi SM. The antioxidant ascorbic acid
mobilizes nuclear copper leading to a prooxidant breakage of cellular DNA: implications for
chemotherapeutic action against cancer. Cancer Chemother Pharmacol. 2011;67103-10.
575. Ait-Mohamed O, Battisti V, Joliot V, Fritsch L, Pontis J, Medjkane S, et al. Acetonic
extract of Buxus sempervirens induces cell cycle arrest, apoptosis and autophagy in breast cancer
cells. PLoS One. 2011;6e24537.
576. Holliday DL, Speirs V. Choosing the right cell line for breast cancer research. Breast
Cancer Res. 2011;13215.
577. Mizuno N, Niwa T, Yotsumoto Y, Sugiyama Y. Impact of drug transporter studies on drug
discovery and development. Pharmacol Rev. 2003;55425-61.
275
VITA
Varun Khurana was born on July 4th, 1986 in New Delhi, India. He completed his secondary
education from Mira Model School, New Delhi, India. He later obtained his Bachelor of Pharmacy
degree from Maharaja Surajmal Institute of Pharmacy (MSIP), Delhi, which is affiliated to Guru
Gobind Singh Indraprastha University (GGSIPU), Delhi in June 2008.
Varun Khurana joined the Department of Pharmaceutical Sciences at University of
Missouri-Kansas City (UMKC), School of Pharmacy in August 2008 in pursuit of a doctorate
degree under the guidance of Dr. Ashim K. Mitra. He served as Vice Chair (2009-10), Chair Elect
(2010-11) and Chair (2011-12) of AAPS-UMKC Student Chapter, School of Pharmacy. He has
been awarded with Graduate Teaching Assistantship (GTA) for Advances in Drug Therapy, and
Pharmacokinetics and Biopharmaceutics (2009-12). He has also received Best Seminar Speaker
in Spring 2013 at Division of Pharmaceutical Sciences, UMKC.
Mr. Khurana is an active member of American Association of Pharmaceutical Scientists
(AAPS), Association of Research in Vision and Ophthalmology (ARVO) and Pharmaceutical
Sciences Graduate Student Association (PSGSA). He has authored/co-authored several peer
reviewed research and review articles in reputed international journals and has also presented his
research work in several national conferences.