role of methanogens in biogas production plants - theses.cz · 2. biogas plants 2.1 structure of a...
TRANSCRIPT

University of South Bohemia
Faculty of Science
Department of Ecosystem Biology
Bachelor Thesis
Role of methanogens in biogas production plants
Lukas Penz
Supervisor: Ing. Jiří Bárta, Ph.D.
December 2012

ii
Penz, L. (2012). Role of methanogens in biogas production plants. BSc Thesis in English 23p.
Faculty of Science, University of South Bohemia, České Budějovice, Czech Republic.
Annotation
The aim of this work is to give an overview of the biogas production in anaerobic digesters
and the methanogenic community involved in this process.
I hereby declare that the submitted bachelor thesis has been written solely by me without any
third-party assistance. Additional sources or aids are fully documented in this paper, and
sources for literal or paraphrased quotes are accurately credited.
I hereby declare that, in accordance with Article 47b of Act No. 111/1998 in the valid
wording, I agree with the publication of my bachelor thesis, in full form to be kept in the
Faculty of Science archive, in electronic form in the publicly accessible part of the STAG
database operated by the University of South Bohemia in České Budějovice accessible
through its web pages.
Further, I agree to the electronic publication of the comments of my supervisor and thesis
opponents and the record of the proceedings and results of the thesis defence in accordance
with aforementioned Act No. 111/1998. I also agree to the comparison of the text of my thesis
with the Theses.cz thesis database operated by the National Registry of University Theses and
a plagiarism detection system.
České Budějovice, December 2012 Lukas Penz

iii
Acknowledgements
I am grateful to Ing. Jiří Bárta, Ph.D. for supervising my thesis and for his support throughout
the work. In addition I would like to thank Prof. RNDr. Libor Grubhoffer for his guidance
during the whole study. Finally I would like to thank my parents and friends for their moral
and financial support.

iv
List of Abbreviations
AG Aktiengesellschaft (Joint-Stock company)
BLASTn Nucleotide-nucleotide Basic Local Alignment Search Tool
C Carbon
CHP Combined heat and power unit
CO2 Carbon dioxide
DGGE Denaturing gradient gel electrophoresis
DNA Deoxyribonucleic acid
dsDNA Double stranded deoxyribonucleic acid
FISH Fluorescence in situ hybridization
H2S Hydrogen sulphide
IPC Internal positive control
mcrA Methyl-coenzyme M reductase α-subunit
MPN Most probable number
N Nitrogen
NGE Naturgas Engerwitzdorf GmbH
NH3 Ammonia
NH4+ Ammonium
OÖ Oberösterreich (Upper Austria)
P Phosphorus
qPCR Quantitative real-time polymerase chain reaction
S Sulphur
TGGE Temperature gradient gel electrophoresis
T-RFLP Terminal restriction fragment length polymorphism
VFA Volatile fatty acid

v
Table of contents
Annotation .................................................................................................................................. ii
Acknowledgements ................................................................................................................... iii
List of Abbreviations ................................................................................................................. iv
1. Introduction ............................................................................................................................ 1
2. Biogas plants .......................................................................................................................... 2
2.1 Structure of a typical biogas plant .................................................................................... 2
2.1.1 Manure storage tank and substrate storage ............................................................... 3
2.1.2 Fermenter .................................................................................................................. 3
2.1.3 Post-fermenter ........................................................................................................... 3
2.2 Production of biogas ......................................................................................................... 4
2.2.1 Oxygen ...................................................................................................................... 5
2.2.2 Temperature .............................................................................................................. 5
2.2.3 pH .............................................................................................................................. 5
2.2.4 Nutrients .................................................................................................................... 6
2.2.5 Inhibiting factors ....................................................................................................... 6
2.2.6 Substrates .................................................................................................................. 7
2.3 Composition of biogas and its utilisation ......................................................................... 8
2.4 Naturgas Engerwitzdorf GmbH (NGE) – case study of a local biogas plant ................... 9
3. Methanogen community in biogas plants ............................................................................. 10
3.1 Specific aspects of methanogens .................................................................................... 10
3.2 Methanogenic diversity in biogas reactors ..................................................................... 11
4. Methods for the detection of methanogens .......................................................................... 13
4.1 Microscopic and microbiological methods .................................................................... 13
4.2 Molecular methods ......................................................................................................... 13
4.2.1 Quantitative real-time PCR (qPCR) ........................................................................ 13
4.2.2 Denaturing gradient gel electrophoresis (DGGE) ................................................... 14

vi
4.2.3 Terminal restriction fragment length polymorphism (T-RFLP) ............................. 15
4.2.4 Fluorescence in-situ hybridization (FISH) .............................................................. 16
4.2.5 Metagenomics ......................................................................................................... 16
5. Conclusion ............................................................................................................................ 18
6. References ............................................................................................................................ 19

1
1. Introduction
Due to the increased demand for energy and the high dependence on fossil fuels, the need for
renewable energy sources is certainly going to increase over the next decades. Therefore there
is a great need for alternatives, and the reduction of fossil fuel-derived CO2 emission is
another vital aspect for which it is important to find sustainable solutions (Weiland, 2010).
One possible alternative to fossil fuels is the production of biogas by anaerobic digestion of
wastes, residues and energy crops. This form of energy production has several advantages,
such as the use of local resources, a reduction of the greenhouse gas emissions and it has been
evaluated as a very effective form of bio energy production (Fehrenbach et al., 2008). As a
direct result of this, the production of biogas and the construction of biogas plants have
increased in the countries of the European Union over the past years. Moreover, the sector has
also gained more and more economic recognition (Abraham et al., 2007).
In order to obtain the desired biogas a conversion of the organic material has to occur inside
the biogas digester under set up conditions. This biological formation of methane
(methanogenesis) is the last step in the degradation of biomass. Methanogenesis itself can be
divided into three major pathways: the CO2 reduction pathway, the acetotrophic pathway and
the methylotrophic pathway (Ferry, 2010). The microorganisms involved in this process are
called methanogens and belong to the domain of the Archaea.
Very little is known about the interaction of the microorganisms inside a biogas reactor.
Therefore it is important to understand and describe the microbial diversity and growth
dynamics inside the bioreactor in order to further optimize the conditions of biogas production
(Weiland, 2010).

2
2. Biogas plants
2.1 Structure of a typical biogas plant
In figure 1 the typical structure of a biogas plant is depicted. However, some constituent parts
can be added depending on the specific type of biogas plant. In this section the parts that are
necessary for the biogas production itself will be shortly described, whereas the cleansing step
and usage are discussed later.
Figure 1: Constituent parts of a biogas plant. Adapted from Stifter, 2011.
Fermenter Post-Fermenter Dung
storage tank
Substrate storage
Gas
cleansing
Gas storage
Gas
utilisation
Substrate
filling
station Manure
storage tank

3
2.1.1 Manure storage tank and substrate storage
In these two components the starting materials are stored. On the one hand the liquid manure
from cattle and pig is stored and then pumped into the fermenter, on the other hand the so
called co-ferment, mostly energy crops, is stored by ensiling and filled into the fermenter via
the substrate filling station.
2.1.2 Fermenter
The fermenter, also often referred to as digester, is the core part of every biogas plant where
the anaerobic digestion takes place. The fermenter is equipped with a stirring device to ensure
proper mixing of the newly added and the old substrates. The mixing is also important to
avoid deposits and also to maintain a constant temperature (Dobelmann 2004). In addition to
assure a constant temperature the fermenter is usually equipped with a heating system. The
required heat energy is often produced at the site of the biogas plant itself with a combined
heat and power unit (CHP) (Dobelmann, 2004).
In general fermenters can be divided into horizontal and vertical ones. Vertical fermenters
have the advantage of minimizing heat loss and lower cost of material. Horizontal fermenters
have the advantage of avoiding the mixing of newly added substrate with already decomposed
material at the other end of the fermenter (Jüngling, 1999; Öchsner & Knebelspieß, 1999).
2.1.3 Post-fermenter
Post-fermenters are used to maximize the biogas yields by also capturing the methane
emissions caused by secondary fermentation. Moreover the post-fermenter is used as storage
tank as the products of fermentation are usually not immediately used as dung (Dobelmann,
2004).

4
2.2 Production of biogas
The production of biogas follows the normal anaerobic digestion process with the only
exception that the conditions are set up artificially. The process can be divided into four major
steps: hydrolysis, acidogenesis, acetogenesis and methanogenesis (Watter, 2009).
During hydrolysis and acidogenesis, complex polymers are attacked and broken down by
hydrolysing and fermenting microorganisms. These microorganisms produce exoenzymes as
for example amylase, lipase, cellulase and protease which degrade the polymers to acetate,
hydrogen, carbon dioxide, alcohols and volatile fatty acids such as butyrate and propionate
(Weiland, 2010; Watter, 2009). The bacteria involved in these processes are mostly strict or
facultative anaerobes as for example Bacteriocides, Clostridia and Streptococci (Weiland,
2010).
In the third step of the process, the acetogenesis, the fatty acids are broken down into acetate
and hydrogen by acetogenic bacteria. Examples of involved bacteria are Acetobacterium
woodii and Clostdridium aceticum (Weiland, 2010).
During the last step of the process acetate, carbon dioxide and hydrogen or methanol are
converted into methane and carbon dioxide, the so-called biogas. These conversions are
carried out by a class of microorganisms called methanogens that are described in detail in a
later section (chapter 3) of this work.
A close interaction of all the involved microorganisms is of utter importance for the biogas
production. This is especially true for a well-balanced partial pressure of hydrogen. A too
high concentration of hydrogen can hinder the metabolism of the acetogenic bacteria.
Therefore it is important that the hydrogen is constantly being used up by the methanogens in
order to avoid a breakdown of the whole process (Weiland, 2010).
Other factors which highly influence the biogas production are the process conditions at
which the digestion process is carried out.

5
2.2.1 Oxygen
Most of the involved microorganisms, in particular the methanogens, are strict anaerobes and
therefore oxygen exclusion is necessary for a functioning digestion process. Nevertheless, it is
difficult to guarantee total anoxic conditions in a fermenter. One reason why the metabolism
of the methanogens is not immediately inhibited if oxygen occurs, is the presence of
facultative anaerobic bacteria that use the oxygen before it kills other microorganisms
(Schattauer & Weiland, 2006).
2.2.2 Temperature
Most fermenters are operated at mesophilic (32-42°C) temperature conditions while only a
minority is operated at thermophilic (50-57°C) temperature conditions (Schattauer &
Weiland, 2006). It is of great importance, however, to have a constant temperature inside the
fermenter in order to achieve a constant biogas production. It is therefore more
recommendable to run digestion processes at mesophilic temperature conditions since
mesophilic microorganisms are more tolerant to slight temperature fluctuations (Weiland,
2010). This is in contrast to the fact that chemical reactions generally proceed faster if
temperatures are higher (Schattauer & Weiland, 2006). Consequently one could assume
thermophilic temperature conditions should be favoured. It is important to acknowledge,
however, that the risk using thermophilic conditions is higher and therefore these conditions
are not applied very often.
2.2.3 pH
Similarly to temperature conditions, a pH interval must be obtained that is tolerated by the
whole consortia of microorganisms involved in the digestion process. The optimal pH range
for hydrolysing and fermenting bacteria is between 4,5 and 6,3. In contrast, methanogens and
acetogens need a pH in the range of 6,5-8,5 with an optimal methane production at a pH
interval of 7,0-8,0 (Schattauer & Weiland, 2006; Weiland, 2010). Fortunately, the hydrolysing
and fermenting bacteria can also operate at a slightly higher pH value and are thereby only
slightly inhibited. A typical pH interval at which a fermenter operates is therefore in the
neutral region of around 6,8-7,5 (Schattauer & Weiland, 2006). In general, the pH value in the
fermenter is regulated by the degradation process itself and held at a neutral interval by a
buffer system. Nevertheless, it may happen that the buffer capacity is exhausted and that the
pH drops to a value which inhibits the methanogens. Consequently, the pH value drops even
further due to an accumulation of volatile fatty acids which are no longer broken down to
methane and carbon dioxide. In this case, the addition of substrate to the fermenter must be

6
stopped in order to allow the methanogens to degrade the volatile fatty acids while no new
acids can be generated due to a lack of substrate (Schattauer & Weiland, 2006; Weiland,
2010).
2.2.4 Nutrients
Incoming substrate does not only allow a high methane production but should also provide the
necessary nutrients. In order to guarantee a sufficient supply of nutrients for specific
microbial groups in biogas production, the substrate C:N:P:S ratio should be around
600:15:5:1 (Weiland, 2010). In addition, the presence of some trace elements is necessary.
These include iron, nickel, cobalt, selenium, molybdenum and tungsten. For methanogens, the
presence of nickel and cobalt which are necessary for the cofactor F430 and the corrinoid
factor III are particularly important respectively (Weiland, 2010). One possibility to avoid the
artificial addition of micronutrients is the use of energy crops and manure as substrate.
Thereby the micronutrients are provided by the manure. However, an artificial addition of
micronutrients can still upgrade the digestion process (Weiland, 2010).
2.2.5 Inhibiting factors
The digestion process is also influenced by inhibitory factors. Inhibitory factors can either be
introduced into the system via the substrate or they can be intermediates which are generated
during the digestion process (Schattauer & Weiland, 2006). Some examples for substrate
related inhibitors are antibiotics, herbicides, salts and heavy metals. Already small amounts of
these substances can inhibit the microbial degradation. However, it is difficult to define
concentrations toxic to the microorganisms as they are able to adapt to new conditions
(Schattauer & Weiland, 2006). Two inhibitory factors that are generated by the digestion
process itself are ammonia (NH3) and hydrogen sulphide (H2S). The ammonia concentration
increases at a higher pH and with higher temperatures as the equilibrium of ammonium and
ammonia is thereby shifted towards ammonia (Maehnert, 2007). In contrast to NH4+ which
acts as a nitrogen source, ammonia shows inhibitory characteristics already in small
concentrations (Schattauer & Weiland, 2006). Hydrogen sulphide can act as an inhibitory
factor in two ways. In its dissolved form it acts as a strong cell toxin whereas it can precipitate
essential trace elements as sulphides too (Schattauer & Weiland, 2006).
Furthermore, sufficient moisture (min. 50% water) has to be available in order to allow
microbial growth (Watter, 2009).
7
2.2.6 Substrates
“All types of biomass can be used as substrates for biogas production as long as they contain
carbohydrates, proteins, fats, cellulose and hemicelluloses as main components” (Weiland,
2010). This citation might indicate that a larger variety of substrates is used in the biogas
production. However, substrates are used with the aim of maximizing the methane content of
the produced biogas. This is of importance as the methane yield of the different substrates
depends on their composition. Carbohydrates and proteins are converted at a higher rate than
fats but provide a lower biogas yield (Weiland, 2010). Therefore, so-called energy crops are
chosen according to their net energy yield per hectare and in most cases a mixture of
renewable primary products such as grass- or maize silage and manure is used (Stifter, 2011;
Weiland, 2010). The advantages of energy crops such as maize and rye-whole crop silage are
well-known harvesting practices and an easy storage by ensiling. The process of ensiling can
be regarded as a pre-treatment of the substrate by which the pH value is considerably lowered
to inhibit the growth of detrimental microorganisms.
Another important fact concerning ensiling is the compacting of the silage and the sealing by
means of plastic wraps to avoid aerobic degradation before usage. Moreover, the substrate
should be added to the fermenter continuously in order to avoid fluctuation in the process
conditions (Weiland, 2010).
8
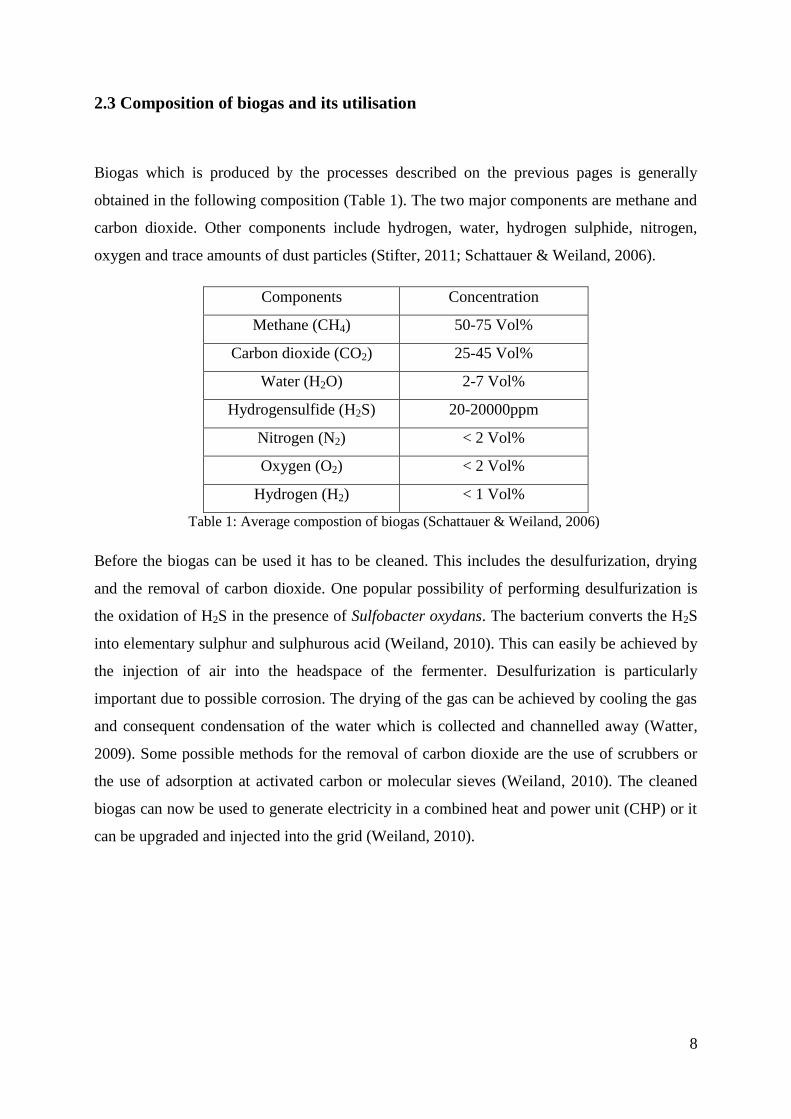
2.3 Composition of biogas and its utilisation
Biogas which is produced by the processes described on the previous pages is generally
obtained in the following composition (Table 1). The two major components are methane and
carbon dioxide. Other components include hydrogen, water, hydrogen sulphide, nitrogen,
oxygen and trace amounts of dust particles (Stifter, 2011; Schattauer & Weiland, 2006).
Components Concentration
Methane (CH4) 50-75 Vol%
Carbon dioxide (CO2) 25-45 Vol%
Water (H2O) 2-7 Vol%
Hydrogensulfide (H2S) 20-20000ppm
Nitrogen (N2) < 2 Vol%
Oxygen (O2) < 2 Vol%
Hydrogen (H2) < 1 Vol%
Table 1: Average compostion of biogas (Schattauer & Weiland, 2006)
Before the biogas can be used it has to be cleaned. This includes the desulfurization, drying
and the removal of carbon dioxide. One popular possibility of performing desulfurization is
the oxidation of H2S in the presence of Sulfobacter oxydans. The bacterium converts the H2S
into elementary sulphur and sulphurous acid (Weiland, 2010). This can easily be achieved by
the injection of air into the headspace of the fermenter. Desulfurization is particularly
important due to possible corrosion. The drying of the gas can be achieved by cooling the gas
and consequent condensation of the water which is collected and channelled away (Watter,
2009). Some possible methods for the removal of carbon dioxide are the use of scrubbers or
the use of adsorption at activated carbon or molecular sieves (Weiland, 2010). The cleaned
biogas can now be used to generate electricity in a combined heat and power unit (CHP) or it
can be upgraded and injected into the grid (Weiland, 2010).

9
2.4 Naturgas Engerwitzdorf GmbH (NGE) – case study of a local biogas plant
The biogas plant in Engerwitzdorf, Upper Austria, is a project realized by a cooperation of
Naturgas Engerwitzdorf GmbH, OÖ Ferngas AG and erdgas OÖ. The aim of the project was
to provide an energy supply from renewable resources which can be cultivated in the local
surroundings. After three years of intensive planning the biogas production was finally started
in November 2010.
The biogas production falls into the agenda of NGE, a company owned by four innovative
farmers. They sell the produced biogas to OÖ Ferngas AG that operates a gas treatment plant
and provides the upgraded biogas to the grid.
The production of the biogas is achieved by a mixture of energy crops and manure. In the year
2010 the crops used were maize, millet, sunflower and whole plant silage (rye, triticale). The
manure was either from pigs or cattle. The two components are mixed in the fermenter which
is operated at mesophilic temperature conditions of 40°C. As has already been mentioned
earlier, these conditions offer a good environment for the involved microorganisms and also
tolerate slight fluctuations in the process conditions. In order to guarantee a constant supply of
organic material, the farmers have to add 25 to 30 tons of biomass, which is stored by
ensiling, each day. The substrate is then used in the fermenter for 45 days. This shortened
storage time is only possible because a post-fermenter is also used.
Desulfurization is achieved with the aid of liquid oxygen and the sulphur is bound to the
biogas slurry at the bottom of the mixture. This effect makes the biogas slurry a good fertilizer
which is used on the fields again. The operators of the biogas plant are obligated to provide
biogas with a methane content of more than 50%. In case this value should not be reached, the
biogas is once again conducted through the whole facility (Stifter, 2011).
From this short summary of biogas production it can be seen that this form of energy
production is environmentally friendly. The energy crops are locally harvested and the biogas
slurry can be distributed on the same fields again. The biogas plant produced 135-140 m3 of
clean gas per hour in the first half of the year 2011 and an increase of this value is planned for
the coming years, as the plant is designed to provide energy for 4000 households (Stifter,
2011).

10
3. Methanogen community in biogas plants
3.1 Specific aspects of methanogens
Figure 2: Phylogenetic tree of Archaea with selected genera of methanogens (Sowers 2009).
Methanogens belong to the domain of the Archaea (Figure 2) and can be divided into five
orders Methanobacteriales, Methanococcales, Methanomicrobiales, Methanosarcinales and
Methanopyrales (Sowers, 2009; Madigan et al., 2009). A possible sixth order, the
Methanocellales, has recently been discussed (Ferry, 2010). The methanogens are extremely
diverse and range from psychrophilic species to thermophilic species, from acidophilic
species to alkaliphilic species and from halophilic species to non-halophilic species. An
example for an acidophilic and thermophilic methanogen is the Methanotorris igneus with
optimum growth conditions at a pH of 5,7 and 88°C. By contrast, the Methanobacterium
subterraneum has its optimal growth conditions at a pH between 7,8-8,8 and temperatures
between 20-40°C. However, most methanogens are mesophiles and non-halophilic and grow
at a neutral to slightly alkaline pH (Madigan et al., 2009; Sowers, 2009). The most unifying
characteristic of methanogens is that they all produce methane (Sowers, 2009).

11
3.2 Methanogenic diversity in biogas reactors
As the production of biogas is highly dependent on the microbial community in the reactor the
study of its diversity is of growing interest. Nettmann et al. (2009) performed a study on ten
agricultural biogas plants operated at a mesophilic temperature and with renewable primary
products. The study revealed that the Methanomicrobiales is the predominate order in nine of
ten analysed reactors. The most abundant genus was the Methanoculleus (Nettmann et al.,
2009). Kröber et al. (2009) also found out that most methanogens in a biogas plant operated
on maize silage and liquid manure belong to the genus Methanoculleus. Other studies also
revealed the Methanomicrobiales as most abundant order, however in these studies the
dominate genus was the Methanocorpusculum (Klocke et al., 2007; Rastogi et al., 2008). As
most species in the order Methanomicrobiales grow by CO2 reduction with hydrogen as
electron donor (Sowers, 2009), it can be assumed that this is the main metabolic pathway in
these reactors.
However, also other orders are present in agricultural biogas plants. According to Nettmann et
al. (2009) members of the order Methanobacteriales can be found in seven of ten biogas
reactors. Moreover also members of the genus Methanosaeta are present in seven of ten
reactors (Nettmann et al., 2009). The presence of this genus introduces the acetotrophic
pathway for the generation of methane. Nevertheless, according to Nettmann et al. (2009), the
majority of methanogens in agricultural biogas reactors is expected to use the CO2 reduction
pathway for growth. This is in contrast to other literature sources in which the acetotrophic
pathway is described as the dominate metabolic pathway (Ahring, 2003).
Certainly it is of great interest now to know which parameters influence the methanogenic
diversity inside the reactor. On the one hand the used substrates and the hydraulic retention
time seem to have little influence on the microbial community (Karakashev et al., 2005;
Nettmann et al,. 2009). On the other hand abiotic factors, as for example oxygen, temperature,
pH, total ammuniom content and the amount of volatile fatty acids (VFA) are expected to
play an important role (Nettmann et al., 2009). According to Rastogi et al. (2008) the ambient
temperature has a great influence on the methanogenic community in biogas reactors,
although constant temperature is of high priority in any biogas fermenter. The study revealed
that there is a seasonal shift in the microbial community from summer to winter, resulting in a

12
much lower microbial diversity during winter times. In areas with seasonal temperature
variations the genus Methanocorpusculum, order Methanomicrobiales, is often found, as it
optimally grows at mesophilic temperatures, however they are also psychrotolerante
(Simankova et al., 2003). Furthermore the total ammonium concentration influences the
methanogenic community to a large extend (Gavala et al., 2003; Nettmann et al., 2009). A
high total ammonium concentration can inhibit the growth of strictly acetotrophic
methanogens (Nettmann et al., 2009). Nevertheless the inhibitory mode of action of
ammuniom on the microbial consortium is still under discussion and needs further
investigation.

13
4. Methods for the detection of methanogens
4.1 Microscopic and microbiological methods
One possible method to detect methanogens is the most probable number (MPN)
determination. Ludvigsen et al. (1999) used MPN on methanogens as this serial-dilution
method is especially applicable on specific physiological types by varying the growth medium
(Spiegelmann et al., 2005). This of course also provides a limitation to this method as it might
happen that the growth medium does not support all the methanogens present (Burlage et. al.,
1998). Another drawback of this method is that it is a time consuming assay due to long
incubation times which might take up to six months (Ludvigsen et al., 1999).
Another possible method to detect methanogens is epifluorescence microscopy. This method
is applicable on methanogens as they contain the autofluorescence cofactor F420 which
fluorescence blue-green when excited (Burlage et al., 1998). Nevertheless, the method has the
drawback that the F420 concentrations vary a lot within the methanogens, even to such a low
level that it is no longer detectable (Gorris & Drift, 1994). This means that a non-fluorescence
microbe is not automatically to be classified as a non-methanogen (Burlage et al., 1998).
Regardless of this disadvantage the method assisted in the qualitative identification of
methanogens in natural habitats (Burlage et al., 1998).
4.2 Molecular methods
4.2.1 Quantitative real-time PCR (qPCR)
qPCR is a powerful method to detect methanogens, as it allows a precise quantification of the
analysed target, which is in contrast to conventional PCR (Zhou et al., 2011). The
quantification in qPCR is performed in real-time by the use of dsDNA binding dyes or
fluorescently labelled probes and the measurement of their fluorescent signal. The intensity of
the signal is then compared to a reference to quantify the target (Tolvanen & Karp, 2011).
Bergmann (2012) used qPCR in a study on the methanogenic Archaea of biogas reactors, as it
is a very sensitive method (Lebuhn et al., 2004) that allows high throughput capacity
(Vandesompele et al., 2002) and offers a wide dynamic range of quantification (Klein, 2002).

14
However, samples from biogas reactors are rich in humic acids which act as inhibitors on
DNA polymerase (Dionisi et al., 2003) and therefore their removal is of great importance. In
order to test the quality and purity of the extracted DNA, spiking and recovery experiments,
as for example the addition of an internal positive control (IPC) should be carried out
(Bergmann, 2012). Moreover, a major limitation for the quantification is the possible
difference in the gene copy number of different targeted methanogens when targeting 16S
rRNA genes (Zhou et al., 2011). However, Steinberg and Regan (2009) used the methyl-
coenzyme M reductase α-subunit (mcrA) genes as target in their qPCR study on methanogens
and thereby overcame the limitations arising when targeting the 16S rRNA genes. Further
advantages of the mcrA gene are, that it is exclusive to methanogens and methanotrophic
Archaea, highly conserved and shows congruent phylogeny to the 16S rRNA gene (Steinberg
& Regan, 2009).
4.2.2 Denaturing gradient gel electrophoresis (DGGE)
DGGE is a commonly used method for community characterizations that is based on the
melting behaviour of DNA fragments in a special polyacrylamid gel (Spiegelman et al.,
2005). The gel contains a linear gradient of denaturant, for example urea or formamide, which
causes the denaturation of the DNA fragment according to its GC content and nucleotide
sequence. It is thereby possible to achieve a separation based on single base pair differences
of the fragments, provided that the gel is well calibrated (Zhou et al., 2011). Apart from the
high resolution, DGGE is able to provide a good comparison of methanogenic communities as
it is possible to compare the different band patterns of the gel. Wang et al. (2010) used this
approach of comparing DGGE profiles to analyse the microbial community in a biogas
reactor. They analysed the change in the archaeal community while changing the ratio of the
added substrates, namely grass silage and cow manure. Thereby Wang et al. (2010)
demonstrated that the archaeal community is only affected to a minimal extend by changes in
the substrate composition. Moreover, Wang et al. (2010) state that they regard DGGE a potent
approach to analyse the connection of bioreactor performance and microbial community
structure. Furthermore, to ensure analysis of the whole diversity of the methanogenic
community the primer selection in the DGGE experiment is very important. Hwang et al.
(2008) constructed methanogenic profiles by DGGE in anaerobic sludge digestion and found
that when using universal archaeal primers several methanogens involved in the degradation
process were not detected. In order to provide insight into the whole methanogenic
community it is therefore necessary to use primers targeting lower taxonomical levels, as for
example at the order level (Hwang et al., 2008). Drawbacks of DGGE are its lower sensitivity

15
compared to T-RFLP (Wang et al., 2010) and that the interpretation of very complex
community samples can be difficult due to an overload of bands (Spiegelman et al., 2005). A
possible modification of DGGE is temperature gradient gel electrophoresis (TGGE) in which
the gradient of denaturants is replaced by a temperature gradient, yet following the same
separation principles.
4.2.3 Terminal restriction fragment length polymorphism (T-RFLP)
T-RFLP is an analysis method based on the separation of labelled DNA fragments according
to their size (Moeseneder et al., 1999). The label is introduced during PCR amplification via
one labelled primer and the restriction digestion is performed by restriction endonucleases.
The actual separation of the fragments is carried out by gel electrophoresis or by capillary
electrophoresis (Spiegelman et al., 2005; Tolvanen & Karp, 2011). Wang et al. (2010) also
used T-RFLP for their investigation on the microbial community of a biogas reactor under the
influence of varying substrate composition. Thereby the finding of the DGGE analysis, the
fact that the archaeal population is only little affected by the substrate composition, could be
confirmed. An advantage of T-RFLP is, however, the better resolution in complex microbial
consortia (Wang et al., 2010; Schwarz et al., 2007). In another study conducted on the
methanogenic population in a bioreactor by T-RFLP, Padmasari et al. (2007) analysed the
methanogens while changing the loading rate of the bioreactor. They found out that
methanogens belonging to the order Methanomicrobiales and Methanosarcinales were
dominant throughout the analysis. However, their relative abundances were fluctuating due to
different concentrations of acetate and hydrogen. An increase in hydrogen production inside
the bioreactor was accompanied by an increasing abundance of Methanomicrobiales spp. and
a fall in the amount of Methanosarcina spp. (Padmasari et al., 2007). In addition, Padmasari
et al. (2007) tested their results obtained by T-RFLP by conducting a variance component
analysis of selected peak areas and thereby verified their results and demonstrated that T-
RFLP is a rapid, robust and reproducible method to analyse methanogens. In general, T-RFLP
is a very sensitive method that allows a high-throughput due to automated detection and
provides an immediate analysis (Spiegelman et al., 2005), whereas its main limitations are
problems related to incomplete or non-specific digestion (Padmasari et al., 2007; Justé et al.,
2008).

16
4.2.4 Fluorescence in-situ hybridization (FISH)
FISH is a technique where fluorescently labelled probes are introduced to target cells to
hybridize to specific genes (Tolvanen & Karp, 2011; Zhou et al., 2011). After the
hybridization, usually to the cell ribosomes, the analysis can be performed by epifluorescence
microscopy (Tolvanen & Karp, 2011). A great advantage of this technique is that the
methanogens can be identified in vivo and also the morphology, the spatial arrangements and
their association to other organisms can be analysed (Amann et al., 1995; Madigan et al.,
2009). Nettmann et al. (2010) carried out a study on six full-scale biogas plants in which the
archaeal community was also analysed by FISH. FISH revealed that in three of the six biogas
plants methanogens belonging to the order Methanomicrobiales were dominant with 60-64%
of archaeal cell counts (Nettmann et. al., 2010). In one of the analysed biogas plants
methanogens belonging to the family Methanosaetaceae were detected with the highest
percentage of 64% of archaeal cell counts (Nettmann et al., 2010). The findings are in
accordance with the results obtained by qPCR, which was performed at the same time
(Nettmann et al., 2010). In another study conducted by FISH in an anaerobic digester for
treating palm oil mill effluent, Tabatabaei et al. (2009) demonstrated the dominance of the
family Methanosaetaceae in this bioreactor with Methanosaeta concili being the most
common species. Conclusively, FISH is a good estimate of the dominant species of
methanogens (Tabatabaei et al., 2009) and its drawbacks are related to the presence of the
autofluorecent F420 in methanogens (Zhou et al., 2011).
4.2.5 Metagenomics
Metagenomics implies the study of the genes of a whole community in an environmental
sample (Cardenas & Tiedje, 2008). The new high-throughput technologies are so called
sequence-by-synthesis methods which allow the determination of the genome sequence with
the advantage of avoiding the bias underlying the cloning procedures (Cardenas & Tiedje,
2008). The currently most popular example for such a technology is pyrosequencing
(Cardenas & Tiedje, 2008). Schlüter et al. (2008) used the ultrafast 454-pyrosequencing
technology to analyse the microbial community of a biogas reactor sample and found
methanogens belonging to the genus Methanoculleus being most abundant. This result was
obtained by the mapping of the metagenome reads to the reference genome of M. Marisnigri
JR1 by BLASTn. Moreover, Schlüter et al. (2008) demonstrated that genes for all enzymatic
functions needed in the CO2 reduction pathway of methanogenesis are present in the analysed
sample. This is of interest as the genus Methanoculleus comprises species which use the CO2

17
reduction pathway for methane production (Sowers, 2009) and thereof the dominance of
species belonging to the Methanoculleus was confirmed (Schlüter et al., 2008). Furthermore,
these findings are supported by another study performed by Krause et al. (2008) using
massive parallel pyrosequencing. The analysis was carried out on a similar biogas reactor and
the same results were achieved. Most methanogens found belong to the genus Methanoculleus
and consequently the major pathway is the CO2 reduction pathway. Concluding, the major
problem related to next-generation sequencing is no longer the feasibility of the sequencing,
but the enormous effort of data analysis (Cardenas & Tiedje, 2008).

18
5. Conclusion
In conclusion, it can be expected that the impact of biogas plants on the energy market will
further increase in the next years. Since the production of biogas is highly dependent on the
microbial community involved in the anaerobic digestion process, it is important to extend
our knowledge of these microorganisms. Especially the methanogenic community has to be
monitored carefully aiming at optimizing the methane yields. In order to achieve this goal the
process conditions like temperature, pH, nutrient supply and the substrates have to be well
selected to allow the involved microorganisms to prosper. This is however only possible when
the methanogenic community is studied in great detail. Modern analysis tools as for example
DGGE, qPCR, t-RFLP and pyrosequencing are used to deepen the understanding of
methanogens. However, these microorganisms are to a large extent unexplored and
subsequent investigations are necessary in order to obtain further knowledge in this field.
19
6. References
Abraham, E.R., Ramachandran, S. & Ramalingam, V. (2007). Biogas: Can it be an important
source of energy? Environmental Science and Pollution Research, 14(1), 67-71.
Ahring, B.K. (2003). Perspectives for anaerobic digestion. In B.K., Ahring (Ed.),
Biomethanation I (pp. 1-30). Berlin: Springer.
Amann, R.I., Ludwig, W. & Schleifer K.H. (1995). Phylogenetic identification and in situ
detection of individual microbial cells without cultivation. Microbiology and molecular
biology reviews, 59, 143–169.
Bergmann, I. (2012). Characterization of methanogenic Archaea communities in biogas
reactors by quantitative PCR. Ph. D Thesis. Berlin: Technische Universität.
Burlage, R.S., Atlas, R., Stahl, D., Geesey, G. & Sayler, G. (1998). Microscopic methods to
study methanogens in natural habitats. Techniques in microbial ecology (pp. 127-128). New
York: Oxford University Press.
Cardenas, E. & Tiedje J.M. (2008). New tools for discovering and characterizing microbial
diversity. Current opinion in biotechnology, 19, 544–549.
Crosby, L.D. & Criddle, C.S. (2003). Understanding bias in microbial community analysis
techniques due to rrn operon copy number heterogeneity. BioTechniques, 34, 790–798.
Dionisi, H.M., Harms, G., Layton, A.C., Gregory, I.R., Parker, J., Hawkins, S.A., Robinson,
K.G. & Sayler, G.S. (2003). Power analysis for real-time PCR quantification of genes in
activated sludge and analysis of the variability introduced by DNA extraction. Applied and
environmental microbiology, 69, 6597-6604.
Dobelmann, J.K. (2004). Bioenergieanlagen: Planung und Installation: Leitfaden für
Investoren, Architekten und Ingenieure. München : Deutsche Gesellschaft für Sonnenenergie
Fachausschuss Biomasse.
Fehrenbach, H., Giegrich, J., Reinhardt, G., Sayer, U., Gretz, M., Lanje, K. & Schmitz, J.
(2008). Kriterien einer nachhaltigen Bioenergienutzung im globalen Maßstab. UBA-
Forschungsbericht, 206, 41–112.
20
Ferry, J.G. (2010). The chemical biology of methanogenesis. Planetary and space science, 58,
1775-1783.
Gavala, H.N., Angelidaki I. & Ahring, B.K. (2003): Kinetics and modeling of anaerobic
digestion process. In B.K. Ahring (Ed.): Biomethanation I (pp57-93). Berlin: Springer.
Gorris, L.G.M. & van der Drift, C. (1994). Cofactor contents of methanogenic bacteria
reviewed. Biofactors, 4, 139–145.
Hwang, K., Shin, S.G., Kim, J. & Hwang, S. (2008). Methanogenic profiles by denaturing
gradient gel electrophoresis using order-specific primers in anaerobic sludge digestion.
Applied microbiology and biotechnology, 80, 269–276.
Jüngling, G. (1999). Landwirtschaftliche Biogasanlagen. Wien: Österreichisches Kuratorium
für Landtechnik und Landentwicklung.
Justé A., Thomma, B.P.H.J. & Lievens, B. (2008). Recent advances in molecular techniques
to study microbial communities in food-associated matrices and processes. Food
microbiology, 25, 745-761.
Karakashev, D., Batstone, D.J. & Angelidaki, I. (2005). Influence of environmental
conditions on methanogenic compositions in anaerobic biogas reactors. Applied and
environmental microbiology, 71, 331-338.
Klein, D. (2002). Quantification using real-time PCR technology: applications and
limitations. Trends in molecular medicine, 8, 257-260.
Klocke, M., Nettmann, E., Mundt, K., Souidi, K., Bergmann, I. & Linke, B. (2007). Diversity
of methanogenic Archaea in biogas reactors. Journal of biotechnology, 131S, 123-124.
Krause, L., Diaz, N.N., Edwards, R., Gartemann, K.-H., Krömeke, H.,Neuweger, H., Pühler,
A., Runte, K., Schlüter, A., Stoye, J., Szczepanowski, R., Tauch, A. & Goesmann, A. (2008).
Taxonomic composition and gene content of a methane-producing microbial community
isolated from a biogas reactor. Journal of biotechnology, 136, 91–101.
Kröber, M., Bekel, T., Diaz, N.N., Goesmann, A., Jaenicke, S., Krause, L., Miller, D., Runte,
K.J., Viehöver, P., Pühler, A. & Schlüter, A.(2009). Phylogenetic characterization of a biogas
plant microbial community integrating clone library 16S-rDNA sequences and metagenome
sequence data obtained by 454-pyrosequencing. Journal of biotechnology, 142, 38–49.

21
Lebuhn, M., Effenberger, M., Garces, G., Gronauer, A. & Wilderer, P.A. (2004). Evaluating
real-time PCR for the quantification of distinct pathogens and indicator organisms in
environmental samples. Water Science and Technology, 50, 263-270.
Ludvigsen, L., Albrechtsen, H.J., Ringelberg, D.B., Ekelund, F. & Christensen, T.H. (1999).
Distribution and composition of microbial populations in a landfill leachate contaminated
aquifer (Grindsted, Denmark). Microbial ecology, 37, 197–207.
Madigan, M.T., Martinko, J.M., Dunlap, P.V. & Clark, D.P. (2009). Brock Biology of
Microorganisms. San Francisco: Benjamin Cummings.
Mähnert, P. (2007). Kinetik der Biogasproduktion aus nachwachsenden Rohstoffen und
Gülle. Ph. D. thesis. Berlin: Landwirtschaftlich-Gärtnerische Fakultät der Humboldt-
Universität.
Moeseneder, M.M., Arrieta, J.M., Muyzer, G., Winter, C. & Herndl, G.J., (1999).
Optimization of terminal restriction fragment length polymorphism analysis for complex
marine bacterioplankton communities and comparison with denaturing gradient gel
electroforesis. Applied and environmental microbiology, 65, 3518–3525.
Nettmann, E., Bergmann, I. & Klocke, M. (2009). Methanogene Archaea in
landwirtschaftlichen Biogasanlagen. In Bayerische Landesanstalt für Landtechnik ( Ed.),
Internationale Wissenschaftstagung Biogas Science 2009 (pp 303-318). Freising: ES-Druck.
Nettmann, E., Bergmann, I., Pramschüfer, S., Mundt, K., Plagsties, V., Hermann, C. &
Klocke, M. (2010). Polyphasic analysis of methanogenic archaeal communities in agricultural
biogas plants. Applied and environmental microbiology, 76, 2540–2548.
Oechsner, H. & Knebelspieß, M. (1999). Ermittlung des Investitionsbedarfs und der
Verfahrenskosten von landwirtschaftlichen Biogasanlagen. Darmstadt: Kuratorium für
Technik und Bauwesen in der Landwirtschaft e.V. (KTBL).
Padmasiri, S.I., Zhang, J.Z., Fitch, M., Norddahl, B., Morgenroth, E. & Raskin, L. (2007).
Methanogenic population dynamics and performance of an anaerobic membrane bioreactor
(AnMBR) treating swine manure under high shear conditions. Water Research, 41, 134–144.
Rastogi, G., Ranade, D., Yeole, T.Y., Patole, M.S. & Shouche, Y.S. (2007). Investigation of
methanogen population structure in biogas reactor by molecular characterization of methyl-
coenzyme M reductase A (mcr A) genes. Bioresource Technology, 99 , 5317-5326.

22
Schattauer, A. & Weiland, P. (2006). Grundlagen der anaeroben Fermentation. Handreichung
Biogasgewinnung und -nutzung (3. überarb. Aufl. ed., pp. 25-35). Gülzow: Fachagentur
Nachwachsende Rohstoffe.
Schlüter, A., Bekel, T., Diaz, N.N., Dondrup, M., Eichenlaub, R., Gartemann, K.H., Krahn, I.,
Krause, L., Krömeke, H., Kruse, O., Mussgnug, J.H., Neuweger, H., Niehaus, K., Pühler, A.,
Runte, K.J., Szczepanowski, R., Tauch, A., Tilker, A., Viehöver, P. & Goesmann, A. (2008).
The metagenome of a biogas-producing microbial community of a production-scale biogas
plant fermenter analysed by the 454-pyrosequencing technology. Journal of biotechnology,
136, 77–90.
Schwarz, J.I.K., Eckert, W. & Conrad, R. (2007). Community structure of Archaea and
Bacteria in a profundal lake sediment Lake Kinneret (Israel). Systematic and applied
microbiology, 30, 239-254.
Simankova, M.V., Kotsyurbenko, O.R., Lueders, T., Nozhevnikova, A.N., Wagner, B.,
Conrad, R. & Friedrich, M.W. (2003). Isolation and characterization of new strains of
methanogens from cold terrestrial habitats. Systematic and applied microbiology, 26, 312–
318.
Sowers, K.R. (2009). Methanogenesis. Encyclopedia of microbiology (3rd ed., pp. 265-285).
United States: Academic Press.
Spiegelman, D., Whissell, G. & Greer C.W. (2005). A survey of the methods for the
characterization of microbial consortia and communities. Canadian journal of microbiology,
51, 355–386.
Steinberg, L.M. and Regan, J.M. (2009). mcrA-targeted real-time quantitative PCR method to
examine methanogen communities. Applied and environmental microbiology, 75, 4435-4442.
Stifter, T. (2011). Prozess- und Kostenanalyse der Biogasanlage Engerwitzdorf. Master thesis.
Wieselburg: Austrian Marketing University of Applied Sciences.
Tabatabaei, M., Zakaria, M.R., Abdul Rahim, R., Wright, A-D.G., Shirai, Y., Abdullah, N.,
Sakai, K., Ikeno, S., Mori, M., Kazunori, N., Sulaiman, A. & Hassan, M.A. (2009). PCR-
based DGGE and FISH analysis of methanogens in an anaerobic closed digester tank for
treating palm oil mill effluent. Electronic journal of biotechnology, 12 (3).

23
Tolvanen K.E.S. & Karp M.T. (2011). Molecular methods for characterizing mixed microbial
communities in hydrogen-fermenting systems. International journal of hydrogen energy, 36,
5280-5288.
Vandesompele, J., De Paepe, A. & Speleman, F. (2002). Elimination of primer-dimer artifacts
and genomic coamplification using a two-step SYBR green I real time RT-PCR. Analytical
biochemistry, 303, 95-98.
Wang, H., Tolvanen, K., Lehtomaki, A., Puhakka, J. & Rintala, J. (2010). Microbial
community structure in anaerobic co-digestion of grass silage and cow manure in a laboratory
continuously stirred tank reactor. Biodegradation, 21, 135-146.
Watter, H. (2009). Nachhaltige Energiesysteme: Grundlagen, Systemtechnik und
Anwendungsbeispiele aus der Praxis ; mit 45 Tabellen (1. Aufl. ed.). Wiesbaden: Vieweg +
Teubner.
Weiland, P. (2010). Biogas production: current state and perspectives. Applied microbiology
and biotechnology, 85, 849-860.
Zhou, M., McAllister, T. A. & Guan, L. L. (2011). Molecular identification of rumen
methanogens: Technologies, advances and prospects. Animal feed science and technology,
166–167, 76–86.