role of predation by harp seals pagophilus … · chassot et al.: harp seal predation on cod...
TRANSCRIPT

MARINE ECOLOGY PROGRESS SERIESMar Ecol Prog Ser
Vol. 379: 279–297, 2009doi: 10.3354/meps07897
Published March 30
INTRODUCTION
During the early 1990s, there was an almost simulta-neous collapse among most of the Atlantic cod Gadusmorhua L. fisheries in eastern Canada, leading tosevere restrictions or moratoria on commercial fishing(Myers et al. 1997, Rice et al. 2003). The northern Gulfof St. Lawrence (NGSL) cod stock (NAFO divisions3Pn4RS; Fig. 1) was historically the second largest codpopulation in the Western Atlantic with a spawningstock biomass (SSB) of 380 000 t in the early 1980s, sup-
porting a fishery of more than 100 000 t in 1983 (MPO2007). By the late 1980s, the population and fisherydeclined to such an extent that a moratorium wasimposed in 1994, leaving a SSB of only about 10 000 t.Subsequently, the population increased quite rapidlyand in 1997, a small fishery reopened, although thestock has remained at about 50% of its minimum con-servation biomass limit (Blim) of about 80 000 to 90 000 t.
There has been considerable debate concerning thecauses for the decline in cod abundance and subse-quent lack of recovery (Hutchings 1996, Shelton &
© Inter-Research 2009 · www.int-res.com*Email: [email protected]
Role of predation by harp seals Pagophilus groenlandicus in the collapse and non-recovery ofnorthern Gulf of St. Lawrence cod Gadus morhua
Emmanuel Chassot1, 4,*, Daniel Duplisea1, Mike Hammill1, Amanda Caskenette1, Nicolas Bousquet2, Yvan Lambert1, Garry Stenson3
1Fisheries and Oceans Canada, Institut Maurice-Lamontagne, 850 route de la Mer, Mont-Joli, Quebec, G5H 3Z4, Canada2Département de Mathématiques et Statistiques, Université Laval, Pavillon Alexandre-Vachon, Quebec, G1K 7P4, Canada
3Fisheries and Oceans Canada, Northwest Atlantic Fisheries Centre, PO Box 5667, St. John’s, Newfoundland, A1C 5X1, Canada
4Present address: IRD, CRH, Avenue Jean Monnet, BP 171, 34 203 Sète Cedex, France
ABSTRACT: A statistical catch-at-age model was developed to assess the effects of predation by thenorthwest Atlantic harp seal population on northern Gulf of St. Lawrence cod by estimating the rela-tive importance of different sources of mortality that affected the stock during a period of collapseand non-recovery. Cod recruitment at age 1 is modeled via a non-linear stock-recruitment relation-ship based on total egg production and accounts for changes in female length-at-maturity and codcondition. Natural mortality other than seal predation also depends on cod condition used as an inte-grative index of changes in environmental conditions. The linkage between seals and cod is modeledthrough a multi-age functional response that was derived from the reconstruction of the seal dietusing morphometric relationships and stomach contents of more than 200 seals collected between1998 and 2001. The model was fitted following a maximum likelihood estimation approach to a sci-entific survey abundance index (1984 to 2006). Model results show that the collapse of the northernGulf of St. Lawrence cod stock was mainly due to the combination of high fishing mortality rates andpoor environmental conditions in the early to mid-1990s contributing to the current state of recruit-ment overfishing. The increase in harp seal abundance during 1984 to 2006 was reflected by anincrease in predation mortality for the young cod age-groups targeted by seals. Although currentlevels of predation mortality affect cod spawning biomass, the lack of recovery of the NGSL cod stockseems mainly due to the very poor recruitment.
KEY WORDS: Cod · Harp seal · Functional response · Model · Predation · Recovery
Resale or republication not permitted without written consent of the publisher
OPENPEN ACCESSCCESS

Mar Ecol Prog Ser 379: 279–297, 2009
Healey 1999, Shelton et al. 2006). Overfishing hasbeen identified as the main factor contributing to thecollapse due to several interrelated common factors,including underestimated discarding and misreporting(Myers et al. 1996, Myers et al. 1997, Savenkoff et al.2004). For the NGSL cod stock, it has been suggestedthat changes in environmental conditions in the early1990s also played a role in the fishery collapse througha decline in cod condition, which consequently resul-ted in reduced growth and recruitment (Lambert &Dutil 1997a, Dutil et al. 1999, Dutil & Lambert 2000).Poor condition is also suspected to have led to anincrease in natural mortality through starvation andenhanced vulnerability to predation (Dutil et al. 1999).The current poor productivity of the stock, combinedwith ongoing fishing activity, has been proposed as amajor factor explaining the lack of recovery for NGSLcod (Dutil et al. 2003, Shelton et al. 2006).
During the last 3 decades, there has been a markedincrease in abundance of many pinniped populationsin the northwest Atlantic (Hammill et al. 1998, Ham-mill & Stenson 2005). Higher natural mortality of north-west Atlantic groundfish resulting from increasedpredation by seals has also been put forward as a plau-sible hypothesis explaining the collapse and failure ofpopulations to recover (Bundy 2001, DFO 2003, Rice etal. 2003). In particular, harp seals Pagophilus groen-landicus, the most abundant pinniped in the northwestAtlantic, have increased from less than 2 million indi-viduals in the early 1970s to almost 6 million today(Hammill & Stenson 2005). Harp seals summer in theArctic, but migrate south along the Labrador coast inlate autumn to overwinter off northeastern Newfound-
land and in the NGSL (Fig. 2). The majorityof the seals overwinter off the south-eastern Labrador–northeastern Newfound-land coast (NAFO Divisions 2J3KL), whileapproximately 25 to 33% of the harp sealsmove into the NGSL (Stenson et al. 2002,2003). Harp seals are generalist predatorscharacterized by a diverse diet of fish andinvertebrates (e.g. Lawson et al. 1998,Hammill & Stenson 2000). Stomach sam-ples collected during the winter and springin the NGSL indicate that their diet ishighly variable, both seasonally and geo-graphically, with an average of approxi-mately 5% made up by cod mainly in thesize range of 15 to 25 cm. In some samples,this proportion may be as high as 45%(Hammill & Stenson 2004, Stenson & Ham-mill 2004).
The correspondence between the de-cline of NGSL cod and the large increase inharp seal abundance (Fig. 3) has led to the
hypothesis that harp seal predation may play a signifi-cant role in the lack of cod population recovery(McLaren et al. 2001, DFO 2003). Seal predation oncod has been examined using bioenergetic models thatderive annual consumption estimates by taking into
280
56575859606162636465666768
52
51
50
49
48
47
Quebec
New Brunswick
Newfoundland
Longitude (°W)
Latitu
de (°N
)
4T
4S4R
3 Pn
a
b
c
d
Fig. 1. Northern Gulf of St. Lawrence (NAFO divisions 4R and 4S)
506070
70
60
50
Longitude (°W)
Latitu
de (°N
)
Greenland
Canada
Gulf of Gulf of St. LawrenceSt. Lawrence
Gulf of St. Lawrence
Fig. 2. Pagophilus groenlandicus. Distribution area of north-west Atlantic harp seals

Chassot et al.: Harp seal predation on cod
account seasonal changes in seal feeding and variabil-ity in abundance, distribution and diet composition(Stenson et al. 1997, Hammill & Stenson 2000, Stenson& Hammill 2004). However, because of the variablenature of the seal diets, these models have assumed anaverage proportion of cod in the diet, in spite of themarked changes in cod biomass that have been docu-mented over the last 3 decades (MPO 2007). Assump-tions about how predation changes in response to vari-ations in prey abundance have been shown to becritical in predicting impacts of predators on commer-cially important prey (Yodzis 1994, Mackinson et al.2003). However, individual and population-level phe-nomena among predators and prey such as searchimage, difficulty in finding prey, aggregation, and dis-persion of predator and prey, can lead to significantdepartures from the linear assumptions about the rela-tionship between prey abundance and the proportionof prey in the diet (Koen-Alonso 2006). In addition,harp seals can display strong preference for specificprey, although they have been shown to be neutrallyselective toward Atlantic cod (Lawson et al. 1998,Lindstrøm et al. 1998, Wathne et al. 2000). Modelingnon-linear processes of the functional response of harpseals to cod therefore appears to be a key to modelingpredation over a wide range of prey abundance suchas observed in NGSL cod.
As described above, hypotheses related to fishing,seal predation, and environment have been proposedfor the decline of NGSL cod, but few studies have at-tempted to simultaneously address these hypotheses todetermine which processes were at play at different
times and how synergistic forcing could have led to thecod collapse. Here, a predator–prey model was con-structed for NGSL cod, with mortality partitioned intocomponents caused by harp seal predation and byother processes, including an explicit influence of an in-tegrated environmental forcer. The impact of seal pre-dation on cod was modelled through a non-linear,multi-age functional response similar to a multi-speciesfunctional response (Smout & Lindstrøm 2007). Codcondition was used as an index for the cumulative andlagged effects of environmental conditions related tofactors such as food availability and temperature expe-rienced by cod (Lambert & Dutil 1997a,b, Rätz & Lloret2003). Changes in cod condition were assumed to affectnatural mortality (Dutil & Lambert 2000) and fecundity,i.e. potential recruitment strength (Marteinsdottir &Begg 2002). The main objective of the analysis was todetermine the relative impact of fishing, seal predation,and environment on the decline of NGSL cod by inte-grating these processes into a single consistent model-ing framework. Such a framework is essential to bothunderstand what happened to the stock and serve as aspringboard for determining future states in the contextof cod recovery and providing advice on exploitation ofNGSL harp seal and cod populations.
METHODS
Cod population model
Cod population dynamics were modelled through aseparable statistical catch-at-age analysis (Fournier &Archibald 1982) without process error, where mortalitywas derived from 3 sources: the fishery, harp seal pre-dation, and natural mortality due to causes other thanharp seal predation (other predation, disease, virus,etc.). The Seal IMpact on Cod ABundance (SIMCAB)model considers 13 age classes of cod from age 1 to 13,and 100% mortality occurs at the end of the age 13class for all cohorts. Following Pope’s approximation(Pope 1972), mortality processes were modelled as suc-cessive steps, i.e. removals of cod by harp seal preda-tion were taken instantaneously at the beginning ofthe year, fishing removals were taken instantaneouslyin the middle of the year, and residual mortality oc-curred between the 2 portions of the year (see Table 2,D9–D11). The NGSL cod fishery changed considerablyover the last decades, particularly after the 1994 mora-torium when the winter mobile fishery, dominated byotter trawlers, was closed (Fréchet et al. 2003a). To ac-count for changes in fishing patterns, 2 periods of dis-tinct fishery selectivity (partial recruitment) were con-sidered: 1984 to 1993 and 1994 to 2006. For consistency
281
1985 1990 1995 2000 2005
0
500
1000
1500
Years
Seal ab
und
ance (’0
00 ind
ivid
uals
)
0
50
100
150
200
250
300
Co
d S
SB
(’0
00 t
)Fig. 3. Pagophilus groenlandicus. Harp seal abundance (d)(means ± SD) derived from the model of Hammill & Stenson(2004) and cod spawning stock biomass (e) derived from vir-tual population analysis (MPO 2007) in the northern Gulf of
St. Lawrence during 1984 to 2006

Mar Ecol Prog Ser 379: 279–297, 2009
with available knowledge on NGSL cod dynamics andbecause of the convergence property of the virtualpopulation analysis (VPA), the initial population age-structure was based on cod abundances estimated in1984 from VPA (MPO 2007) and the model was run forthe period 1984 to 2006. The parameters and variablesused and the process and observation equations aregiven in Tables 1 & 2, respectively.
A condition-dependent reproduction function. Re-cruitment, i.e. fish numbers at age 1, was modelledthrough a Beverton & Holt (1957) stock-recruitmentrelationship based on an index of the reproductivepotential of cod that was developed from an estimate oftotal egg production of the stock (TEP) (Table 2, D3).TEP accounted for yearly changes in cod numbers-at-age, sex ratio-at-age, the proportion of mature fe-
282
Table 1. Parameters and variables used in the Seal IMpact on Cod ABundance (SIMCAB) model. NS: data not shown
Notation Definition Origin Value Equation
B Cod biomass (t) Calculated NS D1N Cod abundance (no. ind.) Calculated NS D1–D5, D9, D11–D12w Cod weight (t) Fixed NS D1–D2SSB Spawning stock biomass (t) Calculated NS D2TEP Total egg production (no. of eggs) Calculated NS D3, D8ξ Sex ratio Fixed NS D3φ Proportion of maturing females Fixed NS D1, D3f Fecundity (no. of eggs cod–1) Fixed NS D3A Last age-group Fixed 13 D3λ Functional responses of harp seals to cod Calculated Fig. 9 D4, D5
(no. consumed seal–1 year–1)ζ Attack rate (no. attacks seal–1 yr–1) Calculated NS D4ζref Reference attack rate (no. attacks seal–1 year–1) Calculated NS D4ρ Scaling factor of the attack rates Estimated 0.021 (0.003) D4Jmax Maximum cod consumption rate Calculated 996 D4
(no. consumed seal–1 year–1)m Shape parameter defining the functional Estimated 2.13 (0.015) D4
response typeρ Feeding time spent by seals in Gulf each year (d) Fixed 150 D5W⎯ t Cod mean weight for age groups targeted by seals (t) Calculated NS D5W⎯ 0 Cod mean weight for age groups targeted by seals in Calculated 288e-6 D5
1998 to 2001 (t)S Seal abundances (no. ind.) Fixed Fig. 3 D5M Residual natural mortality rate of cod (yr–1) Calculated Fig. 7 D6α Intercept of the M curve (yr–1) Estimated 5.03 (0.013) D6β Slope of the M curve Estimated 0.90 (0.002) D6ϑ Asymptote of the M curve (yr–1) Calculated NS D6F Fishing mortality rate of cod (yr–1) Estimated Fig. 7 D7ςc Partial recruitment of cod Calculated NS D7γ1
c Shape parameter of the partial recruitment (1984 to 1993) Estimated 1.95 (0.007) D7δ1
c Age at which 50% of the individuals are vulnerable Estimated 5.39 (0.006) D7to fishing gear (1984 to 1993)
γ2c Shape parameter of partial recruitment of cod (1994 to 2006) Estimated 1.64 (0.017) D7
δ2c Age at which 50% of the individuals are vulnerable to Estimated 6.46 (0.016) D7
fishing gear (1994 to 2006)R Cod recruitment (no. ind.) Calculated NS D8Rmax Maximum no. of cod recruits produced (no. ind.) Estimated 1.9e9 (6.9e6) D8r TEP needed to produce cod recruitment equal to Rmax/2 Estimated 5.3e11 (1.3e11) D8
(no. of eggs)N ’ Cod abundance in the middle of the year (no. ind.) Calculated NS D9–D10P No. of cod predated by the seals (no. ind.) Calculated NS D9C Fishery catch (no. ind.) Calculated Fig. 6 D10–D11, D14–D15I Abundance index (no. ind.) Calculated Fig. 5 D12ςs Survey selectivity Calculated NS D12q Survey catchability Estimated 1.38 (0.076) D12γs Shape parameter of the survey selectivity Estimated 2.99 (0.028) D12δs Age at which 50% of the individuals are vulnerable Estimated 2.72 (0.007) D12
to the survey gear (yr)pt,s Proportion of number in the survey (%) Calculated NS D13pt,c Proportion of catch (%) Calculated NS D15

Chassot et al.: Harp seal predation on cod
males-at-age, fecundity-at-age through length-at-ageand condition factor of the fish. Previous studies haveshown that length and condition factor have significanteffects on the fecundity of cod in the NGSL (Lambert &Dutil 2000, Lambert et al. 2000). This dependence offecundity on length and condition factor was used to
develop a generalized linear model to determine thevariation in the fecundity between 1984 and 2006(Lambert 2008).
Sex ratio and maturity ogive data were derived fromwinter surveys conducted with the MV ‘Gadus Atlan-tic’ (1984 to 1994) and spring samples available fromthe Groundfish Sentinel Fisheries Program (www.osl.gc.ca/pse/en/). Fulton’s condition factor (Fulton 1902)based on length and weight data was also obtainedfrom the winter surveys (1984 to 1994), the SentinelFisheries Program (1995 to 2007), and supplementaryresearch surveys conducted during the pre-spawningperiod in 1994, 1995, 1997, and 1998 (Dutil et al. 2003,Fréchet et al. 2007).
A multi-age functional response of harp seals tocod. To account for effects of prey abundance on pre-dation, assuming no predator interference in the pre-dation process, a multi-age functional response (FR),i.e. the number of cod consumed per seal per year, wasconsidered (Table 2, D4). The FR of seal to cod is com-prised of a maximum consumption rate for cod (Jmax),attack rates-at-age (ζa), and age-structured cod popu-lation. The shape parameter m of the FR determinesthe FR type, i.e. m = 1 corresponds to a hyperbolic type2 relationship and m > 1 corresponds to a sigmoidshaped type 3 response (Koen-Alonso 2006).
The attack rates, ζa, were expressed relative to base-line attack rates, ζ0
a, through a scaling factor, ρ, thatwas estimated in the fitting process (see section ‘Fittingthe model’). Baseline attack rates were derived fromcod biomass requirements for the NGSL harp seal pop-ulation, cod abundance based on the matrix of num-bers-at-age derived from virtual population analysis(MPO 2007), that was extended to ages 1 to 2 based onpreliminary runs of the model without predation, andproportion and age-structure of cod in the seal diet in1998 to 2001.
First, harp seal energetic requirements to maintainthe seal population were estimated based on the dailygross energy intake of an individual harp seal derivedfrom the allometric Kleiber equation that scales ani-mal’s metabolic rate to the 3/4 power of the animal’smass, and the age-structure of the seal population(Hammill & Stenson 2004, Stenson & Hammill 2004).25% of the northwest harp seal population was as-sumed to move into the Gulf of St. Lawrence each yearto spend on average 150 d yr–1 in its northern part(Stenson et al. 2002, 2003). The biomass of cod con-sumed in 1998 to 2001 was then estimated based onthe average energy content of cod in winter, set to4.96 kJ g–1 (Lambert & Dutil 1997a), and on the annualaverage proportion of cod in seal diets during Novem-ber to March 1998–2001 (Table 3). The relative ener-getic contribution of cod to seal diets was estimatedfrom recovered otoliths and accounted for harp seal
283
Table 2. Deterministic process and observation equations in the SIMCAB model. a: age; t: time
State moments
(D1)
(D2)
(D3)
Mortality components
(D4)
(D5)
(D6)
(D7)
Process functions
(D8)
(D9)
(D10)
(D11)
Observation functions
(D12)
(D13)
(D14)
(D15)p
C
Ca t c
a t
a ta
A, ,,
,
=
=∑
1
C Ct a ta
A
,==∑
1
pI
Ia t s
a t
a ta
A, ,,
,
=
=∑
1
I q Nat
a
A
a s a t a ssexp (, , ,= =
+ − −=∑
1
11
ς ςγ
withδδs )( )
N N C Ma t a t a t a t+ + = ′ −( ) −1 1 2, , , ,exp( / )
C N Fa t a t a t, , ,exp= ′ − −( )( )1
′ = −( ) −N N P Ma t a t a t a t, , , ,exp( / )2
RRrt
t
t
=+
−
−
max TEPTEP
1
1
F Faa t a c
kt a c
k
ck, , , exp (
= =+ − −
ς ςγ
with1
1 δδck )( )
Ma
a t t, exp= + −⎛⎝
⎞⎠ϑ α
β
PN
W
WS
a ta t a t
tt
,, ,=
⎛⎝⎜
⎞⎠⎟
λ
ρ
0365
λζ
ζζa t
a a tm
i i tm
i
J N
J N,max ,
max ,
=+∑ with aa a= ρζ0
TEPt a t a t a t a ta
A
N f, , , ,==∑ ξ φ
1
SSBt aa
A
a t a tw N , ,==∑
1
φ
B w Nt aa
A
a t,==∑
1
Mar Ecol Prog Ser 379: 279–297, 2009
population residency in the areas 4Ra-c, 4Rd-3Pn, and4S of the NGSL (Hammill & Stenson 2004). The annualnumber of cod consumed by harp seals was then esti-mated based on the mean mass of cod consumed andreallocated between cod age-groups using informationavailable from the analysis of seal stomach contents(Lawson et al. 1998, Hammill & Stenson 2004). Lengthsof ingested cod were estimated from otoliths found inseal stomachs and published fish length–otolith lengthregression equations (Hammill & Stenson 2004).Otoliths collected from stomach contents wereassumed to represent the size distribution of cod eaten.Fish lengths were based on 671 otoliths found in 140seal stomachs collected during November to March1989–2001 in the Gulf of St. Lawrence (Chassot et al.2007). Harp seal size ranged from 102 to 166 cm. Pro-portions were estimated by fitting a mixture model ofnormal distributions to the prey size-frequency histo-gram by applying a constraint on the variance of codsize derived from the DFO summer surveys (Chassot etal. 2007).
The maximum consumption rate, Jmax, was calculatedbased on the energy requirements of the NGSL harpseal population in 1998 to 2001, and a maximum valueof cod proportion in seal stomachs was derived fromavailable diet information. Following the same ap-proach as described above, fish biomass required tomaintain the NGSL seal population was first calculated.Based on a maximum proportion of 18.3% of cod in sealdiets observed since 1980 and the relative residencytime of seals in each area of the NGSL, the potentialmaximum number of cod eaten per seal per year, Jmax,was calculated. The baseline attack rates-at-age werefinally calculated from the number of cod-at-age con-sumed per seal, and cod numbers-at-age were derivedfrom the VPA in 1998 to 2001 (Table 2, D4). Since thebaseline attack rates were based on the number of codeaten calculated from the mean weight of cod in thereference period 1998 to 2001, the mass ratio W3t/W30, anindex of cod weight, was included to account for yearlyfluctuations in the mean mass of cod when calculatingthe number of cod predated by seals (Table 2, D5).
In order to illustrate the multi-age functional feedingresponse to changes in cod availability, a large rangeof levels of cod abundance were simulated for 2 dis-tinct age-structures of the cod population. For eachage-structure, cod-at-age consumed per seal per yearwere calculated based on the model fitting results.
Removals by natural mortality other than harp sealpredation. The rate of natural mortality excluding harpseal predation, i.e. residual mortality, was modelled asan age-dependent function in the form of a decreasingexponential as a function of age with a condition-dependent asymptote (Table 2, D6). The asymptotewas modelled as a decreasing linear function of codcondition based on results of laboratory experimentsrelating natural mortality to cod condition (Dutil &Lambert 2000, Chassot et al. 2007). The condition fac-tor, which is an indicator of the energy content of cod,was used here as an integrative index of environmen-tal conditions (Lambert & Dutil 1997b). Alternative val-ues for the asymptote of the residual mortality curve,i.e. a constant value of 0.4 yr–1, and a time-dependentnatural mortality derived from stock assessment mod-els (MPO 2007) were considered to assess the impacton the results through the Akaike Information Crite-rion (AIC; Akaike 1974).
Effects of seal predation vs. fishing on the repro-ductive potential. Because seal predation and fishingare mortality sources for different cod age groups, aunit of mortality of each does not have the same impacton the population. Similarly to a multi-fleet biomass-per-recruit analysis, effects of changes in harp sealpredation vs. fishing mortality were investigated bycalculating the spawning stock biomass per recruit(SSB/R) for different levels of mortality. Such an analy-sis focuses on the long-term survival of a recruit anddoes not consider the linkage between reproductivepotential and recruitment at age 1. Based on the mor-tality rates estimated and averaged over the period2002 to 2006 and assuming all else constant, we exam-ined the relative importance of seal predation mor-tality and fishing mortality on the long-term stockreproductive potential under 2 scenarios: a high pro-ductivity environment and a low productivity environ-ment. Considering a range of fishing mortality multi-pliers from 0 to 2, cod SSB/R was calculated atequilibrium for distinct levels of condition, because thecondition of cod was assumed to affect the asymptote ϑof the residual natural mortality in the model. Threelevels of seal predation mortality were considered, cor-responding to 0.5, 1, and 1.5 times the average harpseal predation mortality estimated for 2002 to 2006.Two scenarios of condition represented different envi-ronmental parameters for the cod population, with val-ues of ϑ = 0.26 and ϑ = 0.35 corresponding to a highand a low productivity regime scenario, respectively.
284
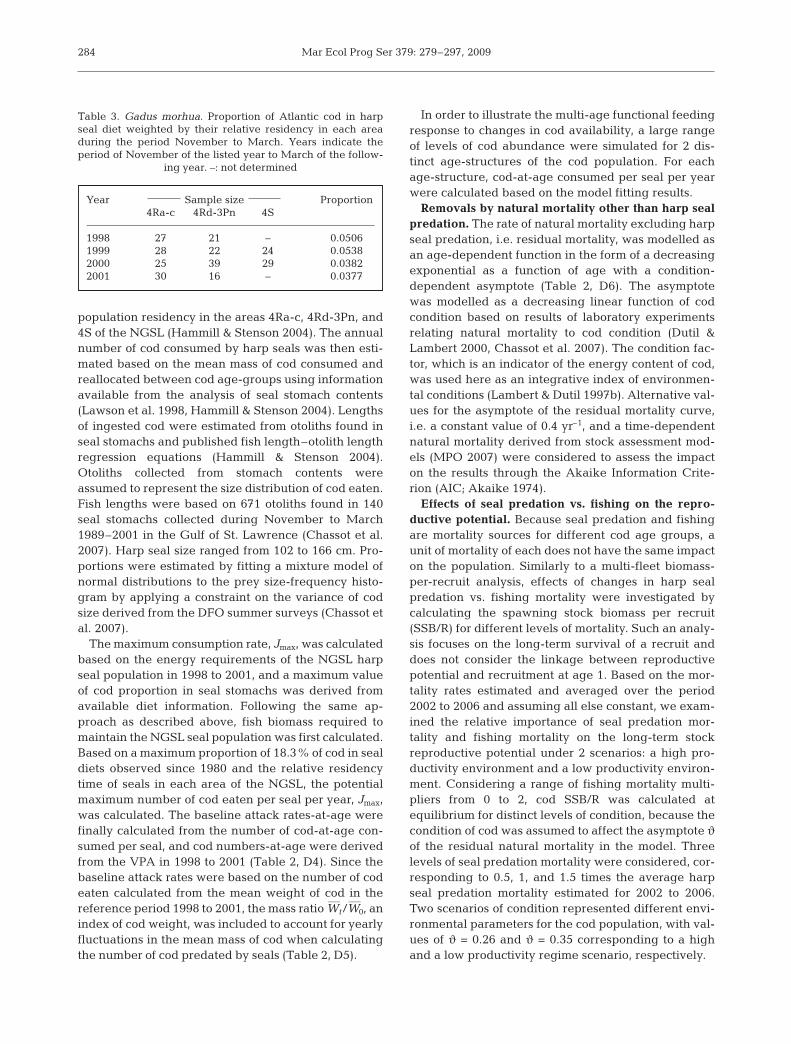
Table 3. Gadus morhua. Proportion of Atlantic cod in harpseal diet weighted by their relative residency in each areaduring the period November to March. Years indicate the period of November of the listed year to March of the follow-
ing year. –: not determined
Year Sample size Proportion4Ra-c 4Rd-3Pn 4S
1998 27 21 – 0.05061999 28 22 24 0.05382000 25 39 29 0.03822001 30 16 – 0.0377
Chassot et al.: Harp seal predation on cod
Fitting the model
Abundance and catch data. Stratified, random bot-tom trawl surveys have been conducted in the NGSLannually, in summer months, since 1984. A consistenttime series of numbers-at-age, accounting for thechanges in research vessels and fishing gear, wasused as abundance indices for cod for the period1984 to 2006 (Bourdages et al. 2003, 2007, Chassotet al. 2007).
The catch-at-age matrix of cod (total number ofindividuals) was obtained from the last updatedstock assessment carried out in February 2007(MPO 2007). All quantities caught and landed forboth commercial and recreational fisheries, ex-cluding discards, were included in the data. In thepresent analysis, reported landings were consid-ered as the ‘true’ catch despite potential discardingand misreporting in the fishery (Fréchet et al.2003b, Savenkoff et al. 2004).
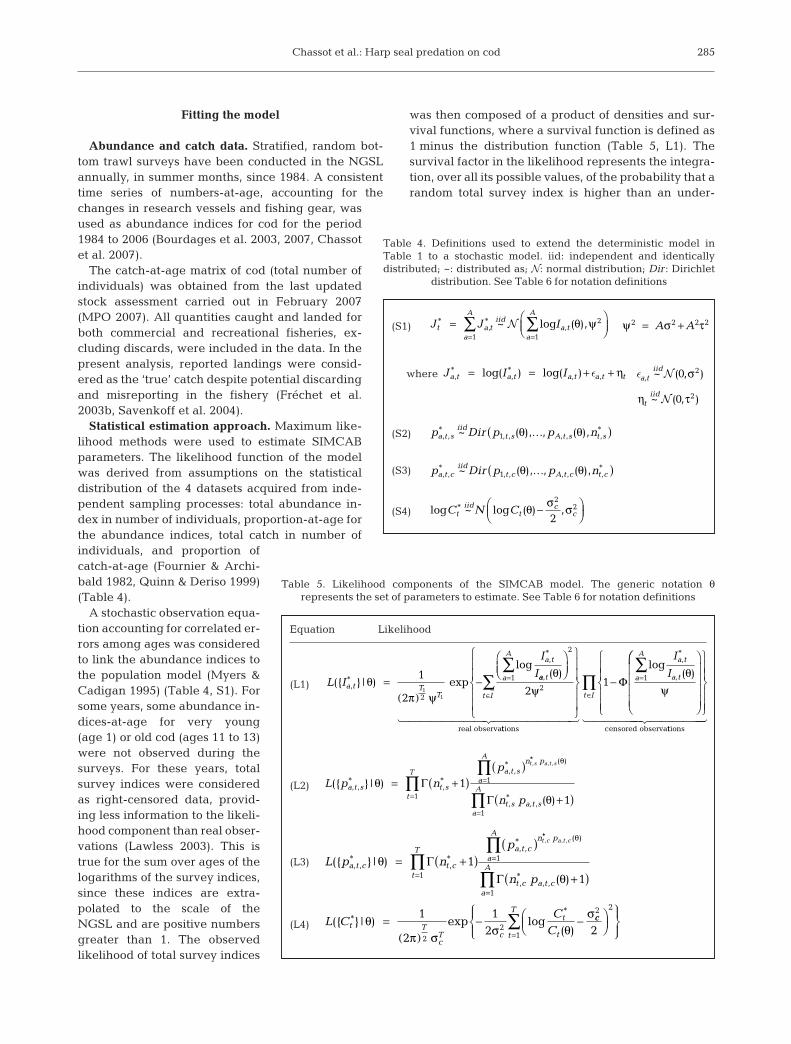
Statistical estimation approach. Maximum like-lihood methods were used to estimate SIMCABparameters. The likelihood function of the modelwas derived from assumptions on the statisticaldistribution of the 4 datasets acquired from inde-pendent sampling processes: total abundance in-dex in number of individuals, proportion-at-age forthe abundance indices, total catch in number ofindividuals, and proportion ofcatch-at-age (Fournier & Archi-bald 1982, Quinn & Deriso 1999)(Table 4).
A stochastic observation equa-tion accounting for correlated er-rors among ages was consideredto link the abundance indices tothe population model (Myers &Cadigan 1995) (Table 4, S1). Forsome years, some abundance in-dices-at-age for very young(age 1) or old cod (ages 11 to 13)were not observed during thesurveys. For these years, totalsurvey indices were consideredas right-censored data, provid-ing less information to the likeli-hood component than real obser-vations (Lawless 2003). This istrue for the sum over ages of thelogarithms of the survey indices,since these indices are extra-polated to the scale of theNGSL and are positive numbersgreater than 1. The observedlikelihood of total survey indices
was then composed of a product of densities and sur-vival functions, where a survival function is defined as1 minus the distribution function (Table 5, L1). Thesurvival factor in the likelihood represents the integra-tion, over all its possible values, of the probability that arandom total survey index is higher than an under-
285
Table 4. Definitions used to extend the deterministic model inTable 1 to a stochastic model. iid: independent and identically distributed; ~: distributed as; N: normal distribution; Dir : Dirichlet
distribution. See Table 6 for notation definitions
(S1)
where
(S2)
(S3)
(S4) log ~ log ( ) ,C N Ctiid
tc
c* θ σ σ−⎛
⎝⎜⎞⎠⎟
22
2
p Dir p p na t ciid
t c A t c t c, , , , , , ,~ ( ), , ( ),* *
1 θ θ…( )
p Dir p p na t siid
t s A t s t s, , , , , , ,~ ( ), , ( ),* *
1 θ θ…( )
η τtiid~ ( , )N 0 2
ε Na tiid
, ~ ( , )0 2σJ I Ia t a t a t a t t, , , ,( ) ( )* *= = + +log log ε η
ψ σ τ2 2 2 2= +A AJ J It a ta
Aiid
a
A
a t* * ~ log ( ),, ,= ⎛
⎝⎜⎞⎠⎟= =
∑ ∑1 1
2N θ ψ
Table 5. Likelihood components of the SIMCAB model. The generic notation θrepresents the set of parameters to estimate. See Table 6 for notation definitions
Equation Likelihood
(L1)
(L2)
(L3)
(L4) L CC
Ct T
cT c
t
t
({ } | ) exp log( )
*
*
θπ σ σ θ
σ=( )
− −1
2
12
22
cc
t
T 2 2
1 2⎛⎝⎜
⎞⎠⎟
⎧⎨⎪
⎩⎪
⎫⎬⎪
⎭⎪=∑
L p np
a t ct
T
t c
a t cnt c
({ } | ), , ,
, ,,
* *
*
θ = +( )( )
=∏Γ
1
1
**
*
p
a
A
a
A
t c a t c
a t c
n p
, , ( )
, , , ( )
θ
θ
=
=
∏
∏ +( )1
1
1Γ
L p np
a t st
T
t s
a t snt s
({ } | ), , ,
, ,,
* *
*
θ = +( )( )
=∏Γ
1
1
**
*
p
a
A
a
A
t s a t s
a t s
n p
, , ( )
, , , ( )
θ
θ
=
=
∏
∏ +( )1
1
1Γ
L I
I
Ia t T
T
a
Aa t
({ } | ) exp
log
,
,
*
*
θπ ψ
=( )
− =∑
1
21
12
1 aa t
t I
, ( )θψ
⎛⎝⎜
⎞⎠⎟
⎧
⎨
⎪⎪
⎩
⎪⎪
⎫
⎬
⎪⎪
⎭
⎪⎪
∈∑
2
22
real observattions� �������� ��������
1 1− =∑
Φlog
( ),
,a
Aa t
a t
I
I
*
θψ
⎛⎛
⎝
⎜⎜⎜⎜
⎞
⎠
⎟⎟⎟⎟
⎧
⎨⎪⎪
⎩⎪⎪
⎫
⎬⎪⎪
⎭⎪⎪
∈∏t I
censored observattions� ������ ������

Mar Ecol Prog Ser 379: 279–297, 2009
reported observation. It is a common way of includingpartial data information in a statistical analysis, butrarely used in fisheries analysis (for a notable exceptionsee Hammond & Trenkel 2005).
Proportion-at-age for the abundance indices andcatch data were assumed to follow Dirichlet distribu-tions to account for correlations among age groups(Fournier & Archibald 1982) (Table 4, S2 & S3). Totalcatch observed was considered mainly dependent onthe fishing year and assumed to include lognormalobservation errors (Table 4, S4). The assumption oflog-normal error distributions for survey and catchdata was checked through the residuals.
The maximum likelihood estimates were found byminimizing the negative sum of the log of the 4 likeli-hood components (i.e. objective function) given inTable 5. Minimizations were performed with theNelder–Mead simplex non-linear optimization algo-rithm implemented in the R package (R DevelopmentCore Team 2008). The parameter space θ to estimate in-cluded 37 parameters from 644 observations, an obser-vation being a survey index or catch number for a givenage group in a given year: 2 for the TEP-recruitment re-lationship (Rmax and r ), 2 for the FR (m and ρ), 2 for theresidual mortality curve (α and β), 1 for the survey catch-ability (q), 6 for the selectivity of survey and fishing gears(γs, δs, γ1
c, δ1c, γ2
c, δ2c), 23 for the fishing mortality rates (Ft),
and 1 for the standard deviation of the observation errorin the total survey data (ψ) (see Table 1 for definition).The value of the observation errorvariance in the total catch data (σ2
c)at the maximum liklihood estimatewas:
(1)
where the notations used are givenin Table 6.
Confidence statements about para-meters were inferred using paramet-ric bootstrap methods accounting forbias (Efron & Tibshirani 1998). Wegenerated 100 bootstrap replicatesamples with the same dimensions asthe datasets described above bydrawing from the probability distrib-utions characterised by the para-meters estimated at the maximumlikelihood. Replicate samples werethen submitted to the estimation pro-cedure to obtain bootstrap replicatesof the estimator and calculate per-centiles of the distribution.
Sensitivity analysis. To complete the bootstrapanalysis that only considered uncertainty in the catchand survey data, a sensitivity analysis was performedto account for uncertainty in some input parametersof the predation model and harp seal population inthe NGSL (Hammill & Stenson 2004, Stenson & Ham-mill 2004). In a first step, the sensitivity of the resultswas examined by independently increasing parame-ter values by 10% from a baseline value (values fromthe standard run), re-fitting the model to observa-tions for each sensitivity run, and assessing thechange between the new and baseline resultsthrough a measure of relative sensitivity (Mohn &Bowen 1996, Stenson & Hammill 2004). The sensitiv-ity to 5 parameters was investigated: the proportionof the northwest Atlantic population of harp sealsmoving into the NGSL, the average proportion of codin seal diets in 1998 to 2001, the maximum propor-tion of cod in seal diets, the average energy of cod,and the Kleiber multiplier used as a constant multi-plicative parameter in the Kleiber equation (Table 7).In order to summarize the model results and becausepredation by harp seals was the main focus of theanalysis, only results for mean cod biomass removedby seals and mean predation mortality rate for ages 1to 4 during 1984 to 2006 were presented. In a secondstep, the impacts of setting the value of the func-tional response type m to 1, i.e. a hyperbolic type 2relationship, were examined.
σct
tt
T
TCC
22
1
2 11
1log= + ⎛⎝⎜
⎞⎠⎟ −
⎛
⎝⎜⎜ =
∑*
286
Table 6. Parameters and variables used in the stochastic equations and likelihood components. a: age; t: year; s : survey; c : catch
Notation Definition Equation
I*a,t Observed abundance index L1J*a,t Log-observed abundance index T1 = Card (I
9) S1
T1 Number of uncensored data, with L1Φ Cumulative standard normal distribution L1ψ Standard deviation of the observation error in the survey data L1n*t,s Observed total number of fish taken by the survey vessels L2
p*a,t,s Observed proportion of number-at-age, with L2
pa,t,s Predicted proportion of number-at-age L2T Number of years L2–L4Γ Gamma distribution L2–L3p*a,t,c Observed proportion of catch-at-age L3pa,t,c Predicted proportion of catch-at-age L3n*t,c Total catch sampled to establish age-proportions L3C*t Observed total catch L4Ct Predicted total catch L4σc Standard deviation of the observation error in the catch data L4
pI
Ia t s
a t
a ta
A*
*
*, ,
,
,
=
=∑
1

Chassot et al.: Harp seal predation on cod
RESULTS
Age-structure of cod in seals’ diet
The size-frequency histogram showed that 95% ofcod found in harp seal stomachs were less than 38 cm inlength (Fig. 4). The mixture model fitted the cod size-frequency data well as indicated by the significancelevel for the goodness-of-fit test (p > 0.05), based on thechi-square approximation to the likelihood ratio statis-tic (Du 2002). The model showed that cod consumedwere young, with ages 1 to 4 representing 26.5, 48.5,18, and 7% of the cod in seal diets, respectively (Fig. 4).
Cod population dynamics
The model fitted the survey and catch data well andthe minimum value for the objective function was 6149.6,corresponding to an AIC value of 12 373 (Figs. 5 & 6). The
variances of the observation errors in thesurvey and catch data were low, the val-ues of ψ and σc used as proxies of coeffi-cients of variation in the case of log-normal likelihoods being 5.0 and2.7%, respectively. Consequently, con-fidence intervals around parametersestimated by bootstrap analysis weresmall (Table 1). Considering a constantasymptote of 0.4 yr–1 and a variable as-ymptote for the residual mortality curveled to higher values of AIC (12 583 and
12 696 respectively) than for a condition-dependentasymptote, indicating a better fit of the model whenresidual mortality was related to cod condition.
SIMCAB estimates indicated a strong decline in codabundance for all age groups from 1984 to 1993, con-sistent with the collapse of the northern Gulf cod stockin the mid-1990s (Fig. 5). Abundance indices for ages4 to 8 then remained quite stable from the mid-1990s tothe early 2000s, the stock showing no clear sign ofrecovery despite the moratoria on fishing implementedin 1994 to 1996 and 2003 (Fig. 5). By contrast, abun-dance indices for cod aged 10 to 13 displayed increas-ing trends from the mid-1990s to the 2000s; these age-groups represented a very small proportion of thestock abundance but about 10% of the SSB on averagefor the period 1984 to 2006 (Fig. 5). The declines intotal cod abundance were accompanied by a decreasein SSB from more than 330 000 t in the early 1980s to aminimum of less than 30 000 t in 1994 and showed asmall increase thereafter. SSB estimates were thus be-low the conservation biomass limit of 80 000 to 90 000 tand indicated a clear case of recruitment overfishingfor the stock.
The number of cod caught showed a strong decreasefrom the 1980s to the mid-1990s for ages 5 to 10 thatrepresent the large majority of the harvested biomass(Fig. 6). SIMCAB predictions appeared bumpy in the1980s, with catches underestimated in 1986 and 1988for all age-groups (Fig. 6). This mismatch betweenobserved and predicted catch seems mostly due to theexceptional and somewhat surprising abundance in-dices for ages 4 to 10 in 1987 (Fig. 5).
Mortality components in different age-groups
Total mortality divided into age-groups showed thatsources and magnitude of mortality varied in time andage (Fig. 7). Young cod aged 1 to 2 yr experienced highnatural mortality, varying between about 1.9 yr–1 in themid-1980s to more than 2.4 yr–1 in the mid-1990s(Fig. 7a). Predation mortality by harp seals only repre-sented a low proportion of mortality for ages 1 to
287
Cod length (cm)
Rela
tive f
req
uen
cy
0 10 20 30 40 50
0.00
0.01
0.02
0.03
0.04
0.05
0.06
0.07
Fig. 4. Gadus morhua. Size-frequency histogram of cod in-gested by harbor seals, derived from otoliths collected in sealstomachs, with fitted mixture distribution representing cod of
age 1 to 4 yr
Table 7. Relative sensitivity (%) of biomass removed (BR) by seals and predationmortality rate for cod aged 1 to 4 yr (Mp(1–4)) to a 10% increase in input para-
meters. NGSL: northern Gulf of St. Lawrence
Parameter Base value BR Mp(1–4)
% in the NGSL 25 67 129% cod contribution to diet 1998 to 2001 4.53 1 25 % cod maximum contribution to diet 18.3 –6 –2 Average energy content of cod (kJ g–1) 4.96 –13 40Kleiber multiplier (kJ) 293 67 129

Mar Ecol Prog Ser 379: 279–297, 2009
2 throughout the period 1984 to 2006 but increasedfrom about 6% in the 1980s to more than 12% in themid-2000s.
In addition to seal predation and residual natural mor-tality, cod aged 3 to 6 were subject to fishing mortality,mainly in the 1980s (Fig. 7b). The decrease in fishingmortality from the mid-1990s coincided with the changein fishing pattern, i.e. the commercial fishery after 1994was only conducted by fixed gears (longlines, gill nets,and hand lines) targeting larger cod. Residual natural
mortality showed an increase from the 1980s to the mid-1990s associated with lower condition during this period;the rates in the most recent years were similar to the lev-els estimated in the mid-1980s. Seal predation mortalityfor ages 3 to 6 remained quite stable during 1984–2006with its proportion in total mortality increasing to morethan 20% in the 2000s due to the decrease in fishing andresidual natural mortality.
Cod aged 7 to 10 not preyed upon by harp sealsshowed high total mortality, particularly in the mid-
288
Age 2 Age 3 Age 4
Age 5 Age 6 Age 7
Age 8 Age 9 Age 10
Age 11
1985
1.2
0.6
0
2
1
0
1.2
0.6
0
0.6
0.4
0.2
0
0.06
0.04
0.02
0
0.04
0.02
0
0.15
0
0.01
0.004
0
0.025
0.01
0
1
0
1.5
0
4
2
0
1995 2005
Age 12
1985 1995 2005
Age 13
1985 1995 2005
Co
d a
bu
nd
an
ce in
dic
es (x 1
08)
Fig. 5. Gadus morhua. Survey numbers-at-age observed (+) and predicted by the Seal IMpact on Cod ABundance (SIMCAB) model (solid line). Scales were selected for readability along y-axes

Chassot et al.: Harp seal predation on cod
1980s and early 1990s with rates higher than 1.0 yr–1
(Fig. 7c). The high interannual variability in mortalityrates was mainly due to the strong variations in fishingmortality that represented more than 65% of the totalmortality in some years (Fig. 7c). The low fishingmortality values estimated in 1986 and 1988 could bedue to the high abundance indices observed in 1987(Fig. 5). As for ages 3 to 6, residual natural mortalitywas the highest in the mid-1990s, corresponding to alow-condition period for cod. Although fishing mortal-ity rates showed a decreasing trend in the 2000s, thevalues remained high for some years relative to the lowabundance of the stock, particularly in 2005.
Harp seal predation
Predation mortality rates for cod aged 1 to 4showed a steady increase alongside the increase inharp seal abundance from 0.1 yr–1 in 1984 to morethan 0.3 yr–1 in 2000 (Fig. 8). The rates thendecreased to remain quite stable around 0.25 yr–1 inthe most recent years. Cod biomass removed annu-ally by seal predation was estimated to be around10 000 t from 1985 to 1995. Removals then showed anincreasing trend with a peak above 30 000 t in 2000and a temporally averaged median of 16 000 t in the2000s. The high interannual variability in biomass
289
Age 3 Age 4 Age 5
Age 6 Age 7 Age 8
Age 9 Age 10 Age 11
Age 12
1985
0.04
0.02
0
0.4
0.2
0
1.2
0.6
0
0.15
0.05
0
2
1
0
??
0
0.4
0
0.08
0.04
0
0.025
0.01
0
0.25
0.1
0
1
0
1995 2005
Age 13
1985 1995 2005
Catc
h n
um
bers
(x 1
07)
Fig. 6. Gadus morhua. Catch-at-age observed (+) and predictedby the SIMCAB model (solidline). Scales were selected for
readability along y-axes

Mar Ecol Prog Ser 379: 279–297, 2009
removed was mainly due to the variations in abun-dance of cod aged 1 to 2 that represent the majorage-groups preyed upon by harp seals.
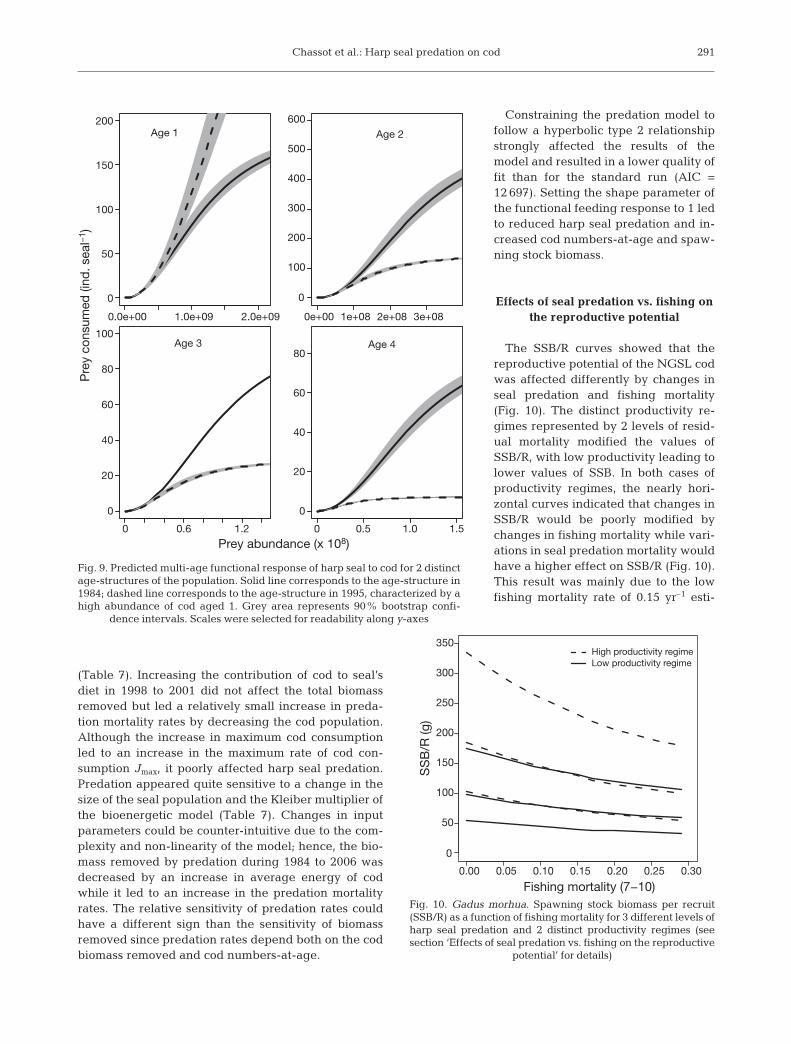
The exponent of the multi-age functional responsefitted to the data was estimated to be 2.13 (± 0.015),indicating a sigmoid shaped type 3 response character-istic of sharp changes in the relative importance of thecod age-groups consumed as the result of a relativelysmall change in their availability in the environment.The changes in biomass removed by seal predationwere then related to both changes in seal populationenergy requirements and changes in relative codabundance between age-groups. For instance, the pre-dicted multi-age functional response showed that codage 2 would be the main target of harp seals when con-sidering different levels of cod abundance describedby the 1984 population age-structure (Fig. 9). Consid-ering an age-structure similar to low abundance yearof 1995, characterized by a high proportion of cod aged1 in the population, would lead to a very differentresponse of seals with age-1 cod becoming the majorprey and the other age-groups quickly reaching theirrespective maximum in seal consumption (Fig. 9).
Sensitivity analysis
The sensitivity analysis showed that the results of themodel concerning harp seal predation were robust tothe assumptions made about the average energy of codand the values of contribution of cod to seal’s diet
290
Mo
rtalit
y r
ate
(yr−
1)
0.0
0.5
1.0
1.5
2.0
2.5
3.0
a Ages 1−2
1984 1988 1988 19882001 2001 20011992 1997 2005
0.0
0.5
1.0
1.5b Ages 3−6
1984 1992 1997 2005
Year
0.0
0.5
1.0
1.5
1984 1992 1997 2005
c Ages 7−10
Fig. 7. Gadus morhua. Cumulative annual mortality rates for cod (a) aged 1 to 2, (b) aged 3 to 6, and (c) aged 7 to 10. Dark grey:seal predation mortality; light grey: natural mortality other than by seal predation; white: fishing mortality. Scales were selected
for readability along y-axes
1985 1990 1995 2000 2005
0.0
0.1
0.2
0.3
Years
Pre
datio
n m
ort
alit
y r
ate
(yr−
1)
Fig. 8. Gadus morhua. Annual seal predation mortality ratefor cod aged 1 to 4, with 90% bootstrap confidence intervals
Chassot et al.: Harp seal predation on cod
(Table 7). Increasing the contribution of cod to seal’sdiet in 1998 to 2001 did not affect the total biomassremoved but led a relatively small increase in preda-tion mortality rates by decreasing the cod population.Although the increase in maximum cod consumptionled to an increase in the maximum rate of cod con-sumption Jmax, it poorly affected harp seal predation.Predation appeared quite sensitive to a change in thesize of the seal population and the Kleiber multiplier ofthe bioenergetic model (Table 7). Changes in inputparameters could be counter-intuitive due to the com-plexity and non-linearity of the model; hence, the bio-mass removed by predation during 1984 to 2006 wasdecreased by an increase in average energy of codwhile it led to an increase in the predation mortalityrates. The relative sensitivity of predation rates couldhave a different sign than the sensitivity of biomassremoved since predation rates depend both on the codbiomass removed and cod numbers-at-age.
Constraining the predation model tofollow a hyperbolic type 2 relationshipstrongly affected the results of themodel and resulted in a lower quality offit than for the standard run (AIC =12 697). Setting the shape parameter ofthe functional feeding response to 1 ledto reduced harp seal predation and in-creased cod numbers-at-age and spaw-ning stock biomass.
Effects of seal predation vs. fishing on the reproductive potential
The SSB/R curves showed that thereproductive potential of the NGSL codwas affected differently by changes inseal predation and fishing mortality(Fig. 10). The distinct productivity re-gimes represented by 2 levels of resid-ual mortality modified the values ofSSB/R, with low productivity leading tolower values of SSB. In both cases ofproductivity regimes, the nearly hori-zontal curves indicated that changes inSSB/R would be poorly modified bychanges in fishing mortality while vari-ations in seal predation mortality wouldhave a higher effect on SSB/R (Fig. 10).This result was mainly due to the lowfishing mortality rate of 0.15 yr–1 esti-
291
0.0e+00 1.0e+09 2.0e+09
Age 1
0e+00 1e+08 2e+08 3e+08
0
100
200
300
400
500
600
Age 2
100
80
60
40
20
0
200
150
100
50
0
80
60
40
20
0
Age 3
0 0.6 1.2 0 0.5 1.0 1.5
Age 4
Prey abundance (x 108)
Pre
y c
on
su
med
(in
d.
seal−
1)
0.00 0.05 0.10 0.15 0.20 0.25 0.30
0
50
100
150
200
250
300
350
Fishing mortality (7−10)
SS
B/R
(g
)
High productivity regime
Low productivity regime
Fig. 10. Gadus morhua. Spawning stock biomass per recruit(SSB/R) as a function of fishing mortality for 3 different levels ofharp seal predation and 2 distinct productivity regimes (seesection ‘Effects of seal predation vs. fishing on the reproductive
potential’ for details)
Fig. 9. Predicted multi-age functional response of harp seal to cod for 2 distinctage-structures of the population. Solid line corresponds to the age-structure in1984; dashed line corresponds to the age-structure in 1995, characterized by ahigh abundance of cod aged 1. Grey area represents 90% bootstrap confi-
dence intervals. Scales were selected for readability along y-axes

Mar Ecol Prog Ser 379: 279–297, 2009
mated during 2002 to 2006. Considering the harp sealpredation mortality estimated in 2002 to 2006 and alow residual mortality (i.e. a high productivity regime),the SSB/R was estimated to be equal to 129 g (Fig. 10,intermediate dashed line curve). In this case and for afishing mortality fixed at the level of 2000 to 2006, adecrease in the predation mortality rate from the meanvalue of 0.26 yr–1 in 2000 to 2006 to a level around0.13 yr–1 observed in the mid-1980s would allow almostdoubling the SSB/R (Fig. 10, upper dashed line curve).Changes in fishing mortality assuming constant preda-tion mortality would be less beneficial to the SSB, adecrease from the fishing mortality rate of 0.15 yr–1 in2002–2006 to a low rate of 0.03 yr–1 increasing the SSBfrom 129 g to 171 g per recruit. Considering a low pro-ductivity regime strongly decreased the SSB/R thatwas estimated to be 73 g in 2000 to 2006, due to thehigher residual mortality decreasing the probability ofyoung cod to reach maturity (Fig. 10, intermediatesolid line curve). In this case, the SSB/R for a predationmortality of 0.13 yr–1 and constant fishing mortalitywould only be 131 g (Fig. 10, upper solid line curve).For the 2002 to 2006 predation mortality, a decrease infishing mortality would slowly increase the SSB/R to amaximum of 97 g in the situation of a moratorium.
DISCUSSION
The SIMCAB statistical catch-at-age model was de-veloped to assess the effects of predation by thenorthwest Atlantic harp seal population on NGSL codby estimating the relative importance of differentsources of mortality that affected the stock during aperiod of collapse and non-recovery. SIMCAB is aconsistent modeling framework which combines theeffects of fishing, predation mortality and environ-ment (through the condition index) on cod populationdynamics. SIMCAB showed that the increase in harpseal abundance during 1984–2006 resulted in anincrease in predation mortality for cod age-groupstargeted by seals. Despite the increasing importanceof harp seal predation in cod mortality, the collapse ofthe NGSL cod stock appears mainly due to the combi-nation of high fishing mortality rates and poor envi-ronmental conditions that affected the productivity ofthe population in the early to mid-1990s and led to thecurrent state of recruitment overfishing. SIMCABresults also show, however, that current levels of pre-dation mortality could increase stock rebuilding timeby decreasing the probability of fish to reach maturity.Although cod condition has improved in recent years,the current lack of recovery of the NGSL cod seemsdue mainly to the very low spawner biomass, drivenboth by the fishery inherently targeting larger fish
and increased harp seal predation. Within an ecosys-tem perspective, management scenarios based on adecline in seal population to promote stock rebuildingshould however consider environmental conditions,prey availability for seals and other cod predators ofthe NGSL that all affect cod productivity and mightgive rise to unexpected outcomes with a decline inseal abundance.
Multispecies modeling and functional response
Separating the sources of mortality affecting animalpopulations is a major issue in ecology and has a longhistory in fisheries science (Andersen & Ursin 1977).This is particularly important in the context of multi-species management as predator control has been pro-posed for some time as a beneficial tool for fisheries(Flaaten 1988, FRCC 1999). Multispecies models areuseful tools to address the issues raised about theeffects of marine mammals on fisheries (Yodzis 1998).In particular, predator-prey models have been used toevaluate the effects of fur seal Arctocephalus pusilluspusillus predation on hakes Merluccius capensis andMerluccius paradoxus in the Benguela system (Punt &Butterworth 1995) and more recently the effects ofnorthwest Atlantic grey seal Halichoerus grypus pre-dation on cod population dynamics and causes of col-lapse and non recovery on the eastern Scotian shelf(ESS) have been explored (Mohn & Bowen 1996, Fu etal. 2001, Trzcinski et al. 2006). In the Benguela system,modeling the biological interaction between cape furseals and the cape hakes suggested that an initialreduction in seal numbers would be beneficial, but theresulting decrease in seal consumption would alsoresult in increased predation by a less commerciallyimportant hake species M. capensis on the more com-mercially important hake M. paradoxus, resulting inlittle net benefit (Punt & Butterworth 1995). Amongnorthwest Atlantic grey seals, the first modelingapproach included predation mortality explicitly incohort analysis and showed that grey seals had littleeffect on the collapse of cod on the ESS (Mohn &Bowen 1996). By contrast, more recent analyses sug-gested that increasing predation mortality since the1990s could affect the survival of immature cod andcontribute to the failure of the ESS and southern Gulfof St. Lawrence cod stocks to recover (Fu et al. 2001,Chouinard et al. 2005, Trzcinski et al. 2006).
The SIMCAB model is an age-structured populationdynamics model structurally similar to the models usedfor grey seals on the ESS but it differs in several im-portant points. A major difference with the modelsfrom Mohn & Bowen (1996) and Fu et al. (2001) butaddressed by Trzcinski et al. (2006) concerns the link-
292

Chassot et al.: Harp seal predation on cod
age between cod abundance and seal consumptionthrough the functional feeding response. The form ofthe FR is a key issue in multispecies modeling, espe-cially at low abundance, because it defines how preda-tors impact their prey as a function of prey abundance(Yodzis 1994, Mackinson et al. 2003). Most multi-species models such as the Multi-Species Virtual Pop-ulation Analysis (MSVPA; Magnússon 1995) are basedon hyperbolic type 2 functional relationships betweenprey abundance and predation rates (for a review seePláganyi 2007). These models assume constant rationformulations where per-capita consumption is setequal to the predator’s required daily ration, consistentwith the interpretation that feeding selectivities areindependent of prey abundance. A sigmoidal func-tional response is however likely more appropriatewhen modeling generalist predators (Magnússon &Pálsson 1991) and recent analyses based on field datatend to support a type 3 relationship (Middlemas et al.2006, Kempf et al. 2008). In Ecopath with Ecosim mod-els (Walters et al. 1997), the functional form of inter-actions is based on the ‘foraging arena’ concept thatallows exploring alternative forms of functional res-ponse but biological and ecological justifications aboutthis concept remain controversial (Pláganyi 2007).
In the present analysis, cod age-groups were consid-ered distinct prey, consistently with the opportunisticbehaviour of harp seals (Hammill & Stenson 2000) andthe size-based structure of marine food webs that reg-ulates predation processes (e.g. Shin & Cury 2004).The multi-age FR fitted to the data was a sigmoidshaped type 3 response, suggesting that the responseof seals to changes in cod abundance might be com-plex and highly non-linear, due to predator prefer-ences and potential for prey switching as a function ofthe relative abundance of prey types in the environ-ment. A sigmoidal shape for the FR would be con-sistent with the available knowledge on the spatio-temporal and vertical distribution of cod that differsbetween cod age-groups, juvenile cod being generallyfound in shallower waters and closer to the shore thanadult cod (e.g. Castonguay et al. 1999). Based on sur-vey conducted on board the MV ‘Gadus Atlantica’ inwinter from 1978 to 1994, young cod age-groups havebeen shown to occupy different depths and areas inthe NGSL (DFO unpublished data), which could favorthe emergence of a type 3 FR. Cod migration and dis-tribution patterns might also change in time in relationto changes in environmental conditions affecting theirhabitat (Castonguay et al. 1999).
The sensitivity analysis showed that a type 2 FRwould be less consistent with both the data and out-puts from other predation models (Hammill & Stenson2004, Duplisea & Hammill 2006). Although cod preda-tion removals were of the same order of magnitude as
those found with models based on linear assumptionsabout seal consumption (Hammill & Stenson 2004,Duplisea & Hammill 2006), the use of a FR led to differ-ent conclusions by accounting for changes in cod age-groups abundance in time. Our results are consistentwith Middlemas et al. (2006) who provided empiricalsupport for a type 3 FR of seals to Atlantic salmon in anestuarine system in Scotland; however, in a multi-species or multi-age context, the interpretation of theFR type is not straightforward as the changes in alter-native prey abundance influence the response of thepredator to the availability of any prey (Smout & Lind-strøm 2007). This will be important for harp seals whohave been shown to show strong preference for pe-lagic species such as capelin Mallotus villosus but areneutrally selective towards cod (Lawson et al. 1998).Attempts to estimate statistical parameters of a FRhave revealed the difficulty of relating microscaleobservations of stomach contents to the effective feed-ing responses of marine species at the macroscale (Plá-ganyi 2007). This is further complicated in the case ofharp seal because biomass estimates of important al-ternative prey such as capelin, sandlance Ammodytessp., Arctic cod Boreogadus saida and krill Euphausiasp. are not available for the NGSL. New data collec-tion, experiments, and analyses such as conducted byKempf et al. (2008) may help clarify harp seal sig-moidal feeding behaviour since modeling such non-linear processes is key to explore the potential impactof management scenarios based on a decline in sealpopulation.
Cod population dynamics
Despite major differences with the current methodused to assess the cod stock status (e.g. no commercialdata included in the analysis), SIMCAB estimates ofcod abundance, fishing mortality, and SSB accordedwith the last assessment of the northern Gulf cod (MPO2007). Results were consistent with the collapse of thestock in the late 1980s and the current lack of recovery(MPO 2007). In the present analysis, cod abundance inthe initial year 1984 was based on the numbers-at-ageprovided by VPA results, considering that the conver-gence property of this method would give reliable esti-mates of abundance in the past. Setting the initial codnumbers helped in the estimation of the parameterslinking cod abundance to survey abundance indices,i.e. catchability and selectivity. Although a statistically‘optimal’ solution was obtained through the fitting pro-cess, the information provided to the model was insuf-ficient to distinguish between the level of residual mor-tality and magnitude of recruitment at age 1, i.e. therecould be a correlation between the maximum recruit-
293

Mar Ecol Prog Ser 379: 279–297, 2009
ment (Rmax) and the residual mortality parameters (αand β). Such a correlation could affect the absolute val-ues of residual mortality at age 1 but would not modifythe model results for the other cod age-groups forwhich information is provided through survey data.
A novel aspect of our cod population model is astock-recruitment relationship based on egg produc-tion, which for cod is considered a better measure ofthe true reproductive potential of the stock than spaw-ning biomass (Marshall et al. 2006). The high interan-nual variations in abundance indices for cod aged 1 to2 yr included both natural survival variability of codlarvae and juveniles, and sampling noise associatedwith the research vessel gear that does not well selectvery small cod (<15 cm) predated by seals. In the con-text of trophic interactions where small fish form thebulk of the diet of many predators, collecting data onfish larvae and juveniles abundance appears as a keyissue to explain the factors driving prerecruit survivaland recruitment.
In addition, total egg production in our model wasderived from a statistical model that related egg pro-duction to length-at-maturity and condition of maturefemales (Lambert 2008). Hence, recruitment in themodel accounted for changes in growth of cod thatcould be density and/or temperature dependent(Swain et al. 2003), as well as changes in environmentthat could affect egg productivity through cod condi-tion. Natural mortality other than harp seal predationwas assumed to be age- and condition-dependentbased on a comparative analysis between laboratoryfeeding experiments and wild cod collected in the Gulfof St. Lawrence in the 1990s (Lambert & Dutil 1997a).The residual natural mortality term for old ages wasconsistent with temporal patterns estimated with vir-tual population analysis (Grégoire & Fréchet 2005).Accounting for effects of condition on residual mortal-ity led to a better fit of the model and suggested thatthe decline in the condition and energy reserves of codduring the 1990s may have lowered the productivity ofthe stock and contributed to its collapse (Lambert &Dutil 1997a).
In contrast to the VPA, SIMCAB allows the separa-tion of seal predation mortality from fishing mortalityand other mortality through time and accounts forenvironmental influences on mortality and cod fecun-dity. Modeling the mechanistic processes involved inpredation is a valuable alternative to the classic as-sumption of constant natural mortality rates to includesome ecosystem components in stock assessmentmethods (e.g. Lindstrøm et al. 2002) and progressivelymove toward ecosystem-based fishery management(Pikitch et al. 2004). This seems particularly critical forconducting stock projections to evaluate the expectedeffects of fishery management rules (e.g. Hollowed et
al. 2000) in a context where predation is suspected todelay the NGSL cod stock recovery.
Cod recovery within an ecosystem perspective
The impact of changes in predation and fishing mor-tality on the SSB/R was assessed for different values ofresidual natural mortality assumed here to representdifferent environmental conditions. Diagnostics abouta decline in seal predation were then shown to bedependent on the productivity of the stock related tothe environment (Dutil et al. 2003). Residual mortalityaffecting young cod was shown to be more importantthan harp seal predation but not explicitly modelled inthe present analysis. Predation mortality has beenshown to be the dominant source of mortality for smallcod (≤35 cm) in the 1990s and 2000s, representingabout 95% of total mortality (Savenkoff et al. 2006). Inthe NGSL, small cod have been shown to be preyedupon by large cod through cannibalism, other largedemersals (e.g. white hake Urophycis tenuis), greyseals and boreal cetaceans including mysticetes suchas minke whale Balaenoptera acutorostrata and odon-tocetes such as white-beaked dolphins Lagenorhyn-chus albirostris (Morissette et al. 2006, Savenkoff et al.2004, 2006, 2007). While cannibalism decreased in thelast decades due to the decline in adult stock biomass,it still represented an important component of mortal-ity for small cod in the early 2000s (Savenkoff et al.2007). A high proportion of the total mortality of codaged 3 to 10 yr was also not explained by harp seal pre-dation or fishing and attributed to residual mortality.This residual mortality includes both a predation mor-tality component due to large cod predators such asgrey seals and another mortality component that couldinvolve starvation, disease, and parasites (Savenkoff etal. 2004, 2006). In SIMCAB, mortality linked to theselatter factors was related to cod condition through theasymptote of residual mortality, assuming that fish inbad condition would have little energy reserves to sur-vive over the winter months or critical stages of theirlife cycle (Lambert & Dutil 1997a, Dutil et al. 1999).
Based on the large database of cod stomachs col-lected by Fisheries and Oceans Canada during numer-ous research and commercial fishing-vessel surveyssince the mid-1980s, modelling explicitly cannibalismwithin SIMCAB could help separating the componentsof residual mortality for small cod. Following the one-way interaction modelled between harp seal and cod,predation by other species than harp seals such as greyseals could also be included in the model if suitabledata are available. The use of ecosystem models suchas mass-balanced and end-to-end models (Travers etal. 2007) in complement to SIMCAB would allow to
294

Chassot et al.: Harp seal predation on cod
represent the full complexity of the food web, to iden-tify the major factors affecting cod mortality, to includebottom-up effects of prey availability on productionand mortality, and eventually to compare simulationoutputs for assessing the robustness of the results.
Long-term projections based on the SSB/R analysisdid not consider issues of recruitment in a contextwhere the low reproductive potential of the stock asso-ciated with a low productivity are major factors ex-plaining its lack of recovery (Dutil et al. 2003, Sheltonet al. 2006). Projections performed with SIMCAB toestimate recovery time should also account for theeffects of condition on recruitment (Lambert et al.2000, Marteinsdottir & Begg 2002) and growth (Dutil etal. 1999) that would also modify the response of the codpopulation to the implementation of managementrules based on a decline in seal population. Consider-ing alternative projection scenarios based on differentharvest control rules for the commercial cod fisheryand different environmental regimes is important todetermine the utility of managing seals to increase therecovery rate of the NGSL cod population.
CONCLUSION
The main objectives of this study were to examinethe relative impacts of fishing, environmental condi-tions and seal predation on the decline and recovery ofthe NGSL cod population within a consistent modelingframework. Within this framework harp seals couldplay an important role in the recovery of NGSL cod.This framework lends itself to adding additional com-ponents which might result in different conclusions.For example, harp seals are generalist predators andtheir impact will be affected by the availability of alter-native prey. Elsewhere it has been shown that incorpo-rating even only a few other prey alternatives mayresult in different and unexpected outcomes (Punt &Butterworth 1995, Morissette et al. 2006, Matthiopou-los et al. 2007). Therefore, although harp seals mayhave an important impact on recovery of NGSL codpopulation, efforts to manage seals with this objectivein mind may not achieve the expected outcomesbecause of other components within the NGSL marineecosystem.
Acknowledgements. We are grateful to P. Carter, S. Turgeon,D. McKinnon, W. Penney, B. Stockwood, D. Wakeham, andH. Bourdages for providing data on seal diet and cod abun-dance indices. K. Trzcinski and B. Mohn made useful sugges-tions on the modeling approach, M.-N. Bourassa and J.F. Gos-selin helped in map drawing. The work benefited fromdiscussions with A. Fréchet, P. Schwab, J. Gautier, and M.Koen-Alonso. Comments by 3 anonymous referees greatlyhelped to improve and to clarify the manuscript. This work wasfinanced by DFO’s species at risk funding program (SARCEP).
LITERATURE CITED
Akaike H (1974) A new look at the statistical model identifica-tion. IEEE Trans Automat Contr 19:716–723
Andersen KP, Ursin E (1977) A multispecies extension to theBeverton and Holt theory of fishing, with accounts ofphosphorus circulation and primary production. MeddDan Fisk-Havunders NS Vol 7:319–435
Beverton RJH, Holt SJ (1957) On the dynamics of exploitedfish populations. Fisheries investigations series 2. UK Min-istry of Agriculture, Fisheries and Food, London
Bourdages H, Archambault D, Morin B, Fréchet A, Savard L,Grégoire F, Bérubé M (2003) Preliminary results from thegroundfish and shrimp multidisciplinary survey from Au-gust 2003 in the northern Gulf of St. Lawrence. DFO CanSci Advis Sec Res Doc 2003/078. Department of Fisheriesand Oceans Canada, Ottawa
Bourdages H, Savard L, Archambault D, Valois S (2007)Résultats de l’expérience de la pêche comparative d’août2004 et 2005 dans le nord du golfe Saint-Laurent, entre leNGCC Alfred Needler et le NGCC Teleost. Rapp tech cansci halieut aquat, 2750, Ministère des Pêches et desOcéans, Ottawa
Bundy A (2001) Fishing on ecosystems: the interplay of fish-ing and predation in Newfoundland-Labrador. Can J FishAquat Sci 58:1153–1157
Castonguay M, Rollet C, Fréchet A, Gagnon P, Gilbert D,Brêthes JC (1999) Distribution changes of Atlantic cod(Gadus morhua L.) in the northern Gulf of St Lawrence inrelation to an oceanic cooling. ICES J Mar Sci 56:333–344
Chassot E, Caskenette A, Duplisea DE, Hammill MO, Bour-dages H, Lambert Y, Stenson GB (2007) A model of preda-tion by harp seals (Phoca groenlandica) on the northernGulf of St. Lawrence stock of Atlantic cod (Gadus mor-hua). DFO Can Sci Advis Sec Res Doc 2007/066. Depart-ment of Fisheries and Oceans, Ottawa
Chouinard GA, Swain DP, Hammill MO, Poirier GA (2005)Covariation between grey seal (Halichoerus grypus)abundance and natural mortality of cod (Gadus morhua)in the southern Gulf of St. Lawrence. Can J Fish Aquat Sci62:1991–2000
Stenson GB, Hammill MO, Lawson JW (1997) Predation byharp seals in Atlantic Canada: preliminary consumptionestimates for Arctic cod, capelin and Atlantic cod.J Northw Atl Fish Sci 22:137–154
DFO (2003) Proceedings of the zonal assessment meeting —Atlantic cod. DFO Can Sci Advis Sec Proceed Ser 2003/ 021
Du J (2002) Combined algorithms for constrained estimationof finite mixture distributions with grouped data and con-ditional data. MS thesis McMaster University
Duplisea DE, Hammill MO (2006) An approach to modellingthe influence of harp seal (Phoca groenlandica) predationon decline and recovery of the Northern Gulf of St. Law-rence cod (Gadus morhua). International Council for theExploration of the Sea, ICES CM 2006/L: 02
Dutil JD, Lambert Y (2000) Natural mortality from poor condi-tion in Atlantic cod (Gadus morhua). Can J Fish Aquat Sci57:826–836
Dutil JD, Castonguay M, Gilbert D, Gascon D (1999) Growth,condition, and environmental relationships in Atlantic cod(Gadus morhua) in the northern Gulf of St. Lawrence andimplications for management strategies in the NorthwestAtlantic. Can J Fish Aquat Sci 56:1818–1831
Dutil JD, Gauthier J, Lambert Y, Fréchet A, Chabot D (2003)Cod stocks rebuilding and fish bioenergetics: low produc-tivity hypothesis. DFO Can Sci Advis Sec Res Doc 2003/060.Department of Fisheries and Oceans, Ottawa
295

Mar Ecol Prog Ser 379: 279–297, 2009
Efron B, Tibshirani RJ (1998). An introduction to the Boot-strap. Chapman & Hall, London
Flaaten O (1988) The economics of multispecies harvesting.Springer Verlag, Berlin
Fournier D, Archibald CP (1982) A general theory for ana-lyzing catch at age data. Can J Fish Aquat Sci 39:1195–1207
FRCC (1999) Conservation requirements for the Gulf ofSt. Lawrence groundfish stocks and cod stocks in divisions2GH and 3Ps and science priorities. Report to the Ministerof Fisheries and Oceans. FRCC.99.R.1, April 1999 Fish-eries Resource Conservation Council, Ottawa
Fréchet A, Gauthier J, Schwab P, Bourdages H and others(2003a) The status of cod in the Northern Gulf of St. Law-rence (3Pn, 4RS) in 2002. DFO Can Sci Advis Sec Res Doc2003/065. Department of Fisheries and Oceans, Ottawa
Fréchet A, Butler R, Hussey E, Kennedy J, Rose G (2003b)Quality at landing in relation to gears used in the 3Pn, 4Rcod fishery, 2000–2002. DFO Can Sci Advis Sec Res Doc2003/066. Ministère des Pêches et des Océans, Ottawa
Fréchet A, Gauthier J, Schwab P, Bourdages H and others(2007) The status of cod in the Northern Gulf of St. Lawrence(3Pn, 4RS) in 2006. DFO Can Sci Advis Sec Res Doc2007/068. Department of Fisheries and Oceans, Ottawa
Fu C, Mohn R, Fanning LP (2001) Why the Atlantic cod(Gadus morhua) stock off eastern Nova Scotia has notrecovered. Can J Fish Aquat Sci 58:1613–1623
Fulton T (1902) Rate of growth of seas fishes. Sci Invest FishDiv of Scotland 20:1035–1039
Grégoire F, Fréchet A (2005) Calculation of northern Gulf ofSt. Lawrence cod (Gadus morhua) natural mortality for the1990 to 2004 period. DFO Can Sci Advis Sec Res Doc2005/019. Department of Fisheries and Oceans, Ottawa
Hammill MO, Stenson GB (2000) Estimated prey consumptionby harp seals (Phoca groenlandica), hooded seals (Cys-tophora cristata), grey seals (Halichoerus grypus) and har-bour seals (Phoca vitulina) in Atlantic Canada. J North-west Atl Fish Sci 26:1–23
Hammill MO, Stenson GB (2004) Estimated consumption of At-lantic cod (Gadus morhua) by harp seals (Phoca groen-landica), in NAFO Zone 4RS. DFO Can Sci Advis Sec ResDoc 2004/093. Department of Fisheries and Oceans, Ottawa
Hammill MO, Stenson GB (2005) Abundance of NorthwestAtlantic harp seals (1960–2005). DFO Can Sci Advis SecRes Doc 2005/090. Department of Fisheries and Oceans,Ottawa
Hammill MO, Stenson GB, Myers RA, Stobo WT (1998) Pupproduction and population trends of the grey seal (Hali-choerus grypus) in the Gulf of St. Lawrence. Can J FishAquat Sci 55:423–430
Hammond TR, Trenkel VM (2005) Censored catch data infisheries stock assessment. ICES J Mar Sci 62:1118–1130
Hollowed AB, Ianelli JN, Livingston PA (2000) Including pre-dation mortality in stock assessments: a case study for Gulfof Alaska walleye Pollock. ICES J Mar Sci 57:279–293
Hutchings JA (1996) Spatial and temporal variation in thedensity of northern cod and a review of hypotheses for thestock’s collapse. Can J Fish Aquat Sci 53:943–962
Kempf A, Floeter J, Temming A (2008) Predator–prey overlapinduced Holling type III functional response: an examplefrom the North Sea fish assemblage. Mar Ecol Prog Ser367:295–308
Koen-Alonso M (2006) A process-oriented approach to themultispecies functional response. In: Rooney N, McCannKS, Noaks DLG (eds): From energetics to ecosystems: Thedynamics and structure of ecological systems, Springer,Dordrecht, p 1–36
Lambert Y (2008) Why should we closely monitor fecundity inmarine fish populations? J Northwest Atl Fish Sci 41:93–106
Lambert Y, Dutil JD (1997a) Condition and energy reserves ofAtlantic cod (Gadus morhua) during the collapse of thenorthern Gulf of St. Lawrence stock. Can J Fish Aquat Sci54:2388–2400
Lambert Y, Dutil JD (1997b) Can simple condition indices beused to monitor and quantify seasonal changes in theenergy reserves of Atlantic cod (Gadus morhua)? Can JFish Aquat Sci 54:104–112
Lambert Y, Dutil JD (2000) Energetic consequences of repro-duction in Atlantic cod (Gadus morhua) in relation tospawning level of somatic energy reserves. Can J FishAquat Sci 57:815–825
Lambert Y, Dutil JD, Ouellet P (2000) Nutritional conditionand reproductive success in wild fish populations. In: Nor-berg B, Kjesbu OS, Taranger GL, Andersson E, StefanssonSO (eds) Proc 6th Int Symp Rep Phys Fish. Inst Mar Res &Univ Bergen, Bergen, Norway, p 77–84
Lawless JF (2003) Statistical models and methods for lifetimedata, 2nd edition. John Wiley & Sons, Hoboken
Lawson JW, Anderson JT, Dalley EL, Stenson GB (1998)Selective foraging by harp seals Phoca groenlandica innearshore and offshore waters of Newfoundland, 1993and 1994. Mar Ecol Prog Ser 163:1–10
Lindstrøm U, Harbitz A, Haug T, Nilssen KT (1998) Do harpseals Phoca groenlandica exhibit particular prey prefer-ences? ICES J Mar Sci 55:941–953
Lindstrøm U, Haug T, Røttingen I (2002) Predation on herring,Clupea harengus, by minke whales, Balaenoptera acuto-rostrata, in the Barents Sea ICES. J Mar Sci 59:58–70
Mackinson S, Blanchard JL, Pinnegar JK, Scott R (2003) Con-sequences of alternative functional responses in modelsexploring whale-fishery interactions. Mar Mamm Sci 19:661–681
Magnússon KG (1995) An overview of the multispecies VPA —theory and applications. Rev Fish Biol Fish 5:195–212
Magnússon KG, Pálsson OK (1991) Predator–prey interac-tions of cod and capelin in Icelandic waters. ICES Mar SciSymp 193:153–170
Marshall CT, Needle CL, Thorsen A, Kjesbu OS, Yaragina NA(2006) Systematic bias in estimates of reproductive poten-tial of an Atlantic cod (Gadus morhua) stock: implicationsfor stock-recruit theory and management. Can J FishAquat Sci 63:980–994
Marteinsdottir G, Begg GA (2002) Essential relationshipsincorporating the influence of age, size and condition onvariables required for estimation of reproductive potentialin Atlantic cod Gadus morhua. Mar Ecol Prog Ser 235:235–256
Matthiopoulos J, Graham K, Smout S, Asseburg C and others(2007) Sensitivity to assumptions in models of generalistpredation on a cyclic prey. Ecology 88:2576–2586
McLaren I, Brault S, Harwood J, Vardy D (2001) Report of theeminent panel on seal management. Department of Fish-eries and Oceans, Ottawa, Canada
Middlemas SJ, Barton TR, Armstrong JD, Thompson PM(2006) Function and aggregative response of harbour sealsto changes in salmonid abundance. Proc R Soc Lond B BiolSci 273:193–198
Mohn R, Bowen WD (1996) Grey seal predation on the east-ern Scotian Shelf: modelling the impact on Atlantic cod.Can J Fish Aquat Sci 53:2722–2738
Morissette L, Hammill MO, Savenkoff C (2006) The trophicrole of marine mammals in the northern Gulf of St. Law-rence. Mar Mam Sci 22(1):74–103
296

Chassot et al.: Harp seal predation on cod
MPO (2007) Évaluation du stock de morue du nord du golfedu Saint-Laurent (3Pn, 4RS) en 2006. Secrétariat canadiende consultation scientifique, Avis scientifique 2006/010.Available at: www.dfo-mpo.gc.ca/csas/Csas/etat/2006/SAR-AS2006_010_F.pdf
Myers RA, Cadigan NG (1995) Statistical analysis of catch-at-age data with correlated errors. Can J Fish Aquat Sci 52:1265–1273
Myers RA, Barrowman NJ, Hoenig JM, Qu Z (1996) The col-lapse of cod in eastern Canada: the evidence from taggingdata. ICES J Mar Sci 53:629–640
Myers RA, Hutchings JA, Barrowman NJ (1997) Why do fishstocks collapse? The example of cod in Atlantic Canada.Ecol Appl 7:91–106
Pikitch EK, Santora C, Babcock EA, Bakun A and others (2004)Ecosystem-based fishery management. Science 305:346–347
Plaganyi, E (2007) Models for an ecosystem approach to fish-eries. FAO Fisheries Technical Paper. No 477. FAO, Rome
Pope JG (1972) An investigation of the accuracy of VirtualPopulation Analysis using cohort analysis. Int CommNorthwest Atl Fish Res Bull 9:65–74
Punt AE, Butterworth DS (1995) The effects of future con-sumption by the Cape fur seal on catches and catch ratesof the Cape hakes. 4. Modelling the biological interactionbetween Cape fur seals Arctocephalus pusillus pusillusand the Cape hakes Merluccius capensis and M. para-doxus. S Afr J Mar Sci 16:255–285
Quinn TJ II, Deriso RB (1999) Quantitative fishery dynamics.Oxford University Press, New York
R Development Core Team (2008) R: A language and environ-ment for statistical computing. R Foundation for StatisticalComputing, Vienna. Available at: http://cran.r-project.org/doc/manuals/refman.pdf
Rätz HJ, Lloret J (2003) Variation in fish condition between At-lantic cod (Gadus morhua) stocks, the effect on their produc-tivity and management implications. Fish Res 60: 369–380
Rice JC, Shelton PA, Rivard D, Chouinard GA, Fréchet A(2003) Recovering Canadian Atlantic cod stocks: theshape of things to come? International Council for theExploration of the Seas, ICES CM 2003/U:06
Savenkoff C, Castonguay M, Vézina AF, Despatie SP, ChabotD, Morissette L, Hammill MO (2004) Inverse modelling oftrophic flows through an entire ecosystem: the northernGulf of St. Lawrence in the mid-1980s. Can J Fish AquatSci 61:2194–2214
Savenkoff C, Castonguay M, Chabot D, Fréchet A, HammillMO, Morissette L (2006) Main prey and predators andestimates of mortality of Atlantic cod (Gadus morhua) inthe northern Gulf of St. Lawrence during the mid-1980s,mid-1990s, and early 2000s. Can Tech Rep Fish Aquat Sci2666. Department of Fisheries and Oceans, Ottawa
Savenkoff C, Castonguay M, Chabot D, Hammill MO, Bour-dages H, Morissette L (2007) Changes in the northern Gulfof St. Lawrence ecosystem estimated by inverse model-ling: evidence of a fishery-induced regime shift? EstuarCoast Shelf Sci 73:711–724
Shelton PA, Healey BP (1999) Should depensation be dis-missed as a possible explanation for the lack of recovery ofthe northern cod (Gadus morhua) stock? Can J Fish AquatSci 56:1521–1524
Shelton PA, Sinclair AF, Chouinard GA, Mohn R, Duplisea DE(2006) Fishing under low productivity conditions is furtherdelaying recovery of Northwest Atlantic cod (Gadus mor-hua). Can J Fish Aquat Sci 63:235–238
Shin YJ, Cury P (2004) Using an individual-based model offish assemblages to study the response of size spectra tochanges in fishing. Can J Fish Aquat Sci 61:414–431
Smout S, Lindstrøm U (2007) Multispecies functional responseof the minke whale Balaenoptera acutorostrata based onsmall-scale foraging studies. Mar Ecol Prog Ser 341:277–291
Stenson GB, Hammill MO (2004) Quantifying uncertainty inestimates of Atlantic cod (Gadus morhua) consumption byharp seals (Phoca groenlandica). DFO Can Sci Advis SecRes Doc 2004/089. Department of Fisheries and Oceans,Ottawa
Stenson GB, Hammill MO, Lawson JW (1997) Predation byharp seals in Atlantic Canada: preliminary consumptionestimates for Arctic cod, capelin and Atlantic cod.J Northw Atl Fish Sci 22:137–154
Stenson GB, Hammill MO, Kingsley MCS, Sjare B, WarrenWG, Myers RA (2002) Is there evidence of increased pupproduction in northwest Atlantic harp seals, Pagophilusgroenlandicus? ICES J Mar Sci 59:81–92
Stenson GB, Rivest LP, Hammill MO, Gosselin JF, Sjare B(2003) Estimating pup production of harp seals, Pago-philus groenlandicus, in the Northwest Atlantic. MarMamm Sci 19:141–160
Swain DP, Sinclair AF, Castonguay M, Chouinard GA,Drinkwater KF, Fanning LP, Clark DS (2003) Density-versus temperature-dependent growth of Atlantic cod(Gadus morhua) in the Gulf of St. Lawrence and on theScotian Shelf. Fish Res 59:327–341
Travers M, Shin Y, Jennings S, Cury P (2007) Towards end-to-end models for investigating the effects of climateand fishing in marine ecosystems. Prog Oceanogr 75:751–770
Trzcinski MK, Mohn R, Bowen WD (2006) Continued declineof an Atlantic cod population: how important is gray sealpredation? Ecol Appl 16:2276–2292
Walters CJ, Christensen V, Pauly D (1997) Structuring dyna-mic models of exploited ecosystems from trophic mass-balance assessments. Rev Fish Biol Fish 7:139–172
Wathne JA, Haug T, Lydersen C (2000) Prey preference andniche overlap of ringed seals Phoca hispida and harp sealsP. groenlandica in the Barents Sea. Mar Ecol Prog Ser 194:233–239
Yodzis P (1994) Predator-prey theory and management ofmultispecies fisheries. Ecol Appl 4:51–58
Yodzis P (1998) Local trophodynamics and interaction ofmarine mammals and fisheries in the Benguela ecosystem.J Anim Ecol 67:635–658
297
Editorial responsibility: Jake Rice, Ottawa, Ontario, Canada
Submitted: June 20, 2008; Accepted: December 12, 2008 Proofs received from author(s): March 19, 2009