role of renewable energy and implication of rps in a sustainable electric generation portfolio naruc...
TRANSCRIPT

Role of Renewable Energy and Implication of RPS in a Sustainable Electric Generation Portfolio NARUC Electricity Committee2007 Annual ConferenceNew York, New YorkJuly 16, 2007
Thomas Key
EPRI Renewable and Hydropower
2© 2007 Electric Power Research Institute, Inc. All rights reserved.
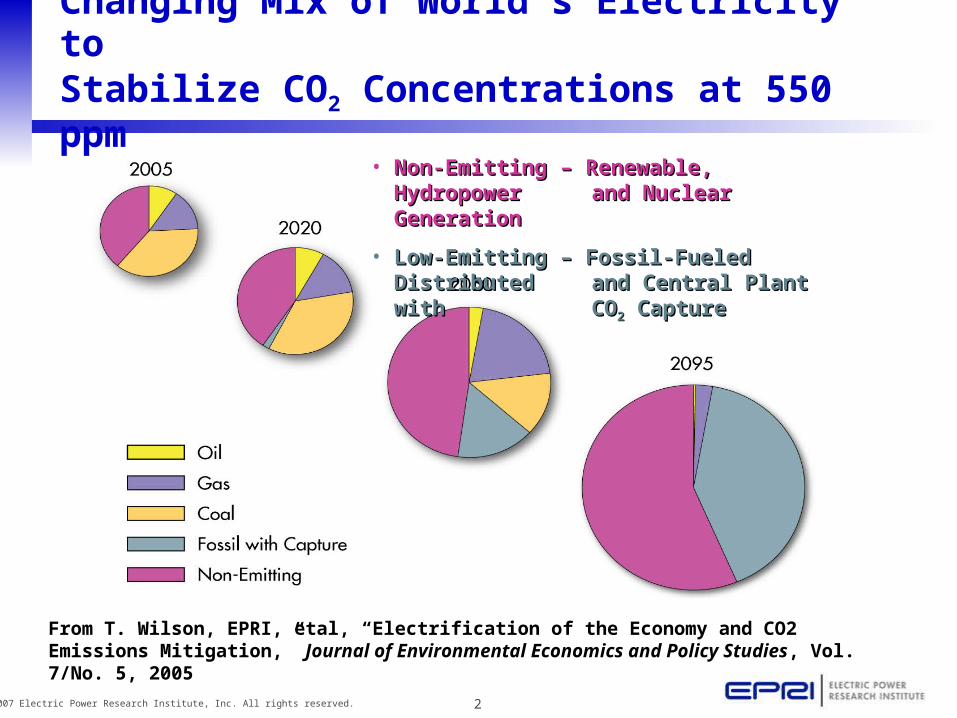
Changing Mix of World’s Electricity to Stabilize CO2 Concentrations at 550 ppm
• Non-Emitting – Renewable, Hydropower Non-Emitting – Renewable, Hydropower and Nuclear Generationand Nuclear Generation
• Low-Emitting – Fossil-Fueled Distributed Low-Emitting – Fossil-Fueled Distributed and Central Plant with and Central Plant with COCO22 Capture Capture
From T. Wilson, EPRI, etal, “Electrification of the Economy and CO2 Emissions Mitigation,” Journal of Environmental Economics and Policy Studies, Vol. 7/No. 5, 2005
3© 2007 Electric Power Research Institute, Inc. All rights reserved.
0
500
1000
1500
2000
2500
3000
3500
1990 1995 2000 2005 2010 2015 2020 2025 2030
U.S
. Ele
ctri
c S
ecto
rC
O2 E
mis
sio
ns
(mill
ion
met
ric
ton
s)
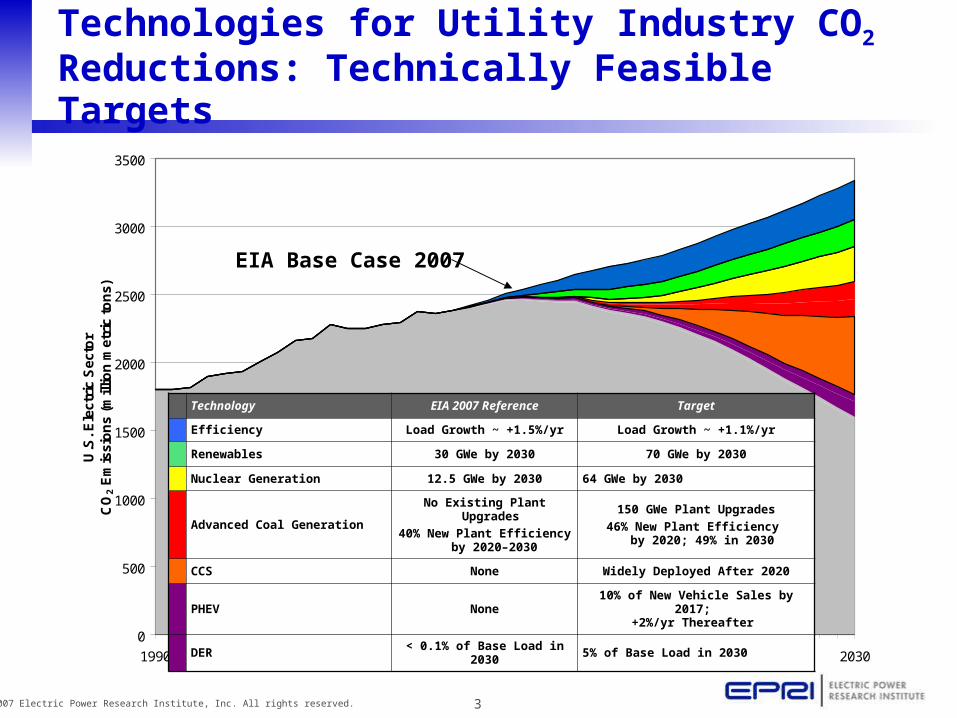
Technologies for Utility Industry CO2 Reductions: Technically Feasible Targets
Technology EIA 2007 Reference Target
Efficiency Load Growth ~ +1.5%/yr Load Growth ~ +1.1%/yr
Renewables 30 GWe by 2030 70 GWe by 2030
Nuclear Generation 12.5 GWe by 2030 64 GWe by 2030
Advanced Coal GenerationNo Existing Plant Upgrades
40% New Plant Efficiency by 2020–2030
150 GWe Plant Upgrades
46% New Plant Efficiency by 2020; 49% in 2030
CCS None Widely Deployed After 2020
PHEV None10% of New Vehicle Sales by 2017;
+2%/yr Thereafter
DER < 0.1% of Base Load in 2030 5% of Base Load in 2030
EIA Base Case 2007
4© 2007 Electric Power Research Institute, Inc. All rights reserved.
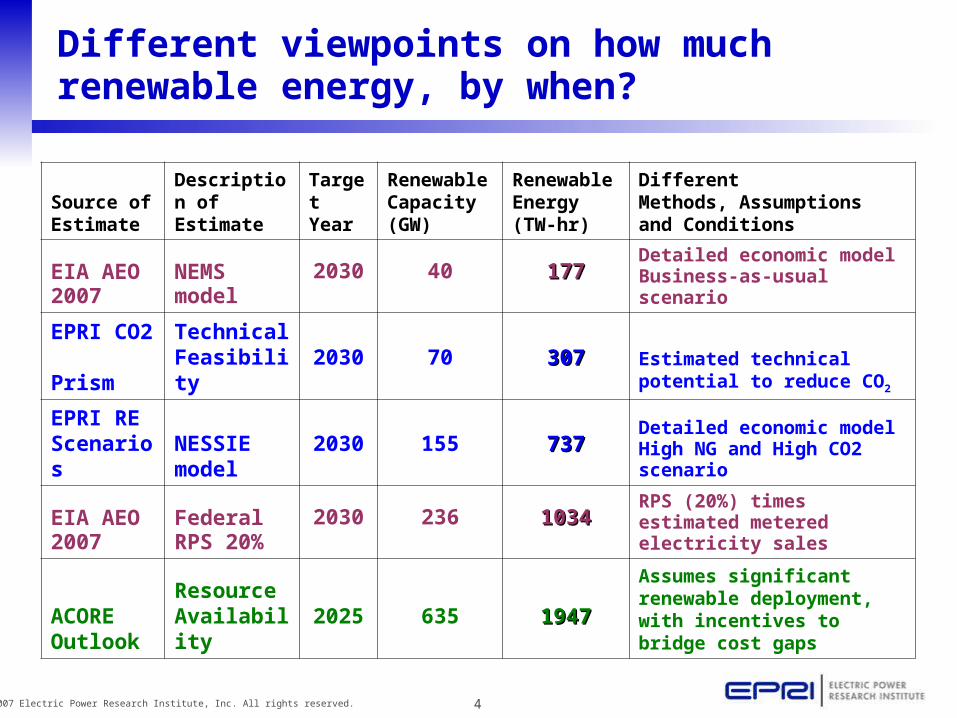
Different viewpoints on how much renewable energy, by when?
Source of Estimate
Description of Estimate
Target Year
Renewable Capacity (GW)
Renewable Energy (TW-hr)
DifferentMethods, Assumptions and Conditions
EIA AEO 2007
NEMS model
2030 40 177177 Detailed economic model Business-as-usual scenario
EPRI CO2 Prism
Technical Feasibility
2030 70 307307 Estimated technical potential to reduce CO2
EPRI RE Scenarios
NESSIE model
2030 155 737737Detailed economic model High NG and High CO2 scenario
EIA AEO 2007
Federal RPS 20%
2030 236 10341034 RPS (20%) times estimated metered electricity sales
ACORE Outlook
Resource Availability
2025 635 19471947
Assumes significant renewable deployment, with incentives to bridge cost gaps

5© 2007 Electric Power Research Institute, Inc. All rights reserved.
Renewable technologies at various stages of development and deployment

6© 2007 Electric Power Research Institute, Inc. All rights reserved.
EPRI Analysis Approach
• National Energy Modeling System (NEMS) feeds EPRI’s capacity expansion model
• Scenarios developed based on technologies, fuels, emissions cost expectations and related incentives.
• Simulation yields generation mix, capacity, energy, fuels, emissions, LCOE, etc.
• Details provided for 13 NERC regions, supply-side only … includes reserves but not other costs of integration.
SERC 2006 Capacity EnergyEnergy TW-hours
Coal 33% 51%51% 457
Nuclear 15% 38%38% 253
Hydro 8.5% 6%6% 94
Renewable 1.5% 1%1% 9
Gas/other 42% 14%14% 127
Total 100% 100%100% 896

7© 2007 Electric Power Research Institute, Inc. All rights reserved.
2020 Regional Distribution of Electric Generation(Total Estimate is 4,828 TWhr, 15% is 674 TWhr)
Regions
1 ECAR
2 ERCOT
3 MAAC
4 MAIN
5 MAPP
6 NPCC/NY
7 NPCC/NE
8 SERC/FL
9 SERC/STV
10 SPP
11 WSCC/NWP
12 WSCC/RA
13 WSCC/CNV
ECAR ERCOT MAAC MAIN MAPPNPCC/
NYNPCC/
NESERC/ FL
SERC/ STV
SPPWSCC/ NWP
WSCC/ RA
WSCC/ CNV
13.9% 7.9% 7.2% 6.7% 4.1% 3.6% 3.3% 6.7% 23.3% 5.1% 6.1% 5.0% 7.2%
669 TWh 382 348 323 197 172 161 322 1123 248 294 242 346

8© 2007 Electric Power Research Institute, Inc. All rights reserved.
Base Case Assumptions – 15%, 2020
• Federal RPS along lines of “Bingaman ARP07513”– 3.75% (2010), 7.5% (2015), 15% (2020)
• Incentives (production tax credits) are applied to drive renewable deployment to levels required.
• Alternative compliance payment is $20/MWh• No CO2 emission allowance….other allowances are:
– SOX @ $470/ton increasing at ~4%/year– Nox @ $1931/ton increasing at ~4%/year– HG @ $18,000/lb increasing at ~9%/year
• Natural gas varies from $4.50 to $5.75/MMBtu by season/region
• Demand growth is ~1.4%/year

9© 2007 Electric Power Research Institute, Inc. All rights reserved.
Different quantities and mix of renewable energy across the country – 15%, 2020
0%
5%
10%
15%
20%
25%
30%
35%
Ren
ewab
le %
of
To
tal G
ener
atio
n
Geothermal
New hydro
Solar
Wind
Biomass
Shown here as a % of regional electric generation

10© 2007 Electric Power Research Institute, Inc. All rights reserved.
Differences between required and available renewable energy by region – 15%, 2020
(60,000)
(40,000)
(20,000)
-
20,000
40,000
60,000
80,000
1
NERC Regions
Re
ne
wa
ble
Ex
ce
ss
or
Sh
ort
ag
e (
GW
h)
ECAR
ERCOT
MAAC
MAIN
MAPP
NPCC/ NY
NPCC/ NE
SERC/ FL
SERC/ STV
SPP
WSCC/ NWP
WSCC/ RA
WSCC/ CNV
Results show importance of regional Results show importance of regional flexibilityflexibility

11© 2007 Electric Power Research Institute, Inc. All rights reserved.
What is the cost of a Federal RPS?
Several key questions in analyzing RPS cost impact:• How are federal PTC incentives handled …
continuing, tax payers sharing of RPS cost?• Should CO2 credits be considered…..as adder to
relative cost of fossil generation options?• What is relative cost to build other, non-renewable,
plants?• Uncertainty in the demand for, and price elasticity of,
natural gas. • Limit to wholesale supply-side cost or include
demand-side and retail.• How will existing State RPS be counted?

12© 2007 Electric Power Research Institute, Inc. All rights reserved.
Potential effect of State RPS on Federal
• States with aggressive RPS…..
– California ~86 TWHr by 2020
– Texas ~18 TWHr by 2015
– Northeast ~30 TWHr, 2010-2020
– PA, NJ, MD ~55 TWHr by 2020
• Estimated total of state RPS by 2020 is >300 TWHr
• A 15% federal RPS in 2020 is ~ 675 TWHr
• Regions w/o RPS….SERC, FL, ECAR, MAPP, SPP
• State RPS will play a major role in cost and achievement of Federal RPS goals

13© 2007 Electric Power Research Institute, Inc. All rights reserved.
Impact of federal RPS on wholesale electricity cost – 15%, 2020
Assumptions on federal PTC and state RPS
US- All Regions (%)
Variation over 13 NERC Regions (%)
1. RPS cost without federal PTC (assumes incentive by ratepayer)
12.2% From 5.4 to 24.6%
2. RPS cost with a PTC of $18/MWh (by federal taxpayers)
6.4% From 1.4 to 12.9%
3. RPS cost with support from federal PTC and state RPS incentives
3.4% From -1.2 to
10.9%
Reduction in CO2 based on changes in generation mix
7.4% From 3.6 to 16.3%
…….depends on assumptions and region.depends on assumptions and region

14© 2007 Electric Power Research Institute, Inc. All rights reserved.
Some points the electric industry can bank on
• Demand for electricity will continue to grow
• Pressure to reduce green house gasses will continue
• Most of low and non-emitting generation technologies will be less controllable and change how the power system is operated
• Advances in electric generation technology will occur, and affect the relative cost/performance
• All electric generation technologies will be needed in the future