“role of ultrasonography in the evaluation of the
TRANSCRIPT

I
“ROLE OF ULTRASONOGRAPHY IN THE
EVALUATION OF THE HEPATOBILIARY
DISEASES”
By
Dr. RAJESH REDDY INDLURI
Dissertation submitted to the Rajiv Gandhi University of Health Sciences, Karnataka, Bangalore.
In partial fulfillment of the requirements for the Degree of
MASTER OF DEGREE IN
RADIO-DIAGNOSIS
Under the Guidance of Dr. JAYSHREE.R.GADWALKAR M.D
Professor and Head
DEPARTMENT OF RADIO-DIAGNOSIS
NAVODAYA MEDICAL COLLEGE, RAICHUR.
2015

II
RAJIV GANDHI UNIVERSITY OF HEALTH SCIENCES,
BANGALORE
DECLARATION BY THE CANDIDATE
I hereby declare that this dissertation entitled “ROLE OF
ULTRASONOGRAPHY IN THE EVALUATION OF THE
HEPATOBILIARY DISEASES” is a bonafide and genuine research work
carried out by me under the guidance of Dr.
JAYSHREE.R.GADWALKAR, M.D., Professor, Department of Radio-Diagnosis,
Navodaya Medical College, Raichur.
Dr. RAJESH REDDY INDLURI
Date: Post Graduate Student, Place: Raichur Navodaya Medical College, Raichur.

III
RAJIV GANDHI UNIVERSITY OF HEALTH SCIENCES,
BANGALORE
CERTIFICATE BY THE GUIDE
This is to certify that the dissertation entitled “ROLE OF
ULTRASONOGRAPHY IN THE EVALUATION OF THE
HEPATOBILIARY DISEASES " is a bonafide research work done by
Dr.RAJESH REDDY INDLURI in partial fulfillment of the requirement for the
degree of MASTER OF DEGREE in RADIO-DIAGNOSIS.
Dr. JAYSHREE.R.GADWALKAR M.D Professor and Head, Department of Radio-Diagnosis, Date: Navodaya Medical College, Place: Raichur. Raichur.

IV
RAJIV GANDHI UNIVERSITY OF HEALTH SCIENCES,
BANGALORE
ENDORSEMENT BY THE HOD, PRINCIPAL / HEAD OF
THE INSTITUTION
This is to certify that the dissertation entitled “ROLE OF
ULTRASONOGRAPHY IN THE EVALUATION OF THE
HEPATOBILIARY DISEASES " is a bonafide research work done by Dr.
RAJESH REDDY INDLURI under the guidance of
Dr.JAYSHREE.R.GADWALKAR M.D., Professor, Department of Radio-
Diagnosis, Navodaya Medical College, Raichur.
Dr JAYSHREE.R.GADWALKAR Dr. B.VIJAYA CHANDRA MD. MS(Anatomy) Professor and Head, Principal, Department of Radio-Diagnosis, Navodaya Medical College, Navodaya Medical College, Raichur. Raichur.
Date: Date:
Place: Raichur. Place: Raichur.

V
COPYRIGHT
DECLARATION BY THE CANDIDATE
I hereby declare that the Rajiv Gandhi University of Health Sciences,
Karnataka shall have the rights to preserve, use and disseminate this dissertation
in print or electronic format for academic / research purpose.
Dr. RAJESH REDDY INDLURI
Date: Navodaya Medical College,
Place: Raichur. Raichur.
© Rajiv Gandhi University of Health Sciences, Karnataka.

VI
ACKNOWLEDGEMENT
I express my deep sense of gratitude and indebtedness to this institution
Navodaya Medical College,Raichur which has provided me an opportunity to fulfill
the most cherished desire to reach my goal.
I,from the very core of my heart express my thanks to
Dr.Jayshree.R.Gadwalkar M.D.,Professor and Head, Department of Radiodiagnosis
who offered much valuable criticism, painful efforts and remained a pillar of
inspiration and true guide throughout, to get this dissertation completed well in time.
I would like to express my deep sense of gratitude to our beloved Medical
Director,Dr.S.R.Hegde,M.S. for providing the right academic climate at this
institution that has made this entire task appreciable.
I would like to thank Dr.B.Vijayachandra M.D.,Principal for encouraging me
and providing the clinical facilities.
I would like to express my deep sense of gratitude to Dr.M.Bharathi
M.D.,Professor,Department of Radio-Diagnosis for her continuous guidance and
constant inspiration throughout my course.
I extend my sincere thanks to Dr.Saleem,Asst.Professor,Dept. of Radio-
diagnosis,for his continuous guidance and moral support.

VII
I extend my heartfelt thanks to all my friends for their co-operation during my
study and I thank all my Post-Graduate Colleagues.
My sincere thanks to all the teaching and non-teaching staff, Department of
Radio-Diagnosis, Navodaya Medical College, Raichur for their co-operation.
I sincerely thank all my patients for their full co-operation during my study.
Above all, parents are always a perpetual source of inspiration and
encouragement. No words can ever express what their constant undemanding love,
sacrifice, dedication and prayers have done to help me whatever I am today. I feel
proud in admitting that the main force behind all the little I am able to do, are my
Parents.
Finally, I thank my lord Sri Shirdi Sai Baba for blessing me good health,
wisdom and strength throughout my life.
Date: Dr. RAJESH REDDY INDLURI
Place: Raichur.

VIII
LIST OF ABBREVIATIONS
GBCA Gall bladder carcinoma A.CH Acute cholecystitis C.CH Chronic cholecystitis HCC Hepatocellular Carcinoma HEM Haematoma H.megaly Hepatomegaly HNG Haemangioma HYD Hydatid LFT Liver Function Tests LT Left METS Metastasis MUL Multiple Pyog Pyogenic Quad Quadrant RT Right SEC Secondaries SOL Solitary Therap Therapy Undiff Undifferentiated Up Upper USG Ultrasonography USG Diag Ultrasound Diagnosis Abd Abdomen ALA Amoebic liver abscess Ca Carcinoma RUQ Right upper quadrant

IX
ABSTRACT
Background and Objectives: The science of Diagnostic ultrasound is perhaps the
most promising of the imaging modalities currently available. The main objective of
this study is to establish the efficacy of ultrasonography to detect various
hepatobiliary lesions and provide necessary information, aiding in their appropriate
management.
Methods: This study, carried over a period of 18 months, included 150 patients with
various hepatobiliary lesions. There were patients of both sexes and their ages were
above 5 years and below 85 years. After the routine blood and urine investigations
and liver function tests, the patients were subjected to ultrasound examination using
3.5-5 MHZ curvilinear transducer of TOSHIBA Istyle nemioXG ultrasound machine
in the Department of Radiology and Imaging of Navodaya Medical College and
Hospital, Raichur.
Results: One fifty cases, aged between 5 and 85 years, with various hepatobiliary
lesions were studied with real time ultrasonography. The most frequently encountered
Gall bladder lesion was Gallstones (44) with associated chronic cholecystits in 32
cases, acute cholecystitis in 10 cases, Gall bladder carcinoma in 2 cases.There were 3
cases of GB polyp, 2 case of chronic cholecystitis, 1 case of CA Gallbladder which
were not associated with gall stones.Among the CBD lesions there were 2 cases of
choledocholithiasis, 2 cases of cholangiocarcinoma and 1 case of choledochal cyst.
The most frequently encountered focal liver lesion in this study was amoebic liver
abscess which was found in 20 cases. The second most commonly encountered focal
liver lesion was hepatocellular carcinoma which was found in 12 cases. 10 cases with
hepatic metastasis were found. 4 cases with ultrasound features highly suggestive of
haemangioma and 2 cases with hepatic hydatid disease were found. One case each of
an intrahepatic haematoma and a simple liver cyst was found. Among the diffuse liver
diseases, the most commonly encountered was fatty liver which was seen in 16 cases.
The second most common diffuse liver disease was cirrhosis which was seen in 12

X
cases. 10 cases of Acute hepatitis,4 cases of chronic hepatitis and 3 cases of
congestive liver was found.
Interpretation and Conclusion: Ultrasound proved to be a sensitive, easily available
and safe imaging modality for the diagnosis and follow-up of various hepatobiliary
lesions and should therefore be the first line of investigation in suspected cases.
KEY WORDS: Carcinoma, Metastasis, Amoebic, Benign, Cyst, Diagnosis, Focal
liver lesions, Haemangioma, Hydatid, Liver, Malignant, Patients, Ultrasonography,
Ultrasound.

XI
TABLE OF CONTENTS
SL.NO CONTENTS PAGE NO.
1
INTRODUCTION
01
2
OBJECTIVES
02
3 REVIEW OF LITERATURE
03
4 HISTORY OF ULTRASOUND 11
5 ANATOMY OF LIVER AND GALL BLADDER
14
6 BASIC PHYSICS OF ULTRASOUND 60
7
METHODOLOGY
70
8
RESULTS
85
9
DISCUSSION
110
10
CONCLUSION
124
11
SUMMARY
126
12
BIBLIOGRAPHY
130
13
ANNEXURES
140

XII
LIST OF FIGURES
Table No Figures Page No
1 The Superior, Anterior and Right Lateral Surfaces of
the Liver
15
2 The Inferior Surface of the Liver 15
3 Variations in Form of Liver 16
4 Embryology of Liver 17
5 Liver Structure - Schema 19
6 Hepatic Microstructure 19
7 Normal Lobular Pattern of Liver 20
8 Histological Organization of the Liver 20
9 Electron Micrograph showing Portions of three
adjacent Hepatocytes and the intervening Bile
Canaliculi
21
10 Intrahepatic Biliary System - Schema 21
11 Intrahepatic Biliary System - Histology 22
12 Lymph Vessels and Nodes of Liver - Histology 22
13 Transmission Electron Micrograph of the border of a
Hepatic Sinusoid
23
14 Scanning Electron Micrograph of the cut surface of
the liver
23
15 Scanning Electron Micrograph of the internal surface
of a hepatic sinusoid
24
16 Topography of Liver - Anterior and Posterior Views 26
17 Topography of Liver - Lateral View 26
18 Surfaces and Bed of Liver - Anterior View 27
19 Surfaces and Bed of Liver - Visceral Surface 27
20 Surfaces and Bed of Liver - Posterior View and Bed
of Liver
28
21 Posterior Aspect of the Liver Showing its Peritoneal
Connections divided close to its surfaces
28

XIII
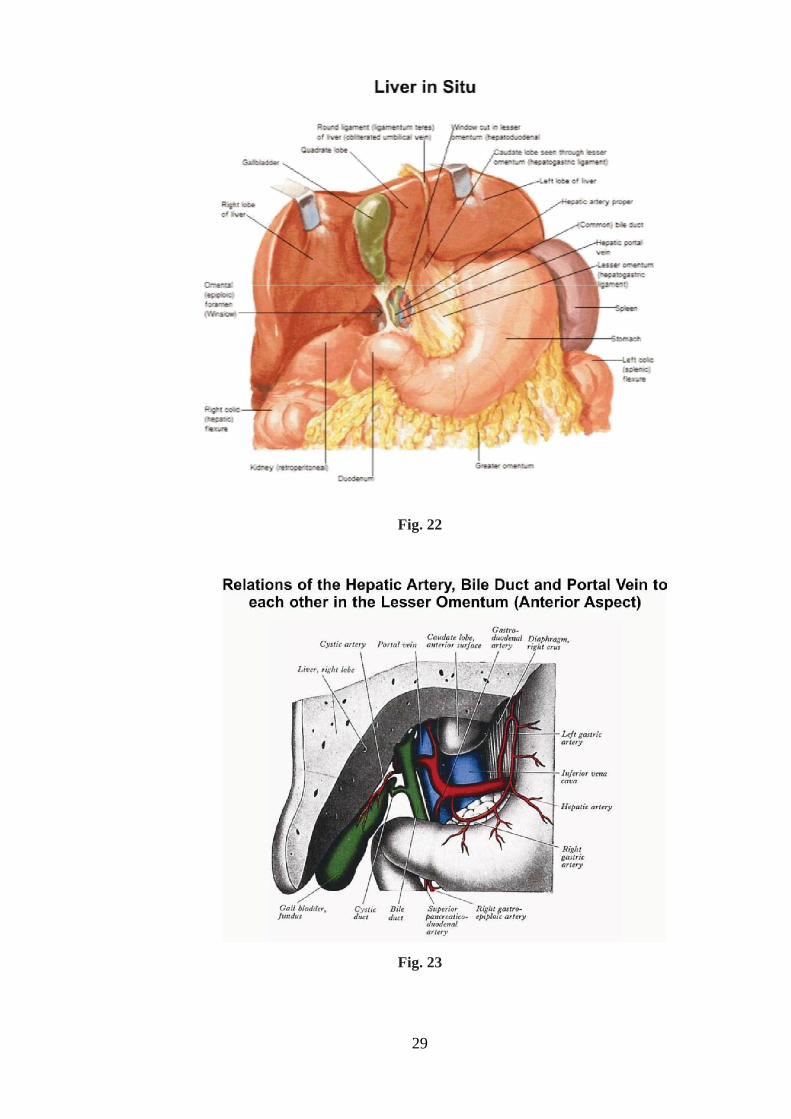
22 Liver in Situ 29
23 Relations of the Hepatic Artery, Bile Duct and Portal
Vein to each other in the Lesser Omentum (Anterior
Aspect)
29
24 Hepatic Portal Segments and Lobules - Parietal
Surface
31
25 Hepatic Portal Segments and Lobules - Visceral Surface 31
26 Distribution of Vessels and Ducts of Liver 33
27 Intrahepatic Vascular and Duct Systems 33
28 Typical Arrangement of Portal Vein 34
29 Portal Vein Tributaries - Portacaval Anastomoses 34
30 Lymph Vessels and Nodes of Liver 36
31 Innervation of Liver and Biliary Tract – Schema 36
32 Schematic diagram of B-Scan Transducer 61
33 Schematic diagram of B-Mode Scanner 61

XIV
LIST OF IMAGES
Sl. No. Images Page Nos.
1. Gall Bladder Carcinoma 75
2. Acute Cholecystitis 75
3. Gall bladder polyp 76
4. Chronic Cholecystitis 76
5. Choledocholithiasis 77
6. Choledochal cyst 77
7. Klatskin tumour 78
8. Amoebic Liver Abscess 78
9. Multiple Amoebic Liver Abscesses 79
10. Hydatid Cyst 79
11. Simple Liver Cyst 80
12. Liver Haematoma 80
13. Haemangiomas 81
14. Hepatocellular Carcinoma 81
15. Liver Metastasis 82
16. Metastasis – Bull’s Eye (Target) Lesions 82
17. Congestive Liver 83
18. Cirrhosis 83
19. Cirrhosis 84
20. Acute Hepatitis 84

XV
LIST OF TABLES AND CHARTS
Sl. No. Images Page Nos.
1. Incidence of Hepatobiliary lesions 85
2. Age & Sex Incidence of Gall bladder lesions 86
3. Percentage of patients with different signs and symptoms
87
4. Incidence of Gall Stone with Age and Sex 88
5. Age and Sex Incidence of Acute Cholecystitis 89
6. Ultrasound findings of Acute Cholecystitis 90
7. Age and Sex Incidence of Chronic cholecystitis 91
8. Age and Sex distribution of Gall bladder carcinoma 92
9. Symptoms and signs of Gall bladder carcinoma 93
10. Age and Sex distribution of CBD lesions 94
11. Age & Sex Incidence of Focal Liver Lesions 95
12. Sex-Wise Distribution of Focal Liver Lesions 96
13. Percentage of Patients with Different Signs and Symptoms
97
14. Incidence of Individual Lesions 98
15. Solitary V/S Multiple Lesions 99
16. Lobe Involvement in Various Focal Liver Lesions 100
17. Age Distribution in Cases of Liver Abscess 101
18. Liver Abscess - Solitary V/S Multiple 102
19. Lobe Involvement in Liver Abscess 103
20. Age & Sex Incidence in Cases of Hepatocellular Carcinoma
104
21. Lobe Involvement in Hepatocellular Carcinoma 105

XVI
22. Age and Sex Incidence in Cases of Hepatic Metastasis 106
23. Site of Primary in Cases of Metastasis 107
24. Age Incidence of Diffuse Liver Diseases. 108
25. Sex distribution of diffuse liver diseases 109

1
INTRODUCTION
Although roentgenology has long been one of the cornerstones of diagnosis, it
is now generally accepted that some hazards to the patient do exist. There has been a
revolution in the field of diagnostic imaging following the advances in the techniques
of ultrasonography, computed tomography and Magnetic resonance imaging.
The advent of diagnostic ultrasound is perhaps the most promising of the
imaging modalities currently thought to be noninvasive. The ease and elegance with
which ultrasound can detect and display intrahepatic lesions, the non-invasiveness,
cost-effectiveness, portability, patient acceptability and radiation dosage (it does not
employ any ionizing radiation) of the method are the other advantages.
Abdominal ultrasound provides the physician/surgeon the necessary
information to plan out the right therapeutic approach required in the given situation.
Hence, ultrasound has become a mandatory examination in the approach to the
management of hepatobiliary lesions.
Gray scale ultrasonic imaging has been found to be most informative, quick
and non invasive means for investigating hepatobiliary system. Its high resolution,
flexibility and reliability make it almost ideal for the study of hepatobiliary diseases
in general and focal lesions in particular. Other valuable information like the number
of lesions, exact location, relation to the various vessels and surfaces of the liver, the
nature of the lesions (i.e. solid, cystic or complex mass), etc. can be achieved.
Starting from 1950, ultrasound has developed into the most indispensable
diagnostic technique in the appropriate evaluation and management of all types of
liver lesions. Ultrasound detects the abnormalities much before the disease becomes
rampant and thus helps in decreasing the morbidity and mortality due to hepatobiliary
lesions.

2
OBJECTIVES OF THE STUDY
1. To detect various hepatobiliary lesions by using real time ultrasonography.
2. To study the ultrasound pattern of various hepatobiliary lesions.
3. To study the role of ultrasonography in the diagnosis and management of
hepatobiliary lesions.
4. To establish the efficacy of the diagnostic yield of ultrasonography to detect
various hepatobiliary lesions and provide necessary information, aiding in their
appropriate management.

3
REVIEW OF LITERATURE
Suhas G. Parulekar studied the sonographic anatomy and variation in the
ligaments and fissures of the liver1.
Robert Dick et al. states that sonography is considered to be the most cost-
effective primary investigation of choice in the elucidation of liver mass and right
upper abdominal problems, since its use can be combined with examination of the gall
bladder, biliary tract Sonography is superior to oral cholecystography for
demonstrating gall bladder calculi even in obese patients2.
Ultrasound gives a excellent display of dilated intrahepatic ducts and the
normal portions of the biliary tree at porta hepatis can be imaged. Dilatation is
demonstrable with a reliability of 90%3.
Abramson et al, Brun et al.stated that demonstration of normal gall bladder at
ultrasound virtually excludes biliary atresia4,5
.
A choledochal cyst is usually very obvious on ultrasound as a subhepatic cyst
alongside gallbladder, with careful scanning its communication with the bile duct can
be demonstrated6.
Ultrasound is highly sensitive for the detection of fatty infiltration (sensitivity
86% for mild and almost 100% for moderate and severe disease)7.
Sampler et al, Mueller, lunderquist. Stated that the exquisite sensitivity of
ultrasound to dilatation of bile ducts has made it the imaging technique of choice in
the evaluation of jaundice. Dilated bile ducts are seen as tubulus lying alongside the
portal vein branches.The pattern is characteristic and specific8,9,10
.
Colour Doppler can detect tumour induced compression/thrombosis of portal
vein or hepatic artery11
.

4
Colour Doppler ultrasound is able to depict the presence of Arterioportal
fistula.Colour Doppler ultrasound can be proposed for screening of Arterioportal
fistula in patients with cirrhosis.This screening can be carried out simply, as patients
with cirrhosis are usually periodically examined with Doppler ultrasound12
.
In evaluation of liver tumours, 3D ultrasonography increases the efficiency of
liver tumour screening by using the multislice function, allows a better time and
human resource management, the precise location on three axes of tumour and exact
assessment of the distances relative to the main vessel structures of the liver.It is able
to characterise the tumour echotexture and to sum up the total volume of liver masses,
with application in postchemotherapy followup13
.
Patric J. Bryan et al. carried out a correlative study in 51 patients using CT
scan, grey scale ultrasound and radionuclide imaging in detecting focal liver lesions
and have emphasized the role of ultrasound as a safe and sensitive imaging
modality14
.
Robert Dick et al. states that sonography is considered to be the most cost-
effective primary investigation of choice in the elucidation of liver mass and right
upper abdominal problems, since its use can be combined with examination of the gall
bladder,biliary tract and pancreas. The abnormalities demonstrated by ultrasound
include neoplasms (primary and metastatic), cysts, abscesses and dilated ducts.
Ultrasound is more specific than scintiscanning since it will differentiate solid from
cystic lesions while colour Doppler sonography is a superb non-invasive alternative to
arteriography and phlebography15
.
L. Bolondi et al. stated that liver cysts, abscesses and haematomas are more
easily identified by ultrasound than by other methods. Due to the excellent
transmission of ultrasound through fluids they remain echolucent even with high
attenuation of the beam16
.

5
J E J Krige and I J Beckingham are of the opinion tht ultrasonography is the
preferred initial method of imaging for liver abscesses as it is non-invasive, cost
effective, and can be used to guide aspiration to identify the causative organism17
.
Jose A. Tan et al. say that with the advent of imaging techniques such as liver
scan and ultrasound, the diagnosis of hepatic abscess can be made more safely, easily
and accurately when correlated with specific serologic test18
.
Studying a case of amoebic liver abscess, Dr. O.P. Kapoor concluded that
though ultrasound is the modality of choice in management of patients with amoebic
liver abscess, CT scan has a greater sensitivity19
.
Studying 12 cases with abscess, F.R. Vicary and others were able to diagnose
all the eight cases with abscess, using gray scale ultrasonography20
.
Phillip W. Ralls et al. studied 106 patients with amoebic liver abscess and
conc1uded that sonography is extremely useful in the diagnosis and management of
amoebic liver abscess21
.
C. Rammohan et al. studied 22 cases of liver abscess by ultrasound. They
discussed various sonographic findings in these cases22
.
A.K. Chaturvedi and K.V. Sangameshwaran studied 54 cases of amoebic liver
abscess. They studied the ultrasound patterns and clinical and ultrasound response to
metronidazole therapy23
.
Laila Ahmed et al. studied the resolution time for amoebic liver abscess. They
found variable resolution time from two to twenty months. In their series all the
abscesses healed completely leaving normal hepatic sonographic pattern24
.
Arnold C. Friedman et al. say that the use of radionuclide scanning,
ultrasonography (US), and computed tomographic (CT) imaging has resulted in the
earlier diagnosis of pyogenic abscess of the liver, and together with percutaneous
drainage has in recent years helped to reduce mortality from this condition25
.

6
Barry Green et al. studied 90 cases of hepatic neoplasm using gray scale
ultrasound. They concluded that there is no apparent association of ultrasonic pattern
with either the histological type of neoplasm or the angiographic vascularity26
.
Michael E. Bernardino and E. Lewis stressed the role of ultrasound as a safe
and sensitive imaging modality for liver neoplasms27
.
J Furuse et al. described contrast enhanced ultrasound using coded harmonic
imaging and Levovist which provided detailed information about tumor vascularity
and contrast enhancement patterns in hepatic tumors28
.
Michael E. Bernardino et al. stated that hepatic sonography is improved when
static 'B' scanning is combined with real time examination, eliminating possible
pseudolesions and blind spots. They also emphasized that because of its versatility,
sonography should replace radionuclide scanning as an initial diagnostic method in
patients with liver masses and for follow up29
.
J. Karani stated that ultrasound provides an invaluable screening technique for
detection or exclusion of a focal liver mass with a reported sensitivity of 90%30
.
Thomas W. Broderick et al. are of the view that ultrasound is a useful tool in
the evaluation of hepatoma31
.
Raju Sharma is of the view that sonography being inexpensive and widely
available is frequently used as the initial modality in the work-up of focal hepatic
lesions. The sensitivity of USG for detection of hepatocellular carcinoma ranges
between 75 to 94 percent in various studies32
.
David O Cosgrove states that comparative studies on the sensitivity of various
imaging modalities in the diagnosis of hepatocellular carcinoma in Japan indicate that
real-time ultrasound has a detection rate of 94%, which is better than that of CT,
angiography or scintigraphy (84%, 76%, 12% respectively), particularly where the
nodules are smaller than 2-3 cm in diameter33
.

7
Jin-Chuan Sheu et al. studied 36 hepatic tumors smaller than 3 cms using high
resolution linear array real time ultrasound and concluded that ultrasound is a
sensitive and easy method of detecting small tumors. They also emphasized the
prominent role of ultrasound in detection and diagnosis of hepatocellular carcinoma in
areas where this cancer is common34
.
Jin-Chuan Sheu et al. studied the ultrasound evaluation of hepatocellular
carcinoma in early stages in 80 patients. They observed a change in echo pattern of
these tumors from hypoechoic to isoechoic to hyperechoic pattern with increasing size
35.
Bala R. Subramanyam et al. studied 15 cases of hepatocellular carcinoma with
ultrasound for the assessment of tumor extension into the intra hepatic inferior
venacava, hepatic veins and portal branches in the correlation with angiography. They
demonstrated vessel invasion in 33% cases and found that thrombi were readily
identified on ultrasound36
.
P.A. Dubbins et al. studied the ultrasound appearances of preliminary
hepatocellular carcinoma in 32 patients and concluded that ultrasound had a useful
role in detecting solid focal lesions in patients with cirrhosis37
.
Mario Cottone et al. studied 100 cirrhotic patients with suspected
hepatocellular carcinoma by using real time ultrasound and concluded that ultrasound
has a sensitivity of 90% and a specificity of 93%38
.
Eugenio Caturelli et al. observed that coarse nodular pattern is more often seen
in patients with Hepatitis-D Virus related cirrhosis and in this setting (in contrast to
Hepatitis B Virus, Hepatitis C Virus and Alcoholic Liver cirrhosis as well as in
Primary Biliary Cirrhosis) it does not represent an added risk factor for Hepatocellular
Carcinoma39
.
K.L.W. Taylor and others studied the anatomy and pathology of the
liver,using gray scale ultrasound and concluded that gray scale ultrasound is a very
sensitive tool for evaluating various focal lesions of the liver. Their study included
some 2000 cases of metastatsis with a diagnostic accuracy of 90%40
.

8
Cynthia E. Withers and Stephanie R. Wilson are of the view that ultrasound is
an excellent screening modality for metastatic disease of the liver because of its
relative accuracy (compared with scintigraphy and liver function tests), speed, lack of
ionizing radiation and availability. It is evident that detection of metastatic liver
disease greatly alters the patient’s prognosis and very often the management41
.
M. Koenigsberg and J. Hoffman-Tretin are of the opinion that ultrasound has
an accuracy of about 85 to 90 percent in detecting secondary deposits in the liver, and
the modality is useful in localizing a site for percutaneous biopsy, as well as for
monitoring subsequent therapy42
.
Robert N Berk et al. state that ultrasonography has been broadly employed in
the detection and characterization of hepatic metastases. Echograms display the
broadest spectrum of metastatic appearances of all imaging modalities employed43
.
T Sekiya et al. studied 16 cases of hepatic metastasis from testicular tumors
and emphasized the value of ultrasound in characterization of various focal lesions
especially metastasis44
.
S.J. Golding and E.W.L. Fletcher are of the view that ultrasound may detect
lesions as small as 5 mm in diameter and a diagnostic sensitivity of up to 96% in the
detection of hepatic neoplasms. A good ultrasound unit should be able to detect over
90% of liver metastases. Ultrasound has the advantage that it is simple to perform,
inexpensive and acceptable to the patient. Furthermore, if metastases are detected,
fine-needle biopsy under ultrasound control maybe carried out at the first attendance
as this is relatively painless and safe45
.
Thomas Albrecht et al. concluded that contrast enhanced ultrasound improved
sensitivity and specificity in the detection of hepatic metastasis in comparison with
conventional ultrasound46
.
V.G. Vassiliades et al. are of the opinion that USG is the primary diagnostic
modality for hepatic hydatid disease and is often all that is required when the
appearance is classic47
.
A. Adam et al. say that Echinococcus granulosus (Hydatid disease) of the liver

9
is readily detected on ultrasound as a cystic cavity, most commonly in the right lobe.
Hydatids often show a sediment of debris representing the dead scolices (hydatid
sand), and they frequently calcify, a change that maybe detected on ultrasound as
strong echoes, but one that is more obvious on a plain radiograph48
.
E.A. Niron and H. Ozer evaluated the gray scale ultrasound features of hepatic
hydatid disease in 38 patients using gray scale 'B' scanner. They concluded that
ultrasound approaches a diagnostic accuracy of 100% and should be the first method
of investigation in suspected cases49
.
S.K. Sharma and Avik Sengupta studied the ultrasound pattern of hepatic
hydatid disease in 55 cases. They classified the lesions into simple cystic, multilocular
septated, complex and calcified types50
.
Ali Hadidi studied 151 cases of hepatic echinococcal cysts by gray-scale
ultrasound. According to their echographic features, the cysts were categorized as
discrete cysts, multiple cysts and queer pear-shaped cysts51
.
H.A. Gharbi et al. have described five types of echinococcal cysts on USG:
purely cystic except for hydatid sand; detached membrane; multiseptated; peripheral
or diffuse distribution of coarse echoes in a complex heterogenous mass; and calcified
wall52
.
Sukhpal Sawhney et al. studied 61 patients with abdominal hydatid disease and
suggested a classification into VI types based on the ultrasound appearances53
.
David B. Lewall and Scott J. McCorkell studied the sonographic appearance of
echinococcal lesions of the liver in 59 patients and suggested a classification (Type I–
Type III) which reflects the pathology and natural history of the disease54
.
C. Ramamohan and Pramod Kumar Reddy studied 12 patients with 20 hydatid
cysts and described the various ultrasound patterns encountered therein55
.
L. Volterrani et al. studied 279 hyper echoeic liver haemangiomas with
ultrasound, in order to define their structural patterns and incidence of different signs
that could be used for diagnostic purpose. They concluded that in non-neoplastic

10
patients a hyperechoic hepatic lesion presenting with hypoechoic areas and posterior
enhancement with no surrounding hypoechoic halo can be confidently diagnosed as
haemangioma on ultra sound alone56
.
P.J. Patel et al. are of the view that hyperechoic patterns, strong echoic
peripheral border, posterior enhancement and hyperechoic central area are highly
suggestive of hemangioma on ultrasound examination57
.
J Taboury et al. studied the sonographic pattern of 37 hepatic cavernous
haemangiomas. He found out that the most frequent ultrasound pattern of cavernous
haemangioma is that of a solitary homogeneously hyperechoic, round well defined
mass with posterior enhancement. According to this more than 75% of haemangiomas
corresponded with hypervascularity and also depended on the size of the lesion -
smaller ones (2.5 cms) not showing enhancement58
.
Thomas C. Winter III and Faye C. Laing are of the opinion that ultrasound has
been and continues to be one of the most sensitive diagnostic modalities for the
detection and characterization of cysts. This is especially true of the liver, where the
echogenicity of the hepatic parenchyma presents a good background against which
one can easily recognize an anechoic cyst59
.

11
HISTORY OF ULTRASOUND
The story of the development of ultrasound applications in medicine should
probably start with the history of measuring distance under water using sound
waves.The term SONAR refers to Sound navigation and Ranging.Ultrasound scanners
can be regarded as a form of Medical Sonar.
Sir Isaac Newton (1643-1727) first described the propagation of sound.
English physicist John William Strutt (1842-1919), in 1877-88 published his
two-volume treatise “The Theory of Sound” describing the physics of sound waves.
Christian Doppler (1805-1853), the Austrian physicist published “Ubley Das
Forbiye Der Doppler Sterne” (concerning the coloured lights of double stars) in the
year 1842 which contained his first statement of Doppler effect.
The real breakthrough in the evolution of high frequency echo sounding
technique came when the "Piezoelectric effect" was discovered by the brothers Pierre
and Jacques Curie in 1880. In 1912, G. Richardson, a British physicist used
ultrasound for detection of icebergs. Paul Langevin, a graduate student of Pierre Curie
went on to develop Richardson's idea and became the practical pioneer of acoustic
pulse echo techniques in their 1914 to 1918 war time application to underwater
detection of Submarines.
Karl Theo Dussik, Austrian neurologist became the first to use ultrasound as a
medical procedure in 1942. He tried to image the cerebral ventricles through
transmission of ultrasound waves. After several trials, the tasks proved too difficult
and he dropped his idea. An important link between Langevin's work in acoustics and
its application to medicine was forged by the Russian engineer, S.Y.Sokolov, who
pioneered the use of ultrasound echo method for flaw detection in metal.

12
Three separate groups in the U.S.A. had become interested in the medical
application of ultrasound by 1948. Ludwig and Struthers at the U.S. naval
establishment at Maryland, John Wild, a British trained surgeon at Minneapolis, who
recruited help from a local U.S. naval station, and Douglas Howry, a radiologist at
Denver. All the three groups initially worked with A-scan techniques.
John Wild and Donald Neal in 1950 published their work on unidirectional A-
mode ultrasound investigations. Douglas Howry and John Wild made significant
contribution to the ultrasonic demonstration of soft tissues of the body. Howry helped
to construct a pulsed echo system in 1948-49. In 1950 he produced his first cross
sectional images and in 1951 conceived the idea of compound scanning. Wild was
interested in tissue differentiation, primarily to detect cancerous tissue. Together with
his engineering colleague Reid, he developed a 'B' scanner working at 15 MHZ and
designed to be sensitive to even low level echoes.
In 1954 Ian Donald carried out experiments with industrial metal flaw detector
in his approach to investigation of ultrasound. Donald, along with his engineer
collaborator T.G. Brown is responsible for the contact scanning concept and
pioneering the extensive application of ultrasound imaging in obstetrics and
gynaecology.
The first compound scanner was developed by Kossoff, Robinson and Garrett
in 1962. The same group introduced gray scale imaging in ultrasound in 1972. Since
then there has been tremendous evolution in the field of ultrasound. Invention of 3D
and 4D ultrasound equipments have changed the concept and approach of evaluation
of various diseases by ultrasound.
In the first World Congress of Ultrasound in Medicine held in Erlangen,
Germany in May, 1948 Dussik and Keidel presented their papers on ultrasound
employed in medical diagnosis. These were the only two papers that discussed
ultrasound as a diagnostic tool.
Colour Doppler was introduced in medical practice in mid 1980. It is now
established as a non-invasive technique not only to study blood flow in vessels but

13
also to study organ perfusion and to determine functions.
Colour doppler and duplex sonography are helpful in identifying vascularity
and to differentiate liver lesions which was difficult with the conventional gray scale
ultrasound, thus helping in planning the mode of management.

14
ANATOMY OF LIVER AND GALL BLADDER
The liver is the most massive of the viscera and lies in the right upper part of
the abdominal cavity, occupying most of the right hypochondrium and epigastrium. It
is wedge shaped and weighs about 1500 gm in the normal adult. The Gall bladder is a
piriform sac partly sunk in a fossa in right hepatic lobes inferior surface. It is 7-10cm
long, 3cm broad at its widest. It has a fundus, body and a neck85
.
Embryology
The liver primordium appears in the middle of the third week as an outgrowth
of the endodermal epithelium at the distal end of the foregut. This outgrowth is known
as the hepatic diverticulum. By the stage 12, the diverticulum has 2 parts; a caudal
part which will produce the cystic duct and gall bladder and a cranial part which
forms the liver and biliary tract. Around the cranial portion of hepatic diverticulum,
shows rapidly proliferating cell strands which penetrate the septum transversum, that
is the mesodermal plate between the pericardial cavity and stalk of the yolk sac while
the hepatic cell strands continue to penetrate in the septum, the connection between
the hepatic diverticulum and the foregut narrows, thus forming the bile duct85
.
During further development, the epithelial liver cords intermingle with the
vitelline and umbilical veins forming the hepatic sinusoids. The mesoderm of the
septum between the ventral abdominal wall and the liver becomes falciform ligament.
Similarly the mesoderm of the septum between the liver and the foregut becomes
lesser omentum.
Histology
The small, anatomic and functional unit of the liver is the lobule.It is 1-2 mm
in diameter. The liver lobule is constructed around a central vein. The plates of
hepatic cells, usually two cells thick, radiate from the central vein to the periphery of
the lobule like the spokes of a wheel. Branches of the portal vein,hepatic artery and
bile duct forms the portal triad at the periphery

15
Fig. 01
Fig. 02

16
Fig. 03

17
Fig. 04
The laminae of hepatic cells are separated by vascular spaces called “sinusoids”
which open into the central vein. The sinusoids are lined by endothelial cells and kupffer
cells. Bile canaliculi are adjacent to hepatocytes and conduct bile produced by
hepatocytes to the bile ducts and eventually drain to common bile duct.

18
Gross Anatomy
Liver is located under the right diaphragm and the inferior surface is in contact
with the duodenum, colon, kidney, adrenal gland and stomach. In the adult, the normal
liver extends in the midclavicular line from approximately the right fifth intercostal space
down to slightly below the costal margin85
. It is the largest gland in the body, weighing
approximately 1500 gm. in the adult.
Peritoneal Attachments
The entire liver is invested by peritoneum except for a bare area on the
posterosuperior surface adjacent to the inferior venacava where Glisson's capsule is in
direct contact with the diaphragm85
.
1. The falciform ligament is the peritoneum reflected from the upper and anterior
surfaces of the liver to the diaphragm and incorporates in its deep border the
ligamentum teres hepatis with the obliterated left umbilical vein.
2. The coronary ligaments connect the liver to the diaphragm. The lateral aspects of
the anterior and posterior coronary ligaments form the right and left triangular
ligaments.
3. The lesser omentum stretches from the porta hepatis to the lesser curvature of
the stomach and the first 2.5 cm of the duodenum. Its right free border forms the
anterior boundary of the epiploic foramen. It contains the hepatic and common bile
ducts, the hepatic artery and the portal vein.

19
Fig. 05
Fig. 06

20
Fig. 07
Fig. 08

21
Fig. 09
Fig. 10

22
Fig. 11
Fig. 12

23
Fig. 13
Fig. 14

24
Fig. 15

25
Segments of the Liver
Cantlie (1898) first described the division of liver into right and left halves
according to the distribution of right and left hepatic arteries.Hjortso emphasized that
the primary anatomic and functional lobation are better defined as territories of right
and left hepatic ducts.These studies were combined with surgical data in the classic
book by Couinad (1953) which is now regarded as the definitive descriptive
foundation for surgical approaches to the liver85
.
According to this functional anatomy, the liver appears to be separated into
two livers (hemilivers) by the main portal fissure (scissurae), also called Cantlie’s
line. The Cantlie’s line extends from the anteroinferior gall bladder fossa
posterosuperiorly to the left of the inferior venacava. The middle hepatic vein follows
this main portal fissure.
These right and left hemilivers are themselves divided into two parts by two
other portal scissurae. These four subdivisions are called sectors (according to
Couinad's nomenclature).

26
Fig. 17
Fig. 16
Topography of Liver - Lateral View

27
Fig. 18
Fig. 19

28
Fig. 20
Fig. 21
29
Fig. 22
Fig. 23

30
The right portal scissura divides the right liver into two sectors - anteromedial
or anterior and posterolateral or posterior. Along the right portal scissura runs the
right hepatic vein. Each of these two sectors further divided into two segments. The
anterior sector divides into segment V inferiorly (anteriorly) and segment VIII
superiorly (posteriorly). The posterior sector divides into segment VI inferiorly
(anteriorly) and segment VII superiorly.
The left portal scissura divides the left liver into two sectors anterior and
posterior. The anterior sector is divided by the umbilical fissure into two segments -
medially the segment IV, the anterior part of which is the quadrate lobe and laterally
segment III, which is the anterior part of the left lobe. The posterior sector is
comprised of only one segment, segment II, which is posterior part of the left lobe.
As a result, the two hemilivers, each of them divided into two sectors,
comprise seven segments. (Segments II to segment VIII).
The caudate lobe or segment I is considered as an autonomous segment for its
vascularisation is independent of the portal division and of the three main hepatic
veins. It receives vessels from the left, but also from the right branches of the portal
vein and hepatic artery. Its hepatic veins are independent and end directly into inferior
venacava.
Portal Vein
It is formed by the junction of the superior mesenteric and splenic veins behind
the head of the pancreas. The portal vein carries approximately 75% of the blood
supply to the liver.

31
Fig. 24
Fig. 25

32
The portal trunk divides into the left and right hepatic branches in the porta
hepatis. The left branch consists of two sections, the pars transversa and the pars
umbilicus. Two branches to the lateral segment of the left lobe usually arise from the
pars umbilicus near the plane of the falciform ligament. Branches from both sections
supply the medial segment of the left lobe. The right main branch of the portal vein
divides into anterior and posterior segments. Both systems branch into small veins
and venules and finally into hepatic sinusoids. Abundant intercommunication exists at
the sinusoidal level.
Hepatic Artery
The proper hepatic artery arises from the celiac axis and passes along the upper
border of the pancreas towards the liver. It divides into right and left branches within
the porta hepatis and subsequently into smaller branches corresponding to the portal
venous system and subsegmental anatomy.
Hepatic Veins
Three major hepatic veins (right, middle and left) are of surgical importance.
The right hepatic vein is the largest of the three, follows along the intersegmental
plane between the anterior and posterior segments, and provides the principal
drainage for the right lobe of the liver. The.middle hepatic vein lies in the lobar
fissure and drains principally the medial segment of the left lobe as well as a variable
portion of the anterior segment of the right lobe. The left hepatic vein drains
principally the left lateral segment. In addition, there are multiple small veins that
drain the posterior aspect of the liver directly into the inferior venacava.

33
Fig. 26
Fig. 27

34
Fig. 28
Fig. 29

35
Biliary System
Small channels known as bile canaliculi are adjacent to hepatocytes and
conduct bile which is produced by the hepatocytes, outward to the bile ducts and
eventually drain to CBD. The CBD empties into the duodenum through a opening
called major duodenal papilla.
Lymphatics
Hepatic lymphatic fluid from the perisinusoidal space of Disse and clefts of
Mall, drains into large lymphatics in the porta hepatis, then into the cisterna chyli and
subsequently into the thoracic duct. Draining lymphnodes are located in the porta
hepatis, in the celiac region and near the inferior venacava.
Functions of the Liver
1. Phagocytosis and immunological surveillance.
2. Metabolism of basic nutrients - carbohydrates, fats and proteins.
3. Detoxification.
4. Synthesis of coagulation factors.
5.Bile formation and excretion.
Functions of the Gall bladder
1. It stores and concentrates the bile.
2. It reduces the alkalinity of hepatic bile.

36
Fig. 30
Fig. 31

37
Ultrasound Features of various Hepatobiliary Lesions of the Liver
Gall Bladder Lesions:
Gall Stones:
Gallstones have been known since ages, which have been seen in Egyptian
mummies dating 1500BC. At least 10% of adults have gallstones.
Risk factors:
Obesity, diabetes, oral contraceptives, previous truncal vagotomy, higher age
(incidence increases with age in both sexes, with a peak in fifth and sixth decades),
intestinal malabsorption especially at the distal ileum.
Gallstones are rare in childhood, the etiology being hemolytic anaemia,
hyperalimentation (total parenteral nutrition), congenital biliary tract anomalies,
frusemide therapy, phototherapy, dehydration, severe systemic infections, ileal resection,
cystic fibrosis, tyrosinosis, wilson’s disease, multiple transfusions, chemotherapy etc., are
few but important risk factors.
“Female, Forty, Fair, Fattry, Fertile and Flatulent” is a phrase, which is still
relevant albeit the present day idea of etiopathogenesis. In pregnant women due to
hypercholesterolemia and increased concentration of cholesterol in the bile the incidence
of gallstones is common (4 to 11%).
Types of stones and Pathophysiology:
Normally the hepatic bile is concentrated and stored in the gallbladder. Excess
concentration results in super saturation of bile with cholesterol, that precipitates into
solid crystals which along with bacteria, foreign material, abnormal bile pigments and
mucoproteins form the nidus, which ultimately becomes macroscopic stones due to
repeated layering. The deposition of crystalline cholesterol and calcium over a period of
time causes the laminated appearance in the stone. There are two varieties of stones,
which are:
1. Cholesterol stones
2. Pigment stones (Black and brown)

38
Etiology:
Association with gallstones are increased age, female sex, obesity, clofibrate
therapy, ileal diseases and resection, hepatic cirrhosis, hemolysis, refined carbohydrate
diet, total parentral nutrition, diabetes mellitus, small intestine by pass surgeries, estrogen
therapy and type IV hyperlipoproteinemia.)
The risk of gallbladder cancer in patients with gallstones is as low as 0.2 to 0.5%.
Ultrasonography has very good sensitivity and specificity of 95 to 99% in most
series and has been accepted as the modality of choice. They appear as strongly reflective
foci in gallbladder and cast well marked acoustic shadows distally.
Gall stones have 3 typical sonographic features: Type 1: Stones appear as high level intraluminal echogenic foci with distal shadowing.
This is 100% diagnostic.Stones are usually mobile exhibiting the “rolling stone sign” on
changing the position, unless they are impacted in gall bladder neck or are very larger as
to fill most part of the gall bladder.
Type 2:Stones are diagnosed when strong acoustic shadowing ,arising in the gall bladder
fossa without a normal gall bladder lumen is imaged.It has a accuracy of 85 to 90%.
Type 3: Stones appear as multiple, mobile, non-shadowing, echogenic foci of less than
5mm in diameter.
The presence of such a finding is not a reliable indicator of gallstones in a single
scanning. This can be diagnosed usually when a repeat ultrasound scanning shows the
same findings at a later day.
Acute Calculous Cholecystitis:
It occurs when gallbladder cannot empty due to obstruction at either the neck of
gallbladder or cystic duct. In > 95% the cause is stone impacted in the neck of gallbladder
or cystic duct, which enables accumulation of secretions there by distending gallbladder
with increased intraluminal pressure and vascular insufficiency.
Other cause of cystic duct obstruction are torsion, angulation or kinking of the
duct, anomalous blood vessels, fibrosis, adhesion, lymphadenopathy, plugging by
inspissated bile and local neoplasm.

39
Ultrasound is preferred because of its speed, consistency in the evaluation of
adjacent structures, lack of dependence on hepatic excretory function and usually, less
cost. There are several criteria to diagnose acute cholecystitis sonologically. They are the
presence of stones, wall thickness, wall sonolucency, sonographic Murphy’s sign and
gallbladder distension.
Major signs:
Gallstones in the cystic duct or the neck of gallbladder, wall sonolucency,
Murphy’s sign.
Minor signs:
Wall thickening, rounded shape and dilatation.
Other findings such as pericholecystic fluid (suggesting perforation), presence of
sludge, and coarse, nonshadowing, non-dependent echodensities with or without
intraluminal membrane (suggesting empyema or gangrene) are also seen.
The combination of findings (stones, non uniform wall thickening with edema or
positive Murphy’s sign) in a appropriate clinical setting gives a good positive predictive
value for sonography which also depends on more other findings.
Complications such as Empyema, gangrene, perforation etc., can occur
independently or coexist as is often the case is.
Acute Acalculous Cholecystitis:
It forms only about 5% of acute cholecystitis cases. It is seen in critically ill
patients, after surgery, trauma, sepsis, burns, total parenteral nutrition, typhoid,
cholera, miliary tuberculosis, general anesthesia etc. Extrinsic cystic duct obstructions
also can lead to acalculous cholecystitis.
Lymphadenopathy (Kawasaki mucocutaneous lymph node syndrome)
obstructing the cystic duct is the usual cause. Clinically it presents similar to calculus
cholecystitis.
Ultrasonography is often nonspecific but is diagnostic with clinical

40
background. The most suggestive findings are gallbladder wall thickening (more than
4mm in the presence of at least 5cm gallbladder length), and pericholecystic fluid in
the absence of ascites and intraluminal membaranes, representing sloughed mucosa.
Chronic Cholecystitis:
Chronic cholecystitis represents the clinico pathological entity of recurrent
mild or moderately severe pain and symptoms characteristic of biliary origin, without
the signs of acute inflammation. Typically the condition is always associated with
gallstones. Patients with gallstones have chronic cholecystitis in about 60 to 70%,
acute cholecystitis in 20% and the complications of chronic cholecystitis occurs in
10% of patients. Chronic presence of cholelithiasis eventually leads to chronic
inflammation where gallbladder becomes fibrotic, shrunken, thickened and adherent
to surrounding organs or the omentum.
Ultrasonography shows persistent smooth gallbladder wall thickening with
abundant sludge in addition to stones. Gallbladder lumen is markedly contracted (AP
diameter is < 2cms). Sludge may or may not be present which depends on patients
eating habits.
THE HYPERPLASTIC CHOLECYSTOSES:
Two conditions which are well known and reasonably well defined as
pathological entities are,
1. Adenomyomatosis
2. Cholesterolosis
Adenomyomatosis:
In this there is hyperplasia of mucosal and muscular elements with resultant
marked thickening of gallbladder wall. The hyperplastic columnar epithelium
becomes redundant and appears to grow into or become enmeshed in the basket
weave-like structure of proliferating and thickened muscularis layer, resembling
glands or diverticula. These invaginations are called as Rokitansky-Aschoff sinuses.
Three types have been recognized:
1. Generalized-involves entire gallbladder.

41
2. Segmental (annular) – is more commonly seen as thick septum at the body
causing hourglass appearance.
3. Focal (fundal) - is the most common form, seen in 5% of gallbladders and the
lesion is a localized one in the fundus.
On USG Generalized form is imaged as multiple anechoic, fluid filled and
small areas within an unusually thickened wall of the gallbladder. Because wall
thickening is so common and non-specific, it is necessary to image the sinuses by
scanning after a fatty meal which improves the demonstration of the sinuses.
Sometimes the RA sinuses may contain sludge, debris, or calcified or cholesterol
stone on which case they will be echogenic. Cholesterol stones within them may give
rise to a V shaped reverberation artifact projecting over the lumen from the wall.
Demonstration in the anterior wall is easier where it is contrasted with liver and bile
whereas the posterior wall is more often obscured by a bowel.
In segmental type the findings range from focal wall thickening to a thick band
like constriction of the gallbladder separating it into compartments. The constrictions
caused by a congenital septum is usually thinner.
Cholesterolosis:
Here the connective tissue below the luminal mucosa of gallbladder becomes
filled with foamy cholesterol laden cells. The cause and the alleged hyperplastic
process remain in doubt. Exessive hepatic production of cholesterol precursors,
increased absorption of bile cholesterol by the gallbladder mucosa and impaired
transport of cholesterol out of the mucosa have been postulated. Two forms exist:
a. Planar form
b. Polypoid form (cholesterol polyps).
Planar form:
In this, the cholesterol filled cells cause a patchy or diffuse thickening of the
usually fine, villous surface pattern of the gallbladder lining with resultant yellowish
excrescencies, that resemble tiny seeds. The specimen is likened to a strawberry since
the yellowish seeds are seen against the reddish background, thus the name
Strawberry gallbladder.

42
Imaging modalities are unhelpful since the size of the expanded villi is beyond
the limit of resolution. Sometimes all that can be seen is a non-specific wall
thickening by cross sectional imaging modalities.
Polypoid form:
These are localized manifestation of planar form with increased size of the
yellowish seeds but rarely over 1 cm in diameter. It may be solitary or multiple,
pedunculated with a thin fragile stack or sessile where the core composed of the
cholesterol filled cells are covered by a single layer of epithelium. Size rarely exceeds
1cm. They can occur anywhere in the gallbladder.
In USG they appear as small, stationary, echogenic, non-shadowing, non-
mobile masses adherent to the wall.
Differential diagnosis include gallstones, adenomas, inflammatory polyps,
carcinoids, metastases, in-situ carcinomas etc.
Carcinoma Of Gall Bladder:
Carcinoma of gall bladder is a highly malignant tumour characterized by early
metastasis and a rapidly downhill clinical course.
Ultrasonographically, three patterns of presentation have been described:
Type I: Gallbladder fossa is either replaced (Endophystic) or surrounded (Exophytic)
by a complex soft tissue mass and may vary in size from normal to markedly
enlarged. Gallbladder may be normal in shape or can be distended, nodular and
irregular. The mass is often homogenously hypoechoic with any anechoic area
representing either necrosis or residual bile. Gallbladder with acoustic shadows may
be seen trapped within it (constraint or trapped stone sign). The lack of clear
demarcation between the liver and the gallbladder mass is diagnostic. Type I, is the
most common form seen in about 40 to 50% of cases.
Type II: There is focal or diffuse, irregular, hypoechoic, wall thickening which is
asymmetric and associated with mass, adenopathy, invasion of liver or adjacent

43
structures. Occasionally sludge may layer out giving an appearance of thickened
posterior wall. It is seen in 20% of cases.
Type III: Least common. There is an irregular, intraluminal, fungating, polypoid,
mass with wide base to gallbladder wall, usually at fundus or infundibulum rather
than body. It is non mobile and nonshadowing. Stones are associated findings.
Distortion of gallbladder contour is a useful additional sign. When the entire lumen is
filled with tumour, it may be indistinguishable from sludge. When the doubt exists
colour Doppler will help to identify the abnormal neoplastic vascularization.
Other conditions that can affect gall bladder are hydrops, porcelain gallbladder,
ascariasis etc.
Biliary Tract Lesions: Choledocholithiasis:
Stone in the CBD may be primary resulting from bile stasis and infection or
secondary from gallbladder.
On sonography, if the CBD is dilated, then calculus is seen as an echogenic nodule
with acoustic shadowing. But if the CBD is minimally dilated or of normal caliber,
acoustic shadowing is usually not seen. Possible source of confusion with calculus are
gas or particulate material in the adjacent duodenum or gas in the biliary tract,
pancreatic calcification, post-cholecystectomy surgical clips.
Choledochal cysts:
Choledochal cysts are uncommon congenital cysts of the bile ducts. The cysts
usually manifest in childhood and the triad of jaundice, pain and palpable subcostal
mass is diagnostic. Sonographic findings reflect specific types of choledochal cysts.

44
Todani et al classified choledochal cysts into five types:
Type I Fusiform cystic dilatation of extrahepatic CBD.
Type II
Eccentric fluid filled cyst may be seen which may appear separate
from the CBD as its neck may be narrow.
Type III
Choledochal cyst or choloedochocele represents localized the CBD
and is difficult to diagnose on US.
Type IVA Multiple cysts involving intrahepatic and extrahepatic bile ducts.
Type IVB There are multiple cysts involving the extrahepatic bile duct only.
Type V
Also called Caroli's disease, includes single or multiple intrahepatic
bile duct cysts.
Complications are choledocholithiasis, changes due to pancreatitis and /or
biliary cirrhosis, portal vein thrombosis, hepatic abscess and malignant neoplasm
within the cyst wall and gallbladder.
Cholangiocarcinoma:
It is uncommon tumour. It is commoner in males with peak incidence in sixth
or seventh decade. High incidence is associated with sclerosing cholangitis, Caroli's
disease, choledochal cysts, and ulcerative colitis. The prognosis of distally placed
tumour is better than proximally placed tumours. Local and distant metastases are
uncommon.
Cholangiocarcinoma can be classified according to location as:
a) Intrahepatic tumour
b) Hilar lesions (the most common location) referred to as Klatskin tumour and
c) Distal ductal tumour.
Cholangiocarcinoma may occur in between these general locations.
Intrahepatic Cholangiocarcinoma - They are usually large at presentation due
to early asymptomatic course. Sonographic findings are nonspecific and may be seen
as hypo or iso echoic masses, which may be homogenous or heterogenous. Focal
intrahepatic biliary ductal dilatation and atrophy of the segment of the liver drained by
these ducts with retraction of overlying liver capsule may also be seen.

45
Hilar Cholangiocarcinoma- The most common location is either at the
confluence of right and left hepatic ducts, or the proximal common hepatic duct, and
has been termed as Klatskin tumour.
Hilar Cholangiocarcinomas are graded according to Bismuth classification.
Type 1 lesion involves common hepatic duct only; type 2 lesion involves right and
left hepatic ducts at confluence. First order branches are involved of either (type 3) or
both (type 4) of the hepatic ducts. Ultrasound demonstrates dilatation of intrahepatic
biliary radicles without any evidence of extrahepatic dilatation. Tumours may be
small and difficult to visualize on sonography. Occasionally moderately echogenic
tumour may be seen at confluence. Some time no mass seen at confluence except non-
union of right and left hepatic biliary radicles.
Distal duct Cholangiocarcinoma -The least common location for
Cholangiocarcinoma is the distal duct. Ultrasound demonstrates biliary dilatation
proximal to an abrupt obstruction. Site of lesion will determine the gallbladder
distension. There may be intraluminal polypoid lesion within bile duct. The bile duct
at the level of obstruction in cholangiocarcinoma is narrowed if the process is
primarily desmoplastic and widened if there is an obstructing intraluminal mass.
Mirrizi's syndrome:
Mirrizi's syndrome is uncommon cause for extra hepatic biliary obstruction
due to an impacted stone in the cystic duct creating extrinsic mechanical compression
of the common hepatic duct. Not uncommonly, the stone penetrates into the common
hepatic duct or the gut, resulting in a cholecystobiliary or cholecystenteric fistula.
Sonographic findings include intrahepatic bile duct dilation, a normal size
CBD, and a large stone in the neck of the gallbladder or cystic duct.
Post operative biliary strictures:
Majority of the strictures are the result of injury to the bile duct at the time of
biliary tract surgery. ERCP and PTC are investigation of choice. On sonography
smooth tapering stenosis with proximal dilation of CBD, abrupt cut off of CBD, the
presence of echogenic nodule without acoustic shadowing are findings.

46
Post- inflammatory strictures:
Inflammatory strictures caused by cholangitis, chronic pancreatitis, gallstones
and penetrating or perforating duodenal ulcer. The most frequent findings are smooth,
concentric, often tapered narrowing of the CBD. Strictures may be single or multiple
and may involve any portion of the biliary tree.
Primary sclerosing cholangitis:
Primary sclerosing cholangitis is chronic progressive disorder of unknown
etiology that occurs commonly in young men. In about 50% cases it is associated with
ulcerative colitis. In AIDS, causes of abnormalities are infection with HIV virus and
opportunistic organisms have been implicated. Sonography shows patchy smooth or
irregular wall thickening of intrahepatic bile ducts.Dilatation of biliary radicles is
usually mild.
Recurrent pyogenic cholangitis:
Recurrent pyogenic cholangitis is endemic in Southeast Asia. Recurrent nature
of the disease leads to progressive biliary strictures with marked ductal dilatation and
stone formation. The disease often progresses to cirrhosis. Sonography shows
combination of marked extrahepatic bile duct dilatation and intrahepatic bile duct
dilatation limited to segmental branches with acute peripheral tapering ("pruned-tree"
appearence), with associated biliary calculi and debris.
Parasitic diseases:
Ascaris lumbricoides- It normally inhabits the small intestine and have
propensity to migrate through the ampulla of Vater to lodge in the gallbladder and
biliary tract. On USG, the worms can be recognized as tubular non-shadowing,
echogenic structures in the dilated biliary tract. When they are alive, the movement of
the worms can be seen, and it is usually possible to see a sonolucent inner tube within
the echogenic tubular structure, which represents the alimentary canal of the worm. In
transverse section, a "bull's eye" image may be seen caused by the worm inside a
dilated bile duct. Ultrasound may also reveal hepatic abscesses complicating biliary
ascariasis.

47
Biliary Hydatid:
Hydatid disease can affect any organ of the body and liver is involved most
commonly. Rupture is an important complication of Hydatid cyst of liver. In a patient
with rupture into the biliary system, daughter cysts and membranes pass into the
common bile duct producing surgical jaundice. Sonography shows findings of
Hydatid cyst in liver (cyst with daughter cyst), with connection of Hydatid cyst with
CBD and linear echogenic material due to laminated Hydatid membranes, rounded
small cysts due to Hydatid daughter cysts and debris due to a mixture of Hydatid
membranes and daughter cysts in CBD.
Diffuse Liver Lesions: Fatty liver:
Fatty liver is an acquired, reversible disorder of metabolism, resulting in an
accumulation of triglycerides within the hepatocytes. The most common cause of fatty
liver is obesity. Other causes are excessive alcohol intake, hyperlipedemia, diabetes,
steroids, glycogen storage diseases, drugs, toxins etc.
Sonography of fatty liver may vary depending on the amount of fat and
whether the deposits are diffuse or focal. Diffuse steatosis may be,
Mild-Minimal diffuse increase in hepatic echogenecity; normal visualisation of
hepatic borders and intrahepatic vessel borders.
Moderate-Moderate diffuse increase in hepatic echogenicity; slightly impaired
visualisation of intrahepatic vessels and diaphragm.
Severe-Marked increase in echogenecity; poor or nonvisualisation of the
hepatic vessels and diaphragm.
Focal fatty infiltration and focal fatty sparing may mimic neoplastic
involvement. In focal fatty infiltrations; regions of increased echogenecity are present
within a background of normal liver parenchyma.Conversely, islands of normal liver
parenchyma may appear as hypoechoic masses within a dense, fatty infiltrated liver.

48
Feature of focal fatty change include: Focal fatty sparing and focal fatty liver both most commonly involve the periportal
region of the medial aspect of the left lobe. Sparing also occurs commonly by the gall bladder fossa and along the liver margins.
Lack of mass effect: Hepatic vessels are not displaced. Geometric margins are present although focal fat may appear round, nodular or
interdigitated with normal tissue. Rapid changes with time: Fatty infiltration may resolve as early as within 6 days.
Hepatitis: Acute hepatitis:
In acute hepatitis, there is diffuse swelling of hepatocytes, proliferation of
kupffer cells lining the sinusoids and infiltration of portal areas by lymphocytes and
monocytes.
Sonographically liver parenchyma may have a diffusely decreased
echogenecity with accentuation and brightness of portal vein radicals.Hepatomegaly
and thickening of gall bladder are associated findings.In most cases the liver appears
normal.
Chronic hepatitis:
Chronic persistent hepatitis is characterised by periportal inflammation with
preserved lobular architecture.Chronic active hepatitis is marked by more extensive
inflammation, piecemeal necrosis and often fibrosis.
Sonographically most cases of chronic hepatitis are normal.Chronic hepatitis
when sufficiently severe causes coarsening of parenchymal echogenecity with
consequent silhouetting of portal vein radical walls. This decreases the
demonstrability of portal vein branches.These findings can be explained on the basis
of inflammatory infiltrate and increased amount of fibrous tissue surrounding the
hepatic lobules. Cirrhosis, fatty infiltration, diffuse hepatocellular carcinoma,
lymphoma have been reported to produce the same findings. Periportal
lymphadenopathy can be seen in either chronic or active hepatitis but is more frequent
in active hepatitis.

49
Cardiac liver:
The ultrasound findings in cardiac liver include hepatomegaly, diffuse
hypoechoic echopattern, dilated IVC, dilated hepatic veins, serous effusions into
pleural, pericardial and peritoneal cavities.
Cirrhosis:
Cirrhosis is defined as a diffuse process characterised by fibrosis and
conversion of normal liver echotexture into structurally abnormal nodules.
Common causes are alcohol abuse, chronic active hepatitis, prolonged biliary
obstruction, toxic drugs etc.The classic clinical presentation is hepatomegaly, jaundice
and ascitis.
Sonographic patterns associated with cirrhosis include:
Volume redistribution :In early stages of cirrhosis the liver may be enlarged,whereas
in advanced stages the liver is often small.,with relative enlargement of caudate lobe,
left lobe or both in comparison with the right lobe. Several studies have evaluated the
ratio of caudate lobe width to the right lobe width as an indicator of cirrhosis. A C/RL
value of 0.65 is considerd as indicative of cirrhosis. The sensitivity is high but
specificity is low indicating that C/RL ratio is useful measurement if it is abnormal.
Coarse echotexture Nodular surface-Irregularity of liver surface has been appreciated as a sign of
cirrhosis when the appearance is gross or when ascitis is present.
Regenerating nodules represent regenerating hepatocytes surrounded by a fibrous
septa.Because they have a similar architecture to the liver, ultrasound has a limited
ability in their detection.
Dysplastic nodules are larger than regenerating nodules and are considered
premalignant. They contain well differentiated hepatocytes, a portal venous blood
supply and also atypical or frankly malignant cells. In patients with cirrhosis and liver
mass, percutaneous biopsy is often performed to exclude or diagnose hepatocellular
carcinoma.

50
Associated abnormalities:
Splenomegaly, ascitis, portal hypertension, varices may be present. Portal vein
diameter exceeding 13mm is characteristic of portal hypertension. Some authors have
identified that portal vein diameter over 17mm is 100% predictive of large varices.
Splenic vein calibre >20mm should be considered a specific sign of portal
hypertension.
Portosystemic collaterals:
The most common collaterals are left gastric (coronary) and paraumbilical
veins. Other portal collaterals are retroperitoneal, splenorenal, splenoperitoneal, short
gastric, inferior mesenteric vein to haemorrhoidal.
Doppler findings: Cirrhosis often causes narrowing of hepatic veins with loss of normal phasic
waveform and the waveform is flattened. The enlarged hepatic arteries usually have
high velocity (frequency shifts) usually with aliasing compared with normal hepatic
artery. A resistive index of 0.78 in the hepatic artery is specific for portal hypertension,
but not sensitive. Portal vein flow reversal or portal collaterals may prompt the diagnosis
of portal hypertension. Other portal flow abnormalities include bidirectional flow and
rarely nearly static flow.
Brilliant Liver Echopattern:
Causes are cirrhosis fatty infiltration, chronic liver disease, glycogen storage
disease, diffuse infiltrative processes such as military tuberculosis, metastasis, steroid
administration.
Other diffuse hepatic diseases:
In general any diffuse process inflammatory, neoplastic or infiltrative process
causes disruption of parenchymal echoes.
Focal Liver Lesions:
Simple Cysts:
Ultrasonography is one of the most sensitive diagnostic modalities for the
detection and characterization of cysts. This is especially true of the liver, where the

51
echogenecity of the liver parenchyma presents a good background against which one
can easily recognize an anechoic cyst. Cysts are characterized by two sets of criteria:
1. Those related to the physical interaction of the sonic beam with the fluid are
relatively low protein concentration, low viscosity and velocity.
2. Those related to the accepted morphologic criteria of the simple cyst.
Fluid tends to return no echo signals from an ultrasound beam. Also, fluids with low
viscosity and low protein concentration tend to attenuate the beam very little. Finally
there is refraction of the sound beam at the edges of the cystic lesion. This
phenomenon is noted on scans by the presence of edge shadow. It also causes the cyst
to act as a weakly focusing lens, thus increasing the acoustic enhancement. In terms of
morphologic criteria, simple cysts tend to have smooth margins and essentially
imperceptible walls and they lack septations. The presence of mural nodules, thick
walls, numerous septa or fluid levels should suggest other probable diagnosis.
Primary liver cysts are congenital and arise from developmental defects in the
formation of bile ducts. They are relatively uncommon and are lined by cuboidal
epithelium. The right lobe is affected more than the left. Average cyst size is 3 cm.
Acquired cysts are essentially indistinguishable from primary cysts on ultrasound and
occur secondary to trauma, inflammation or parasitic infestation etc. The differential
diagnosis will include a necrotic metastasis, hydatid cyst, hepatic
cystadenocarcinoma, hematoma or abscess.
Polycystic Liver Disease:
Majority of patients with polycystic liver disease have renal cysts. Polycystic
renal disease is an autosomal dominant condition and approximately one-third of
patients with polycystic disease of the kidney have found to have liver cysts. The
most common presentation being hepatomegaly. The presence of multiple liver cysts
may distort the normal architecture considerably. Acoustic enhancement may produce
an impression of abnormal pattern in addition to the cysts.
Hydatid Cysts:
Hydatid disease of the liver is caused by infestation with the species of
cystodes- Echinococcus granulosus and is endemic in our country. Liver is the most
frequently involved organ. The larvae of E.granulosus gain entry into the portal

52
venous system by penetrating the intestinal mucosa. Smaller daughter cysts arise from
the germinal epithelium which is the endocyst. On ultrasound it may appear as purely
cystic, solid or mixed. A variety of ultrasound appearances may be demonstrated by
hydatid cysts:
a. Solitary Cyst:
A single may be quite indistinguishable from a simple congenital liver cyst
and may vary in size from 1 to 20 cms. It appears as a well-defined sonolucent mass
with smooth borders and good posterior enhancement. The simple and hydatid cysts
may be distinguished by noting the following features:
1. Debris consisting of sand or scolices may be present within the hydatid
cyst. This can be accentuated by moving the patient during the
examination.
2. Wall calcification may occur years after the initial infection. Simple liver
cyst rarely, if ever, calcifies. The presence of a complete rim of
calcification suggests an inactive lesion.
3. It may be possible to discern the two layers of the wall of the hydatid cyst.
b. Separation of the Membrane:
“Ultrasound waterlily sign” results from detachment and collapse of the inner
germinal layer from the exocyst. The collapsed germinal layer is seen as an
undulating linear collection of echoes either floating in the cyst or lying in the most
dependent portion.
c. Daughter Cysts:
The development of daughter cysts produces a characteristic cysts within a
cyst appearence. This appearance is described as a cart-wheel or honey-comb cyst.
d. Multiple Cysts:
Multiple parent cysts may develop within the liver due to continuous
infestation often producing hepatomegaly with normal liver tissue between the
individual cysts. The diagnosis of hydatid disease may be difficult in the absence of

53
membrane separation or daughter cyst formation. The differential diagnosis should
include chronic hematomas, necrotic hepatic metastasis, abscess, simple cysts, bile
duct cyst and polycystic disease.
Abscess: a. Amoebic Liver Abscess: Occurs in an average 8.9% of patients having clinical amoebic infection. Entamoeba histolytica primarily infects the colon. The disease is contacted by
ingesting the cysts in contaminated food and water . The trophozoites emerge to
colonize and ulcerate the colon. Invasion of the colonic mucosa allows the amoebae to
be carried in the portal venous system to the liver. An amoebic abscess may be
indistinguishable from a pyogenic abscess.
A strongly suggestive but not pathognomonic pattern consist of:
1. When infection has been established there is liquefaction necrosis of the
hepatocytes with little leucocytic response of fibrotic reaction, producing
classical anchovy sauce pus. Pathologically the walls of this abscess have a
shaggy fibrin lining and hence there is lack of significiant wall echo, so that
they appear to be punched out lesions.
2. Distal acoustic enhancement.
3. Oval or round configuration.
4. Less reflective than the liver.
5. Subcapsular location.
Some may show a bizarre sonographic appearance. e.g. an irregular
echogenicity interspersed with disorganized low level echoes.
b. Pyogenic Abscess:
Pyogenic abscesses occur as a complication of an intra abdominal infection
with portal venous spread to the liver. Common aetiological sites of infection
include the biliary tract, Crohn's disease, appendiceal abscess, colonic
diverticulitis etc. Frequently the source of infection is not found.
Ultrasound usually shows a oval or slightly irregular echo poor lesion with

54
distal enhancement. This pattern is present in three quarters of patients. Great
variability is common and depends upon both the age and causative organism. A
significant number of abscesses can be higher in reflectivity than the adjacent
normal liver. This may be related to a mixture of differing contents producing
strong interfaces or air bubbles. In chronic abscess a wall of variable thickness
may be present
Candidiasis:
Hepatic candidiasis is uncommon .The typical ultrasound appearances are of a
target lesion with a small highly reflective center and a poorly reflective halo.
Multiple lesions are characteristic. Fine needle aspiration is necessary for a definitive
diagnosis.
Haematoma:
It may occur following a blunt abdominal trauma or rupture of a cavernous
haemangioma or a hepatic adenoma.
Three major categories of liver trauma are:
a. Rupture of liver and its capsule. It is a serious injury and is best assessed by CT.
b. Subcapsular haematoma.
c. Central haematoma.
In acute situation, central haematoma tends to be highly reflective due to the
erythrocytes forming multiple acoustic interfaces and fibrin content. With time the
clot undergoes liquefaction, which corresponds with decreasing reflectivity and an
apparent increase in size. The haematoma may become cystic and develop internal
stranding over a period of months. The residual fibrous scar or a small cyst may
persist in the long term.
Benign Hepatic Neoplasms: a. Haemangiomas:
Hepatic cavernous hemangiomas are the benign tumors of the liver. They are
usually solitary but are multiple in 10% of cases. They are usually less than 3 cms in

55
diameter but they may become very large. Majority of liver haemangiomas will not
change in size over a period of several years. Histologically they consist of blood
filled spaces lined by a single layer of endothelium separated by fibrous septa.
Calcifications or phleboliths are rare. Central thrombosis may occur which leads to
fibrosis.
Hepatic haemagiomas are usually asymptomatic.
Ultrasonographically, it appears as a sharply defined homogenously
hyperechoic round tumor without a hypoechoic peripheral border. This echogenic
appearance of a haemangioma is thought to be due to multiple interfaces between the
walls of cavernous sinuses and the blood contained within. A minority of
haemangioma may present as an isoechoic or hypoechoic mass relative to the liver
parenchyma. Haemangiomas larger than 2.5 cm. may show posterior acoustic
enhancement.
Some haemangiomas, especially if they are large (> 5-6 cm in diameter) present a
heterogenous echo pattern. This is thought to be due to thrombosis, fibrosis,
degeneration or haemorrhagic necrosis. Atypical appearance makes distinction from
other focal lesions difficult.
b. Adenoma and Focal Nodular Hyperplasia:
Hepatic adenoma is a rare benign tumour of liver.They are composed of
normal hepatocytes, without lobular architecture, thus without bile ducts, portal triads
or centrilobular veins. Kupffer cells are mostly absent. It is partly or completely
encapsulated and strongly vascularised. They have a strong association with the use of
oral contraceptives based on oestrogens and occur predominantly in young women.
They are more symptomatic than focal nodular hyperplasia. Pain is present in 40-50%
of patients. Multiple adenomas occur in children with type-l glycogen storage disease.
Focal nodular hyperplasia occurs predominantly in females but the mean age is
higher than that for adenomas. It is uncapsulated lobular mass with septations and a
central stellate structure. Within the central scar and fibrous septa, hyperplastic
vessels are present. Microscopically they are composed of units of hepatocytes,

56
kupffer cells with sinusoids and bile duct structures.Usually are asymptomic. Hepatic
adenomas are usually echogenic but may occasionally be hypoechoic. Sonolucent
areas within the lesion occur due to haemorrhage. There are no definite ultrasound
features that distinguish hepatic adenomas from focal nodular hyperplasia.
The lesions are usually homogenous with a slightly differing reflectivity to the
normal liver. An echo complex corresponding to the central fibrous scar although
classical, is infrequently demonstrated.
Malignant Hepatic Tumors:
Ultrasound detects liver tumors, whether primary or secondary by
demonstrating the lesion itself as a mass of greater or less reflectivity than the
surrounding liver, together with changes caused by its expanding or invasive nature.
This depends on a combination of resolution and contrast so that smaller lesions can
be detected when there is a marked difference in reflectivity from the background,
whereas low contrast lesions should be larger to be demonstrable.
As tumor expands, they distort the nearby architecture and recognition of these
features often draws attention to the abnormality. Enlargement of the liver is often
difficult to detect until gross, due to the wide range of normal variation.
Focal mass effects may be seen as local humps on the liver surface or as
deviations of the normal straits or curved course of the liver veins. These humps are
more obvious when the liver is surrounded by ascites, but it can also be demonstrated
in its absence. Both the portal and hepatic veins may be involved. The intravascular
tumor may be visualized as reflective material within the vessel. Color Doppler is
used to evaluate the flow.
Segmental localization of the position of a lesion may be important especially
when segmental resection is planned. The primary distinction is the main left-right
division of the liver, corresponding to the lie of the middle hepatic vein, which runs
from the gall-bladder fossa superiorly to the inferior venacava. The left lobe is then
divided by the ligamentum teres into medial and lateral segments. The right lobe is
divided into anterior and posterior segments based on the right hepatic vein which lies

57
more or less in a coronal plane.
a. Hepatocellular Carcinoma: It is the most common malignant neoplasm of the liver. Risk factors include
hepatitis B and C infection, alcoholic cirrhosis, haemochromatosis and exposure to
carcinogens like aflatoxin. Alfa-foetoprotein is a useful serum marker and is elevated
in 50-70 percent of cases. It may be focal and diffuse. During the early application of
ultrasound only advanced cases were diagnosed, early lesions were seen in population
surveys and patients with cirrhosis who were under surveillance.
Three patterns have been described: 1. Nodular- when the contour of the tumor is regular and the boundary with the
parenchyma is well defined. The nodules may be single or multiple.
2. Massive - when the tumor is large (more than 5 cm) and boundary with the liver
parenchyma is difficult to recognize.
3. Diffuse- when the mass is indistinct and large portions of the parenchyma are
involved by the tumor.
The reflectivity of hepatocellular carcinoma depends on their size and
pathological characteristics. The mass may show echogenicity which is less than,
equal to, or greater than that of normal liver.
In some cases the mixed echo patterns with areas of both increased and
decreased reflectivity may be found. An echopoor nodule may be occasionally in a
large mass, representing differentiation of cell lines within a pre-existing tumor, the
tumor in tumor phenomenon.
The highly reflective pattern is most frequent, being present in about half of all
cases. However small hepatocellular carcinomas. (less than 3cms ) tend to be poorly
reflective. Some tumors may present echogenecity (mosaic pattern).
Fibrolamellar hepatocellular carcinomas present as large masses with central
fibrous scar.

58
Hepatocellular carcinoma has a strong tendency to invade the portal venous system.
The hepatic veins and the inferior vena cava may also be frequently involved.
Vascular invasion is recognizable as a mass within a portal branch or even a portal
trunk. Portal vein involvement is more frequently detected by ultrasound than by CT
or angiography.
b. Metastatic Tumours:
Liver is one of the commonest sites for metastasis . This can be attributed to its
large size, high rate of blood flow and double perfusion by the portal vein and hepatic
artery. The route of tumor spread to the liver is more likely to be haematogenous
rather than lymphatic, because for the most part of the liver's lymphatics are
hepatofugal. Metastasis is more common in the right lobe of the liver and are usually
multiple. The most common primary tumors are those of the gut, breast, lung and
melanoma.
Ultrasound Appearances:
The wide range of appearances are encountered in liver metastatic disease.
Focal lesions are commonest but the malignancy may also be infiltrated widely. The
commonest focal patterns are of echo-poor masses. The difference in reflectivity may
be sufficient that the lesions are very obvious and may virtually be echo free.
However the difference in reflectivity may sometime be slight so that lesions are
difficult to demonstrate. Echo-poor lesion may be produced by any type of primary
tumor. They are typical of many of the common tumors as in breast and bronchial
malignancies.
Deposits that are more reflective than the liver, are easier to detect. Highly
reflective lesions may be surrounded by an echo-poor band which may be merely a
fine line (known as a halo) or be obvious as a border several millimeters thick. This is
known as the target or “bull's eye” pattern and is more often seen in larger lesions.
Highly reflective and target lesions are typically of tumors originating in the
gastrointestinal tract and urogenital tract. Metastatic lesions may take the form of
echo free areas. These are recognized by distal enhancement caused by them. They
may contain clear fluid as may be produced by mucin secreting lesion (e.g., ca-
pancreas/ovary) but contain debris when the fluid represents tumor necrosis. This type
tends to have shaggy walls and are less likely to be mistaken for simple cysts.

59
Calcified lesions have very intense echos and may show shadowing if the foci are
sufficiently large. Calcification commonly occurs in secondaries from colorectal and
gastric carcinomas as well as neuroblastomas.
One of the more difficult differential diagnosis is that from haemangiomas
which also have a variety of echo patterns. Although a definite differential diagnosis
is not possible based on ultrasound alone. Haemangiomas are typically situated
subcapsular, are solitary (usually), small in size (less than 2.5cms) and have
uniformly high amplitude echoes. They lack any echo-poor halo. Some may show
posterior enhancement which is not described with reflective metastasis.
Metastasis may become diffuse by conflict growth of initially separated foci.
This results in an irregular pattern throughout the involved portion (or whole liver)
with ill defined patches consisting of geographic echo-poor areas. Diffuse
involvement is also a feature of lymphomas and leukemias, although focal
involvement may be seen in lymphomas (echo-poor).

60
BASIC PHYSICS OF ULTRASOUND
Diagnostic ultrasound employs pulsed, high frequency sound waves that are
reflected back from body tissues and processed by the ultrasound machine to create
characteristic images. Ultrasound is a form of mechanical energy which passes in
wave form like sound waves and having a frequency waves; the same type of wave as
detected by the human ear, except the frequency is higher. Ultrasonic imaging uses
frequencies in the range from 1 to 20 Mhz at powers from 0.01 to 200 mW/cm2. The
ultrasound is generated and received by piezoelectric transducers. Ultrasound can be
aimed in a specific direction and obeys the laws of geometric optics with regard to
reflection, transmission and refraction. When an ultrasound wave meets an interface
of differing echogenicity, the wave is reflected, refracted and absorbed. Only
reflected sound waves (echoes) can be sensed by the transducer and processed to
generate an Image. The transducer acts as a receiver over 99% of the time.
Generation of Ultrasound Transducer
An instrument which converts one form of energy into another. In
ultrasonography, transducers convert electrical energy into mechanical energy to
produce ultrasound and vice versa.
The part of the transducer which does this work is a piezo electric crystal. It
can be synthetic or natural. They have an inherent property of vibrating when an
electric current is applied and thus produce ultrasonic waves and conversely produce
electric impulse when vibrated thus helping the acquisition of data for the formation
of image. This effect is called "Piezoelectric effect".
Quartz is a naturally occurring piezoelectric crystal. Synthetic ones are
prepared from ceramics like lead zirconate and lead titanate.

61
Fig. 32
Fig. 33

62
The pulse-echo principle
As the crystal in the transducer is electrically pulsed, it changes shape and
vibrates thus producing the sound beam that propagates through tissues. The crystal
emits sound for a brief moment and then waits for the returning echoes reflected from
the structures in the plane of the sound beam. When the echo is received, the crystal
again vibrates, generating an electrical voltage comparable to the strength of the
returning echo. This is called the pulse echo principle.
The transducers used in ultrasound are piezoelectric ceramics. These are
crystals with polar electric axes. If the crystal is deformed by mechanical forces in
certain directions, it becomes electrically polarized. Similarly if a voltage is applied
along these axes, the crystal mechanically deforms. So the crystals can be used both
to transmit and receive ultrasound as per the pulse echo principle mentioned above.
The most commonly used crystals are barium titanate, lead zirconate titanate (PZT)
and the polymer polyvinylidene difluoride (PVDF). The acoustic waves in the tissue
are longitudinal, i.e. take place in the direction of propagation of the wave.
The transducers are usually disk shaped. The piezoelectric crystal is
sandwiched between a backing layer and an impedance matching layer. The crystal is
usually a half wave length in thickness. For PZT at a frequency of 1 Mhz, this means
a thickness of 2.085 mm, the speed of sound in PZT being 4170 m/s. The backing
layer is epoxy resin containing 1 part in 20 of tungsten powder. It absorbs back
radiation and provides coupling to the crystal.
Leads are connected to the top of the backing layer and the front of the crystal
to receive signals and provide the exciting voltage. The matching layer is an odd
number of quarter wavelengths thick and has characteristic impedance which is the
geometric mean of the crystal and body tissue. A series of matching materials of
different impedances may be used to provide a more gradual change in impedance
and so reduce reflected radiation at the interface with the body.
The ultrasonic beam shows two zones: the near field (Fresnel region) and the
far field (Fraunhofer region). In the near field, all the components of the beam
propagate in parallel. In the far field, the beam diverges. An acoustic lens can be

63
placed in front of the transducer so that in the near field the beam is convergent
before a focus zone, after which it becomes divergent in the far field. This allows a
greater range of useful beam into the body before it becomes divergent and so loses
resolution.
The beam is diffracted, scattered and absorbed by the tissue. A small
proportion is reflected back by each structure in the tissue and is used to form the
image, knowing the time for the round trip from the transducer, out to the pint of
reflection and back to the transducer. Thus the signal loses strength roughly
exponentially with distance (or time). To compensate for this and ensure the image
has an even brightness, the amplifier of the received signal has a gain that increases
exponentially with time form the instant of pulse transmission by the transducer.
The attenuation of the beam sets a practical limitation on the depth into the
body that can be imaged. As a rough rule of thumb, the beam can form images to a
depth of 200 wave lengths. Thus lower frequency beams can penetrate to a greater
depth than higher frequencies. However the lower frequency beam has a lower spatial
resolution than the higher frequencies. Generally most machines have a number of
transducers operating at different frequencies. The one that is used in any given
situation is the highest frequency transducer that can achieve the desired depth of
penetration.
Ultrasonic Tissue Characteristics
The attenuation of ultrasound in water is due to viscous absorption and is
proportional to the square of the frequency. In tissues between 1 MHz and 10 MHz
the absorption is proportional to the frequency. The mechanism is believed to be due
to a relaxation process in which energy is removed from the beam by a vibrating
particle and then returned at a later time. The intensity of the ultrasound bema
decreases as it travels away from the transducer because of the beam divergence,
absorption, scatter, and reflection of wave energy at tissue interfaces; these factors
influence the intensity of the returning echoes. Stronger echoes are returned when the
beam is perpendicular to the imaged structure.

64
Different tissues have different attenuation coefficients and this determines the
quantum of reflection. This property has helped in imaging, tissue characterization
and appropriate diagnosis.
Tissue attenuation at 1 MHz
Tissue Attenuation Coefficient (dB/cm)
Air 10
Blood 0.18
Bone 10-Mar
Lung 40
Muscle 1.65-1.75
Other soft tissues 1.35-1.68
Water 0.002
The range of the velocities of ultrasound in body tissues is fortunately limited,
so that time of return of an echo is a reliable indication of depth. Small variations
give rise to geometrical distortions. The variations can be used to give useful clinical
information. Typical velocities are show below:
Tissue Propagation Velocity
Material Velocity of Sound (m/s)
Air 330
Fat 1450
Water 1480
Average Human Soft Tissue 1540
Strength of the reflected sound wave also depends on the difference in "acoustic impedance" between adjacent structures.

65
Acoustic Impedance
It is a fundamental property of matter. The Impedance of a material is a
product of its density and the velocity of sound in the material. Z = PV Z = acoustic impedance P
= density (gm / cm3)
V = velocity of sound (cm / sec)
The greater the mismatch in acoustic impedance between two adjacent tissues
the more reflective will be their boundary.
Material Acoustic Impedance
Air 0.004
Fat 1.38
Water 1.48
Average Human Soft Tissue 1.63
Liver 1.65
Bone 7.8
Most abdomen and pelvic examinations are done with a 2.5 - 3.5 MHz or 5
MHz transducer. The frequency is determined by the thickness of the crystal. 1 MHz crystal is 0.5 mm thick 2 MHz crystal is 0.25 mm thick
Focal zone: The distance from the face of the transducer at which the ultrasound
beam is narrowest. Images are better if the region of interest is within the focal zone.
Various Ultrasound Displays
Electrical signals received from the transducer can be displayed on visual TV
screen by the following modes.
1. A mode - Amplitude mode
2. B mode - Brightness mode
3. M mode - Motion mode or TM mode - Time motion mode
4. Real time B mode scan display

66
A mode (Amplitude mode)
It is a one dimensional image displaying the amplitude strength of the
returning echoes signals along the vertical axis and the time (the distance from the
transducer) along the horizontal axis.
It is the most basic form of the diagnostic ultrasound in which a single beam is
analyzed.
Practical uses 1. In ophthalmology - for the measurement of the internal dimension of the eye,
especially when the lens has become opaque. 2. To determine the brain midline-useful in accident cases. 3. Accurate measurements of fetal head size. B mode - Brightness mode
It is similar to A mode expect that instead of spikes which represent returning
echoes, a series of bright dots are produced. Brightness of each dot is representative
of the amplitude of returning echoes.

67
M mode / TM mode
In these, besides stationary structure, echoes from moving structures can be
received and displayed like heart, aorta, diaphragm etc. the stationary reflecting
surface will display straight lines on graph but moving interface will produce wiggy,
curved lines. This is used in echo.
B – Scan
B scan display is a 2-D sectional display of objects parallel to the direction of
sound beam. It is an advanced computerized aggregation of B mode display to
accumulate B-mode dots to form one cross sectional image. It is a static image.
Grey scale imaging
It displays great variations in the amplitude of echoes which come from
tissues, as varying shades of grey on TV screen. The variations of brightness of dots
are displayed in various shades. This is possible due to computer development of scan
converters.
Real time ultrasound
B-Scan produces a single image frame. A real time ultrasound transducer
produces multiple images in a very short time i.e., at least 16 or more images (frames)
per second, which gives us a impression as though we are seeing the moving
structures in real.
This quick presentation of images is possible by oscillating the piezoelectric crystals.
Types of Real Time Transducers: 1. Mechanical scanner 2. Electronic array scanner
Mechanical scanner
In this, one piezo electric crystal (transducer element) or a group is used. They
are made to move mechanically by electric motor. This produces a sector image
format or a trapezoid image format.

68
Electronic array scanner
These contain many small rectangular transducer elements about 2 x 10 mm
size arranged adjacent to each other. Here the transducer element doesn't move but the
ultrasound beam is made to move. This is a gain of 2 types:
a) Liner array transducers which produce linear or rectangular scan format. b) Phased or steered array transducers which produce sector scan format.
Ultrasound controls - Basic principles
The power output control affects the echoes throughout the ultrasonic field by
regulating the amount of sound through the transducer (gain) or varying the strength
of the signal after it has come back to the transducer (attenuation). The size of all
echoes is altered when the gain is changed.
Time Gain Compensation (TGC)
The method or technique of correcting the attenuation or absorption of sound
waves in tissues is called time gain control.
It attempts to compensate for the acoustic loss that occurs by absorption,
scatter and reflection and to show structures of the same acoustic strength as echoes
of the same size whatever their depth.
Hence to get a good image, near gain is reduced and far gain is increased.
Dynamic Range
It is the ratio of largest signal to the smallest signal that a system can handle. It
is expressed in decibels.
Descriptive terms used in Ultrasonography
Tissues that strongly reflect ultrasound are hyperechoic or of increased
echogenicity. They appear brighter on the monitor. Poorly reflecting tissues are
hypoechoic i.e., less bright, while fluid, which does not reflect sound, is anechoic or
sonolucent i.e., they appear dark on the monitor.
Ultrasound Artifacts
Artifacts are echoes that appear on the image that do not correspond in location or

69
intensity to actual interfaces in the patient. They can be of two types: 1. Good Artifacts - which are helpful 2. Bad Artifacts - which are disturbing
Good Artifacts
Acoustic shadowing
Acoustic enhancement
Comet tail
Bad Artifacts
Refraction
Reverberation
Mirror Image artifacts
Beam width artifacts
Movement artifacts
Operator pressure artifacts

70
METHODOLOGY
The present study consisted of 150 patients with various hepatobiliary lesions
referred between January 2013 to June 2014 from various clinical departments of
Navodaya Medical College and Hospital to the Department of Radiology. Majority of
the patients were referred to our Department with clinical suspicion of a hepatobiliary
lesion. In some patients intrahepatic lesions were found incidentally.
There were patients of both sexes and their ages were above 5 years and below
85 years, with maximum number of cases in the age group of 31 to 60 years. The
youngest patient was 9 year old and the oldest patient was 81year old.
Equipment
In the present study, real time ultrasound examination was carried out using
3.5-5 MHZ curvilinear transducer of TOSHIBA Istyle nemio XG ultrasound machine
at NAVODAYA MEDICAL COLLEGE and HOSPITAL, RAICHUR.
Patient preparation and scanning techniques
Prior to the ultrasound examination a brief relevant history was taken and a
quick examination was performed as per the proforma given below. A provisional
diagnosis was made as per the history and examination findings. Routine blood and
urine investigations and liver function tests were also carried out.
Patient were kept nil per oral for a few hours prior to the ultrasound
examination wherever possible. In some cases, the clinical condition of the patient
demanded an ultrasound examination without prior preparation. Patient were
examined in the supine position, to begin with and then in the decubitus (right or left),
sitting position etc. if required.
A thorough ultrasound examination of the liver was carried out. The liver was
scanned in various planes like the sagittal, parasagittal, transverse, oblique, subcostal,
intercostals, coronal etc. Various observations of the hepatobiliary lesions were made.

71
This included:
1. The number of lesions:
Solitary or Multiple.
2. Location of the lesion:
The lobe of the liver involved, the relation of lesion to the surfaces of liver,
relation to the vessels (hepatic veins, portal veins and inferior venacava) etc. were
studied.
3. Reflectivity:
The reflectivity of the lesions was compared with that of the normal liver
parenchyma, i.e. whether the lesions were more reflective, less reflective, non-
reflective, or mixed echogenic (hyperechoic/hypoechoic/anechoic/complex).
4. Size, shape and margins:
The assessment of the size, contour and echopattern of the liver was made.
A note was made of the shape of the lesion i.e. round /oval /irregular /etc. and
size measured. The margins of the lesion were studied i.e. whether well defined or
poorly defined, regular or irregular.
The vessel involvement, abnormalities of the biliary tract, lymphadenopathy,
presence (or absence) of ascites etc. were also made.
5. Calcification:
Calcification in the liver is the end result of a number of infections and
infestations including tuberculosis, syphilis and parasitic disease. Liver abscess and
haematoma may also be develop dystrophic calcification in the long term. Porcelain
gall bladder is the common name for the calcified gall bladder.
Methodology of Scanning Proper technique of scanning is very important in obtaining the right diagnosis
in any patient.

72
Transducer is first placed in the right 7th intercostals space along the anterior
axillary line, in the coronal plane and slightly tilted obliquely to see the portal vein,
common bile duct, gall bladder and the adjacent liver with slight movements of the
probe. Then the transducer is slowly moved one intercostals space up to see the
diaphragmatic respiratory excursions, costophrenic angle and the subdiaphragmatic
area. Now the transducer is moved two spaces down in the mid axillary line to see the
right kidney, its movements with respiration, adrenal area and the Morrison's pouch.
Next, the transducer is placed in the epigastrium below the xiphoid process, in
the longitudinal and axial planes to see the left lobe of liver. Then the transducer is
slowly moved down in the transverse plane to visualize the pancreas, stomach, IV C,
Aorta, their branches and the para-aortic areas. Duodenum is seen just lateral to the
pancreatic head in which the terminal portion of the CBD is also seen. As the
transducer is moved down slowly in the midline from the epigastrium right up to the
symphisis pubis, Retropertoneum anterior to the Aorta and IVC are studied.
Next the transducer shifts to the left 8th intercostals space, in the coronal plane
to visualize the left kidney, its movements and then slowly move up one intercostals
space to see the spleen, left dome of diaphragm, its movements, the costophrenic
angle and the subdiaphragmatic area. Two spaces down in the same plane, Aorta ant
the para-aortic areas can be seen well.
Then the transducer is placed in the supra-pubic area in the transverse plane
and slowly pan the transducer below upwards to study the prostate, seminal vesicles,
vesicoureteric junctions, ureteric jets and the bladder. In females uterus and cervix are
studied. Now keep the transducer in the sagittal plane and pan across from left to right
and vice versa to study the same structures in their sagittal axis and also to se for the
pouch of Douglas. With slight obliquity to the left and right, both the ovaries and the
adnexae can be studied.
Next, the transducer is moved to the right iliac fossa to study the Appendix,
Caecum, Ileocaecal junction and the adjacent structures. Puylaert's Graded
Compression technique is used to study the appendix. Mild compressions are applied
and the overlapping bowel loops are moved away from the appendix. With a high

73
frequency transducer, Caecum is identified just adjacent to the right iliac bone, which
normally moves with respiration and appendix is looked for near the inferior aspect of
the Caecum. High frequency transducer gives excellent detail about the Appendiceal
walls, contents, presence or absence of any appendicolith, inflammatory changes in
and around the Appendix and the caecum. Graded compressions are applied to see for
the compressibility of the appendix. Any adnexal pathology also can be studied as the
transducer is slowly moved inferomedially.
To complete the scanning, left iliac fossa and the retropertoneum are also
studied. Retroperitoneum can be studied from different windows. After the right
kidney is studied along the right anterior axillary linetransducer is slowly panned
anteroposteriorly to see the paracaval area, Renal spaces Peritoneal recesses and the
adrenals. Similarly paraaortic and the left renal spaces of theRetroperitoneum can be
studied in coronal axis along the left anterior axillary line. As the transducer is moved
down in the midline from the epigastrium to the pubic symphysis, Retroperitoneum
anterior to the Aorta and the IVC are studied.
Guidelines for the Abdominal and Retroperitoneal Examination
The following guidelines described the examination to be performed for each
organ and anatomic regions in abdomen and retroperitoneum. A complete
examination of upper abdomen would include the liver, gall bladder and biliary tract,
pancreas, spleen and limited views of both kidneys. A complete retroperitoneal
examination would include the images of the aorta, IVC, retroperitoneal abnormalities
such as lymphadenopathy, masses or fluid collections, views of the kidneys and in the
case of neonatal retroperitoneal examinations imaging of adrenal glands. The liver,
gallbladder, pancreas, spleen, kidneys, urinary bladder, adrenal gland, aorta and IVC
also may be imaged separately or in combination.
Liver - The liver survey should include both long axis (coronal or sagittal) and
transverse views. The liver parenchyma should be evaluated for focal or diffuse
abnormalities. Views comparing the echogenicity of the liver to the right kidney
should be performed. The major vessels (Aorta/IVC) in the region of liver should be
imaged, including the position of IVC where it passes through the liver. The regions
of ligamentum teres on the left, dome of the right lobe, right hemidiaphargm and right

74
pleural space should be imaged. Hepatic veins should be visualised in both lobes. The
right and left branches of portal vein should be identified. Spectral or color Doppler
may be used to document blood flow and blood flow direction in the hepatic artery,
hepatic veins and portal veins as well as to identify collateral venous pathways. The
above protocols in ultrasound examination of abdomen is widely accepted and
followed. AMERICAN INSTITUTE OF ULTRASOUND IN MEDICINE has
recommended the same86
.
Gall bladder- The gall bladder should be scanned with the patient in left lateral
decubitus position in addition to supine position so that stones in the neck may roll
into the more accessible fundus. Prone and upright or seated scanning positions are
sometimes helpful.

75
Image 01
Gall Bladder Carcinoma
Image – 02
Acute Cholecystitis

76
Image – 03
Gall bladder polyp
Image – 04
Chronic Cholecystitis

77
Image – 05
Choledocholithiasis
Image – 06
Choledochal cyst

78
Image – 07
Klatskin tumour
Image – 08
Amoebic Liver Abscess

79
Image – 09
Multiple Amoebic Liver Abscesses
Image – 10
Hydatid Cyst

80
Image – 11
Simple Liver Cyst
Image – 12
Liver Haematoma

81
Image – 13
Haemangiomas
Image – 14
Hepatocellular Carcinoma

82
Image – 15
Liver Metastasis
Image – 16
Metastasis – Bull’s Eye (Target) Lesions

83
Image – 17
Congestive Liver
Image – 18
Cirrhosis

84
Image – 19
Cirrhosis
Image – 20
Acute Hepatitis

85
RESULTS
Ultrasound scan was performed on 150 patients who presented with history,
symptoms and signs of hepatobiliary lesions. The results are enumerated below:
Table -1 : Table showing Incidence of Hepatobiliary lesions studied
Sl. No. Type of Hepatobiliary Lesion Male Female Total
1 Gall Bladder Lesion 16 34 50
2 CBD Lesion 3 2 5
3 Focal Liver Lesion 34 16 50
4 Diffuse Liver Disease 27 18 45
The above table illustrates the number of cases of Hepatobiliary lesions encountered
in the study. Gall bladder lesions was found in 50 cases(33%).5 cases of CBD
lesion(3%).50 cases of focal liver lesions (33%) and 45 cases of diffuse liver
diseases(30%) were studied.
Chart 1 : Chart showing the Incidence of Hepatobiliary lesions
0
5
10
15
20
25
30
35
40
45
50
Gall Bladder Lesion
CBD Lesion Focal Liver Lesion
Diffuse Liver Disease
16
3
34
27
34
2
1618
50
5
50
45
Male
Female
Total

86
Table-2 : Table showing Age & Sex Incidence of Gall bladder lesions
Sl. No. Age Male Female Total
1 > 19 1 0 1
2 20-29 0 1 1
3 30-39 0 4 4
4 40-49 7 9 16
5 50-59 6 8 14
7 60-69 2 7 9
8 70-79 0 4 4
9 < 80 0 1 1
Total 16 34 50
There were 16 males and 34 females in the present study of Gall bladder lesions with
a M:F ratio of 1:2.8.Maximum incidence was seen in 4th and 5th decades. A F:M
ratio of 3:1 found.
Chart 2 : Chart showing the Age & Sex Incidence of Gall bladder Lesions
0
5
10
15
20
> 19 20-29 30-39 40-49 50-59 60-69 70-79 < 80
1 0 0
7 62
0 00 1
4
9 8 74
11 1
4
1614
9
41
Male
Female
Total

87
Table-3: Table showing percentage of patients with different signs and
symptoms
Sl. No. Symptoms/signs No. Cases Percentage (%)
1 Pain 30 60
2 Mass in right hypochondrium 2 4
3 Jaundice 3 6
4 Fullnes after eating 20 40
5 Fever 8 16
The table shows various important clinical features in patients with Gall bladder
lesions. Pain in the abdomen was the most common presenting
feature(30/50),Jaundice was present in 6%(3/50).Mass in right hypochondrium in 4%
(2/50)of cases, fullness after eating was present in 40% of cases.
Chart 3 : Chart showing the percentage of patients with different Signs and
Symptoms
0
10
20
30
40
50
60
Pain Mass in right hypochondrium
Jaundice Fullnes after eating
Fever
No. Cases
Percentage (%)

88
Table-4: Table showing Incidence of Gall Stone with Age and Sex
Sl. No. Age Male Female
1 > 19 1 0
2 20-29 0 1
3 30-39 0 4
4 40-49 4 8
5 50-59 4 8
6 60-69 2 7
7 70-79 0 4
8 < 80 0 1
Total 11 (25%) 33 (75%)
In the present study there were 11 males and 33 females with gall stones. The
maximum incidence was in 4th and 5th decades.
Chart 4 : Chart showing Incidence of Gall Stone Age and Sex
0
1
2
3
4
5
6
7
8
> 19 20-29 30-39 40-49 50-59 60-69 70-79 < 80
1
0 0
4 4
2
0 00
1
4
8 8
7
4
1
Male
Female

89
Table 5 : Table showing Age and Sex Incidence of Acute Cholecystitis
Sl. No. Age Male Female Total
1 > 19 1 0 1
2 20-29 0 1 1
3 30-39 0 4 4
4 40-49 0 2 2
5 50-59 0 2 2
6 60-69 0 0 0
7 <70 0 0 0
Total 1 9 10
The above table shows the age and sex incidence of acute cholecystitis. Maximum no.
of cases were between the age group of 30-60years (8/10 i.e 80%). M:F ratio 1:9 was
found.
Chart 5 : Chart showing Age and Sex Incidence of Acute Cholecystitis
0
0.5
1
1.5
2
2.5
3
3.5
4
> 19 20-29 30-39 40-49 50-59 60-69 <70
1
0 0 0 0 0 00
1
4
2 2
0 0
1 1
4
2 2
0 0
Male
Female
Total

90
Table 6 : Table showing ultrasound findings of Acute Cholecystitis
Sl. No. Ultrasound Finding No.of Patients Percentage(%)
1 Gall Bladder Wall Thickening 9 90
2
Echofree Layer within Gall Bladder
Wall 6 60
3 Murphys Sign 8 80
4 Cholelithiasis 10 100
The above table illustrates the ultrasound findings of acute cholecystitis.Gall bladder
wall thickening was present in 90% cases(9/10), echofree layer within the gall bladder
wall in(6/10) 60% cases, Murphys sign in 8/10(80%),associated cholelithiasis in
100% (10/10) cases.
Chart 6 : Chart showing ultrasound findings of Acute Cholecystitis
0
20
40
60
80
100
120
Gall Bladder Wall
Thickening
Echofree Layer within
Gall Bladder Wall
Murphys Sign Cholelithiasis
No.of Patients
Percentage(%)

91
Table 7 : Table showing Age and Sex Incidence of Chronic cholecystitis
Sl. No. Age Male Female Total
1 > 19 0 0 0
2 20-29 0 0 0
3 30-39 0 0 0
4 40-49 4 6 10
5 50-59 4 6 10
6 60-69 2 7 9
7 70-79 0 4 4
8 < 80 0 1 1
Total 10 24 34
The above table shows the age and sex incidence of chronic cholecystitis. Maximum
no. of cases were found between 40-60years. A M:F ratio of 1:2 was found.
Chart 7 : Chart showing Age and Sex Incidence of Chronic cholecystitis
0
5
10
15
20
25
> 19 20-29 30-39 40-49 50-59 60-69 70-79 < 80 Total
0 0 0
4 42
0 0
10
0 0 0
6 6 7
4
1
24
Male Female

92
Table 8 : Table showing the Age and Sex distribution of Gall bladder carcinoma
Sl. No. Age Male Female
1 > 19 0 0
2 20-29 0 0
3 30-39 0 0
4 40-49 1 0
5 50-59 0 2
6 60-69 0 0
7 70-79 0 0
8 < 80 0 0
Total 1 2
The above table show as the age and sex distribution of Gall bladder carcinoma.There
were 2 cases in the age group of 50-60 years ,one case in the age group of 40-50years.
Chart 8 : Chart showing the Age and Sex distribution of Gall bladder carcinoma
0
0.2
0.4
0.6
0.8
1
1.2
1.4
1.6
1.8
2
> 19 20-29 30-39 40-49 50-59 60-69 70-79 < 80 Total
0 0 0
1
0 0 0 0
1
0 0 0 0
2
0 0 0
2Male
Female

93
Table 9 : Table showing the symptoms and signs of Gall bladder carcinoma
Sl. No. Symptoms/Signs No. of cases Percentage(%)
1 Pain 3 100
2 Vomitting 2 67
3 Jaundice 3 100
4 Mass in Right Hypochondrium 2 67
The above table shows the common symptoms/ signs in 3 patients with Gall bladder
carcinoma. The common symptom was pain in right hypochondrium 3/3 (100%),
jaundice in 3/3 (100%), mass in right hypochondrium was present in 2 patients (67%)
and, vomiting in 2/2 (67%).
Chart 9 : Chart showing the symptoms and signs of Gall bladder carcinoma
0
10
20
30
40
50
60
70
80
90
100
Pain Vomitting Jaundice Mass in Right Hypochondrium
3 2 3 2
100
67
100
67
No. of cases
Percentage(%)

94
Table 10 : Table showing the Age and Sex distribution of CBD lesions
Sl. No. Age Male Female Percentage(%)
1 20-Oct 1 0 20
2 21-30 0 0 0
3 31-40 0 0 0
4 41-50 0 2 40
5 51-60 2 0 40
6 >61 0 0 0
Total 3 2 100
The above table shows the age and sex incidence of CBD lesions. The maximum no.
of cases were seen in 4th and 5th decade. A M:F ratio of 3:2 was found.
Chart 10 : Chart showing the Age and Sex distribution of CBD Lesions.
0
0.5
1
1.5
2
2.5
3
20-Oct 21-30 31-40 41-50 51-60 >61 Total
1
0 0 0
2
0
3
0 0 0
2
0 0
2
Male Female

95
Table 11 : Table Showing Age & Sex Incidence of Focal Liver Lesions
Sl.No Age
Groups(years)
Male Female Total Percentage
1 0-10 - - - -
2 11-20 - - - -
3 21-30 5 2 7 14%
4 31-40 8 3 11 22%
5 41-50 15 5 20 40%
6 51-60 6 5 11 22%
7 61 & above 0 1 1 2%
Total 34 16 50 100%
The above table shows the age and sex incidence in various focal liver lesions
encountered in this study. No case was found below 20 years of age. Maximum
number of cases were found between the age group 41 to 50 years (20/50 i.e. 40 %).
A male to female ratio of about 2:1 (34:16) was found.
Chart 11 : Chart Showing Age & Sex Incidence of Focal Liver Lesions
0
2
4
6
8
10
12
14
16
0-10 20-Nov 21-30 31-40 41-50 51-60 61 & above
0 0
5
8
15
6
00 0
23
5 5
1
Male Female
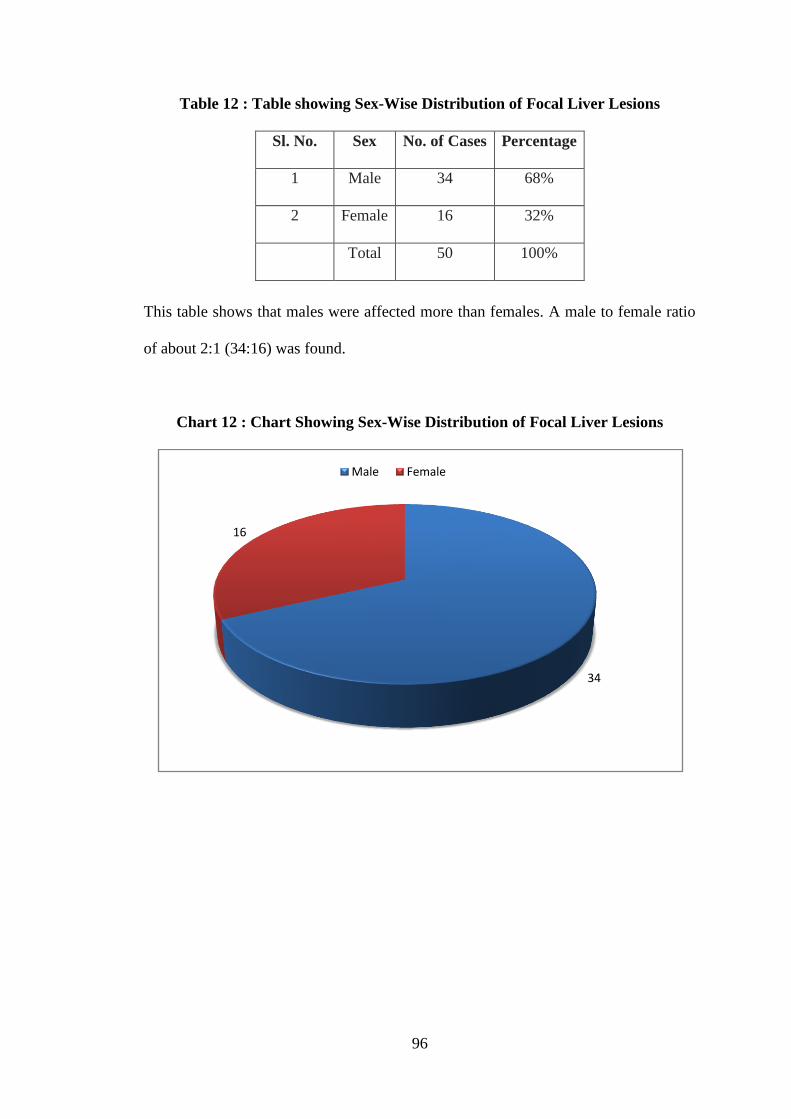
96
Table 12 : Table showing Sex-Wise Distribution of Focal Liver Lesions
Sl. No. Sex No. of Cases Percentage
1 Male 34 68%
2 Female 16 32%
Total 50 100%
This table shows that males were affected more than females. A male to female ratio
of about 2:1 (34:16) was found.
Chart 12 : Chart Showing Sex-Wise Distribution of Focal Liver Lesions
34
16
Male Female

97
Table 13 : Table Showing Percentage of Patients with Different Signs and
Symptoms
Sl. No. Signs/Symptoms No. of Cases Percentage
1 Pain 38 78%
2 Fever 16 32%
3 Hepatomegaly 35 70%
4 Jaundice 9 18%
The above table shows the various important clinical features in patients with focal
liver lesions, found in this study. Pain in the abdomen was the most common
presenting feature and was present in 78 % of cases (38/50). Fever was present in only
16 cases (32 %). On examination, presence of hepatomegaly was found in 35 cases
(70 %). Jaundice was present only in 9 cases (18%).
Chart 13 : Chart Showing Percentage of Patients with Different Signs and
Symptoms
0
5
10
15
20
25
30
35
40
Pain Fever Hepatomegaly Jaundice
38
16
35
9

98
Table 14 : Table Showing Incidence of Individual Lesions
Sl. No. Lesion Male Female Total Percentage
1 Liver Abscess 20 0 20 40%
2
Hepatocellular
Carcinoma 9 3 12 24%
3 Metastatis 2 8 10 20%
4 Haemangioma 1 3 4 8%
5 Hydatid Cyst 1 1 2 4%
6 Haematoma 1 0 1 2%
7 Simple Cyst 0 1 1 2%
Total 34 16 50 100%
The above table illustrates the number of cases of each type of focal liver lesions
encountered in this study. Liver abscess was found in 20/50 cases i.e. 40% and
accounted for the maximum number of cases. Hepatocellular carcinoma was found in
12 cases i.e. 24 %. 10 cases of metastatic deposits in the liver were found (20%). 4
cases of hemangioma (8%), 2 cases with hydatid cysts (4 %), and one case each (2%)
of haematoma and simple cyst were found.
Chart 14 : Chart Showing Incidence of Individual Lesions
Ma…0
5
10
15
20
Liver Abscess Hepatocellular Carcinoma
Metastatis Haemangioma Hydatid Cyst Haematoma Simple Cyst
20
9
21 1 1
00
3
8
31
0 1
20
1210
42
1 1
Male Female Total

99
Table 15: Table showing Solitary V/S Multiple Lesions
No. of Lesions No. of Cases Percentage
Solitary 34 68%
Multiple 16 32%
Total 50 100%
The above table indicates that most of the cases had solitary intrahepatic focal lesion
(34/50 i.e. 68 %), while 16 cases (32 %) had more than one lesion.
Chart 15 : Chart Showing Solitary V/S Multiple Lesions
0
5
10
15
20
25
30
35
Solitary Multiple
34
16

100
Table 16 : Table Showing Lobe Involvement in Various Focal Liver Lesions
Sl. No. Lobe No. of Cases Percentage
1 Right only 32 64%
2 Left only 6 12%
3 Both 12 24%
Total 50 100%
This table shows the lobe involvement in various focal liver lesions. The right
lobe alone was involved in 32/50 cases (i.e. 64 %). In 6/50 cases the left lobe
alone was involved (12 %), whereas in 12/50 cases (24 %), both the lobes
were involved. This indicates an overall predominance of right lobe
involvement (88%).
Chart 16 : Chart Showing Lobe Involvement in Various Focal Liver
Lesions
326
12
Right only Left only Both
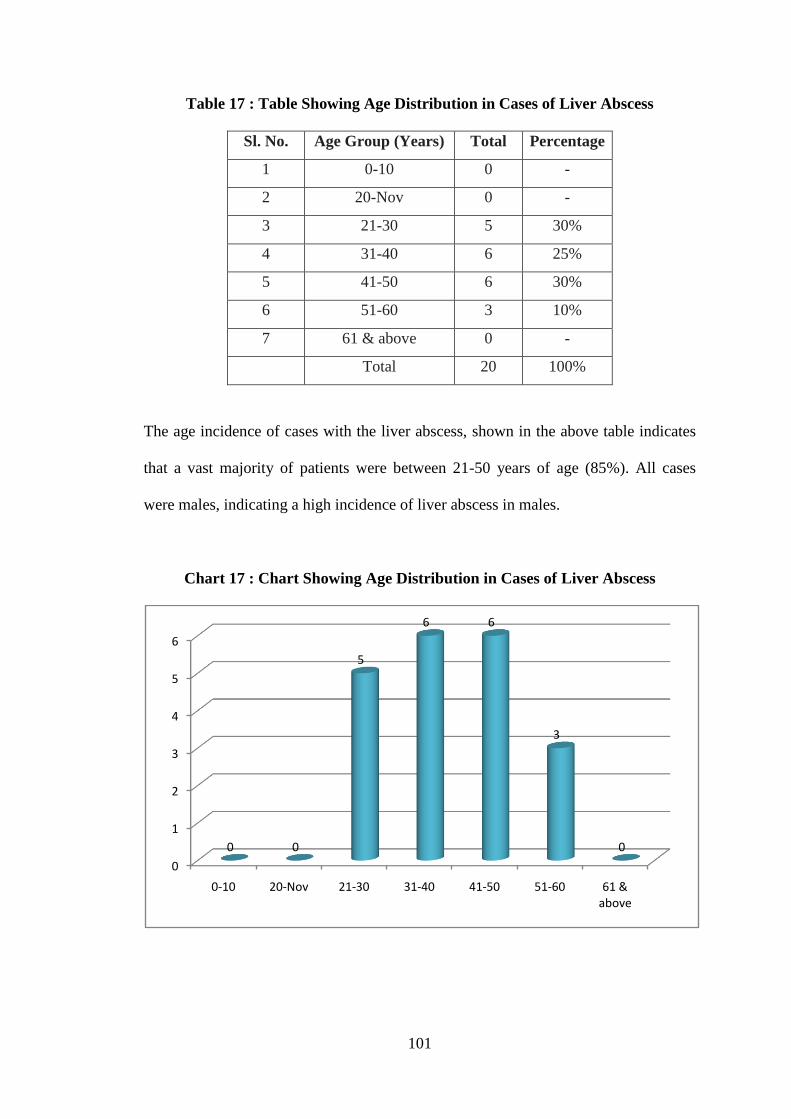
101
Table 17 : Table Showing Age Distribution in Cases of Liver Abscess
Sl. No. Age Group (Years) Total Percentage
1 0-10 0 -
2 20-Nov 0 -
3 21-30 5 30%
4 31-40 6 25%
5 41-50 6 30%
6 51-60 3 10%
7 61 & above 0 -
Total 20 100%
The age incidence of cases with the liver abscess, shown in the above table indicates
that a vast majority of patients were between 21-50 years of age (85%). All cases
were males, indicating a high incidence of liver abscess in males.
Chart 17 : Chart Showing Age Distribution in Cases of Liver Abscess
0
1
2
3
4
5
6
0-10 20-Nov 21-30 31-40 41-50 51-60 61 & above
0 0
5
6 6
3
0

102
Table 18 : Table showing Liver Abscess - Solitary V/S Multiple
Sl. No. No. of Lesions No. of Cases Percentage
1 Solitary 13 65%
2 Multiple 7 35%
Total 20 100%
The above table shows that 13/20 cases had solitary abscess (65 %), while 7/20 cases
had multiple abscesses (35 %). Thus a majority of the patients had solitary abscess.
Chart 18 : Chart Showing Liver Abscess - Solitary V/S Multiple
0 2 4 6 8 10 12 14
Solitary
Multiple

103
Table 19 : Table Showing Lobe Involvement in Liver Abscess
Sl. No. Lobe No. of Cases Percentage
1 Right only 13 65%
2 Left only 2 10%
3 Both 5 25%
Total 20 100%
Table shows the lobe involvement in liver abscess. In 13/20 cases (65%) the right
lobe alone was involved. In 5 cases both the lobes were involved (25%), while the left
lobe alone was involved in only 2 cases (10%). The size of abscesses encountered in
this study was variable, the smallest measuring was 3 cms in diameter and the largest
measuring was 13 cms in diameter.
Chart 19 : Chart Showing Lobe Involvement in Liver Abscess
13
2
5
Right only
Left only
Both

104
Table 20 : Table Showing Age & Sex Incidence in Cases of Hepatocellular
Carcinoma
Sl. No
Age Group
(Years) Male Female Total Percentage
1 < 30 0 0 0 0
2 31- 40 2 1 3 25%
3 41- 50 5 1 6 50%
4 51- 60 2 1 3 25%
Total 9 3 12 100%
The above table shows age & sex incidence of hepatocellular carcinoma. No case was
found below 30 years of age. Maximum number of patients (6/12) were between 41-
50 years of age (50%), 3 cases (25%) were between 51-60 years of age and 3 cases
(25%) were between 31-40 years of age. A male to female ratio of 3:1 (9:3) was
found suggesting a male predominance.
Chart 20 : Chart Showing Age & Sex Incidence in Cases of Hepatocellular
Carcinoma
0
0.5
1
1.5
2
2.5
3
3.5
4
4.5
5
< 30 31- 40 41- 50 51- 60
0
2
5
2
0
1 1 1
Male Female

105
Table 21: Table Showing Lobe Involvement in Hepatocellular Carcinoma
Sl. No. Lobe No. of Cases Percentage
1 Right only 9 75%
2 Left only 0 0
3 Both 3 25%
Total 12 100%
The above table indicates that in cases with hepatocellular carcinoma, the lesions
were limited to the right lobe in 9/12 cases (i.e. 75%); while in the remaining 3 cases
both the lobes were involved. The size of lesions was large at presentation, with the
smallest one measuring 5.4 cm in diameter.
Chart 21 : Chart Showing Lobe Involvement in Hepatocellular Carcinoma
0
1
2
3
4
5
6
7
8
9
Right only Left only Both
9
0
3

106
Table 22: Table Showing Age and Sex Incidence in Cases of Hepatic Metastasis
Sl. No.
Age Group
(Years) Male Female Total Percentage
1 > 30 0 0 0 0
2 31- 40 0 1 1 10%
3 41- 50 2 4 6 60%
4 51- 60 0 3 3 30%
Total 2 8 10 100%
The age and sex incidence in cases with metastasis is shown in the above table. It
shows that the majority of cases (9/10 i.e. 90 %) were between 41 and 60 years of age.
Only 1 case below the age of 40 years was found (Ca Breast).
Chart 22 : Chart Showing Age and Sex Incidence in Cases of Hepatic Metastasis
0
0.5
1
1.5
2
2.5
3
3.5
4
> 30 31- 40 41- 50 51- 60
0 0
2
00
1
4
3
Male Female

107
Table 23: Table showing Site of Primary in Cases of Metastasis
Sl. No Site of primary No. of cases Percentage
1 Breast 5 50%
2 Colon 1 10%
3 Stomach 1 10%
4 Melanoma 1 10%
5 Ovary 1 10%
6 Undiff. Sarcoma 1 10%
Total 10 100%
The primary tumors in cases with liver metastatis are shown in the above table. The
most common primary tumor was carcinoma of the breast and was present in 5/10
cases (50%). 1 case each (10%) of ovarian tumor, malignant melanoma, carcinoma of
the stomach, carcinoma of the colon and undifferentiated sarcoma (thigh) was found.
Chart 23 : Chart Showing Site of Primary in Cases of Metastatis
5
1
1
1
1
1
Breast
Colon
Stomach
Melanoma
Ovary
Undiff. Sarcoma

108
Table 24: Table showing Age Incidence of Diffuse Liver Diseases
Sl.No.
Diffuse Liver
Disease 0-10 30-Nov 31-50 <51 Total
1 Fatty Liver 0 0 12 4 16
2
Acute
Hepatitis 8 2 0 0 10
3
Chronic
Hepatitis 0 0 4 0 4
4 Cirrhosis 0 0 10 2 12
5
Congestive
Hepatomegaly 0 0 1 2 3
Total 8 2 27 8 45
The above table shows the age incidence of Diffuse liver diseases. Maximum no. of
cases were in the age group of 31-50years (26/45 i.e 60%), with a F:M ratio of 1:1.5.
Chart 24 : Chart showing age incidence of Diffuse liver diseases
0
2
4
6
8
10
12
Fatty Liver Acute Hepatitis Chronic Hepatitis
Cirrhosis Congestive Hepatomegaly
0
8
0 0 00
2
0 0 0
12
0
4
10
1
4
0 0
2 2
0-10 30-Nov 31-50 <51

109
Table 25: Table showing sex distribution of diffuse liver diseases
Sl. No. Diffuse Liver Disease Male Female Total
1 Fatty Liver 6 10 16
2 Acute Hepatitis 4 6 10
3 Chronic Hepatitis 3 1 4
4 Cirrhosis 10 2 12
5 Congestive Hepatomegaly 2 1 3
The above table shows the sex wise distribution of Diffuse liver diseases. A F:M ratio
of 1:1.5 was found.
Chart 25 : Chart showing sex distribution of diffuse liver diseases
0 2 4 6 8 10 12 14 16
Fatty Liver
Acute Hepatitis
Chronic Hepatitis
Cirrhosis
Congestive Hepatomegaly
6
4
3
10
2
10
6
1
2
1
16
10
4
12
3
Total
Female
Male

110
DISCUSSION
Hepatobiliary lesions have been a leading cause of mortality and morbidity in
the general population.Detection of these lesions is very essential in arriving at proper
diagnosis and further management.Ultrasound is a sensitive tool for detecting and
follow up of these lesions.
The study carried over a period of 18 months,included 150 cases of
hepatobiliary lesions.The study included 50 cases of gallbladder lesions,5 cases of
CBD lesions ,50 cases of focal liver lesions and 45 cases of diffuse liver lesions.Table
No .1 shows the incidence of hepatobiliary lesions studied.
Gall bladder diseases
Table No.2 shows the age and sex incidence of gall bladder lesions studied, 34
were females and 16 males indicating a F:M ratio of 2:1. Khalid Ahsan Malik. found
a F:M ratio of 4:1 in his study of 260 patients60
.
The age incidence indicates that maximum number of cases were between 40
to 69 years of age which indicates that gall bladder diseases are more common in
middle age group.
Common symptoms and signs of patients with gall bladder lesions are shown
in Table No. 3.Pain in the abdomen was most common presenting symptom (30/50 i.e
60%) and the type of pain varied from severe pain to vague abdominal pain.Right
upper quadrant mass was present in 2 patients (4%), 20 patients had fullness after
eating i.e 40%, jaundice was present in 3 cases (6%), fever was present in 8 cases
(16%).
In 50 cases of GB lesions, there were 44 cases of calculus diseases and 6
noncalculus cases.Among the 6 noncalculus cases, there were 3 cases of GB polyps, 1
case of Gall bladder carcinoma, 2 cases of chronic cholecystitis.
Gall stones
Table No.4 shows the age and sex incidence of gall stones. Majority of cases
(32 out of 50) were seen between 40-69 years(64%) with a peak incidence in 4th
and
5th decades.Gall stones were seen in 25% (11/14) men &75%(33/44)women with a
M:F ratio of 1:3.

111
Men were predominantly affected in 4th
and 5th
decades while women were
affected predominantly in 4th
, 5th
and 6th
decades.Khalid Ahsan Malik. In his study the
maximum no. of patients were in the 4th
decade of life60
.
In the study ultrasound diagnosed the presence of calculi in 44 cases and its
absence in 6 cases.In one patient ultrasound missed a calculus that was subsequently
found at surgery.The sensitivity of ultrasound in detecting gall stones was 97%,
specificity of 100% in the present study.Mark S.Silidker et al. In their study the
sensitivity of ultrasound in detecting gall stones was 91% and specificity of 100%61
.
Acute cholecystitis
There were 10 cases (10/50) of acute cholecystitis (22%). All the 10 cases
were associated with gall stones.
Acute cholecystitis was seen in nine cases in women and and one case in a
man.Among the 9 cases of acute cholecystitis seen in females, 6 cases were seen in 3rd
and 4th
decades (60%). Table No.5 showing age and sex incidence of acute
cholecystitis.
Table No.6 showing ultrasound findings in acute cholecystitis in the study. Out
of 10 cases of acute cholecystitis, ultrasound diagnosis was done correctly in 9
patients (90%), wall thickening was seen in 90% (9/10), echofree layer within the
wall in 6 patients (60%), associated cholelithiasis was present in all 10 patients
(100%), Murphy’s sign was present in 8 patients (80%). F Croce et al. In their study
of 40 cases of acute cholecystitis, ultrasound diagnosis was done in 34 patients (85%),
wall thickening (90%), echofree layer within the wall (67%), associated cholelithiasis
was present in 28 patients (82%)64
.
The incidence of gall stones in acute cholecystitis was 100% in the study
which is superior to that by Philips W. Ralls et al. (sensitivity of 99% in their study)62
.
Among the 50 patients of gallbladder lesions, 10 patients (20%) were
diagnosed to have acute cholecystitis by ultrasound.The diagnosis was correctly made
in 9 patients (TP).One case (FP) which was diagnosed as acute cholecystitis turned
out to be chronic cholecystitis by pathology. There was one case of false negative
diagnosis.
There was a sensitivity of 90%, specificity of 50% and accuracy of 83.33%.
Ralls P W et al. The sensitivity and specificity of ultrasound for acute cholecystitis is
approximately 85% to 95% and 64% to 100% respectively62
.

112
Chronic cholecystitis
Table No.7 showing the age and sex incidence of chronic cholecystitis. In the
study there were 34 cases of chronic cholecystitis, 22(68%) cases in women and 10
cases in men were associated with gall stones. 2 cases in women were not associated
with gall stones. Majority of cases were in women in the 4th
, 5th
, and 6th
decades. 80%
of cases in men were encountered in 4th
and 5th
decades.
The ultrasound features for chronic cholecystitis were absence of focal
tenderness over gall bladder, contracted nature of GB, multiplicity of stones, wall
thickening.
In the study 32 patients of chronic cholecystitis had associated gall stones
(94%). Ultrasound correctly diagnosed gall stones in all 32 cases in whom they were
present with a sensitivity of 100%. Faye C.Laing et al.In their study 94% of chronic
cholecystitis were associated with gall stones.Wall thickening was seen in 20 out of
34 cases in our study with a sensitivity of 57%. Faye C.Laing et al. Their study had a
sensitivity of 53%63
.
In the present study all cases of chronic calculus cholecystitis had small and
multiple calculi and hence could not be enumerated.
` Ultrasonographically the diagnosis of chronic cholecystitis was correctly made
in 27 cases. The 7 cases of errors that were made consisted of one case diagnosed
pathologically as acute cholecystitis and 6 cases were diagnosed as just having gall
stones.
Gall bladder carcinoma
Table No.8 shows the age and sex incidence of gall bladder carcinoma. In the
study there were 3 cases (6%) of gall bladder carcinoma with a M:F ratio of 1:2. The
age group ranged from 40-60yrs. Ata Ur Rehman et al.In their study age group ranged
from 34yrs to 73yrs with a M:F ratio of 1:2 65
.
Table No.9 shows the common symptoms/signs of gall bladder carcinoma. The
most common symptom was pain in right hypochondrium (3/3), mass in right
hypochondriumin 2 patients (66%), jaundice in all 3 patients (100%).
The incidence of gall bladder carcinoma in the study was 6%. Shah et al. In the
study the incidence of gall bladder carcinoma was 6.6% in the study66
.
Among the 3 cases of gall bladder carcinoma, 2 cases were associated with gall
stones (66%). Khalid Ahsan Malik. In his study all the cases of gall bladder

113
carcinoma were associated with gall stones60
.
Ultrasound examination showed gall bladder mass in all 3 cases.
Histopathological examination revealed adenocarcinoma in all 3 cases.
Gall Bladder Polyp
Gall bladder polyps are quite common being present in 4-6% of population.
There were 3 cases of gall bladder polyp in the study.The M:F ratio of 2:1 in the age
group ranging fron 27-49 years. All the 3 cases were not associated with gall stones.
Collett j et al. are of the view that polyps <10mm are most likely benign
incidental cholesterol polyps.Follow up is not warranted because the incidence of
malignant transformation is extremely rare69
. Polyps more than 10mm are most likely
to be benign cholesterol polyps, but probably should be followed for evidence of
growth because some are adenomas that can be cancerous.In present study of 3 cases,
polyps were small (<10mm), nonmobile, nonshdowing masses adherent to the wall.
Ultrasound correctly diagnosed polyp in all 3 cases with a sensitivity of 100%.
CBD lesions
In the study there were 5 cases of CBD lesions, 2 cases of cholangiocarcinoma,
2 cases of choledocholithiasis and 1 case of choledochal cyst. Table no.10 showing
the age and sex distribution of CBD lesions studied.Maximum number of cases were
seen in 4th
and 5th
decades with a M:F ratio of 3:2.
The present study showed correct identification of level and cause of biliary
obstruction by ultrasound in 100% and 80%.Our findings are similar to that of RN
Gibson et al.In their series,they found that ultrasound correctly identified the level of
obstruction in 95% of cases.The cause was correctly identified by ultrasound in
88%70
.
Cholangiocarcinoma
In the study there were 2 cases of cholangiocarcinoma in males,in the age
group ranging from 51-60years.
Common symptoms and signs were jaundice (2/2 i.e 100%), pruritis (2/2 i.e
100%) and anorexia (1/2 i.e 50%). Elevated liver function tests were present in both
cases.
There was one case of klatskin tumour in a male aged 54years .Ultrasound

114
showed hypoechoic mass lesion in porta hepatis with dilatation of intrahepatic biliary
radicles. It was confirmed by MRCP.
The other case presented in a 56 year old man. Ultrasound showed dilatation of
CBD and intrahepatic biliary radicles. The distal CBD was obscured by bowel gas.
Pancreas was normal.A diagnosis of distal CBD lesion was made.Further evaluation
with ERCP showed the level of obstruction in distal CBD which was subsequently
proved by biopsy. Ultrasound is well suited to visualise common hepatic duct and
proximal CBD, one of its major limitations is the assessment of distal CBD and
pancreas which is often obscured by bowel gas in 30-50% patients67
.
CBD calculi
There were 2 cases of choledocholithiasis in females, in the age goup ranging
41-50years.The most common symptom was pain in right hypochondrium (2/2 i.e
100%), jaundice (2/2 i.e 100%) and vomiting (1/2 i.e 50%).
Ultrasound detected stone in both cases (100%). One case of CBD stone had
associated cholelithiasis. In the present study the sensitivity of ultrasound in detecting
CBD stone was 100% (2/2). Koenigsberg M et al. found a sensitivity of 82% (9/11
stones were diagnosed by ultrasound)68
.
Choledochal cyst
There was one case of choledochal cyst in a male aged 27years who presented
with mild pain in epigastrium ,icterus,elevated liver profile.Ultrasound showed
fusiform cystic dilatation of extrahepatic CBD with mild intrahepatic biliary radicle
dilatation.The diagnosis of choledochal cyst was made based on Todanis
classification71
.
Focal Liver Lesions
Table No. 11 & 12 shows the age & sex incidence and sex wise distribution of
50 cases of focal liver lesions studied, 34 were males and 16 were females indicating
a M:F ratio of 2:1.
The age incidence indicates that maximum number of cases were between 41 to
50 years of age (20/50 i.e. 40%). 60% of cases (30/50)were between 30 and 50 years
of age which indicates that focal liver lesions are more common in middle age. No
case was found below 20 years of age.

115
The common signs and symptoms in patients with focal liver lesions are shown
in Table No 13. Pain in the abdomen was the most common presenting symptom
(38/50 cases i.e. 78%) and the type of pain varied from severe pain to dull ache or
vague abdominal pain. Hepatomegaly or right upper quadrant mass was present in 35
patients (i.e. 70%). The consistency of the liver varied from firm to hard in different
cases. Tenderness was also noted in many cases.
The various focal liver lesions observed in this study were liver abscess,
hepatocellular carcinoma, metastasis, hydatid cyst, haemangioma, haematoma and
calcified cyst. The incidence of these focal liver lesions is shown in Table No 14. The
most commonly encountered focal liver lesion was liver abscess (20/50 cases i.e.
40%). Mukul P. Agarwal et al. In their study, 16 out of the 28 cases had liver
abscess72
. The next common intrahepatic focal lesion was hepatocellular carcinoma
which accounted for 12 cases i.e. (24%). Metastasis was found in 10 cases (i.e. 20%),
3 cases of hepatic hydatid disease (6%), 3 cases with haemangioma (6%) and one case
each of haematoma and calcified cyst were found.
Table No. 15 shows that multiple lesions were found in 16 cases (32%) while
solitary lesions were found in 34 cases (68%). Therefore, a majority of the lesions
were solitary.
Table No. 16 shows that the right lobe alone was involved in 32/50 cases
(64%), the left lobe alone was involved in 6/50 cases (12%). In 12/50 cases (24%),
both the lobes were involved. This indicates that there is an overall tendency of right
lobe involvement (88%).
Liver Abscess
Table No. 17 shows the age incidence in the cases of liver abscess. Majority of
cases (17/20) were between 20-50 years of age (85%). Of these 17 cases, 5 to the age
group 21-30 years, while 6 cases each belonged to the age group of 31-40 years and
41-50 years. C. Ramamohan et al. In their study of 22 cases of liver abscess, the most
common age group was also between 31-50 years22
.
All the 20 cases of amoebic liver abscess (ALA) were in males. C.
Ramamohan et al. found a male to female ratio of 16:2 in their study22
.
The common clinical presentation was abdominal pain. Hepatomegaly and
tenderness were present in all the cases.
All the cases of liver abscess studied in this series were of amoebic abscess.

116
This was confirmed either by aspiration of anchovy sauce pus, response to
metronidazole treatment or both. Out of the 22 cases of liver abscess studied by C.
Rammohan et al, 18 cases had amoebic liver abscess while, 4 cases had pyogenic
liver abscess22
.
Table No. 18 shows the number of abscesses in these 20 cases of amoebic liver
abscess. Solitary abscess was present in 13 cases (65%), while 7 patients had multiple
abscesses (35%). C. Ramamohan et al. found solitary abscess in 66.7% of cases and
multiple abscesses in 33.3%22
. Present study correlates well with these figures. Philip
W. Ralls et al. in a study of 106 cases of amoebic liver abscess found solitary abscess
in 83% and multiple in 17%21
.
Table No. 19 shows the distribution of amoebic liver abscess in the lobes of
the liver. The right lobe alone was involved in 65% cases (13/20), the left lobe alone
was only involved in 10% cases (2/20) and in 25% cases i.e. 5/20 both the lobes were
involved. Philip W. Ralls et al. found right lobe involvement in 73.4% of their
cases21
. C. Ramamohan et al. found right lobe involvement in 83% of their cases22
.
The right lobe predominance found in my study correlates well with these figures.
The size of the liver abscess varies enormously. Laila Ahmed et al.
encountered sizes ranging from 1-22 cm24
. In the present study the smallest abscess
was 3 cm in diameter, while the largest abscess was 13 cm in diameter. Majority of
the abscesses were between 5-10 cm in diameter. This correlates with other studies. In
a study of 143 liver abscesses, Philip W. Ralls et al. found them ranging from 1.5-22
cm with an average of 7.5 cm21
.
The diagnosis of amoebic liver abscess was made, based on the following
ultrasound features which are strongly suggestive of amoebic liver abscess:
5. A round or oval configuration.
6. Lower reflectivity as compared to the normal echo patterns of the liver, with
the varying degree of internal echoes.
7. Lack of significant wall echo.
8. Subcapsular location.
9. Distal acoustic enhancement.
All or most of these ultrasound features were found in the cases of amoebic
liver abscess in this study.
Follow up of patients with amoebic liver abscess, after percutaneous

117
aspiration and metronidazole treatment showed reduction in size, with a general only
three patients. In these cases the echopattern was resorted to normal at the end of six
months. Laila Ahmed et al. studied the resolution time for amoebic liver abscess in 25
patients with abscesses ranging from 1 to 22 cm in size. They found that resolution
time was variable, ranging from two months for the smallest abscess to twenty
months for the largest. Long term follow up was possible in all the abscesses in their
study which resolved completely, leaving normal hepatic sonographic pattern24
.
Hepatocellular Carcinoma
The second most commonly encountered focal liver lesion was hepatocellular
carcinoma, accounting for 24% of cases (12/50).
Commonest clinical presentation was that of abdominal pain which was of a
dull aching type. Right upper quadrant lump was the second most common presenting
feature. Hepatomegaly was present in all the cases with a firm to hard consistency.
Jaundice was present in 5 cases.
The age and sex incidence is shown in table no. 20. No case was found below
30 years of age. Maximum number of cases were found between 41 to 50 years (6/12
i.e. 50%). 3 cases were between 31-40 years (25%), while 3 cases (25%) were
between 51 & 60 years. These findings indicate that hepatocellular carcinoma is
common in middle age and older individuals. A male to female ratio of 3:1 (9:3) was
found in this study indicating a male predominance. This correlates with other studies.
P. A. Dubbins et al.In their study of 32 patients, 27 were males and 5 were females37
.
In this study all the hepatocellular carcinomas were large at presentation, the
smallest one being 5.4 cm in diameter. The lobe involvement in hepatocellular
carcinomas shown in table no. 21 indicates that in 9 cases (75%) the right lobe alone
was involved; while in 3 cases (25%) both the lobes were involved.
The echo pattern of the hepatocellular carcinomas encountered in this study
was either that of a hyperechoic lesion or of a mixed echogenicity (hyper as well as
hypoechoic lesion i.e. complex). The margins of the lesions were well defined in
smaller tumors while they were poorly defined in larger lesions.
Other important findings on ultrasound included presence of ascites,
indentation & compression of vessels (hepatic and portal veins) and thrombosis of
portal vein (which was found in one case). A tendency of hepatocellular carcinoma to
involve the portal vein is known. Bala R. Subramanyam et al. studied 15 cases of

118
hepatocellular carcinomas with ultrasound and angiography and found vessel invasion
(IVC / hepatic vein / portal vein) in 33% cases36
. In one case, enlarged lymph nodes
were found in the porta hepatis.
In my study not a single case of hepatocellular carcinoma with cirrhosis was
found. Mario Cottone et al. diagnosed hepatocellular carcinoma in 30 cases, in a study
of 100 cases of histologically proved cirrhosis38
.
Liver Metastasis
In this study, 10 cases with metastasis in the liver were found. Table No. 22
shows the age & sex incidence in these cases. Majority of the patients were between
41-60 years (90%). The male to female ratio was 1:4 (2:8). Female predominance in
this study is due to the fact that 50% of the cases were of Ca Breast.
The site of the primary malignancies in various cases of hepatic metastasis is
shown in table no.23. Carcinoma of the breast was present in 5/10 cases (50%), while
one case each (10 %) of carcinoma of the stomach, carcinoma of the colon, malignant
melanoma, ovarian tumor and undifferentiated sarcoma (thigh) was found
Anil K Jain et al. studied the sonographic spectrum of metastatic disease in 75
cases. In their study 85% cases had focal lesions while 15% had diffuse involvement.
They categorized focal lesions into 7 types: echo-poor, bull's eye, echogenic, necrotic,
cystic, calcific and mixed. They found that echo-poor lesions were more common
(34.6%) followed by bull's eye (14.6%), echogenic (13.3%), necrotic (10.6%), cystic
(4%), mixed (4%) and calcific (2.6%)73
. In this study, out of 10 cases, 5 had bull's eye
lesion (50%). 3 cases had hypoechoic lesions (30%), while 2 cases had hyperechoic
lesion without a surrounding hypoechoic halo (20%).
Many other studies of the sonological pattern in hepatic metastasis have been
done. In some studies echogenic metastasis were more commonly encountered, while
some others found echo-poor lesion to be more common. William Scheible et al.
found 37% echodense lesions (of these 70% were colonic)74
. Bruce J. Hillman et al.
found 62% echogenic lesions (of these 16% were of colonic origin)75
. G. N. Viscomi
et al. found hypoechoic lesions in 37.5% of cases (of these 44% were lymphomas),
37.5% mixed and 27% purely echogenic (of these 54% were colonic in origin)76
.
Wayne B. Wooten et al. found discrete echogenic lesions in 30% cases and 23%
echopoor77
. These differences could be partly due to the differences in patient
selection. Although there is no definite correlation between the sonological pattern of

119
lesion and the histological type, metastasis from gastrointestinal tract and ovary are
known to be echogenic. In this study only 2 cases with gastrointestinal tract
malignancies were found (one of each carcinoma of the stomach and colon) and both
had discrete echogenic metastasis. In the 5 cases of carcinoma of the breast,
hypoechoic metastasis was found in 3 cases while 2 cases had bull's eye lesion. Bull's
eye lesions were also found in cases with ovarian tumor, malignant melanoma and
soft tissue sarcoma.
Haemangiomas
Haemangiomas are the most frequently encountered benign tumors of the liver
and is reported in 7% of patients at autopsy. Most of the patients are asymptomatic.
About 70-95% are found in females with a female to male ratio of about 5:1. This fact
correlates well with my study. A female to male ratio of 3:1 was found in this study
indicating a female predominance.
The spectrum of ultrasound appearances is variable; however the majority has
a distinctive appearance. This is of a sharply defined, highly reflective, round tumor
less than 3 cm in diameter with a homogenous echopattern.
L. Volterrani et al. studied 297 hyperechoic haemangiomas with ultrasound.
They concluded that in non-neoplastic cases with a hyperechoic hepatic lesion with
hypoechoic areas and posterior enhancement, with no surrounding hypoechoic halo,
can be confidently diagnosed as haemangioma on ultrasound alone56
.
In my study, 4 cases with ultrasound pattern highly suggestive of
haemangiomas were encountered, of which 2 patients had solitary lesions. Both the
lesions were hyperechoic, well circumscribed, without a surrounding hypoechoic
halo. One of them had a few hypoechoic areas and showed minimal posterior acoustic
enhancement and was found incidentally while the patient was being investigated for
prostatic hyperplasia. The other 2 patients had multiple lesions.
In asymptomatic patients with no known history of malignancy, it is safe to
consider these classical appearances as diagnostic of haemangioma. With increasing
size, degeneration and fibrous replacement, the reflectivity becomes heterogenous and
makes distinction from other focal hepatic lesions difficult or impossible.
Hydatid Disease
Hydatid disease is endemic in our country and is caused by infestation with the

120
species of cystodes, Echinococcus granulosus. The liver is the most frequent site for
intra-abdominal hydatid cysts.
Although the clinical presentation may vary, most patients present with pain or
a lump in the right upper quadrant. In this study, only 2 cases of hepatic hydatid
disease were found. Both the patients presented with pain in the abdomen. A palpable
lump was present in the epigastrium of both the patients. In a series of 35 patients, S.
K. Sharma and Avik Sengupta et al. found abdominal discomfort in 60% cases and
abdominal lump in 31% cases50
.
An interesting spectrum of ultrasound findings is seen in hepatic hydatid
disease. Based upon the ultrasound morphology many classifications have been
suggested. Sukhpal Sawhney et al. have suggested a classification into 6 types (I to
VI)53
. E. A. Niron and H. Ozer have divided the cases into 3 groups (with subtypes)
based on ultrasound morphology49
.
A solitary cyst may greatly vary in size. It is anechoic and may be
indistinguishable from simple liver cyst. In endemic areas, all liver cysts should be
considered as hydatid cysts, unless proved otherwise. Presence of hydatid sand in
some of the cysts may suggest a diagnosis.
The development of daughter cysts from a lining germinal epithelium produces
a characteristic appearance of cysts within a cyst producing a 'Cart wheel' or
'Honeycomb' appearance.
Multiple cysts with normal liver parenchyma intervening may be found if there
is continued or heavy infestations.
Separation of the membrane producing a pathognomonic ‘ultrasound
waterlily sign’ may be seen in some cases. It is seen as an undulating linear collection
of echoes (collapsed germinal layer), either floating in the cysts or lying on the most
dependent part. If the cysts become secondarily infected, a different pattern may be
seen, with filling of the cysts with echoes. Cysts may calcify years after the infection.
Two cases of hydatid disease of the liver were found in this study. Both the
patients had characteristic cysts within cyst appearance.
Haematoma
Liver haematomas appear hyperechoic in acute situation due to erythrocytes
and fibrin forming multiple interfaces. With time the reflectivity decreases which
corresponds to clot liquefaction.

121
In this study a single case of liver haematoma was found. A 45 year old male
patient with the history of blunt trauma to the abdomen was referred for ultrasound.
The ultrasound features were, a large almost anechoic lesion in the right lobe
with some internal stranding seen in part of the lesion. These features correlate with
the liquefaction of the clot.
Simple Cyst
In this study a well-demarcated, thin walled, anechoic lesion with posterior
acoustic enhancement was found in the right lobe of a 63 year old female who did
not have any symptom related to the lesion.This was an incidental finding. This was
suggestive of a simple liver cyst.
Diffuse Liver Disease
In the study there were 45 cases of diffuse liver diseases. Table No.24 & 25
showing age and sex distribution of diffuse liver lesions studied with 21 females and
24 males in the age group ranging from 8-70years with a F:M ratio of 1.5:1.
Fatty Liver
In the study there were 16 cases of fatty liver, 10 females and 4 males in the
age group of 30-70years. Among them 6 patients had diabetes, 4 were obese. All the
patients were asymptomatic and detected incidentally on ultrasound. Palmentieri B et
al. concluded that the presence of bright liver echopattern is a sign of liver steatosis
and that liver fibrosis does not interfere with ultrasound measurements. Posterior
attenuation and/or skip areas are closely related to steatosis of • 30%78
. In the present
study, bright liver echopattern was seen in all 16 cases.
Acute hepatitis
In the study, there were 10 cases of clinically suspected acute hepatitis, 6
females and 4 males. Maximum number of cases were in the children in the age
group of 1-15years with M:F ratio of 2:3.
Common symptoms and signs were fever (10/10 i.e 100%), hepatomegaly
(90%), jaundice (100%), splenomegaly (10%), malaise. Biochemical tests revealed
elevated alanine aminotransferase levels, Anti HAV antibodies in the serum.
Zwibel W J.The most common sonographic finding of acute hepatitis is

122
hepatomegaly79
. The so called starry night pattern with decreased parenchymal
echogenecity, increased periportal echoes is less commonly seen80
.
In the present study the most common finding on ultrasound was
hepatomegaly i.e 9/10 patients (90%), the remaining 1 patient (10%) had diffusely
decreased parenchymal echogenecity with increasd periportal echoes(starry night
pattern). This patient had associated gall bladder wall thickening of 5mm. Glorgio et
al. found starry night pattern in 2%cases (19/791)81
.
Chronic Liver Disease
There were 4 cases of HBsAg positive in the study, 3 males and 1 female in
the age group of 30-55years.
Ultrasound showed normal liver in 3 patients and other 1 patient showed
hepatomegaly with coarsened echotexture and increased parenchymal echogenecity,
portal vein radicles were less conspicuous.Biopsy showed mild changes of chronic
hepatitis in 3 ultrasound normal cases and moderate changes in the other case. Kurtz
Alfred et al.In their study histopathology showed mild changes of chronic hepatitis in
2 ultrasound normal cases and moderate changes of chronic hepatitis in 4 cases with
moderate changes on ultrasound82
.
Cirrhosis
In the study there were 12 cases of cirrhosis, 10 males and 2 females in the age
group of 30-65years with a M:F ratio of 5:1.
The most common symptom was abdominal distension (12/12 i.e 100%),
jaundice (10/12 i.e 84%), splenomegaly (4/12 i.e 33%), pleural effusion (6/12 i.e
50%).
Ultrasonographic diagnosis of cirrhosis was based on nodularity of liver
surface, liver size, coarse echotexture and increased attenuation using 3.5 to 5 MHz
transducer. Ascitis, splenomegaly, varices were also looked for.
In the study, 12 patients had ultrasonographic diagnosis of cirrhosis but only 8
cases (58%) were proved by biopsy. Ong Tz et al. In their study, 17 patients had
ultrasonographic diagnosis of cirrhosis but only 6 cases were proven by biopsy i.e
(35%)83
.

123
Congestive Liver
In the study there were 3 cases of congestive liver, 2 males and 1 female with a
M:F ratio of 2:1, in the age group of 30-60years. The most common presenting
symptom was breathlesness (3/3 i.e100%), abdominal distension (3/3 i.e 100%),
cough (2/3 i.e 66%). Examination revealed signs of congestive heart failure.Liver
function tests were normal in all 3 cases.
Ultrasound showed hepatomegaly with mild decreased echotexture, dilated
IVC and hepatic veins, pleural effusion, pericardial effusion, ascitis was present in all
3 cases. Hani H et al. In their study the common ultrasound finding was
hepatomegaly, dilated IVC and ascitis84
.

124
CONCLUSION
The science of Diagnostic Ultrasound is perhaps the most promising of the
new imaging modalities currently available. Its lack of dependence on organ function
and flexibility makes it ideal for imaging the liver. The liver can be scanned in
multiple planes, thus enabling us to know the exact location of the lesion and studying
their echopattern. Apart from detecting lesions, other valuable information like vessel
involvement, ascites, lymphadenopathy, etc. can be easily obtained. In most instances
a specific diagnosis can be made, either based on the ultrasound features alone or in
correlation with the clinical features.
Ultrasound can also be used for guided percutanous drainage of abscesses and
for obtaining biopsies. It also has an important role in the follow up of the patient with
hepatobiliary lesions.
Ultrasound is recommended to be very useful modality with regards to
diagnostic yield. It makes possible to establish the diagnosis quickly and thus start
appropriate treatment early. This greatly reduces the morbidity, mortality and the
period spent by the patient in the hospital.
Ultrasound should be the first investigation in suspected biliary obstruction
followed by other imaging modalities as and when required. Although it is well suited
to visualize common hepatic duct and proximal CBD, one of its major limitations is
assessment of distal CBD which is often obscured by bowel gas. Obesity is also a
limiting factor. Invasive procedures should be reserved for those patients where
therapeutic interventions are planned.
Ultrasound is a useful but imperfect tool in evaluating diffuse liver disease.
Sonographic detection and evaluation of diffuse liver disease may be difficult,
because diffuse liver disease does not always cause distortion of the liver
parenchymal texture or shape of the liver. This is especially true in patients with acute
hepatitis. Sonography can show hepatomegaly, fatty infiltration of the liver, and
cirrhosis, all with good but imperfect sensitivity and specificity.

125
The overall good sensitivity, specificity and accuracy of ultrasound diagnosis
in gall bladder diseases in our study has lent support once again to the proposition that
ultrasound is the diagnostic technique of choice in the evaluation of gall bladder
diseases.
Disadvantages of ultrasound are its operator dependency (experience of the
examiner is crucial) and to a lesser degree on patient cooperation. Large air containing
collections may make ultrasonography difficult. Lesions which are isoechoic to the
liver parenchyma, may be missed.
Thus ultrasound offers a safe, sensitive and easily available imaging modality
for the diagnosis and follow-up of various hepatobiliary lesions and should be the first
line of investigation in suspected cases.

126
SUMMARY
One fifty cases with various hepatobiliary lesions were studied with real time
ultrasonography and the following results were obtained:
1. Maximum number of cases were in the age group of 40 to 50 years (40%) and
minimum number of patients were in the age group of 70 years & above (3%). No
case was found below 8years of age.
2. The youngest patient was 9 year old and the oldest patient was 81 year old.
3. Males were affected more than females. 76 patients (51%) were males and 74
patients (49%) were females. A male to female ratio of about 1.5:1 was found.
4. Pain in the abdomen was the most common presenting symptom (42%). On
examination, presence of hepatomegaly was found in 82 cases (54%).
5. The most commonly encountered gall bladder lesion in the study was gall stones
(44/50) i.e 88%. Majority of cases were between 40-69 years of age (64%).
Females were more commonly affected (33/44) i.e 75% with a M:F ratio of
1:3.Gall stones were associated with acute cholecystitis in 20% (10/50) of
cases,with chronic cholecystitis in 32 cases (64%)
6. 10 cases of acute cholecystitis was found. Majority of cases (60%) were seen in
3rd
& 4th
decades. A M:F ratio of 1:9 was found. Gall bladder wall thickening was
seen in 90% (9/10), cholelithiasis in 100% (10/10) and Murphys sign in 80%
(8/10).
7. There were 34 cases of chronic cholecystitis.Majority of cases were in women
(22/32), were associated with gall stones (68%). Majority of cases were
encountered in 4th
, 5th
and 6th
decades of life (79%). Ultrasound showed gall
stones in 32 cases (94%), wall thickening in 20 cases (57%). Gall stones were
multiple and small and hence could not be enumerated.
8. 3 cases of Gall bladder (6%) carcinoma with M:F ratio of 1:2.The age group
ranged from 40-60 years. Ultrasound showed irregular wall thickening in 1 case,
mass lesion in other 2 cases.Two cases were associated with gall stones.
9. There were 3 cases of gall bladder polyp in the age group of 27-49years with a
M:F ratio of 2:1. Ultrasound showed small, solitary nonmobile, nonshadowing
mass(less than 10mm) adherent to GB wall in all 3 cases.

127
10.There were 5 cases of CBD lesions, 2 cases of cholangiocarcinoma, 2 cases of
choledocholithiasis and 1 case of choledochal cyst.Majority of cases were
between 40-60 years (80%) with a M:F ratio of 3:2.
11. There were 2 cases of cholangiocarcinona in males in the group of 50-60
years.One case of Klatskin tumour showed hyperechoic mass lesion in porta
hepatis.The other case showed dilated CBD with IHBRD. Distal CBD was
obscured by bowel gas. A diagnosis of ?distal CBD lesion was made. Further
evaluation with ERCP showed the level of obstruction in distal CBD which was
confirmed by biopsy.
12. Two cases of CBD calculi in females in the age group of 40-50years.Ultrasound
detected stones in both cases (100%). One case of CBD calculus had associated
cholelithiasis.
13. One case of choledochal cyst in a male aged 27years. Ultrasound showed fusiform
cystic dilatation of extrahepatic CBD with intrahepatic biliary radicle dilatation.
14. A majority of the focal liver lesions were solitary (68%). Multiple lesions were
encountered in only 16 cases (32%).
15. There was an overall tendency of right lobe involvement (88%). The right lobe
alone was involved in 32 cases (64%); the left lobe alone was involved in 6 cases
(12%), whereas in 12 cases (24%) both the lobes were involved.
16. Liver abcess and hepatocellular carcinoma comprised 64% of all cases of which
90% were male patients.
17. The most frequently encountered focal liver lesion in this study was amoebic liver
abscess which was found in 20 cases (40%). A vast majority of patients were
between 21-50 years of age (85%). All the patients were males.
18. Majority of the abscesses were between 5-10 cm in diameter. A majority of the
patients had solitary abscess (65%) while 7 cases had multiple abscesses (35%). In
13 cases (65%) the right lobe alone was involved. In 5 cases both the lobes were
involved (25%), while the left lobe alone was involved in only 2 cases (10%).
19. The second most commonly encountered focal liver lesion was hepatocellular
carcinoma accounting for 24% of cases. A male to female ratio of 3:1 was found.
The maximum number of patients were between 41-50 years of age (50%). No
case was found below 30 years of age. The lesions were limited to the right lobe
in 9 cases (75%); while in the remaining 3 cases (25%) both the lobes were
involved.

128
20. 10 cases (20%) with hepatic metastasis were found. Breast was the most common
site of primary malignancy in these cases (50%). The majority of cases (90%)
were between 41 and 60 years of age. A male to female ratio of 1:4 was found.
Majority of the cases (80%) had multiple lesions while 2 cases (20%) had solitary
lesion. In 5 cases (50%) bull's eye lesion was found. 3 cases (30%) had
hypoechoic lesions, while 2 cases (20%) had hyperechoic lesions.
21. 4 cases (8%) with ultrasound features highly suggestive of haemangioma were
found. 2 patients had solitary lesions. The other 2 patients had multiple lesions, of
which 1 case had an associated amoebic liver abscess. A female to male ratio of
3:1 was found.
22. 2 cases (4%) with hepatic hydatid disease were found. Both the patients had
characteristic cysts within cyst appearance.
23. One case (2%) of an intrahepatic haematoma was found. The ultrasound pattern of
an almost anechoic lesion with internal stranding in part of the lesion was highly
suggestive of a haematoma in a male patient.
24. One case (2%) of a simple liver cyst was found. It was an incidental finding in a
female patient who did not have any symptom related to the lesion.
25. 45 cases of Diffuse Liver Diseases were studied.Majority of cases were between
31-50years (60%). A F:M ratio of 1.5:1 was found.
26. 10 cases of acute hepatitis in the study.Maximum no. of cases were seen in
children (10/10) in the age group of 1-15 years with M:F ratio of 2:3.Ultrasound
showed only hepatomegaly in 9 cases (90%), one case showed diffusely
decreased echotexture with increased periportal echoes (starry night pattern).
27. 4 cases of HBsAg positive, 3 males and 1 female in the age group of 40-
55years.Ultrasound showed normal finding in 3 patients, one case showed coarse
echotexture and increased parenchymal echogenecity, portal vein walls were less
conspicuous.
28. 12 cases of cirrhosis, 10 males and 2 females in the age group ranging from 30-
60years.Ultrasound showed nodular liver surface in 12 cases (100%)
,hepatomegaly in 3 cases (25%), coarsened echotexture in 100%., ascitis (12/12 i.e
100%), spenomegaly in 3 cases (25%).
29. In the study there were 3 cases of congestive liver, 2 males and 1 female with a
M:F ratio of 2:1, in the age group of 30-60years. Ultrasound showed
hepatomegaly with mild decreased echotexture, dilated IVC and hepatic veins,

129
pleural effusion, pericardial effusion, ascitis was present in all 3 cases.
30. In the study there were 16 cases of fatty liver, 10 females and 4 males in the age
group of 30-70years. Ultrasound showed bright liver echopattern in all 16 cases
(100%), hepatomegaly in (50%).
31. Ultrasound proved to be a safe, sensitive and easily available imaging modality
for the diagnosis and follow-up of various hepatobiliary lesions

130
BIBLIOGRAPHY
1. Parulekar SG. Ligaments and fissures of the liver: sonographic anatomy.
Radiology 1979 Feb; 130:409-11.
2. Dick R, Davies ER, Whitehouse RW, Lees WR, Olliff JFC, Robinson PJA.
The liver and spleen. In: Sutton D, editor. Textbook of Radiology and
Imaging. 6th ed. New York: Churchill Livingstone; 1998. p. 990. (Textbook of
Radiology and Imaging; vol 2).
3. Taylor KJ, Rosenfield AT, Spiro HM. Diagnostic accuracy of gray scale
ultrasonography for the jaundiced patients.Archieves of Internal Medicine.
1979; 13:60-63.
4. Abramson SJ, Treves S, Teele RS. The infant with possible biliary atresia.
Evalvation by ultrasound and nuclear medicine. Paediatric Radiology 1982;
12:1-5.
5. Brun P, Gauthier F, Boucher D, Brunelle F. Ultrasound findings in biliary
atresia.Annales de Radiologie (paris) 1985; 259-263.
6. Cosgrove DO. Ultrasound in surgery of the liver and biliary tract. In: Blumgart
LH, editor. Surgery of the liver and biliary tract. Edinburg: Churchill
livingstone Inc: 1994. p. 211.
7. Joseph AEA, Saverymuttu SH, AI-Sam S, Cook MG, Maxwell JD.
Comparison of liver histology with ultrasonography in assessing diffuse
parenchymal liver disease.Clinical Radiology 1991; 43: 26-31.
8. Sample WF, Sarti DA, Goldstein LI et al. Gray scale ultrasonography of
jaundiced patient.Radiology 1978; 128: 719- 725.

131
9. Mueller PR. Jaundice. In: Simeone J, editor. Coordinated diagnostic imaging.
Newyork: Churchill livingstone; 1984 ch-2. (clinics in diagnostic ultrasound;
vol 14).
10. Lunderquist A. The Radiology of jaundice. Clinical Gastroenterology 1989;
3: 387-406.
11. Khan SA, Davidson BR, Goldin R, Pereira SP. GUT 2002; 51: vi1-vi 9.
12. Bolognesi Massimo, Saccerdoti David. RSNA 2000; 216: 738-743.
13. Badea Radu, Socaciu Mihai, Lupsor M, Pop Teodora. Journal of
Gastroenterology and liver diseases 2007; vol 16. No.1.
14. Bryan PJ, Dinn WM, Grossman ZD, Wistow BW, McAfee JG, Kieffer SA.
Correlation of computed tomography, gray scale ultrasonography, and
radionuclide imaging of the liver in detecting space-occupying processes.
Radiology 1977 Aug; 124: 387-93.
15. Dick R, Davies ER, Whitehouse RW, Lees WR, Olliff JFC, Robinson PJA.
The liver and spleen. In: Sutton D, editor. Textbook of Radiology and
Imaging. 6th ed. New York: Churchill Livingstone; 1998. p. 990. (Textbook of
Radiology and Imaging; vol 2).
16. Bolondi L, Gandolfi L, Labo G. The liver. In: Bolondi L, Gandolfi L, Labo G,
editors. Diagnostic Ultrasound in Gastroenterology. Padova, Italy:
Piccin/Butterworths; 1984. p. 143.
17. Krige JEJ, Beckingham IJ. ABC of diseases of liver, pancreas, and biliary
system: Liver abscesses and hydatid disease. BMJ 2001 Mar 3; 322 (7285):
537-40.

132
18. Tan JA, Chua CJ, Lira CP, Ana AS, Ong HC. A Non-Invasive Approach in
the Diagnosis of Amoebic Abscess. Phil J Microbiol Infect Dis 1988; 17 (1):
25-8.
19. Kapoor OP. Imaging of an amoebic liver abscess. BHJ 1989; 31(2):123-5.
20. Vicary FR, Cusick G, Sherley IM, Blackwell RJ. Ultrasound and amoebic
liver abscess. Br J Surg 1977 Feb; 64(2): 113-4.
21. Ralls PW, Colletti PM, Quinn MF, Halls J. Sonographic findings in hepatic
amoebic abscess. Radiology 1982 Oct; 145: 123-6.
22. Ramamohan C, Reddy PK, Manohar K. Sonographic evaluation of liver
abscess. Indian J Radiol Imaging 1989 Aug; 43(3): 312-5.
23. Chaturvedi AK, Sangameshwaran KV. Sonographic evaluation of amoebic
liver abscess. Indian J Radiol Imaging 1989 Nov; 43(4): 373-7.
24. Ahmed L. Salama ZA, el Rooby A, Strickland GT. Ultrasonographic
Resolution Time for Amebic Liver Abscess. Am J Trop Med Hyg 1989 Oct;
41(4): 406-10.
25. Friedman AC, Frazier S, Hendrix TM, Ros PR. Focal diseases. In: Friedman
AC, Dachman AH, editors. Radiology of the liver, biliary tract, and pancreas.
St. Louis: Mosby-Year Book Inc.; 1994. p. 169.
26. Green B, Bree RL, Goldstein HM, Stanley C. Gray scale ultrasound evaluation
of hepatic neoplasms: patterns and correlations. Radiology 1977 July; 124(1):
203-8.
27. Bernardino ME, Lewis E. Imaging hepatic neoplasms. Cancer 1982 Dec 1; 50
(11 Suppl): 2666-71.
28. Furuse J, Nagase M, Ishii H, Yoshino M. Contrast enhancement patterns of
hepatic tumours during the vascular phase using coded harmonic imaging and

133
Levovist to differentiate hepatocellular carcinoma from other focal lesions. Br
J Radiol 2003; 76: 385-92.
29. Bernardino ME, Thomas JL, Maklad N. Hepatic sonography: technical
considerations, present applications, and possible future. Radiology 1982 Jan;
142 (1): 249-51.
30. Karani J. Tumours: benign, primary malignant. In: Wilkins RA, Nunnerley
HB, editors. Imaging of the liver, pancreas and spleen. Oxford: Blackwell
Scientific Publications; 1990. p. 173.
31. Broderick TW, Gosink B, Menuck L, Harris R, Wilcox J. Echographic and
radionuclide detection of hepatoma. Radiology 1980 Apr; 135: 149-51.
32. Raju Sharma, Diagnostic Radiology: Gastrointestinal and Hepatobiliary
Imaging, Manorama Berry, second edition, 2004, pp: 262, published by
Jaypee Brothers Medical Publishers (P) Ltd.
33. Cosgrove DO. Malignant liver disease. In: Meire HB, Cosgrove DO, Dewbury
KC, Farrant P, editors. Abdominal and General Ultrasound. 2nd ed. London:
Churchill Livingstone; 2001. p. 221. (Clinical ultrasound: a comprehensive
text; vol 1).
34. Sheu JC, Sung JL, Chen DS, Yu JY, Wang TH, Su CT et al. Ultrasonography
of small hepatic tumors using high-resolution linear-array real-time
instruments. Radiology 1984 Mar; 150(3): 797-802.
35. Sheu JC, Chen DS, Sung JL, Chuang CN, Yang PM, Lin JT et al.
Hepatocellular carcinoma: US evolution in the early stage. Radiology 1985
May; 155(2): 463-7.

134
36. Subramanyam BR, Balthazar EJ, Hilton S, Lefleur RS, Horii SC, Raghavendra
BN. Hepatocellular carcinoma with venous invasion. Sonographic-
angiographic correlation. Radiology 1984 Mar; 150(3): 793-6.
37. Dubbins PA, O'Riordan D, Melia WM. Ultrasound in hepatoma-can specific
diagnosis be made? Br J Radiol 1981 Apr; 54 (640): 307-11.
38. Cottone M, Marcenò MP, Maringhini A, Rinaldi F, Russo G, Sciarrino E et al.
Ultrasound in the diagnosis of hepatocellular carcinoma associated with
cirrhosis. Radiology 1983 May; 147(2): 517-9.
39. Caturelli E, Castellano L, Fusilli S, Palmentieri B, Niro GA, del Vecchio-
Blanco C et al. Coarse nodular US pattern in hepatic cirrhosis: risk for
hepatocellular carcinoma. Radiology 2003 Mar 1; 226(3): 691-7.
40. Taylor KJW, Carpenter DA, Hill CR, McCready VR. Gray scale ultrasound
imaging. The anatomy and pathology of the liver. Radiology May 1976;
119(2): 415-23.
41. Withers CE, Wilson SR. The liver. In: Rumack CM, Wilson SR, Charboneau
JW, editors. Diagnostic Ultrasound. St. Louis: Mosby-Year Book, Inc.; 1991.
p. 75. (Diagnostic ultrasound; vol 1).
42. Koenigsberg M, Hoffman-Tretin J. Abdominal sonography. In: Kassner EG,
editor. Atlas of Radiologic Imaging. Philadelphia: J. B. Lippincott; 1989. p.
5.6-8.
43. Berk RN, Burhenne HJ, Clemett AR, Filly RA, Gooding GAW, Laing FC, et
al. Liver and biliary tract. In: Margulis AR, Burhenne HJ, editors. Practical
Alimentary Tract Radiology. St. Louis: Mosby-Year Book Inc.; 1993. p. 345-
6.

135
44. Sekiya T, Kelly MJ, Meller ST, Cosgrove DO, McCready VR.
Ultrasonographic evaluation of hepatic metastases in testicular tumour. Br J
Radiol 1982 May; 55(653): 338-41.
45. Golding SJ, Fletcher EWL. The radiology of secondary malignant neoplasms
of the liver. In: Wilkins RA, Nunnerley HB, editors. Imaging of the liver,
pancreas and spleen. Oxford: Blackwell Scientific Publications; 1990. p. 201.
46. Albrecht T, Blomley MJ, Burns PN, Wilson S, Harvey CJ, Leen E et al.
Improved detection of hepatic metastases with pulse-inversion US during the
liver-specific phase of SHU 508A: multicenter study. Radiology 2003 May;
227(2): 361-70.
47. Vassiliades VG, Bree RL, Korobkin M. Focal and diffuse benign hepatic
disease: correlative imaging. Semin Ultrasound CT MR 1992; 13: 313-35.
48. Adam A, Allison DJ, Bydder G, Hemingway A, Malmud LS, Vitti RA, et al.
The liver. In: Grainger G, Allison DJ, editors. Diagnostic Radiology. 2nd ed.
Edinburgh: Churchill Livingstone; 1992. p. 1043-4. (Textbook of Diagnostic
Radiology; vol 2).
49. Niron EA, Ozer H. Ultrasound appearances of liver hydatid disease. Br J
Radiol 1981 Apr; 54(640): 335-8.
50. Sharma SK, Sengupta A. Ultrasonographic pattern of hepatic hydatid desease.
Indian J Radiol Imaging 1989 Feb; 43(1): 33-6.
51. Hadidi A. Sonography of hepatic echinococcal cysts. Gastrointest Radiol 1982
Dec; 7(4): 349-54.
52. Gharbi HA, Hassine W, Brauner MW. Ultrasound examination of the hydatid
liver. Radiology 1981; 139: 459-63.

136
53. Sawhney S, Berry M, Jain R. Ultrasound morphology of abdominal hydatid
cysts. Indian J Radiol Imaging 1990 Aug; 44(3): 172-6.
54. Lewall DB, McCorkell SJ. Hepatic echinococcal cysts: sonographic
appearances and classification. Radiology: 1985; 155: 773-5.
55. Ramamohan C, Reddy PK, Manohar K. Role of ultrasonography in the
diagnosis of hepatic hydatid disease. Indian J Radiol Imaging 1991 Aug; 1:
21-4.
56. Volterrani L, Guercia M, Guidoni E, Guercia C, Cetta F, Tucci E.
[Echotomography and hyperechoic angiomas of the liver. The structural
aspects in 297 cases]. Radiol Med (Torino) 1989 Jul-Aug; 78(1-2): 57-60.
57. Patel PJ, El-Desouki M, Al-Mofleh I. Sonographic and scintigraphic diagnosis
of large-size hepatic cavernous hemangiomas. Indian J Radiol Imaging 1990
Feb; 44(1): 19-22.
58. Taboury J, Porcel A, Tubiana JM, Monnier JP. Cavernous hemangiomas of
the liver studied by ultrasound. Enhancement posterior to a hyperechoic mass
as a sign of hypervascularity. Radiology 1983 Dec; 149(3): 781-5.
59. Winter TC III, Laing FC. Hepatic ultrasound. In: Freeny PC, Stevenson GW,
editors. Margulis & Burhenne’s Alimentary Tract Radiology. 5th ed. St.
Louis: Mosby-Year Book Inc.; 1994. p. 1474. (Margulis & Burhenne’s
Alimentary Tract Radiology; vol 2).
60. Malik Ahsan Khalid. Pattern of Gall bladder disease at Nawabshah: An
analysis of 260 patients.Pakisthan Journal of Surgery 2006; vol 22.issue 4.
61. Silidker S. Mark, Cronan J John, Scola H Francis, Moore M Marlan, Dorfan S.
Gary. Ultrasound evaluation of cholelithiasis in morbidly obese.
Gastrointestinal Radiology 1988; vol 13: 345-346.

137
62. Ralls P W, Colletti PM, Lapin SA et al. Real time sonography in suspected
acute cholecystitis. Prospective evaluation of primary and secondary signs.
Radiology 1985; 155: 767-771.
63. Laing F C, Federle MP, Jeffrey R B, Brown TW. Ultrasonic evaluation of
patients with Right upper quadrant pain. Radiology 1981; 449-455.
64. Croce F, Montali G, Solbiati L, Marinomi G. Ultrasonography in acute
cholecytitis. British Journal of Radiology 1981; 54: 927-931.
65. Rahman Ur Ata, Shah Ali Murad Syed Khan Nadeem, Arif Ataullah,
Assadullah, Sadiq Uddin, Muzaffar. Frequency of carcinoma gall bladder in
patients undergoing surgery for chronic cholecystitis with
cholelithiasis.Journal of Medical Sciences 2006; vol 14. No.1.
66. Shah SA, Nadler LH, Mc Sherry CK. Gall stone disease in Pakisthan. The
Journal of Surgery 1990; 1: 30-33.
67. Ferruci JT. Journal of body ultrasonography. N Eng J Med 1979; 300: 590-
602.
68. Koenigsberg M, Wiener SN, Walzer A. The accuracy of sonography in the
differential diagnosis of obstructive jaundice: A comparison with
cholangiography. Radiology 1979; 133: 157-165.
69. Collett J, Allan R, Chisholm R et al. Gall bladder poyps: Prospective study. J
Ultrasound Medicine 1998; 17: 207-211.
70. Gibson RN, Yeung E, Thompson et al. Bile duct obstruction: Radiologic
evaluation of the level, cause and tumour resectibility. Radiology 1986; 160:
43-47.

138
71. Todani T, Watanabe hue, Narusue M, Tabuchi K, Okajimok. Congenital bile
duct cysts. Classification, operative procedure and review of thirty seven cases
including cancer arising from choldeochal cyst. Am J Surg 1977; 134: 263-9.
72. Agarwal MP, Kapoor R, Saha MM. Ultrasonography and scintiscanning in the
diagnosis of intrahepatic space occupying lesions. Indian J Radiol Imaging
1991 Nov; 44(Suppl 1): 33-7.
73. Jain AK, Gupta NC, Kapoor R, Saha MM. Sonographic spectrum of hepatic
metastatic disease. Indian J Radiol Imaging 1990 Feb; 44: 156-61.
74. Scheible W, Gosink BB, Leopold GR. Gray scale echographic patterns of
hepatic metastatic disease. AJR Am J Roentgenol 1977 Dec; 129(6): 983-7.
75. Hillman BJ, Smith EH, Gammelgaard J, Holm HH. Ultrasonographic-
pathologic correlation of malignant hepatic masses. Gastrointest Radiol 1979
Dec; 4(1): 361-5.
76. Viscomi GN, Gonzalez R, Taylor KJ. Histopathological correlation of
ultrasound appearances of liver metastases. J Clin Gastroenterol 1981 Dec;
3(4): 395-400.
77. Wooten WB, Green B, Goldstein HM. Ultrasonography of necrotic hepatic
metastases. Radiology 1978 Aug; 128: 47-50.
78. Palmentieri Sio BI. De Mura V.La Masarone M Vecchione R Bruno S, Torella
R Persico M et al.Role of The bright liver echo pattern on ultrasound B-mode
examination in the diagnosis of liver steatosis.Digestive and Liver disease
2006 july; issue 7: 485-489.
79. Zweibel W J. Sonographic Diagnosis of Diffuse Liver Disease. Semin
Ultrasound CT MR 1995; 16: 8-15.

139
80. Kurtz AB, Rubin CS, Cooper HC et al. Ultrasound findings in hepatitis.
Radiology 1980; 136: 717-723.
81. Glorgio A, Ambroso P, Fico P et al. Ultrasound evaluation of uncomplicated
and complicated acute viral hepatitis. J clin Ultrasound 1986; 14: 675-679.
82. Kurtz B Alfred, Rubin S Carl, Cooper S Harry, Nisenbaum L Harvey, Beuglet
Cole Catherine, Medoff Joseph, Goldberg B Barry. Ultrasound findings in
Hepatitis. Radiology 1980; 136: 717-723.
83. Ong Tz, Tan H J. Singapore Med J 2003; vol 44(6): 293-295.
84. Hani H, Judah Abu. The “Starry Sky” Liver with Right sided heart failure AJR
2002; 178: 78.
85. Bannister LH. Alimentary system: liver. In: Williams PL, Bannister LH, Berry
MM, Collins P, Dyson M, Dussek JE, Ferguson MWJ, editors. Gray’s
anatomy. 38th ed. New York: Churchill Livingstone 1995; p. 1795-1808.
86. Sanders RC. Clinical sonography: a practical guide. 3rd ed. Philadelphia:
Lippincott, Williams & Wilkins 1998; p. 579.

140
ANNEXURES
PROFORMA
Name:
Age:
Sex:
Religion:
Occupation:
Address:
Chief presenting Complaints:
History of presenting illness:
Past History:
Family History:
Personal History:
GENERAL PHYSICAL EXAMINATION
Pallor:
Icterus:
Clubbing:
Cyanosis:
Lymphadenopathy:
Edema:
SYSTEMIC EXAMINATION
Per Abdomen:
Inspection:
Palpation:
Percussion:
Auscultation:
Respiratory System:
Cardio Vascular System:

141
LABORATORY EXAMINATION
Routine Blood and Urine Analysis:
Blood Urea and Serum Creatinine:
Liver Function Tests:
RADIOLOGICAL EXAMINATION
Radiograph:
Abdomen - Supine, Erect, Lateral Decubitus:
Chest PA:
Ultrasonography:
CT / MRI:
ERCP:
MRCP:
Provisional Diagnosis:
Surgery/Medical treatment:
Post-operative findings:
Histo-Pathological findings:
Final Diagnosis:

142
MASTER CHART
SL. Name AGE/SEX C/F Ultrasound Ultrasound Final diagnosis
No. OP/IP No. PAIN MASS IN RIGHT GB Stones W.T
. sludge diagnosis
JAUNDICE FEVER HYPOCHONDRIUM size Number Size (mm) M
1 ANIKETH 127 18/M P A P A D 2 2 + - G.S WITH A.CH G.S WITH A.CH 2 SRIDEVI 43772 28/F P A P A D 1 2 + - G.S WITH A.CH G.S WITH A.CH 3 DEVANNA 1204 48/M P A A A C M - + - G.S WITH C.CH G.S WITH C.CH 4 SHIVANNA 1769 49/M P A A A C M - + + GS WITH C.CH GS WITH C.CH 5 LAKSHMI 2018 34/F P A P A D 2 4 + - G.S WITH A.CH G.S WITH A.CH 6 RAJANNA 2667 46/M P A A A C M - + - G.S WITH C.CH G.S WITH C.CH 7 DHANALAKSHMI 3290 35/F P A P A D 4 4 + + G.S WITH A.CH G.S WITH A.CH 8 LAKSHMI 3197 38/F P A P A D 3 2 + - G.S WITH A.CH G.S WITH A.CH 9 ANITHA 3874 36/F P A P A D 2 2 + - G.S WITH A.CH G.S WITH A.CH
10 THAYAMMA 22640 48/F P A P A D 3 1 + - G.S WITH A.CH G.S WITH A.CH 11 ANASUYAMMA 4533 49/F P A P A D 4 5 + + G.S WITH A.CH G.S WITH A.CH 12 NARASAMMA 5367 59/F P A A A D 2 1 + + G.S WITH A.CH G.S WITH C.CH 13 HAMPAMMA 6177 55/F A A A A D 3 1 + - G.S WITH A.CH G.S WITH C.CH 14 MAHADEVAMMA 6586 42/F A A A A C M - + - G.S WITHC.CH G.S WITH C.CH 15 ASHA BEE 7174 46/F A A A A C M - + - G.S WITH C.CH G.S WITH C.CH 16 UMADEVI 7444 49/F P A A A C M - + + G.S WITH C.CH G.S WITH C.CH
17 NAGARATHNAMMA 7668 47/F P A A A C M - + - G.S WITH C.CH G.S WITH C.CH
18 SEETHAMMA 7735 45/F P A A A C M - + + G.S WITH C.CH G.S WITH C.CH 19 RANGA REDDY 8265 46/M P A A A C M - + - G.S WITH C.CH G.S WITH C.CH 20 SAROJA 8751 43/F A A A A C M - + - G.S WITH C.CH G.S WITH C.CH 21 NARAYAN 9025 54/M A A A A C M - + + G.S WITH C.CH G.S WITH C.CH 22 RAMESH 9652 56/M A A A A C M - + - G.S WITH C.CH G.S WITH C.CH 23 LAXMANNA 9915 58/M P A A A C M - + - G.S WITH C.CH G.S WITH C.CH 24 BHIJAMMA 10205 54/F P A A A C M - + - G.S WITH C.CH G.S WITH C.CH 25 EARAPPA 9721 52/M A A A A C M - + - G.S WITH C.CH G.S WITH C.CH 26 GOVINDAPPA 11588 62/M P A A A C M - + + G.S WITH C.CH G.S WITH C.CH
27 HANUMANTHAPPA 12171 66/M P A A A C M - + - G.S WITH C.CH G.S WITH C.CH
28 JAMAL BEE 12175 58/F P A A C M - + - G.S WITH C.CH G.S WITH C.CH 29 KAMALAMMA 13352 57/F P A A A C M - + - G.S WITH C.CH G.S WITH C.CH 30 ANNAPURNA 13774 55/F P A A A C M - + + G.S WITH C.CH G.S WITH C.CH 31 KULIGAPPA 14328 49/M P P A P C + - + - GB .CA GB CA 32 MAREPPA 14677 55/M P A A A C - - + - C.CH C.CH 33 YANKAMMA 15624 65/F P A A A C M - + - G.S WITH C.CH G.S WITH C.CH 34 NAGAMMA 15761 68/F A A A A C M - + - G.S WITH C.CH G.S WITH C.CH 35 PARVATHAMMA 16388 63/F A A A A C M - + - G.S WITH C.CH G.S WITH C.CH 36 VENKATESH 16447 56/M A A A A C - - + - C.CH C.CH 37 NARASAMMA 16993 68/F A A A A C M - + + G.S WITH C.CH G.S WITH C.CH 38 THIMALAMMA 17627 67/F P A A A C M - + - G.S WITH C.CH G.S WITH C.CH 39 SHAKUNTHALA 18121 64/F A A A A C M - + - G.S WITH C.CH G.S WITH A.CH 40 AYYAMMA 18657 66/F A A A A C M - + + G.S WITH C.CH G.S 41 LAXMAMMA 19362 73/F A A A A C M - + - G.S WITH C.CH G.S 42 MALLAMMA 19708 76/F A A A A C M - + + G.S WITH C.CH G.S 43 KARIYAMMA 20254 78/F A A A A C M - + - G.S WITH C.CH G.S 44 SHIVALINGAMMA 20551 47/F A A A A D - - - - GB POLP GB POLP 45 KAMALAMMA 20689 70/F P A A A C M - + - G.S WITH C.CH G.S 46 HANUMANTHU 21681 45/M A A A A D - - - - GB POLYP GB POLP 47 MANIKYAMMA 23125 81/F A A A A C M - + + G.S WITH C.CH G.S 48 BASAPPA 23272 44/M A A A A D - - - - GB POLYP GB POLYP 49 SARASWATHI 23268 54/F P P A P - 1 1.3 + - GB .CA GB.CA 50 KHAJA BEE 23347 56/F P P A A D - - - - GB .CA GB .CA

143
Sl. No. Name
O.P/I.P No. Age Sex
Clinical Features LFT No. of Lesions Lobe
USG Diagnosis Final Diagnosis
Pain Tend H.megaly Jaundice Fever
51 SHANKARAPPA 24419 47 M P A P A A WNL SOL RT HCC HCC
52 SIDDANGOWDA 24907 30 M P P P A P WNL MUL BOTH LA ALA
53 DURGAPPA 25564 36 M P P P A A WNL SOL RT LA ALA
54 GOVINDAPPA 26168 45 M P P P P A ALT SOL RT HCC HCC
55 GOVINDAMMA 25420 63 F A A A A A WNL SOL RT SC -
56 RAMACHANDRA 27173 45 M P A P P A ALT MUL BOTH METS METS
57 MALLESH 27377 34 M P P P A P ALT MUL RT LA ALA
58 JYOTHI 27845 40 F P A P A A WNL SOL RT HCC HCC
59 NAGAMMA 28360 25 F P P P A A WNL MUL RT HYD HYD
60 HUSSAINAPPA 28653 43 M P P P P P ALT MUL BOTH HCC HCC
61 NARASAYYA 29132 51 M P P P A A WNL SOL RT LA ALA
62 RAYAPPA 29651 35 M P A P P A ALT SOL RT HCC HCC
63 KARIYAMMA 29872 30 F A A A A A WNL SOL RT HNG -
64 SHARANAPPA 30068 45 M P P P A P ALT MUL BOTH LA ALA
65 THIMMAPPA 31188 45 M P P A A A WNL SOL RT HEM -
66 MAHANTHESH 31488 45 M P P P A P WNL SOL RT LA ALA
67 THULASI BHAI 32063 51 F A A A A A WNL MUL RT HNG -
68 RAJASHEKHAR 32756 35 M P P P A A WNL SOL RT LA ALA
69 RAMAYYA 32986 42 M P P P A P WNL SOL LT LA ALA
70 VEERANNA 33732 30 M P P P P P ALT MUL BOTH LA ALA
71 YENKANNA 33734 58 M P A P A A WNL MUL BOTH HCC HCC
72 JOSHI 34574 36 M P P P A P ALT MUL RT LA ALA
73 MAHADEVAPPA 35571 50 M P A A A A WNL MUL BOTH METS METS
74 BASAVARAJ 35839 45 M P P P A P WNL SOL RT LA ALA
75 VEERESH 35451 43 M P P P A A WNL SOL LT LA ALA
76 NAGARAJ 36891 30 M P P P P P ALT MUL BOTH LA ALA 77 DHANUMANNA 37201 45 M P P P A P WNL SOL RT HCC HCC 78 RAMAPPA 37565 42 M P P P A A WNL SOL RT LA ALA 79 BUDDAYYA 38329 45 M P P P P A ALT MUL BOTH HCC HCC 80 RADHAMMA 38774 35 F A A A A A WNL MUL BOTH METS METS
81 HUSSAIN BASHA 39067 30 M P P P A P WNL SOL RT LA ALA
82 SIDDAMMA 39920 50 F P A P A A WNL SOL RT HCC HCC 83 BASSAMMA 40667 56 F A A A A A WNL SOL RT METS METS 84 SURESH 41211 28 M P P P A P WNL SOL RT LA ALA
85 ARUNA 42007 48 F A A A A A WNL MUL BOTH METS METS
86 FATHIMA 42473 52 F A A A A A WNL MUL BOTH METS METS 87 AMARAMMA 42844 42 F P A A A A WNL MUL RT METS METS 88 NINGAPPA 42874 53 M P P P A A WNL MUL BOTH LA ALA 89 SANDHYA 43691 35 F A A A A A WNL SOL RT HNG - 90 SHANKARAYYA 44173 50 M A A A A A WNL MUL RT HNG - 91 SUGAMMA 45650 60 F P P P A A WNL SOL RT HCC HCC 92 HANUMANTHU 45970 60 M P A P P A ALT SOL RT HCC HCC 93 NARAYANA 46543 40 M P P P P P ALT SOL RT LA ALA 94 HANUMAYYA 47262 38 M P A P A A WNL SOL RT HCC HCC 95 RAJIYA BEGUM 47259 60 F A A A A A WNL MUL RT METS METS 96 ERAMMA 48123 45 F A A A A A WNL MUL RT METS METS 97 GANGAPPA 48975 55 M P P P A P WNL SOL RT LA ALA 98 THIMMAYYA 49776 60 M P P P A A WNL SOL RT HYD HYD 99 RAMAKRISHNA 50183 34 M P P P A P WNL SOL RT LA ALA
100 DEVAMMA 50217 49 F A A A A A WNL SOL RT METS METS

144
Sl. No Name OP/ IP Age/ FEVER C/F LFT U/S Diagnosis Final Diagnosis
No. Sex
Dist
Hep.
Jaun
Asc.
PL.Efff
Spln.Ly L
101 GANGADHAR 1509 14/M P A P P A A A ALT HEPATOMEGALY ACUTE HEPATITIS 102 RIYAZ 1838 15/M P A P P A A A ALT HEPATOMEGALY ACUTE HEPATITIS 103 SHILPA 1757 13/F P A P P A A A ALT HEPATOMEGALY ACUTE HEPATITIS 104 RAVI KUMAR 2753 15/M P A P P A A A ALT HEPATOMEGALY ACUTE HEPATITIS 105 HANUMANTHI 2853 10/F P A P P A A A ALT HEPATOMEGALY ACUTE HEPATITIS 106 JYOTHI 2980 12/F P A P P A A A ALT HEPATOMEGALY ACUTE HEPATITIS 107 SABAMMA 3458 44/F A P P P P P A ALT CIRRHOSIS CHRONIC HEPATITIS 108 GADDAPPA 4000 49/M A P P P P P A ALT CIRRHOSIS CHRONIC HEPATITIS 109 RAMAKRISHNA 4293 18/M P A P P A A A ALT ACUTE HEPATITIS ACUTE HEPATITIS 110 GOWRI 4980 46/F A P A P P P P ALT CIRRHOSIS CIRRHOSIS 111 JAYANTHI 5208 43/F A A P P A A A ALT CHRONIC LIVER DISEASE CHRONIC HEPATITIS 112 VEENA 5855 45/F A A P A A A A WNL FATTY LIVER NORMAL 113 SOMAPPA 5589 43/M A P A P P P P ALT CIRRHOSIS CIRRHOSIS 114 GANGA BHAI 6584 49/F A A P A A A A WNL FATTY LIVER FATTY LIVER 115 SUDHA 5657 14/F P A P P A A A ALT HEPATOMEGALY ACUTE HEPATITIS 116 RUKMINI 7134 9/F P A P P A A P ALT HEPATOMEGALY ACUTE HEPATITIS 117 PALLAVI 7935 10/F P A P P A A P ALT HEPATOMEGALY ACUTE HEPATITIS 118 LINGAPPA 9068 54/M A P P P P A A ALT CIRRHOSIS CHRONIC HEPATITIS 119 BASAVARAJ 9479 50/M A P P P P A A ALT CIRRHOSIS FATTY LIVER 120 SHANTHAPPA 9871 48/M A P P A P A A ALT CIRRHOSIS CHRONIC HEPATITIS 121 NARASAMMA 10308 54/F A A P A A A A WNL FATTY LIVER FATTY LIVER 122 SHIVAMMA 10145 49/F A A P A A A A WNL FATTY LIVER NORMAL 123 AMARAMMA 10814 54/F A A P A A A A WNL FATTY LIVER FATTY LIVER 124 BHEEMAVVA 11227 60/F A A A A A A A WNL FATTY LIVER NORMAL 125 SANGANNA 12885 46/M A P A A P P P ALT CIRRHOSIS CIRRHOSIS 126 GANGARAJU 13418 47/M A P A A P P P ALT CIRRHOSIS CIRRHOSIS 127 BHARATHI 15009 49/F A A P A A A A WNL FATTY LIVER FATTY LIVER 128 MALLAYYA 14258 44/M A P A A P A A ALT CIRRHOSIS CHRONIC HEPATITIS 129 RAMALAMMA 14913 64/F A A A A A A A WNL FATTY LIVER FATTY LIVER 130 RAMULU 15423 49/M A P A A P A A WNL CIRRHOSIS FATTY LIVER 131 NAGARAJ 16214 52/M A P A A P A A ALT CIRRHOSIS CHRONIC HEPATITIS 132 JAMBAYYA 10407 48/M A A P A A A A WNL FATTY LIVER NORMAL 133 LAXMAN 17920 42/M A A P A A A A WNL FATTY LIVER FATTY LIVER 134 SRIKANTH 18327 52/M A A P A A A A WNL FATTY LIVER NORMAL 135 RAMESH 18778 40/M A A P A A A A ALT NORMAL CHRONIC LIVER DISEASE 136 BASAVARAJ 19148 46/M A A P A A A A ALT NORMAL CHRONIC LIVER DISEASE 137 LINGANNA 19901 40/M A A P P A A A ALT CHRONIC LIVER DISEASE CHRONIC HEPATITIS 138 AMEEN SAB 25393 55/M A A P A A A A WNL FATTY LIVER FATTY LIVER 139 THAYAMMA 21492 66/F A A P A A A A WNL FATTY LIVER FATTY LIVER 140 SHANTHAMMA 26062 59/F A A P A A A A WNL FATTY LIVER FATTY LIVER 141 HULIGAPPA 23056 60/M A A P A A A A WNL FATTY LIVER FATTY LIVER 142 GOVINDAMMA 23054 39/F A A P A P P A WNL CONGESTIVE LIVER CONGESTIVE LIVER 143 SHIVAPPA 28149 52/M A A P A P P A WNL CONGESTIVE LIVER CONGESTIVE LIVER 144 YELLAPPA 24262 58/M A A P A P P A WNL CONGESTIVE LIVER CONGESTIVE LIVER 145 LINGAPPA 24696 49/M A A P A A A A WNL FATTY LIVER FATTY LIVER
C/F
SI.No. NAME OP/IP
No. AGE PAIN JAUN VOM FEVER WT LOSS USG DIAGNOSIS FINAL DIAGNOSIS 146 MUNIYAMMA 20196 40/F P P P A A CBD CALCULUS CBD CALCULUS 147 SHARANAMMA 25744 44/F P P A A A CBD CALCULUS CBD CALCULUS 148 MANJUNATH 22210 14/M P P A A A CHOLEDOCHAL CYST CHOLEDOCHAL CYST 149 BALAYYA 27083 54/M A P P A P KLATSKIN TUMOUR KLTATSKIN TUMOUR 150 NARASIMHULU 22844 56/M P P P A P ?DISTAL CBD LESION CHOLANGIOCARCINOMA

145
KEY TO MASTER CHART
A Absent
ALA Amoebic Liver Abscess
ALT Altered
F Female
H.megaly Hepatomegaly
HCC Hepatocellular Carcinoma
HEM Haematoma
HNG Haemangioma
HYD Hydatid Cyst
LA Liver Abscess
LFT Liver Function Tests
LT Left
M Male
METS Metastasis
MUL Multiple
P Present
RT Right
SC Simple Cyst
SOL Solitary
Tend Tenderness
USG Diag Ultrasound Diagnosis
WNL Within Normal Limits
GS Gall Stones

146
A.CH Acute Cholecystitis
C.CH Chronic Cholicystitis
GBCA Gall Bladder Carcinoma
GB Gall Bladder
RUQ Right Upper Quadrant
Abd.Dist Abdomen Distension
Pl.Eff Pleural Effusion
Asc Ascitis
Splen.Ly Splenomegaly
Jaun Jaundice
Hep Hepatomegaly
Vom Vomitting