role of vitamin d in iron status and the risk of …
TRANSCRIPT

ROLE OF VITAMIN D IN IRON STATUS AND THE RISK OF MALARIA
INFECTION IN KENYAN CHILDREN: A CASE OF KILIFI COUNTY
KIMITA WANDIA
(BSc. Biochemistry)
A56/81604/2015
Department of Food Science, Nutrition and Technology
University of Nairobi
A DISSERTATION SUBMITTED TO THE UNIVERSITY OF NAIROBI IN
PARTIAL FULFILMENT FOR THE AWARD OF THE DEGREE OF MASTER OF
SCIENCE IN APPLIED HUMAN NUTRITION
2018

ii
DECLARATION
Name of Student: Wandia Kimita
Registration Number: A56/81604/2015
College: Agriculture and Veterinary Sciences
Faculty: Agriculture
Department: Food Science, Nutrition and Technology
Course Name: Applied Human Nutrition
Title of the work: The Role of Vitamin D in the Risk of Malaria Infection in Kenyan
Children: A Case of Kilifi County
1. I understand what Plagiarism is and I am aware of the University‘s policy in this regard
2. I declare that this dissertation is my original work and has not been submitted elsewhere
for examination, award of a Degree or publication. Where other people‘s work or my own
work has been used, this has properly been acknowledged and referenced in accordance with
the University of Nairobi‘s requirements.
3. I have not sought or used the services of any professional agencies to produce this work
4. I have not allowed, and shall not allow anyone to copy my work with the intention of
passing it off as his/her own work
5. I understand that any false claim in respect of this work shall result in disciplinary action,
in accordance with University Plagiarism Policy.
Signature ______________________________________Date: _____________

iii
DECLARATION
I hereby declare that this dissertation is my original work and has not been presented for a
degree in any other University or institution of higher learning.
Signature………………………… Date………………………………..
Wandia Kimita
This dissertation has been submitted with our approval as Supervisors:
Signature……………………… Date………………………………..
Prof. Wambui Kogi- Makau
Department of Food Science, Nutrition and Technology
University of Nairobi
Signature…………………… Date……………………………….
Dr. John Wangoh
Department of Food Science, Nutrition and Technology
University of Nairobi
Signature…… Date………2nd
July, 2018…
Dr. Sarah Atkinson
Senior Lecturer University of Oxford / Principal Investigator KEMRI Wellcome Trust

iv
DEDICATION
This dissertation is dedicated to my parents, Kimita and Nyokabi. From you, I have learnt
immeasurable values.

v
ACKNOWLEDGEMENT
I am grateful to several people who have played a role towards the success of this work.
I thank my supervisors: from the university, Prof. Wambui Kogi-Makau and Dr. John
Wangoh and, from KEMRI-Wellcome Trust, Dr. Sarah Atkinson and for being there
throughout this project. I would like to warmly thank Dr. Atkinson for her funding, support
and mentorship during the entire research period. Her wisdom, guidance and positive
criticism at every stage enabled me to complete this project. I extend my deepest appreciation
to Prof. Wambui Kogi-Makau for her support, professional guidance and advice which
helped me overcome various academic challenges. I am grateful to Dr. Wangoh, for his
guidance and supervision.
This work would not have been possible without the supervision and guidance of Dr. Reza
Morovat and his team at the Oxford University - John Radcliffe Hospital. Thank you for the
technical training and advice that was crucial for this work.
I am very appreciative to John Muriuki and Reagan Moseti for, in addition to peer
mentorship, assistance with statistical analyses and STATA programme. My greatest
appreciation also goes to the MSc. IDEAL cohort of 2016 for the support and friendship.
Your company and scientific scope of ‗all things science‘ brought humour and sanity as I
worked. I also wish to thank my colleagues at the University of Nairobi for their
encouragement and support.
I acknowledge the support of the IDEAL Team for funding and facilitating my studentship at
the KEMRI-Wellcome Trust. In particular, I am most grateful to Dr. Samson Kinyanjui, Liz
Murabu, Rita Baya, Charles Kamau and Florence Kirimi. Many thanks to the KEMRI
Wellcome Trust fraternity for training on research, advice and assistance throughout the
project.
I would like to acknowledge the faculty and staff of the Department of Food Science,
Nutrition and Technology, University of Nairobi that contributed to this study in one way or
another. Special thanks to Joan and Benard for your consistent support.
Finally, I would like to thank my family for their love and encouragement. To my parents
who support my academic endeavours, as well as my brothers; Gathii Kimita for mentoring
me into science and, Ikambi Kimita for always cheering me on. Special thanks to Mercy
Muturi, a friend who knows this journey all too well.

vi
TABLE OF CONTENTS
DECLARATION ............................................................................................................... iii
DEDICATION ................................................................................................................... iv
ACKNOWLEDGEMENT .................................................................................................. v
TABLE OF CONTENTS ................................................................................................... vi
LIST OF TABLES ............................................................................................................... x
LIST OF FIGURES ............................................................................................................ xi
LIST OF APPENDICES ................................................................................................... xii
OPERATIONAL DEFINITIONS .................................................................................. xiii
ABBREVIATIONS ........................................................................................................... xv
ABSTRACT ................................................................................................................ xvii
CHAPTER 1: INTRODUCTION ...................................................................................... 1
1.1 Background of Study ................................................................................................... 1
1.2 Statement of problem .................................................................................................. 3
1.3 Justification ................................................................................................................. 3
1.4 Aim of Study ............................................................................................................... 4
1.5 Purpose of the Study ................................................................................................... 4
1.6 Study Objectives ......................................................................................................... 4
1.6.1 Overall objective .................................................................................................. 4
1.6.2 Specific objectives ................................................................................................ 4
1.7 Research question ........................................................................................................ 4
1.8 Benefits........................................................................................................................ 5
1.9 Limitation .................................................................................................................... 5
CHAPTER 2: LITERATURE REVIEW .............................................................................. 6
2.1 Vitamin D: Background .............................................................................................. 6
2.1.1 Sources ................................................................................................................. 6

vii
2.1.2 Biosynthesis ......................................................................................................... 6
2.1.3 Definition and Assessment of Vitamin D Status ................................................. 7
2.2 Functions of vitamin D ................................................................................................ 8
2.2.1 Bone metabolism and calcium homeostasis ........................................................ 8
2.2.2 Non-skeletal Function .......................................................................................... 8
2.2.3 Inflammation and infection .................................................................................. 8
2.3 Health problems related to vitamin D deficiency........................................................ 9
2.4 Epidemiology of vitamin D deficiency ..................................................................... 10
2.4.1 Risk factors ........................................................................................................ 10
2.4.2 Vitamin D deficiency in Africa .......................................................................... 10
2.5 Vitamin D and malaria infection ............................................................................... 11
2.5.1 Malaria ............................................................................................................... 11
2.5.2 Evidence of vitamin D and malaria from animal studies ................................... 12
2.5.3 Evidence of vitamin D and malaria from human studies ................................... 12
2.6 Mechanisms of vitamin D regulating malaria susceptibility ..................................... 15
2.6.1 Vitamin D regulates iron .................................................................................... 15
2.6.2 Immune modulation properties of vitamin D in malaria ................................... 17
2.7 Methodological issues ............................................................................................... 18
2.8 Gap in knowledge...................................................................................................... 19
CHAPTER 3: METHODOLOGY ....................................................................................... 20
3.1 Study context ............................................................................................................. 20
3.1.1 Parent Study ....................................................................................................... 20
3.1.2 Kenyan cohort .................................................................................................... 20
3.1.3 Present study ...................................................................................................... 20
3.1.4 Study area and study site.................................................................................... 21
3.1.5 Health and nutrition ........................................................................................... 21
3.1.6 Participant enrolment ......................................................................................... 22

viii
3.2 Study population ....................................................................................................... 22
3.3 Study design .............................................................................................................. 22
3.4 Sampling.................................................................................................................... 23
3.4.1 Sample size determination ................................................................................. 23
3.4.2 Sampling procedure ........................................................................................... 24
a) Inclusion criteria ........................................................................................................ 25
b) Exclusion criteria....................................................................................................... 25
3.5 Data acquisition methods .......................................................................................... 26
3.5.1 Biochemical methods ......................................................................................... 26
3.5.2 Definitions.......................................................................................................... 28
3.6 Ethical Consideration ................................................................................................ 29
3.7 Statistical data analysis.............................................................................................. 30
CHAPTER 4: RESULTS ...................................................................................................... 32
4.1 Characteristics of study population ........................................................................... 32
4.2 Vitamin D status of children in Kilifi County ........................................................... 34
4.2.1 Distribution of Vitamin D by Age ..................................................................... 35
4.2.2 Predictors of a Low Vitamin D status (250HD <75nmol/L) ............................. 36
4.2.3 Vitamin D status of children in Malaria transmission areas .............................. 38
4.3 Association of vitamin D status and iron status ........................................................ 40
4.3.3 Mean differences of vitamin D by iron markers ................................................ 40
4.3.4 Effect of vitamin D status on iron markers ........................................................ 41
4.4 Vitamin D status and the risk of malaria infection.................................................... 45
CHAPTER 5: DISCUSSION ................................................................................................ 48
5.1 Vitamin D status of children in Kilifi........................................................................ 48
5.2 The association between vitamin D status and iron status ........................................ 50
5.3 Vitamin D status alters the risk of malaria infection ................................................. 52
5.4 Strengths and Limitations of the Study ..................................................................... 54

ix
5.5 Conclusion ................................................................................................................. 54
5.6 Recommendations ...................................................................................................... 55
REFERENCES ....................................................................................................................... 56
APPENDIX 1: Map of Kenya showing Kilifi County and Kilifi Demographic and Health
Survey (KHDSS) ...................................................................................... 62
APPENDIX 2: KEMRI/SERU Ethical Approval ............................................................... 63

x
LIST OF TABLES
Table 1: Summary of Human Studies Reporting Association between Vitamin D
Status and Malaria
Table 2: Incidence of Plasmodium falciparum malaria among iron-replete and
iron-deficient children during 12 months of follow-up
Table 3: Sample size calculation indicates sufficient power for the Kilifi samples
Table 4: Techniques of measurement of analytes in the Abbot Architect cSystem
Table 5: Characteristics of study population
Table 6: Plasma 25OHD differences in means according to study variables
Table 7: Predictors of a low vitamin D status (25OHD <75nmol/L) for children
in Kilifi County
Table 8: Geometric mean differences of iron markers between low vitamin D
and high vitamin D status groups
Table 9: Effect of Vitamin D level on iron status markers
Table 10: Association of vitamin D status of study children and malaria infection
Table 11: Susceptibility to malaria infection by vitamin D status of study children

xi
LIST OF FIGURES
Figure 1: Hypothesis for the molecular mechanism through which vitamin D regulates the
iron ferroportin axis (Bacchetta et al., 2014)
Figure 2: Study activity flow showing points in the study for data collection for each child 23
Figure 3: Sampling Schema
Figure 4: Vitamin D status in study population
Figure 5: Distribution of Vitamin D (25OHD) by Age in months
Figure 6: Map of KHDSS showing Malaria Transmission area and coordinates for study
participants
Figure 7: The correlation between Vitamin D and Iron markers among children in Kilifi
County, Kenya
Figure 8: Distribution of children‘s Vitamin D status by age (months)
Figure 9: Distribution of children‘s Iron status by age (months)

xii
LIST OF APPENDICES
Appendix 1: Map of Kenya showing Kilifi County and Kilifi Demographic and Health
Survey (KHDSS)
Appendix 2: KEMRI/SERU Ethical Approval

xiii
OPERATIONAL DEFINITIONS
Acute phase response: An increase in serum proteins referred to as acute phase proteins
in response to inflammation or tissue injury.
Asymptomatic malaria: Presence of parasite stages of P. falciparum in blood without
causing any symptoms.
Ferritin: A protein that stores iron in tissues. It is a marker for iron stores
in the body and hence iron deficiency
Geometric means of vitamin D: Average of 25OHD
Hepcidin: Iron regulatory hormone produced by the liver and acts on
ferroportin to regulate serum iron availability.
Inflammation: C Reactive Protein levels ≥5mg/l.
Iron deficiency: Plasma ferritin levels of less than 12µg/L and less than 30µg/l in
the presence of inflammation indicated iron deficiency.
Iron deficient anaemia (IDA): Haemoglobin levels <11g/L in children
Kenyan children: Children from Kilifi County – Junju, Ngerenya, Chonyi
locations, 6-48 months at the time of plasma sample collection.
Malaria clinical case: Fever / axillary temperature of 37.5 °C with any level of
accompanying parasitaemia in children less than 1 year, and
fever >37.5 °C and parasitaemia of ≥2500 parasites/µl of blood
in children 1-15 years (Mwangi et al., 2005)
Risk of malaria infection: Likelihood of contracting malaria due to exposure of risk factors
such as residing in a high transmission area, low immunity,
young age and pregnancy.
Soluble transferrin Receptor: Blood proteins that are elevated with iron deficiency
Sub-Saharan Africa: All African countries partially or fully located south of the
Sahara.

xiv
Transferrin saturation: Calculated by ((Iron (µmol/L) / Transferrin (g/L) x 25.1) x 100)
Transferrin: Blood proteins that bind to iron in circulation and carry it to
tissues
Vitamin D deficiency: Blood 25OHD levels < 50nmol/L (20ng/ml)
Vitamin D insufficiency: Blood 25OHD levels ≥50≤75nmol/L (≥20≤30ng/ml)
Vitamin D sufficiency: Blood 25OHD levels ≥75nmol/L (≥30ng/ml)
Vitamin D toxicity: Blood 25OHD levels ≥100nmol/L (≥250ng/ml)

xv
ABBREVIATIONS
1,25(OH)D 1,25-dihydroxycholecalciferol / calcitriol
25OHD 25-hydroxycholecalciferol / calcifediol /25-vitamin D
AGP α-acid glycoprotein
CAMP Cyclic adenosine monophosphate
CGMRC Centre for Geographic Medicine Research Coast
CRP C-Reactive Protein
CXCL9 Chemokine ligand 9
DMT1 Divalent Metal transporter -1
EDTA Ethylene diaminetetraacetic acid
ESA Erythrocyte Stimulating Agents
HAMP Hepcidin antimicrobial peptide
Hb Haemoglobin
HIV Human Immunodeficiency virus
HPLC High Performance Liquid Chromatography
IFN-γ Interferon gamma
IOM Institute of Medicine
IRR Incidence Rate Ratio
KEMRI Kenya Medical Research Institute
KHDSS Kilifi Demographic and Health Survey
KNBS Kenya National Bureau of Statistics
KWTRP KEMRI Wellcome Trust Research Programme
MCV Mean Corpuscular Volume

xvi
RNA Ribonucleic acid
STFR Soluble Transferrin Receptor
TNF Tumour Necrosis Factor
TS Transferrin saturation
VDD Vitamin D deficiency
VDI Vitamin D insufficiency
VDR Vitamin D receptor
VDS Vitamin D sufficiency
WHO World Health Organization

xvii
ABSTRACT
Introduction: In Kilifi County, malaria infection is a major cause of mortality with children
under the age of five years being the most vulnerable. Iron status influences susceptibility to
malaria while Vitamin D status may also have an important influence to susceptibility and
severity. Despite this, there is insufficient information on the vitamin D status of children in
the coastal region where malaria infections are highly prevalent. The general objective of this
study, therefore, was to find out the association between vitamin D status and iron status and
how this interaction alters the risk of malaria infection in Kenyan children.
Research Methods: A cross sectional study was carried out in 1487 children in Kilifi
County, Junju and Ngerenya areas. Longitudinal data on anthropometry, haemoglobin,
auxiliary temperature and a malaria blood slide. Laboratory analysis was carried out for
ferritin, C-reactive protein, transferrin, hepcidin and soluble transferrin receptor. Data was
analysed for descriptive and inferential statistics.
Results: The overall geometric mean serum 25-hydroxycholecalciferol, 25OHD, was 81.9
nmol/L, (range 16, 215.5 nmol/L). The overall prevalence of vitamin D deficiency (25OHD
<50nmol/L) was 6%, vitamin D insufficiency (25OHD >50 and ≤75nmol/L) was 34.1% and
vitamin D sufficiency (25OHD <75nmol/L was 59.9%). An increase in vitamin D increased
the risk of iron deficiency (OR 2.89, 95% CI; 2.02, 4.13; P=0.0005) and iron deficiency
anaemia (OR, 5.70; 95%CI, 3.37, 9.64; P=0.0005) significantly in a univariate logistics
model, but when adjusted for gender, study setting and age, the significance was lost. Low
vitamin D levels (25OHD <75nmol/l) increased the risk of malaria incidence OR 2.52; 95%
CI, 1.47; P=0.001, but when adjusted for age, gender and study setting, the effect was lost
OR 1.31; 95% CI, 0.73, 2.37, P=0.36.

xviii
Vitamin D status was not associated with malaria parasitaemia. Moreover, vitamin D status
had no influence on susceptibility to malaria infection.
Conclusion: This study led to the conclusion that; the prevalence of vitamin D insufficiency
in children in Kilifi County is high, that low levels of vitamin D among healthy children is
not associated with iron status nor does vitamin D status predict the risk of malaria infection.
Recommendations: Low vitamin D status is a public health concern among children in Kilifi
County and these children should be targeted for supplementation programmes. Additionally,
there should be increased sensitization by community health workers among caregivers on
the health benefits of exposing children to sunshine as a source of vitamin D.

1
CHAPTER 1: INTRODUCTION
1.1 Background of Study
In Sub-Saharan Africa, micronutrient deficiencies and malaria infections are highly prevalent
and often co-exist. The World Health Organization estimates 82 deaths per 1000 live births
in children under the age of 5 years annually caused by malaria (World Health Organization,
2015). More than 70 percent of all malaria deaths occur in this age category making malaria
a major cause of childhood mortality in high transmission areas (World Health Organization,
2016).
Micronutrient deficiencies are often linked to susceptibility to malaria and other infectious
diseases. Vitamin D and iron status have been found to be linked to malaria susceptibility and
severity in African children (Cusick et al., 2014; Sazawal et al., 2006). Findings from an
observational study in Ugandan children (Cusick et al., 2014) have linked low vitamin D
status to malaria susceptibility. Research on mouse models showed a positive correlation on
malaria severity and low vitamin D status (Dwivedi et al., 2016; He et al., 2014).
Despite Africa having abundant sunshine throughout the year, research indicates that there
may be a high prevalence of vitamin D deficiency in African children which manifests as
bone mineralisation disorders such as rickets (Braithwaite et al., 2012; Edwards et al., 2014).
Vitamin D is an important micronutrient for bone growth and also plays a role in immune
function. Low serum vitamin D has been linked to higher risk of infections and disease
severity including tuberculosis (Chan, 2000), invasive pneumococcal disease (White, 2008)
HIV (Rodriguez et al., 2009) and malaria (Cusick et al., 2014).
Iron deficiency anemia, on the other hand, is the leading cause of years lived with disability
in Africa and its prevalence in children is high (Global Burden of Disease Pediatrics
Collaboration, 2016). Iron deficiency is especially prevalent in malaria endemic areas

2
(World Health Organization, 2015) and, is associated with malaria infection. Studies
hypothesise that poor iron status may be protective against malaria infections by starving
Plasmodium falcipurum, the malaria parasite (Ganz Tomas, 2010). In support of this, studies
in coastal Kenya (Nyakeriga et al., 2004) and Tanzania (Gwamaka et al., 2012) have shown
that high serum iron increases the likelihood of morbidity and mortality from malaria in
children.
One of the greatest challenges in sub Saharan Africa is reducing the risk of malaria infections
while countering micronutrient deficiencies. Vitamin D and iron deficiencies often co-exist,
particularly in children with infections (Martineau et al., 2007). There is evidence that
vitamin D plays a role in the regulation of iron status through the iron-ferroportin axis by
mediating the iron regulator hormone hepcidin (Bacchetta et al., 2014; Smith et al., 2016).
Vitamin D deficiency may therefore increase the risk of malaria and other infections.
Interestingly, vitamin D deficiency may be more common in African children than previously
thought. Studies on malaria and other infections show that poor vitamin D status is associated
with the severity of disease outcomes (Yakoob et al., 2016). Knowledge about the interaction
between vitamin D and iron homeostasis through hepcidin could better inform iron and
vitamin D supplementation initiatives in malaria endemic areas.

3
1.2 Statement of problem
One of the biggest problems in Africa is controlling the rate of malaria infection. The
interaction between vitamin D and iron could explain a different pathway through which both
micronutrients interact to influence susceptibility to malaria. Vitamin D plays a role in iron
regulation through the iron regulator hormone hepcidin (Smith et al., 2016). Though isolated
studies in American (Smith et al., 2015) and Asian (Han et al., 2013) populations have shown
that vitamin D status influences iron status, a thorough review of literature shows little data
on African populations. Furthermore, research on vitamin D status in Africa remains an area
of little coverage. A clear understanding is also lacking on the effects of low vitamin D status
and susceptibility to infectious disease in the paediatric population in Africa, particularly
malaria.
1.3 Justification
From the literature, little research has been done to establish the relationship between vitamin
D, hepcidin concentration and other measures of iron status in malaria-endemic countries.
Additionally, there appears to be no available data on the vitamin D status of children in
Kilifi. Malaria infection in Kilifi County is a major cause of childhood mortalityyet there is
little available evidence on the relationship between vitamin D and malaria infection (Scott et
al., 2012). Iron deficiency, on the other hand, affects approximately 40-50 percent of children
in Kilifi and, is the leading cause of lives lived with disability in sub Saharan Africa
(Atknison et al., 2014). At the same time malaria infection is common and causes childhood
mortality. Though supplementation with micronutrients including iron improves general child
health, it might be detrimental to children in malaria endemic areas (Sazawal et al., 2011).
This is because the malaria parasite requires iron and other micronutrients for its own growth
and proliferation. In such a paradoxical relationship, it is important to explore the role of
vitamin D status on malaria infection. This study intends to establish whether there is an

4
association between vitamin D and iron status and the risk of malaria infection. Data from
this study could further inform supplementation programs in Kenyan malaria endemic areas.
1.4 Aim of Study
The aim of this study was to contribute towards reduced malaria prevalence and iron
deficiency among children in Kilifi County.
1.5 Purpose of the Study
This study purposed to generate data that is useful for raising awareness on the role of
vitamin D and iron status in influencing malaria susceptibility, as a base for policy making on
malaria and micronutrient status of children in Kilifi County.
1.6 Study Objectives
1.6.1 Overall objective
To determine the association between vitamin D status and iron status and how this
interaction alters the risk to malaria infection in Kenyan children
1.6.2 Specific objectives
1. To determine the vitamin D status of Kenyan children in a malaria endemic Kilifi County.
2. To establish the association between vitamin D and iron status in children in Kilifi
County.
3. To investigate how vitamin D status alters the risk of malaria infection in Kenyan
children.
1.7 Research question
How does the association between vitamin D and iron status influence the risk of malaria
infection in Kenyan children?

5
1.8 Benefits
1. Knowledge on the prevalence of vitamin D status may inform nutritional
supplementation programmes for children in Kilifi County.
2. Knowledge on the association between vitamin D status and malaria infection may
lead to interventions aimed at increasing vitamin D status as well as design measures
to reduce malaria infection in children below five years.
1.9 Limitation
This study is an observational study, and hence associations between vitamin D and malaria
may be confounded by other environmental and physiological factors that may not be part of
the study variables.

6
CHAPTER 2: LITERATURE REVIEW
2.1 Vitamin D: Background
Vitamin D, also known as the ‗sunshine vitamin‘, is a fat soluble molecule. It was discovered
in the 1920‘s originally as the ‗vitamin‘ that is essential for normal skeletal growth and
maintenance of calcium homeostasis in the body (Holick, 2003). Further research disqualified
vitamin D as a ‗vitamin‘ when scientists found out that it was synthesised in the body from
sunlight exposure. Instead, vitamin D is more of a steroid hormone in structure and
physiology, and its hormonal action has effects on health and disease in the body (Holick,
2003).
2.1.1 Sources
Vitamin D is obtained from dietary sources or synthesized in the skin through exposure to
ultra violet B rays. Dietary sources of vitamin D are in two forms; cholecalciferol (vitamin
D3) from animal sources and ergocalciferol (vitamin D2) from plant sources (Holick, 2004).
Food sources of vitamin D attribute to very small amount of total in the body since few foods
are rich in vitamin D. These include oily fish, yeast, eggs and milk. Breast feeding infants are
born with vitamin D stores and additionally obtain the nutrient from the mothers‘ milk.
Vitamin D is also available in fortified foods such as infant formula, milk and cheese, which
may have limited access in low income countries. Supplements are of vitamin D alone or a
combination with calcium and other nutrients are also sources of vitamin D (White, 2008).
2.1.2 Biosynthesis
Most of the vitamin D in circulation is obtained from cutaneous synthesis. As the skin is
exposed to sunlight, ultra violet B radiation is absorbed by 7-dehydrocholesterol, a molecule
found in cells of the skin, which is then converted to pre-vitamin D3. Vitamin D2 and vitamin

7
D3 have no biological activity and need to be activated through the body‘s metabolic
pathways to exert vitamin-D effects (Holick, 2004). Vitamin D3 from the diet and from the
skin then enters circulation bound to carrier vitamin D binding proteins and is metabolised in
the liver to 25 hydroxyvitamin D (25OHD). In the kidneys, this is then converted to the active
1,25 dihydroxy vitamin D (1,25OHD) by 1-alpha-hydroxylase enzyme. 1,25OHD acts as a
hormone that regulates calcification of bones during calcium and phosphate homeostasis. It
does this through regulation of parathyroid hormone levels hence reducing bone loss (Holick,
2004; White, 2008).
2.1.3 Definition and Assessment of Vitamin D Status
The definition of vitamin D status is a contentious subject. The Institute of Medicine defines
deficiency as 25OHD less than 50nmol/l, insufficiency >50≤75nmol/l and sufficiency as
levels >75nmol/l (IOM, 2010). However, researchers suggest the revision of these definitions
since these levels are based on adequate amounts used to prevent skeletal disorders such as
rickets and osteomalacia (Ross et al., 2011).
Vitamin D is quantified through the assessment of circulating 25OHD in plasma (Ross et al.,
2011). High Performance Liquid Chromatography (HPLC), immunoassays and the gold
standard mass spectrophotometry are used to measure 25OHD in blood. There is no
consensus on a universal method of measuring 25OHD in vitamin D studies, which,
complicates comparison and interpretation of individual results (Ross et al., 2011).
Quantification of vitamin D is influenced by vitamin D binding protein (DBP) which
influenced by disease and pregnancy.

8
2.2 Functions of vitamin D
2.2.1 Bone metabolism and calcium homeostasis
Vitamin D acts an endocrine hormone which regulates calcium homeostasis by maintaining
plasma levels of 8.5 to 10.5 mg/Dl (Holick. 2005). When plasma concentrations fall below
8.5mg/dl, parathyroid hormone is upregulated prompting the activation of 1,25OHD. Vitamin
D works to increase calcium absorption form the small intestines, renal calcium re-absorption
and bone resorption through activation of osteoclasts. When on is vitamin D deficient,
prolonged metabolic responses may result to increased bone resorption and bone weakening.
2.2.2 Non-skeletal Function
Recent studies have identified vitamin D receptor (VDR) in immune cells such as activated T
and B cells, and cells in the colon, breast, prostate and other organs (Rodriguez et al., 2009;
Bacchetta et al., 2014). Additionally, 1 α-hydroxylase enzyme has been identified in
pancreatic, colon, breast, skin and immune cells, suggesting that the production of vitamin D
(Holick, 2004). These discoveries evidence non-skeletal roles of vitamin D especially in
immune function. Studies show vitamin D may be an important precursor in insulin response.
Vitamin D deficiency has been linked to increased risk of developing type 1 diabetes (Asemi
et al., 2013) while high intake of vitamin D in early childhood has been associated with
decreased risk of developing type 1 diabetes mellitus (Holick, 2004).
2.2.3 Inflammation and infection
The immune system protects the body from infection. It is divided into two; innate immune
system which provides non-specific first line of protection from pathogens; and adaptive
immune system which is more specific and stimulated after innate response. The role of
vitamin D in immune-regulation was identified decades ago when sunlight was observed to
cure some infections (White, 2004) and certain illnesses were associated with low vitamin D

9
levels and seasons (Holick, 2003). Vitamin D is involved in innate immune response where
bacteria, viruses and fungi are killed through antimicrobial peptides such as cathelicidins and
defensins (Bacchetta et al., 2014). These Antimicrobial peptides are produced phagocytic
cells, lymphocytes and epithelial cell lining where they defend the host against pathogens.
Research has further identified the expression of 1α-hydroxylase and vitamin D receptors
(VDR) in immune cells such as dendritic cells, macrophages and activated B and T
lymphocytes which imply production of vitamin D in these cells (He et al., 2014; Liu, 2006).
In the adaptive immune system, vitamin D function has been evidenced through the
expression of vitamin D receptors in activated T and B lymphocytes (Dwivedi et al., 2016).
Elevated 1,25OHD suppresses proliferation of T helper cells and modulates the production of
cytokines. Associations between infections, immune function and vitamin D deficiency has
been studied broadly. Acen et al. (2016) found an inverse relationship between the risk and
severity of tuberculosis, acute respiratory tract infection and pneumonia and vitamin D status
in Ugandan patients.
2.3 Health problems related to vitamin D deficiency
Deficiencies in vitamin D lead to demineralisation of bone cells, osteoid, leading to bone
mineralisation disorders (Holick, 2004). Rickets in children is characterised by soft and weak
bones which result in bowed legs, curved spine, swelling of the wrist, knee or ankle, rachitic
rosary and susceptibility to bone fractures (Jones et al., 2017). In adults, defective
mineralisation results in osteomalacia. Vitamin D deficiency has also been linked to several
conditions such as breast cancer, cardiovascular disease, autoimmune disease such as
multiple sclerosis and infections (Yakoob et al., 2016; Wilkinson et al., 2000). There is
evidence that vitamin D also plays a role in immune modulation (Schwartz et al., 2018).

10
2.4 Epidemiology of vitamin D deficiency
2.4.1 Risk factors
Processes that alter the amount of sunlight available for cutaneous synthesis of vitamin D,
bioavailability and diet are factors that influence vitamin D synthesis. First, vitamin D
synthesis requires Ultra violet B rays of between 290nm and 315nm wavelength (Holick,
2003). People living in high latitudes do not get enough wave length to stimulate cutaneous
synthesis. Secondly, melanin acts as a barrier that prevents UVB radiation from penetrating
the skin, hence decreasing the synthesis of vitamin D. Dark pigmented individuals require ten
times sun exposure as light skinned persons to synthesis vitamin D. Likewise, wearing
covering clothing such as in cultural dressing of the Middle East, use of sunscreen, skin
injury such as in burns are often linked to low vitamin D status (Holick, 2004).
Gastrointestinal disorders that alter nutrient absorption (Bikle, 2007), fat storage disorders
and obesity (Rodríguez-rodríguez et al., 2009) are also associated with suboptimal levels. The
risk of vitamin D deficiency also increases with age, is more prevalent in females and
individuals who live a sedentary lifestyle.
2.4.2 Vitamin D deficiency in Africa
In populations living in Africa, data on vitamin D status is scant and inconsistent. However,
studies identified by this literature review show much higher baseline 25OHD levels
compared to other continents, and a high variation within the continent. African studies also
show few nationally representative data, and most research compare unhealthy to healthy
groups. Africa is a heterogeneous continent in geography, climate and topography. There also
exist a great deal of variation in demography, cultural practices, religion, skin pigmentation,
disease burdens, dietary intake and, water sources, all which may influence vitamin D status.

11
In sub-Saharan Africa where sunshine is abundant, occurrence of vitamin D insufficiency and
deficiency has been reported in Ethiopia (Wakayo et al., 2015), South Africa (Poopedi et al.,
2011) and Kenya (Jones et al., 2017; Toko et al., 2016). Rickets is also common in African
children as evidenced by studies from Kenya (Edwards et al., 2014; Jones et al., 2017) and
The Gambia (Braithwaite et al., 2012). In North African countries, studies show low 25OHD
levels in children (Allali et al., 2009). Most of North Africa is located in high latitude areas
and may receive little sunshine. Additionally, cultural and religious practices involving full
body coverage may also hinder sun exposure and consequently cutaneous vitamin D
synthesis.
2.5 Vitamin D and malaria infection
In this new area of research, few studies have examined the relationship between vitamin D
and malaria through immune modulation and iron regulation.
2.5.1 Malaria
Malaria infection is a leading cause of morbidity and mortality in Sub-Saharan Africa. In
2016, sub-Saharan Africa accounted for 91 percent of all the malaria deaths (World Health
Organization, 2015). Transmission in Kenya is seasonal with the highest infection cases
occurring during the rainy season specifically at the coastal region and areas around Lake
Victoria (Ministry of Health, 2016). In Kilifi, the highest incidence is in school going
children with high levels of mortality (Mogeni et al., 2016). Malaria is mainly caused by the
Plasmodium falciparum parasite which is transmitted by the female anopheles mosquito.
Clinical manifestations range from asymptomatic infection to disease and death. Populations
in malaria endemic areas develop asymptomatic malaria with continued exposure, creating
malaria immunity with age. Those with clinical malaria develop symptoms such as fever,
headache, vomiting and nausea. In its severe form, seizures, anaemia and, respiratory distress

12
usually occur. In very severe complications, cerebral malaria develops where patients
experience, in addition to severe malaria symptoms, delirium, febrile stupor and coma
(Mwangi et al., 2005). Malaria diagnostic tests recommended by the World Health
Organisation are microscopy, a technique widely used in developing countries; rapid
diagnostic tests, which, are useful in remote areas; and nucleic acid amplification-based
diagnostics used for epidemiological studies
(http://www.who.int/malaria/areas/diagnosis/en/).
2.5.2 Evidence of vitamin D and malaria from animal studies
Animal studies indicate that vitamin D may have a beneficial anti-inflammatory role in
malaria. In a study by He et al. (2014), Plasmodium berghei infected mice treated with
vitamin D had significantly longer survival as opposed to the controls. The decreased time of
disease progression could have been caused by the ability of vitamin D to reduce circulating
cytokines, interferon gamma (IFN-ɣ) and tumour necrosis factor (TNF), which are elevated in
severe malaria and result in hyperinflammation (He et al., 2014). In mouse studies, combined
treatment of the antimalarial drug arteether with vitamin D significantly improved survival
compared to mice treated with Vitamin D or arteether alone (Dwivedi et al., 2016).
Yamamoto et al. (2016) also found anti-plasmodial activities where reduced parasitaemia was
observed with calcitriol treatment in mice.
2.5.3 Evidence of vitamin D and malaria from human studies
Observational human studies suggest that there may be a link between 25OHD levels and
malaria susceptibility and severity. A study in Ugandan children found that 25OHD
concentrations were significantly lower in children with malaria, both severe and cerebral, as
compared to children from the community cohort. There was also an overall high prevalence
of vitamin D deficiency in all children (Cusick et al., 2014). In Tanzania, Sudfield et al.

13
(2015) also found an association between 25OHD levels and an increased risk of clinical
malaria. On the other hand, a study in Kenya did not find any significant differences in
25OHD levels with malaria infection during pregnancy, delivery or in infant cord blood
(Toko et al., 2016). Table 1 gives a summary of the human studies on vitamin D and malaria.

14
Table 1: Summary of Human Studies Reporting Association between Vitamin D Status and Malaria
Reference
Country
Study type Population
Sample size (n)
25OHD nmol/l Association
with
outcome
Findings
Cusick et al., 2014
Uganda
Cross-sectional study Children 18 months to 12
years
60 children
Mean 25OHD levels
25.3ng/ml in Community cohort
21.2ng/ml in Severe malaria
21.3ng/ml in Cerebral malaria
Yes There was a 9% decrease in the odds of
having severe malaria with every
1ng/ml increase in plasma 25OHD.
25OHD was significantly lower in
children with SMA/CM than in children
from the community cohort.
Sudfeld et al.,
2015
Dar es Salaam,
Tanzania
Prospective study
(observational)
581 Infants
Vitamin D deficiency was highly
prevalent. Mean 18.5ng/ml
Yes Children with 25OHD ≥30ng/ml had an
increased risk of clinical and confirmed
malaria.
Sudfeld et al.,
2012
Dar es Salaam,
Tanzania
Prospective study
(observational)
1103 HIV positive adults,
≥18 years initiating
antiretrotherapy
Vitamin D insufficiency 43.6% No
No association between vitamin D and
incidence of malaria
Toko et al., 2016
Western Kenya
Prospective study
(mother infant cohort)
Pregnant 63 women, 43
infants women at time of
enrolment 16.5 to 28.5
years, and infants from
those pregnancies.
Low vitamin D status highly prevalent
in women; 51% with VDI, 21% with
VDD
No No significant association in plasma
25OHD levels relative to malaria
infection.
Newens et al.,
2005
London, United
Kingdom
Cross-sectional study Adults with P. falcipurum
malaria 25 only 14 had
complete follow-up data
Low 25OHD mean 24.3ng/ml
No No differences in 25OHD in subjects in
the course of malaria infection, and
even after they got cured of malaria.
25OHD: plasma vitamin D; VDD: Vitamin D deficiency; VDI: Vitamin D insufficiency; HIV: Human Immunodeficiency virus

15
2.6 Mechanisms of vitamin D regulating malaria susceptibility
2.6.1 Vitamin D regulates iron
Vitamin D has been recently shown to influence iron status, and possibly influence iron
availability to parasites. Iron is important in the survival of both hosts and invading microbes
and, its overload has been shown to favourably promote the growth of these pathogens
(Sazawal et al., 2006). Malaria infections have been shown to be less frequent and severe in
patients who are iron deficient (Nyakeriga et al., 2004; Sazawal et al., 2006).
2.6.1.1 Iron status role in malaria
Studies have indicated that iron deficiency could be beneficial to hosts as it limits iron
availability, diminishing the proliferation of the malaria parasite. As shown in Table 2,
Nyakeriga et al (2004) found that the incidence of malaria infection was significantly lower
in children who were iron deficient as compared to those who were replete.
Table 2: Incidence of Plasmodium falciparum malaria among iron-replete and iron-
deficient children during 12 months of follow-up
Variable
Iron-replete
children
(n p 154)
Iron-deficient
children
(n p 125)
No. of child weeks of observation 4545 3788
Malaria definition11
No. of episodes 119 73
Annual incidence 1.36 1.0
Adjusted IRR (95% CI) 1.00 0.70 (0.51–0.99)
Malaria definition22
No. of episodes 76 50
Annual incidence 0.87 0.69
Adjusted IRR (95% CI) 1.00 0.83 (0.57–1.24)
1fever / axillary temperature of 37.5 °C with any level of accompanying parasitaemia in children less than 1
year 2fever /37.5 °C and parasitaemia of ≥2500 parasites/µl of blood in children 1-15 years (Mwangi et al., 2005)
IRR: Incidence Rate Ratio
CI: Confidence Interval
Note: Retrieved from http://jid.oxfordjournals.org/ (Nyakeriga et al., 2004)

16
Iron regulation is primarily controlled by the hormone hepcidin, which is produced in the
liver. Hepcidin is an antimicrobial peptide and is encoded by the HAMP gene. It blocks
export by ferroportin and the divalent metal transporter, DMT1 on macrophages and
enterocytes. This control mechanism protects the body from excess iron in circulation and
accumulation (Ganz and Nemeth, 2015).
2.6.1.2 Role of Vitamin D in iron homeostasis
Vitamin D metabolites have recently been shown to regulate hepcidin synthesis through
downregulation of the HAMP gene. Molecular studies have shown suppressed hepcidin
mRNA expression resulting in low hepcidin concentrations (Bacchetta et al., 2014; Smith et
al., 2016; Zughaier et al., 2014). In a study involving healthy volunteers, hepcidin
concentrations decreased in vitamin D administered groups as compared to placebo groups
(Smith et al., 2016). These finding were consistent with a study by Bacchetta et al. (2014)
where individuals who received a high dose of vitamin D had decreased hepcidin levels
within 24 hours of supplementation. Figure 1 shows the molecular mechanism through which
vitamin D regulates iron. When vitamin D is sufficient, 250HD is activated to 1,25OHD, and
binds to the vitamin D receptor (VDR). This causes the downregulation of transcription of the
HAMP gene resulting in increased membrane expression of ferroportin. The resulting
enhancement of iron transporters then leads to systemic increase in iron. Consequently, when
vitamin D is deficient, elevated hepcidin decreases membrane expression of ferroportin
decreasing systemic levels of iron. (Bacchetta et al., 2014)

17
Figure 1: Hypothesis for the molecular mechanism through which vitamin D regulates the iron
ferroportin axis (Bacchetta et al., 2014).
Another mechanism through which vitamin D may regulate iron is through the regulation of
erythropoiesis. 1,25OHD has been found to have a synergistic relationship with
erythropoietin. Erythrocyte precursor cells express 1,25OHD receptors, which induce
proliferation and maturation of erythroid progenitor cells. Vitamin D insufficiency may
therefore result in increased resistance to erythropoietin and reduced erythropoiesis (Alon et
al., 2002). These findings are supported by clinical observations, which showed that vitamin
D deficiency was independently associated with low haemoglobin levels and anaemia.
Supplementation with ergocalciferol has been associated with dose reduction in ESA –
erythrocyte stimulating agents (ESA) in haemodialysis patients (Santoro et al., 2015).
2.6.2 Immune modulation properties of vitamin D in malaria
Vitamin D metabolites have been found to stimulate production of antimicrobial peptides,
cathelicidin and defensin, which play a role in innate immunity. These peptides are elevated
during and after malaria infection and are thought to play a multifunctional role in providing

18
a first line immunity against malaria parasites (Parra et al., 2013). 1,25(OH)D3 is a direct
inducer of the antimicrobial peptide gene, hCAMP - cathelicidin and defensin B2 - defensin.
Promoters of these genes contain vitamin D response elements which mediate 1,25(OH)D3
dependent gene expression (Wang et al., 2017). Additionally, 1,25(OH)D3 is also necessary
for an interferon gamma mediated pathway in macrophages which propels phagosomal
maturation and autophagy (He et al., 2014).
2.7 Methodological issues
The assessment of iron status in a malaria endemic area may present difficulties in
determining the biochemical markers that correctly define iron status. Exposure to malaria
parasites causes an acute phase response resulting in elevation of iron indicators which are
also acute phase response proteins, such as ferritin and hepcidin, and in symptomatic malaria,
soluble transferrin receptor (sTfR) (Silva, 2014). For this reason, plasma ferritin
measurements are often accompanied by measurement of acute phase response proteins
namely C-reactive protein (CRP) and α acid glycoprotein (AGP) (Silva, 2014). Using ferritin
as a sole indicator of iron status may mask iron deficiency in populations with widespread
infection and inflammation. Ferritin can be measured in plasma, serum or a dried serum spot,
using enzyme linked immunosorbent assay (ELISA). Plasma ferritin levels of less than
12µg/L, and less than 30µg/L in the presence of inflammation indicate depleted iron stores in
children less than 5 years. (Silva, 2014)
Changes in soluble transferrin receptor (sTfR) indicate changes in erythropoiesis and hence
iron status. sTfR is a polypeptide derived from transferrin receptor, which is a transmembrane
protein that is expressed in cells that require iron. It is a useful biomarker of iron deficiency
and unlike ferritin, hepcidin and transferrin, is not strongly affected by inflammation and

19
infections. Levels of sTfR are elevated in iron deficiency. Levels of sTfR higher than 8.3
indicate iron deficiency (Garza, 2010).
2.8 Gap in knowledge
Generally, there is a paucity of data on the status of vitamin D levels in Africa, and
particularly in Kenya. Kenya has policies on malaria control and treatment and iron
supplementation programs through the Ministry of Health (Ministry of Health, 2016).
However, there lacks supplementation guidelines on vitamin D status. Despite knowledge
from molecular studies showing that vitamin D regulates hepcidin, few studies have been
done on children population to show this association. Furthermore, vitamin D has been
thought to regulate iron deficiency and that this could influence susceptibility to infection,
specifically malaria. Despite this, there are few studies that have sought to establish this
relationship.

20
CHAPTER 3: METHODOLOGY
3.1 Study context
3.1.1 Parent Study
The parent study for this present research was an ongoing study that was using genetic
variation in micronutrients to determine whether blood levels of micronutrients increase the
risk of infection in African children. This approach is known as Mendelian randomization.
The larger study was conducted in four sites in Africa; Kilifi in Kenya, Entebbe in Uganda,
Banfora in Burkina Faso and Soweto in South Africa, at different timelines.
3.1.2 Kenyan cohort
The study cohort included children from the Kilifi Health and Demographic Surveillance
System (KHDSS) described by Scott et al. (2012). In summary, the KHDSS is a community-
based surveillance system that recruits residents from Kilifi District. KHDSS covers
approximately 891km2
and currently has a population of 280, 000. Information on births,
deaths, migration and pregnancies is updated every three months by enumerators who carry
out household visits (Scott et al., 2012). Longitudinal data on childhood infection, genetic
risk factors and prevalence of diseases is collected. All residents have a unique identity
number and are investigated with standard laboratory tests. These include a malaria slide, full
blood count and blood culture (Scott et al., 2012). Healthy children aged between 6 and 30
months were recruited during annual KHDSS follow-up visits, from 2000 to 2016.
3.1.3 Present study
This study used previously available data collected during surveillance, and generated data
through laboratory analysis of vitamin D and iron markers. Children remained in active
surveillance for malaria and other infections until their eighth birthday. Standard data on
anthropometry and malaria was also collected in the annual cross-sectional survey.
Additionally, 5mls of venous blood was collected from each participant. In my study, data

21
from the 2016 survey was included. In addition to the data from the 2016 cross-sectional
bleed, this study used data from previously collected data so as to meet the objectives of this
research.
3.1.4 Study area and study site
The study was conducted in Kilifi County, located 3° south of the equator in the Coastal
Region of Kenya. Kilifi County has an area of 12,609.7 square kilometres and a population
density of 473.6 (KNBS, 2015). Residents practice subsistence farming as their main
economic activity and most of the population lives in the rural areas. The County experiences
two rainy seasons, the short rains which occur between October and December and the long
rains between April and July. During these seasons, malaria transmission is high (KNBS,
2015).
3.1.5 Health and nutrition
The prevalence of iron deficiency is 46.5% (Atkinson et al., 2014) and the entomological
inoculation rate is 8.5-300 infective bites per person per year (Mwangi et al., 2005). A 2014
KNBS Report indicated malaria as the leading cause of mortality in Kilifi, followed by
pneumonia, anaemia and tuberculosis (KNBS, 2015). The County has only one paediatric
ward located in Kilifi County Hospital in Kilifi town.
This study was based at the KEMRI-Wellcome Trust Research Programme (KWTRP) –
Centre for Geographical Medicine Research (CGMRC) – Coast. Children in this study were
from cohorts within the Kilifi Health and Demographic Surveillance System (KHDSS)
(Appendix 1) (Scott et al., 2012) which included malaria vaccine trial cohorts RTSS and ME-
TRAP (SSC Protocols 1131; 3149; and 2887 Protocols 1131; 3149; and 2887) (kemri-
wellcome.org). The KHDSS locations used in this study included Junju, a high malaria
endemic area, and Ngerenya, a low malaria endemic area. The KHDSS spans 35kms from

22
Kilifi town. A census carried out in 2000 to 2001 defined a population of 198 063 (Scott et
al., 2012).
3.1.6 Participant enrolment
Children residing in households within the KHDSS were recruited at birth and remained
under active surveillance for malaria and other infections until their eighth birthday. Healthy
children 6 to 48 months were recruited in the community cohorts and malaria vaccine studies
at different timelines. Informed consent was obtained from the mothers of the child before the
child was enrolled (kemri-wellcome.org). On enrolment, 5mls of venous blood was collected
into heparin and EDTA tubes for each child, as well as during yearly cross sectional bleeds.
During an annual cross-sectional survey, the child was assessed and data recorded in a
standard proforma per specific study protocols. These data included anthropometric
information, haemoglobin, axillary temperature and a malaria blood slide if the child had a
temperature above 37.5oC.
3.2 Study population
Children 6 months to 48 months at the time of plasma sample collection, living within the
Kilifi Health and Demographic Surveillance at Junju, Ngengerenya locations in Kilifi
County.
3.3 Study design
This study was a cross sectional study with a retrospective aspect. Figure 2 shows the study
activity flow diagram. Children were enrolled every year from 2000 to 2016. Each child was
recruited at 6 to 48 months of age and followed up until their eighth birthday. At enrolment,
height, weight Mid-Upper Arm Circumference (MUAC) age and, gender data was collected.
Additionally, 5mls of venous blood was drawn from each child. In the present study, Vitamin

23
D measurement 25(OH)D, iron, sTfR, ferritin, transferrin and, C-Reactive protein (CRP)
were measured from when the child was 6 to 48 months. Every year and, when a child fell
sick, malaria parasitaemia data, auxiliary temperature and malaria slides were collected.
Within the 8 years of follow-up, some children dropped out, others migrated, while in others,
blood could not be drawn from the child due to denied consent or sickness. As this study was
to determine the vitamin D status of a healthy population, all children with malaria infection
at the time of vitamin D measurement were exempted.
Figure 2: Study activity flow showing points in the study for data collection for each child
3.4 Sampling
3.4.1 Sample size determination
To obtain an adequate number of participants, all healthy children registered under the
KHDSS surveillance between 2000 and 2016 were included (convenient sample). A power
analysis was conducted to determine an appropriate sample size that was sufficient to detect

24
the significance effect of vitamin D status on malaria infection. According to Cohen (1988),
significance represents the likelihood of a Type I error, that is, the likelihood that the study
will falsely claim a significant effect has been found where there is no effect in the population
under study.
Table 3 shows the calculated power to detect the prevalence of vitamin D insufficiency of the
study with a type one error rate of 0.05. A prevalence of 64.7% of vitamin D insufficiency
from a study in rural community children in Ethiopia (Wakayo et al., 2015), was used to
calculate power. The purpose of this study was to describe vitamin D status and how it
influences malaria infection in children in Kilifi County. A sample size of 1487 gave a power
>80%.
Table 3: Sample size calculation indicates sufficient power for the Kilifi samples
Study site Vitamin D insufficiency (%) Sample size Power (%)
Kilifi, Kenya 64.7% 1487 100
3.4.2 Sampling procedure
1. Sampling frame
The sampling frame included all children aged 6 to 48 months at the time of enrolment living
within the KHDSS. All study participants with available stored samples, laboratory data and
informed consent were included in the study.
2. Sampling schema
Figure 3 shows the sampling schema. Purposive sampling was used to select Kilifi County,
Junju and Ngerenya localities. Junju and Ngerenya were selected because of their location
within the KHDSS. All households in these areas were enrolled for the KDHSS as described
in (Scott et al., 2012). Children were selected if they qualified the selection criteria below.

25
Figure 3: Sampling Schema
3. Selection criteria
a) Inclusion criteria
1. Availability of informed consent to participate in the study
2. Children aged 6 to 48 months at the time of sampling to be enrolled in community
cohort studies
3. Children with available samples, clinical and laboratory data
b) Exclusion criteria
1. Lack of informed consent
2. Children ≥48 months or < 6 months at the time of sampling
3. Children without an available stored plasma sample and/or without follow-up data.
4. Chronically sick children or those who had sickle cell anaemia

26
3.5 Data acquisition methods
All children had demographic, anthropometric, malaria data and 5mls of blood collected. The
baseline and follow-up data already available for each child included; anthropometric data
height (cm) and weight (kg), age (months) at enrolment, gender, haemoglobin (not available
for all participants), auxiliary temperature (°C), parasitaemia density (per/µL of blood) and
malaria blood films for children whose temperature exceeded 37.5°C, and a child‘s unique
identification number. Additionally, 5ml of blood for children above 6 months were
collected. Primary data was collected through laboratory assays. Plasma was kept in -80°C
freezers for storage and transport. All assays were carried out by the author of this
dissertation at the Department of Clinical Biochemistry, Oxford University Hospitals,
Oxford; a laboratory that is well equipped with the relevant equipment.
3.5.1 Biochemical methods
1. Sample preparation
The samples were archived in KEMRI-Wellcome trust laboratories at -80 degrees, and
shipped to Oxford University Hospital for laboratory tests. The samples were thawed at room
temperature in batches of 81, which was the number of samples in each ELISA plate. They
were then vortexed at 300s for 15seconds to mix plasma content, and later centrifuged at
10,000rpm for 10 minutes to section out any precipitate according to sample preparation
guidelines by McPherson and Pincus (2016).
2. Sample analysis of analytes
The Abbot Architect cSystem (Abbott Laboratories, Abbott Park, IL) was used to assay the
analytes. 250µl of sample was loaded into the automated cSystem for the analysis of ferritin,
iron, transferrin, 25OHD and C-reactive protein (CRP). Table 4 shows the immunoassay used
by the Abbot cSystem to assay the analytes.

27
Table 4: Techniques of measurement of analytes in the Abbot Architect cSystem
Analyte Technique of measurement
25OHD (vitamin D) Chemiluminescent Microparticle Immunoassay
Transferrin Chemiluminescent Microparticle Immunoassay
Ferritin Chemiluminescent Microparticle Immunoassay
CRP MULTIGENT CRP Vario assay [CRPVa]
Source: (Abbott Laboratories, Abbott Park, IL)
a) Chemiluminescent Microparticle Immunoassay of plasma transferrin
A plasma aliquot of 250µL was loaded into the Abbot Architect cSystem (Abbott
Laboratories, Abbott Park, IL) and incubated with a buffer Reagent 1 consisting of
100mmol/L TRIS, 45g/L Polyethylene Glycol and 0.1% Sodium Azide. Transferrin antibody
Reagent 2: 40% Anti-human transferrin goat serum, 100mmol/L TRIS and 0.1% Sodium
Azide was added to the aliquot, causing formation of insoluble immune complexes that
increased turbidity. The transferrin concentration was then measured as a function of
turbidity.
b) Plasma Hepcidin ELISA procedure
Plasma hepcidin was measured using competitive enzyme linked immunosorbent assay using
the DRG® Hepcidin 25 (bioactive) HS ELISA Kit (DRG International, Inc. 2018). The
assays are solid phase enzyme linked immunosorbent assays based on the principle of
competitive binding. A sample of 20µL, standard and control were pipetted into appropriate
wells and 50µL of enzyme conjugate added onto each well. The plate was then incubated at
room temperature (25 degrees centigrade) for 60 minutes. After incubation, well contents
were poured out and the plate was washed using a wash buffer. 100µL of the enzyme
complex (streptavidin-HRP) was pipetted into the wells and the plate incubated for 30
minutes at room temperature. After incubation, a second wash step was carried out and
100µL of the substrate solution (Tetramethyl benzidine – TMB) pipetted into each well. The

28
plate was then incubated for 20 minutes at room temperature to allow colour development
and stopped using 100µL of the stop solution (0.5m Sulfuric acid). Absorbance was taken at
450nm with a microtiter plate reader not exceeding 10 minutes after addition of the stop
solution.
c) Plasma soluble transferrin receptor ELISA
Plasma levels of soluble transferrin receptor (sTfR) were determined using the BioVendor
Human Soluble Transferrin receptor ELISA kits (biovendor.com). Plasma sample volume
20µL was diluted with a dilution buffer in the kit, dilution factor 25, and then pipetted into
appropriate wells together with 100µL of standards and quality controls. The plate was then
incubated for 1 hour shaking at 300 rpm on microplate shaker at room temperature. Wells
were washed in the wash buffer and 100µL of conjugate solution added into each well. The
plate was incubated for another hour shaking at 300 rpm then washed again. 100µL of the
substrate solution was pipetted into each well in a dark room and incubated for 10 minutes to
allow for colour development, which was then stopped with a 0.5M Sulfuric acid solution.
Absorbance was read using a microplate reader set to 450nm the results multiplied by the
dilution factor to obtain the concentration of soluble transferrin receptor in the plasma
samples. The results of these ELISAs were determined from standard curves developed from
standard calibrators, which were run simultaneously with study samples.
3.5.2 Definitions
A clinical malaria case was defined as fever / axillary temperature of 37.5 °C with any level
of accompanying parasitaemia in children less than 1 year, and fever >37.5 °C and
parasitaemia of ≥2500 parasites/µl of blood in children 1-15 years (Mwangi et al., 2005). A
single malaria episode was defined as all cases of parasitaemia occurring within 28 days after
a previous case (Gonçalves et al., 2014). Vitamin D deficiency (VDD) was defined as plasma

29
25(OH)D levels of <50 nmol/L, vitamin D insufficiency (VDI) as levels between 50-
75nmol/L, while vitamin D sufficiency (VDS) was defined as levels >75nmol/L (IOM,
2010). Iron deficiency was defined using the plasma markers. Plasma ferritin levels of less
than 12µg/L or less than 30µg/l in the presence of inflammation indicated iron deficiency
(Phiri et al., 2009). Inflammation was defined as CRP levels ≥5mg/l (Phiri et al., 2009).
Transferrin saturation lower than 7% was used to indicate iron deficiency, and was calculated
by ((Iron (µmol/L) / Transferrin (g/L) x 25.1) x 100) (Phiri et al., 2009). Iron deficiency
anaemia was defined as iron deficiency combined with a haemoglobin level of <11g/L (Cook,
2005). The nutritional status of each child was calculated based on the 2018 WHO Global
Database on Child Growth and Malnutrition for Z-scores ("Weight-for-age Child growth
standards", 2018). A Z-score cut-off point of <-2 standard deviation was used to classify low
weight-for-age, low height-for-age and low weight-for-height as moderate and severe
undernutrition, and a <-3 standard deviation Z-score to define severe undernutrition. Weight-
for-age Z-scores below -2 standard deviation were grouped as underweight, height-for-age Z-
score <-2 standard deviation as stunting and weight-for-height Z-score <-2 as wasting
("Weight-for-age Child growth standards", 2018).
3.6 Ethical Consideration
Ethical approval to carry out the study was granted by the Kenya Medical Research
Institute‘s Ethical Review Committee; Scientific and Ethics Review Unit (SERU),
KEMRI/SERU/CGMR-C/046/3257, before initiation of the study. Appendix 2 shows the
SERU Ethical approval.

30
3.7 Statistical data analysis
All the statistical analyses, data cleaning and calculations were performed using STATA
version 13.1 (Stata Corporation, College Station, TX, USA, 1985-2013) statistical software
package.
To explore the general characteristics of the study population, simple descriptive methods
such as summary characteristics and frequency distributions were used. All variables
underwent descriptive checks for missing values and outliers. The geometric mean values
between groups were compared using one-way analysis of variance and independent t-test,
after checking for normality and adjusting where necessary. Statistical significance was set at
P≤0.05. Hepcidin, ferritin and vitamin D (25OHD) measurements were not normally
distributed and were hence transformed to logarithmic scales. Data was categorised to make it
easier to interpret based on previously stipulated definitions. The nutritional status of each
child was calculated based on the 2006 WHO Global Database on Child Growth and
Malnutrition for Z-scores (WHO, 2006). Iron deficiency anaemia, transmission area and
inflammation were also grouped into categories for analysis. Categorical variables were
compared using chi-square tests and analysis of variance.
Vitamin D status was modelled as a categorical variable; ―low‖ vitamin D
(25OHD<75nmol/L) and ―adequate‖ vitamin D (250HD≥75nmol/L). To determine the
predictors of vitamin D deficiency, a univariate analysis was carried out. The predictor
variables used were age, gender, study setting, inflammation and nutritional status. The
variables that had P<0.05 were identified as significant predictors of vitamin D status, and
results were reported as odds ratios and 95% confidence intervals (CI). The interaction
between each predictor variable and the age of the participants was also determined.

31
To investigate the association between vitamin D and iron markers, univariate association
between each of the iron markers (transferrin saturation, hepcidin, haemoglobin) and 25OHD
was carried out. The association between vitamin D status and iron deficiency was
investigated using logistic regression. The strength of association was measured by the
coefficient for linear analysis and odds ratio for categorised variables. Additionally, as the
age effect was a confounding factor, the model was adjusted for age, gender and the
association determined by the adjusted odds ratio.
The main exposure variable was vitamin D status modelled as dichotomous variable (low,
adequate) and, a categorical variable (sufficient, insufficient, deficient), depending on
specific analysis. The outcome variable was the number of malaria episodes. A Poisson
regression model was used to investigate the association between of sub-optimal vitamin D
levels (deficiency and insufficiency) and the number of malaria episodes.

32
CHAPTER 4: RESULTS
4.1 Characteristics of study population
Plasma samples were available for 1487 children. Table 5 describes the characteristics of the
study population. Of these, 48.9% (671) were female and 51.1% (690) were males. The
minority of the children (40.2%) were in the age group 12 to 24 months. Anthropometric data
was available for a total of 501 participants. The nutritional status of the study participants
was determined, where 11.4% (27/237) had wasting (defined as weight-for-height z-score
less than -2), 48.8% (117/240) were stunted (defined as height-for-age z-score less than -2)
and 26.6% (114/429) were underweight (defined as weight-for-age z-score less than -2). Mid-
Upper Arm Circumference (MUAC) data for participants below 6 months of age was
available for 296 participants. The MUAC data was not normally distributed and had a
geometric mean of 15.0±1.1. Only a minority of children, 0.7%, had a MUAC less than
12.5cm.
Inflammation, which was defined as CRP≥5mg/L, had a prevalence of 26.4% (393/1440).
Malaria parasitaemia was also present in 21.9% (262/1191) of malaria blood smears were
positive for P. falciparum. The overall geometric mean parasite density was 2317 parasites/µl
(with a range of 40 – 380000 parasites/µl).

33
Table 5: Characteristics of study population
Characteristics Frequency, N %
Gender (n=1361)
Female 671 49.0
Male 690 51.0
Age groups (n=1361)
<12months 300 21.6
12 to ≤24 months 555 40.2
24 to ≤36 months 153 11.5
36 to ≤48 months 146 10.7
>48months 207 16.0
Study setting (n=1273) a
Ngerenya 275 21.6
Junju 998 78.4
Inflammation (n=1347)
CRP<5mg/ml 983 73.0
CRP≥5mg/ml 364 27.0
Parasitaemia
With parasitaemia 227 21.0
Without parasitaemia 855 79.0
Nutritional status b
Stunted (n=240) Height-for-Age 117 48.8%
Wasted (n=237) Weight-for-Height 27 11.4%
Underweight (n=429) Weight-for-Age 114 26.6%
Mid Upper Arm
Circumference (MUAC) c
<12.5cm
2/294 0.7%
a Study setting: Ngerenya is a low malaria transmission area; Junju is a high malaria transmission area
b Nutritional status: Stunting defined as height-for-age z-scores less than -2; Wasting defined as
weight-for-height z-scores less than -2; Underweight defined as weight-for-age z-scores less than -2. c MUAC: Mid Upper Arm Circumference for children less than 6months
CRP: C reactive protein

34
4.2 Vitamin D status of children in Kilifi County
A total of 1364 (92%) children had vitamin D measurements. The geometric mean of serum
25-hydroxycholecalciferol (25OHD) was 81.9 nmol/L, (range 16, 215.5 nmol/L). The overall
prevalence of vitamin D deficiency (25OHD <50nmol/L) was 6% (82/1364), vitamin D
insufficiency (25OHD >50 and ≤75nmol/L) was 34.1% (465/1364) and, vitamin D
sufficiency (25OHD <75nmol/L) was 59.9% (817/1364). (Figure 4)
Figure 4: Vitamin D status in study population
Children with inflammation (CRP≥5mg/L) had a significantly lower 25OHD level compared
to the non-inflamed (CRP<5mg/L). Children with malaria parasitaemia had a 16% lower
25OHD level compared to those without parasitaemia (95% CI 0.21,0.11; P=0.000).
Moreover, there was no statistically significant difference in 25OHD geometric means
between males and females as well as no difference in study setting and, in nutritional status
indices as shown in the Table 6.
60% 34%
6%
Sufficient Insufficient Deficient

35
Table 6: Plasma 25OHD differences in means according to study variables
Study variables Frequency Plasma 25OHD nmol/l mean±
SD
P value
Gender
Female 671 81.2±1.4 0.416
Male 690 82.4±1.4
Study setting a
Ngerenya 275 82.2±1.3 0.138
Junju 998 79.7±1.4
Nutritional status b
Stunted 99 70.1±1.4 0.997
Not Stunted 109 70.1±1.4
Wasted 24 67.7±1.4 0.519
Not Wasted 181 70.1±1.4
Underweight 102 75.6±1.4 0.196
Not Underweight 287 79.7±1.4
Parasitaemia
With parasitaemia 227 68.4±1.3 0.0005
Without parasitaemia 855 80.3±1.4
Inflammation
CRP<5mg/L 983 81.0±1.4 0.042
CRP≥5mg/L 364 84.1±1.4
a Study setting: Ngerenya is a low malaria transmission area; Junju is a high malaria transmission area.
b Nutritional status: Stunting defined as height-for-age z-scores less than -2; Wasting defined as weight-
for-height z-scores less than -2; Underweight defined as weight-for-age z-scores less than -2.
CRP: C-Reactive protein
4.2.1 Distribution of Vitamin D by Age
The geometric mean of 25OHD level was lower in older compared to younger children
(P=<0.0001). Children less than 12 months had the highest mean 25OHD of 105 nmol/L.
Figure 5, shows a box plot of 25OHD levels by age categories. Vitamin D levels reduced in
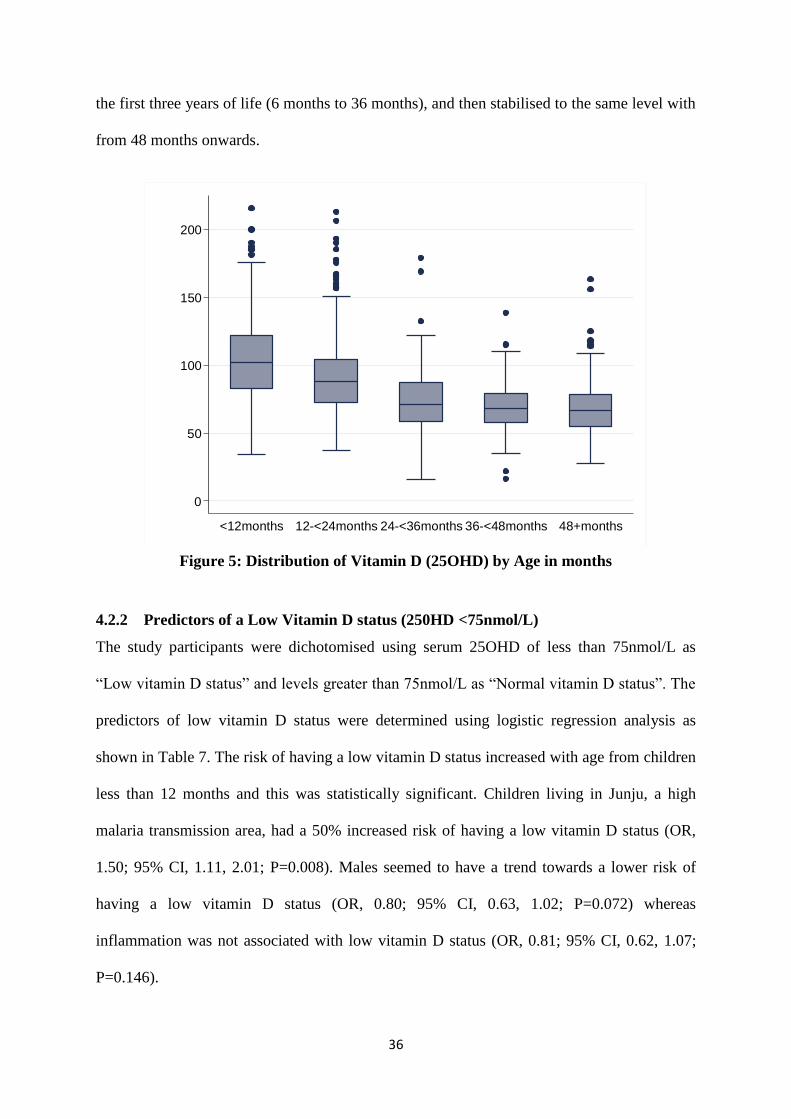
36
the first three years of life (6 months to 36 months), and then stabilised to the same level with
from 48 months onwards.
Figure 5: Distribution of Vitamin D (25OHD) by Age in months
4.2.2 Predictors of a Low Vitamin D status (250HD <75nmol/L)
The study participants were dichotomised using serum 25OHD of less than 75nmol/L as
―Low vitamin D status‖ and levels greater than 75nmol/L as ―Normal vitamin D status‖. The
predictors of low vitamin D status were determined using logistic regression analysis as
shown in Table 7. The risk of having a low vitamin D status increased with age from children
less than 12 months and this was statistically significant. Children living in Junju, a high
malaria transmission area, had a 50% increased risk of having a low vitamin D status (OR,
1.50; 95% CI, 1.11, 2.01; P=0.008). Males seemed to have a trend towards a lower risk of
having a low vitamin D status (OR, 0.80; 95% CI, 0.63, 1.02; P=0.072) whereas
inflammation was not associated with low vitamin D status (OR, 0.81; 95% CI, 0.62, 1.07;
P=0.146).
0
50
100
150
200
log
Vita
min
D (
nm
ol/L)
<12months 12-<24months 24-<36months 36-<48months 48+months

37
Table 7: Predictors of a low vitamin D status (25OHD <75nmol/L) for children in Kilifi County
Vitamin D status OR (95%CI) P value OR (95% CI) P value
Normal
n (%)
Low
n (%)
Gender
Female 386 (47.36) 285 (52.2) Reference Reference
Male 429 (52.64) 261 (47.8) 0.82 (0.66,1.02) 0.08 0.80 (0.63,1.02) 0.072
Age-groups
<12months 246 (30.18) 54 (9.89) Reference Reference
12 ≤ 24months 392 (48.1) 163 (29.85) 1.89 (1.34,2.68) 0.000 1.62 (1.10,2.37) 0.014
24 ≤ 36months 65 (7.98) 88 (16.12) 6.17 (3.99,9.53) 0.000 5.26 (3.30,8.39) 0.000
36 ≤ 48months 48 (5.89) 98 (17.95) 9.30 (5.91,14.64) 0.000 8.22 (5.06,13.36) 0.000
>48months 64 (7.85) 143 (26.19) 10.18 (6.71,15.44) 0.000 8.81 (5.62,13.82) 0.000
Study setting
Ngerenya 178 (24.22) 97 (18.03) Reference Reference
Junju 557 (75.78) 441 (81.97) 1.45 (1.10,1.92) 0.008 1.50 (1.11,2.01) 0.008
Inflammation
CRP<5mg/L 582 (72.03) 401 (74.4) Reference Reference
CRP≥5mg/L 226 (27.97) 138 (25.6) 0.89 (0.69,1.13) 0.338 0.81 (0.62,1.07) 0.146
Multivariable estimates (Odds ratio) adjusted for all other variables in the model. OR, Odds Ratio; CI, confidence interval; MUAC, Mid-Upper Arm
Circumference. Low vitamin D status 25OHD<75nmol/L; Normal Vitamin D status 25OHD≥75nmol/L. P value indicates logistics regression for
differences in predictor variables.

38
4.2.3 Vitamin D status of children in Malaria transmission areas
Vitamin D status; normal vitamin D and low vitamin D, were mapped according to the study
settings. Location coordinates of study participants were used to map children in Junju, where
malaria transmission was high and, Ngerenya, where malaria transmission was low. Figure 6
shows that Junju had a higher proportion of children with malaria (27 episodes in Ngerenya
verses 225 episodes in Junju). Moreover, Ngerenya had more children with vitamin D
sufficiency (178 (24.22%) compared to Junju, 557 (75.8%). To further explore this
observation, logistic regression analysis showed that study participants in Junju had a 50%
higher chance of having vitamin D deficiency than Ngerenya (OR 1.50; 95% CI, 1.11,2.01;
P=0.008).

39
Figure 6: Map of KHDSS showing Malaria Transmission area and coordinates for study
participants

40
4.3 Association of vitamin D status and iron status
4.3.3 Mean differences of vitamin D by iron markers
Table 8 summarizes the geometric mean differences in iron markers. Soluble transferrin
receptor levels were significantly higher in children with normal vitamin D status than those
with low vitamin D status (19.0mg/L versus 16.7mg/L). Hepcidin levels were higher in the
low vitamin D group compared to the normal Vitamin D group (6.5µg/L verses 5.1µg/L;
P=0.0005). Iron deficient children had significantly higher levels of vitamin D (70.0% verses
30.0%) in normal and low vitamin D status.
Table 8: Mean differences of iron markers between low vitamin D and high vitamin D
status groups
Iron markers Frequency Low Vitamin D
status
Normal Vitamin D
status
P value
sTfR (mg/L) 1346 16.7±1.5 19.0±1.5 0.000
Hepcidin (µg/L) 1257 6.5±3.4 5.1±3.7 0.000
Ferritin index 1308 5.5±1.9 7.0±2.0 0.003
Transferrin saturation 1300 10.5±2.1 8.3±2.1 0.000
Haemoglobin (g/dL) 793 10.4±1.2 9.9±1.2 0.000
Iron deficient, no (%) 477 143 (30.0%) 334 (70.0%) 0.000a
Iron deficiency anemia,
no (%)
199 57 (28.6%) 142 (71.4%) 0.000a
Low Vitamin D is 25OHD <75nmol/L; Normal Vitamin D is 25OHD≥75nmol/L. Geometric mean values are
presented for continuous variables and categorical variables are represented by proportions (%). Iron deficiency
was defined as ferritin<12µg/L or ferritin <30 µg/L with inflammation CRP≥5mg/L. Iron deficiency anaemia
was defined as iron deficiency with Hb<11g/dl.
SD, standard deviation
P values for continuous variables are Chi-square differences in mean. a P values for categorical variables

41
4.3.4 Effect of vitamin D status on iron markers
The correlations between 25OHD and iron markers are demonstrated in Figure 7. All the
variables were log transformed as they were not normally distributed. There was a significant
negative correlation between logvitamin D and; logferritin, log hepcidin and log TS, and a
positive correlation with logsTfR.
a
b
c
d
Two-way scatterplots of vitamin D status shows
a) logferritin Coeff. -0.04 (95% CI -0.05, -0.02; P=0.000)
b) loghepcidin Coeff. -0.02 (95% CI -0.04, -0.01; P=0.004)
c) logsTfR Coeff. 0.13 (95% CI 0.09, 0.17; P=0.000)
d) logtransferrin saturation (TS) Coeff. -0.09 (95%CI -0.12, -0.07; P=0.000)
Figure 7: The correlation between Vitamin D and Iron markers among children in Kilifi
County, Kenya
34
56
log
Vita
min
D (
nm
ol/L)
0 2 4 6log ferritin (µg/L)
Log vitamin D Fitted values
34
56
log
Vita
min
D (
nm
ol/L)
-4 -2 0 2 4log hepcidin (µg/L)
Log vitamin D Fitted values
34
56
log
Vita
min
D
1 2 3 4 5log stfr (mg/L)
Log vitamin D Fitted values
34
56
log
Vita
min
D (
nm
ol/L
)
-1 0 1 2 3 4log Transferin saturation
Log vitamin D Fitted values

42
A linear relationship Univariate regression analyses of the effect of vitamin D levels on iron
markers showed a 21% increase in sTfR, (95% CI; 0.15, 0.29; P=0.000); 31% decrease in
hepcidin -0.31 (95% CI; -0.52, -0.10; P=0.004); 34% increase in ferritin index (95% CI; 0.23,
0.45; P=0.000) and 89% decrease in haemoglobin (95% CI; -1.19, -0.60; P=0.000) with
increasing vitamin D levels. When adjusted for gender, age and study setting, the model
showed significant association with increasing vitamin D levels where; 18% increase in sTfR,
71% increase in ferritin index and a 32% decrease in transferrin saturation. The effect on all
the other variables was not significant. Increase in vitamin D levels increased iron deficiency
(OR 2.89, 95% CI; 2.02, 4.13; P=0.0005) and iron deficiency anaemia (OR, 5.70; 95%CI,
3.37, 9.64; P=0.0005) significantly in a univariate logistics model, but when adjusted for
gender, study setting and age, the significance was lost, as shown in Table 9.
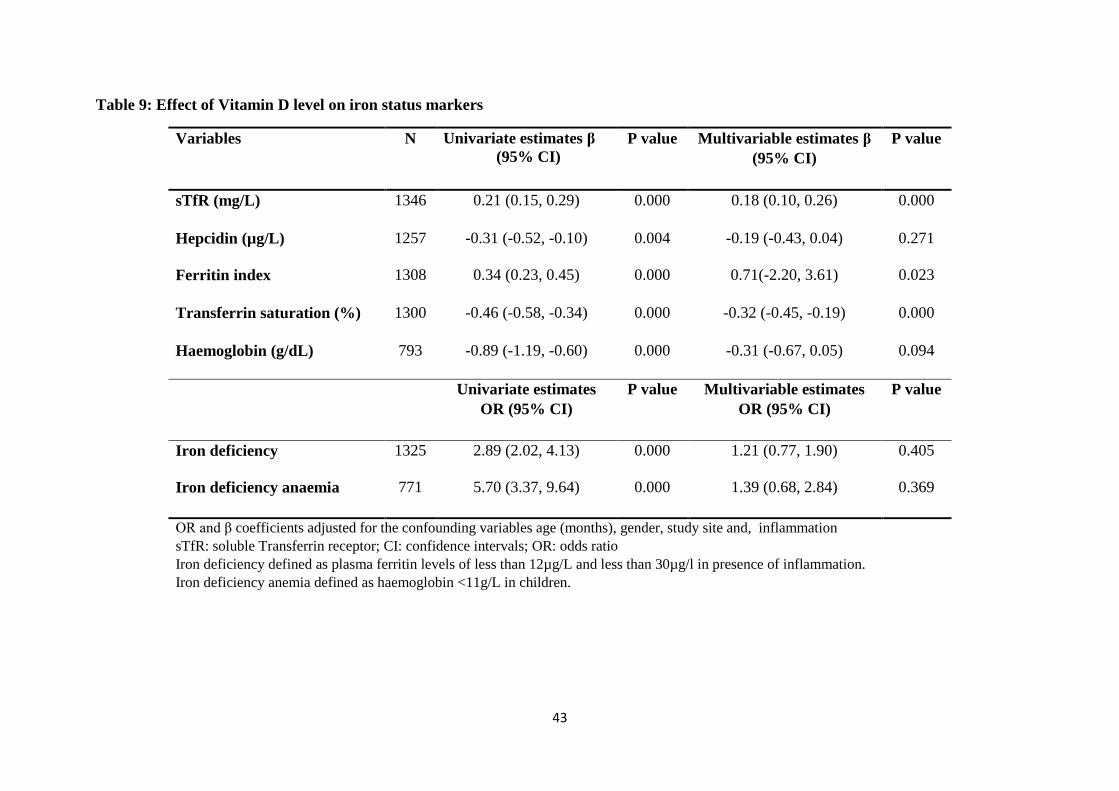
43
Table 9: Effect of Vitamin D level on iron status markers
Variables N Univariate estimates β
(95% CI)
P value Multivariable estimates β
(95% CI)
P value
sTfR (mg/L) 1346 0.21 (0.15, 0.29) 0.000 0.18 (0.10, 0.26) 0.000
Hepcidin (µg/L) 1257 -0.31 (-0.52, -0.10) 0.004 -0.19 (-0.43, 0.04) 0.271
Ferritin index 1308 0.34 (0.23, 0.45) 0.000 0.71(-2.20, 3.61) 0.023
Transferrin saturation (%) 1300 -0.46 (-0.58, -0.34) 0.000 -0.32 (-0.45, -0.19) 0.000
Haemoglobin (g/dL) 793 -0.89 (-1.19, -0.60) 0.000 -0.31 (-0.67, 0.05) 0.094
Univariate estimates
OR (95% CI)
P value Multivariable estimates
OR (95% CI)
P value
Iron deficiency 1325 2.89 (2.02, 4.13) 0.000 1.21 (0.77, 1.90) 0.405
Iron deficiency anaemia 771 5.70 (3.37, 9.64) 0.000 1.39 (0.68, 2.84)
0.369
OR and β coefficients adjusted for the confounding variables age (months), gender, study site and, inflammation
sTfR: soluble Transferrin receptor; CI: confidence intervals; OR: odds ratio
Iron deficiency defined as plasma ferritin levels of less than 12µg/L and less than 30µg/l in presence of inflammation.
Iron deficiency anemia defined as haemoglobin <11g/L in children.

44
The prevalence of iron deficiency was 36.0% (477/1325). Interestingly, the age distribution
of vitamin D status versus that of iron status in children showed an inverse trend; Vitamin D
insufficiency increased with age (Figure 8) whereas iron deficiency decreased with age
(Figure 9).
Figure 8: Distribution of children’s Vitamin D status by age (months)
0
10
20
30
40
50
60
70
80
90
<12months 12 ≤ 24months 24 ≤ 36months 36 ≤ 48months >48months
Vitamin D sufficiency Vitamin D insufficiency Vitamin D deficiency
Age Categories
% P
revale
nce
of
Vit
am
in
D s
tatu
s

45
Figure 9: Distribution of children’s Iron status by age (months)
4.4 Vitamin D status and the risk of malaria infection
a) Association of asymptomatic parasitaemia and vitamin D status
Asymptomatic parasitaemia was defined as presence of any parasitaemia in blood without
causing any symptoms. About 21.9% (262/1191) of the children had malaria parasitaemia.
Asymptomatic parasitaemia at the time of vitamin D measurement was determined using
regression model with vitamin D as continuous variable and in a logistic regression model as
a categorical variable. The outcome variable was with or without asymptomatic parasitaemia.
Low vitamin D levels (25OHD <75nmol/l) increased the risk of malaria incidence OR 2.52;
95% CI, 1.47, 4.33, P=0.001, but when adjusted for age, gender and study setting, the effect
was lost OR 1.31; 95% CI, 0.73, 2.37, P=0.362. Table 10 shows the estimates of association
of vitamin D and malaria at the time of vitamin D measurement.
0
10
20
30
40
50
60
70
80
90
100
<12months 12 ≤ 24months 24 ≤ 36months 36 ≤ 48months >48months
% P
rev
ale
nce
of
Iro
n D
efi
cien
cy
Age categories
Iron replete Iron deficiency

46
Table 10: Association of vitamin D status of study children and malaria infection
Vitamin D (nmol/L) N Unadjusted Estimate
(coefficient) (95% CI)
P value Adjusted Estimate a
(coefficient) (95% CI)
P value
Log Vitamin D (continuous) 1126 β -0.09 (-0.14, -0.04) 0.000 β -0.02 (-0.07, 0.03) 0.427
OR (95% CI) OR (95% CI)
Vitamin D status
Normal vitamin D (≥75) 551 Reference Reference
Low vitamin D (<75) 462 2.52 (1.47, 4.33) 0.001 1.31 (0.73, 2.37) 0.362
Vitamin D categories
Vitamin D sufficient (≥75L) 551 Reference Reference
Vitamin D insufficient (<75≤50) 389 2.41 (1.38,4.23) 0.002 1.34 (0.73,2.46) 0.345
Vitamin D deficient (<50) 73 3.11 (1.32, 7.30) 0.009 1.21 (0.48, 3.02) 0.688
a Estimate (coefficient and odds ratio), adjusted for age (months), gender and study setting. OR, odds ratio; CI, confidence interval

47
b) Vitamin D status and the occurrence of future malaria episodes
A Poisson regression model was used to investigate the effect of vitamin D on future malaria
episodes. To help assess whether the Poisson model fit the data, a goodness-of-fit chi-squared
test was run. The Poisson model was found to fit reasonably well as the goodness-of-fit chi-
squared test was not statistically significant. The Poisson regression results were presented as
incidence rate ratios (IRR). There was a significant interaction between vitamin D status and
future malaria episodes in unadjusted models. However, there was no significant association
between vitamin D status and prospective malaria episodes in adjusted models, and age was a
significant confounder (Table 11).
Table 11: Susceptibility to malaria infection by vitamin D status of study children
Vitamin D (nmol/L) Unadjusted IRR
(95% CI)
P
value
Adjusted IRR a
(95% CI)
P value
Log Vitamin D (continuous) 0.51 (0.39, 0.66) 0.000 0.87 (0.65, 1.17) 0.375
Vitamin D status
Normal vitamin D status (≥75) Reference Reference
Low vitamin D status (<75) 1.50 (1.26, 1.78) 0.000 1.06 (0.87, 1.28) 0.572
Vitamin D categories
Vitamin D sufficiency (≥75) Reference Reference
Vitamin D insufficiency
(<75≤50)
1.51 (1.26, 1.81) 0.000 1.10 (0.91, 1.34) 0.325
Vitamin D deficiency (<50) 1.42 (1.01, 2.00) 0.000 0.81 (0.56,1.16) 0.248
NOTE: The analysis represents 1191 children with vitamin D measurement during 6 months of follow-up.
Incidence rate ratios (IRRs) were calculated by Poisson regression analysis that included malaria episodes as the
dependent variable and the explanatory variable vitamin D status, age (months), gender and study setting. a Adjusted for age (months), gender and study setting.

48
CHAPTER 5: DISCUSSION
5.1 Vitamin D status of children in Kilifi
This study established prevalence of vitamin D deficiency (6%; 25OHD <50nmol/L) and of
vitamin D of insufficiency (34%; prevalence 25OHD <75nmol/L) among otherwise healthy
children in Kilifi County. The study site is located at 3ºS latitude along Indian Ocean the
Coast of Kenya; where sunlight is strong. The study participants were from rural
communities where environmental air pollution was not evident. Considering these
conditions, the hypothesis that vitamin D deficiency is almost non-existent in the coastal
region was nullified. Despite this, comparison with data from other African studies shows
significant variation. For instance, a study in South African children found a 36% prevalence
(Poopedi et al., 2011) while another in Ethiopian school going children found a 42%
prevalence of vitamin D deficiency (Wakayo et al., 2015), compared to 6% in this study
population. The reason for these disparities across the continent could be because Africa is
not homogenous in geography, climate, cultural practices, skin pigmentation and disease
burden, and these differences could have led to the variability in vitamin D status.
Additionally, these results show higher vitamin D levels in African children in Kilifi
compared to other continents such as America, where one study found an 18% prevalence of
vitamin D deficiency in children (Mansbach et al., 2009) while another in Asian children
showed a prevalence of 90% deficiency in children one to six months of age (Choi et al.,
2013). Both America and South Korea are in higher latitudes and do not receive ample
sunlight throughout the year for optimal vitamin D synthesis.
This study showed that low vitamin D status decreases with age. This is in agreement with a
study by Mansbach and colleagues (2009) where, vitamin D levels among children 0 to 48
months decreased with increasing age. Infants less than six months had the highest mean
levels of vitamin D. This may due to of exclusive breastfeeding practice where children are

49
exclusively breast fed from birth until six months, and up to two years with complementary
feeding (World Health Organization, 2009). According to these recommendations, many of
the health care providers and community health workers within the KHDSS advise care-
givers on exclusive breastfeeding (Scott et al., 2012). Other studies (Mansbach et al., 2009;
Zhu et al., 2012) attribute this trend to decreased intake of vitamin D fortified infant food,
which is not comparable to this population in Kilifi. Age differences in vitamin D in these
children could be explained by an increased need for vitamin D due to rapid skeletal growth
(Holick, 2004). Additionally, it could also be due to transplacental transfer of vitamin D
where children are born with high vitamin D stores. This could be depleted as the child grows
or, due to the cultural practice of covering infants and keeping them indoors which denies
them exposure to sunlight.
This study did not find a significant difference in vitamin D levels by gender. Similar results
were found for Chinese children where no significant difference was found between the
vitamin D levels of boys and girls at any stage (Zhu et al., 2012). This could be because
children in this study population, 3 months to 30 months at the time of vitamin D
measurement, had not reached puberty where girls tend to have a higher fat storage than
boys, and hence lower vitamin D levels in circulation (Poopedi et al., 2011). Vitamin D is a
fat soluble vitamin which has stores in the adipose tissue (Martinaityte et al., 2017)
This study found no correlation between serum vitamin D levels and inflammation in all age
groups. While some observational studies have shown an inverse association between vitamin
D and inflammation in newborns (Tao et al., 2015), others have shown no relationship in
women (Azizieh et al., 2016) and in elderly subjects (Shea et al., 2008). Prior randomized
control studies on participants with autoimmune and chronic diseases with baseline CRP of
<5nmol/L showed increased CRP with vitamin D supplementation (Asemi et al., 2013). It
appears that the beneficial effects of high vitamin D levels in reduction of CRP and other

50
inflammatory cytokines are found in individuals diagnosed with autoimmune and chronic
diseases as in the study by (Asemi et al., 2013).
There was no statistically significant difference in geometric means of vitamin D in children
according to their nutritional status. However, malnourished children had a lower vitamin D
geometric mean as compared to those who were not malnourished. Previous studies have
shown an association between nutritional status and low vitamin D levels. In hospitalized
Ugandan children, 6 to 24 months of age subjects with severe acute malnutrition and
moderate acute malnutrition had significantly lower vitamin D levels compared to those who
were non-malnourished (Nabeta and Kasolo, 2017). Also, very few children in this cohort
must have had severe malnutrition. Malnourished children are more likely to have
accompanying infections, poor absorption and utilization of food, which may explain the
differences in vitamin D levels. Additionally, malnourished children may feel weak, and may
spend fewer hours in the sun as compared to healthy children, resulting in a low vitamin D
status. The assumption in this study was that the children were healthy community subjects
who were exposed to the sun daily, whereas those from the Ugandan study were hospitalized
and sickly and hence did not get sufficient sunshine for vitamin D synthesis.
5.2 The association between vitamin D status and iron status
In this study, no significant association of iron deficiency and vitamin D status was observed.
Moreover, haemoglobin, ferritin index and transferrin saturation were not significantly
associated with vitamin D status. Study participants with low vitamin D had lower soluble
transferrin receptor (sTfR) compared to those with normal vitamin D status. Soluble
transferrin receptor is used as a measure of iron status especially during inflammation, when
ferritin, which is a routine investigation for iron deficiency is confounded by inflammation.

51
Contrary to these results, previous cross-sectional studies have shown an association between
low vitamin D and iron deficiency (Lee et al., 2009; Sim et al., 2010). Some studies show that
supplementation with vitamin D does not increase ferritin, haemoglobin and iron.
Hepcidin concentrations were lower in children with higher vitamin D levels in an unadjusted
model though this was not significant when adjusted for age, study site and gender. Elevated
levels of vitamin D resulted in decreased hepcidin levels, an observation agreeing with a
study in pregnant adolescent girls adolescents (Thomas et al., 2015). Previous studies also
demonstrate that supplementing with vitamin D decreases hepcidin concentrations in adults
(Bacchetta et al., 2014; Smith et al., 2016). Studies in mice show that vitamin D is capable of
suppressing the expression of the HAMP gene which codes for hepcidin (Bacchetta et al.,
2014). This association was however not significant in this study population and may have
been confounded by factors not measured in our study. The study population was highly
inflamed (27% prevalence) and this could have highly influenced hepcidin concentrations.
The precise mechanism through which vitamin D influences iron status is not well
understood.
There are few plausible reasons for the negative findings in this study. One possibility is that
the study participants were inflamed, underestimating iron deficiency anaemia. Iron
deficiency anaemia is defined using the iron marker ferritin, an acute-phase protein that is
elevated during inflammation. As this study population has a 27% prevalence of
inflammation, this could have resulted in non-identification of iron deficient children. A
second reason could be because of age-specific differences in iron deficiency. Iron deficiency
in our study population was highest in infancy 0 to 6 months, and decreased gradually with
age, making age a strong confounder. This finding may be explained by the age variability in
hepcidin concentrations which has been reported in malaria endemic regions (Atkinson et al.,
2015). Other potential confounders influencing the relationship between vitamin D and iron

52
markers, which were not considered in this study, include dietary calcium, fat intake, body
mass index, folate deficiency, vitamin B12 deficiency, sickle cell trait, iron metabolism
disorders and medication (Holick, 2003).
5.3 Vitamin D status alters the risk of malaria infection
In this study, vitamin D status was not associated with malaria parasitaemia at the time of
vitamin D measurement in a cross-sectional model. Moreover, vitamin D status had no
influence on susceptibility to malaria infection. Findings from previous studies are
contradictory. A previous prospective study of adults receiving antiretroviral therapy in
Tanzania found no association between vitamin D deficiency and malaria incidence (Sudfeld
et al., 2013), and another in western Kenya, a malaria endemic area, found no significant
difference in vitamin D levels and malaria during pregnancy, delivery, or in infant cord blood
(Toko et al., 2016). Contrary to these findings, a study in Ugandan children found low
vitamin D levels in children with severe malaria compared to community cohorts, and the
odds of having severe malaria decreased with increase in plasma vitamin D levels (Cusick et
al., 2014). However, one observational study among HIV-exposed uninfected infants at 6
weeks of age with 25OHD ≥50nmol/L were found to have an increased risk of clinical and
confirmed malaria (Sudfeld et al., 2015).
Despite these findings, there are multiple direct immune mechanisms through which vitamin
D deficiency may impair malaria immunity and increase the risk of asymptomatic and
symptomatic malaria infection. Malaria infection is characterised by an overwhelming
inflammatory response that leads to clinical symptoms typical of a systemic infectious
disease. Patients with malaria experience tiredness, aching joints and muscles, fever, and
anorexia, which are characterised by release of inflammatory cytokines (Mecheri, 2012).
Animal studies have established that treatment with vitamin D reduces circulating cytokines

53
interferon gamma (IFN-ɣ) and tumour necrosis factor (TNF) hence decreasing time of
malaria progression and minimising susceptibility (He et al., 2014). Moreover, in one study,
mice infected with Plasmoduim treated with the antimalarial drug arteether1, and vitamin D
combined showed improvement in disease pathogenesis compared to mice treated with
vitamin D or arteether alone (Dwivedi et al., 2016). Interestingly, the chemokines CXCL9
and CXCL10, which play a role in the pathogenesis of cerebral malaria by attracting T-cells
into the central nervous system (Campanella et al., 2008), were found to be suppressed in
vitamin D treated mice (Dwivedi et al., 2016).
In addition to suppressing pro-inflammatory cytokines, vitamin D metabolites have been
found to stimulate production of antimicrobial peptides, cathelicidin and defensin, which play
a role in innate immunity (Bacchetta, et al., 2014). These peptides are elevated during and
after malaria infection and are thought to play a multifunctional role in providing a first line
immunity against malaria parasites (Parra et al., 2013). 1,25(OH)D3 is a direct inducer of the
antimicrobial peptide gene, hCAMP - cathelicidin and defensin B2 - defensin. Promoters of
these genes contain vitamin D response elements which mediate 1,25(OH)D3 dependent gene
expression (Wang et al., 2017). This could mean that an elevated level of vitamin D could
potentially stimulate immune mechanisms that cause decrease malaria infection.
1 Arteether is an antimalarial drug used to treat malaria.

54
5.4 Strengths and Limitations of the Study
The main strength of this study is the large sample size (n=1487) which gave a wide
representation of the population under research. Secondly, the research involved a relatively
homogenous cohort of children 6 to 48 months which helped reduce confounding.
However, there are general limitations in this study. First, it is an observational study and
does not proof causality. Secondly, information on iron, vitamin B12, folate and sun exposure
was not collected. These are important determinants of vitamin D synthesis that influence
vitamin D status, therefore they could confound these results.
5.5 Conclusion
This study led to a conclusion that; the prevalence of vitamin D insufficiency in children in
Kilifi County is high, that vitamin D deficiency and insufficiency are not associated with iron
status nor is vitamin D status associated with future malaria episodes. Hence, vitamin D and
does not alter the risk of malaria infection among children in Kilifi County.

55
5.6 Recommendations
1. Vitamin D insufficiency and deficiency are a public health concern among children in
Kilifi County and these children should be targeted for supplementation programmes.
Additionally, there should be increased sensitization by community health workers
among caregivers on the health benefits of exposing children to sunshine as a source
of vitamin D.
2. Similar studies should be carried out in other counties in Kenya to determine the
vitamin D status of children and other age groups. There is scarcity of data on this
area.
3. Randomised control trials investigating the effect of vitamin D supplementation on
iron status of children should be carried out to further explore the effect of improving
the vitamin D status on iron deficiency and iron deficiency anaemia.
4. Vitamin D level was not associated with future malaria episodes in this study.
However, malaria data may have limited the ability to detect a significance level.
Further studies are needed to assess the relationship between vitamin D levels and
malaria immune response proteins to assess the molecular relationship of vitamin D
and malaria.

56
REFERENCES
Abbott Laboratories, Abbot Park IL. (2018). Retrieved from
https://www.corelaboratory.abbott/us
Allali F, El A, Khazani H et al. (2009) High prevalence of hypovitaminosis D in Morocco:
relationship to lifestyle, physical performance, bone markers, and bone mineral density.
Semin Arthritis Rheum, 38: 444–451.
Alon D, Chaimovitz C, Dvilansky A, Lugassy G, Douvdevani A, Shany S, and Nathan I.
(2002). Novel role of 1, 25 (OH) 2 D 3 in induction of erythroid progenitor cell proliferation.
Experimental Hematology, 30(5), 403–409.
Asemi Z, Samimi M, Tabassi Z, Shakeri H, and Esmaillzadeh A. (2013). Vitamin D
Supplementation Affects Serum High-Sensitivity C-Reactive Protein, Insulin Resistance, and
Biomarkers of Oxidative Stress in Pregnant Women. The Journal of Nutrition, 25, 1432–
1438.
Asemi Z, Samimi M, Tabassi Z, Shakeri H, and Esmaillzadeh A. (2013). Vitamin D
supplementation affects serum high-sensitivity C-reactive protein, insulin resistance, and
biomarkers of oxidative stress in pregnant women. Journal of Nutrition, 143(9), 1432-1238.
Atkinson S, Armitage A, Khandwala S, Mwangi T, Uyoga S, Bejon P, Drakesmith H. (2014).
Combinatorial effects of malaria season, iron deficiency, and inflammation determine plasma
hepcidin concentration in African children. Blood, 123(21), 3221–3229.
Atkinson S, Uyoga S, Armitage A, Khandwala S, Mugyenyi C, Bejon P, Williams T. (2015).
Malaria and Age Variably but Critically Control Hepcidin Throughout Childhood in Kenya.
EBioMedicine, 2(10), 1478–1486.
Azizieh F, Khulood A, and Raj R. (2016). Association between levels of vitamin D and
inflammatory markers in healthy women. Journal of Inflammatory Research, 9: 51-57.
Bacchetta J, Chun R, Gales B, Zaritsky J, Leroy S, Wesseling-Perry K, Hewison M. (2014).
Antibacterial responses by peritoneal macrophages are enhanced following vitamin D
supplementation. PLoS ONE, 9(12), 1-8.
Bacchetta J, Zaritsky J, Sea J, Chun R, Lisse T, Zavala K, Hewison M. (2014). Suppression
of Iron-Regulatory Hepcidin by Vitamin D. J Am Soc Nephrol, 25, 564–572.
Bejon P, Ogada E, Mwangi T, Milligan P, Lang T, Fegan G, Hill A. (2007). Extended follow-
up following a phase 2b randomized trial of the candidate malaria vaccines FP9 ME-TRAP
and MVA ME-TRAP among children in Kenya. PLoS ONE, 2(8), 1–5.
Braithwaite V, Jarjou L, Goldberg G, Jones H, Pettifor J, and Prentice A. (2012). Follow-up
study of Gambian children with rickets-like bone deformities and elevated plasma FGF23:
Possible aetiological factors. Bone, 50(1), 218–225.
Campanella G, Tager A, Khoury J, ElThomas S, Abrazinski T, Manice L, Luster A. (2008).
Chemokine receptor CXCR3 and its ligands CXCL9 and CXCL10 are required for the
development of murine cerebral malaria. PNAS, 105(12), 4814-4819.

57
Chan T. (2000). Comment Vitamin D Deficiency and Susceptibility to Tuberculosis.
Calcified Tissue International, 476–478.
Choi Y, Kim M, and Jeong S. (2013). Vitamin D deficiency in infants aged 1 to 6 months.
Korean J Pediatr, 56(5), 205–210.
Cohen J. (1988). Statistical power analysis for the behavioral sciences (2nd ed., pp. 14-17).
New York, NY: Psychology Press, Taylor & Francis Group.
Cook J. (2005). Diagnosis and management of iron-deficiency anaemia. Clinical
Haematology, 18(2), 319-332.
Cusick S, Opoka R, Lund T, John C, and Polgreen L. (2014). Vitamin D insufficiency is
common in Ugandan children and is associated with severe malaria. PLoS ONE, 9(12), 1–8.
DRG International, Inc. (2018). Retrieved from https://store.drg-
international.com/pc_product_detail.asp
Dwivedi H, Singh S, Chauhan B, Gunjan S, and Tripathi R. (2016). Potential cerebral malaria
therapy: intramuscular arteether and vitamin D co-administration. Parasitology, 143(12),
1557–1568.
Edwards J, Thiongó A, Van den Bergh I, Kizito W, Kosgei R, Sobry A, Vandenbulcke A,
and Zuniga I. Preventable but neglected: rickets in an informal Nairobi, Kenya. Public Health
Action International Union Against Tuberculosis and Lung Disease Health Solutions for the
Poor, 4(2), 122-127.
Ganz T. (2010). Iron in Innate Immunity: Starve the Invaders Tomas. Clinical Lymphoma,
9(1), 19–22.
Garza C. (2010). α1-Acid glycoprotein, hepcidin, C-reactive protein, and serum ferritin are
correlated in anemic schoolchildren with Schistosoma haematobium. Children, 1784–1790.
Global Burden of Disease Pediatrics Collaboration. (2016). Global and national burden of
diseases and injuries among children and adolescents between 1990 and 2013: findings from
the Global Burden of Disease 2013 Study. JAMA Pediatrics, 170(3), 267–287.
Gonçalves B, Huang C, Morrison R, Holte S, Kabyemela E, Prevots D, Duffy P. (2014).
Parasite Burden and Severity of Malaria in Tanzanian Children. New England Journal of
Medicine, 370(19), 1799–1808.
Gwamaka M, Kurtis J, Sorensen B, Holte S, Morrison R, Mutabingwa T, Duffy P. (2012).
Iron deficiency protects against severe plasmodium falciparum malaria and death in young
children. Clinical Infectious Diseases, 54(8), 1137–1144.
Han S, Kim M, Kim H, Lee S, Oh Y, et al. (2013) Non-Linear Relationship between Serum
25-Hydroxyvitamin D and Hemoglobin in Korean Females: The Korean National Health and
Nutrition Examination Survey 2010–2011. PLoS ONE, 8(8): e72605.
He X, Yan J, Zhu X, Wang Q, Pang W, Qi Z, Cao Y. (2014). Vitamin D Inhibits the
Occurrence of Experimental Cerebral Malaria in Mice by Suppressing the Host Inflammatory
Response. The Journal of Immunology, 193(3), 1314–1323.

58
Holick M. (2003). Vitamin D: A millennium perspective. Journal of Cellular Biochemistry,
88:296-307.
Holick M. (2004). Sunlight and vitamin D for bone health and prevention of autoimmune
diseases, cancers, and cardiovascular disease. The American Journal of Clinical Nutrition,
1(4), 80, 1678–1688.
Jones K, Hachmeister C, Khasira M, Cox L, Schoenmakers I, Munyi C, Berkley J. (2017).
Vitamin D deficiency causes rickets in an urban informal settlement in Kenya and is
associated with malnutrition. Maternal and Child Nutrition, (2017), e12452.
KNBS. (2015). County Statistical Abstract Kilifi County 2015. Retrieved from
https://www.knbs.or.ke/county-statistics/
Lee D, Tajar A, Ulubaev A, Pendleton N, O‘Neill T, O‘Connor D, Wu F. (2009). Association
between 25-hydroxyvitamin D levels and cognitive performance in middle-aged and older
European men. Journal of Neurology, Neurosurgery, and Psychiatry, 80(7), 722–729.
Lee D, Tajar A, Ulubaev, Pendleton N, O'Neill T et al (2009). Association between 25-
hydroxyvitamin D levels and cognitive performance in middle-aged and older European men.
Journal of Neurology, Neurosurgery, and Psychiatry, 80(7), 722-729.
Mansbach J, Ginde A, and Camargo C. (2009). Serum 25-Hydroxyvitamin D Levels Among
US Children Aged 1 to 11 Years: Do Children Need More Vitamin D? Pediatrics, 124(5),
1404–1410.
Martinaityte I, Kamycheva E, Didriksen A, Jakobsen J, and Jorde R. (2017). Vitamin D
Stored in Fat Tissue During a 5-Year Intervention Affects Serum 25-Hydroxyvitamin D
Levels the Following Year. The Journal of clinical endocrinology and metabolism, 102(10),
3731-3738.
McPherson R and Pincus M. (2016). Henry's Clinical Diagnosis and Management by
Laboratory Methods E-Book (22nd ed., pp. 67-90). Philadelphia: Elsevier Health Sciences.
Mecheri S. (2012). Biochimica et Biophysica Acta Contribution of allergic inflammatory
response to the pathogenesis of malaria disease. BBA - Molecular Basis of Disease, 1822(1),
49–56.
Ministry of Health (2016). The epidemiology and control profile of malaria in Kenya:
reviewing the evidence to guide the future vector control. National Malaria Control
Programme, Ministry of Health. Technical support provided by the LINK Project (London
School of Hygiene and Tropical Medicine and the Information for Malaria (INFORM)
Project, KEMRI-Wellcome Trust Research Programme), Nairobi, Kenya, April 2016.
Mogeni P, Williams T, Fegan G, Nyundo C, Bauni E, Mwai K, Bejon P. (2016). Age, Spatial,
and Temporal Variations in Hospital Admissions with Malaria in Kilifi County, Kenya : A
25-Year Longitudinal Observational Study. PLoS Medicine, 2009, 1–17.
Mwangi T, Ross A, Snow R, and Marsh K. (2005). Case Definitions of Clinical Malaria
under Different Transmission Conditions in Kilifi District, Kenya. The Journal of Infectious
Diseases, 191(11), 1932–1939.

59
Nabeta H, and Kasolo J. (2017). Serum Vitamin D status in children with protein-energy
malnutrition admitted to a national referral hospital in Serum vitamin D status in children
with protein ‑ energy malnutrition admitted to a national referral hospital in Uganda. BMC
Research Notes, (December 2015).
Nabeta H, Kasolo J, Kiggundu R, Kiragga A, Kiguli S. (2015). Serum vitamin D status in
children with protein-energy malnutrition admitted to a national referral hospital in Uganda.
BMC Research Notes. 8:418.
Newens K, Filteau S, and Tomkins A. (2006). Plasma 25-hydroxyvitamin D does not vary
over the course of a malarial infection. The Royal Society of Tropical Medicine and Hygiene,
100, 41—44.
Nyakeriga A, Troye-blomberg, Chemtai A, Marsh K, and Williams T. (2004). Malaria and
nutritional status in children living on the coast of Kenya. The Journal of Infectious Diseases,
190(3), 439–447.
Parra M, Liu X, Derrick S, Yang A, Tian J, Kolibab K, Morris S. (2013). Molecular Analysis
of Non-Specific Protection against Murine Malaria Induced by BCG Vaccination. PLoS
ONE, 8(7), 1–8.
Phiri K,, Calia J, Siyasiya A, Bates I, Brabin B, et al. (2009). New cut-off values for ferritin
and soluble transferrin receptor for the assessment of iron deficiency in children in a high
infection pressure area. Journal of Clinical Pathology, 62(12), 1103-1106.
Poopedi M, Norris S, and Pettifor J. (2011). Factors influencing the vitamin D status of 10-
year-old urban South African children. Public Health Nutrition, 14(2), 334–339.
Prentice A, Doherty C, Abrams S, Cox S, Atkinson S, Verhoef H, Drakesmith H. (2012).
Hepcidin is the major predictor of erythrocyte iron incorporation in anemic African children.
Blood, 119(8), 1922–1928.
Rodriguez M, Daniels B, Gunawardene S, and Robbins G. (2009). High frequency of vitamin
D deficiency in ambulatory HIV-Positive patients. AIDS Res Hum Retroviruses, 25(1), 9–14.
Rodríguez-rodríguez E, Navia B, López-sobaler A, and Ortega R. (2009). Vitamin D in
Overweight / Obese Women and Its Relationship with Dietetic and Anthropometric
Variables. Obesity, 17(4).
Ross C, Manson J, Abrams S, Aloia J, Brannon P, et al. (2011). The 2011 Report on Dietary
Reference Intakes for Calcium and Vitamin D from the Institute of Medicine: What
Clinicians Need to Know. Journal of Clinical Endocrinol Metabolism, 96: 53–58, 2011.
Santoro D, Caccamo D, Lucisano S, Buemi M, Sebekova K, Teta D, and De Nicola L.
(2015). Interplay of Vitamin D, erythropoiesis, and the renin-angiotensin system. BioMed
Research International, 2015(11).
Sazawal S, Black R, Ramsan M, Chwaya H, Stoltzfus R, Dutta A, Kabole F. (2006). Effect of
routine prophylactic supplementation with iron and folic acid on admission to hospital and
mortality in preschool children in a high malaria transmission setting: community based,
randomised, placebo-controlled trial. The Lancet, 367(9505, 14–20 January), 133–143.

60
Sazawal S, Black R, Ramsan M, Chwaya H, Stoltzfus R, Dutta A. (2001). Effects of routine
prophylactic supplementation with iron and folic acid on admission to hospital and mortality
in preschool children in a high malaria transmission setting : community-based , randomised ,
placebo-controlled trial, Lancet 2006; 367: 133–143.
Schwartz J, Gallagher C, Jorde R, Berg V, Walsh J et al. (2018). Determination of free
25(OH)D concentrations and their relationships to total 25(OH)D in multiple clinical
populations. Journal of Clinical Endocrinol Metabolism.
Scott J, Bauni E, Moisi J, Ojal J, Gatakaa H, Nyundo C, Williams T. (2012). Profile: The
Kilifi health and demographic surveillance system (KHDSS). International Journal of
Epidemiology, 41(3), 650–657.
Shea M, Booth S, Massaro J, Jacques P, D‘Agostino R, Dawson-Hughes B, and Benjamin E.
(2008). Vitamin K and vitamin D status: Associations with inflammatory markers in the
Framingham offspring study. American Journal of Epidemiology, 167(3), 313–320.
Silva G, Elena C, Carneiro F, and Veiga J. (2014). Effect of systemic inflammation on level
of ferritin seminal in chronic renal male patient undergoing hemodialysis. International
Archives of Medicine, 7, 23.
Sim J, Lac P, Liu I, Meguerditchian S, Kumar V, Kujubu D, and Rasgon S. (2010). Vitamin
D deficiency and anemia: A cross-sectional study. Annals of Hematology, 89(5), 447–452.
Smith E, Alvarez J, Kearns M, Hao L, Sloan J, Konrad R, Tangpricha V. (2016). High-dose
vitamin D3 reduces circulating hepcidin concentrations: A pilot, randomized, double-blind,
placebo-controlled trial in healthy adults. Clinical Nutrition, 6–11.
Smith E, Alvarez J, Martin G, Zughaier S, Ziegler T, and Tangpricha V. (2015). Vitamin D
deficiency is associated with anaemia among African Americans in a US cohort. British
Journal of Nutrition, 113, 1732–1740.
sTfR Human ELISA (soluble Transferrin Receptor) | BioVendor.com - BioVendor. (2018).
Retrieved from https://www.biovendor.com/sTfR-human-elisa-soluble-transferrin-receptor
Sudfeld C, Duggan C, Aboud S, Kupka R, Manji K, Kisenge R, and Fawzi W. (2015).
Vitamin D Status Is Associated with Mortality, Morbidity, and Growth Failure among a
Prospective Cohort of HIV-Infected and HIV-Exposed Tanzanian Infants. The Journal of
Nutrition, 1 – 3, 121–127.
Sudfeld C, Giovannucci E, Isanaka S, Aboud S, Mugusi F, Wang M, Fawzi W. (2013).
Vitamin D Status and Incidence of Pulmonary Tuberculosis , Opportunistic Infections , and
Wasting Among HIV-Infected Tanzanian Adults Initiating Antiretroviral Therapy. The
Journal of Infectious Diseases, 207, 378–385.
Tao R, Zhou Q, Xu Z, Hao J, Huang K, Mou Z, Zhu P. (2015). Inverse correlation between
vitamin D and C-reactive protein in newborns. Nutrients, 7(11), 9218–9228.
Thomas C, Guillet R, Queenan R, Cooper E, Kent T, Pressman E, O‘Brien K. (2015).
Vitamin D status is inversely associated with anemia and serum erythropoietin during
pregnancy. American Journal of Clinical Nutrition, 102:1088–95.

61
Toko E, Sumba O, Daud I, Ogolla S, Majiwa M, Krisher J, Mehta S. (2016). Maternal
vitamin D status and adverse birth outcomes in children from Rural Western Kenya.
Nutrients, 8(12), 1–11.
Wakayo T, Belachew T, Vatanparast H, and Whiting S. (2015). Vitamin D deficiency and its
predictors in a country with thirteen months of sunshine: The case of school children in
Central Ethiopia. PLoS ONE, 10(3), 1–14.
Wang T, Nestel F, Bourdeau V, Nagai Y, Wang Q, Liao J, Nestel F. (2017). Inducer of
Antimicrobial Peptide Gene Expression 1. The Journal of Immunology, 173:2909-2912.
Weight-for-age Child growth standards. (2018). Retrieved from
http://www.who.int/childgrowth/standards/en/
White J. (2008). Vitamin D Signaling, Infectious Diseases, and Regulation of Innate
Immunity. Infection and Immunity, 76(9), 3837–3843.
Wilkinson R, Llewelyn M, Toossi Z, Patel P, Pasvol G, Lalvani A, Davidson R. (2000).
Influence of vitamin D deficiency and vitamin D receptor polymorphisms on tuberculosis
among Gujarati Asians in west London: a case-control study. Lancet, 355(9204), 618–621.
World Health Organization. (2009). Infant and young child feeding: Model Chapter for
textbooks for medical students and allied health professionals. World Health Organization.
World Health Organization. (2015). World Malaria Report 2015. World Health, 243. 32
Yakoob M, Salam R, Khan F and Bhutta Z. (2016). Vitamin D supplementation for
preventing infections in children under five years of age (Review), (11). Art. No.: CD008824.
Yamamoto K, Iwagami M, Seki T, Kano S, Ota N, and Ato M. (2017). Parasitology
International Dual antiplasmodial activity of vitamin D3 and its analog, 22-oxacalcitriol, by
direct and indirect mechanisms. Parisotology International, 66, 89–99.
Zhu Z, Zhan J, Shao J, Chen W, Chen L, Li W, Zhao Z. (2012). High prevalence of vitamin
D deficiency among children aged 1 month to 16 years in Hangzhou, China. BMC Public
Health, 12(1), 126.
Zughaier S, Alvarez J, Sloan J, Konrad R, and Tangpricha V. (2014). The role of vitamin D
in regulating the iron-hepcidin-ferroportin axis in monocytes. Journal of Clinical and
Translational Endocrinology, 1(1): 19–25.

62
APPENDIX 1: Map of Kenya showing Kilifi County and Kilifi Demographic and
Health Survey (KHDSS)

63
APPENDIX 2: KEMRI/SERU Ethical Approval