role of wettability in fuel cells - opencommons@uconn
TRANSCRIPT

University of ConnecticutOpenCommons@UConn
Doctoral Dissertations University of Connecticut Graduate School
12-16-2016
Role of Wettability in Fuel CellsJaehyung ParkUniversity of Connecticut - Storrs, [email protected]
Follow this and additional works at: https://opencommons.uconn.edu/dissertations
Recommended CitationPark, Jaehyung, "Role of Wettability in Fuel Cells" (2016). Doctoral Dissertations. 1314.https://opencommons.uconn.edu/dissertations/1314

Role of Wettability in Fuel Cells
Jaehyung Park, PhD
University of Connecticut, [2016]
Fuel cells have received significant attention as a promising candidate for efficient
and emission-free power in automotive, stationary, and portable applications. This work is
focused on sophisticated schemes for surface wettability impact on fuel cell performance
are required by using proper wettability characteristics for the fuel cell components.
Foreign cations are shown to cause mass transport losses, in particular due to
wettability changes in the gas diffusion media (GDM) and have a major impact on the
durability and the performance of polymer electrolyte fuel cell (PEFC). The effects of
cationic impurities on fuel cell system performance, especially on the water management
has been studied by employing in-situ and ex-situ contamination methods. Changes in the
wettability of the GDM surface following the in-situ contamination injection were
quantified using a force tensiometer employing the Wilhelmy plate method. Identification
and mitigation of adverse effects of cationic airborne contaminants on fuel cell system
performance and durability has been studied and effective recovery methods are proposed.
A new membrane electrode assembly (MEA) concept is introduced, where the
carbon paper substrate is eliminated and the entire GDM consists of only the micro-porous
layer (MPL) directly applied on the catalyst coated membrane (CCM). Spray deposition
with a heated plate is used to fabricate the MPL directly onto both sides of the catalyst

coated membrane (CCM), simplifying the fabrication and assembly, and results in a more
robust interface between the MPL and the catalyst layer. The new MEA structure provides
superior pathways for gas transport and water evacuation, reduces flooding at high current
densities, and results in a stable voltage at higher current densities by improving mass
transport.
Wilhelmy balance in a force tensiometer was successfully applied to study the
wetting property of an electrode matrix in the electrolyte of molten carbonate fuel cells
(MCFCs). MCFCs are high-temperature fuel cells that use a molten carbonate salt mixture
as an electrolyte integrated in a porous ceramic matrix. The performance of MCFC highly
depends on the surface tension of the molten carbonate and the contact angle with the
electrolyte matrix in the solution. A new formulation based on the Wilhelmy force balance
equation is developed to determine the contact angle for samples with irregular shapes.
Jaehyung Park – University of Connecticut, [2016]

i
Role of Wettability in Fuel Cells
Jaehyung Park
B.S., Illinois Institute of Technology, 2008
M.S., North Carolina State University, 2011
A Dissertation
Submitted in Partial Fulfillment of the
Requirements for the Degree of
Doctor of Philosophy
at the
University of Connecticut
[2016]

ii
Copyright
Jaehyung Park
[2016]

iii
APPROVAL PAGE
Doctor of Philosophy Dissertation
Role of Wettability in Fuel Cells
Presented by
Jaehyung Park, B.S., M.S.
Major Advisor
___________________________________________________________________
Ugur Pasaogullari
Associate Advisor
___________________________________________________________________
Prabhakar Singh
Associate Advisor
___________________________________________________________________
Michael Pettes
Associate Advisor
___________________________________________________________________
Brice Cassenti
Associate Advisor
___________________________________________________________________
Trent Molter
University of Connecticut
[2016]

iv
ACKNOWLEDGMENTS
Foremost, I would like to thank my advisor, Dr. Ugur Pasaogullari, for all the
support and encouragement during my PhD study. I am grateful for his kind advice not
only in academic research knowledge, but proper research attitude and responsibility for
my future career as electrochemical/mechanical engineering professional. He gave me
perceptive and brilliant ideas to help me solve many challenging research problems. His
great advice has inspired me to creative thinking for my research and life. I could not have
imagined having my PhD without his valuable support and advice. I thank him for
providing me with a great opportunity to work with a talented team at the Center for Clean
Energy Engineering.
I would like to thank my thesis committee members for all of their time, dedication
and guidance: Drs. Prabhakar Singh, Michael Pettes, Brice Cassenti and Trent Molter. I
would especially like to thank Mr. Leonard Bonville for ingenious instructions and advice
on my research and publications with extensive knowledge and professional experiences
in the fuel cell. I want to express my thanks to group members: Aman, Charlie, Ozan, Eric,
Selvarani, Xiaofeng and Jing. We had many exciting discussions and great works as a team,
helping each other in times of need, which made the research progress more enjoyable. I
wish to thank all staff members of the C2E2. Peter, Garry and Mark helped me to use fuel
cell test and material analysis equipment in good condition and to solve lab safety issues
that I faced. I would also like to thank Sheila, Terry, Amy, and Raelene for their friendly
administrative assistance.

v
Lastly, I especially want to give my sincere thanks to my parent for their endless
love and support throughout my life. I have never felt so grateful to my parents for their
love. I am deeply grateful to Soyeon for all her support and understanding what made this
journey possible. I never would have made it without her precious love.
vi
CONTENTS
LIST OF FIGURES ......................................................................................................... ix
LIST OF TABLES .......................................................................................................... xv
CHAPTER 1. INTRODUCTION ................................................................................ 1
1.1. Background of fuel cells ...................................................................................... 1
1.2. Polymer electrolyte fuel cells ............................................................................... 3
1.2.1. Membranes .................................................................................................... 7
1.2.2. Catalyst layers ............................................................................................... 9
1.2.3. Gas diffusion media .................................................................................... 11
1.3. Durability issues of PEFCs ................................................................................ 13
1.4. Fuel cell contamination and mitigation .............................................................. 16
1.5. High temperature fuel cells ................................................................................ 18
1.6. Effect of wettability in fuel cell components ..................................................... 20
1.7. Thesis overview.................................................................................................. 22
CHAPTER 2. METHODOLOGY FOR WETTABILITY CHARACTERIZATION
OF POROUS STRUCTURE IN POLYMER ELECTROLYTE FUEL CELLS:
WILHELMY PLATE METHOD .................................................................................. 24
2.1. Introduction ........................................................................................................ 24
2.2. Experimental ...................................................................................................... 26
2.3. Results and discussion ........................................................................................ 28
2.3.1. Wilhelmy force equation............................................................................. 28
2.3.2. Wilhelmy plate method for measuring the contact angles .......................... 30
2.4. Summary and conclusions .................................................................................. 34
CHAPTER 3. CHANGES IN WETTABILITY OF POLYMER ELECTROLYTE
FUEL CELLS COMPONENTS DURING CATIONIC CONTAMINATION AND
MITIGATION ................................................................................................................. 36
3.1. Introduction ........................................................................................................ 36
3.2. Experimental ...................................................................................................... 39
3.2.1. Cell assembly .............................................................................................. 39

vii
3.2.2. Fuel cell performance and diagnostic measurement ................................... 43
3.2.3. Contamination method ................................................................................ 46
3.2.4. Mitigation .................................................................................................... 49
3.2.5. Wettability measurement of the carbon paper substrate/MPL during
contamination and mitigation .................................................................................... 52
3.3. Results and discussion ........................................................................................ 52
3.3.1. Fuel cell contamination during the in-situ contaminant injection .............. 52
3.3.2. Mitigation method for cationic contaminated MEA ................................... 54
3.3.3. Wettability characterizations during contamination and mitigation ........... 70
3.4. Summary and conclusions .................................................................................. 81
CHAPTER 4. A NOVEL MEA STRUCTURE FOR POLYMER ELECTROLYTE
FUEL CELLS OPERATING AT VERY HIGH POWER DENSITY ....................... 84
4.1. Introduction ........................................................................................................ 84
4.2. Experimental ...................................................................................................... 89
4.2.1. Preparation of MPL ink .............................................................................. 89
4.2.2. MPL ink deposition onto the CCM ............................................................. 90
4.2.3. Characterization .......................................................................................... 94
4.2.4. Cell performance test .................................................................................. 96
4.3. Results and discussion ........................................................................................ 98
4.3.1. Microstructure of the MPL and the interface .............................................. 99
4.3.2. Optimization of the MPL porosity ............................................................ 101
4.3.3. Wettability measurement .......................................................................... 104
4.3.4. Ion exchange capacity ............................................................................... 106
4.3.5. Performance .............................................................................................. 107
4.4. Summary and conclusions ................................................................................ 109
CHAPTER 5. WETTING PROPERTIES OF THE ELECTROLYTE MATRIX
OF MOLTEN CARBONATE FUEL CELLS ............................................................ 111
5.1. Introduction ...................................................................................................... 111
5.2. Experimental .................................................................................................... 112
5.3. Results and discussion ...................................................................................... 118
5.3.1. Wilhelmy plate method ............................................................................. 118

viii
5.3.2. Washburn method ..................................................................................... 124
5.4. Summary and Conclusions ............................................................................... 131
CHAPTER 6. WETTABILITY MEASUREMENTS OF IRREGULAR SHAPES
WITH WILHELMY PLATE METHOD ................................................................... 133
6.1. Introduction ...................................................................................................... 133
6.2. Advanced Wilhelmy plate method ................................................................... 136
6.3. Experimental .................................................................................................... 140
6.4. Results and discussion ...................................................................................... 141
6.4.1. Square-shaped samples ............................................................................. 141
6.4.2. Triangle-shaped samples ........................................................................... 145
6.4.3. Irregular-shaped samples .......................................................................... 151
6.5. Summary and Conclusions ............................................................................... 158
CHAPTER 7. CONCLUSION AND FUTURE WORKS .................................... 160
7.1. Contamination and mitigation .......................................................................... 160
7.2. MEA structure .................................................................................................. 162
7.3. Wettability of electrolyte matrix in MCFCs .................................................... 164
7.4. Advanced Wilhelmy plate method ................................................................... 164
REFERENCES .............................................................................................................. 166

ix
LIST OF FIGURES
Figure 1.1 Schematic of chemical reaction in the PEFC, reprint from [5]. ........................ 4
Figure 1.2 Typical polarization curve for the fuel cell with i) activation loss, ii) ohmic
loss, iii) mass transport loss and iv) species crossover and internal currents. .................... 6
Figure 1.3 PEFC single cell hardware and fuel cell components. ..................................... 7
Figure 1.4 Chemical structure of Nafion membrane, reproduced with permission from
[9]. ....................................................................................................................................... 9
Figure 1.5 Schematic view of transport protons, electrons and reactant in the cathode
electrode of PEFCs, reprint from [21]. ............................................................................. 11
Figure 1.6 SEM images of Freudenberg C4 GDM; surface views of the carbon paper
substrate (left) and the MPL (right). ................................................................................. 13
Figure 1.7 Membrane degradation mechanisms in the PEFC operation, reprint from [29].
........................................................................................................................................... 14
Figure 1.8 Tafel plots for slow and fast electrochemical reactions, reproduced with
permission from [1]........................................................................................................... 20
Figure 2.1 Cross-section scanning electron micrograph of the carbon paper substrate with
the MPL (Freudenberg C4 GDM)..................................................................................... 25
Figure 2.2 Krüss K100 tensiometer. ................................................................................. 27
Figure 2.3 Sample preparation for measuring the wetting force of the carbon paper
substrate/MPL surface in the force tensiometer. ............................................................... 28
Figure 2.4 Wetting processes of Wilhelmy plate method for the dynamic contact angle
measurement while measuring the force on the as-received carbon paper (CP) substrate
and MPL in water.............................................................................................................. 32
Figure 2.5 The rate of water absorption into the pores of carbon substrate (sample cross-
sectional area: 4.42 mm2). ................................................................................................. 34
Figure 3.1 GORE® PRIMEA® CCM with Pt loading of 0.4 mg/cm2 on both sides ....... 40

x
Figure 3.2 MEA assembly with skived Teflon® gaskets. ................................................ 41
Figure 3.3 Cathode (left) and anode (right) end plates with gas feeding ports. ................ 42
Figure 3.4 Cathode (left) and anode (right) flow fields. ................................................... 42
Figure 3.5 Fuel cell test system: Teledyne/Scribner associates model 890CL. ................ 44
Figure 3.6 Solartron analytical 1287 potentiostat/galvanostat. ......................................... 46
Figure 3.7 High resolution HPLC pump. .......................................................................... 47
Figure 3.8 Assembly of the nebulizer and Swagelok tube fittings. .................................. 48
Figure 3.9 Schematic of experiment setup for ex-situ cleaning by acid flush. ................. 50
Figure 3.10 Photographs of salt deposits on (a) flow field and (b) carbon paper substrate
surface after the in-situ contaminant injection into the cathode. ...................................... 54
Figure 3.11. (a) Comparison between a baseline polarization curve and others obtained
after the CaSO4 exposure (24 h soak duration) and operation at the low cell voltage after
contaminant exposure. Operating conditions: 80°C, A/C: 100/75% RH, 2/2 stoic, 0/0
psig, 200/200 sccm minimum flow; (b) Subsequent transient cell performance at constant
current at 100 mA/cm2, i.e. between polarization curves (2) and (3). Operating
conditions: 80˚C, A/C: 25/125% RH, 1.75/1.66 slpm H2/Air, 1.5/15 psig. ...................... 56
Figure 3.12 CaSO4 salt deposits on cathode carbon paper substrate (top) and cathode
bipolar plate (bottom) before and after the ex-situ exposure of 100 mM H2SO4. ............ 58
Figure 3.13 Polarization curves obtained during and after different in situ contamination
and ex-situ cleaning. Operating conditions: 80˚C, A/C: 100/75% RH, 2/2 stoic, 0/0 psig,
200/200 sccm minimum flow. .......................................................................................... 59
Figure 3.14 Scanning electron microscopy and energy dispersive x-ray spectroscopy
images of the contaminated MEA cross sections after recovery with the acid cleaning
solution, corresponding sulfur S (purple) and calcium Ca (green) maps. ........................ 60
Figure 3.15 Comparative polarization curves for CCM that contaminated in a solution of
0.9 mM CaSO4 and 29.1 mM H2SO4 and various steps of analysis and treatment.
Operating conditions: 80C, relative humidity anode/cathode: 100/75%, no back
pressures, 2/2 stoichiometry.............................................................................................. 62

xi
Figure 3.16 Recovery from Ca2+ contamination using in-situ acid solution and wetting
agent injection. .................................................................................................................. 64
Figure 3.17 Polarization curves obtained during and after the transient recovery test. Cell
temperature: 80˚C; A/C: 100/75% RH; 0/0 psig; 2/2 stoic. .............................................. 66
Figure 3.18 Ion exchange capacity of the catalyst coated membrane obtained in the virgin
CCM, after the ex-situ contamination method and after the in-situ recovery injection test.
........................................................................................................................................... 66
Figure 3.19 Cathode CV curves obtained during and after the transient recovery injection
test. Scan rate: 20mV/s; cell temperature: 25˚C, A/C: 100/100% RH; 0/0 psig; flow rate:
0.25/0.25slpm. ................................................................................................................... 67
Figure 3.20 Cell voltage and resistance during constant current hold (400mA/cm2) after
the MEA contaminated ex-situ Ca2+ solution with 15% IPA and 15% IPA only. Cell
temperature: 80˚C; anode/cathode relative humidity: 25%/125%; flow rate:
1.75/1.66slpm; back-pressure: 1.5/15psig. ....................................................................... 69
Figure 3.21 In-situ 15% IPA injection during recovery process at different operating
conditions, 400 mA/cm2 and OCV. Cell temperature: 80˚C; anode/cathode relative
humidity: 25%/125%; flow rate: 1.75/1.66slpm; back-pressure: 1.5/15psig. ................... 70
Figure 3.22 Carbon paper substrate wetting force changes after CaSO4 injection testing
into the cathode (100hr run): in-situ contamination. ........................................................ 72
Figure 3.23 Wetting force traces plotted against immersion depth during cleaning steps
(soaking in ultrasonic water bath and stirring in 1M H2SO4) to remove the salt deposits of
the cathode carbon paper substrate near the gas exit. ....................................................... 74
Figure 3.24 SEM surface images of cathode carbon paper substrate (a) after the CaSO4
injection testing and (a) after the ex-situ acid cleaning. ................................................... 75
Figure 3.25 Wetting force-immersing position curve in the submersion cycle for
determining the wetting properties in pure water of as-received, DI water soaked and
CaSO4 solution soaked carbon paper substrate at 80°C for 100 hours (ex-situ
contamination). ................................................................................................................. 76
Figure 3.26 Secondary electron image and the EDX map for the cation contaminant
soaked carbon paper substrate surface. ............................................................................. 78

xii
Figure 3.27 Wetting force versus submersion position from the force tensiometer
measurement on the carbon paper substrate and the MPL with DI water and 15% IPA at
room temperature, and 15%IPA at 80˚C. .......................................................................... 80
Figure 4.1 Schematic of the MPL/CL interfacial contact; (a) MPL is separately fabricated
(conventional method) and (b) MPL is directly deposited on the CL (new method). ...... 88
Figure 4.2 Spray station setup for the MPL application with (a) a numerically-controlled
spray booth, (b) a nitrogen‐driven spray gun with a CCM frame, and (c) a vertical steel
plate with a heating lamp. ................................................................................................. 92
Figure 4.3 MPL solution spraying cycles; total cycles: 2 horizontal + 2 vertical + 2
horizontal + 2 vertical. ...................................................................................................... 93
Figure 4.4 Sample preparation for measuring the wetting force of the MPL surface in the
force tensiometer. .............................................................................................................. 95
Figure 4.5 CCM sample is placed in the epoxy stub. ....................................................... 96
Figure 4.6 Schematic of cell configurations; (a) carbon paper substrate/CCM with
conventional single serpentine channels, (b) new MEA with conventional single
serpentine channels, and (c) new MEA with micro-channels. .......................................... 97
Figure 4.7 Melting point verification test for hydrophobic materials in the hot pressing for
1 hour at 160°C; (a) PVDF copolymer, (b) PVDF homopolymer, and (c) PTFE. ........... 99
Figure 4.8 SEM micrographs of interface between the catalyst layer and the deposited
MPL (blue arrows indicate the interface): (a) anode and (b) cathode. ........................... 100
Figure 4.9 EDX element mapping of the CCM with MPL on both sides: (a) Pt and (b) F.
......................................................................................................................................... 101
Figure 4.10 SEM cross-sectional views of MPL pore structure of (a) Freudenberg C4, (b)
SGL 25BC, and (c) current work. ................................................................................... 102
Figure 4.11 Pore size distribution of the carbon MPL ink with 10, 30 and 50%wt PVDF,
Freudenberg C4 and SGL 25BC. .................................................................................... 103
Figure 4.12 The wetting force versus position from the tensiometer force measurement on
the fabricated MPL (30 wt% PVDF) in the new MEA and the commercial MPL
(Freudenberg C4) with DI water. .................................................................................... 106

xiii
Figure 4.13 Ion exchange capacity values for the fresh CCM and the MPL deposited
CCM on both sides after the heat treatment. ................................................................... 107
Figure 4.14 Comparison of polarization curves of two difference MPL thickness onto
commercial CCM and the conventional cell; cell temperature: 80°C; relative humidity
(A/C): 100/100%; flow rate (A/C): 1/1 slpm; back-pressure (A/C): 10/10 psig. ........... 109
Figure 5.1 Schematic diagram of the wetting force measurement system and gas flow
direction. ......................................................................................................................... 113
Figure 5.2 Experimental setup of (a) gas flow controller and (b) saturator to evaluate the
electrode wetting property in oxidant and reducing atmospheres as the MCFC working
condition. ........................................................................................................................ 114
Figure 5.3 Fabrication procedure of the aluminum heated vessel. ................................. 115
Figure 5.4 (a) Original sample holder and (b) new design of the sample holder for the
force tensiometer. ............................................................................................................ 116
Figure 5.5 New design of gas phase regulating coat to insert gas mixture for the contact
angle measurement; (a) design concept of the new gas hood, (b) customized Pyrex glass
and steel cover, and (c) gas hood installation in the tensoimeter. ................................... 118
Figure 5.6 Wetting processes of Wilhelmy plate method for the dynamic contact angle
measurement while measuring the force on the gold foil in the molten carbonate at
reducing atmosphere (4% H2 + 96% N2, 3% humidified) and the heated vessel of 650°C.
......................................................................................................................................... 122
Figure 5.7 (a) Standard (500°C for 2 hours) and (b) extended (650°C for 150 hours)
burnout matrix samples after dipping into the molten carbonate salt at 600°C. ............. 123
Figure 5.8 Wetting force against immersion depth for the FCE matrix samples in the
molten carbonate at 4% H2+10% CO2+86% N2 (3% humidified) and 600°C................ 124
Figure 5.9 Schematic of the electrolyte rise into pores of the matrix by capillary action.
......................................................................................................................................... 124
Figure 5.10 Ethanol uptake in the fresh extended burnout matrix. ................................. 127
Figure 5.11 The rate of liquid electrolyte absorption into the pores of matrix (fresh and
used samples) in the gas mixture ((a) 4% H2 + 96% N2, 9% humidified, (b) 4% H2 +
10% CO2 + 86% N2, 9% humidified, and (c) 19.1% CO2 + 12.5% O2 + 68.4% N2, 3%
humidified) at the electrolyte temperature of 600°C. ..................................................... 130

xiv
Figure 6.1 Determination process of volume and wetted length at each measuring point
for the PTFE plate based on the equilateral triangle shape; (a) the perimeter decreases
during immerging to the liquid, (b) the perimeter increases during immersing to the
liquid. .............................................................................................................................. 139
Figure 6.2 Preparation of PTFE samples (a) long edge trapezoid, (b) short edge trapezoid
and (c) random cut shapes............................................................................................... 140
Figure 6.3 Wetting force and contact angle traces plotted against immersion depth for the
square-shape PTFE plate (20×20 mm) in water. ............................................................ 143
Figure 6.4 (a) Wetting forces and (b) contact angles-immersing position curve of the
trapezoid-shape with the long edge immersing first, and (c) wetting forces and (d) contact
angles-immersing position curve of the trapezoid-shape with the short edge immersing
first for determining the wetting properties in pure water. ............................................. 148
Figure 6.5 Conversion of color pictures of four PTFE samples into black/white images
using ImageJ. .................................................................................................................. 152
Figure 6.6 Profile plot of each sample from the average pixel value by setting the image
scale with known bottom length. .................................................................................... 154
Figure 6.7 Calculation formulas of the segment volume of the irregular-shape PTFE plate
at each measuring point for the force tensiometer. ......................................................... 156
Figure 6.8 Wetting force and contact angle changes versus position from the Wilhelmy
plate method for the irregular-shape PTFE plates (shape 1-4) in water. ........................ 158

xv
LIST OF TABLES
Table 1.1 Characteristics of different types of fuel cells, reprint from [1]. ........................ 2
Table 3.1 The contact angles on the carbon paper substrate surfaces after the in-situ
injection test of the contaminant solution and DI water for 100 hours. ............................ 72
Table 3.2 The contact angles of water on the carbon paper substrate surfaces after the ex-
situ soaking in DI water and the cation contaminant solution. ......................................... 77
Table 3.3 The calculated advancing and receding contact angles of the liquid on the
carbon paper substrate and the MPL surfaces. .................................................................. 81
Table 5.1 List of the test sample. .................................................................................... 120
Table 5.2 List of gas mixture. ......................................................................................... 120
Table 5.3 List of Ethanol properties of at 20°C. ............................................................. 127
Table 5.4 Molten carbonate properties of at 600°C [129]. ............................................. 130
Table 5.5 Calculation of slope of the electrolyte update and contact angles. ................. 131
Table 6.1 Contact angle calculation of the trapezoid-shape with the long edge immersing
first. ................................................................................................................................. 149
Table 6.2 Contact angle calculation of the trapezoid-shape with the short edge immersing
first. ................................................................................................................................. 150

1
CHAPTER 1. INTRODUCTION
1.1. Background of fuel cells
The competition for scarce energy resources and the need for greater energy
efficiency are critical considerations for industrial development and economic growth. The
use of fossil fuels for generating electrical power is causing serious environmental
problems such as air pollution and global warming. There is a growing desire to replace
fossil fuels with clean energy sources, including solar power, bio-energy, wind energy and
hydrogen energy. Among these alternative power sources, fuel cells have received
significant attention as a promising candidate for efficient and emission-free power in
automotive, stationary, and portable applications [1–3].
Fuel cells are electrochemical energy conversion devices in which chemical energy
is converted into electrical energy through a chemical reaction between a fuel and oxygen.
Fuel cells provide significant benefits over internal combustion engines, especially in terms
of energy conversion efficiency. The most efficient automotive combustion systems yield
a fuel-to-electricity efficiency of about 25-35%. However, typical fuel cells provide about
40-60% efficiency, because they convert chemical energy directly into electricity without
incurring the various losses associated with combustion processes. Fuel cell systems can
even achieve efficiencies of over 85% with cogeneration using the generated waste heat
[4]. Moreover, fuel cells operating on pure hydrogen are emission-free because they emit
only water as the byproduct. Fuel cells are classified primarily by the type of electrolyte

2
material as polymer electrolyte membrane or polymer electrolyte fuel cells (PEFCs), direct
methanol fuel cells (DMFCs), solid oxide fuel cells (SOFCs), phosphoric acid fuel cells
(PAFCs), molten carbonate fuel cells (MCFCs), and alkaline fuel cells (AFCs) [1]. Basic
information about different types of fuel cells is given in Table 1.1.
Table 1.1 Characteristics of different types of fuel cells, reprint from [1].
Fuel cell
type
Mobile
ion
Power density
(mW/cm2)
Operating
temperature Applications
AFC OH- 150-140 50-200°C Space and military
vehicles
PEFC H+ 300-1000 30-100°C Vehicles and mobile
applications
DMFC H+ 30-160 20-90°C
Portable electronic
systems, running for long
times
PAFC H+ 150-300 ~220°C Stationary power source
MCFC CO32- 100-300 ~650°C
Medium and large scale
CHP systems
SOFC O2- 250-350 500-1000°C all sizes of CHP systems

3
1.2. Polymer electrolyte fuel cells
Polymer electrolyte fuel cells (PEFC) have the most promising applications as zero-
emission vehicles due to their outstanding features such as high power density, simplicity
of construction, quick start-up, and simple chemical reaction. Low temperature operation
leads to better durability of fuel cell components, resulting in a longer stack life. These
attractive features have elevated PEFCs to be the major focus of automobile companies for
zero-emission vehicles. As shown in Figure 1.1, oxygen or air is supplied to the cathode,
while the fuel, usually in the form of hydrogen, is fed to the anode [5]. The overall reactions
in the fuel cell are:
Anode: 𝐻2 → 2𝐻++2𝑒−
Cathode: 2𝐻+ +1
2𝑂2 + 2𝑒− → 𝐻2𝑂
Overall reaction: 𝐻2 +1
2𝑂2 → 𝐻2𝑂 + energy (heat)
Hydrogen entering the anode is separated into protons and electrons at the anode
platinum catalyst. The protons pass directly through the electrolyte from the anode to the
cathode, whereas the electrons travel through the external load, thereby generating
electrical power, before returning to the cathode. The protons and electrons recombine with
oxygen at the cathode to produce water and waste heat. However, a noble-metal catalyst
(usually Pt) is required to promote electrochemical reactions in the electrode at low
temperatures, which is one of the main causes of the high manufacturing cost. It is
necessary to add an extra additional reactor to reduce undesirable impurities of a
hydrocarbon fuel because the platinum catalyst is highly sensitive to carbon monoxide (CO)

4
poisoning even 30 ppm level of CO can cause significant drops in output cell voltage about
50% [6].
Figure 1.1 Schematic of chemical reaction in the PEFC, reprint from [5].
Figure 1.2 is an illustration of a typical single cell performance for the hydrogen-
air fuel cell operating at about 80°C and normal air pressure, showing four regions of major
irreversibility. Activation losses (region I) are dominated by the activation overpotentials
of electrochemical reactions at the electrodes, which result in severe voltage losses at the
initial performance stage. These reaction rate losses are mainly related to the reaction
activity of the catalyst material and microstructure, and the reactant utilization at the
expense of forcing the chemical reaction to completion. The losses in region II are the

5
ohmic polarization caused by ionic conduction losses in the electrolyte and catalyst layers,
as well as electron resistance of cell interconnects, contact resistance between cell
components, the material resistance of electrodes and the porous GDM. This voltage drop
of ohmic losses is linearly proportional to the current density. Mass transport losses
(concentration losses, region III) are a result of finite mass transport limitations of the
reactants to the electrodes mainly due to concentration reduction of the reactant in the
electrode. The presence of excessive liquid water in pores of catalyst layers and carbon
papers causes a sharp drop in the output voltage at high current densities. The generated
water occupies the active catalyst zones and hinders the oxygen transport to the reaction
site. Therefore, the effective water management is necessary to minimize mass transport
losses at high current densities. The losses in region IV represent the waste of fuel passing
and internal currents from undesired species crossover and electron leakage though the
electrolyte on the open circuit voltage (OCV) [1].

6
Figure 1.2 Typical polarization curve for the fuel cell with i) activation loss, ii) ohmic loss,
iii) mass transport loss and iv) species crossover and internal currents.
Components of a single cell PEFC hardware is given in Figure 1.3. The cell
hardware unit incorporates a membrane electrode assembly (MEA) which is comprised of
the anode-electrolyte-cathode sandwiched between two gas diffusion media (GDM),
gaskets, metal end plate and bipolar plates. The bipolar plates, which is made of metal,
carbon or composites, serve as the current collector between cells and incorporate gas
supply channels to distribute reactants uniformly over the active areas. These plates also
provide mechanical strength to the cell stack and facilitate heat management through high
thermal conductivity [7]. The relatively high material and manufacturing cost of PEFC

7
stacks has restricted their commercialization in vehicles. Moreover, the durability of fuel
cell components has been the focus of many researchers, who have addressed membrane
preparation and modification, degradation of MEAs, developed chemical degradation
models, and catalyst layer designs [8].
Figure 1.3 PEFC single cell hardware and fuel cell components.
1.2.1. Membranes
One of the critical components of PEFC is the proton exchange membrane (PEM)
which separates the anode from the cathode. The membrane must provide high ionic
conductivity, while acting as an electronic insulator. Other requirements for PEMs are
mechanical, chemical and thermal stability, dimensional stability, and low fuel crossover
permeability. For several decades, Nafion (DuPont de Nemours) has been the material of
choice for proton exchange membranes, which is a polymer belonging to the class of

8
perfluorosulfonic acids (PFSA). Figure 1.4 shows a chemical structure of Nafion [9].
Nafion has been widely used because of its excellent proton conductivity and
electrochemical stability due to a sulfonated polyether chain on a PTFE backbone. The
fluorinated backbone of the polymer provides the membrane to have exceptional chemical
resistance and mechanical stability in the fuel cell operating conditions [10].
Perfluorosulfonic acid (PFSA) polymer electrolytes (e.g. Nafion® ) must be well
hydrated to ensure good proton conductivity, it is very important to maintain a high relative
humidity within the cell while simultaneously avoiding flooding of the cell with water.
Insufficient membrane and electrode hydration can result in lower proton conductivity and
apparent high charge transfer resistance. On the other hand, excessive humidity levels can
cause cathode flooding which blocks reactant access to the electrodes, non-uniform
distribution of reactants over the active catalyst area, and poor fuel cell performance
[11,12]. Thus, practical schemes for water management are required. However, the main
disadvantages of Nafion-type MEAs are their high price, high oxygen permeability, and
insufficient durability under various operating conditions. Currently, development of new
membranes for fuel cells is focused on: (i) cost-effective electrolyte materials, (ii) proton-
conducting membranes for high temperature (>120 ºC) and low humidity (<25% relative
humidity) operation, (iii) comprehensive membrane models that address membrane
swelling properties for vapor-liquid transport modes with interfacial water mass-transport
resistance, and (iv) high durability polymeric membranes for dry H2/Air operation at high
temperatures [13]. Although many other candidates have been explored to develop new
proton-conducting materials as a replacement for the Nafion-based membrane, Nafion
membrane is still the most popular membrane in commercially available PEFCs.

9
Figure 1.4 Chemical structure of Nafion membrane, reproduced with permission from
[9].
1.2.2. Catalyst layers
The catalyst layer is composed catalyst support particles, platinum or platinum alloys,
and ionomer of the electrolyte [14]. Figure 1.5 shows transport mechanisms of gases,
protons, and electrons in the cathode electrode. Air is fed to the GDM through flow
channels and oxygen is adsorbed onto the surface of catalyst to give oxygen atoms. The
oxygen is protonated with H+ from the electrolyte and reduced by electrons from the
external load path, and then water is release to the GDM. The electrode kinetic of this
reaction is one of the limiting factors in fuel cell performance. Therefore, the length of
three phase boundaries is critical for efficient performance where catalyst particles,
ionomer and reactant are described in electronic conducting phase, proton conductive
phase and pores for providing transport of gas phase and product, respectively. The catalyst
layer can be attached to either the membrane or the carbon paper substrate; a catalyst coated

10
membrane (CCM) composed of a sandwich structure applying electrodes on both sides of
the membrane or a gas diffusion electrodes (GDE). The catalyst ink is generally applied to
the surface of membrane and carbon paper substrate in solid form (dry spraying and decal
method) and in emulsion form (painting and screen printing of ink, and spreading of pastes)
[15].
The ionomer plays important roles in making transport path of proton as well as
oxygen transport media and a binder to maintain the catalyst layer. However, unexpected
amount of ionomer disturbance reactant gas transport and occupy the catalyst surface at the
flooding condition, resulting in significant mass transport loss. The PEFC has limitations
of type of the catalyst due to its low temperature operating condition. Highly active
precious metals, should be used to the electrode in order to produce sufficient electrode
kinetics. The platinum is widely used as the catalyst material in terms of both activity and
stability, but the high cost of precious metal electrodes is one of main barrier toward
commercialization of the PEFC technology to the excessive production costs of fuel cell
stack. Many research efforts have been focused on reducing platinum loading in the
electrode and develop low cost, durable, high performance electrode using advanced
catalysts such as nanostructured Pt-alloy catalyst and platinum group metal-free catalyst
[16–18]. The platinum loadings in the electrode as low as 0.015 mg/cm2 have been studied
by developing deposition methods to increase the utilization of the platinum and novel
electrode structure designs to provide efficient transport and reduce transport losses in the
issue of electrode flooding [19,20].

11
Figure 1.5 Schematic view of transport protons, electrons and reactant in the cathode
electrode of PEFCs, reprint from [21].
1.2.3. Gas diffusion media
The gas diffusion media (GDM) provides mechanical support to the electrodes and
distributes the reactant gases to them, including thermal insulation of the electrode. The
highly porous substrate is typically comprised of nonwoven carbon paper or woven carbon
cloth with a thickness in the range of 200-400 µm to help diffuse the reactant gases from
the flow fields to the catalyst layer. These highly porous structures are necessary for
improved mass transfer inside the MEA at the cost of decreased electrical conductivity.
The GDM works as an electrical conductor to transport electrons between the electrode
and the current collector of bipolar plates [22].

12
Water management in the cell is significantly influence by the GDM structure and
material allowing an appropriate water amount to the membrane for hydration while
expelling product water from the catalyst layer. In general, a small amount of hydrophobic
material (usually PTFE) is applied to the carbon paper substrate to improve both the
electrical/thermal contact between the carbon paper and the catalyst layers, and the water
management in reduction of flooding effect in the fuel cell. The mixed solution of carbon
powder and hydrophobic material is applied on one side of the carbon paper or cloth. The
MPL helps to remove water from the cathode catalyst layer to the carbon paper substrate
and facilitate water back diffusion to the membrane. The MPL also can reduce a contact
resistance between the catalyst layer and the rough structure of carbon paper by making a
flat and smooth layer [23–26]. Figure 1.6 shows that surface structures of the GDM; carbon
paper substrate and micro porous layer (MPL). Liquid water easily accumulates in the
porous network of the carbon paper substrate and blocks the reactant transport to the
catalyst layer, thus causing mass transport losses. The key to minimizing mass-transport
losses is effective water management in the cell, especially in the carbon paper substrate at
the cathode. Liquid water in macro-pores of the carbon paper substrate decreases the fuel
cell performance at high current density due to reduction in oxygen transport to the catalyst
layer even with the MPL [27]. Therefore, a new MEA configuration needs to develop for
less liquid water accumulation at each interface.

13
Figure 1.6 SEM images of Freudenberg C4 GDM; surface views of the carbon paper
substrate (left) and the MPL (right).
1.3. Durability issues of PEFCs
Another important issue in the development of fuel cells is their insufficient
durability caused by both catalyst and membrane degradation due to the harsh chemical
environment. For fuel cell commercialization, the durability of fuel cell components has
been the focus of many researchers, who have addressed membrane preparation and
modification, degradation of MEAs, developed chemical degradation models, and catalyst
layer designs [28]. A fundamental understanding of degradation mechanisms is critical for
the development of high-durability membranes for long-term performance. Mechanical,
chemical and thermal effects during fuel cell operation are the leading causes of the
membrane degradation due to multiple mechanisms. Figure 1.7 shows the fuel cell
degradation mechanisms in relation to operating conditions and their measurable effects
[29]. Both structural and chemical stability of the membrane are essential for the long-term
performance stability of PEFCs.

14
Figure 1.7 Membrane degradation mechanisms in the PEFC operation, reprint from [29].
PEFCs need to operate under a wide range of conditions, especially in automobiles,
which can have a negative impact on durability and lifetime of the membrane due to
mechanical degradation. It has been found that the early failure of the fuel cell is usually
due to the structural failure of the membranes. Mechanical degradation manifests itself in
the form of pinholes, creep deformation, cracks, and tears in the membrane [30]. Changes
in operating conditions such as temperature and relative humidity cycling can cause

15
cyclical shrinking/swelling of the membrane, resulting in significant mechanical stresses.
Furthermore, exposure to freezing and thawing conditions can also cause additional
stresses and associated degradation. Irregular surface contact pressure between the MEA
and the bipolar plate can also result in high localized stresses leading to the membrane’s
mechanical failure. The development of pinholes and cracks in the membrane causes fuel
crossover from the anode to the cathode, and the crossover rate is exacerbated by a
difference in reactant gas pressure on either side of the membrane. Fuel crossover through
the membrane due to pinholes or tears causes a measurable drop in the OCV. Therefore,
OCV measurement is used as the primary test protocol to monitor the mechanical integrity
of the membrane.
Mechanical stability can be improved by enhancing the mechanical strength by
reinforcing the membranes with fibers. Reinforcement of the membrane with a porous
polyethylene or PTFE material has been reported to enhance the membrane’s dimensional
stability and reduce the shrinkage stress under dry operating conditions [31]. Reinforced
membranes are shown to be more stable, resulting in a smaller decrease in OCV at elevated
temperature and low humidity which results in a longer lifetime.
Chemical stability of the membrane is also critically important to the fuel cell’s
long-term durability. The formation of hydrogen peroxide (H2O2) during operation causes
chemical degradation of the membrane, which can lead to catastrophic failure. Chemical
attack by hydrogen peroxide radical results in a separation of the membrane’s backbone or
side-chain groups, thereby decreasing the membrane’s ionic conductivity and decreasing
fuel cell performance. This peroxide or radical degradation can also lead to the crossover
of oxygen molecules from the cathode side [32]. Chemical degradation of membranes is

16
characterized by the emission rate of fluoride ions and sulfuric acid in the fuel cell exhaust
gas, and by membrane thinning. The three major degradation steps of Nafion-based
membranes are: (i) hydrogen absorption from an acid endgroup resulting in water,
perfluorocarbon radical and carbon dioxide, (ii) the perfluorocarbon radical reacts with the
hydroxy radical to form a chemical intermediate which rearranges to acid fluoride and one
equivalent of hydrogen fluoride (HF), (iii) a second equivalent of HF and another acid
endgroup are produced by hydrolysis of the acid fluoride [33].
𝑅𝑓 − 𝐶𝐹2𝐶𝑂𝑂𝐻 + 𝑂𝐻 → 𝑅𝑓 − 𝐶𝐹2 + 𝐶𝑂2 + 𝐻2𝑂 (i)
𝑅𝑓 − 𝐶𝐹2 + 𝑂𝐻 → 𝑅𝑓 − 𝐶𝐹2𝑂𝐻 → 𝑅𝑓 − 𝐶𝑂𝐹 + 𝐻𝐹 (ii)
𝑅𝑓 − 𝐶𝑂𝐹 + 𝐻2𝑂 → 𝑅𝑓 − 𝐶𝑂𝑂𝐻 + 𝐻𝐹 (iii)
Hydrogenation of CF2 groups with H2 can also cause low chemical stability of the ionomer
in the membrane [34]. Numerous alternative membranes, such as modified PFSA
membranes, non-fluorinated ionomer polymers, polyether sulfone (PES), sulfonated poly-
ether ether ketone (SPEEK), modified poly-benzimidazole (PBI), and modified
polyvinylidenefluoride (PVDF) are being evaluated as alternate candidates based on how
they degrade under typical operating conditions [35,36].
1.4. Fuel cell contamination and mitigation
Contamination in polymer electrolyte fuel cells (PEFCs) is a major cause of severe
cell performance degradation and failure. Fuel impurities (e.g. CH4, CO, CO2, NH3, and
H2S) mainly from H2 production processes, and air pollutants (NOx, SOx, COx, O3, and
organic chemical species) can enter the fuel cell, causing lower performance and reduced
durability. In addition, there are ionic contaminants (Fe3+, Ni2+, Cu2+, and Cr3+) from

17
corrosion of fuel cell stack and balance of plant components, such as bipolar metal plates,
humidifiers, sealing gaskets, gas lines and storage tanks, as well as from roadside
impurities [37–39]. Metal ions (Fe3+/Fe2+) from the fuel cell components decrease
membrane stability due to peroxide radicals formation in the membrane electrode assembly
(MEA) [40].
If foreign cations get into the ionomer, they replace protons attached to the
sulfonate groups, resulting primarily in reduction of proton conductivity, as well as
decreased water content and gas permeation [41]. Cationic contaminants in the membrane
typically accumulate in the cathode due to the potential gradient, which can further cause
membrane dehydration and flooding of the cathode [42,43]. Metal ions from the fuel cell
components are shown to accelerate the decomposition of the membrane due to the
formation of radicals [44], leading to membrane thinning and pin-hole formation.
A severe Pt poisoning of electrodes is strongly affected by carbon monoxide (CO)
contamination in the anode feed stream. The absorption of CO significantly decreases the
activity of the platinum electrocatalyst as a result of limiting the number of catalyst active
sites for the hydrogen oxidation reaction, resulting in lower exchange current [45,46].
Mitigation strategies of the fuel contamination sources have been widely studied; the most
common strategies are air or oxygen bleeding at the anode for CO contamination reduction,
developing CO-tolerant anode catalyst using Pt-Ru alloys, and high-temperature operation
to improve CO tolerance [47–49]. The addition of liquid hydrogen peroxide (H2O2/H2O)
to the anode humidification system improves CO contaminated fuel cell performance in
the form of a heterogeneous decomposition of H2O2 and formation of active oxygen, but
the added hydrogen peroxide can degrade the proton conductivity of ionomer [50]. A

18
reconfigured anode including nonprecious metal-based chemical catalyst layer allows the
effectiveness of air-bleed for CO tolerance to be improved [51]. Several mitigation
strategies for fuel contamination of CO poisoning on Pt electrode catalysts are widely
investigated. However, the mitigation for air-side contaminants has not been studied well.
1.5. High temperature fuel cells
Fuel cell operating temperatures above 100ºC are highly desirable due to its
significant benefits such as high carbon monoxide (CO) tolerance of the Pt catalyst, faster
electrochemical kinetics, and easier water management. The tolerance of the Pt catalyst to
fuel impurities in reformed fuels is improved at higher operating temperatures. CO
poisoning by adsorption onto the platinum catalyst layer decreases significantly with
increasing temperature [52]. PEFCs operating at high temperatures can accept hydrogen in
the form of reformate more readily without incurring the extra cost of purification.
Integrated subsystems for fuel cell humidification are required to maintain sufficient
hydration levels in the Nafion membrane, which increases system cost and complexity [53].
High temperature PEFCs would be able to accomplish the heat removal with much smaller
radiators, while large radiators and heat exchangers are required to dissipate waste heat to
the environment in low-temperature fuel cell systems [54].
The cathode Pt activity is an important factor in improving the performance at
higher temperature and under low relative humidity conditions. Increasing the operating
temperature of the fuel cell accelerates electrode kinetic rates determined by the oxygen
reduction reaction (ORR) on the Pt electrocatalyst on the cathode side, which significantly
improves the fuel cell performance due decreased activation losses. The presence of

19
adsorbed anions, electric field, and flow rate of reactants are major determinants in the
ORR [55]. The current-overpotential is given by the following equation [56]:
𝐼𝑐 = 𝑖𝑂2
0 (𝑒𝑛𝑎0∙𝑎0∙𝐹𝜂𝑐
𝑅𝑇 − 𝑒𝑛𝑎0∙(1−𝑎0)∙𝐹𝜂𝑐
𝑅𝑇 )
where 𝐼𝑐 is the oxygen reduction reaction current density, 𝐼𝑂2
0 is the exchange current
density, 𝑛𝑎0 is the number of electrons transferred in the rate determining step, 𝑎0 is the
transfer coefficient, 𝜂𝑐 is the overpotential of ORR, 𝐹 is the Faraday constant, 𝑅 is the gas
constant, and 𝑇 is the temperature in K. A larger exchange current density, 𝐼𝑂2
0 , and smaller
𝑅𝑇
𝑛𝑎0∙𝑎0∙𝐹𝜂𝑐
lead to high current at low potential, and this constant 𝑅𝑇
𝑛𝑎0∙𝑎0∙𝐹𝜂𝑐
is called the Tafel
slope. As shown in Figure 1.8, a faster reaction should exhibit a higher exchange current
density and lower Tafel slope. These characteristics hold true for the ORR with increasing
fuel cell temperatures. The proton conductivity of Nafion decreases at elevated
temperatures (>100°C) due to decreasing relative humidity leading to unacceptably high
ohmic losses. Nafion’s thermal stability is also compromised at higher operating
temperatures. Extensive research efforts have been ongoing to find alternative high-
performance fuel cells operating at temperatures above 100°C.
Therefore, the high temperature operation of fuel cells such as SOFCs and MCFCs
have a number of advantages over low temperatures fuel cell because of its flexibility to
use various types of fuels and non-precious metal catalyst. The co-generation system of
stationary fuel cells can give higher energy efficiency by producing the combined electrical
and thermal energy of a high quality pressure steam, which is generated from a regenerative
heat exchanger with exhaust gas [57].

20
Figure 1.8 Tafel plots for slow and fast electrochemical reactions, reproduced with
permission from [1].
1.6. Effect of wettability in fuel cell components
Surface wettability of fuel cell components in the MEA is a major property
governing the water management capabilities for the PEFCs at the high performance and
extended lifespan of the fuel cell stack. Excessive water formation inside the cell is the
major cause of flooding issues which blocks reactant access to the electrodes, non-uniform
distribution of reactants over the active catalyst area, and poor fuel cell performance. The
generate water tends to stick the surface of the carbon paper substrate and fill the pores of
the catalyst layer and the carbon paper substrate because of the influence of the capillary

21
force distribution in the macro-pores of the carbon paper substrate. An extra water
generation in the electrode, especially in the cathode, will block the active surface area and
hinder reactant gas transport to limiting current behavior, while a dehydration in the
catalyst layer is often the result of indigent ionic conductivity and insufficient utilization
of catalyst [23]. Cell performance fluctuations are mainly caused by flooding from periodic
accumulation and removal of liquid water in the cell. High temperatures, surface oxidation
of the carbon fibers and cell compression during the fuel cell operation can affect
degradation and aging on carbon paper substrate surface properties, which results in the
lower water management compared with the fresh status. Oxidation of carbon fibers of the
substrate may cause the higher level of wettability after the cell operation [58]. Therefore,
the porous structure and surface wettability on liquid water transport and the capillary
penetration of water in the fuel cell components should be studied in a proper method.
The structural and wetting properties of cell components are also key factors for
high temperature fuel cells. The performance of MCFC highly depends on the surface
tension of the molten carbonate and the wettability with the electrolyte matrix in the
solution [3]. For the PAFC, concentrated phosphoric acid and a silicon carbide (SiC) matrix
composite are used as the electrolyte for the proton conductivity at aqueous phosphoric
acid. The proper wettability of the concentrated phosphoric acid is required to permeate
the electrodes, which does not have constant wetting property for the long term operation
due to considerably lower wetting in increasing temperatures up to 200°C. Many researches
have been attempted in increasing the wettability of concentrated phosphoric acid as the
electrolyte and resolving the acid leakage by evaporation at high temperatures [59,60]. In
the SOFC, the coarsening of wettability between a metallic phase and electrolyte particles

22
results degradation of the cell performance in loss of active surface area and decreased
conductivity of metallic and ceramic electrodes [61].
1.7. Thesis overview
Despite outstanding advances in fuel cell technologies such as membranes, catalyst
layers, carbon paper/MPLs, gas flow channels, bipolar plates, and fuel cell stack
architectural design, further efforts are required to manufacture cost-effective and highly
durable fuel cell components on a commercial scale. The performance of fuel cell is
significantly affected by wetting properties within each layer of the cell. This thesis has
focused on three directions: i) the measurement of wetting forces and contact angles were
conducted to quantify the carbon paper substrate and the MPL wettability changes, as well
as changes of the surface properties of the carbon paper substrate due to contamination
deposits on the carbon fibers. ii) A novel MEA structure in eliminating a macroporous
substrate was developed for a better water management at the high current density. iii) A
method of studying the wetting property was developed for the electrode matrix in the
electrolyte of molten carbonate fuel cells and irregular shapes.
In Chapter 2, a measurement process of contact angles using a force tensiometer is
explained to quantify wetting properties of fuel cell components having rough surfaces; the
carbon paper substrate and the MPL. The contact angle measured by the force tensiometer
shows the dynamic contact angle during sample immerging/emerging into/from the water
with wetting cycles.
In Chapter 3, effects of cationic impurities on fuel cell system performance,
especially on the water management by employing in-situ and ex-situ contamination

23
methods, are presented. Changes in the wettability of the carbon paper substrate following
the in-situ contamination injection are quantified using the force tensiometer employing
the Wilhelmy plate method.
In Chapter 4, a novel MEA concept is introduced for a high current density
operation and a better water management, where the carbon paper substrate is eliminated
and the entire gas diffusion media consists of only the MPL. The MPL is directly deposited
onto both sides of the catalyst layer using a spray deposition method with a heated plate to
provide an improvement in interfacial contacts.
In Chapter 5, a new experimental setup is described for measuring the wettability
of the MCFC electrolyte matrix at high temperatures in oxidant and reducing atmospheres.
The setup consists of a gas regulating hood as well as custom heated stage that are attached
to the force tensiometer for applying various operating conditions.
In Chapter 6, a new method based on the Wilhelmy force balance equation to
determine the contact angle for irregular samples is developed. The raw force data
measured by the force tensiometer is manipulated using the profile plot to determine the
wetting force and consequently advancing and receding contact angles, which is verified
with triangular and irregular PTFE samples in water.
Finally, in Chapter 7, conclusions are presented listing the major contributions of
this research, and suggestions for possible extensions of the work in the future.

24
CHAPTER 2. METHODOLOGY FOR WETTABILITY
CHARACTERIZATION OF POROUS STRUCTURE IN POLYMER
ELECTROLYTE FUEL CELLS: WILHELMY PLATE METHOD
2.1. Introduction
Gas diffusion media (GDM) is a critical component for water management in a
PEFC, and is composed of two layers: a carbon fiber substrate and a hydrophobic coating
(i.e. micro porous layer, MPL), which contains high fractions of polytetrafluoroethylene
(PTFE) as shown in shown in Figure 2.1. The substrate is typically comprised of highly
porous carbon paper or cloth to help diffusion of reactant gases to the catalyst layers. The
carbon paper substrate also provides mechanical support to the electrodes and facilitates
the electron conduction, particularly in the in-plane direction from the areas under the gas
channels to the current collector ribs [62].
A hydrophobic material (usually PTFE) is applied to the carbon paper substrate,
which is also coated with a thin micro porous layer to enhance its capability of product
water removal. The key to minimizing mass-transport losses is effective water management
in the cell, especially in the carbon paper substrate at the cathode. Liquid water in macro-
pores of the carbon paper substrate decreases the fuel cell performance at high current
density due to the hindered oxygen transport to the catalyst layer [27].

25
Figure 2.1 Cross-section scanning electron micrograph of the carbon paper substrate with
the MPL (Freudenberg C4 GDM).
Recent MEA life time testing shows that the rate of loss of hydrophobicity in the
carbon paper substrate increases with operating temperature during drive cycle testing of
fuel cells [63]. Ex-situ aging tests of the carbon paper substrate in a peroxide solution,
simulating the chemical degradation process by water in the drive cycle operation, shows
weight loss due to surface oxidation of carbon paper substrate and MPL which also results
in the formation of hydrophilic surface oxide groups leading to lower hydrophobicity [64].
Hydrophobic properties of the carbon paper substrate can also be altered by mechanical
degradation by the stack compression, resulting in limited durability of water management
during long term operations [65]. An optical measurement of the contact angle such as
sessile drop profiles is widely used as a wettability measurement tool. However, the
evaluation of the tangent line of the drop at a precise point can be unclear mainly due to
optical noise caused by resolution, image diffraction, or scattering. Especially in

26
heterogeneous and rough surfaces, the contact point between the axial location of the base
line and the projected drop boundary can appear distorted, resulting in inconsistent
measurements [66]. In this chapter, a force tensiometer is used to measure dynamic contact
angles the carbon paper/MPL.
2.2. Experimental
As shown in Figure 2.2, the dynamic contact angle of the carbon paper substrate
and the MPL is measured with a Krüss K100 tensiometer (Krüss GmBH, Germany),
following the Wilhelmy plate method. Figure 2.3 shows that two square pieces of GDM
are knife-cut near the gas inlet and outlet, located at the top and the bottom of the cell,
respectively. These samples, identified as inlet and exit, are prepared by taping the two
square pieces of GDM back to back using a thin double sided tape to measure the
wettability of both layers of the carbon paper substrate and the MPL, separately. There is
no significant spontaneous uptake of water into the pores of either the GDM or MPL,
therefore the double-sided tape does not have any impact on the measured contact angles.
The prepared sample is mounted on the sample holder, and then scanned in both advancing
and receding directions with a scan rate of 6 mm/min and a maximum distance of 10 mm.
The contact angle measurement was repeated three times per each case with three
separately cut samples from the same carbon paper substrate and MPL batch, with the
average given in the final angle.

27
Figure 2.2 Krüss K100 tensiometer.

28
Figure 2.3 Sample preparation for measuring the wetting force of the carbon paper
substrate/MPL surface in the force tensiometer.
2.3. Results and discussion
2.3.1. Wilhelmy force equation
Wettability of the carbon paper substrate/MPL is one of the major parameters
governing the water management, especially at high current densities. The traditional

29
method for measuring contact angles on flat surfaces is the sessile drop technique. However,
extremely small or large contact angles cannot be measured with this method due to
difficulty of assigning the tangent line when the droplet profile is flat or readily slide off
the surface. In addition, the evaluation of the tangent line of droplet may be unclear due to
optical noise caused by image diffraction or scattering [67,68]. The uneven porous
structure of the carbon paper substrate may result in wicking of the liquid into macro-pores,
and surface heterogeneity and roughness of the carbon paper substrate and the MPL will
cause local variation of the contact angle measurements, determining the average change
in wettability will require many measurements. Contact angle measurement with the
Wilhelmy plate method is a more accurate way to characterize changes in the wettability
of rough surfaces as it measures the wetting force between the liquid surface and the sample.
This method involves the use of a pre-weighed sample, and accounting of the buoyancy
force and wetting force via a precise load cell. The dynamic contact angle of liquids against
solid surfaces is indirectly determined from force data as the solid flat sample is pushed
into or pulled out of the liquid to quantify wetting changes [69]. The force balance is given
by the Wilhelmy equation,
𝐹 = 𝑝𝛾𝑐𝑜𝑠𝜃 + 𝑚𝑔 − 𝜌𝑉𝑔 (1)
where, m is sample mass, g is gravitational acceleration, p is sample wetted length
(perimeter), γ is liquid surface tension, ρ is liquid density and V is sample wetted volume.
As such, the first (𝑝𝛾𝑐𝑜𝑠𝜃) and third (𝜌𝑉𝑔) terms represent the wetting force and the
buoyancy force, respectively. The advancing contact angle and the receding contact angle
are measured during immersing to the liquid and emerging from the liquid, respectively.
Contact angles are calculated from force data using the Wilhelmy equation. The detailed

30
process to calculate dynamic contact angles from the wetting force will be discussed in the
next section.
2.3.2. Wilhelmy plate method for measuring the contact angles
Figure 2.4 shows the measurement of the wetting force on the as-received carbon
paper substrate and MPL which are prepared as shown in Figure 2.3. The lower set of
forces (A-C) until 10 mm immersing position are the advancing wetting force into water,
and the upper set of forces (C-F) until back to initial position are the receding wetting force
from water. The plotted force is corrected for the buoyancy and the weight of the sample
prior to wetting. The wetting force on the solid sample can be either positive or negative
during the force tensiometer measurement depending on sample’s wettability in the testing
liquid (i.e. hydrophobic or hydrophilic). Negative values describe the upward direction
force on the sample (i.e. for hydrophobic surfaces, contact angle>90°), and positive values
describe the downward direction force on the sample (i.e. for hydrophilic surfaces, contact
angle<90°). The resultant force during the initial development of the meniscus is referred
to as the transient force, which is shown as segment AB in Figure 2.4. Another transient
period is shown in segment CD, in which the wetting force increases when the liquid-solid
interface transitions from the advancing to the receding shape, when the direction of the
travel changes. The receding process of the carbon paper substrate (D-E) shows water
retention on the carbon paper substrate surface due to its hydrophilic characteristics, while
the meniscus between the MPL surface and water (D-E) indicates a hydrophobic behavior.
The transient region (E-F) for the MPL occurs during the meniscus going back to its
original shape. The advancing and receding wetting forces remain constant for a uniform

31
solid sample except in the transient region, i.e. during the formation of the meniscus. The
contact angle, thus can be calculated with the perimeter of the sample (i.e. wetted length,
p) and the surface tension of the liquid (𝛾). The contact angle of water on the carbon paper
substrate and the MPL is determined by fitting the steady advancing and receding force
balances to the linear portions of submersion and immersion forces, segment BC and
segment DE, respectively.

32
Figure 2.4 Wetting processes of Wilhelmy plate method for the dynamic contact angle
measurement while measuring the force on the as-received carbon paper (CP) substrate
and MPL in water.
In equation (1), the surface tension of water at 20°C is 0.0728 mN/mm and the
sample perimeter is 34.52 mm (thickness: 0.26 mm, width: 17 mm). The constant
advancing and receding wetting forces are determined by the average in the steady region
of force traces. In Figure 2.4, the advancing and receding wetting forces for the virgin
carbon paper substrate are -2.43 mN and 1.10 mN from the average force data in the 4-8
mm region of the immersion and the 4-0 mm region of emerging form water, respectively.
The Wilhelmy plate method was repeated three times using three separate samples from
the same batch, and the average is given as the final contact angle, and the standard
deviation of the three repeated measurements is associated with the experimental error as
well as the variation in samples. As a result, the advancing contact angle is 165±3° and the
receding contact angle is 63±4° in water. Equilibrium contact angle can be calculated from
the advancing and receding contact angles that are determined by dimensionless parameters
of the normalized line energy associated with the triple phase contact [70]. It is defined as,

33
𝜃0 = 𝑎𝑟𝑐𝑐𝑜𝑠 (Γ𝐴 𝑐𝑜𝑠𝜃𝐴 + Γ𝑅 𝑐𝑜𝑠𝜃𝑅
Γ𝐴 + Γ𝐵)
where Γ𝑅 = (𝑠𝑖𝑛3𝜃𝑅
2−3𝑐𝑜𝑠𝜃𝑅+𝑐𝑜𝑠3𝜃𝑅)
1/3
, Γ𝐴 = (𝑠𝑖𝑛3𝜃𝐴
2−3𝑐𝑜𝑠𝜃𝐴+𝑐𝑜𝑠3𝜃𝐴)
1/3
, and 𝜃𝐴 is the advancing
contact angle, and 𝜃𝑅 is the receeding contact angle. The equilibrium contact angle for the
as-received carbon paper substrate is 75±3°, which correlates well with the hydrophilic
carbon fibers of the Freudenberg C4 carbon paper. Similarly, for the virgin MPL, the
advancing and receding wetting forces are -2.54 mN and -2.08 mN from the average force
data in 4-8 mm region of the immersion and 8-4 mm region of the emerging form water,
respectively, and the corresponding contact angles are 174±4° advancing and 142±6°
receding. The equilibrium contact angle for as-received MPL is calculated as 145±5°.
As the carbon paper substrate and the MPL are porous, spontaneous uptake of water
into the pores is possible and it may affect the measured wetting forces. The Washburn
capillary rise method is used to measure that the amount of liquid penetrating into the
carbon paper substrate pores as a function of time. In the Washburn method, the sample is
not completely immersed into the liquid, but just touches the liquid surface and then water
uptake into the carbon paper substrate pores is determined by measuring the weight change
[71]. Figure 2.5 shows the rate of water absorption into the carbon paper substrate. For the
Wilhelmy plate method in Figure 2.4, the force detection speed was 6 mm/min and the
maximum submersion depth was 10 mm, therefore, the total testing time was 200s during
collecting advancing and receding wetting forces. The maximum amount of weigh increase
due to water penetration is only 2 mg in 300s, which corresponds to ~0.02 mN in terms of
the additional gravitational force acting on the carbon paper substrate. The receding wetting
forces of the carbon paper substrate are much higher than the spontaneous imbibition of

34
water into the pores. Therefore, it is not necessary to correct for the uptake of water in
calculation of the receding wetting force measured in the Wilhelmy method.
Figure 2.5 The rate of water absorption into the pores of carbon substrate (sample cross-
sectional area: 4.42 mm2).
2.4. Summary and conclusions
The force tensiometer was used to measure the wettability of carbon paper substrate
and MPL using the Wilhelmy plate method. The contact angle measured in the force
tensiometer shows the dynamic contact angle during sample immerging into the liquid and
emerging from the liquid with repeated wetting cycles indirectly determined from force
data. The optical analysis method is not accurate for heterogeneous and rough surfaces
such as fuel cell due to uncertainty of capturing the contact tangent line. Therefore, the
Wilhelmy plate method is a proper way to evaluate the wettability of carbon paper substrate

35
and MPL. The Wilhelmy plate method using the force tensiometer continues to use in the
following chapters for evaluating changes in the wettability of the fuel cell components.

36
CHAPTER 3. CHANGES IN WETTABILITY OF POLYMER
ELECTROLYTE FUEL CELLS COMPONENTS DURING
CATIONIC CONTAMINATION AND MITIGATION
3.1. Introduction
Impurities present in fuel and air can have a major effect on durability/performance
of PEFCs. These impurities can be introduced into the fuel cell from the air stream in the
cathode chamber, water in the humidifier, system components, metal bipolar plates, or Fe-
containing alloy catalysts [37,72,73]. The atmospheric air quality cannot be controlled and
normally includes many impurities including unstable organic compounds, as well as
foreign ions in liquid water, especially in city areas and beachside environments. The high
level of air pollutants are required to be removed for long term operation [74,75].
Contamination of the membrane with foreign cations has a serious impact on the fuel cell
performance by replacing protons attached to the sulfonate groups (-SO3-) with foreign
cations originating from the pollutants and the cell components [41]. These ions weaken
the mechanical and chemical properties of the membrane resulting in lower proton
conductivity and increased reactant gas crossover. Cationic contaminants typically
accumulate near the cathode with a concentration gradient across the membrane due to the
potential gradient during fuel cell operation [42,76].
The mass transport limitation of fuel or oxidizer in the cell causes a sharp drop in
the output voltage at high current densities, which is mainly from the presence of liquid

37
water in catalyst layers and carbon paper substrates. Foreign cations from air pollutants
and fuel cell metallic components can change surface properties of the carbon paper
substrate by depositing on the carbon fibers, resulting in mass transport losses and water
management issues resulting from changes in hydrophobicity of the catalyst layer and the
carbon paper substrate [37]. We observed that water management significantly affects
contamination by cations which may result in salt precipitation in the carbon paper
substrate and the flow field causing serious mass transport losses mainly due to changes in
the surface wettability [77–79]. The rate of oxygen reduction reaction in the cathode
catalyst layer, where the oxygen atom combines with electrons, is considered to be the
leading factor that limits fuel cell performance. The contaminants in the oxidant feed lead
to kinetic loss due to the Pt catalyst poisoning in the cathode layer [80]. Voltage losses
increase with contamination exposure time due to the accumulation of foreign substances
on the Pt catalyst surface [81]. Foreign cations can also decrease catalyst activity and
membrane degradation which is revealed by high fluoride emission [82,83].
The method for mitigation of the accumulated contamination should be studied to
reduce its effects on fuel cell performance. Several mitigation strategies for fuel
contamination of CO poisoning on Pt electrode catalysts are widely investigated; such as
using blending low concentrations of air, oxygen, or hydrogen peroxide into the anode,
developing CO-tolerant anode Pt-Ru catalyst, and operating at high temperature over
100˚C for advanced CO tolerance [47–49]. The additional setup of filters to purify the
cathode oxidant feed helps reduce the contamination from pollutants and dust emission
[84]. However, this is only a temporary method to reduce particulate accumulation from
the air in the cell stack, not the fundamental solution for the impurities generated inside

38
fuel cell components. A proven method of mitigating the cation contamination has not been
identified.
In previous studies, it has been demonstrated that when the membrane directly
comes into contact with cations, its proton conductivity and gas permeability decreases
resulting in serious performance loss [85]. This chapter has developed novel technologies
for reducing the effects of contamination on fuel cell performance as shown by the
following mitigation strategies: (1) mitigation of foreign cation effects by low voltage
operation at super saturated conditions, (2) mitigation of salt deposit from the carbon paper
substrate and flow field, and (3) mitigation of membrane conductivity loss due to foreign
cations via external methods/re-protonation and in-situ H+ generation.
In addition, There is only a limited number of studies that have focused on
addressing the effects of contamination on the changes in the wettability of the carbon
paper substrate. [63,86] There is evidence that contaminants may have a strong influence
on mass transport losses due to hydrophobicity changes of the carbon paper substrate. In
our previous studies, we have investigated the effect of various foreign cations on PEFC
operation and performance. The contaminant solution was injected into the air stream of
the fuel cell through a nebulizer for in-situ contamination [77–79,85–87]. We observed that
water management significantly affects contamination by foreign cations, if there is not
sufficient water precipitation of the contaminants in the carbon paper substrate and the flow
field may ensue causing significant mass transport losses. Foreign cations from air
pollutants and fuel cell metallic components can also alter surface properties of carbon
paper substrate by precipitating on the carbon fibers, decreasing effective porosity resulting
in mass transport losses and increased wettability [21,22].

39
In our previous studies, the hydrophobic nature of the MPL was found to prevent
both foreign cation solutions and mitigation solutions from reaching the CCM, and a
wetting agent was necessary to enable the transport of cation through MPL [85]. Here, the
mitigation solution is used to clean previously contaminated CCMs and GDM in fuel cell
assembly. In either the in-situ injection or ex-situ soak experiments, the CCM was not in
direct contact with the contamination or mitigation solution as it was separated by a PTFE
gasket and the GDM. 15% isopropanol (IPA) solution was selected as the proper wetting
agent for the MPL as it has no discernible impact on the ionomer structure –other
surfactants resulted in degradation of the ionomer- and sufficiently decreases the contact
angle. We have also measured the effect of the added 15% IPA on the performance and
verified by both the ex-situ soak and in-situ injection [86]. Following this work, we here
report the measurement of wetting forces and contact angles to quantify the carbon paper
substrate/MPL wettability changes attributed to the added IPA solution, as well as changes
of the surface properties of the carbon paper substrate due to contaminant precipitation on
the carbon fibers following the in-situ contamination injection.
3.2. Experimental
3.2.1. Cell assembly
As shown in Figure 3.1, a catalyst coated membrane (CCM) is GORE® PRIMEA®
membrane electrode assemblies (GORE, PRIMEA and design are trademarks of W. L.
Gore and Associates, Elkton, MD) with Pt loading of 0.4 mg/cm2 on both sides and an
active area of 25 cm2. A gas diffusion media (GDM) is Freudenberg C4 (Freudenberg
FCCT SE & Co. KG, Weinheim, Germany) with a thin hydrophobic microporous layer

40
(MPL). The MEA was prepared with the CCM and two GDMs and the active area of 25
cm2. Figure 3.2 shows that a sealing gasket is used to prevent a reactant leak and control a
compression for the CCM and GDM with a good electrical contact on the active surface
area. The assembled cell pinch was set to approximately 15% of the total thickness of CCM
and GDMs, controlled by an appropriate thickness of skived Teflon® gaskets. The MEA
sealing with gaskets is located between anode and cathode bipolar plates.
Figure 3.1 GORE® PRIMEA® CCM with Pt loading of 0.4 mg/cm2 on both sides

41
Figure 3.2 MEA assembly with skived Teflon® gaskets.
Figure 3.3 shows a single-cell hardware (Fuel Cell Technology, Albuquerque, NM)
consisted of graphite flow fields, gold-plated copper current collectors, aluminum end
plates with reactant input/output ports, stainless steel Swagelok compression fittings and
silicone rubber heaters (120V-60W, WATLOW, St. Louis, MO). As shown in Figure 3.4,
machined graphite flow fields had triple serpentine and single serpentine channels on the
cathode and the anode, respectively, with 1.0 mm channel/rib and 1.0 mm depth.

42
Figure 3.3 Cathode (left) and anode (right) end plates with gas feeding ports.
Figure 3.4 Cathode (left) and anode (right) flow fields.
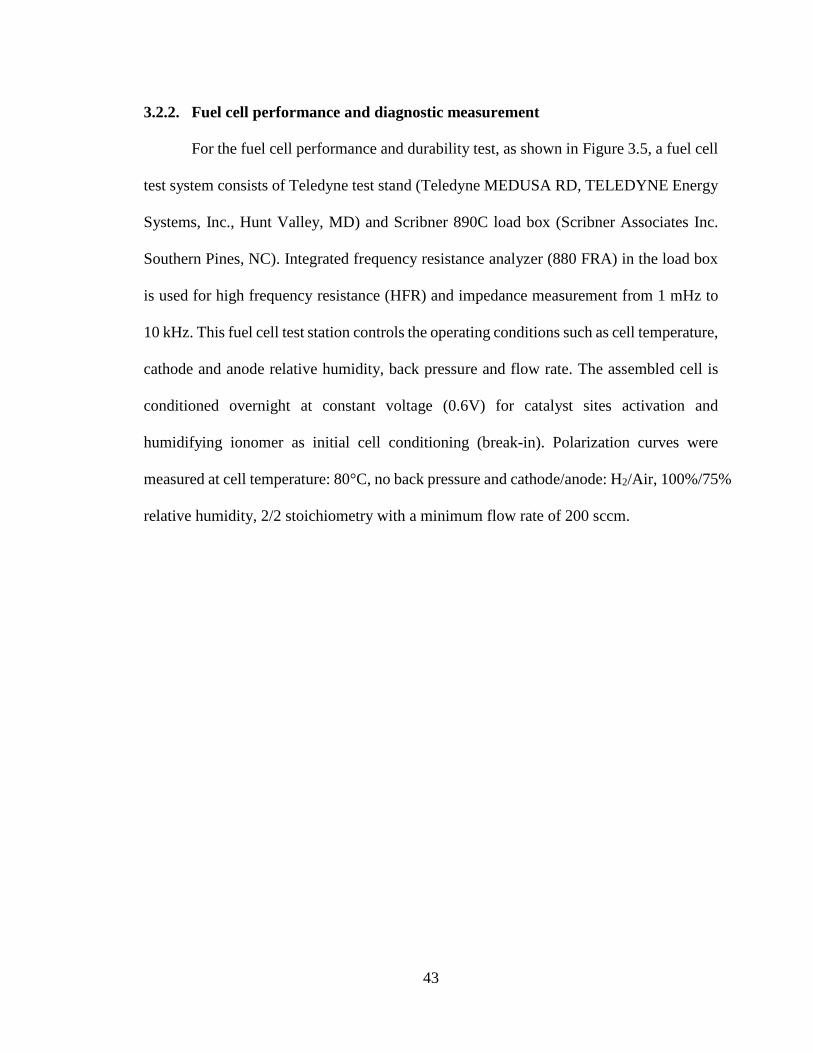
43
3.2.2. Fuel cell performance and diagnostic measurement
For the fuel cell performance and durability test, as shown in Figure 3.5, a fuel cell
test system consists of Teledyne test stand (Teledyne MEDUSA RD, TELEDYNE Energy
Systems, Inc., Hunt Valley, MD) and Scribner 890C load box (Scribner Associates Inc.
Southern Pines, NC). Integrated frequency resistance analyzer (880 FRA) in the load box
is used for high frequency resistance (HFR) and impedance measurement from 1 mHz to
10 kHz. This fuel cell test station controls the operating conditions such as cell temperature,
cathode and anode relative humidity, back pressure and flow rate. The assembled cell is
conditioned overnight at constant voltage (0.6V) for catalyst sites activation and
humidifying ionomer as initial cell conditioning (break-in). Polarization curves were
measured at cell temperature: 80°C, no back pressure and cathode/anode: H2/Air, 100%/75%
relative humidity, 2/2 stoichiometry with a minimum flow rate of 200 sccm.

44
Figure 3.5 Fuel cell test system: Teledyne/Scribner associates model 890CL.
H2 crossover (CO) and cyclic voltammetry (CV) curves were measured in a
potentiostat/galvanostat (Solartron SI 1287, AMETEK, Oak Ridge, TN) for cell diagnosis
tests between the durability tests (Figure 3.6). The cathode was purged with N2, while H2
is continuously fed to the anode with a flow rate of 250 sccm in the both sides. The anode

45
and the cathode were connected to a counter electrode and a working electrode in the
Solartron, respectively. The CO data was collected by linear sweep voltammetry in a scan
range of 0.1-0.4V at a scan rate of 2 mV/s. The Cathode CV data was collected in a scan
range of 0.05-0.8V at a scan rate of 20 mV/s, which was used to calculate the
electrochemically active area (ECSA) of the electrodes/catalyst. The ECSA can be
calculated using [88]:
𝐸𝐶𝑆𝐴 (𝑚2 ∙ 𝑔−1) =𝑄𝐻
𝛤 ∙ 𝐿
where, 𝑄𝐻 (𝐶 𝑐𝑚2⁄ ) is the atomic hydrogen desorption charge density by integrating the
charge density associated with the peak area in the hydrogen desorption region (0.05–0.4V),
which represents the charge amount to the double layer charging. 𝐿 is the Pt loading in the
electrode (0.4 mg/cm2 in this thesis). Γ is the quantity of charge to reduce a homogeneous
monolayer of protons on Pt, which is assumed to be 0.21 mC/cm2.
After the durability test and diagnostic measurements, the cell was dissembled and
subjected to initial visual observation using both a scanning electron microscope (SEM,
FEI ESEM Quanta 250, Hillsboro, OR, USA) and energy dispersive X-ray spectroscopy
(EDX).

46
Figure 3.6 Solartron analytical 1287 potentiostat/galvanostat.
3.2.3. Contamination method
3.2.3.1. Ex-situ soaking
If cation contaminant enters into the membrane, the foreign cation can replace and
occupy the sulfonic acid site, which results in reduction in proton conductivity. To simulate
this situation, the fresh CCM is soaked in the calcium sulfate contamination solution; 0.9
mM CaSO4 (99.99% pure metal basis, Sigma-Aldrich® , St. Louis, MO) and 29.1 mM
H2SO4, (95.0-98.0%, ACS reagent, Sigma-Aldrich® , St. Louis, MO).
For further study of the ex-situ soaking with the whole MEA with the gasket, the
assembled cell was conditioned at a constant voltage to activate the catalyst layer and then
operated in supersaturated conditions with DI water injected for 24 hours at 0.6 V to
establish the baseline, uncontaminated cell performance. After the preconditioning process,
the MEA is disassembled from the cell and exposed to further soaking test. The CCM was
not in direct contact with the contaminant solution being separated by the MPL and the
Teflon gasket. The cell was disassembled then the MEA is soaked in the contaminant
solution with/without the wetting agent (15% isopropanol solution) for 100 hours at 80°C.

47
3.2.3.2. In-situ injection
Another approach of studying the effects of cations is directly injecting the cation
solutions into the air stream of the cathode [77]. In the in-situ contamination injection, as
shown in Figure 3.9 and Figure 3.8, the contaminant solution was injected into the cathode
gas line of the fuel cell by a high resolution HPLC pump (Series III, LabAlliance, State
College, PA) through a nebulizer (ES-2040, Elemental Scientific Inc, Omaha, NE), which
creates a fine mist to avoid local flooding by atomizing the liquid into aerosol droplets.
Figure 3.7 High resolution HPLC pump.

48
Figure 3.8 Assembly of the nebulizer and Swagelok tube fittings.
Through the nebulizer, the CaSO4 solution was injected into the cell in the form of
mist to avoid local flooding. The flow rate of the calcium sulfate solution was 130 µL/min,
which is a concentration of 1.14mM corresponding to 5 ppm flow in air stream on mole
basis. During the contaminant injection test, cells were maintained at 80°C with anode H2
flow rate of 1.75 slpm and cathode air flow rate of 1.66 slpm. The high air flow easily
allows sufficient water to reach the membrane and helps prevent CaSO4 precipitation in
the cathode as the contaminated air flows through the flow field. The anode and cathode
RH were maintained at 25% and 125%, respectively. The anode and cathode outlet back
pressure were maintained at 10 kPa and 100 kPa gauge pressure, respectively. A
supersaturated cell inlet condition and high cathode back pressure were used to establish a
water concentration gradient from the cathode to the anode, facilitating transport of foreign
cations across the cell along water transport pathways.

49
3.2.4. Mitigation
3.2.4.1. Mitigation of foreign cation in the membrane by low voltage operation
Before the cell assembly, the CCM was soaked in a solution of 1.74 mM CaSO4
and 28.26 mM H2SO4 for 24 hours at 80°C, to allow direct contact with the Ca2+ solution
for sufficient cation uptake. The total sulfate concentration (SO4)2− was kept at 30mM to
be the same as the previous tests [89]. The CCM was then washed and soaked in DI water
for 30 min. This step was repeated two more times to remove excess acid or salt from the
CCM. The cation soaked CCM was assembled in single cell hardware to determine the fuel
cell performance. The assembled cell was run at the low voltage condition for 50 h after
the initial polarization measurement to generate a high rate of water production at the
cathode. Operating conditions were same with the above contamination test. After 50 hours
of low cell voltage operation, the recovery cell performance was measured at 80°C with
100% (H2) and 75% (air) relative humidity, and H2/air flow rate was maintained at 2
stoichiometry with a minimum flow rate of 200 sccm in a fuel cell test station (890B,
Scribner Associates, Inc., Southern Pines, NC).
3.2.4.2. Mitigation of mass transport losses
After cell operation with the presence of Ca2+ ions that led to salt deposits in the
flow field channels and the gas diffusion electrode, the recovery test of mass transport
losses is performed to remove salt deposits from the cathode carbon paper substrate, ex-
situ cleaning methods have been adopted. For this, 100mM H2SO4 solution with 100ml/min
flow rate of the peristaltic pump passed through cathode for 2h, while keeping anode side

50
filled with water, subsequently DI water was circulated through the cathode for 2h. All
lines are PVC tubing for good resistance to the acid solution and is sufficiently flexible for
the peristaltic pump. The schematic illustration of ex-situ cleaning method is given in
Figure 3.9. The circulating water was collected for further analysis. Once the ex-situ acid
flush was done, the polarization curve (cell temperature: 80˚C; cathode/anode: H2/air,
100%/75% RH, 2/2 stoich, no back pressure) and the cyclic voltammetry test
(cathode/anode: N2/H2, 250/250sccm; scan rate: 20 mV/s; scan range: 0.05-0.8V) were
measured in a potentiostat/galvanostat. After that, the cell was dissembled and subjected
to initial visual observation using scanning electron microscope (SEM) and energy
dispersive X-ray spectroscopy (EDX).
Figure 3.9 Schematic of experiment setup for ex-situ cleaning by acid flush.

51
3.2.4.3. Mitigation of membrane conductivity loss via re-protonation
For the ex-situ CCM contamination, the CCM was soaked in a solution of 0.9 mM
CaSO4 and 29.1 mM H2SO4 for 24 hours at room temperature. The constant current hold
test (at 0.1 A/cm2) was performed for 24 hours at the same conditions as the above. The
cation contaminated cell was disassembled and the CCM was soaked in a 1 M H2SO4
cleaning solution for 24 hours at room temperature, and then washed with DI water. Finally,
the re-protonated CCM was assembled again and the recovered cell performance was
measured.
3.2.4.4. Mitigation of membrane conductivity loss via external H+ supply
In our previous screening test, the hydrophobic nature of the MPL was acting as a
barrier for both cations and cleaning solutions to reach the CCM, and the 15% isopropanol
(IPA) solution was selected as the proper wetting agent for the MPL [85]. After the base
line test for 24 hours, the cell was disassembled and the MEA was soaked in the
contaminant solution with the wetting agent (0.9mM of CaSO4, 29.1mM of H2SO4 and 15%
IPA solution). The mitigation solution used in the in-situ recovery was 10mM H2SO4 and
15% IPA. This cleaning solution was injected into the air stream after a 70 hours DI water
injection test at the same conditions as the above contamination injection test. To verify
this in-situ mitigation method, ion exchange capacity (IEC) measurement is a titration
procedure used to determine the acid capacity of the CCM before and after the in-situ
mitigation method [89]. The tested CCM was soaked in 50 mL of 2 M NaCl solution for
24 hours. After a DI water rinse at least 30 min, the solution was titrated with 0.01 M NaOH

52
to the phenolphthalein end point, and a blank consisting of 50 mL of 2 M NaCl was also
titrated. The result was calculated by averaging three separate measurements.
3.2.5. Wettability measurement of the carbon paper substrate/MPL during
contamination and mitigation
The GDM was carefully removed from the CCM to measure the wettability changes.
A similar experiment was performed with an MEA contaminated ex-situ. In this test, the
as-received GDM is soaked in the contaminant solution (2.85 mM of CaSO4 + 27.15 mM
of H2SO4) for 100 hours at 80°C. The mitigation method to remove salt deposits from the
cathode GDM is performed by two cleaning steps. The contaminated GDM is soaked in
water with ultrasonic bath for 2 hours, and then stirred in 1M H2SO4 for 2 hours at room
temperature. Changes in the wettability of the carbon paper surface following the in-situ
contamination injection, the ex-situ soaking, and the mitigation steps were quantified using
the Wilhelmy plate method as described in chapter 2.
3.3. Results and discussion
3.3.1. Fuel cell contamination during the in-situ contaminant injection
Calcium contaminants can be ingested into a fuel cell as a particulate air pollutant
or as an ion within liquid roadside spray, especially near marine environments. To emulate
these conditions, the CaSO4 solution was injected through the cathode inlet using a
nebulizer. There was no discernible performance change observed initially, up to 60 hours
[77]. After then, a rapid drop in the voltage and a sharp increase in the cell resistance were
observed immediately, possibly due to salt precipitation clogging the cathode GDM and
53
the flow field channels. Significant Voltage fluctuations accompanied and are usually
associated with mass transport loss, particularly due to flooding of the cathode. We
hypothesize that the loss of carbon paper substrate wet proofing causes water to accumulate
locally in the macro-pores of the gas diffusion media.
Figure 3.10 shows photograph of the carbon paper substrate surface and flow
channel for both cathode and anode after 100 hours CaSO4 injection into the cathode of
the cell with air through a nebulizer. The white deposits seen on the cathode carbon paper
substrate and the flow field are confirmed to be CaSO4 precipitate by energy dispersive x-
ray spectra (EDS) analysis [77], which leads severe mass transport losses in addition to the
previously investigated ohmic effects typically associated with foreign cations. Salt
deposits on the surface or inside the carbon paper substrate causes the blockage of available
pore space, thereby hindering oxygen transport to the active reaction sites in the catalyst
layer. The sharp gas flow resistance increases believed to be the result of salt deposits
inside the cell impeding the reactant gas transport and blocking flow channels, which
results in serious mass transport losses. Salt deposits on the surface may also alter the
surface wettability, resulting in local accumulation of water in the carbon paper substrate,
resulting in the voltage instability, commonly associated with mass transport as previously
mentioned [77–79]. Hence, the surface property changes of the carbon paper substrate need
to be quantified as related to the contaminant injection.

54
Figure 3.10 Photographs of salt deposits on (a) flow field and (b) carbon paper substrate
surface after the in-situ contaminant injection into the cathode.
3.3.2. Mitigation method for cationic contaminated MEA
3.3.2.1. Mitigation of foreign cation effect by low voltage operation at super
saturated conditions
In-situ H+ generation involves operating the fuel cell at higher current densities than
the typical operating conditions, resulting in an enhanced migration field to move cations
towards the cathode and eventually out of the MEA. A high current density/low voltage
cell may assist foreign cation removal from the membrane by the high rate of water
production at the cathode. The cell can maintain a high liquid environment in the cathode
to enable rejection of the foreign cations as liquid droplets. The cell should run at high
current density to generate sufficient water, but after contamination test, the cell
performance was unable to run at the high current density. Therefore, the current hold at
100mA/cm2 was alternatively selected as the low voltage operation. Figure 3.11(a) shows
the polarization curves during the mitigation steps for the low voltage operation at super
saturated conditions. After the baseline measurement, the assembled CCM was soaked in

55
a solution of 1.74 mM CaSO4 and 28.26 mM H2SO4, which is in direct contact with the
Ca2+ solution to promote cation uptake into the CCM. After the initial soak, there was a
very large performance drop due to foreign cations (curve labeled as (2)). The performance
kept decaying even when the cell was operated at a low voltage (0.3 to 0.2 V at a constant
current density of 0.1 A/cm2), as shown in Figure 3.11(b). The polarization curve does not
show any improvement after this contaminated cell was tested for 50h at super saturated
condition. This is probably due to the fact that the highly hydrophobic layer acts as a barrier
to transport of Ca2+ out of the contaminated CCM. Therefore, the fuel cell operation at a
low voltage does not have a significant impact on performance recovery from the foreign
cation contamination in the membrane.
(a)

56
(b)
Figure 3.11. (a) Comparison between a baseline polarization curve and others obtained
after the CaSO4 exposure (24 h soak duration) and operation at the low cell voltage after
contaminant exposure. Operating conditions: 80°C, A/C: 100/75% RH, 2/2 stoic, 0/0 psig,
200/200 sccm minimum flow; (b) Subsequent transient cell performance at constant current
at 100 mA/cm2, i.e. between polarization curves (2) and (3). Operating conditions: 80˚C,
A/C: 25/125% RH, 1.75/1.66 slpm H2/Air, 1.5/15 psig.
3.3.2.2. Mitigation of mass transport losses due to foreign cations
During the previous contaminant test, the CaSO4 solution was injected through the
cathode inlet using a nebulizer [77]. The cell voltage decay and resistance changed during
the constant-current hold tests. A steep reduction in voltage during the constant current
hold was observed due to precipitation of the salt deposit, clogging the cathode gas
diffusion layer and the flow field channels (as shown in Figure 3.12 left), which leads a
severe mass transport losses in addition to the ohmic effects typically associated with

57
foreign cation contamination. After the 90 hours cation injection test, the cell was
disassembled to perform the initial visual observation of CaSO4 salt deposits onto the
carbon paper substrate and the flow field. The cell was then reassembled with the cation
exposed MEA to the next mitigation step. An ex-situ acid cleaning method using 100mM
H2SO4 solution with 100ml/min flow rate passed through the cathode for 2 hours at room
temperature, as illustrated in Figure 3.9, was used to remove the salt deposit from the
cathode carbon paper substrate and the flow field. The comparative images of cathode flow
field and carbon paper substrate before and after the ex-situ acid cleaning are shown in
Figure 3.12. Salt deposits from flow field are completely removed, whereas in the carbon
paper substrate some remaining white patches of salt are still observed. The ex-situ acid
solution flush is largely effective to remove salt deposits on the cathode flow field channels
and carbon paper substrate. However, the following characterization tests revealed an
incomplete performance recovery and the presence of salts.

58
Figure 3.12 CaSO4 salt deposits on cathode carbon paper substrate (top) and cathode
bipolar plate (bottom) before and after the ex-situ exposure of 100 mM H2SO4.
Figure 3.13 polarization curves indicate that the contaminant injection largely
impacts the performance degradation especially in ohmic and mass transport regions. There
is no change in OCV probably caused by less impact on the membrane degradation from
the contaminant injection into the cathode. We already verified that the contaminant
solution cannot transport to the membrane through the MPL without the wetting agent [85].
After the acid flushing with 100mM H2SO4 solution as the mitigation method, the cell
performance was only improved slightly in the mass transport region. These results suggest
that the presence of salt deposits on the carbon paper substrate has a smaller effect on cell
performance than the foreign cations that directly penetrate the membrane, except when
the salt deposits are so severe that they clog the reactant gas path. Figure 3.14 shows that
the presence of remnant salt deposits on the gas diffusion layer. In region 1, no cation was

59
detected in either the catalyst layer or the membrane; however, they may still be present
below the EDX detection limit. In a region 2, the cathode gas diffusion layer with salt
deposits shown in white is found in the MEA cross section although region 1 has no
remaining salt deposits. The S and Ca EDX maps correlate with the cathode salt deposits.
The MEA cross section obtained after the test confirms that the in-situ acid solution
flushing is effective for removing most salt deposits from the carbon paper substrate, but
some salt deposits of calcium sulfate are still present inside the carbon paper substrate.
Figure 3.13 Polarization curves obtained during and after different in situ contamination
and ex-situ cleaning. Operating conditions: 80˚C, A/C: 100/75% RH, 2/2 stoic, 0/0 psig,
200/200 sccm minimum flow.

60
Figure 3.14 Scanning electron microscopy and energy dispersive x-ray spectroscopy
images of the contaminated MEA cross sections after recovery with the acid cleaning
solution, corresponding sulfur S (purple) and calcium Ca (green) maps.
3.3.2.3. Mitigation of membrane conductivity loss due to foreign cations (- via
external methods/reprotonation)
In our previous study, we have re-protonated the Al3+ contaminated with 1M
sulfuric acid [89], hence, the similar method has been adopted for Ca2+ ion solution.
Polarization curves were conducted in sequence by following a multiple steps process of
contaminating the CCM in solution of 0.9 mM CaSO4 and 29.1 mM H2SO4, followed by a
constant current hold (100 mA/cm2 for 24 hours) operation, and then CCM re-protonation
in 1M H2SO4 solution. Thus, this mitigation procedure for membrane conductivity loss
from foreign cations required the cell to be disassembled and re-assembled. The
polarization results are shown in Figure 3.15. The degraded performance of the cell after

61
Ca2+ exposure (beginning of test, BoT) indicates that, since the CCM is in direct contact
with the Ca2+ solution during the contamination soaking step, the membrane is significantly
contaminated. Foreign cations have a stronger affinity than protons for the sulfonic acid
group in the membrane and displace protons following the normal ion exchange processes.
The cation on the sulfonic acid group reduces the proton conductivity which results in
increased ohmic losses and lower water content of the membrane which affects water
transport kinetics. After the current hold operation (end of test, EoT) at 0.1A/cm2 for 24 h,
the contaminated cell shows significant additional performance loss possibly due to
redistribution and accumulation of foreign cations at the cathode. In general, for the non-
contaminated CCM, there was no difference in the cell performance after the 24h current
hold test. Finally, the cell stack is disassembled, and then the Ca2+ contaminated CCM is
reprotonated in an acid solution. About 74% of the he cell performance is recovered after
the CCM reprotonation step, but it is not completely recovered to the baseline condition.
Possible reasons for the incomplete performance recovery even after the CCM
reprotonation are impacts of MEA assembling and de-assembling. For example, the GDM
was removed from the CCM prior to reprotonation, part of MPL may have remained
attached to the CCM surface acting as a barrier to the transport of foreign cations out of
the CCM during reprotonation.

62
Figure 3.15 Comparative polarization curves for CCM that contaminated in a solution of
0.9 mM CaSO4 and 29.1 mM H2SO4 and various steps of analysis and treatment. Operating
conditions: 80C, relative humidity anode/cathode: 100/75%, no back pressures, 2/2
stoichiometry.
3.3.2.4. Mitigation of membrane conductivity loss due to foreign cations (-via
external H+ supply)
In our previous studies, the foreign cation uptake in CCM controls the cell
performance; in addition, it was strongly dependent on the soaking configuration [85]. We
verified that the hydrophobic layer of GDM acts, MPL, as a barrier for transport of aqueous
Ca2+ solution to the catalyst layer and membrane. It may also hinder the re-protonation
process by restricting the aqueous acidic solution from entering the cell during the

63
performance recovery process. In order to overcome the above mentioned issues, 15%
isopropanol was added to the contaminant solution to increase the wettability of the GDM
and MEA. For the same reason, an alcoholic based wetting agent has been added into the
recovery solution to across the MPL barrier during the in-situ recovery test. The transient
recovery test with an MEA, which was contaminated by the ex-situ method in the solution
of 0.9mM CaSO4, 29.1mM H2SO4 and 15% IPA as the wetting agent, is shown in Figure
3.16. After the 24 hours baseline test, the cell was disassembled and the whole MEA with
the gasket was soaked in the contaminant solution with the wetting agent (15% IPA). The
MEA in the contaminant solution with the wetting agent, the contaminant solution can
transport foreign cations into the membrane and the catalyst layer passing through the
formally hydrophobic barriers of the GDM during the ex-situ soaking of the MEA. The
contaminated cells show a large performance loss even after the recovery test. Recovery
testing is done by switching from supersaturated air with DI water injection to an acid
cleaning solution (10mM H2SO4) with the wetting agent (15% IPA). The distributed Ca2+
ions in the membrane are gradually accumulated to the cathode due to the potential gradient,
resulting in performance degradation during the DI-water injection. The removal of the
added wetting agent shows a performance recovery in the order of 50 mV. This is attributed
to the fact that the added IPA solution has its own contamination effect on the overall
performance. In the case of IPA injection during cell polarization, the IPA provides a weak
contamination effect through mixed potential that was found to be completely recoverable.
The cationic contaminated MEA performance is partially recovered after the in-situ
mitigation process using the acid cleaning solution and the wetting agent.
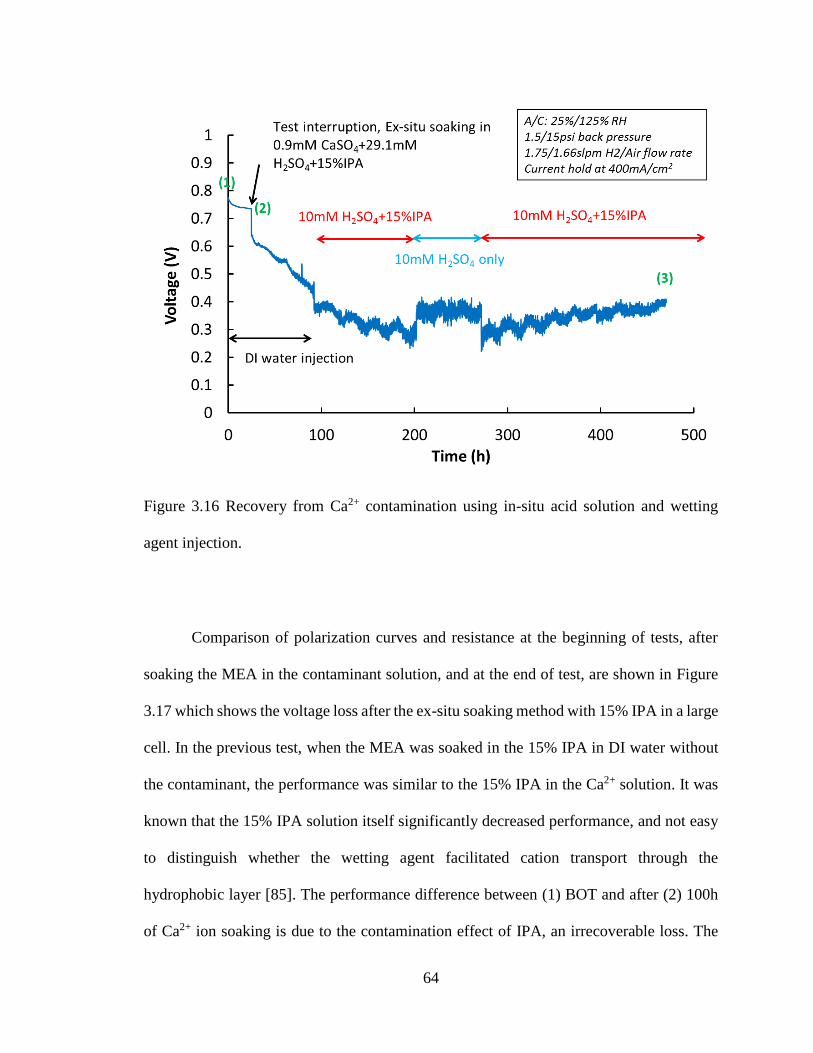
64
Figure 3.16 Recovery from Ca2+ contamination using in-situ acid solution and wetting
agent injection.
Comparison of polarization curves and resistance at the beginning of tests, after
soaking the MEA in the contaminant solution, and at the end of test, are shown in Figure
3.17 which shows the voltage loss after the ex-situ soaking method with 15% IPA in a large
cell. In the previous test, when the MEA was soaked in the 15% IPA in DI water without
the contaminant, the performance was similar to the 15% IPA in the Ca2+ solution. It was
known that the 15% IPA solution itself significantly decreased performance, and not easy
to distinguish whether the wetting agent facilitated cation transport through the
hydrophobic layer [85]. The performance difference between (1) BOT and after (2) 100h
of Ca2+ ion soaking is due to the contamination effect of IPA, an irrecoverable loss. The

65
performance loss after 100h of Ca2+ ion soaking until the EOT could be due to the normal
durability effects like catalysts particle sintering and carbon corrosion of MEA during the
long-term operation. Therefore, this study reveals that the IPA used during soaking led to
a strong impact on the membrane and catalyst layer ionomer’s proton conductivity (verified
later with ion exchange capacities).
To ensure the Ca2+ removal from the MEA, in situ hydrogen production technique
that is hydrogen pump test was conducted. This hydrogen pump experiment did not alter
the performance. Therefore, all the removable cation ions from the contaminated MEA are
eliminated with the sulfuric acid injection process itself, but not perfectly recovered. Figure
3.18 shows that the ion exchange capacity for the CCM used in the ex-situ soaked MEA in
contaminant solution is much lower than the baseline value when the membrane contains
a significant amount of Ca2+ ions. The performance curves and IEC values of the membrane
after the test show that the transient in-situ recovery test can be partially recovered to its
original status.

66
Figure 3.17 Polarization curves obtained during and after the transient recovery test. Cell
temperature: 80˚C; A/C: 100/75% RH; 0/0 psig; 2/2 stoic.
Figure 3.18 Ion exchange capacity of the catalyst coated membrane obtained in the virgin
CCM, after the ex-situ contamination method and after the in-situ recovery injection test.
Figure 3.19 shows the cathode cyclic voltammetry at the beginning and after the
recovery test illustrated in Figure 3.16. Normally, with no cation contamination, a cell loses
0
0.2
0.4
0.6
0.8
1
1.2
1.4
Fresh CCM aftercontamination
after the test
IEC
(m
M/g
)

67
~30% of its electrochemical surface area (ECSA) in the first several hundred hours (which
is typically due Pt nanoparticle growth). However, this catalyst active area is more than 50%
lower than its value before the cell was contaminated. Therefore, the presence of the Ca2+
ions in the membrane and the catalyst layer ionomer affect the catalyst function. These
results could be that the cumulative effect of the presence of the Ca2+ ions in the membrane
and the catalyst layer ionomer affect the catalyst function in addition to the conventional
catalyst surface area loss during the 500 hours operation. The catalyst function loss is due
to contaminant adsorption from interactions between catalyst adsorbates and the cations,
which leads to oxygen reaction mechanism changes, and the catalyst poisoning by the
added wetting agent. The lower water content induced by the presence of the foreign cation
reduces the catalyst ionomer transport properties and prevents access of protons and
oxygen to the catalyst surface [90].
Figure 3.19 Cathode CV curves obtained during and after the transient recovery injection
test. Scan rate: 20mV/s; cell temperature: 25˚C, A/C: 100/100% RH; 0/0 psig; flow rate:
0.25/0.25slpm.

68
In the above recovery injection test, the removal of 15% IPA in the cleaning
solution has increased the performance slightly. To demonstrate effects of the added IPA
solution, two additional transient tests were conducted. In Figure 3.20, the MEA was
soaked in the contaminant solution after the initial 24 hours pre-conditioning period. Cell
#1 was soaked in a contaminant solution of 0.9mM CaSO4, 29.1mM H2SO4 and 15% IPA
in water. Cell #2 was soaked in 15% IPA solution without the contaminant. The cell soaked
in 15% IPA without CaSO4 solution also shows an irreversible performance loss, possibly
due to a decrease in the proton conductivity of the membrane and the catalyst layer by the
IPA absorption on the Pt surface. During the current hold after the soak step, additional
voltage losses were observed for cell #1 but not for cell #2. The uniformly distributed Ca2+
ions in the ionomer phase are accumulated in the cathode during fuel cell operation due to
migration under the potential gradient, resulting in performance degradation during the test.

69
Figure 3.20 Cell voltage and resistance during constant current hold (400mA/cm2) after
the MEA contaminated ex-situ Ca2+ solution with 15% IPA and 15% IPA only. Cell
temperature: 80˚C; anode/cathode relative humidity: 25%/125%; flow rate: 1.75/1.66slpm;
back-pressure: 1.5/15psig.
The rate of oxygen reduction reaction in the cathode catalyst layer is a kinetically
limiting factor. The crossover of fuel through the electrolyte decreases the fuel cell
performance due to the direct reaction of hydrogen with oxygen at the cathode. In addition,
alcohol crossover to the cathodic compartment will lead to a mixed potential with the
oxygen electrode. When the oxygen reduction and alcohol oxidation take place on the same
electrode, the mixed potential results in a reduction of the cell voltage by about 0.1-0.2V
[91]. Figure 3.21 shows a performance loss of about 80mV for 15% isopropanol compared
to the base solution. Mixed potential losses appear for both the 400mA/cm2 current density

70
and the open circuit voltage cases due to the parasitic current associated with isopropanol
oxidation. However, the mixed potential loss is completely recoverable.
Figure 3.21 In-situ 15% IPA injection during recovery process at different operating
conditions, 400 mA/cm2 and OCV. Cell temperature: 80˚C; anode/cathode relative
humidity: 25%/125%; flow rate: 1.75/1.66slpm; back-pressure: 1.5/15psig.
3.3.3. Wettability characterizations during contamination and mitigation
3.3.3.1. In-situ injection tested carbon paper substrates
Figure 3.22 shows the wetting force versus submersion position in water from the
tensiometer on the as-received carbon paper substrate, as well as the anode and cathode
carbon paper substrates after 100 hours in-situ injection of cationic contaminant solution.

71
In the cell testing, anode and cathode inlets/outlets are located at the same corners in a co-
flow configuration. The calcium sulfate (CaSO4) solution was injected into the cathode of
the cell only, and the penetration across the MEA towards anode was minimal, resulting in
no visible deposits on the anode carbon paper substrate. Table 3.1 shows that the wettability
of the entire anode carbon paper substrate and the inlet of cathode carbon paper substrate
remains unchanged after the injection, with advancing and receding contact angles of
157±3° and 40±3°, respectively. Corresponding equilibrium contact angle is 61±2°.
Carbon paper substrate of the Freudenberg C4 is not wet proofed. As shown in Figure 3.22,
(a), (c) and (d), no significant salt deposit was found in these regions. General aging of the
carbon paper substrate, caused by high temperature, oxidation of the carbon fibers [58] and
cell compression during the fuel cell operation for 100 hours, affect its wettability resulting
in lower receding contact angles compared to the as-received carbon paper substrate.
CaSO4 is primarily deposited in the cathode near the outlet [77]. Consequently, cathode
carbon paper substrate near the outlet shows the lowest contact angle, with 99±5°
advancing contact angle and completely hydrophilic (~0°) receding contact angle. The
deposited CaSO4 (most likely in porous form) absorbs additional water resulting in the
larger liquid meniscus on the surface during the measurement as well as lower contact
angle. Therefore, if the carbon paper substrate surface does not show severe salt deposit
such as the cathode outlet, there is no significant change in the wettability of the carbon
paper substrate surface. This result confirms that the CaSO4 precipitation on the carbon
paper substrate can significantly decrease the contact angle and cause flooding with liquid
water, leading to higher mass transport losses.

72
(a) Cathode inlet (b) Cathode outlet (c) Anode inlet (d) Anode outlet
Figure 3.22 Carbon paper substrate wetting force changes after CaSO4 injection testing
into the cathode (100hr run): in-situ contamination.
Table 3.1 The contact angles on the carbon paper substrate surfaces after the in-situ
injection test of the contaminant solution and DI water for 100 hours.
As-
received
(a) Cathode
inlet
(b) Cathode
outlet
(c) Anode
inlet
(d) Anode
outlet
Adv.
Angle 165±3 156±3 99±5 156±3 161±2
Rec.
Angle 63±4 37±4 0 43±2 43±4
Eq.
Angle 75±3 60±3 n/a 61±2 61±3
-3
-2
-1
0
1
2
3
0 2 4 6 8 10 12
Forc
e (m
N)
Position (mm)
As-received
Cathode inlet
Cathode outlet
Anode inlet
Anode outlet
A
B C
D
E

73
3.3.3.2. Ex-situ cleaning of the in-situ injection tested carbon paper substrates
After the wettability measurements performed on the substrates from the in-situ
injection experiment, ex-situ cleaning methods have been applied to remove the salt
deposits on the cathode carbon paper substrate. It is important to note that the DI water
during the wettability measurements did not remove any measureable amount of CaSO4 as
evidenced by the repeated measurements on the same sample. First step included physically
brushing the carbon paper substrate with DI water followed by an ultrasonic bath for 2
hours. As shown in Figure 3.23, some salt deposits still remain visible after this step,
however the advancing and receding contact angles showed some recovery in the
hydrophobic behavior, i.e. measured as 132±4°, and 12±6°, respectively. After the sample
is completely dried, it is further cleaned by soaking and continuously stirring in 1M H2SO4
solution for 2 hours at room temperature. Visually, salt deposits seemed to be completely
removed from the carbon paper substrate, with the advancing and receding angles of 157±4°
and 15±5°; comparable to uncontaminated aged samples, showing that the acidic solution
is effective in removing the salt deposits.

74
Figure 3.23 Wetting force traces plotted against immersion depth during cleaning steps
(soaking in ultrasonic water bath and stirring in 1M H2SO4) to remove the salt deposits of
the cathode carbon paper substrate near the gas exit.
SEM images of the surface confirm, as shown in Figure 3.24, that the salt deposits
from the cathode carbon paper substrate are effectively removed after the ex-situ acid
solution cleaning. Therefore, it is indeed possible to remove salt deposits from the flow
field and the surface of the carbon paper substrate in-situ by pumping an acidic solution.
-3
-2
-1
0
1
2
3
0 2 4 6 8 10 12
Forc
e (m
N)
Position (mm)
1. As-received
2. After injection testing
3. After water cleaning
4. After acid cleaning

75
Figure 3.24 SEM surface images of cathode carbon paper substrate (a) after the CaSO4
injection testing and (a) after the ex-situ acid cleaning.
3.3.3.3. Ex-situ soaked carbon paper substrates
We have also investigated the effect of ex-situ application of foreign cations as
contaminants. While the primary purpose of this step is to produce consistent samples for
mitigation, we have also investigated the effect on the carbon paper substrate wettability.
Figure 3.25 shows water immersion cycles, including as-received, soaked in DI water and
soaked in cation contamination solutions (2.85 mM of CaSO4 and 2.85 mM of CaSO4 +
27.15 mM of H2SO4) at 80°C for 100 hours. An additional test is performed to investigate
how the added acid in the contaminant solution impacts the aging of the carbon paper
substrate surface using a solution with only 2.85 mM of CaSO4. The cathode surfaces
exposed to DI water and all contaminant solutions show the same aging level during the
ex-situ soaking test. As summarized in Table 3.2, wettability of the carbon paper substrate
after the ex-situ soak test (irrespective of the solution) is increased similar to the in-situ
test, but not as high, with an advancing contact angle of 155±4° and a receding contact

76
angle of 27±4° (equilibrium contact angle is 46±3°), compared to the as-received carbon
paper substrate with 165±3° and 63±4° (equilibrium angle is 75±3°), respectively. The
Wilhelmy plate method shows no distinguishable differences between the DI water and the
contaminant solutions.
Figure 3.25 Wetting force-immersing position curve in the submersion cycle for
determining the wetting properties in pure water of as-received, DI water soaked and
CaSO4 solution soaked carbon paper substrate at 80°C for 100 hours (ex-situ
contamination).
-3
-2
-1
0
1
2
3
0 2 4 6 8 10 12
Forc
e (
mN
)
Position (mm)
(a) As-received
(b) After soaking in DIwater
(c) After soaking Casolution
(d) After soaking inCa+acid soluiton

77
Table 3.2 The contact angles of water on the carbon paper substrate surfaces after the ex-
situ soaking in DI water and the cation contaminant solution.
As-received Soaked in Water Soaked in Ca Soaked in Ca+ Acid
Adv. Angle (°) 165±3 157±3 158±4 150±6
Rec. Angle (°) 63±4 21±6 19±4 16±2
Eq. Angle (°) 75±3 47±4 45±4 47±3
SEM/EDX of the carbon paper substrate soaked in the CaSO4 solution is shown in
Figure 3.26. Although a small amount of the contaminant precipitation is found on the
surface, this deposit is too small to affect the contact angle unlike the large deposits found
after the in-situ injection test. The change in the contact angle following soak in any of the
solutions is a result of degradation due to immersion in liquid water at high temperature. A
graphitized resin is typically used to bond carbon fibers in the carbon paper substrate. The
densification of these graphitized fibers weakens after immersing in water at the high
temperature, which increases the hydrophilicity of the carbon paper substrate [92].

78
Figure 3.26 Secondary electron image and the EDX map for the cation contaminant soaked
carbon paper substrate surface.
There was no difference in the wettability of MPL in either experiments, in-situ or
ex-situ contamination. No foreign species of contamination is seen on the MPL surface
after the contamination injection. This may be caused by impeded transport of cationic
solution to the MPL surface due to its very high contact angle, as received MPL has an
equilibrium contact angle of 145±5°.
3.3.3.4. Wetting agent effect on the carbon paper substrate/MPL surface
We have previously shown that the hydrophobicity of the MPL acted as a barrier
to the transport of foreign cations into the membrane [85,86]. The wettability behavior was
modified with 15% isopropanol (IPA) as a wetting agent in the cationic solution, and the
effect on the performance was verified by ex-situ soak method and by in-situ injection
method for both contamination and mitigation (recovery) processes. The added IPA fully
wets the carbon paper substrate and the MPL, and facilitates the transport of both
contamination and recovery solutions to the CCM across the hydrophobic MPL. Here, we

79
report the Wilhelmy plate method to quantify the changes in the wettability of the carbon
paper substrate and the MPL. The results of the Wilhelmy plate method on the carbon paper
substrate and the MPL in DI water and 15% IPA in DI water at room temperature, and 15%
IPA in DI water at 80°C are shown in Figure 3.27. The advancing wetting force is the lower
horizontal region and the receding wetting force is the upper horizontal region. The
negative value of the wetting force indicates the hydrophobic properties of the material in
the tested liquid. The virgin carbon paper substrate in DI water, at room temperature shows
a hydrophobic behavior in the advancing direction with the advancing contact angle of
165±3˚ and is hydrophilic in the receding direction with contact angle of 63±4˚. The carbon
paper substrate in 15% IPA in DI water shows much lower contact angles in both advancing
and receding directions, as listed in Table 3.3. The MPL is found to show super
hydrophobicity in water, mostly due to the wet proofing with PTFE. MPL surfaces exposed
to 15% IPA are changed from hydrophobic to hydrophilic, especially at 80°C. These results
verify that IPA can be used as a wetting agent to facilitate the transport of both
contamination and mitigation solutions across the MPL into the CCM.

80
Figure 3.27 Wetting force versus submersion position from the force tensiometer
measurement on the carbon paper substrate and the MPL with DI water and 15% IPA at
room temperature, and 15%IPA at 80˚C.
-3
-2
-1
0
1
2
3
0 2 4 6 8 10 12
Forc
e (m
N)
Position (mm)
Carbon paper substrate
CP in water
CP in 15% IPA
CP in 15% IPA at 80C
-3
-2
-1
0
1
2
3
0 2 4 6 8 10 12
Forc
e (
mN
)
Position (mm)
MPL
MPL in water
MPL in 15%IPA
MPL in 15%IPA at 80C

81
Table 3.3 The calculated advancing and receding contact angles of the liquid on the carbon
paper substrate and the MPL surfaces.
MPL Water 15%IPA 15%IPA at 80°C
Adv. Angle (°) 174±4 165±3 138±3
Rec. Angle (°) 142±6 57±5 0
Eq. Angle (°) 145±4 70±4 n/a
carbon paper substrate Water 15%IPA 15%IPA at 80°C
Adv. Angle (°) 165±3 149±2 127±6
Rec. Angle (°) 63±4 8±6 0
Eq. Angle (°) 75±3 42±4 n/a
3.4. Summary and conclusions
Mitigation strategies of membrane conductivity loss and mass transports loss due
to foreign cations were studied via in-situ and ex-situ methods. A long term contaminant
exposure to the fuel cell causes mass transport limitations due to water management by
deposits of the injected CaSO4 onto the carbon paper substrate and bipolar plates of the
cathode. The circulation of acid cleaning solutions in the cathode was a significantly
effective method for removing salt deposits of the carbon paper substrates and flow fields,
but the recovered cell performance was only improved slightly in the mass transport region.
In-situ H+ generation during operation at higher current densities than the typical operating
conditions may assist by cation migration towards cathode and eventually out of the MEA.

82
However, cell operation at the high current density/low cell voltage was ineffective to
recover performance losses for this high level of cation contamination.
The hydrophobic layer of GDM acted as a barrier for the transport of the acid
cleaning solution into the catalyst layer and the membrane during the cell performance
recovery process. The cationic contaminated CCM is not in direct contact with the acid
cleaning solution, being separated by the MPL. For the ex-situ cleaning method, cell
recovery was found if there was a direct contact between the acid solution and the
membrane ionomer by immersing the CCM in the solution without the GDM. For the in-
situ cleaning process, a wetting agent was added to the cationic contamination solution to
increase the wettability of the GDM. In situ recovery by acid or acid/wetting agent
solutions after contamination does not fully recover performance. The isopropanol led to a
weak recovery on the proton conductivity of the membrane and catalyst layers, but it results
its own irrecoverable performance loss.
Changes in the wettability of the cathode carbon paper substrate were studied using
the Wilhelmy plate method after the in-situ injection of a contamination solution into the
air stream of a polymer electrolyte fuel cell. A long term CaSO4 contaminant exposure
results in formation of the salt deposit in the cathode carbon paper substrate, and severe
blockage of the flow field near the outlet, resulting in the steep voltage drop. The Wilhelmy
plate method verified that the CaSO4 deposited on the carbon paper substrate surface
increases the wettability compared to the virgin carbon paper substrate. The CaSO4
precipitation on the carbon paper substrate can cause flooding leading to higher mass
transport losses. No salt deposits were visible in the MPL, likely due to its high
hydrophobicity as the contaminant solution cannot penetrate into the MPL. The ex-situ

83
cleaning with an acid solution was largely effective in removing the salt deposits and in
restoring the surface contact angles.
A wetting agent added to the contamination and the mitigation solution facilitates
the transport of solutions by increasing the wettability of the carbon paper substrate and
the MPL. Dynamic contact angles of the carbon paper substrate and the MPL were
measured and it was found that 15% IPA solution can render the highly hydrophobic
microporous layer and the carbon paper substrate fully hydrophilic; therefore the wetting
agent can be used to facilitate transport of the recovery solutions across the hydrophobic
layer into the cation contaminated CCM.

84
CHAPTER 4. A NOVEL MEA STRUCTURE FOR POLYMER
ELECTROLYTE FUEL CELLS OPERATING AT VERY HIGH
POWER DENSITY
4.1. Introduction
The fuel cell assembly incorporates a membrane electrode assembly (MEA), which
is comprised of the anode-electrolyte-cathode usually sandwiched between two gas
diffusion media (GDM) and bipolar plates. Conventional GDMs are comprised of a highly
porous carbon paper (CP) or carbon cloth substrate, typically coated with a thin MPL on
the CCM side. A small amount of hydrophobic material (usually polytetrafluoroethylene,
PTFE) is also applied to the GDM to enhance its water removal capabilities [93]. The GDM
provides mechanical structure for the electrode, distributes the reactant gases, and provides
electrical and thermal connection between the electrodes and the bipolar plates [1,22,94,95].
Among the key challenges for fuel cell commercialization are improved power density,
cost reduction, and durability of fuel cell components. High current density operation is
one path for cost reduction.
New schemes and designs for the MEA are required to support stable high current
density operation. The rate of oxygen reduction reaction in the cathode catalyst layer,
where oxygen combines with electrons, is considered to be the leading factor that limits
fuel cell performance. Liquid water in macro pores of the carbon paper substrate decreases
the fuel cell performance at high current density due to restricted oxygen transport to the
catalyst layer, which result in a sharp drop in the output voltage [26,96]. Liquid water in

85
macro pores of the carbon paper substrate decreases the fuel cell performance at high
current density due to the lack of oxygen reaching the catalyst layer [97]. Effective water
management is the key to minimizing mass transport losses.
In the last decade, micro-porous coatings (e.g. micro-porous layer, MPL) have been
developed to improve both the electrical/thermal contact between the carbon paper
substrate and the catalyst layers, as well as the water management. Through investigations
related to the MPL, it is found that the resistance between the catalyst layer and the GDM
can be reduced by improving the contact at the interface [98]. The MPL also prevents
catalyst penetration into the carbon paper referred as the catalyst supporting layer,
improving the catalyst utilization [24,99]. MPL is also found to improve water
management: the effects of different MPLs on water flooding and cell performance has
been investigated with various carbon loadings, materials, porosity and hydrophobicity
[23,24,100]. A maximum fuel cell performance was obtained with 0.5 mg·cm2 carbon
loading [101]. Qi et al. also suggested a carbon loading of 0.5 mg·cm2 with 35% PTFE in
the microporous sublayer to ensure improved cell performance [25]. A two-phase transport
fuel cell model has been developed to verity the performance improvement with lower
porosity and smaller pore size of the MPL [102]. Kangasniemi et al. verified the
electrochemical surface oxidation of the carbon powder on the MPL with a range of
potentiostatic treatment for 120 hours. Their results show that the carbon surface oxidation
decreases the hydrophobicity of the MPL and could cause water transport issues including
flooding [103]. The presence of the MPL on the cathode electrode or on both electrodes
showed improved performance and durability, even though there was no significant
difference in the effective water drag coefficient [104].

86
Traditionally, polytetrafluoroethylene (PTFE) is used as the hydrophobic agent that
is mixed with carbon powder in MPL fabrication. However, a poly(vinylidene fluoride)
(PVDF)-based MPL resulted in better cell performance by reducing mass transport losses
within the MPL, and has been found to have uniform and robust microstructures without
large cracks [105]. The effects of fabricating the MPL with fluorinated ethylene propylene
(FEP) and variable carbon loadings was also investigated. The cell with the MPL of 20%
FEP and the carbon paper of 10% FEP shows the best performance [106]. A porosity-
graded MPL fabricated by varying the content of the pore-former, which has increasing
MPL porosity from the catalyst layer/MPL interface to the carbon paper substrate/MPL
interface, has better fuel cell performance than a conventional single-layer MPL. This
improved performance is indicated to be due to the variation of capillary force that result
from the graded structure [107]. The carbon paper substrate with a linear gradient porosity
was computationally verified for better liquid water control and less liquid water remaining
in the carbon paper substrate pores [108].
Kotaka et al. introduced a concept where the carbon paper substrate is removed,
and the GDM consisting of only the MPL is manufactured separately, and the cell is then
assembled similar to a conventional GDM [109]. Neutron radiography was conducted to
visualize liquid water across the cell thickness, and it is found that in the case of the carbon
paper free (i.e. MPL only) cell, there was no water accumulation at the interface between
the MPL and the catalyst layer, in contrast to the conventional cell (carbon paper and MPL).
This new configuration without the carbon paper had a significant performance
improvement with minimal mass transport issue due to better water management and
improved oxygen transport, and decrease in electron resistance.

87
The self-standing, thin MPL with a thickness of 100µm was brittle and hard to
handle during the cell assembly, and this resulted in reduced mechanical stability of the
MEA. The MPL is conventionally fabricated onto the carbon paper substrate; therefore,
the interface between the MPL and the catalyst layer may have thermal and electrical
resistance due to the interfacial gaps and uneven compression. This may cause reduction
in contact surface area, and thermal disruptions due to decreased conductance in the
interfacial gaps. These micro-gaps may also induce interfacial delamination in long term
operation [110,111]. Figure 4.1(a) shows a cartoon of the imperfect interfacial contact
between the MPL and CL due to the inherent surface roughness which results in a reduction
of contact surface, which increases the electrical resistance and causes a thermal disruption
due to interfacial gaps and uneven compression [110].
Contact resistance of the assembled MEA plays an important role in the fuel cell
performance. Imperfect contact between the surface roughness of the MPL/CL causes
interfacial gaps and uneven compression leading to disruption of heat transfer and
interfacial contact delamination, resulting in thermal and diffusional resistances [112]. The
separation plane between the MPL and CL was found in the range of 5-10 µm [110]. Liquid
water accumulation in these voids as water pooling volumes between the MPL and the
catalyst layer can affect the limiting current density by increasing ohmic and reactant mass
transport losses [113]. The water retention in these interfacial gaps may cause a serious
MEA delamination during freeze/thaw cycles. The objective of this current study is to
overcome this issue by directly depositing MPL onto the catalyst layer (CL). As shown in
Figure 4.1(b), the new MEA structure can be expected to result in increased contact surface
area, hence a reduced electronic and thermal contact resistance of the interface between

88
these two layers. This one piece MEA significantly simplifies the fabrication and the cell
assembly processes, compared with the traditional cell assembly that fuel cell components
(membrane, electrode, MPL and carbon paper substrate) are fabricated individually and
then assembled together in the cell hardware with a precision alignment. The new MEA
can be a promising cost-effective approach for the fuel cell manufacturing process.
(a)
(b)
Figure 4.1 Schematic of the MPL/CL interfacial contact; (a) MPL is separately fabricated
(conventional method) and (b) MPL is directly deposited on the CL (new method).
In this chapter, the gas diffusion media similarly consists of MPL only, however
the MPL is directly deposited on the CCM, which is expected to provide an improvement
in the contact between the MPL and the CCM. In addition, direct deposition onto CCM

89
should resolve issues stemming from fabricating self-supporting thin MPLs, it also allows
a functional grading of the MPL for improved mechanical strength, and optimized gas
transport and water removal. This chapter presents further characterization studies and the
performance stability at the high current density of the new MEA structure.
4.2. Experimental
4.2.1. Preparation of MPL ink
In the conventional MPL fabrication process, a high temperature heat treatment
after MPL ink deposition onto the carbon paper substrate is required to evenly distribute
the hydrophobic material throughout the surface for the last fabrication step. The
conventional MPL fabrication uses PTFE as the hydrophobic material that sinters at around
340ºC. However, this high sintering temperature is not acceptable for our approach, in
which has the CCM and the MPL will be subject to the heat treatment together. The high
temperature would result in irreversible damage for the polymer electrolyte membrane
when the MPL ink is directly deposited onto the CCM. Therefore, Polyvinylidene fluoride
(PVDF)-based copolymer (Kynar Powerflex® LBG, Arkema Inc., PA) was used as the wet
proofing agent due to its lower sintering temperature and high solubility in acetone
compared to PTFE. Bulk carbon powder (Vulcan XC-72R Carbon Black, Cabot Corp., MA)
was heat-treated to produce high purity carbon particles in a furnace at 450°C for 4 hours.
The carbon particles were then dispersed and ultra-sonicated in dimethylformamide (DMF,
ACS 99.8+%, Alfa Aesar, MA) to obtain uniform dispersion using a homogenizer and an
ultrasonic water bath. The PVDF powder was stirred and dissolved in acetone at 40°C until
it changed to a clear solution.
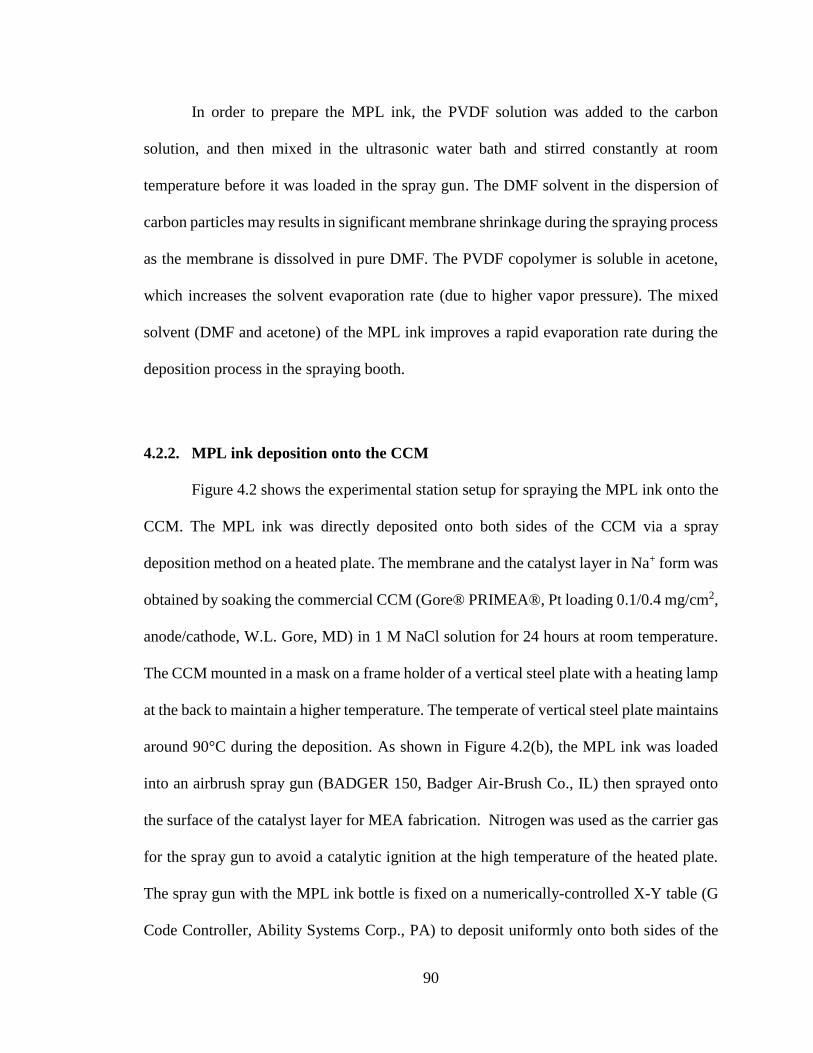
90
In order to prepare the MPL ink, the PVDF solution was added to the carbon
solution, and then mixed in the ultrasonic water bath and stirred constantly at room
temperature before it was loaded in the spray gun. The DMF solvent in the dispersion of
carbon particles may results in significant membrane shrinkage during the spraying process
as the membrane is dissolved in pure DMF. The PVDF copolymer is soluble in acetone,
which increases the solvent evaporation rate (due to higher vapor pressure). The mixed
solvent (DMF and acetone) of the MPL ink improves a rapid evaporation rate during the
deposition process in the spraying booth.
4.2.2. MPL ink deposition onto the CCM
Figure 4.2 shows the experimental station setup for spraying the MPL ink onto the
CCM. The MPL ink was directly deposited onto both sides of the CCM via a spray
deposition method on a heated plate. The membrane and the catalyst layer in Na+ form was
obtained by soaking the commercial CCM (Gore® PRIMEA® , Pt loading 0.1/0.4 mg/cm2,
anode/cathode, W.L. Gore, MD) in 1 M NaCl solution for 24 hours at room temperature.
The CCM mounted in a mask on a frame holder of a vertical steel plate with a heating lamp
at the back to maintain a higher temperature. The temperate of vertical steel plate maintains
around 90°C during the deposition. As shown in Figure 4.2(b), the MPL ink was loaded
into an airbrush spray gun (BADGER 150, Badger Air-Brush Co., IL) then sprayed onto
the surface of the catalyst layer for MEA fabrication. Nitrogen was used as the carrier gas
for the spray gun to avoid a catalytic ignition at the high temperature of the heated plate.
The spray gun with the MPL ink bottle is fixed on a numerically-controlled X-Y table (G
Code Controller, Ability Systems Corp., PA) to deposit uniformly onto both sides of the

91
catalyst layer. The sprayed-CCM was kept at high temperature by the heating lamp to avoid
shrinkage and swelling of the catalyst layer and the membrane during spraying due to
uneven evaporation. Acetone was also added to the MPL ink to accelerate evaporation to
minimize the contact of the CCM with the solvent (DMF).

92
Figure 4.2 Spray station setup for the MPL application with (a) a numerically-controlled
spray booth, (b) a nitrogen‐driven spray gun with a CCM frame, and (c) a vertical steel
plate with a heating lamp.
As shown in Figure 4.3, the spraying cycles were composed of 4 up & down strokes
and 4 left & right strokes with 3.175 mm steps until the desired MPL thickness was

93
obtained. The desired thickness of the MPL was selected between 50 and 100µm to provide
enough mechanical stability for the CCM while maintaining minimal mass transport
resistance. Once the deposition on one side was completed, the MPL sprayed CCM was
left on the frame holder for 10 minutes to evaporate the remaining solvent and completely
dry the MEA, then the other side was sprayed by the same process. The sprayed MEA was
heat-treated between two flat carbon plates for 1 hour at 160°C to distribute the PVDF
homogeneously throughout the MPL.
Figure 4.3 MPL solution spraying cycles; total cycles: 2 horizontal + 2 vertical + 2
horizontal + 2 vertical.

94
4.2.3. Characterization
After the heat treatment, the MEA was subjected to initial characterization using a
scanning electron microscope at 5-10kV accelerating voltage and 1000X magnification
(SEM, FEI ESEM Quanta 250, Hillsboro, OR) with an energy-dispersive X-ray
spectroscopy (EDX) element mapping. The cross-section samples were prepared using a
freeze fracture technique after immersing in liquid nitrogen. Mercury intrusion porosimetry
(MIP, AutoPore IV, micromeritics, GA) was used to quantify porosity and pore size
distribution of the porous structure of the MPL. Ion exchange capacity (IEC) of the MEA
before and after heat treatment was measured by a titration procedure. The MEA was
soaked in 50 mL of 2 M NaCl solution for 24 h followed by titration with 0.01 M NaOH
to the phenolphthalein end point. A blank consisting of 50 mL of 2 M NaCl was also titrated.
The details of the experimental setup and the test procedure for the wettability
measurement are described in chapter 2. Briefly, dynamic contact angles were measured
with a Krüss K100 tensiometer (Krüss GmBH, Germany) following the Wilhelmy method
[114]. The wettability of the conventional GDM (Freudenberg C4, Freudenberg FCCT SE
& Co. KG, Germany) was also measured for comparison purposes. To measure the contact
angle of only the MPL side of the conventional GDM, the sample was prepared by
combining two samples back to back using a thin double sided tape, as shown in Figure
4.4. The sample was then mounted on the force sensor holder of the tensiometer, and then
scanned in both advancing and receding directions with a scan rate of 6 mm/min and a
maximum distance of 10 mm. The contact angle measurement was repeated three times for
each case with three separate samples from the same MPL batch, with the average given
as the final angle.

95
Figure 4.4 Sample preparation for measuring the wetting force of the MPL surface in the
force tensiometer.
Cross-section samples of the MPL-sprayed CCM was prepared in epoxy stubs for
SEM analysis. As shown in Figure 4.5, a sample mounting cup fills with a mixture of
SpeciFix resin and curing agent (SpeciFix-20 Kit, Struers Inc., Westlake, OH), and the
epoxy stub is dried overnight at room temperature. The mass ratio between the resin and
curing agent was set to 7:1. The epoxy stub with the embedded CCM face down was
mounted in the automatic polisher until the sample is exposed. The epoxy samples were
then sputter coated with gold for the SEM analysis.

96
Figure 4.5 CCM sample is placed in the epoxy stub.
4.2.4. Cell performance test
The cell performance tests were performed on a gold plated aluminum alloy cell
hardware with an active area of 1 cm2, which minimizes the effect of gas concentration
variation in the flow direction due to small active area [109]. PTFE and silicone gaskets
were applied to control the cell pinch and for sealing the reactant flows. As schematically
shown in Figure 4.6, the one of main function of carbon paper substrate is to distribute
reactant gas from flow channel to CL, as well as liquid water removal, in the in-plane and
through-plane directions. In our case, the carbon paper substrate is removed therefore there
is no sufficient through-plane thickness to enable in-plane transport, hence, a micro-
channel flow field with much shorter in-plane transport distance was used.

97
(a)
(b)
(c)
Figure 4.6 Schematic of cell configurations; (a) carbon paper substrate/CCM with
conventional single serpentine channels, (b) new MEA with conventional single serpentine
channels, and (c) new MEA with micro-channels.
The machined end plates were composed of micro parallel flow channels with ribs
and channels of 0.2 mm width. A fuel cell test station (890CL, Scribner Associates, Inc.,
NC) was used to control gas and cell temperatures, flow rates and relative humidity. A
potentiostat/galvanostat (Solartron SI 1287, Solartron Metrology, NC) was used to provide
precise linear measurements of current and voltage at small currents for the small size cell

98
hardware. High frequency resistance (HFR) from the electrochemical impedance
spectroscopy (EIS) data was obtained using a frequency response analyzer (Solartron 1255).
4.3. Results and discussion
In conventional MPL fabrication, heat treatment at high temperatures is necessary
to uniformly distribute the hydrophobic agent throughout the MPL. With the original MPL
only concept, the MPL ink generally contains strong solvents [101,115], which are
removed during the heat treatment process, and consequently the CCM does not encounter
these solvents. These solvents are found to rapidly dissolve the ionomer in the catalyst
layers, causing the catalyst layer to quickly disintegrate or delaminate. Therefore, in direct
deposition of the MPL, we found out that the CCM that is being coated needs to be kept at
an elevated temperature in order to rapidly evaporate the solvent before it can affect the
ionomer in the CL. We achieve this by keeping the spray booth at a high temperature, using
a heated sample plate and a pair of symmetrically placed heat guns pointed towards the
spray. This set up enable quick evaporation of the solvent before it gets into the PFSA
ionomer in the catalyst layer.
The PTFE dispersion, which is commonly used in the MPL, is not usable for
NafionTM based MEAs due to its thermal limit. PVDF copolymer which tends to be a
proper solubility in common solvents, even in acetone, and lower melting point than PVDF
homopolymer because of its lower crystallinity [116]. Figure 4.7 shows the heat treatment
of multiple wetproofing agents, PVDF copolymer, PVDF homopolymer, and PTFE at
160ºC. It is seen that the PVDF copolymer melts uniformly and covers the surface,
compared to the other fluoropolymers (PVDF homopolymer and PTFE). This result

99
confirms that the PVDF copolymer in the spray ink melts at the relatively low temperature
(160ºC, safe for CCM in Na+ form) and well distributed throughout the MPL in a short
time during the heat treatment.
Figure 4.7 Melting point verification test for hydrophobic materials in the hot pressing for
1 hour at 160°C; (a) PVDF copolymer, (b) PVDF homopolymer, and (c) PTFE.
4.3.1. Microstructure of the MPL and the interface
As shown in Figure 4.8, the sprayed MPL on the CCM produces a firm integrated
interface of the MPL/CL, which results in reduced electronic contact resistance and
improved contact surface area without interfacial gaps and irregular compression pressure.

100
A reduction in the inherent surface gaps at the MPL/CL interface is expected to reduce the
water accumulation at these tiny gaps without interfacial separations. Therefore, this MEA
can eliminate the water accumulation at the interfacial voids of the MPL/CL resulted in
lower interfacial oxygen and water transport resistance. Moreover, a desirable micro-
porous structure is observed in the deposited MPL layer, which provides water vapor
transport to the flow field, attractive pathways for reactant gases from the microchannel
flow field throughout the membrane, and mechanical support for the electrodes.
Figure 4.8 SEM micrographs of interface between the catalyst layer and the deposited
MPL (blue arrows indicate the interface): (a) anode and (b) cathode.
Figure 4.9 shows the elemental mapping of Pt and F (obtained by EDX) in the MEA
cross-section to investigate the MPL distribution and the physical condition of the CCM
after spray fabrication processes and heat treatment. The EDX analysis was performed at
an accelerating voltage of 15 kV to obtain the best resolution without damaging the
membrane. The cathode is thicker than the anode because of the (nominal) Pt loading; 0.4

101
and 0.1 mg/cm2 for cathode and anode, respectively. F, consequently the hydrophobic
material, PVDF (-(C2H2F2)n-), is seen to be uniformly distributed throughout the MPL
cross-section. The EDX element mapping indicate that the sprayed MPL ink
homogeneously covers the CCM with no apparent changes in the elemental composition
of the membrane or the catalyst layer.
Figure 4.9 EDX element mapping of the CCM with MPL on both sides: (a) Pt and (b) F.
4.3.2. Optimization of the MPL porosity
The optimization of the porosity in the MPL is required to lower mass transport
losses and will maintain the balance between maintaining membrane hydration and
avoiding the flooding of the cathode with liquid water. Conventionally, PTFE is used as
the hydrophobic agent of the MPL to maintain rigid carbon particle agglomeration and to
assist in liquid water removal. These agglomerates normally have pore sizes in a range of
0.1-0.5 nm in the MPL [117,118]. In our work, the one piece MEA uses PVDF for the
hydrophobic agent as outlined above due to fabrication processing requirements. Figure
4.10 shows a comparison of morphological data of the pore structures in this new MPL

102
with the MPLs of the commercially available GDMs (Freudenberg C4 and SGL 25BC).
Pore morphology of the deposited MPL (30 wt% PVDF) is found to be similar to those of
commercial MPLs.
Figure 4.10 SEM cross-sectional views of MPL pore structure of (a) Freudenberg C4, (b)
SGL 25BC, and (c) current work.
Pore size distribution and porosity of each component in the MEA are the major
parameters used for performance optimization, especially for water management. Pore size
distribution affects the gas permeability and the capillary pressure. The large pores produce
better reactant distribution but a large amount of liquid water can accumulate in these
macro-pores. The small pores have a higher capillary pressure (for hydrophobic media,
θ>90º) and the gas permeability is lower (~d-2). Figure 4.11 shows pore size distributions
(PSD) of conventional GDMs and our PVDF-based MPL measured by mercury-intrusion
porosimetry (MIP). Conventional GDMs have macro-pores and micro-pores, which
indicate the carbon paper substrate and the MPL, respectively. PSD of our MPL is matched
to commercial MPLs without any further optimization process. It is found that the PVDF
content alters the PSD; the peak of the PSD shifts to smaller pores with lower PVDF

103
content in the MPL ink. Higher PVDF loading in the MPL ink results in larger micro pores,
possibly because additional empty spaces in the sprayed PVDF network is removed and
the remaining PVDF is melted down and cured during the baking process below the
melting point as the last fabrication step. These results correlate well with previous results
with different PTFE content [119]. The mixture ratio of carbon/hydrophobic material
seems to be a key factor for determining the pore size distribution in the MPL. The
optimization of the porosity in the MPL will lead to lower mass transport losses and will
minimize flooding by product water in the fuel cell. In here, it is noted that no optimization
of the MPL layer is performed, only the capability of replicating commercial MPL
properties with the current fabrication method is demonstrated. Future studies shall
consider an optimization of the MPL microstructure and the ink composition for an MPL
only diffusion media.
Figure 4.11 Pore size distribution of the carbon MPL ink with 10, 30 and 50%wt PVDF,
Freudenberg C4 and SGL 25BC.
0
0.5
1
1.5
2
2.5
0.001 0.01 0.1 1 10 100 1000
Log
Dif
fere
nti
al In
tru
sio
n (
mL/
g)
Pore Diameter (µm)
10wt% PVDF
30wt% PVDF
50wt% PVDF
Freudenberg C4
SGL 25BC

104
4.3.3. Wettability measurement
Wettability of the MPL is a major parameter governing the water management
capabilities. Typically, sessile drop measurements used to measure the contact angle,
however rough and heterogeneous surface of the carbon paper substrate and the MPL cause
variations of the contact point in the sessile drop measurement and result in inaccurate
contact angle measurement. The tangent of a fitting curve assessment of the drop profile
can be unclear for optical analysis methods due to image diffraction or scattering noises,
especially in the case of uneven porous structure [120]. In this work, therefore, the
Wilhelmy plate method is used to measure the wetting force between the liquid surface and
the test sample. This method involves the use of a pre-weighed sample, and accounting of
the buoyancy force and wetting force using a precise force sensor. Advancing and a
receding contact angles are determined from the measured force data, as the solid flat
sample is pushed into or pulled out of the liquid (e.g. DI water) [121].
The dynamic contact angle of liquids against solid surfaces is indirectly determined
from force data as the solid flat sample is pushed into the liquid until the maximum depth
and pulled out of the liquid to the initial position. The results of the Wilhelmy balance
measurements of the MPL in DI water are shown in Figure 4.12. The lower set of forces
until the maximum immersing position (0-10 mm) represents the advancing wetting force
and the upper set of forces until back to initial position (10-0 mm) represents the receding
wetting force. The negative values of the wetting force mean the upward direction force on
the sample (i.e. for hydrophobic surfaces), and the positive values describe the downward
direction force (i.e. for hydrophilic surfaces). The receding process of the carbon paper
substrate shows that water retention is on the carbon paper substrate surface due to its

105
hydrophilic characteristics, while the meniscus between the MPL surface and water
indicates the hydrophobic surface and its water removal capabilities. The contact angle can
be then calculated from the wetting force with known sample perimeter and liquid surface
tension. The contact angle of water on the carbon paper substrate and the MPL is
determined by fitting the steady advancing and receding force balances to the linear
portions of submersion and immersion forces employing the Wilhelmy balance equation
[122,123];
𝑭 = 𝒑𝜸𝒄𝒐𝒔𝜽 + 𝒎𝒈 − 𝝆𝑽𝒈
where, m is sample mass, g is gravitational acceleration, p is sample wetted length
(perimeter), γ is liquid surface tension, ρ is liquid density and V is sample wetted volume.
The first (𝒑𝜸𝒄𝒐𝒔𝜽) and third (𝝆𝑽𝒈) terms represent the wetting force and the buoyancy
force, respectively.
The tensiometer force measurement was repeated three times using three separate
samples from the same batch, with the average given in the final contact angle. For the non
wetproofed carbon paper of the Freudenberg C4, the advancing contact angle is 165±3°
and the receding contact angle is 63±4°. The calculated advancing contact angles on the
MPL of Freudenberg C4 and the MPL of this newly fabricated MEA are 174±4˚ and
171±5˚, respectively; and the receding contact angles are 142±6˚ and 138±4˚, respectively.

106
Figure 4.12 The wetting force versus position from the tensiometer force measurement on
the fabricated MPL (30 wt% PVDF) in the new MEA and the commercial MPL
(Freudenberg C4) with DI water.
4.3.4. Ion exchange capacity
Ion-exchange capacity (IEC) describes the number of side-chains available in units
of mmol/g of dry polymer (mole of H+/weight of dry PFSA), following a titration method
[89]. In this case, IEC is measured to verify the health of the ionomer in the catalyst layers
and the membrane. As shown in Figure 4.13, the fabricated MEA (the MPL deposited CCM
on both sides) shows same IEC value as an as-received CCM, confirming that sulfonic acid
groups in the membrane remains intact during the fabrication process, and the following
heat treatment.
-3
-2
-1
0
1
2
3
0 2 4 6 8 10
Forc
e (
mN
)
Position (mm)
CP of Freudenberg C4
MPL of Freudenberg C4
Fabricated MPL
Receding
Advancing

107
Figure 4.13 Ion exchange capacity values for the fresh CCM and the MPL deposited
CCM on both sides after the heat treatment.
4.3.5. Performance
The fuel cell performance for two different MPL thicknesses are shown in Figure
4.14. After several tests, some of the gold coating in the micro-channel field had peeled off
from the aluminum alloy hardware due to a galvanic corrosion of two dissimilar materials
(Au and Al) at small channels of 0.2 mm, and high cell resistance was measured. Thus, the
iR-free polarization curves are shown here instead. These MEAs have MPLs that was
directly deposited onto both sides of the CCM with 50 and 100 µm deposition thickness.
The MPL deposition was only applied to a small active area about 1 cm2 using a spray
mask frame to match the flow field size. A micro-channel flow field was used to provide
the reactant distribution throughout the cell. A conventional fuel cell configuration
(CCM/MPL/carbon paper substrate) was a also assembled with a single serpentine flow
field was prepared to compare the performance with these MEAs. The new MEA with 50
µm MPL thickness shows better performance due to higher water drainage and reduction
0
0.2
0.4
0.6
0.8
1
1.2
IEC
(m
M/g
)
As-receivedCCM
MPL depositedCCM on bothside

108
of oxygen transport resistance. The carbon paper substrate was found to be one of the main
reasons for high oxygen transport resistance due to liquid water plugging and slugging in
its macro pores [109].
In conventional cell designs, cell performance fluctuations are mainly caused by
flooding from periodic accumulation and removal of liquid water in the cell, especially at
the high current densities. More stable performance was achieved using the new MEA
while significant cell voltage fluctuations are present in the conventional cell at the mass
transport region. The cell with thinner (50µm) MPL exhibits better performance than the
thicker (100µm) MPL, especially in the mass transport region. It seems that the increased
thickness of MPL increases the cell resistance and mass transport polarization. Noting that
this MPL is not optimized, the results show that this new method of MEA fabrication can
be an effective design for high power density operation, and the mass transport limitations
can be reduced with this new concept. These results suggest that the design of MEA
components plays a significant role in achievement of high current density operation

109
Figure 4.14 Comparison of polarization curves of two difference MPL thickness onto
commercial CCM and the conventional cell; cell temperature: 80°C; relative humidity
(A/C): 100/100%; flow rate (A/C): 1/1 slpm; back-pressure (A/C): 10/10 psig.
4.4. Summary and conclusions
A new MEA structure is investigated to enable high current density operation in
PEFCs. In this design, the carbon paper substrate is eliminated and the entire GDM consists
of only the MPL fabricated via direct spray deposition method onto CCMs. A custom
fabrication setup is developed using a spray booth at high temperatures, and a PVDF
copolymer is found to be suitable wet proofing agent for this new MEA design. This
0
0.2
0.4
0.6
0.8
1
0 0.5 1 1.5 2
iR-F
ree
Ce
ll V
olt
age
(V)
Current Density (A/cm^2)
50µm MPL
100µm MPL
Baseline

110
concept provides an improvement in the interfacial contact between the MPL and the
catalyst layer, and is expected to reduce thermal and electrical resistances, as well as
reducing water accumulation at the interfacial contact plane. No evidence of damage to the
CCM or the membrane or change in the morphology of the catalysis layer is observed after
the spray deposition and the heat treatment. Appropriate pore size distribution of micro-
porous structure was obtained in the deposited MPL layer compared to the MPLs of
existing commercial GDMs. The cell performance shows that the MPL deposited-CCM
can achieve high performance during high current density operation, and the new MEA
configuration can be effective in improving stability at high current densities.

111
CHAPTER 5. WETTING PROPERTIES OF THE
ELECTROLYTE MATRIX OF MOLTEN CARBONATE FUEL
CELLS
5.1. Introduction
Among several types of fuel cells, molten carbonate fuel cells (MCFCs) are high-
temperature fuel cells that use a molten carbonate salt mixture as an electrolyte integrated
in a porous ceramic matrix. Since the cell operating temperature is over 600°C to achieve
sufficient conductivity of the electrolyte, noble metal catalysts such as platinum (Pt) are
not required and relatively low-cost metal cell components such as nickel(Ni) and nickel
oxide (NiO) can be used in MCFCs. MCFC systems are being developed for large
stationary power generations of natural gas and coal-based power plants, which can even
achieve efficiencies of over 85% with a cogeneration using the generated waste heat [124].
Major disadvantages associated with MCFC systems arise from using a liquid electrolyte
at high temperature followed by handling problems with the molten electrolyte rather than
a solid electrolyte and serious durability issues due to high temperature corrosion of
electrodes and electrolyte matrix. The MCFC consists of porous nickel anode, porous
nickel oxide cathode, and an ion-conducting electrolyte matrix. A ceramic powder and
fibers formed to a sheet is penetrated with the carbonate electrolyte as the electrolyte matrix.
The ceramic material is used to contain the molten carbonate electrolyte which is extremely
corrosive over 600°C [125,126]. The smallest pores of the electrolyte matrix should

112
maintain completely occupied with molten carbonate, while the porous gas diffusion
electrodes are partially covered by a thin film of electrolyte [127,128]. The surface tension
of the molten carbonate and the wetting property of the electrolyte matrix in the solution
significantly affect the performance of MCFC.
The wettability and pore structure in the electrolyte matrix is an important factor to
directly affect the cell performance for MCFCs. It is challenging to measure the wettability
of the electrolyte matrix in the molten carbonate at high temperatures especially tested
matrix due to its complex shape and brittle status. A proper measurement technique should
be identified in oxidant and reducing atmospheres as the MCFC working condition. The
overall objective of this chapter is to measure contact angles and wetting forces of ceramic
matrix (virgin and tested samples) in the cathode electrolyte using a force tensiometer at
different environment. This chapter covers (i) development of a proper experimental setup
and a useful method for measuring the wettability of the MCFC electrolyte matrix at high
temperature and (ii) wettability evaluation for virgin and used samples after thousands hour
operations at various gas mixtures.
5.2. Experimental
Figure 5.1 shows a drawing of the experimental setup for the wetting force
measurement system and gas flow direction. As shown in Figure 5.2, mass flow controllers
and a humidifier were installed to the K100 tensiometer for simulating dry and humidified
(45% RH) gas condition. An alumina crucible (High Purity 50 dia. x 35 H mm Cylindrical,
MTI Corporation, CA) with nichrome heating wires covered by ceramic sleeving (Nextel
312, Alumina-Borica-Silica fiber, OMEGA, CT) are used to melt down and contain the

113
carbonate power. The fabrication procedure of aluminum heated vessel is shown in Figure
5.3. An alumina single bore tube was attached inside of the crucible to isolate a
thermocouple from the molten carbonate, which can protect contamination of the cathode
electrolyte from the thermocouple probe corrosion. A ceramic bond (CERAMABOND,
Aremco Products, INC., NY) was used to attach the alumina tube. The small alumina tube
attached crucible was dried at room temperature for 2 hours, and then cured at 90°C and
260°C for 2 hours at each temperature.
Figure 5.1 Schematic diagram of the wetting force measurement system and gas flow
direction.

114
(a) Flow meters for gas mixture
(b) Saturator and heated gas line
Figure 5.2 Experimental setup of (a) gas flow controller and (b) saturator to evaluate the
electrode wetting property in oxidant and reducing atmospheres as the MCFC working
condition.

115
Figure 5.3 Fabrication procedure of the aluminum heated vessel.
The dynamic contact angle of the electrolyte matrix is measured with a Krüss K100
tensiometer, following the Wilhelmy plate method. As shown in Figure 5.4 (a), the force
tensiometer generally uses a tweezer style sample holder in one-point pressure for solids
in plate form. Figure 5.4 (b) shows our new design sample holder made by a steel to evenly
distribute holding pressure on the plate sample during the measurement, which can rigidly
hold easily brittle matrix samples at high temperature.

116
(a) (b)
Figure 5.4 (a) Original sample holder and (b) new design of the sample holder for the
force tensiometer.
As shown is Figure 5.5, aluminum crucible with heating wires, Pyrex glass cover,
gas phase regulating hood are used to apply the MCFC operating conditions in the different
temperature and gas mixture. The tensiometer force sensor is very precise electrobalance.
Therefore, the force sensor should keep in room temperature condition. The force sensor
can be separated from gas mixture and high temperature with the gas phase regulating hood.
The capillary rise method indicates that the amount of molten carbonate penetrating
into the matrix pores is measured against time. The sample is not completely immersed
into the liquid, but the electrolyte matrix is just touching the liquid surface and then
measure the rate of water uptake into the matrix pores [71]. A scanning electron microscope
(SEM), energy dispersive X-ray spectroscopy (EDX), and a mercury intrusion porosimetry
(MIP) are used for morphology analysis before and after the wettability measurement.

117
(a)
(b)

118
(c)
Figure 5.5 New design of gas phase regulating coat to insert gas mixture for the contact
angle measurement; (a) design concept of the new gas hood, (b) customized Pyrex glass
and steel cover, and (c) gas hood installation in the tensoimeter.
5.3. Results and discussion
5.3.1. Wilhelmy plate method
As explained in Chapter 2, the Wilhelmy plate method measures the wetting force
between the liquid surface and the test plate. This measurement requires the use of a pre-
weighed sample and accounting for the wetting force via a precise electro balance, which
is corrected by the buoyant force. The dynamic contact angle of liquids against solid
surfaces is indirectly determined from force data as the solid flat sample is pushed into or
pulled out of the liquid to quantify wetting changes [69].

119
The advancing contact angle and the receding contact angle are determined from
the measured force data of the tensiometer, as the solid flat sample is pushed into and pulled
out of the liquid (e.g. molten carbonate electrolyte), respectively. Negative values of the
wetting force represent the upward direction force on the sample resulting in hydrophobic
surface, and positive values the wetting force describe the downward direction force on the
sample resulting in hydrophilic surface. The wetting force at three-phase line by the
Wilhelmy technique is not changed for a uniform solid sample expect in the transient
region of the force plot. Table 5.1 shows the virgin and used matrix sample list for this
project. The used electrolyte matrix samples are after long term operation (2000h - 44000h)
of MCFC power plant applications (FuelCell Energy, Inc., Danbury, CT). The electrolyte
matrix is soaked in methanol (2-3 time dip washing) and then dried at 200°C for 3 hours
to completely remove the remaining moisture in the porous structure. All samples are
stored in a plastic vacuum chamber after the cleaning. Various gas mixture of the MCFC
operation condition are evaluated as shown in Table 5.2.

120
Table 5.1 List of the test sample.
Name Description
Thin Gold Foil reference
Fresh 1 standard burnout matrix (500°C/2h)
Fresh 2 extended burnout matrix (650°C/150h)
Used matrix 1 washed matrix, after 2000h fuel cell running
Used matrix 2 washed matrix, after 8000h fuel cell running
Used matrix 3 washed matrix, after 19000h fuel cell running
Used matrix 4 washed matrix, after 44000h fuel cell running
Table 5.2 List of gas mixture.
Name Description
Gas 1 4% H2 + 96% N2, 9% humidified (saturator temp, 45°C)
Gas 2 4% H2 + 10% CO2 + 86% N2, 9% humidified (saturator temp, 45°C)
Gas 3 19.1% CO2 + 12.5% O2 + 68.4% N2, 3% humidified (saturator temp, RT)
Figure 5.6 shows wetting processes for the dynamic contact angle due to wetting in
the molten carbonate (FCE cathode electrolyte) while measuring the force on a thin gold
foil, which is to compare Li-Na carbonate literature data. The lower set of forces (1-3) until
10 mm immersing position are the advancing wetting force into the liquid, and the upper
set of forces (4-6) until back to initial position are the receding wetting force from the liquid.
The resultant force during initial development of the meniscus is referred to as the transient
force, which is shown as region 2 in Figure 5.6. Another transient period is shown in region

121
4, in which the wetting force little increases when the liquid-solid interface transitions from
the advancing to the receding shape. The lower and upper plateau regions of the wetting
force plot are used to calculate the advancing and the receding contact angles of the molten
carbonate on the gold foil, shown as region 3 and region 5, respectively. If the surface
tension (γ) of the molten carbonate salt from the NIST data book [129] (Li2CO3-Na2CO3,
50%-50%, @650˚C), 0.239 mN/mm, is used to calculate contact angles, the advancing
contact angle is 53±3˚ and the receding contact angle is 36±5˚. The standard deviation of
the three measurements is associated with the experimental error.

122
Figure 5.6 Wetting processes of Wilhelmy plate method for the dynamic contact angle
measurement while measuring the force on the gold foil in the molten carbonate at reducing
atmosphere (4% H2 + 96% N2, 3% humidified) and the heated vessel of 650°C.
As shown in Figure 5.7 (b), the standard burnout matrix (500°C for 2 hours) is
completely disintegrated with little fire and spark as soon as the sample reached the molten
carbonate solution in 4% H2+10% CO2+86% N2 at room temperature (3% humidified gas)
and liquid temperature of 600°C. Figure 5.7 (b) shows that the extended burnout matrix
has no damage after the measurement. Therefore, the extended baking time is a proper way
to make the ceramic electrode matrix for the MCFC power system.

123
(a) Standard burnout matrix (b) Extended burnout matrix
Figure 5.7 (a) Standard (500°C for 2 hours) and (b) extended (650°C for 150 hours) burnout
matrix samples after dipping into the molten carbonate salt at 600°C.
As shown in Figure 5.8 , there are no significant differences between fresh and used
electrolyte matrix samples because the highly porous structure is completed wet in a very
short time by dipping into the molten carbonate electrolyte in the Wilhelmy plate method
with a scan rate of 6 mm/min and a maximum distance of 3 mm. The surface tension (γ) of
the molten carbonate salt from the NIST data book [129], and the advancing/receding
contact angle is 16±6° for all cases.

124
Figure 5.8 Wetting force against immersion depth for the FCE matrix samples in the molten
carbonate at 4% H2+10% CO2+86% N2 (3% humidified) and 600°C.
5.3.2. Washburn method
As shown in Figure 5.9, Washburn theory indicates that a porous solid is brought
into contact with a liquid, such that the ceramic matrix is not submerged in the molten
carbonate, but rather is just touching the liquid surface. The rise of liquid into the pores of
the matrix due to capillary action.
Figure 5.9 Schematic of the electrolyte rise into pores of the matrix by capillary action.

125
According to Poiseuille’s law, the rate of liquid penetration in porous media is
given in the force balance equation between viscous, capillary and hydrostatics forces by
neglecting inertial effects and by assuming the steady-state flow [130–132]:
𝑑𝑉 =𝑟4∆𝑝𝜋
8𝜂ℎ𝑑𝑡 (1)
The liquid volume and height is,
𝑑𝑉 = 𝜋𝑟2𝑑ℎ (2)
The capillary pressure is,
𝑝𝑘 =2𝛾
𝑟𝑐𝑜𝑠𝜃 (3)
The hydrostatic pressure is,
𝑝ℎ = 𝜌𝑔ℎ (4)
Therefore, the pressure difference is,
∆𝑝 =2𝛾
𝑟𝑐𝑜𝑠𝜃 − 𝜌𝑔ℎ (5)
, where 𝛾 is liquid surface tension, 𝜌 is liquid density. By substitution of eq. (2) and (5) to
eq. (1), the penetration rate is transformed into:
𝑑ℎ
𝑑𝑡=
𝑟2
8𝜂ℎ(
2𝛾
𝑟𝑐𝑜𝑠𝜃 − 𝜌𝑔ℎ) ℎ
𝑑ℎ
𝑑𝑡=
𝑟𝛾𝑐𝑜𝑠𝜃
4𝜂 (6)
with neglecting the hydrostatic pressure. The Washburn’s equation is achieved after the
integration of eq. (6) with the initial condition (h=0 at t=0):
ℎ2 =𝑟𝛾𝑐𝑜𝑠𝜃
2𝜂𝑡 (7)
Washburn’s equation presents linear dependence of square of height penetration of
penetrating liquid in the tube versus time. In case of porous media, Washburn’s theory
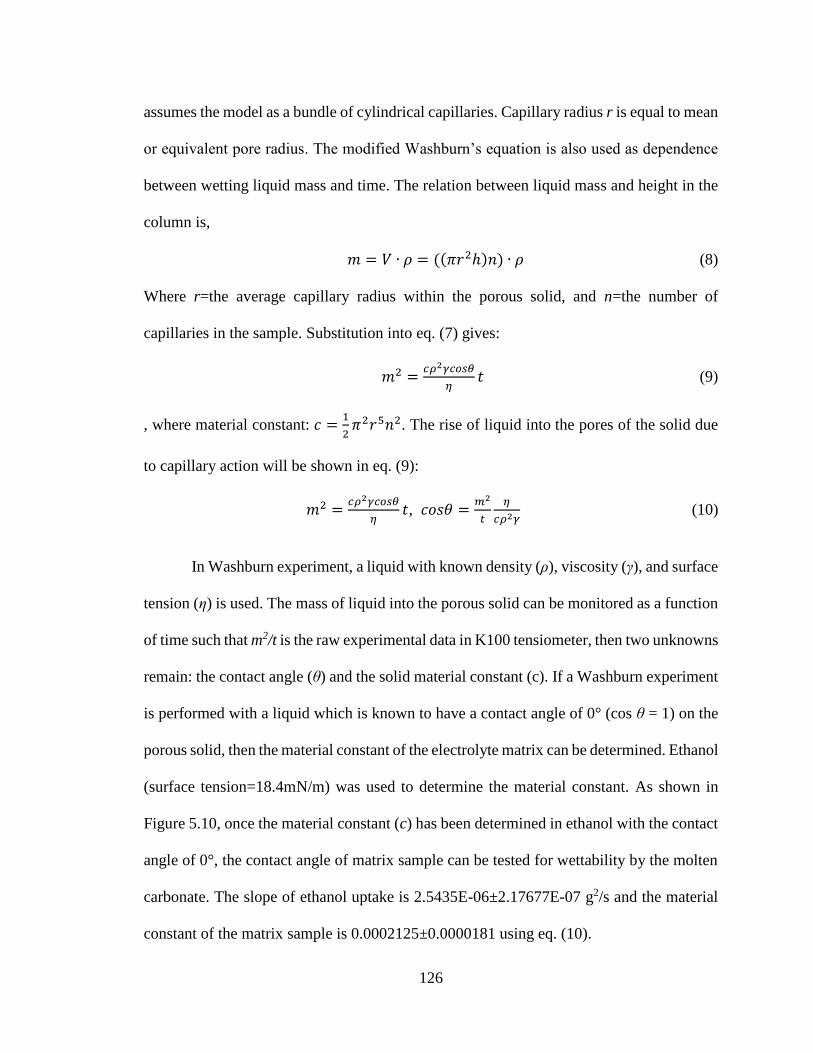
126
assumes the model as a bundle of cylindrical capillaries. Capillary radius r is equal to mean
or equivalent pore radius. The modified Washburn’s equation is also used as dependence
between wetting liquid mass and time. The relation between liquid mass and height in the
column is,
𝑚 = 𝑉 ∙ 𝜌 = ((𝜋𝑟2ℎ)𝑛) ∙ 𝜌 (8)
Where r=the average capillary radius within the porous solid, and n=the number of
capillaries in the sample. Substitution into eq. (7) gives:
𝑚2 =𝑐𝜌2𝛾𝑐𝑜𝑠𝜃
𝜂𝑡 (9)
, where material constant: 𝑐 =1
2𝜋2𝑟5𝑛2. The rise of liquid into the pores of the solid due
to capillary action will be shown in eq. (9):
𝑚2 =𝑐𝜌2𝛾𝑐𝑜𝑠𝜃
𝜂𝑡, 𝑐𝑜𝑠𝜃 =
𝑚2
𝑡
𝜂
𝑐𝜌2𝛾 (10)
In Washburn experiment, a liquid with known density (ρ), viscosity (γ), and surface
tension (η) is used. The mass of liquid into the porous solid can be monitored as a function
of time such that m2/t is the raw experimental data in K100 tensiometer, then two unknowns
remain: the contact angle (θ) and the solid material constant (c). If a Washburn experiment
is performed with a liquid which is known to have a contact angle of 0° (cos θ = 1) on the
porous solid, then the material constant of the electrolyte matrix can be determined. Ethanol
(surface tension=18.4mN/m) was used to determine the material constant. As shown in
Figure 5.10, once the material constant (c) has been determined in ethanol with the contact
angle of 0°, the contact angle of matrix sample can be tested for wettability by the molten
carbonate. The slope of ethanol uptake is 2.5435E-06±2.17677E-07 g2/s and the material
constant of the matrix sample is 0.0002125±0.0000181 using eq. (10).

127
Figure 5.10 Ethanol uptake in the fresh extended burnout matrix.
Table 5.3 List of Ethanol properties of at 20°C.
density of liquid 0.000789 g/mm3
surface tension 0.0221 mN/mm
viscosity 1.144E-06 mN·s/mm2

128
Figure 5.11 shows the rate of electrolyte absorption into the ceramic matrix pores
by the capillary penetration method for fresh and used samples in Table 5.1. The mass
uptake per unit area is used to compare each sample case. The capillary rise method
indicates that the amount of molten carbonate penetrating into the matrix. The largest
weight increase of used matrix (sample 1-4) is due to the initial meniscus formation which
takes place during the first 0.5sec. However, the total mass uptake rate is not much different
between fresh and used matrix samples and no correlation with the operation time for used
electrolyte matrix samples. The relatively high initial uptake as soon as touching the molten
carbonate is mainly caused by some bubble reaction for the used sample cases at the initial
point.
0
0.05
0.1
0.15
0.2
0.25
0.3
0.35
0 20 40 60 80 100
Mas
s^2
(g^
2)
Time (s)
Gas (c)
Fresh
1-2184h
2-8235h
3-18763h

129
0
0.05
0.1
0.15
0.2
0.25
0.3
0.35
0 20 40 60 80 100
Mas
s^2
(g^
2)
Time (s)
Gas (a)
Fresh
1-2184h
2-8235h
3-18763h
0
0.05
0.1
0.15
0.2
0.25
0.3
0.35
0 20 40 60 80 100
Mas
s^2
(g^
2)
Time (s)
Gas (b)
Fresh
1-2184h
2-8235h
3-18763h

130
Figure 5.11 The rate of liquid electrolyte absorption into the pores of matrix (fresh and
used samples) in the gas mixture ((a) 4% H2 + 96% N2, 9% humidified, (b) 4% H2 + 10%
CO2 + 86% N2, 9% humidified, and (c) 19.1% CO2 + 12.5% O2 + 68.4% N2, 3% humidified)
at the electrolyte temperature of 600°C.
Table 5.4 Molten carbonate properties of at 600°C [129].
density of liquid 0.001982 g/mm3
surface tension 0.24296 mN/mm
viscosity 1.02074E-05 mN·s/mm2
0
0.05
0.1
0.15
0.2
0.25
0.3
0.35
0 20 40 60 80 100
Mas
s^2
(g^
2)
Time (s)
Gas (c)
Fresh
1-2184h
2-8235h
3-18763h

131
Table 5.5 Calculation of slope of the electrolyte update and contact angles.
Fresh 1-2184h 2-8235h 1-18763h 4-44089h
Slope of the
electrolyte
uptake (g2/s)
gas (a) 0.0002287 0.0002486 0.0005303 0.0005717 0.0004591
gas (b) 0.0001688 0.0000730 0.0002818 0.0006059 0.0002480
gas (d) 0.0000351 0.0000999 0.0002191 0.0002098 0.0002137
Washburn
contact angle (˚)
gas (a) n/a n/a n/a n/a n/a
gas (b) n/a n/a n/a n/a n/a
gas (d) n/a n/a n/a n/a n/a
The calculated Washburn contact angles show N/A numbers (<0°). The fresh and
used matrix samples are completely wetted by the electrolyte. Therefore, the ceramic
matrix electrode is an appropriate material to contain the molten carbonate electrolyte and
the aging effect for each case is no significant difference after 2000 hours operation.
5.4. Summary and Conclusions
The force tensiometer is very suitable for studying the wetting property of the
electrolyte matrix such as CeO2, MgO and LiAlO2 in the cathode electrolyte of the MCFC
incorporating a capillary rise in the porous structure, making it possible to study wettability
evaluation for virgin and used samples after the long term operation. Moreover, the gas
phase regulating hood, which is to measure wetting properties of the electrolyte matrix in
the cathode electrolyte, enables to keep the MCFC operation environment of gas mixture
and high temperature. A proper contact angle measurement method of the electrolyte

132
matrix in the molten carbonate solution was studied by combining two different approaches;
the Washburn mass uptake method and the Wilhelmy plate method.
The Washburn mass uptake is more reliable method than the Wilhelmy plate
method due to its highly porous structure. The new experimental setup can be easily applied
for measuring wettability in high temperature electrochemical systems. The wettability
characterization with the force tensiometer can be widely used to study for rough surface
and porous structure electrodes of the electrochemical energy application after the long
term operation.

133
CHAPTER 6. WETTABILITY MEASUREMENTS OF
IRREGULAR SHAPES WITH WILHELMY PLATE METHOD
6.1. Introduction
Surface wettability is a very important property for many new polymers or textures
that are used in various industrial processes, such as printing, lubrication, surface coating
and self-cleaning products with hydrophobic surface treatments. The surface wettability is
typically characterized by the contact angle, which represent the shape of the testing liquid
on the solid [133]. The traditional method for measuring contact angle on flat plates is the
static sessile drop method using droplet shape analysis, which is obtained from the
intersection of the tangent line of the sessile droplet profile at the surface contact point. An
auto-controlled micrometer syringe with a precise size needle can be used to measure
advancing and receding contact angles by adding liquid volume until the maximum angle
is achieved (i.e. the advancing angle), and by suction removing liquid from the droplet to
produce the smallest angle (i.e. the receding angle). This method is called the dynamic
sessile drop method [134]. Another common technique for optical measurement of the
contact angle is the tilted plate method, which measures the static contact angle hysteresis
when the testing liquid droplets on a level surface and then tilted. The contact angle is the
angle where the liquid droplet begins to slide down on an inclined plane [135]. The
advancing and the receding contact angles are defined according to the lowest point and
the highest point until the droplet just begins to move by tilting the surface. This method
requires only a camera, but the measured contact angle is strongly dependent on the size
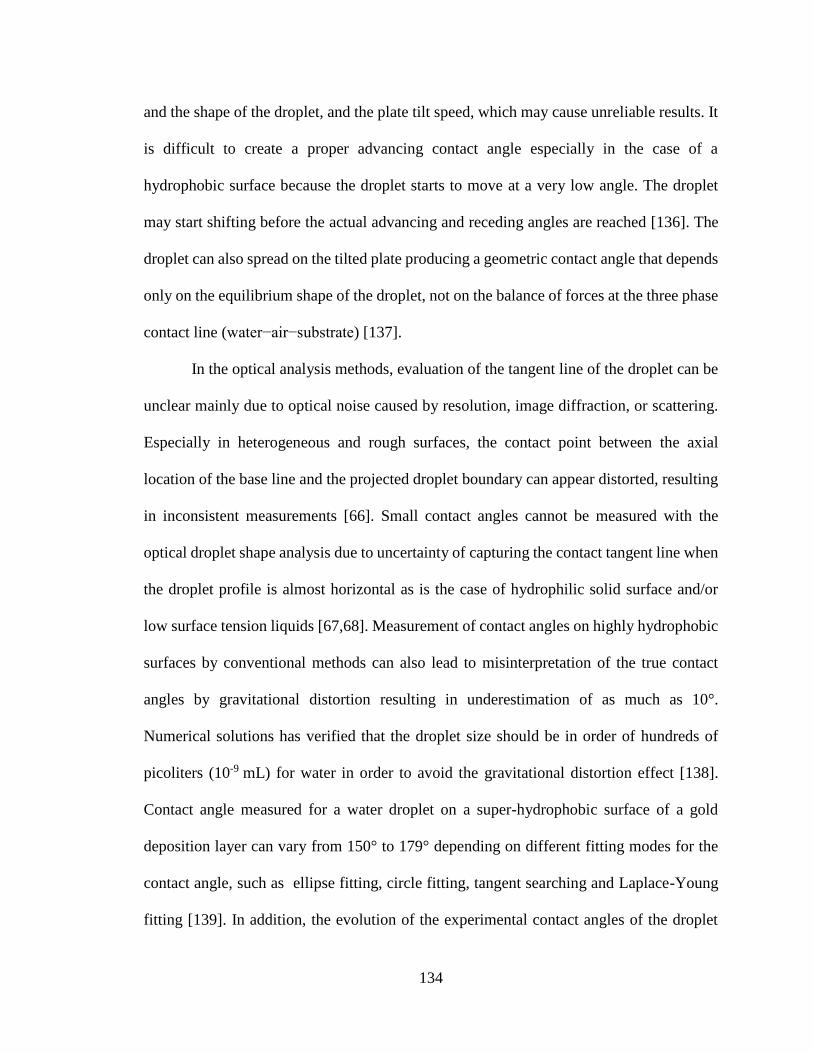
134
and the shape of the droplet, and the plate tilt speed, which may cause unreliable results. It
is difficult to create a proper advancing contact angle especially in the case of a
hydrophobic surface because the droplet starts to move at a very low angle. The droplet
may start shifting before the actual advancing and receding angles are reached [136]. The
droplet can also spread on the tilted plate producing a geometric contact angle that depends
only on the equilibrium shape of the droplet, not on the balance of forces at the three phase
contact line (water−air−substrate) [137].
In the optical analysis methods, evaluation of the tangent line of the droplet can be
unclear mainly due to optical noise caused by resolution, image diffraction, or scattering.
Especially in heterogeneous and rough surfaces, the contact point between the axial
location of the base line and the projected droplet boundary can appear distorted, resulting
in inconsistent measurements [66]. Small contact angles cannot be measured with the
optical droplet shape analysis due to uncertainty of capturing the contact tangent line when
the droplet profile is almost horizontal as is the case of hydrophilic solid surface and/or
low surface tension liquids [67,68]. Measurement of contact angles on highly hydrophobic
surfaces by conventional methods can also lead to misinterpretation of the true contact
angles by gravitational distortion resulting in underestimation of as much as 10°.
Numerical solutions has verified that the droplet size should be in order of hundreds of
picoliters (10-9 mL) for water in order to avoid the gravitational distortion effect [138].
Contact angle measured for a water droplet on a super-hydrophobic surface of a gold
deposition layer can vary from 150° to 179° depending on different fitting modes for the
contact angle, such as ellipse fitting, circle fitting, tangent searching and Laplace-Young
fitting [139]. In addition, the evolution of the experimental contact angles of the droplet

135
shape by the external optical process should only be applied for smooth and homogeneous
solid surfaces because the mechanical equilibrium of three interfacial tensions of the
droplet, known as Young’s equation, is only valid for rigid solid surface tensions [140].
Despite all these drawbacks, the optical analysis of the droplet on the solid substrate is
widely used for flat and smooth surfaces as a screening measurement because it is a quick
and simple process. Captive bubble method is also extensively used in measuring the
contact angle between the liquid and the solid surface by forming an air bubble from the
tiny needle beneath the immersed surface in the liquid. The developed captive bubble
method is recently proposed by adding a pressure control system with a pressure chamber
instead of using the needle as in the conventional method resulting in a more repeatable
process with promising results and smaller errors [141]. In addition, an environmental
scanning electron microscopy (ESEM) with smaller droplet is also being used as a new
method of wetting studies for super-hydrophobicity on patterned surfaces [142].
Alternatively, indirect contact angle measurement using the Wilhelmy plate method
is an accurate way to measure the wettability changes of a sample in a test liquid when the
liquid surface tension is known. The contact angle measured in the force tensiometer shows
the dynamic contact angle during sample immerging into the liquid and emerging from the
liquid with repeated wetting cycles [143]. This method is easy to apply for small contact
angles because it is an indirect measurement calculated from the force data. Moreover,
there is no need to establish a three-phase contact line. This method eliminates the
subjectivity that results from the line tension effect during the droplet image processing. A
significant advantage for measuring the contact angle with the Wilhelmy plate method is
that it has the ability to study the kinetics of the moving contact lines between the sample

136
and the liquid. The wetting force of the thin plate is measured by slowly dipping the plate
into the liquid and then pulling it back to the initial position, known as advancing and
receding modes [144,145]. It is also generally straightforward to measure the temperature
dependence of the contact angle [146–148]. The main disadvantage of the conventional
Wilhelmy plate method is the restriction that the plate sample must have a clearly defined
cross section, and its wetted length must be exactly constant during the travel in the liquid.
In the conventional Wilhelmy plate method, the sample plate is thin and rigid, generally in
rectangular shape, and the wetted length and the volume of the solid during the immersion
cycle is well defined. However, it may be very difficult to prepare a solid rectangular
sample for certain systems, such as high temperature electrochemical energy devices (e.g.
fuel cells and batteries). Preparation of the sample with rigid and homogeneous rectangular
shape after a long term test may become difficult because some components are difficult
to separate from each other and become very brittle over time, making it impossible to
shape.
In this chapter, I propose an approach to relax this requirement and to apply the
Wilhelmy plate method to non-uniform shape samples for measuring contact angles. I
describe the mathematical background for this approach and demonstrate with PTFE
samples having irregular geometric shapes but uniform thickness.
6.2. Advanced Wilhelmy plate method
The Wilhelmy plate method measures the wetting force between the liquid surface
and the sample. This measurement requires a pre-weighed sample and uses a precise force
sensor to measure the wetting force which is corrected by the buoyancy force. The dynamic

137
contact angle of liquids against solid surfaces is indirectly determined from the force data
as the solid flat sample is pushed into or pulled out of the liquid [69]. The force balance is
defined as,
𝐹 = 𝑝𝛾𝑐𝑜𝑠𝜃 + 𝑚𝑔 − 𝜌𝑉𝑔 (1)
where, m is sample mass, g is gravitational acceleration, p is sample wetted length
(perimeter), γ is liquid surface tension, ρ is liquid density and V is sample wetted volume.
The first (𝑝𝛾𝑐𝑜𝑠𝜃) and third (𝜌𝑉𝑔) terms represent the wetting force and the buoyancy
force, respectively. The sample is mounted vertically in the sample holder of the force
sensor, while the vessel and liquid is moved up and down during the submersion cycle.
The weight of the sample is automatically accounted for when the sample is attached, hence
the measured force does not include the gravitational force term (mg) in equation (1), the
measured force then becomes,
𝐹 = 𝑝𝛾𝑐𝑜𝑠𝜃 − 𝜌𝑉𝑔 (2)
In general, Wilhelmy plate method uses a uniform thickness, flat rectangular plate
on which the contact angle is to be measured. The wetted length and cross-sectional area
(consequently wetted volume) of the sample are major parameters in the Wilhelmy force
equation. Here, we suggest an alternative method to measure contact angles of water on
the PTFE plate having non-rectangular shape.
The advanced methodology is analytically shown with a trapezoid shape (i.e.
truncated equilateral triangle). Figure 6.1 shows the process of determining volumes and
perimeters at each segment of the trapezoid plate in the direction (a) and in the reverse
direction (b) to the liquid, which are based on the basic equilateral triangle calculation

138
every measurement step (0.05mm) in the tensiometer. As shown in Figure 6.1(a), the
sample perimeter at each measuring point can be calculated by,
𝐿𝑛 = 2×(ℎ1 − 0.05𝑛)/√3 (3)
Where, L0 is a sample’s bottom length measured with a vernier caliper and h1 is initially
calculated corresponding an equilateral triangle. As shown in Figure 6.1(b), for the
trapezoid plate in reverse direction to the liquid, the sample perimeter can be calculated by,
𝐿𝑛 = 2×(ℎ2 + 0.05𝑛)/√3 (4)
where, h2 is initially calculated using the bottle length (L0) of the equilateral triangle. The
sample volume every force measurement step during sample immerging into the liquid are,
𝑉𝑛 = 𝑉𝑛−1 + 𝑆𝑛 (5)
and emerging from the liquid (e.g. after maximum submersion depth) are,
𝑉𝑛 = 𝑉𝑛+1 − 𝑆𝑛+1 (6)
where S is the segment volume at each measuring step of the tensiometer. Segment volume
is calculated using the trapezoid rule (i.e. height×averaged width) using the segment height
(constant at 0.05mm for the tensiometer used in this work), sample thickness and obtained
perimeters (Ln). A post-processing calculation using the measured perimeter and the
volume is performed to process the force data measured by the tensiometer into the contact
angle in both advancing and receding directions.

139
Figure 6.1 Determination process of volume and wetted length at each measuring point for
the PTFE plate based on the equilateral triangle shape; (a) the perimeter decreases during
immerging to the liquid, (b) the perimeter increases during immersing to the liquid.

140
6.3. Experimental
PTFE (Teflon® fluoropolymer, Skived, CS Hyde Company, Lake Villa, IL)
samples of trapezoidal shape and irregular shape with thickness of 10mil were prepared by
a sharp knife-cut, as shown in Figure 6.2.
Figure 6.2 Preparation of PTFE samples (a) long edge trapezoid, (b) short edge trapezoid
and (c) random cut shapes.
The dynamic contact angle of the PTFE is measured with a Krüss K100 tensiometer
(Krüss GmBH, Germany), following the Wilhelmy plate method. The prepared sample is
mounted on the force sensor holder of the tensiometer, and then scanned in both advancing
and receding directions into and out of the liquid with a scan rate of 6 mm/min and a

141
maximum distance of 10-15 mm. The image processing for defining the perimeter
formation for irregular samples uses an open source, public domain software, ImageJ
(National Institutes of Health, Bethesda, MD). The external image processing and the
calculation procedure of the dynamic contact angle is explained in the next section.
6.4. Results and discussion
6.4.1. Square-shaped samples
Figure 6.3(a) shows the uncorrected measured force (F) changes of the square-
shaped PTFE (20×20mm, thickness: 0.38mm) in DI water during the Wilhelmy plate
method as a baseline. The lower set of data (A-C) until 10 mm immersing position are the
advancing into the liquid, and the upper set of data (C-E) until back to datum are the
receding from the liquid. The uncorrected measured force includes the buoyancy. As
shown, the uncorrected force linearly decreases during immersing, because the wetting
force remains constant for the uniform shape sample and the buoyancy increases as the
submerged volume increases. After correcting with the buoyancy(𝜌𝑉𝑔), the wetting force
in Figure 6.3(b) is obtained which shows the plateau in both curves. The wetting force can
be either positive or negative depending on the sample wettability to the testing liquid,
hydrophobic (Fw>0) or hydrophilic (Fw<0). Negative values of the wetting force represent
the upward direction force on the sample due to the hydrophobic surface (θ>90˚), and
positive values the wetting force describe the downward direction force on the sample due
to the hydrophilic surface (θ<90˚). The magnitude of the wetting force at the three-phase
line by the Wilhelmy plate method does not changed for a uniform solid sample once the
meniscus is formed, In Figure 6.3(b), the force measured during the formation of the

142
meniscus is referred to the transient force, which is shown as segment AB. When the
meniscus is fully developed, the wetting force no longer changes resulting in the plateau,
segment BC. The second transient period is obtained as the direction of the motion changes
when the maximum immersion depth is reached, shown as segment CD, when the meniscus
changes from the advancing shape to the receding shape, resulting in a decrease in the
wetting force. The lower and upper plateau regions of the wetting force plot are used to
calculate the advancing and the receding contact angles of sample in the liquid, shown as
segment BC and segment DE, respectively.

143
Figure 6.3 Wetting force and contact angle traces plotted against immersion depth for the
square-shape PTFE plate (20×20 mm) in water.

144
Contact angles are calculated from the measured force data using the Wilhelmy
equation,
𝑐𝑜𝑠𝜃 = (𝐹 − 𝐹𝑏)/(𝑝 ∙ 𝛾) (7)
where p=sample’s wetted length, γ=surface tension of liquid, F=total force measured by
the load cell, and Fb=buoyancy force on the solid. The advancing contact angle and the
receding contact angle are determined from the wetting force data, as the solid flat sample
is pushed into and pulled out of the liquid (e.g. DI water), respectively. Figure 6.3(c) shows
contact angle changes during immerging into the liquid (A-C) and emerging from the liquid
(C-E). The constant advancing and receding wetting forces are determined by the average
value in the steady region of force. The average value of wetting forces from the plateau
region in Figure 6.3(b) used to calculate advancing and receding contact angles;
submersion cycle from 3mm to 9mm for the advancing contact angle and from 8mm to
2mm for the receding contact angle. Using surface tension of water at 20°C as 0.0728
mN/mm, the advancing contact angle and the receding contact angle is determined
119.6±3.1˚ and 88.8±2.5˚, respectively. The contact angle measurement was repeated four
times per each case with four separated cut samples in the same PTFE batch, with the
average given in the final angle. The equilibrium Young contact angle can then be
calculated from the advancing and receding contact angles that are determined by
dimensionless parameters of the normalized line energy associated with the triple phase
contact [70]. It defined as,
𝜃0 = 𝑎𝑟𝑐𝑐𝑜𝑠 (Γ𝐴 𝑐𝑜𝑠𝜃𝐴 + Γ𝑅 𝑐𝑜𝑠𝜃𝑅
Γ𝐴 + Γ𝐵)

145
where Γ𝑅 ≡ (𝑠𝑖𝑛3𝜃𝑅
2−3𝑐𝑜𝑠𝜃𝑅+𝑐𝑜𝑠3𝜃𝑅)
1/3
, Γ𝐴 ≡ (𝑠𝑖𝑛3𝜃𝐴
2−3𝑐𝑜𝑠𝜃𝐴+𝑐𝑜𝑠3𝜃𝐴)
1/3
, 𝜃𝐴 =advancing contact
angle, and 𝜃𝑅=residing contact angle. The calculated equilibrium water contact angle for
the skived PTFE is 103.5±2.9° from the Wilhelmy plate method. A wide range of water
contact angle measurements (93-121°) for the PTFE film is reported in the literature with
different measurement methods [149–152]. The reported contact angle in this work
measured by Wilhelmy plate method is well within range of the previously reported data.
6.4.2. Triangle-shaped samples
Figure 6.4 (a) and (c) show the measured force and the wetting force traces plotted
against immersion depth for the trapezoid shape PTFE plate based on the triangle and the
inverted triangle immersing into water. These wetting force plots are corrected for the
buoyancy term (𝜌𝑉𝑔) of the Wilhelmy equation using the volume calculation sheet in
equation (5) and (6) from the tensiometer raw force data. However, there is no constant
region for the wetting force, unlike the wetting force cycle of the square-shaped PTFE,
even after the buoyancy correction for sample volume changes because the wetting force
in the Wilhelmy equation is still based on the constant perimeter (𝐹𝑤 = "𝑝" ∙ 𝛾 ∙ 𝑐𝑜𝑠𝜃).
Table 6.1 and Table 6.2 show the contact angle calculation sheet of the trapezoid-shape
with the long and the short edge immersing first. After the contact angle calculation with
sample perimeters decrease and increase during the measurement with equation (4) and (5),
contact angle changes show plateau regions for the advancing angle and the receding angle,
as shown in Figure 6.4 (b) and (d).

146
In summary, at first, the raw force data of the trapezoid shaped sample is measured
in the tensiometer. The real sample perimeters and volumes are calculated based on
equilateral triangle and trapezoid prism calculations before applying to the Wilhelmy
equation, which have to match the force data requisition step in the tensiometer. As the
post-processing, the wetting force is corrected for the buoyancy using sample volume
calculation data at each measurement step, and then the contact angle is determined with
the sample perimeter calculation. These are strongly correlated with contact angle results
of the regular square plate, resulting in the advancing contact angle of 121.7±2.6˚ and the
receding contact angle of 88.6±1.9˚ for the long edge immersing first, and the advancing
contact angle of 119.2±2.4˚ and the receding contact angle of 88.8±2.9˚ for the short edge
immersing first, compared to 119.6±3.1˚ and 88.8±2.5˚, respectively. Therefore, the
Wilhelmy plate method can be widely used for measuring contact angle, not only rigid
plate sample with a constant cross section length.

147

148
Figure 6.4 (a) Wetting forces and (b) contact angles-immersing position curve of the
trapezoid-shape with the long edge immersing first, and (c) wetting forces and (d) contact
angles-immersing position curve of the trapezoid-shape with the short edge immersing first
for determining the wetting properties in pure water.

149
Table 6.1 Contact angle calculation of the trapezoid-shape with the long edge immersing
first.
(1) Immersion
depth [mm]
(2) Measured
force [mN] (3) Width [mm]
(4) Wetted length
[mm]
0.05 0.11763 19.9422 40.704
0.1 0.23526 19.8845 40.589
0.15 0.17024 19.8267 40.473
0.2 0.10523 19.7690 40.358
0.25 0.03972 19.7113 40.242
0.3 -0.02579 19.6537 40.127
⋮ ⋮ ⋮ ⋮
(5) Wetted volume
[mm^3]
(6) Buoyancy
[mN]
(7) Wetting force
[mN] (8) Angle [˚]
0.4094 0.004004 0.121634 87.64
0.8176 0.007997 0.243257 85.27
1.2246 0.011978 0.182223 86.45
1.6305 0.015947 0.121177 87.63
2.0348 0.019901 0.059621 88.83
2.4378 0.023844 -0.00195 90.03
⋮ ⋮ ⋮ ⋮

150
Table 6.2 Contact angle calculation of the trapezoid-shape with the short edge immersing
first.
(1) Immersion
depth [mm]
(2) Measured
force [mN] (3) Width [mm]
(4) Wetted length
[mm]
0.05 0.23026 10.0577 20.935
0.1 0.46053 10.1154 21.050
0.15 0.42248 10.1731 21.166
0.2 0.38444 10.2309 21.281
0.25 0.34540 10.2886 21.397
0.3 0.30637 10.3464 21.512
⋮ ⋮ ⋮ ⋮
(5) Wetted volume
[mm^3]
(6) Buoyancy
[mN]
(7) Wetting force
[mN] (8) Angle [˚]
0.2055 0.002011 0.232276 81.23
0.4123 0.004033 0.464563 72.35
0.620326 0.006067 0.428552 73.85
0.829469 0.008113 0.392553 75.32
1.039795 0.01017 0.355575 76.80
1.251304 0.012238 0.318608 78.26
⋮ ⋮ ⋮ ⋮

151
6.4.3. Irregular-shaped samples
With the above idea, the advanced Wilhelmy plate method is also applicable to
measure the contact angle for irregular shape plates. Image processing is conducted to take
the sample parameter using ImageJ (National Institutes of Health, Bethesda, MD). As
shown in Figure 6.5, photographs of four PTFE samples by random knife cut in random
shape is converted to black/white images using ImageJ. First, the images is converted to 8-
bit greyscale images, and then the threshold is adjusted to convert the 8-bit images into the
black/white images. Once the region is selected using highlight the region of interest (ROI)
with a standard rectangular selection, the average pixel value along the x-axis can be
computed using the plot profile feature. The x-axis of the plot profile represents distance
along the penetration axis and the y-axis is the pixel intensity of black pixels versus white
pixels.
For rectangular selections, it shows a column average plot, where the x-axis
represents the horizontal distance in the area selection, and the y-axis represents the
vertically averaged pixel concentration. The completely black pixel column and white pixel
column should display the average value of 0 and 255, respectively, while the region mixed
with black and white pixels would have an average value somewhere between 0 and 255
depending on the ratio of black to white pixels, resulting in the line plot for each PTFE
sample of the irregular shape. For the next step, the image scale with known bottom length
of the sample is set to get a pixel/unit length ratio. Therefore, the length data on the y-axis
represent the sample width and the length data on the y-axis represent the sample height
from the bottom. The width and the height list is exported into the spreadsheet in the length
scale. The collected data point should be converted in every 0.05mm height to match the

152
tensiometer data for calculating the wetting force and the contact angle, which results in
profile plot of each sample as shown in Figure 6.6.
Figure 6.5 Conversion of color pictures of four PTFE samples into black/white images
using ImageJ.

153

154
Figure 6.6 Profile plot of each sample from the average pixel value by setting the image
scale with known bottom length.
The perimeter and volume of the irregular shape PTFE plate are produced to
combine with the tensiometer force data at a certain point. Figure 6.7 shows calculation
formulas of the segment volume at each measuring point of the tensiometer. L1, L2, ... Lm
are bottom widths of the sample at each point. The sample volume every force

155
measurement step (0.05mm) during sample immerging into the liquid and emerging from
the liquid are,
𝑉1 = (𝐿0 + 𝐿1)/2×0.05𝑚𝑚 ×𝑡
𝑉2 = 𝑉1 + (𝐿1 + 𝐿2)/2×0.05𝑚𝑚 ×𝑡
𝑉3 = 𝑉2 + (𝐿2 + 𝐿3)/2×0.05𝑚𝑚 ×𝑡
⋮
e.g. at a given submersion depth (15 mm), 𝑉𝑚 = 𝑉𝑚−1 + (𝐿𝑚−1 + 𝐿𝑚)/2×
0.05𝑚𝑚 ×𝑡
𝑉𝑚−1 = 𝑉𝑚 − (𝐿𝑚−1 + 𝐿𝑚)/2×0.05𝑚𝑚 ×𝑡
𝑉𝑚−2 = 𝑉𝑚−1 − (𝐿𝑚−2 + 𝐿𝑚−1)/2×0.05𝑚𝑚 ×𝑡
𝑉𝑚−3 = 𝑉𝑚−2 − (𝐿𝑚−3 + 𝐿𝑚−2)/2×0.05𝑚𝑚 ×𝑡
⋮
𝑉1 = (𝐿0 + 𝐿1)/2×0.05𝑚𝑚 ×𝑡
where t is constant thickness of the sample. This procedure is considered as a quasi-static
process that the system is in equilibrium at every measuring point and calculation step.

156
Figure 6.7 Calculation formulas of the segment volume of the irregular-shape PTFE plate
at each measuring point for the force tensiometer.
The sample submersion depth to the liquid is set to 15mm and the wetting force
data is recorded every 0.05mm depth. The raw force data from the tensiometer are
regenerated with the external calculation spreadsheet of the volume and the wetted length
at each segment as following the Wilhelmy force equation. Figure 6.8(a) and (b) show the
measured force and the wetting force for each random cut sample of the PTFE plate. The
wetting force in the plot present is corrected for the buoyancy from the raw force data
measured by the tensiometer, where the buoyancy is determined in the above volume
calculation.
The wetting force term (𝐹𝑤 = 𝑝𝛾𝑐𝑜𝑠𝜃) in the Wilhelmy equation is originally
considered as the constant perimeter. As for the comparison with the wetting force plot of
the constant perimeter case (Figure 6.3), there is no clear and plateau region in the
advancing and receding wetting force due to its non-uniform shape. In Figure 6.8(b), the

157
wetting force in the plot is not yet corrected for the real perimeter changes of irregular
samples. With the same procedure in the case of the trapezoid-shape sample, the wetting
force data is regenerated with perimeter and volume data of the profile plot (Figure 6.6) to
get advancing and receding contact angles. The advancing contact angle is 114.4±1.7˚ and
the receding contact angle is 86.2±2.5˚ in water, as shown in Figure 6.8(c). These contact
angles are good agreement with the previous results for the regular square shape of the
PTFE plate. The presented Wilhelmy plate method with the extra image processing for
quantifying the dynamic contact angle can further expand to apply various plate shapes. It
is not particularly straightforward to create perfectly rectangular samples in many testing
situations, e.g. long term operation. Using this additional image processing and data
manipulation, there is no need to prepare rectangular samples.

158
Figure 6.8 Wetting force and contact angle changes versus position from the Wilhelmy
plate method for the irregular-shape PTFE plates (shape 1-4) in water.
6.5. Summary and Conclusions
In this chapter, an extension to the Wilhelmy plate method is proposed where an
external image processing for irregular shapes is used to determine the sample perimeter
and submerged volume and buoyancy from the average pixel value along the submersion

159
axis. Pictures of each irregular sample are converted to profile plots depending on the pixel
intensity along the distance, which represent the sample perimeter at a certain height for
combining the force data. The raw force data of trapezoid and irregular shapes is measured
in the tensiometer. The real sample perimeters and volumes are calculated based on
trapezoid prism calculations before applying to the Wilhelmy equation. The resultant
contact angles of irregular shape PTFE plate, (after the post-processing with wetted length
and volume changes) have good reproducibility and in good agreement with the
conventional rectangular plate. Therefore, we conclude that the proposed extension to the
Wilhelmy plate method is valid and a useful technique in characterization of wetting
properties of irregular and complex shapes.

160
CHAPTER 7. CONCLUSION AND FUTURE WORKS
The surface wettability of fuel cell components in the MEA is one of major
parameters governing the water management for the PEFCs at the high performance and
extended lifespan of the fuel cell stack. The wettability and pore structure in the electrolyte
matrix is also an important factor to directly affect the cell performance for MCFCs. The
proposed research is focused on sophisticated schemes for surface wettability impact on
fuel cell performance by using a proper wettability measurement for the fuel cell
components. The force tensiometer was successfully used to measure the wettability
carbon paper substrate and MPL following the Wilhelmy plate method.
7.1. Contamination and mitigation
The long term contaminant exposure to the fuel cell negatively affects durability
and performance by formation of the salt precipitation in the carbon paper substrate and
severe clogging of flow channels near the gas outlet. The foreign cation contaminant
strongly influences an adverse effect on the cell water management, which causes serious
mass transport losses mainly due to changes in the surface wettability.
This study evaluated the effects of cationic impurities on fuel cell system
performance, especially on the water management by employing in-situ and ex-situ
contamination methods. The airborne cation was generally considered as serious
contaminant source in reduction of proton conductivity for the catalyst layer and the

161
membrane. However, this project verified that the hydrophobic layer of GDM acts as a
barrier for transport of aqueous contaminant solution to the catalyst layer and membrane
and the fuel cell performance loss by cationic airborne contaminants is mainly due to
serious deposits on the flow flied and the carbon paper substrate. Changes in the wettability
of the carbon paper surface following the in-situ contamination injection were quantified
using the Wilhelmy plate method. The salt precipitation on the macro-pores of the carbon
paper substrate after the contamination injection causes a higher wettability leading to
increased flooding of the carbon paper substrate and consequent mass transport losses.
Mitigation methods of adverse effects of airborne cationic contaminants has been
studied using both in-situ and ex-situ recovery methods. The ex-situ cleaning with an acid
solution flush was evaluated for the removal of salt deposits from flow field channels and
carbon paper substrates after the long term contaminant exposure to fuel cell operating
conditions. A low cell voltage/high current density operation was also used to assist foreign
cation removal from the membrane by high rate of proton generation. During previous
testing, it was determined that ion exchange of the cationic contaminated membrane in an
acid soaking solution can only take place in a direct contact between the acid solution and
the membrane ionomer, that is, by immersing the catalyst coated membrane without the
GDM. All mitigation methods were evaluated for their effects on cell performance
recovery, and the presence of remaining salt deposits after mitigation steps was confirmed
visually. The proposed mitigation strategies will benefit the fuel cell technology typically
in automotive fuel cell systems through improvement in durability and reliability.
Since the hydrophobic layer of the MPL acts as a barrier to the transport of
contaminant and recovery solution into the MEA, therefore isopropanol was added to both

162
the contaminant solution and the recovery solution to increase the wettability of the MPL.
The effect on performance of the added 15% IPA as a wetting agent in the cationic solution
was demonstrated and verified by an ex-situ soak method and by an in-situ injection
method for both mitigation and recovery processes. The cationic mitigation solution and
the acid cleaning solution were transported across the MPL into the CCM, but the overall
cell performance was not fully recovered. Wetting force measurements confirms that the
added IPA can alter the wettability of the MPL and can render it fully hydrophilic, enabling
the transport of the recovery solution into the MEA.
7.2. MEA structure
In conventional MEA configuration, the MPL had never directly attached to the
CCM because the high temperature heat treatment over 300°C is required for the last
fabrication step. This high temperature was not acceptable for our approach that the CCM
and the MPL were in the integrated structure and subject to the heat treatment together.
The novel MEA structure was successfully introduced for the high limiting current density
operation, where the carbon paper substrate is eliminated and the entire GDM consists of
only the MPL. Spray deposition with a heated plate was used to fabricate the MPL directly
onto both sides of the CCM, simplifying the fabrication and assembly, and results in a more
robust interface between the MPL and the catalyst layer. The alternative hydrophobic agent,
PVDF, was used to allow homogeneous distribution at a much lower heat treat temperature
than the conventional hydrophobic agent (PTFE). No evidence of damage to the catalysts
layer or the membrane was observed to result from either the spray deposition or the heat
treatment. The new MEA structure provides superior pathways for gas transport and water

163
evacuation, which reduces flooding at high current densities, and results in a stable voltage
at higher current densities. This new method of MEA fabrication is shown to provide high
power density operation by improving mass transport.
Having gained insight into the new structure, the ideal MPL pore structure and
thickness needs to be optimized to have both sufficient reactant supply, and enhanced
liquid water removal from the MEA, while maintaining mechanical stability. The influence
of porosity of the MPL, and particularly pore size and porosity grading on the fuel cell
performance should be investigated in future studies. The proposed MEA structure is very
practical to create a graded-MPL and catalyst layer for advanced gas transport and water
removal, driven by the differential capillary force, as well as improved mechanical
properties. This study verified the MPL pore size and porosity can be easily controlled by
different mixing ratio between the hydrophobic material and the carbon powder. The
graded-MPL on the catalyst layer can be easily created by the spraying process in different
MPL ink uses depending on the PVDF content. The porosity optimization in the MPL will
lead lower ohmic resistance and mass transport losses and will minimize flooding by
product water in the fuel cell.
Mass transports losses resulting from poor water management in the fuel cell can
also be alleviated by efficient design of the flow field. Several works are focused on the
use of porous metallic mesh and metal foam in between the bipolar plate and the electrode
as the flow channel for improved water and thermal management. The metal foam flow
field has high gas permeability due to its isotropic structure in nature, and mass transport
was greatly enhanced by uniform water removal. The metal foam flow field can also result
in reduced contact resistance and more uniform compression. This concept can be utilized

164
as the flow field to distribute the reactant gases over the MPL instead of the micro-channel
flow field for further study.
7.3. Wettability of electrolyte matrix in MCFCs
Changes in wettability of the porous electrolyte matrix have significant effects for
molten carbonate fuel cells. It is hard to quantify in a proper way because the molten
carbonate is liquid extremely corrosive over 600°C and sensitive the operating conditions.
The force tensiometer with gas phase regulating hood, heating vessel and gas
humidification system was applicable for studying the wettability of the electrolyte matrix
at extremely high temperatures applying both the Washburn mass uptake method and the
Wilhelmy plate method. For this highly porous ceramic structure, the Washburn mass
uptake method was more reliable. The new experimental setup for studying the wettability
in high temperature condition can be widely used in any electrochemical systems such as
phosphoric acid fuel cells and battery applications
7.4. Advanced Wilhelmy plate method
The Wilhelmy plate method generally requires the use of rectangular samples
having a constant perimeter in the liquid during advancing and receding cycles. The new
formulation based on the Wilhelmy force balance equation to determine the contact angle
for plate samples with irregular shapes was successfully conducted using the external
image processing. This method employs the profile plot obtained from the optical image
to determine the perimeter of the sample. The raw force data measured by the force
tensiometer was manipulated using the profile plot and the Wilhelmy equation to determine

165
the wetting force. This method was verified with both triangular and irregular PTFE
samples in water, and measured contact angles were in good agreement with conventional
regular shaped samples with a constant perimeter. This method will promise to be a useful
technique in characterization of wetting properties of samples with complex shapes,
making it possible to study electrodes of the energy application after the long term
operation.
The advanced Wilhemy plate method for irregular geometric shapes is only valid
in samples having uniform thickness. A 3D scanner has advanced rapidly in recent years
with highly accurate resolution. The collected data from the 3D scanner can be applied to
get 3D shaped-sample perimeters, and then the post-processing calculation with the force
data measured by the tensiometer. The proposed Wilhemy plate method can also apply to
not only irregular geometric shapes but also nonuniform thinness samples using the 3D
scanner.

166
REFERENCES
[1] J. Larminie, A. Dicks, Fuel Cell Systems Explained, 2nd ed., Wiley, 2003.
[2] M.M. Mench, Fuel Cell Engine, 1st ed., Wiley, 2008.
[3] U.S. Department of Energy, Fuel Cell Handbook, 7th ed., EG&G Technical
Services, Inc., 2004.
[4] Y. Wang, K.S. Chen, J. Mishler, S.C. Cho, X.C. Adroher, Appl. Energy. 88 (2011)
981–1007.
[5] DOE-EERE, (2009). http://energy.gov/eere/fuelcells/types-fuel-cells.
[6] C.M. Seymour, J. Power Sources. 37 (1992) 155–161.
[7] V. Mehta, J.S. Cooper, J. Power Sources. 114 (2003) 32–53.
[8] X.-Z. Yuan, H. Li, S. Zhang, J. Martin, H. Wang, J. Power Sources. 196 (2011)
9107–9116.
[9] Wikipedia, (n.d.). https://en.wikipedia.org/wiki/Nafion.
[10] H. Tang, S. Peikang, S.P. Jiang, F. Wang, M. Pan, J. Power Sources. 170 (2007)
85–92.
[11] Y. Shao, G. Yin, Z. Wang, Y. Gao, J. Power Sources. 167 (2007) 235–242.
[12] T.J.. Freire, E.R. Gonzalez, J. Electroanal. Chem. 503 (2001) 57–68.
[13] Y. Wang, K.S. Chen, J. Mishler, S.C. Cho, X.C. Adroher, Appl. Energy. 88 (2011)
981–1007.
[14] S. Litster, G. McLean, J. Power Sources. 130 (2004) 61–76.
[15] B. Bladergroen, H. Su, S. Pasupathi, V. Linkov, Overview of Membrane Electrode
Assembly Preparation Methods for Solid Polymer Electrolyte Electrolyzer, in: V.
Linkov (Ed.), Electrolysis, INTECH, 2012.
[16] Y. Shao, G. Yin, Y. Gao, P. Shi, J. Electrochem Soc. 153 (2006) A1093–A1097.
[17] Z. Chen, D. Higgins, A. Yu, L. Zhang, J. Zhang, Energy Environ. Sci. 4 (2011)
3167–3192.
[18] Y. Shao, G. Yin, Y. Gao, J. Power Sources. 171 (2007) 558–566.

167
[19] R. O’Hayre, S.-J. Lee, S.-W. Cha, F.. Prinz, J. Power Sources. 109 (2002) 483–
493.
[20] G. Kim, K. Eom, M. Kim, S.J. Yoo, J.H. Jang, H.-J. Kim, et al., ACS Appl. Mater.
Interfaces. 7 (2015) 27581–27585.
[21] N.. Brandon, D.. Brett, Phil. Trans. R. Soc. A. 364 (2006) 147–159.
[22] M. M. Mench, Fuel Cell Engines, 1st ed., J. Wiley & Sons, 2008.
[23] G. Lin, T. V. Nguyen, J. Electrochem. Soc. 152 (2005) A1942–A1948.
[24] A.Z. Weber, J. Newman, J. Electrochem. Soc. 152 (2005) A677–A688.
[25] Z. Qi, A. Kaufman, J. Power Sources. 109 (2002) 38–46.
[26] U. Pasaogullari, C.Y. Wang, J. Electrochem. Soc. 151 (2004) A399–A406.
[27] A. Weber, J. Newman, Chem. Rev. 104 (2004) 4679–4726.
[28] J. Wu, X.Z. Yuan, J.J. Martin, H. Wang, J. Zhang, J. Shen, et al., J. Power Sources.
184 (2008) 104–119.
[29] F.A. De Bruijn, V.A.T. Dam, G.J.M. Janssen, Fuel Cells. 8 (2008) 3–22.
[30] A. Laconti, M. Hamdan, R. Mcdonald, Handbook of fuel cell, 3rd., John Wiley
and Sons, 2003.
[31] F. Liu, B. Yi, D. Xing, J. Yu, Z. Hou, Y. Fu, J. Power Sources. 124 (2003) 81–89.
[32] M. Aoki, H. Uchida, M. Watanabe, Electrochem. Commun. 8 (2006) 1509–1513.
[33] D.E. Curtin, R.D. Lousenberg, T.J. Henry, P.C. Tangeman, M.E. Tisack, J. Power
Sources. 131 (2004) 41–48.
[34] C. Huang, K. Seng Tan, J. Lin, K. Lee Tan, Chem. Phys. Lett. 371 (2003) 80–85.
[35] Q. Li, R. He, J.O. Jensen, N.J. Bjerrum, Chem. Mater. 15 (2003) 4896–4915.
[36] C. Yang, P. Costamagna, S. Srinivasan, J. Benziger, A.B. Bocarsly, J. Power
Sources. 103 (2001) 1–9.
[37] X. Cheng, Z. Shi, N. Glass, L. Zhang, J. Zhang, D. Song, et al., J. Power Sources.
165 (2007) 739–756.
[38] F.A. Uribe, S. Gottesfeld, T.A. Zawodzinski, J. Electrochem. Soc. 149 (2002)
A293–A293.
[39] M.J. Kelly, G. Fafilek, J.O. Besenhard, H. Kronberger, G.E. Nauer, J. Power

168
Sources. 145 (2005) 249–252.
[40] A. Collier, H. Wang, X.Z. Yuan, J. Zhang, D.P. Wilkinson, Int. J. Hydrog. Energy.
31 (2006) 1838–1854.
[41] B. Kienitz, B. Pivovar, T. Zawodzinski, F.H. Garzon, J. Electrochem. Soc. 158
(2011) B1175–B1183.
[42] A. Weber, C. Delacourt, Fuel Cells. 8 (2008) 459–465.
[43] M.A. Uddin, U. Pasaogullari, J. Electrochem. Soc. 161 (2014) F1081–F1088.
[44] T. Kinumoto, M. Inada, Y. Nakayama, K. Ogata, R. Umebayashi, A. Tasaka, et al.,
J. Power Sources. 158 (2006) 1222–1228.
[45] J. Wang, R.F. Savinel, Electrochem. Acta. 37 (1992) 2737–2745.
[46] T.E. Springer, T. Tockward, T.A. Zawodzinski, S. Gottesfeld, J. Electrochem. Soc.
148 (2001) A11–A23.
[47] S. Gottesfeld, J. Pafford, J. Electrochem. Soc. 135 (1988) 2651–2652.
[48] C.H. Wan, Q.H. Zhuang, C.H. Lin, M.T. Lin, C. Shih, J. Power Sources. 162
(2006) 41–50.
[49] Q.F. Li, R.H. He, J.A. Gao, J.O. Jensen, N.J. Bjerrum, J. Electrochem. Soc. 150
(2003) A1599–A1605.
[50] V.M. Schmidt, H.-F. Oetjen, J. Divisek, J. Electrochem. Soc. 144 (1997) L237–
L238.
[51] P.A. Adcock, S.V. Pacheco, K.M. Norman, F.A. Uribe, J. Electrochem. Soc. 152
(2005) A459–A466.
[52] Q. Li, R. He, J.A. Gao, J.O. Jensen, N.J. Brerrum, J. Electrochem. Soc. 150 (2003)
A1599–A1605.
[53] J. Zhang, Z. Xie, J. Zhang, Y. Tang, C. Song, T. Navessin, et al., J. Power Sources.
160 (2006) 872–891.
[54] G. Zhang, S.G. Kandlikar, Int. J. Hydrog. Energy. 37 (2012) 2412–2429.
[55] S. Walch, A. Dhanda, M. Aryanpour, H. Pitsch, J. Phys. Chem. C. 112 (2008)
8464–8475.
[56] J. Zhang, PEM Fuel Cell Electrocatalysts and Catalyst Layers, Springer, 2008.
[57] P.E. Dodds, I. Staffell, A.D. Hawkes, F. Li, P. Grünewald, W. McDowall, et al.,

169
Int. J. Hydrogen Energy. 40 (2015) 2065–2083.
[58] K.K. H., D.A. Condit, T.D. Jarvi, J. Electrochem. Soc. 151 (2004) E125–E132.
[59] K. Mitsuda, T. Murahashi, J. Appl. Electrochem. 21 (1991) 524–530.
[60] M. Mamlouk, K. Scott, Int. J. Hydrogen Energy. 35 (2010) 784–793.
[61] R. Davis, F. Abdeljawad, J. Lillibridge, M. Haataja, Acta Mater. 78 (2014) 271–
281.
[62] J. Larmine, A. Dicks, Fuel Cell Systems Explained, 2nd ed., J. Wiley, 2003.
[63] T. V. Nguyen, A. Ahosseini, X. Wang, V. Yarlagadda, A. Kwong, A.Z. Weber, et
al., J. Electrochem. Soc. 162 (2015) F1451–F1460.
[64] R. Mukundan, J. Davey, K. Rau, D. Langlois, D. Spernjak, J. Fairweatehr, et al.,
ECS Trans. 58 (2013) 919–926.
[65] C. Lee, W. Merida, J. Power Sources. 164 (2007) 141–153.
[66] J. Bico, U. Thiele, D. Quere, Colloids Surfaces A. 206 (2002) 41–46.
[67] J. Drelich, J.L. Wilbur, J.D. Miller, G.M. Whiteside, Langmuir. 17 (1996) 1913–
1922.
[68] Y.C. Jung, B. Bhushan, Nanotechnology. 17 (2006) 4970–4980.
[69] E. Gauthier, T. Hellstern, I.G. Kevrekidis, J. Benziger, ACS Appl. Mater.
Interfaces. 4 (2012) 761–771.
[70] R. Tadmor, Langmuir. 20 (2004) 7659–7664.
[71] B.R. Friess, M. Hoorfar, J. Power Sources. 195 (2010) 4739–4742.
[72] J. St-Pierre, D.P. Wilkinson, S. Knight, M. Bos, J. New Mater. Electrochem. Syst.
3 (2000) 99–106.
[73] M.P. Rodgers, L.J. Bonville, H.R. Kunz, D.K. Slattery, J.M. Fenton, Chem. Rev.
112 (2012) 6075–6103.
[74] J. Zhang, H. Wang, D.P. Wilkinson, D. Song, J. Shen, Z.S. Liu, J. Power Sources.
147 (2015) 58–71.
[75] N. Zamel, X. Li, Prog. Energy Combust. Sci. 37 (2011) 292–329.
[76] M.. Uddin, U. Pasaogullari, J. Electrochem. Soc. 161 (2014) F1081–F1088.
[77] X. Wang, J. Qi, O. Ozdemir, A. Uddin, U. Pasaogullari, L.J. Bonville, et al., J.

170
Electrochem. Soc. 161 (2014) F1006–F1014.
[78] M.A. Uddin, X. Wang, J. Park., U. Pasaogullari, L. Bonville, J. Power Sources.
296 (2015) 64–69.
[79] J. Qi, X. Wang, M.O. Ozemir, M.A. Uddin, L. Bonville, U. Pasaogullari, et al., J.
Power Sources. 286 (2015) 18–24.
[80] V.M. Schmidt, P. Brockerhoff, B. Hohlein, R. Menzer, U. Stimming, J. Power
Sources. 49 (1994) 299–313.
[81] S. Jimenez, J. Soler, R.X. Valenzuela, L. Daza, J. Power Sources. 151 (2005) 69–
73.
[82] T. Okada, Y. Ayato, H. Satou, M. Yuasa, I. Sekine, J. Phys. Chem. B. 105 (2001)
6980–6986.
[83] A. Pozio, R.F. Silva, M. De Francesco, L. Giorgi, Electrochim. Acta. 48 (2003)
1543–1549.
[84] M.C. Betournay, G. Bonnell, E. Edwardson, D. Paktunc, A. Kaufman, A.T.
Lomma, J. Power Sources. 134 (2004) 80–87.
[85] M.A. Uddin, J. Park., L. Bonville, U. Pasaogullari, Int. J. Hydrog. Energy. 41
(2016) 14909–14916.
[86] J. Park, M.A. Uddin, S. Ganesan, U. Pasaogullari, L. Bonville, ECS Trans. 66
(2015) 91–100.
[87] M.A. Uddin, J. Qi, X. Wang, U. Pasaogullari, L. Bonville, Int. J. Hydrog. Energy.
40 (2015) 13099–13105.
[88] J. Fournier, G. Faubert, J.Y. Tilquin, R. Cote, D. Guay, J.P. Dodelet, J.
Electrochem. Soc. 144 (1997) 145–154.
[89] J. Qi, X. Wang, U. Pasaogullari, L. Bonville, T. Molter, J. Electrochem. Soc. 160
(2013) F916–F922.
[90] M.A. Uddin, X. Wang, J. Qi, M.O. Ozemir, U. Pasaogullari, L. Bonville, et al., J.
Electrochem. Soc. 162 (2015) F373–F379.
[91] P. Barbaro, C. Bianchini, Catalysis for Sustainable Energy Production, Willey,
2009.
[92] B. Avasarala, R. Moore, P. Haldar, Electrochem. Acta. 55 (2010) 4765–4771.
[93] M. Mortazavi, K. Tajiri, J. Power Sources. 245 (2014) 236–244.

171
[94] W. Dai, H. Wang, X.-Z. Yuan, J.J. Martin, D. Yang, J. Qiao, et al., Int. J.
Hydrogen Energy. 34 (2009) 9461–9478.
[95] H. Li, Y. Tang, Z. Wang, Z. Shi, S. Wu, D. Song, et al., J. Power Sources. 178
(2008) 103–117.
[96] M.M. Mench, C.Y. Wang, M. Ishikawa, J. Electrochem. Soc. 150 (2003) A1052–
A1059.
[97] M. Han, J.H. Xu, S.H. Chan, S.P. Jiang, Electrochim. Acta. 53 (2008) 5361–5367.
[98] G.J.. Janssen, M.L.. Overvelde, J. Power Sources. 101 (2001) 117–125.
[99] J.M. Song, S.Y. Cha, W.M. Lee, J. Power Sources. 94 (2001) 78–84.
[100] X.L. Wang, H.M. Zhang, J.L. Zhang, H.F. Xu, Z.Q. Tian, J. Chen, et al.,
Electrochim. Acta. 51 (2006) 4909–4915.
[101] S. Park, J. Lee, B.N. Popov, J. Power Sources. 163 (2006) 357–363.
[102] U. Pasaogullari, C.Y. Wang, K.S. Chen, J. Electrochem. Soc. 152 (2005) A1574–
A1582.
[103] K.H. Kangasniemi, D.A. Condit, T.D. Jarvi, J. Electrochem. Soc. 151 (2004)
E125–E132.
[104] T. Kim, S. Lee, H. Park, Int. J. Hydrogen Energy. 35 (2010) 8631–8643.
[105] A.L. Ong, A. Bottino, G. Capannelli, A. Comite, J. Power Sources. 183 (2008) 62–
68.
[106] W.-M. Yan, C.-Y. Hsueh, C.-Y. Soong, F. Chen, C.-H. Cheng, S.-C. Mei, Int. J.
Hydrogen Energy. 32 (2007) 4452–4458.
[107] H. Tang, S. Wang, M. Pan, R. Yuan, Porosity-graded micro-porous layers for
polymer electrolyte membrane fuel cells, 2007.
[108] Z. Zhan, J. Xiao, Y. Zhang, M. Pan, R. Yuan, Int. J. Hydrogen Energy. 32 (2007)
4443–4451.
[109] T. Kotaka, Y. Tabuchi, U. Pasaogullari, C.-Y. Wang, Electrochim. Acta. 146
(2014) 618–629.
[110] T. Swamy, E.C. Kumbur, M.M. Mench, J. Electrochem. Soc. 157 (2010) B77–
B85.
[111] J. Kleemann, F. Finsterwalder, J. Power Sources. 190 (2009) 92–102.

172
[112] F.E. Hizir, S.O. Ural, E.C. Kumbur, M.M. Mench, J. Power Sources. 195 (2010)
3463–3471.
[113] I.V. Zenyuk, E.C. Kumbur, S. Litster, J. Power Sources. 241 (2013) 379–387.
[114] S.R. Ranabothu, C. Karnezis, L.L. Dai, J. Colloid Interface Sci. 288 (2005) 213–
221.
[115] W. Yang, K.-Y. Kim, B.E. Logan, Bioresour. Technol. 197 (2015) 318–322.
[116] ARKEMA, KYNAR® & KYNAR FLEX ® PVDF Data Brochure, n.d.
[117] E.C. Kumbur, M.M. Mench, FUEL CELLS – PROTON-EXCHANGE
MEMBRANE FUEL CELLS | Water Management, in: Encycl. Electrochem.
Power Sources, 2009: pp. 828–847.
[118] S.G. Kandlikar, M.L. Garofalo, Z. Lu, Fuel Cells. 11 (2011) 814–823.
[119] C.-J. Tseng, S.-K. Lo, Energy Convers. Manag. 51 (2010) 677–684.
[120] Y.C. Jung, B. Bhushan, Nanotechnology. 17 (2006) 4970–4980.
[121] E. Gauthier, T. Hellstern, I.G. Kevrekidis, J. Benziger, ACS Appl. Mater.
Interfaces. 4 (2012) 761–771.
[122] J. Shang, M. Flury, J.B. Harsh, R.L. Zollars, J. Colloid Interface Sci. 328 (2008)
299–307.
[123] L.Q.N. Tran, C.A. Fuentes, C. Dupont-Gillain, A.W. Van Vuure, I. Verpoest,
Colloids Surfaces A Physicochem. Eng. Asp. 377 (2011) 251–260.
[124] E. Antolini, Appl. Energy. 88 (2011) 4274–4293.
[125] A. Wijayasinghe, B. Bergman, C. Lagergren, Electrochim. Acta. 49 (2004) 4709–
4717.
[126] A. Wijayasinghe, B. Bergman, C. Lagergren, Solid State Ionics. 177 (2006) 165–
173.
[127] H. Morita, M. Komoda, Y. Mugikura, Y. Izaki, T. Watanabe, Y. Masuda, et al., J.
Power Sources. 112 (2002) 509–518.
[128] R.J. Berger, E.B.M. Doesburg, J.G. van Ommen, J.R.H. Ross, Appl. Catal. A Gen.
143 (1996) 343–365.
[129] G.J. Janz, J. Phys. Chem. Ref. Data. 17 (1988).
[130] L.R. Fisher, P.D. Lark, J. Colloid Interface Sci. 69 (1979) 486–492.

173
[131] S. Levine, J. Lowndes, E.J. Watson, G. Neale, J. Colloid Interface Sci. 73 (1980)
136–151.
[132] T. Dang-Vu, J. Hupka, Physicochem. Probl. Miner. Process. 39 (2005) 47–65.
[133] G. Bracco, B. Holst, Surface Science Technique, 1st ed., Springer Series in
Surface Sciences, New York, 2013.
[134] J. Shang, M. Flury, J.B. Harsh, R.L. Zollars, J. Colloid Interface Sci. 328 (2008)
299–307.
[135] H.B. Eral, D.J.C.M. ’t Mannetje, J.M. Oh, Colloid Polym. Sci. 291 (2013) 247–
260.
[136] H. Eral, D.J. Mannetje, J.M. Oh, Colloid Polym Sci. 291 (2013) 247–260.
[137] B. Krasovitski, A. Marmur, Langmuir. 21 (2005) 3881–3885.
[138] C.W. Extrand, S.I. Moon, Langmuir. 26 (2010) 17090–17099.
[139] X. Zhang, F. Shi, J. Niu, Y. Jiang, Z. Wang, J. Mater. Chem. 18 (2008) 621–633.
[140] C.N.C. Lam, R. Wu, D. Li, M.L. Hair, A.W. Neumann, Adv. Colloid Interface Sci.
96 (2002) 169–191.
[141] J. Xue, P. Shi, L. Zhu, J. Ding, Q. Chen, Q. Wang, Appl. Surf. Sci. 296 (2014)
133–139.
[142] Y.C. Jung, B. Bhushan, J. Microsc. 229 (2008) 127–140.
[143] M. Miyama, Y. Yang, T. Yasuda, T. Okuno, H. Yasuda, Langmuir. 13 (1997)
5494–5503.
[144] A. Mennella, N.R. Morrow, J. Colloid Interface Sci. 172 (1995) 48–55.
[145] K. Abe, H. Takiguchi, K. Tamada, Langmuir. 16 (2000) 2394–2397.
[146] A. Mennella, N.R. Morrow, J. Colloid Interface Sci. 172 (1995) 48–55.
[147] X. Xie, N.R. Morrow, J.S. Buckley, J. Pet. Sci. Eng. 33 (2002) 147–159.
[148] T.T. Chau, Miner. Eng. 22 (2009) 213–219.
[149] T. Yasuda, T. Okuno, Langmuir. 10 (1994) 2435–2439.
[150] K. Grundke, A. Augsburg, J. Adhes. Sci. Technol. 14 (2000) 765–775.
[151] M. Strobel, S. Corn, C.S. Lyons, G.A. Korba, J. Polym. Sci. Polym. Chem. 23
(1985) 1125–1135.

174
[152] V.M. Starov, S.R. Kosvintsev, M.G. Velarde, J. Colloid Interface Sci. 227 (2000)
185–190.