rollover analysis of passenger bus as per ais-031 superstructure of the bus shall be so designed and...
TRANSCRIPT
International Journal of Engineering Research and Development
e-ISSN: 2278-067X, p-ISSN: 2278-800X, www.ijerd.com
Volume 4, Issue 5 (October 2012), PP. 49-59
49
Rollover Analysis of Passenger Bus as per AIS-031
Vishwajeet Belsare1, Prof. (Dr) Charudatta Pathak
2, Milind Kulkarni
3
1Department of Mechanical Engineering, SCOE, University of Pune, Maharashtra, India 2Department of Mechanical Engineering, SCOE, University of Pune, Maharashtra, India
3Node Element Consultancy Pvt. Ltd., Pune, Maharashtra, India.
Abstract:—Road transport is the most commonly used way of transportation in India and in many countries. The
passenger bus plays an important role in public transport. The capacity of carrying more passengers compared to
other road transport medium is unfavourable in the event of major bus accident. The rollover crash accident of
passenger bus, although occurs less frequently than any other type of accident, the fatality rate and severe injuries
are highest in rollover crash. Hence the structure of the bus needs to be strong enough to ensure the minimum
damage and at the same time it should absorb maximum impact energy. Safety regulations are in force defining
minimum structural rigidity under rollover crash. The Automotive Industry Standard (AIS-031) is implemented in
India since October 2008 which specifies the requirements and methods to calculate the strength of superstructure
of buses during and after rollover. The AIS-031 specifies four different test methods viz. physical rollover test on
a complete vehicle, rollover test on a body section, pendulum test on a body section, and verification of strength of
superstructure by calculation (numerical simulation). In this work numerical simulation of rollover test using finite
element method is followed. First the numerical model is build according to the guidelines provided in AIS-031
and validated by the experimental testing. A validated numerical model is used to evaluate the rollover
performance of the superstructure of the bus.
Keywords:— Bus rollover, Occupant safety, AIS-031, Numerical simulation, RADIOSS
I. INTRODUCTION A large number of road accidents take place every year causing many fatalities and severe injuries to the vehicle
occupants. If adequate attention is given to injury prevention, by making the vehicles inherently safer, this problem can be
reduced. Among the various modes of vehicle crashes, rollover crashes are often very severe and threatening to vehicle
occupants. Though rollover crash occurs less frequently, the higher risk of serious injuries and fatalities makes the study of
rollover analysis and providing solution becomes imperative.
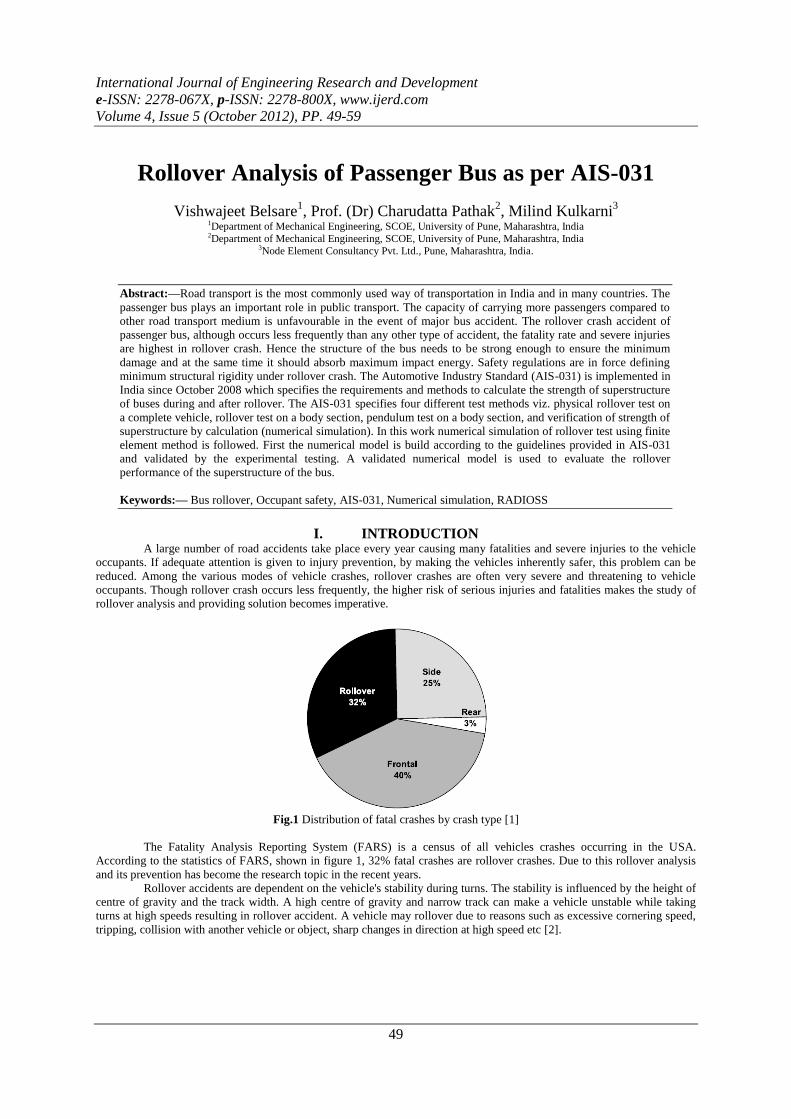
Fig.1 Distribution of fatal crashes by crash type [1]
The Fatality Analysis Reporting System (FARS) is a census of all vehicles crashes occurring in the USA.
According to the statistics of FARS, shown in figure 1, 32% fatal crashes are rollover crashes. Due to this rollover analysis
and its prevention has become the research topic in the recent years.
Rollover accidents are dependent on the vehicle's stability during turns. The stability is influenced by the height of
centre of gravity and the track width. A high centre of gravity and narrow track can make a vehicle unstable while taking
turns at high speeds resulting in rollover accident. A vehicle may rollover due to reasons such as excessive cornering speed,
tripping, collision with another vehicle or object, sharp changes in direction at high speed etc [2].
Rollover Analysis of Passenger Bus as per AIS-031
50
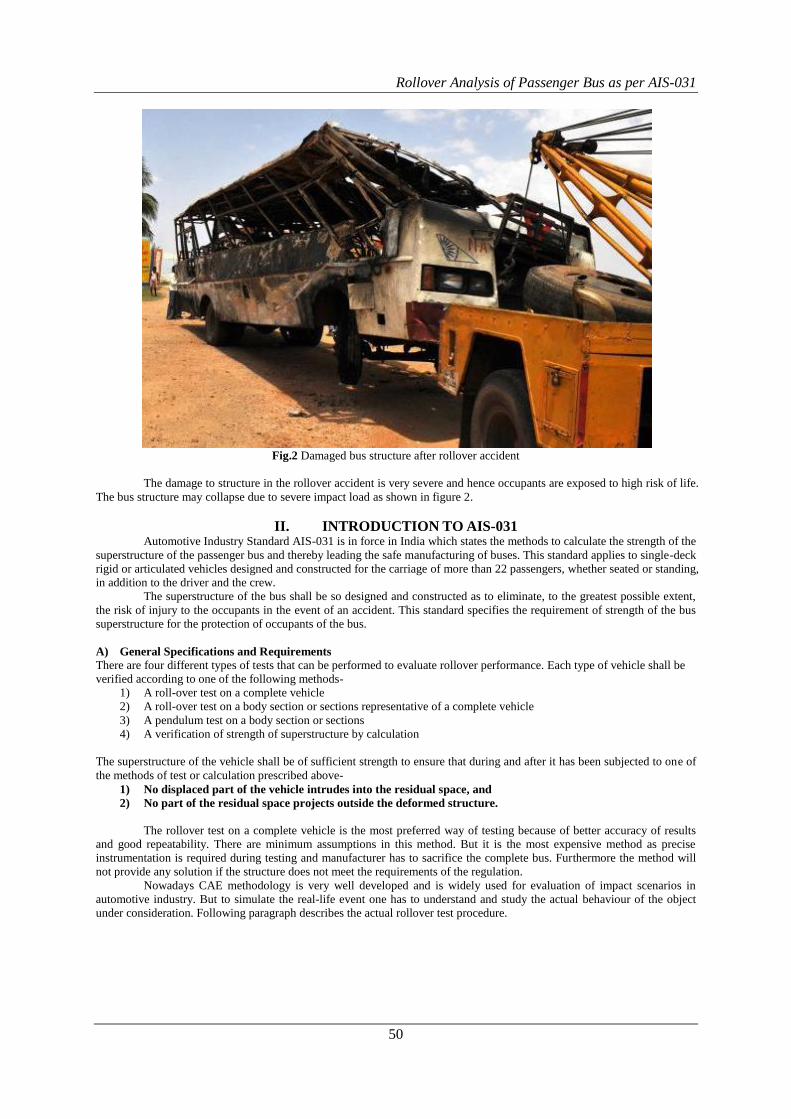
Fig.2 Damaged bus structure after rollover accident
The damage to structure in the rollover accident is very severe and hence occupants are exposed to high risk of life.
The bus structure may collapse due to severe impact load as shown in figure 2.
II. INTRODUCTION TO AIS-031 Automotive Industry Standard AIS-031 is in force in India which states the methods to calculate the strength of the
superstructure of the passenger bus and thereby leading the safe manufacturing of buses. This standard applies to single-deck
rigid or articulated vehicles designed and constructed for the carriage of more than 22 passengers, whether seated or standing,
in addition to the driver and the crew.
The superstructure of the bus shall be so designed and constructed as to eliminate, to the greatest possible extent,
the risk of injury to the occupants in the event of an accident. This standard specifies the requirement of strength of the bus
superstructure for the protection of occupants of the bus.
A) General Specifications and Requirements
There are four different types of tests that can be performed to evaluate rollover performance. Each type of vehicle shall be
verified according to one of the following methods-
1) A roll-over test on a complete vehicle
2) A roll-over test on a body section or sections representative of a complete vehicle
3) A pendulum test on a body section or sections
4) A verification of strength of superstructure by calculation
The superstructure of the vehicle shall be of sufficient strength to ensure that during and after it has been subjected to one of
the methods of test or calculation prescribed above-
1) No displaced part of the vehicle intrudes into the residual space, and
2) No part of the residual space projects outside the deformed structure.
The rollover test on a complete vehicle is the most preferred way of testing because of better accuracy of results
and good repeatability. There are minimum assumptions in this method. But it is the most expensive method as precise
instrumentation is required during testing and manufacturer has to sacrifice the complete bus. Furthermore the method will
not provide any solution if the structure does not meet the requirements of the regulation.
Nowadays CAE methodology is very well developed and is widely used for evaluation of impact scenarios in
automotive industry. But to simulate the real-life event one has to understand and study the actual behaviour of the object
under consideration. Following paragraph describes the actual rollover test procedure.
Rollover Analysis of Passenger Bus as per AIS-031
51
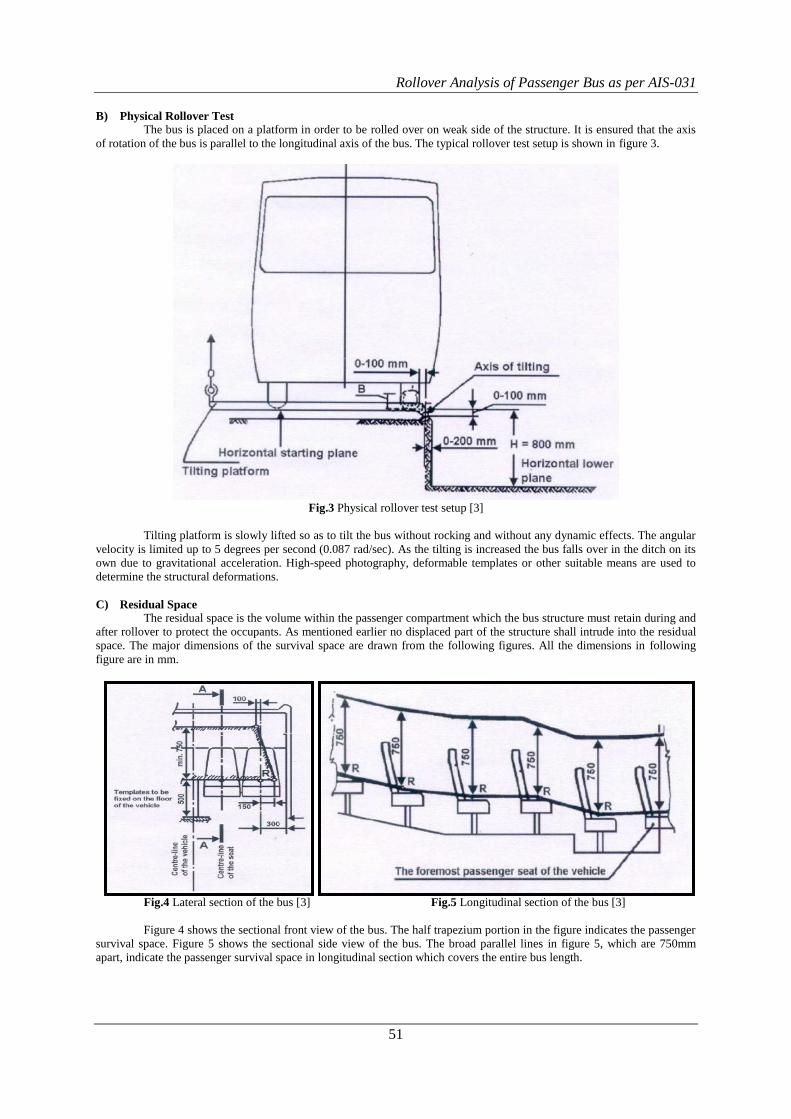
B) Physical Rollover Test
The bus is placed on a platform in order to be rolled over on weak side of the structure. It is ensured that the axis
of rotation of the bus is parallel to the longitudinal axis of the bus. The typical rollover test setup is shown in figure 3.
Fig.3 Physical rollover test setup [3]
Tilting platform is slowly lifted so as to tilt the bus without rocking and without any dynamic effects. The angular
velocity is limited up to 5 degrees per second (0.087 rad/sec). As the tilting is increased the bus falls over in the ditch on its
own due to gravitational acceleration. High-speed photography, deformable templates or other suitable means are used to
determine the structural deformations.
C) Residual Space The residual space is the volume within the passenger compartment which the bus structure must retain during and
after rollover to protect the occupants. As mentioned earlier no displaced part of the structure shall intrude into the residual
space. The major dimensions of the survival space are drawn from the following figures. All the dimensions in following
figure are in mm.
Fig.4 Lateral section of the bus [3] Fig.5 Longitudinal section of the bus [3]
Figure 4 shows the sectional front view of the bus. The half trapezium portion in the figure indicates the passenger
survival space. Figure 5 shows the sectional side view of the bus. The broad parallel lines in figure 5, which are 750mm
apart, indicate the passenger survival space in longitudinal section which covers the entire bus length.

Rollover Analysis of Passenger Bus as per AIS-031
52
III. FINITE ELEMENT MODEL BUILDING The main target of finite element model of the bus is to capture the deformation and interaction of bus subsystems
during rollover impact. The accuracy of results depends upon the accuracy of CAD geometry and quality of meshing. As the
rollover impact takes place on the sides of the bus, the main load bearing members are the superstructure members of the bus.
The parts of the bus model lying below the position of centre of gravity contribute very little in absorbing kinetic energy [4].
The major part of kinetic energy is absorbed by the superstructure members in the form of deformations. Therefore dense
mesh is used for the superstructure compared to the other parts. The complete bus structure along with chassis was modelled
using shell elements. To ensure computational convergence and to keep computational time reasonably low, minimum
element length used is 8 mm. The mesh quality criteria followed for shell meshing is given in Table I.
Table I: Quality Criteria Table
Sr. No. Quality Checking Parameter Allowable Value
1 Minimum length of element >8mm
2 Aspect Ratio > 5
3 Warping Angle < 10 degrees
4 Skew Angle < 45 degrees
5 Jacobian > 0.6
6 Minimum included angle- Tria > 20 degrees
7 Maximum included angle- Tria < 120 degrees
8 Minimum included angle- Quad > 45 degrees
9 Maximum included angle- Quad < 135 degrees
10 Percentage of Tria < 5%
Altair Hypermesh software is used for meshing purpose. The CAD model of the bus was imported into Hypermesh.
The mid-surfaces were extracted from the CAD model. The features like fillet, small holes having dimensions less than 8
mm were deleted because of less structural significance.
Fig.6 Finite Element (mesh) Model
Finite element model, shown in figure 6, can be distinguished between the bus superstructure and the chassis. The
superstructure is the main load bearing member and has the dense meshing compared to the chassis and its components.
Chassis consists of axles, tires, suspension system etc. mounted on it. It is required to capture the mass of various
components on chassis accurately to maintain the centre of gravity of total bus close to the actual value. The chassis being
the heaviest part, it controls the dynamics of total bus during rollover [5].
The exact distribution of mass is also important. Mass of various subsystems like engine, radiator, transmission,
fuel tank and seats are applied as concentrated mass at respective locations. Axles are represented by ‘shell’ elements and
their mass is adjusted to account for the mass of entire axle assembly, differential and wheels. The exterior panels and leads

Rollover Analysis of Passenger Bus as per AIS-031
53
were neglected for their small capacity of impact energy absorption. The finite element solver used for the simulation is
RADIOSS, a non-linear solver developed by Altair Engineering. The FE model of bus has been made up of combination of
shell, beam and rigid elements. All the structural members are modelled using shell elements. Bolt joints are simulated using
1-D beam elements, and 1-D rigid elements are used for weld simulation. The ground was represented by RIGIDWALL
option.
A) Modelling of Residual Space
Residual space is defined as per the guidelines provided in AIS-031. It was introduced 500 mm above the floor
under the passengers’ feet, and 300 mm away from the inside surface of the side of the bus, throughout the entire bus. The
model of the survival space consists of ‘beam‟ element frames rigidly mounted in the hard region under the floor. The
connection of the residual space to the chassis channel is provided by „rigidlink‟ element of RADIOSS. The finite element
model of the full bus comprised 5,83,048 first order explicit shell elements, 552 beam elements, 8,595 1-D rigid elements
and 13 mass elements. Shell element length was assigned as 8 mm in both critical regions and up to 40 mm was used for
those under the floor (lower structure-chassis).
The number of elements per profile width was at least 3 for the upper part of the structure and the number of
elements per profile width was 4 for sidewall pillars (main pillars) which are significant for rollover impact deformation [6].
B) Material Data
Non-linear material properties are assigned to the superstructure. The tension test was performed on sample
components to obtain the engineering stress-strain curve. The true stress and true strain were used as the input to the material
card in software. The material card used in RADIOSS is “M36_PLAS_TAB” Elastic Plastic Piecewise Linear Material. This
law models the isotropic elastic plastic material using user defined functions for the plastic stress-strain curve. This is an
elastic model made of plastic which applies the Young’s Modulus if the stress is lower than the yield stress, and measured
stress-strain-curves if the stress is greater than the yield stress [7].
C) Material Coupon Testing
RADIOSS, a nonlinear finite element solver, is used for the rollover crash simulation. To represent the vehicle
dynamic behaviour more realistically, exact material properties were first determined from laboratory tests. Two material
types which represent most of the bus body were selected for laboratory structure-property quantification. Structural material
used for the passenger compartment includes box tubing sections of 60mm x 40mm x 3mm thick and 40mm x 40mm x 2mm
thick. The standard test specimens were cut from the hollow sections by using milling machine.
Fig.7 Test specimen cut from the hollow tube
Figure 7 shows the hollow section tube used in the construction of bus structure as well as the sample specimen.
The encircled piece is the specimen prepared as per standard ASTM tensile test. The engineering stress- strain curves and
mechanical properties like ultimate tensile strength, breaking strength, elongation at UTS and breaking elongation etc. were
obtained from the tension test.

Rollover Analysis of Passenger Bus as per AIS-031
54
IV. EXPERIMENTAL VALIDATION Before the start of the analysis of complete bus model material model validation is required. It was decided to
compare the force versus displacement graph of experimental and finite element specimen to validate the material model. A
sample specimen was prepared for the three point bend test and loaded on Universal Testing Machine as shown in figure 8.
The specimen was loaded with the support span of 550mm. The mid-span deflection was recorded as a function of load
applied at the mid-point of span. The maximum displacement of 9.2 mm was recorded.
Fig.8 Bend test experimental setup
To simulate the three point bend test the finite element model was prepared as shown in figure 9 with the exact
dimensions as that of the test specimen. The material properties obtained from the tension tests were applied to the finite
element model. The true stress- strain curves obtained in coupon test were used as input to the elastic-plastic material card in
RADIOSS. The displacement contour after the simulation is shown in the figure 9. The position of the specimen before and
after the deformation is also presented.
Fig.9 Displacement plot during bend test simulation
Rollover Analysis of Passenger Bus as per AIS-031
55
Fig.10 Force versus displacement during bend test
Figure 10 shows the comparison of the force versus displacement plot of the experimental and FEA bend test. The
FEA curve shows the same behaviour as the experimental curve. The experimental test shows the 9.2 mm displacement at
mid-span when the force is 31.20kN while the FEA result shows the same displacement at a force of 33.05kN. The
displacement is in close agreement with the experimental values and hence it is concluded that the material model is
validated.
V. SIMULATION OF BUS ROLLOVER
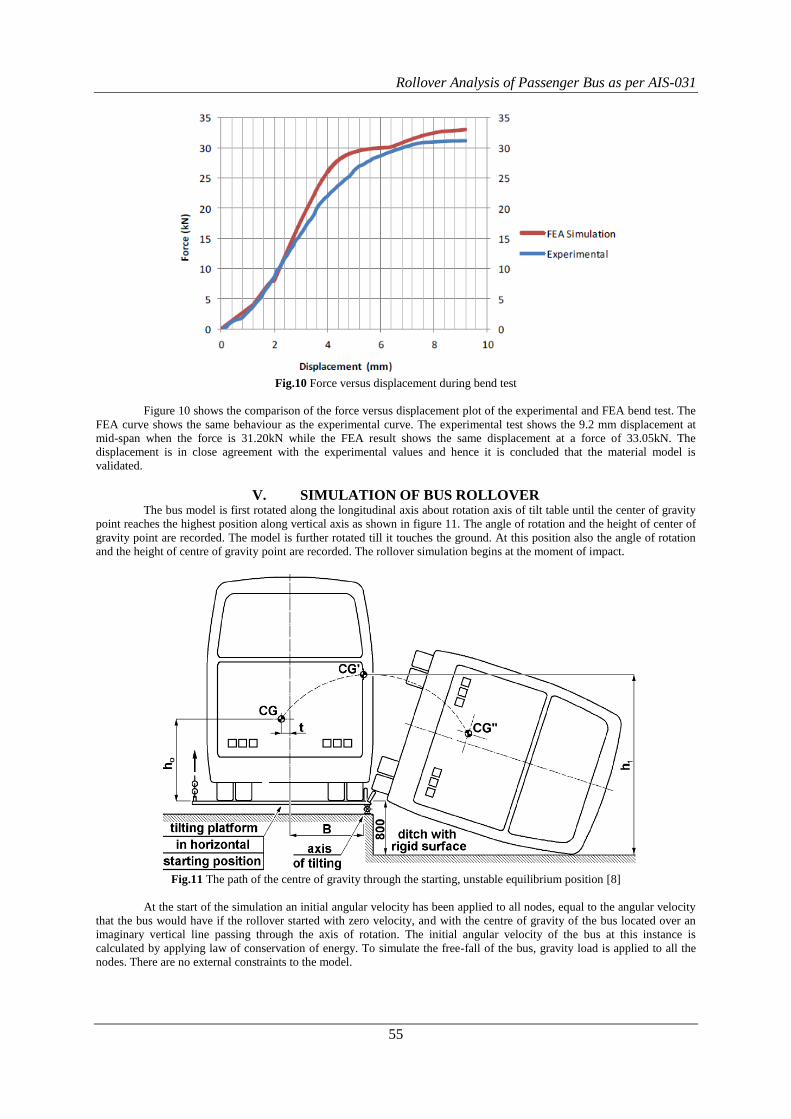
The bus model is first rotated along the longitudinal axis about rotation axis of tilt table until the center of gravity
point reaches the highest position along vertical axis as shown in figure 11. The angle of rotation and the height of center of
gravity point are recorded. The model is further rotated till it touches the ground. At this position also the angle of rotation
and the height of centre of gravity point are recorded. The rollover simulation begins at the moment of impact.
Fig.11 The path of the centre of gravity through the starting, unstable equilibrium position [8]
At the start of the simulation an initial angular velocity has been applied to all nodes, equal to the angular velocity
that the bus would have if the rollover started with zero velocity, and with the centre of gravity of the bus located over an
imaginary vertical line passing through the axis of rotation. The initial angular velocity of the bus at this instance is
calculated by applying law of conservation of energy. To simulate the free-fall of the bus, gravity load is applied to all the
nodes. There are no external constraints to the model.
Rollover Analysis of Passenger Bus as per AIS-031
56
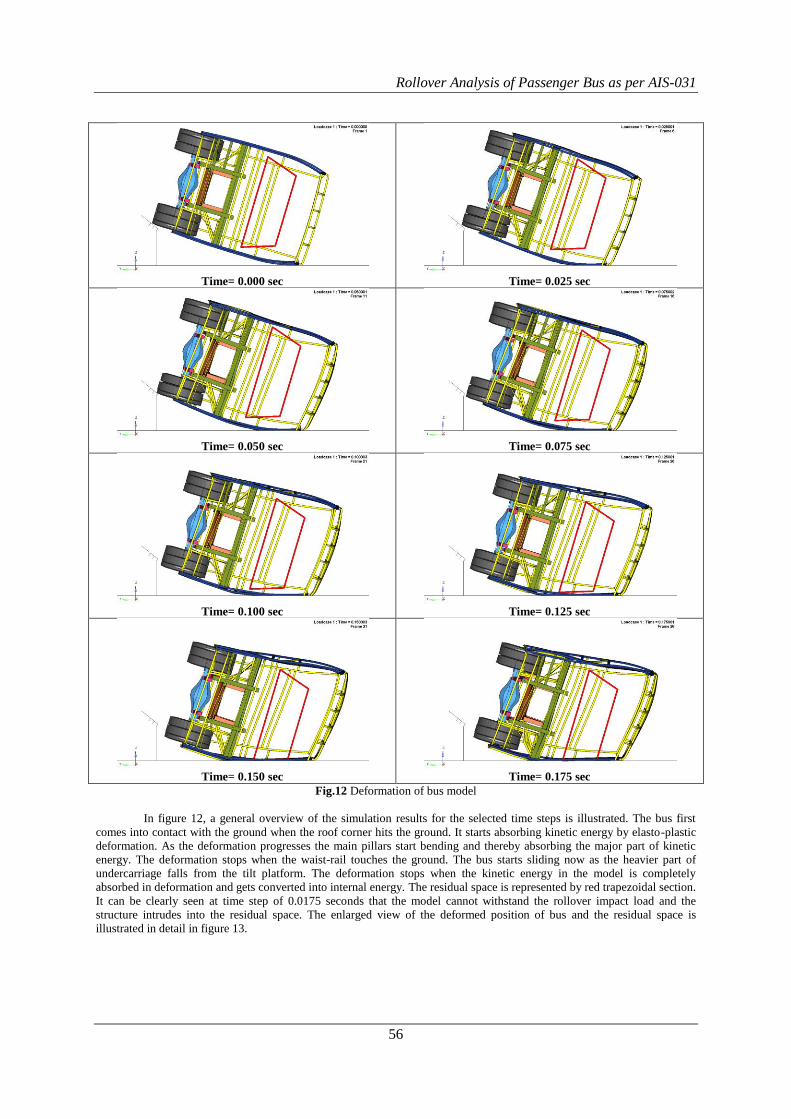
Time= 0.000 sec
Time= 0.025 sec
Time= 0.050 sec
Time= 0.075 sec
Time= 0.100 sec
Time= 0.125 sec
Time= 0.150 sec
Time= 0.175 sec
Fig.12 Deformation of bus model
In figure 12, a general overview of the simulation results for the selected time steps is illustrated. The bus first
comes into contact with the ground when the roof corner hits the ground. It starts absorbing kinetic energy by elasto-plastic
deformation. As the deformation progresses the main pillars start bending and thereby absorbing the major part of kinetic
energy. The deformation stops when the waist-rail touches the ground. The bus starts sliding now as the heavier part of
undercarriage falls from the tilt platform. The deformation stops when the kinetic energy in the model is completely
absorbed in deformation and gets converted into internal energy. The residual space is represented by red trapezoidal section.
It can be clearly seen at time step of 0.0175 seconds that the model cannot withstand the rollover impact load and the
structure intrudes into the residual space. The enlarged view of the deformed position of bus and the residual space is
illustrated in detail in figure 13.

Rollover Analysis of Passenger Bus as per AIS-031
57
Figure 13 shows the passenger survival space by red colour and all other components in green colour to
differentiate survival space clearly. The structure of the bus deforms severely and the intrusion of 25 mm is observed on top
side and the intrusion of the 40 mm is observed on the bottom side of the survival space.
Fig.13 Intrusion of bus structure into survival space
As per AIS-031 the superstructure of the vehicle shall be of sufficient strength to ensure that during and after it has
been subjected to rollover test-
1) No displaced part of the vehicle intrudes into the residual space, and
2) No part of the residual space projects outside the deformed structure.
It is concluded that the bus model under consideration does not meet the structural requirements of AIS-031 and
will fail in the rollover test.
VI. RESULT AND DISCUSSION
After the rollover analysis is performed the energy curves are plotted as shown in figure 14. The energy balance is
a method to evaluate the correctness of the numerical analysis. The kinetic energy drops continuously right from the start of
the run (time 0 seconds to 0.05 seconds). At the time instance of 0.05 seconds the window rail touches the ground. The
undercarriage of the bus now starts sliding down the tilting platform. As the mass of the undercarriage is very high, the
magnitude of kinetic energy increases slightly from time of 0.05 seconds till 0.075 seconds. From the time instance of 0.075
seconds onwards the kinetic energy starts decreasing again. The bus starts sliding in the lateral direction. The curve slopes
down sharply which shows that the energy is absorbed due to sliding friction (time 0.125 seconds to 0.175 seconds). The

Rollover Analysis of Passenger Bus as per AIS-031
58
curve becomes nearly flat after time interval of 0.200 seconds. Ideally the kinetic energy must reach to zero, but for this the
total simulation time has to be increased. From the figure 14 it is clear that the model still has the kinetic energy in it which
is the residual energy in the model due to sliding.
One of the indications for correct analysis is that the total energy remains constant. It can be observed that the
kinetic energy drops and transforms into internal energy (strain energy + sliding energy) over the time. The hourglass energy
is negligible.
Fig.14 Energy balance during rollover analysis
A) Verification of Calculation
AIS-031 defines the tilting platform test in which the bus is tilted without rocking and without any dynamic effects
until it rolls over. It is in unstable equilibrium position when the centre of gravity is at the highest position. Rollover
simulations have been carried out by positioning the bus models at a moment just before impact. At the start of the
simulation an initial angular velocity has been applied to the bus model, equal to the angular velocity that the vehicle would
have gained, if the rollover started with zero velocity from unstable equilibrium position. As per AIS-031 initial zero
velocity is considered at the start of the rollover test. Angular velocity can be calculated by applying law of conservation of
energy.
Potential Energy at unstable equilibrium position = Kinetic energy at the impact
𝑴 𝒈 ∆𝒉 = 𝟏
𝟐 𝑰 𝝎𝟐 (𝟏)
Where,
M = Kerb Mass of the bus, kg
g = Gravitational constant, mm/sec2
∆h = Drop of centre of gravity from highest position till impact position,
I = Mass moment of inertia of bus, kg-mm4
ω = Angular velocity, rad/sec
Kinetic Energy at the moment of impact can be observed from the energy balance curve to verify the correct
angular velocity has been applied to the model. Referring to figure 14 Kinetic Energy at the moment of impact is 1.38x 10⁸
N-mm.
Potential energy = 9200x 9810x 1505
= 1.36x 10⁸ N-mm
As the value of energies by mathematical calculation and from analysis results are in close agreement, the
mathematical model is verified.
Rollover Analysis of Passenger Bus as per AIS-031
59
VII. CONCLUSION
In this work a methodology to analyse the bus structure during rollover using finite element method is presented.
The used computational model provided comparable results to experimental measurements and can be used for other type of
bus to avoid expensive full-scale crash tests. Following points can be concluded from this work-
1) The numerical simulation of the bus model showed that it does not fulfil the requirements of minimum structural
resistance described in AIS-031. There are intrusions of structure into residual space throughout the length of the
bus.
2) The methodology used in this work can be applied for the verification of bus structures in a rollover cases in
future.
3) This methodology can also be used to evaluate the effect of any structural modifications on the rollover
performance before finalizing the design.
4) The finite element simulations can be used to avoid or reduce the physical testing of mechanical systems and
components. Overall effect of this is cost saving and same is done with rollover analysis.
ACKNOWLEDGMENT The authors are grateful to the Principal, Sinhgad College of Engineering, Pune and to the Head of Mechanical
Engineering Department for providing the required facilities. We are also grateful to the Head of Civil Engineering
Department and Structural Dynamics lab staff for providing guidance and help during experimental validation.
REFERENCES [1]. J. Padmanaban, Road safety around the world, Keynote paper, Symposium on International Automotive
Technology, ARAI, India, 2007, pp. 17-25
[2]. Matthew Huang, Vehicle crash mechanics, 1st edition, CRC Press, USA, 2002
[3]. AIS-031, Automotive Industry Standard, India, Automotive Vehicles –The Strength of Superstructure of large
Passenger Vehicles, 2004
[4]. Chopade S. E. et. al., Certification of buses as per AIS-031/ ECE-R66 using CAE methods, SAE paper no. 2009-
26-001
[5]. Tiwari Sanjay, Performance evaluation of bus structure in rollover as per ECE-R66 using validated numerical
simulation, SAE paper no. 2009-26-002
[6]. K. Elitok et. al., An investigation on the rollover crashworthiness of an intercity coach, influence of seat structure
and passenger weight, 9th International LS-DYNA user conference
[7]. RADIOSS Theory Manual, 10.0 Version- January 2009, Large displacement finite element analysis, Altair
Engineering, Inc.
[8]. ECE Regulation No-66, United Nations, Uniform technical prescriptions concerning the approval of large
passenger vehicles with regard to the strength of their superstructure, Revision-1, 2006