roma and egyptians in albania: a socio-demographic and economic profile based on the 2011 census
TRANSCRIPT
ROMA AND EGYPTIANS IN ALBANIA: A SOCIO- DEMOGRAPHIC AND ECONOMIC
PROFILE BASED ON THE 2011 CENSUS
Patrick Simon (INED)
Emira Galanxhi (Instat) and Olgeta Dhono
(Instat)

Roma and Egyptians in the census
Self identification as a rule
An undercount? Different estimates of Roma in Albania:
115 000 for the Council of Europe
13 000 for the UNICEF survey
11 669 (8 301 Roma, 3668 Egyptians) in the Census
Population hard to reach, distrust of administration, social
exclusion and illiteracy or assimilation through social
mobility

Albania, census 2011

A concentrated
population
On 11.698 enumeration areas (EA) 348 count at least one Roma person
50% of the Roma population live in only 25 EA, where they represent more than 32% of the inhabitants

A young population
Population
0-14
Population
15-64
Population
65+
Dependenc
y
Ratio 0-14
Dependenc
y
Ratio 65+
Albanian 20,4% 68,3% 11,3% 30% 17%
Roma 34,1% 61,5% 4,4% 55% 7%
Egyptian 27,4% 67,9% 4,7% 40% 7%

Household structures
Albanian
sRoma Egyptians
Total 100 100 100
Households with no family
nucleus3,1 2,3 3,7
Households with one family
nucleus80,1 71,3 75,2
Households with two or
more family nuclei15,3 22,6 18,2
Households with non-valid
nucleus1,6 3,8 2,9

Housing: a critical situation
15% of the Roma households live in a non-
conventional dwelling, which refers to shelters,
tents, shacks, barracks, or any type of
precarious constructions
Egyptians experience better housing
conditions: more stabilized population

Non-Conventional housing
Roma Egyptians Albanians
Total 100 100 100
Detached house 51,0 32,5 55,5
Semi-detached house 8,6 14,3 9,2
Row (or terraced) house 5,3 10,0 4,5
Apartment building
(flat)
19,3 38,2 30,1
Collective living
quarters
0,5 0,9 0,3
Building designed for
non-residential purposes
0,4 1,4 0,4
Shetler 11,0 2,6 0,1
Tent 1,2 0,0 0,0
Shack 2,4 0,1 0,0
Other structure 0,1 0,0 0,0

Ownership of houses (74%) with a substantial
proportion who are “in process of acquisition”
Houses that are in poor conditions:
lack of water supply (only 42% of dwellings have
piped water vs 66% in Albania)
No toilets or bathrooms inside (59% vs 23% in
Albania)
Overcrowding of dwellings (8,36 sq meters by
occupants vs 14,4 for Albanians)
Early family formation
Marriage at a young age for Roma women:
19% before 17 years old
At 20-24 years old, 40% of Albanian women
are married, whereas 70% of Roma women
are already in couple
A gender gap: men tend to marry later
Early family formation has huge consequences
on education and access to employment

Ever married women by ethnicity
0
10
20
30
40
50
60
70
80
90
100
15-19 years 20-24 years 25-29 years
Albanian women
Roma women

Early parenthood
Early marriage entails young age at birth:
at 18 years old, 43% of Roma women had already
given birthAlbanians Roma
15-19 2,9 33,9
20-24 24,9 68,0
25-29 59,4 83,8
30-34 79,9 89,9
35-39 89,0 91,7
40-44 92,1 93,7

Age at first birth (Cumulative distribution)
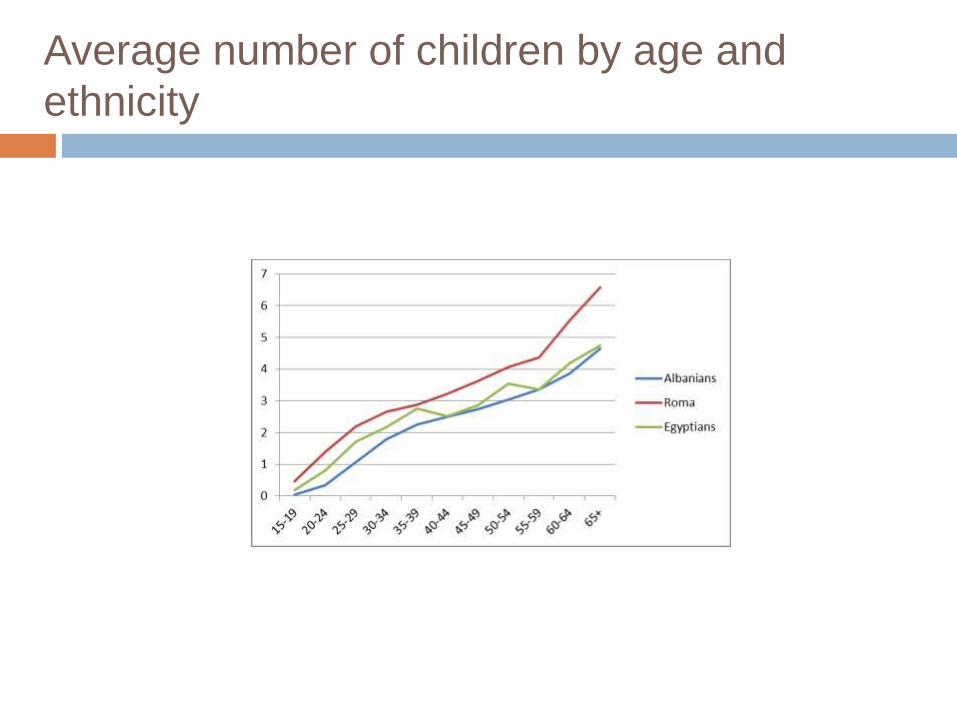
Average number of children by age and
ethnicity

A steep decline in fertilityAverage number of children by generation
Albanians Egyptians Roma
Before 1946 4,7 4,7 6,7
1956-1961 3 3,5 4,1
Norms about marriage
Traditional marriage equals civil marriage:
31% vs 36%
Ethnic homogamy is the norm: 92% of Roma
couples, 87% of Egyptian and 98% of Albanian
Religious homogamy is accordingly very high:
less than 5% of mixed couples (but the high
level of not reported religion may be more
frequent among mixed couples)

Education: A major challenge
Illiteracy
Lower school attendance
High level of drops out
Very low level of educational attainment
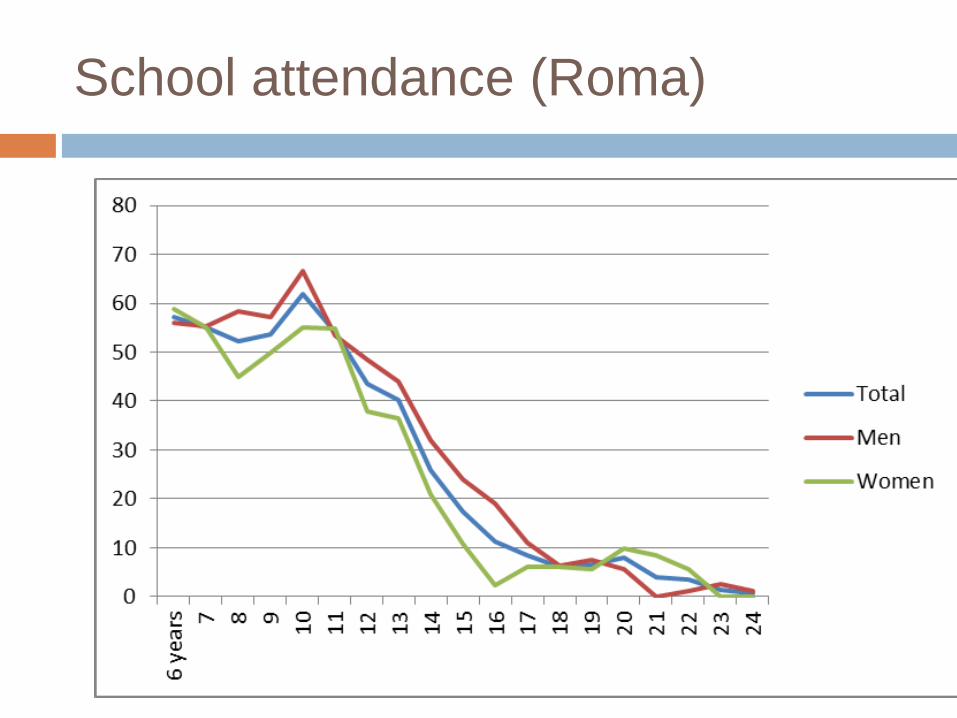
School attendance (Roma)

Fast drop out for those who have been
enrolled

Conditions for education
67% of the children attend schools which are located in a Roma settlement
38% of the children attend schools composed only with Roma pupils and 47% which can be described as non-segregated schools
However, class is mainly given in Albanian language (for 75% of the children)
Reports about discrimination and stigmatization as barriers to access school (Needs assessment report)

Catching up after a sharp decline in the
immediate post-socialist era

Educational attainment
No
schooling
No
diplomaPrimary
Lower
secondary
Upper
secondaryTertiary Total
Roma
Men 49,0 5,4 22,7 20,2 2,4 0,5 100
Women 54,6 5,8 21,6 15,6 2,0 0,4 100
Total 51,8 5,6 22,1 17,9 2,2 0,5 100
Egyptians 15,7 4,5 30,7 39,7 8,0 1,4 100
Albanians 2,8 1,2 15,7 40,7 28,8 10,8 100

Employment and income
A position at the fringe of the formal labor
market
Lack of formal qualifications but also weak
returns of education
Barriers on the labor market : self reported
experiences of discrimination confirmed by
residual gaps

Employment rate

Unemployment rate

Employment rate by age and gender

Quality of work
Most employed Roma are self employed
(62%) where Egyptians (63%) and Albanians
(54 %) are employees
37% of the employed Roma collect scraps or
work on an hourly base as unskilled worker vs
16% of Albanians (UNDP survey)
Low returns of education on the
labor market for Roma
Benefits of education on employment prospects are not
that obvious: employment rate increases from 32%
when never attended school to 38% after 10 years of
education for men and 13% to 20 for women
A logistic regression shows that women have less
probability to be employed than men, upper secondary
diploma provides more opportunities (but no significant
differences below) and young Roma before 30 years old
get lower prospects.

A population at risk of unemployment
beyond formal credentialsEstimate Pr >
ChiSq
Intercept -0.5070 <.0001
Gender Male Ref
Female 0.3282 <.0001
Age 13-17 34.566 <.0001
18-20 0.8260 <.0001
21-24 0.5903 <.0001
25-34 Ref
35-44 -0.4166 <.0001
45-54 -0.5866 <.0001
55-64 -0.6355 <.0001
Education
attainment
No education Ref
Lower Basic -0.0971 0.0004
Upper basic -0.2873 <.0001
Secondary and More -0.7926 <.0001
Ethnicity Roma 0.4091 <.0001
Albanian Ref

Self-reported experience of
discrimination (UNDP survey)
Discrimination in the last 5 years
40,4
Looking for job 46,1
At work 23,6
In housing 32,6
In health 42,8
In education 31,5

Conclusion
Clear findings about the marginalization of Roma and Egyptians in the Albanian society
The gap is widening in the market economy
Actions should be taken to enhance access and participation to education and labor market
Housing and health are also major issues
Lack of resources from communities, but also institutional and social barriers to be alleviated: stigmatization and discrimination