romcif engleza-carte - insse.ro · statistical abstract 5 geographical position of romania extreme...
TRANSCRIPT


CONTENTS
General presentation ................................................................................... 5
Population ......................................................................................................... 10
Labour market ................................................................................................ 20
Population income ...................................................................................... 31
Earnings .............................................................................................................. 32
Population expenditure ............................................................................ 34
Population consumption .......................................................................... 35
Dwellings ........................................................................................................... 36
Unemployed social protection .............................................................. 38
Social insurance ............................................................................................. 39
Social assistance .............................................................................................. 41
Health .................................................................................................................... 43
Education ........................................................................................................... 47
Culture ................................................................................................................. 51
Prices ..................................................................................................................... 54
National accounts ......................................................................................... 56
Investments ...................................................................................................... 60
Agriculture ........................................................................................................ 61
Forestry ................................................................................................................ 65
Enterprise activity ......................................................................................... 66
Industry ................................................................................................................. 67
Energy .................................................................................................................. 69
Construction .................................................................................................... 70
Transport ............................................................................................................ 71
International trade in goods .................................................................. 74
Domestic trade ............................................................................................... 80
Market services ............................................................................................... 81
Tourism ............................................................................................................... 82
Justice .................................................................................................................. 84
International statistics ................................................................................ 86
Page
Statistical abstract 5
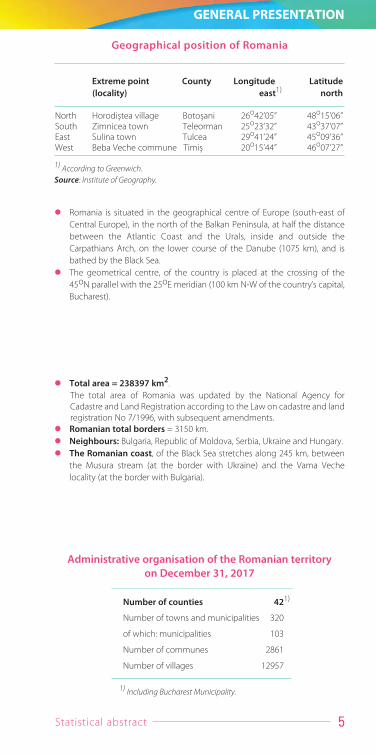
Geographical position of Romania
Extreme point County Longitude Latitude(locality) east1) north
North Horodiºtea village Botoºani 26o42’05” 48o15’06”South Zimnicea town Teleorman 25o23’32” 43o37’07”East Sulina town Tulcea 29o41’24” 45o09’36”West Beba Veche commune Timiº 20o15’44” 46o07’27”
1) According to Greenwich.Source: Institute of Geography.
Romania is situated in the geographical centre of Europe (south-east ofCentral Europe), in the north of the Balkan Peninsula, at half the distancebetween the Atlantic Coast and the Urals, inside and outside theCarpathians Arch, on the lower course of the Danube (1075 km), and isbathed by the Black Sea.
The geometrical centre, of the country is placed at the crossing of the45oN parallel with the 25oE meridian (100 km N-W of the country’s capital,Bucharest).
Total area = 238397 km2.
The total area of Romania was updated by the National Agency forCadastre and Land Registration according to the Law on cadastre and landregistration No 7/1996, with subsequent amendments.
Romanian total borders = 3150 km. Neighbours: Bulgaria, Republic of Moldova, Serbia, Ukraine and Hungary. The Romanian coast, of the Black Sea stretches along 245 km, between
the Musura stream (at the border with Ukraine) and the Vama Vechelocality (at the border with Bulgaria).
Administrative organisation of the Romanian territory on December 31, 2017
Number of counties 421)
Number of towns and municipalities 320
of which: municipalities 103
Number of communes 2861
Number of villages 12957
1) Including Bucharest Municipality.
GENERAL PRESENTATION
ROMANIA IN FIGURES6
Major mountain peaks
ROMANIA’S RELIEF
It consists of three major levels, namely: the highest one in the Carpathians, themiddle one which corresponds to the Sub-Carpathians, to the hills and to theplateaus, and the lowest one in the plains, the meadows and the DanubeDelta. The main features of the relief units are proportionality (31% mountains,36% hills and plateaus, 33% plains and meadows) and the concentric display ofthe major relief levels.
Romanian running waters are radially displayed, most of them havingtheir source in the Carpathians, and flow into the Danube river, whichmarks the southern border on a 1075 km length and flows into the Black Sea.
Name of Name of Heightpeak massif County (m)
Moldoveanu Fãgãraº Argeº 2544Negoiu Fãgãraº Argeº, Braºov, Sibiu 2535Parângu Mare Parâng Gorj, Hunedoara 2519Peleaga Retezat Hunedoara 2509Omu Bucegi Prahova, Braºov, Dâmboviþa 2505
Major rivers
River name Length of the river Basin area( km ) ( km2)
Danube 1075 332501)
Mureº 761 27890Prut 742 10990Olt 615 24050Siret 559 428901) Excluding the tributaries which form the first degree basins.Source: Institute of Geography.
Lakes are represented by natural lakes, spread across all major relief units,from glacial ones in the mountainous area (Mioarele Lake - Fãgãraº at2282 m), to river-maritime banks (Techirghiol Lake at 1.5 m) and anthropiclakes.
Anthropic lake name County Area Volume( ha ) (mil. m3)
Porþile de Fier Mehedinþi 70000.01) 2400.0Ostrovu Mare Mehedinþi 7920.0 800.0
1) Between the Nera-Danube confluence and the dam (according to the data ofthe two hydro-power stations).
Source: Institute of Geography.
GENERAL PRESENTATION
Source: Institute of Geography.

Statistical abstract 7
Major natural lakes
Romania's useful mineral resources are diverse: crude oil, natural gas,coal, mainly coked pitcoal, brown coal and lignite, ferrous and non-ferrousores, gold and silver deposits, bauxite, large reserves of salt, as well asnumerous non-metalliferous resources. A special category of subsoil resources are the over 2000 mineral watersprings fit for consumption and medical treatment.
Natural lake name County Area Volume(ha) (mil. m3)
Lakes of glacial circuses: Bucura Hunedoara 10.5 0.5Lakes of volcanic crater: Sfânta Ana Harghita 22.0 0.6Lakes of karstic depression: Zãton Mehedinþi 20.0 1.0Lakes natural barrage: Lacul Roºu Harghita 12.6 0.7Clasto-karstic lakes: Ianca Brãila 322.0 1.6River banks: Oltina Constanþa 2509.0 60.0River-maritime banks: Taºaul Constanþa 2335.0 57.0Maritime lagoons: Razim Tulcea 41500.0 909.0River meadow lakes: Brateº Galaþi 2111.0 30.0Danube Delta lakes: Dranov Tulcea 2170.0 21.7
Source: Institute of Geography.
Categories of protected areas Number Area (ha)
Scientific reserves, natural monuments, natural reserves 916 307973National parks 13 317419Natural parks 16 770027Biosphere reserves 3 661939Wetlands of international importance 19 1096640Avifauna special protection areas 171 3875298Sites of Community importance 435 4650970Natural sites of the universal natural heritage 1 311916
Source: National Agency for Environment Protection.
Name of County Areareserves (ha)
Total 661939Danube Delta Tulcea, Constanþa 576421Retezat Hunedoara 38316Rodna Maramureº, Bistriþa-Nãsãud, Suceava 47202
Source: National Agency for Environment Protection.
Protected areas, in 2017
Biosphere reserves, in 2017
GENERAL PRESENTATION

ROMANIA IN FIGURES8
Air temperature, in 2017Celsius degrees
Yearly absolute Yearly absoluteMeteorological Yearly maximum minimum
station average Value Recording Value Recordingdate date
Satu Mare 10.9 37.5 4.VIII -16.2 10.ISuceava 9.5 35.5 4.VIII -18.6 11.IIOradea 11.5 39.0 4.VIII -17.4 8.IIaºi 11.0 37.8 5.VIII -21.7 11.IICluj-Napoca 10.1 37.6 5.VIII -19.0 10.ITârgu Mureº 10.1 38.2 5.VIII -21.7 10.IBacãu 10.2 38.8 6.VIII -18.9 11.IITimiºoara 12.1 39.8 5;6.VIII -15.6 8.IDeva 11.0 39.1 5.VIII -22.3 10.ISibiu 9.9 36.4 5.VIII -29.0 10.IVârfu Omu -1.4 17.4 5;6.VIII -29.2 9.IGalaþi 12.1 38.6 1.VII -15.2 10.ITârgu Jiu 11.8 39.6 5.VIII -18.5 10.IBuzãu 11.9 37.5 6.VIII -19.6 10.ICalafat … 42.2 6.VIII -20.3 27.ITurnu Mãgurele 12.2 40.9 1.VII -19.3 12.IBucharest-Filaret 12.7 41.0 6.VIII -15.3 12.IConstanþa 12.9 34.7 4.VIII -15.8 10.I
… = Data not available.
Source: National Administration of Meteorology.
Meteorological station Yearly quantity (mm)
Satu Mare 724.2Suceava 399.1Oradea 725.9Iaºi 510.2Cluj-Napoca 472.7Târgu Mureº 614.8Bacãu 570.2Timiºoara 515.5Deva 447.7Sibiu 589.6Vârfu Omu 1404.2Galaþi 649.5Târgu Jiu 616.8Buzãu 688.9Calafat ...Turnu Mãgurele 700.3Bucharest-Filaret 768.2Constanþa 508.3
... = Data not available.
Source: National Administration of Meteorology.
Precipitations, in 2017
GENERAL PRESENTATION

Statistical abstract 9
POPULATION 19644350 inhabitants, on January 1st, 2017 (usually resident population); Density of the usually resident population: 82.4 inhabitants / km2, on
January 1st, 2017.
CAPITAL: Bucharest Municipality (2104967 inhabitants, permanent residentpopulation on July 1st, 2017), divided into six administrative sectors.Mentioned for the first time in documents on 20.IX.1459, as residence ofVlad Þepeº.It becomes the capital of the Romanian Country (Country Româneascã) in thesecond half of the 17th century and the capital of Romania in 1862, being themost important political, economic, cultural and scientific centre of the country.
MAIN CITIES: Bucharest, Iaºi, Timiºoara, Cluj-Napoca, Constanþa, Craiova, Galaþi,Braºov, Ploieºti, Oradea. The town situated at the highest average altitude is Predeal (Braºov county)= 1060 m. The town situated at the lowest average altitude is Sulina (Tulcea county) = 4 m.
MAIN HARBOURS:– at the Black Sea: Constanþa, Mangalia;– at the Danube: Moldova Nouã, Orºova, Drobeta-Turnu Severin, Calafat,
Corabia, Turnu Mãgurele, Zimnicea, Giurgiu, Olteniþa, Cãlãraºi, Cernavodã,Hârºova, Mãcin, Brãila, Galaþi, Tulcea, Sulina.
MAIN AIRPORTS: Bucharest (“Henri Coandã”-Otopeni and “Aurel Vlaicu”-Bãneasa), Constanþa („Mihail Kogãlniceanu”), Timiºoara („Traian Vuia”),Cluj-Napoca, Iaºi, Craiova, Arad, Bacãu, Baia Mare, Oradea, Satu Mare, Sibiu,Târgu Mureº, Suceava, Tulcea.
OFFICIAL LANGUAGE: Romanian.
ROMANIA’S NATIONAL DAY: December 1.
ROMANIA’S FLAG: Is three coloured, the colours being placed vertically in thefollowing order from the flagpole: blue, yellow, red.
GOVERNMENT FORM IN ROMANIA:Republic, according to the Constitution adopted in 1991, amended and
republished in 2003 (Official Journal No 767/October 31, 2003); Legislative power: a bicameral Parliament (the Chamber of Deputies and
the Senate); Executive power: a Government led by a Prime Minister appointed by the
country's President; The President of the country is elected based on general election results
by universal vote for a 5-year mandate.
NATIONAL CURRENCY: leu, with “ban” as subdivision.The exchange rate is set on the interbank currency market on a daily basis; the reference currency is the euro. In 2017, the average exchange rate leu / eurowas 4,5681.
GENERAL PRESENTATION

ROMANIA IN FIGURES10
20141) 2015 2016 20172)
Total 19916451 19819697 19706529 19644350By sexMale 9730258 9680537 9628271 9602578Female 10186193 10139160 10078258 10041772By age group0-14 years 3094061 3073669 3061624 305702415-59 years 12158078 12003116 11826308 1173508260 years and over 4664312 4742912 4818597 4852244By areaUrban 10728929 10669579 10585664 10531255Rural 9187522 9150118 9120865 91130951) Revised data.2) On January 1st.
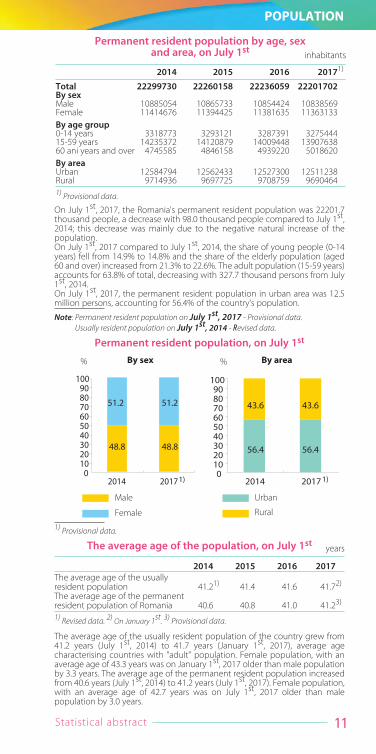
Usually resident population by age, sex and area, on July 1st inhabitants
On January 1st, 2017, Romania's usually resident population was 19644.4thousand inhabitants, of which 10.0 million women (51.1%). The negativevalues of the natural increase, combined with those of international migrationbalance, entailed a diminution of the usually resident population during July1st, 2014 - January 1st, 2017 with 272.1 thousand persons. The age structure ofthe usually resident population bears the specific imprint of the demographicageing process, marked primarily by declining birth rates, which hasdetermined the fall in the share of young population (0-14 years) and theabsolute and relative increase in the share of older people (60 years and over).On January 1st, 2017 compared to July 1st, 2014, a slight increase in the share ofyoung people (0-14 years) was noticed, from 15.5% to 15.6%, while the share ofelderly population (aged 60 and over) considerably increased from 23.4% to 24.7%.
The adult usually resident population (15-59 years) on January 1st, 2017represents 59.7% of the total, decreasing with 423 thousand persons as againstJuly 1st, 2014. Among the adult population, the share of the age groups15-19 years, 40-44 years, 45-49 years increased, while the share of the agegroups 20-24 years, 25-29 years, 30-34 years, 35-39 years, 50-54 years and55-59 years decreased.
On January 1st, 2017, the usually resident population in urban area was 10.5million persons, accounting for 53.6% of the country's population.
POPULATION
���� ����
���� ����
���� ������������������������
���� ����
��� ���
���� ������������������������
������ ��
% %By sex By area
Male
Female
Urban
Rural
Usually resident population
1) On July 1st. Revised data.2) On January 1st.
Statistical abstract 11
2014 2015 2016 2017The average age of the usually resident population 41.21) 41.4 41.6 41.72)
The average age of the permanent resident population of Romania 40.6 40.8 41.0 41.23)
1) Revised data. 2) On January 1st. 3) Provisional data.
yearsThe average age of the population, on July 1st
POPULATION
The average age of the usually resident population of the country grew from41.2 years (July 1st, 2014) to 41.7 years (January 1st, 2017), average agecharacterising countries with "adult" population. Female population, with anaverage age of 43.3 years was on January 1st, 2017 older than male populationby 3.3 years. The average age of the permanent resident population increasedfrom 40.6 years (July 1st, 2014) to 41.2 years (July 1st, 2017). Female population,with an average age of 42.7 years was on July 1st, 2017 older than malepopulation by 3.0 years.
2014 2015 2016 20171)
Total 22299730 22260158 22236059 22201702By sexMale 10885054 10865733 10854424 10838569Female 11414676 11394425 11381635 11363133By age group0-14 years 3318773 3293121 3287391 327544415-59 years 14235372 14120879 14009448 1390763860 ani years and over 4745585 4846158 4939220 5018620By areaUrban 12584794 12562433 12527300 12511238Rural 9714936 9697725 9708759 96904641) Provisional data.
Permanent resident population by age, sex and area, on July 1st
inhabitants
���� ������������������������
�� ��
� � � �
���� ������������������������
� �
�� � �� �
����
Permanent resident population, on July 1st
% %By sex By area
Male
Female
Urban
Rural
On July 1st, 2017, the Romania's permanent resident population was 22201.7thousand people, a decrease with 98.0 thousand people compared to July 1st,2014; this decrease was mainly due to the negative natural increase of thepopulation.On July 1st, 2017 compared to July 1st, 2014, the share of young people (0-14years) fell from 14.9% to 14.8% and the share of the elderly population (aged60 and over) increased from 21.3% to 22.6%. The adult population (15-59 years)accounts for 63.8% of total, decreasing with 327.7 thousand persons from July1st, 2014.On July 1st, 2017, the permanent resident population in urban area was 12.5million persons, accounting for 56.4% of the country's population.
1) Provisional data.
Note: Permanent resident population on July 1st, 2017 - Provisional data.Usually resident population on July 1st, 2014 - Revised data.

ROMANIA IN FIGURES12
POPULATION
Birth rate, death rate and natural increase
������������������
��� ���� ���� ���� ���� ��������
���
Note: For the 1985 - 2011 period permanent resident population at July 1st was used.For the 2012 - 2016 period, the usually resident population on July 1st of each year was used, and for 2017 the usually resident population on January 1st was used, populations estimated under conditions of comparability with the finalresults of the Population and Housing Census 2011.
1) Provisional data.Source: NIS - Statistical demographic surveys.
Birth rateRates (per 1000 inhabitants)
Death rate
Positive natural increase
Negative natural increase
Evolution of the birth rate, the death rate and the natural increase
2014 20151) 20161) 2017
Vital statistics (absolute data)
Live births 1987402) 197491 200009 1894743)
Deaths 2549652) 261294 257215 2605993)
- Infant deaths 16322) 1500 1398 13583)
Natural increase -562252) -63803 -57206 -711253)
Marriages 1180751) 125454 133183 1426131)
Divorces 271881) 31527 30497 311471)
Rates (per 1000 inhabitants)
Live births 10.02) 10.0 10.1 9.64)
Deaths 12.82) 13.2 13.1 13.34)
- Infant deaths 5) 8.22) 7.6 7.0 7.23)
Natural increase -2.82) -3.2 -3.0 -3.74)
Marriages 5.31) 5.6 6.0 6.44)
Divorces 1.21) 1.4 1.4 1.44)
Note: Only live-births whose mothers' usual residences were in Romania and whose births were recorded by the registry courts of Romania are included; as for deathsunder 1 year, only the deaths of persons whose usual residences were in Romaniaand whose deaths were recorded by the registry courts of Romania are included.In 2014 - 2016 period are included live births, deaths and infant deaths for people with usual residence in Romania.For birh and mortality rates from the 2014-2016 period, the usually residentpopulation on July 1st of each year was used and for 2017 year, the usuallyresident population on January 1st was used, populations estimated underconditions of comparability with the final results of the Population and HousingCensus 2011.For marriage and divorce rates the permanent resident population at July 1st wasused.
1)Final data. 2) Data revised according to the NIS revision calendar.3) Semi-final data. 4) Provisional data.5)Infant mortality rate is calculated by reporting the number of deaths of persons under
1 year, who had the usual residences in Romania, to 1000 live-births whose usualresidences were in Romania.
Source : NIS - Statistical demographic surveys.
Statistical abstract 13
POPULATION
The birth rate, the first component of the vital statistics showed for 2017 adecrease compared to the previous year and compared to 2014. Under theconditions where, on the short and medium term, mortality is not expected tocontribute significantly to reducing the demographic decline in Romania, thebirth rate remains the only one component on which it could be acted withefficient outcomes.
In 20171), the number of live births with usual residence in Romania was 189.5thousand persons and decreased with 10.5 thousands compared to 2016 andwith 9.3 thousand persons compared to 20142).
Mortality - as the second component of vital statistics - remained high inRomania. The significant increase in the level of this component should betaken into account for the demographic perspectives of Romania.
260.6 thousand persons with usual residence in Romania have died in 20171),3.4 thousand people more than in 2016 and 5.6 thousand people more than in20142). The number of deaths under 1 year for children with usual residence inRomania, registered in 20171), was 1358, with 40 fewer deaths compared to2016 and with 274 less in comparison with 20142).
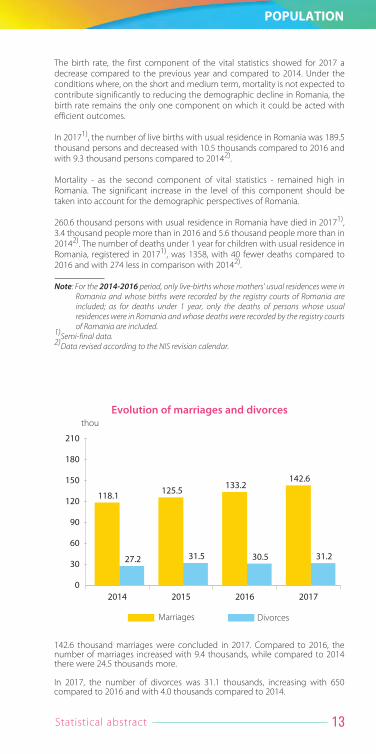
Evolution of marriages and divorces
�� � �� � �� � �� �
�� � ��� � ��� ����
���� ���� ��� �����
��
�
��
���
���
��
���
Marriages Divorces
thou
142.6 thousand marriages were concluded in 2017. Compared to 2016, thenumber of marriages increased with 9.4 thousands, while compared to 2014there were 24.5 thousands more.
In 2017, the number of divorces was 31.1 thousands, increasing with 650compared to 2016 and with 4.0 thousands compared to 2014.
Note: For the 2014-2016 period, only live-births whose mothers' usual residences were in Romania and whose births were recorded by the registry courts of Romania areincluded; as for deaths under 1 year, only the deaths of persons whose usualresidences were in Romania and whose deaths were recorded by the registry courtsof Romania are included.
1)Semi-final data.2)Data revised according to the NIS revision calendar.

ROMANIA IN FIGURES14
POPULATION
Top ten towns in the country by number of inhabitantswith permanent residence in Romania, on July 1st, 2017
Current Town1) Numbernumber of inhabitants
1. Bucharest 21049672. Iaºi 3718893. Timiºoara 3310044. Cluj-Napoca 3231085. Constanþa 3153946. Craiova 3033217. Galaþi 3027728. Braºov 2901679. Ploieºti 230523
10. Oradea 221861
1) Municipality (county residence).
Usually resident population by age and sex, on January 1st, 2017
The ages pyramid reflects in the most accurate way the generations' chronicle,highlighting the disproportions in the population structure by age and sex. Thedecreasing number of young population further narrowed the ages pyramidbase. The demographic and economic effects of this evolution will be felt overtime and will entail changes in the various sub-populations (school population,population of childbearing age, working age population).
���� ������
������������
�� ��� ��� ��� ���
������������
��������������
�������������������������������������
����
� �

Statistical abstract 15
POPULATION
2014 2015 2016 20171)
Counties - total 42 42 42 42Under 300000 6 6 6 6300000 - 499999 19 19 19 19500000 - 699999 8 8 9 9700000 and over 9 9 8 8
Municipalities and towns - total 320 320 320 320Under 5000 21 21 21 215000 - 19999 191 191 192 19120000 - 49999 62 62 61 6250000 - 99999 22 22 21 21100000 - 199999 13 13 14 14200000 - 999999 10 10 10 101000000 and over 1 1 1 1
Communes - total 2861 2861 2861 2861Under 1000 90 94 94 981000 - 1999 607 605 612 6212000 - 4999 1679 1676 1669 16605000 - 9999 446 445 446 44010000 and over 39 41 40 42
1) Provisional data.
Classification of counties and localities by number of personswith permanent residence in Romania, on July 1st
On July 1st, 20171), 12.5 million people had their permanent residence in urbanarea, representing more than half of the country's population. Of the 320 towns and cities, 85.6% had a population of less than 50 thousandinhabitants, representing 18.0% of the country's population and 32.0% of theurban population. Large cities (over 100000 inhabitants) hold 31.4% of thecountry's population and 55.7% of the urban population.In rural area, on July 1st, 20171), there were 9.7 million persons, representing43.6% of the country's population. The communes with populations between1000 and 5000 inhabitants represented 79.7% of the total number ofcommunes.
In 2016, the average duration of life3) has continued to increase reaching to75.56 years, the current values of 72.11 years for men and 79.07 years forwomen, being higher than in 20142), both overall and by sex.
Note: For the 2014-2016 period, only live-births whose mothers' usual residences were in Romania and whose births were recorded by the registry courts of Romania areincluded; as for deaths under 1 year, only the deaths of persons whose usualresidences were in Romania and whose deaths were recorded by the registry courtsof Romania are included.
1)Semi-final data2)Provisional data.3)Data revised according to the NIS revision calendar.

ROMANIA IN FIGURES16
POPULATION
Average life expectancy by sex (years)
���������
���������
� �� �� � �
�
�� �
� �
�� �
����������� �
� �
���������� �
�� �
Male Female
Note: Data on 2017 will be available in July 2018.
In 2016, the average duration of life has increased, as against 20143), with 0.18years for female population and with 0.14 years for male population. In 2016,the average duration of women's life was by 6.96 years longer than that ofmen.
Internal migration
2014 2015 2016 20171)
Structure of urban and rural internal migration flowsdetermined by the change in permanent residence (absolute data)
Total 371677 361083 389373 380202From rural to urban 78411 77878 82612 87097From urban to urban 111545 105292 108872 111592From rural to rural 71063 71266 76939 72110From urban to rural 110658 106647 120950 109403
Rates 2) (per 1000 inhabitants)
Total 16.7 16.2 17.5 17.1From rural to urban 6.2 6.2 6.6 7.0From urban to urban 8.9 8.4 8.7 8.9From rural to rural 7.3 7.3 7.9 7.4From urban to rural 11.4 11.0 12.5 11.3
1) Provisional data.2) For the rates calculation the permanent resident population on July 1st of each
year was used.Source: NIS - Statistical demographic surveys .
In 20172) 380.2 thousand people have changed their permanent residencewithin the country, with 9.2 thousand people less than in 2016 (389.4 thousandpersons), but with 8.5 thousand persons more compared to 2014 (371.7thousand persons).
The same with previous years, in 2017, the migratory flows from urban area (torural and to urban area) hold the largest shares in the structure of internalmigration.
2)Provisonal data.3)Data revised according to the NIS revision calendar.

Statistical abstract 17
POPULATION
Romanian citizens who settled down their permanent residence abroad persons number
2014 2015 2016
Total 11251 15235 22807By sexMale 4776 6521 10007Female 6475 8714 12800
By age groupUnder 18 years 2021 2610 388418-40 years 7430 9231 1244541-60 years 1640 2937 588361 years and over 160 457 595
By country of destinationAustralia 45 116 111Austria 569 804 1347Belgium 282 369 420Canada 688 1184 1086France 495 628 886Germany 2008 2780 3959Greece 60 129 169Jordan 34 48 56Israel 22 43 75Italy 1553 2033 3575United Kingdom 354 671 1203Republic of Moldova 479 632 837Spain 3134 3375 5361United States of America 536 802 1281Sweden 51 104 167Ukraine 13 26 38Hungary 286 420 390Other countries 642 1071 1846
Note: Final data for 2017 will be available in July 2018.

ROMANIA IN FIGURES18
POPULATION
Emigrants and immigrants, by change of usual residence persons number
2014 2015 2016
Immigrants Total 136035 132795 137455By sexMale 70841 73670 79387Female 65194 59125 58068By age groupUnder 18 years 16325 17279 1630018-40 years 85089 79963 8450641-60 years 29852 30229 3037161 years and over 4769 5324 6278By country of destinationAustria 1977 1850 4600Belgium 2500 2715 3036Canada 207 340 392Denmark 1500 1800 2131Switzerland 900 1100 643France 2200 1850 1900Germany 14000 12700 15000Greece 2800 2750 2750Italy 14000 12840 11665United Kingdom 3700 5641 9556Republic of Moldova 20193 20365 19858Spain 53242 46080 43948United States of America 403 790 1120Hungary 700 600 1000Other countries 17713 21374 19856
EmigrantsTotal 172871 194718 207578By sexMale 87356 104700 100533Female 85515 90018 107045By age groupUnder 18 years 23839 24309 2661818-40 years 105828 134510 13445641-60 years 38196 31306 4120261 years and over 5008 4593 5302By country of destinationAustria 8000 8000 12400Belgium 7759 11000 10300Canada 688 1184 1086Denmark 3500 4200 5052Switzerland 1805 1800 1750France 2800 2500 6000Germany 23715 25000 28000Greece 600 600 500Italy 48918 44209 42248United Kingdom 34000 54412 55474Republic of Moldova 479 632 837Spain 29531 28382 27909United States of America 536 802 1281Hungary 700 750 700Other countries 9840 11247 14041
Note: Provisional data on 2017 will be available in September 2018.
The balance of permanent international migration was positive, the number ofimmigrants being 1.2 times higher than the number of emigrants.In 2016, the balance of international migration by change of usual residencewas negative, the number of emigrants exceeding the number of immigrantswith 70 thousands people.
Unlike previous years, when men emigrated to a greater extent than women(50.5% in 2014 and 53.8% in 2015), during 2016 the most people who haveemigrated were female, accounting for 51.6% of emigrants. In 2016, 57.8% ofimmigrants were male, a higher percentage compared to 2014 when the shareof men who immigrated was 52.1%.

Statistical abstract 19
POPULATION
Emigrants and immigrants by age and sex, in 2014
���� ������
�������� �������������
�������������������������������������
�����
�������
����
����
����
����
����
����
����
����
����
����
��������
����
����
����
����
����
����
����
����
����
����
Emigrants and immigrants by age and sex, in 2016
���� ������
�������� �������������
�������������������������������������
�����
�������
����
����
����
����
����
����
����
����
����
����
��������
����
����
����
����
����
����
����
����
����
����

ROMANIA IN FIGURES20
��� ���
���� ����
���� ������������������������
���� ����
���� ����
���� ������������������������
�� ��
% %By sex By area
Male
Female
Urban
Rural
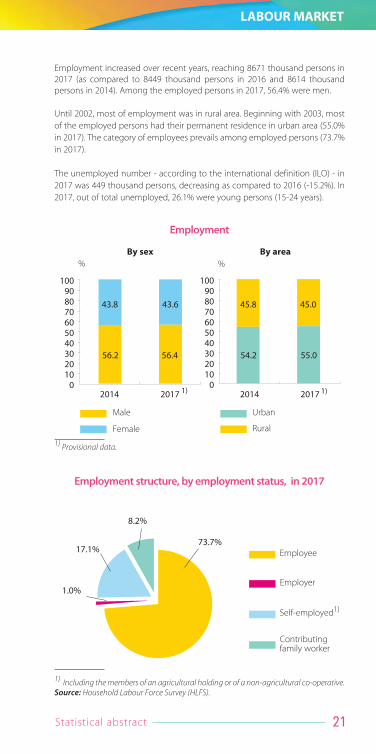
Economically active population
2014 2015 2016 20172)
Economically active population - total 9243 9159 8979 9120- Female 4015 3916 3834 3936- Urban 5078 5013 4962 4994
Employment - total 8614 8535 8449 8671- Female 3770 3687 3643 3777- Urban 4669 4662 4684 4769
ILO1)unemployed - total 629 624 530 449- Female 245 229 191 159- Urban 409 351 278 225
Note: The series of data have been calculated according to the usually residentpopulation, taking into account the usual residence criterion.1) According to the international definition (ILO - International Labour Office).2) Provisional data.
Source: Household Labour Force Survey (HLFS).
Economically active population, employmentand unemployed 1)
thou persons
1) Provisional data.
LABOUR MARKET
In the context of economic transition process, Romanian labour market facedsignificant changes in terms of volume and structure of the main indicatorsrelated to labour force. The characteristics of this process were the diminutionof economically active population and of employment, while keeping atrelatively constant values the unemployment rate. However, the financial crisisparticularly manifested since the second half of 2008 affected the labour forcestructure, the diminution of employment being concomitant withunemployment sharpening.
Though during late ‘90s the economically active population values were stillhigh (over 11 million persons), the new millennium began with a sharpdecrease in the value of this indicator. After 2004, the economically activepopulation oscillated around 10 million persons.
In 2017, the economically active population was of 9120 thousand persons(increasing as compared to previous year), out of which 96.6% belonged to theworking age group (15-64 years).
Statistical abstract 21
LABOUR MARKET
Employment structure, by employment status, in 2017
�� ��
� ��
�� ��
��
1) Including the members of an agricultural holding or of a non-agricultural co-operative. Source: Household Labour Force Survey (HLFS).
Employee
Employer
Self-employed1)
Contributingfamily worker
Employment increased over recent years, reaching 8671 thousand persons in2017 (as compared to 8449 thousand persons in 2016 and 8614 thousandpersons in 2014). Among the employed persons in 2017, 56.4% were men.
Until 2002, most of employment was in rural area. Beginning with 2003, mostof the employed persons had their permanent residence in urban area (55.0%in 2017). The category of employees prevails among employed persons (73.7%in 2017).
The unemployed number - according to the international definition (ILO) - in2017 was 449 thousand persons, decreasing as compared to 2016 (-15.2%). In2017, out of total unemployed, 26.1% were young persons (15-24 years).
� �� � ��
���� ������������������������
���� ������������������������
�� �� �
�� � �� �� � � �
�� ��
�� ��
% %By sex By area
Male
Female
Urban
Rural
Employment
1) Provisional data.

ROMANIA IN FIGURES22
Activity (CANE Rev. 2 sections) 2014 2015 2016 20171)
Total 8614 8535 8449 8671Agriculture, forestry and fishing 2442 2184 1952 1975Industry 1852 1792 1846 1916
Mining and quarrying 75 73 69 65Manufacturing 1595 1551 1598 1668Electricity, gas, steam and air conditioningproduction and supply 92 82 82 80Water supply; sewerage, waste managementand decontamination activities 90 86 98 103
Construction 640 637 678 696Wholesale and retail; repair of motor vehicles and motorcycles 1112 1149 1177 1207Transport and storage 433 475 472 492Hotels and restaurants 181 186 205 203Information and communication 148 173 168 187Financial intermediation and insurance 112 105 111 116Real estate activities 21 22 18 15Professional, scientific and technical activities 193 185 196 215Administrative and support service activities 184 204 207 206Public administration and defence; compulsory social security 391 442 434 424Education 311 355 346 364Human health and social work activities 368 388 390 407Arts, entertainment and recreation 55 56 61 66Other activities of the national economy 171 182 187 182
Note: The series have been calculated according to the usually resident population,taking into account the usual residence criterion.
1) Provisional data.Source: Household Labour Force Survey (HLFS).
Employment, by main activities of the national economy thou persons
In 2017, as compared to 2016, the employment breakdown by activity sectorof the national economy indicates the significant increase in the number ofthose employed in information and communication (11.1%), professional,scientific and technical activities (10.1%) and arts, entertainment and recreation(6.9%). The activity branches where the number of employed persons sharplydecreased are real estate activities (-18.0%) and mining and quarrying (-6.4%).
LABOUR MARKET

Statistical abstract 23
LABOUR MARKET
Structure of employment in the private sector,by main activities of national economy
�� �����
�� � �� ��� � �� �
� ��� � �� ��� � �� �
�� �� ��� � ��
���� ���� ��� ������������������������
Note: The private sector includes private and co-operative or community ownershiptypes.
1) Including electricity, gas, steam and air conditioning production and supply, andwater supply, sewerage, waste management and decontamination activities.
Source: Household Labour Force Survey (HLFS).
Services
Construction
Industry 1)
Agriculture, forestry and fishing
% CANE Rev.2
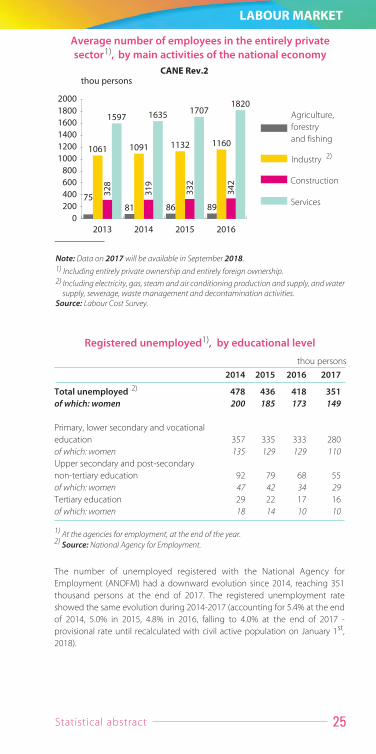
The weight of employment in private sector fell during the last four years from83.6% in 2014, to 82.8% in 2017. Out of total employment in private sector,72.9% carried out their activities, in 2017, in industry, construction and services,a higher percentage than the one of 2016, when it was 72.4%.
In 2016, the average number of employees was 4759.4 thousand persons. The average number of employees increased during 2016 with 148.0 thousandpersons compared to the previous year.
Compared to 2015, significant increases in the average number of employeeswere registered in the following economic activities: trade, manufacturing,administrative and support service activities, hotels and restaurants, humanhealth and social work activities, information and communications,construction, transport and storage, professional, scientific and technicalactivities. As the other end of the scale, the following activities were registeredwith decreases in the average number of employees: education, mining andquarrying, electricity, gas, steam and air conditioning production and supply.
The employees breakdown by economic sectors in 2016 shows that 61.4%were found in services (tertiary sector), increasing by 0.5 percentage points ascompared to 2015, respectively by 0.3 percentage points as against 2014.36.1% of total employees worked in the secondary sector (industry andconstruction), decreasing by 0.5 percentage points as compared to 2015,respectively by 0.4 percentage points as against 2014. The weight ofemployees working in agricultural branches (primary sector) remainedconstant in 2016 compared to previous year (2.5%), increasing by 0.1percentage points as against 2014.
The private sector absorbs most of the wage earners, so that in 2016 theweight of employees in the entirely private sector reached 71.7%, increasing ascompared to 2015 by 1.1 percentage points.
ROMANIA IN FIGURES24
Average number of employees, by main activities of the national economy
thou persons
Activity (CANE Rev. 2 sections) 2014 2015 2016
Total 4507729 4611395 4759419
Agriculture, forestry and fishing 107721 112699 117046Industry 1302576 1334943 1352862
Mining and quarrying 61450 57863 54022Manufacturing 1084769 1122321 1145001Electricity, gas, steam and air conditioningproduction and supply 58039 55445 54234Water supply; sewerage, waste managementand decontamination activities 98318 99314 99605
Construction 344742 354706 365298Wholesale and retail; repair of motor vehiclesand motorcycles 755995 767525 799735Transport and storage 251166 256480 264682Hotels and restaurants 128229 133848 151230Information and communication 132611 143274 154520Financial intermediation and insurance 90505 88421 90160Real estate activities 23977 24357 27448Professional, scientific and technical activities 135801 143863 151242Administrative and support service activities 252605 259683 278540Public administration and defence; compulsory social security 1) 191898 194087 195967Education 360844 357125 352742Human health and social work activities 323080 331792 345501Arts, entertainment and recreation 61829 62692 64450Other service activities 44150 45900 47996
Note: Data on 2017 will be available in September 2018.1) Excluding armed forces and similar staff (Ministry of National Defence, Ministry of
Internal Affairs, Romanian Intelligence Service a.s.o.).Source: Labour Cost Survey.
LABOUR MARKET
Statistical abstract 25
LABOUR MARKET
Average number of employees in the entirely private sector1), by main activities of the national economy
���� ��� �������
��� ���� ���� ���
��� �
���� ���� ���� ����
��������������������������������
��
���
���
���
thou persons
Agriculture, forestryand fishing
Industry 2)
Services
Construction
CANE Rev.2
Note: Data on 2017 will be available in September 2018.1) Including entirely private ownership and entirely foreign ownership.2) Including electricity, gas, steam and air conditioning production and supply, and water
supply, sewerage, waste management and decontamination activities.Source: Labour Cost Survey.
2014 2015 2016 2017
Total unemployed 2) 478 436 418 351of which: women 200 185 173 149
Primary, lower secondary and vocational education 357 335 333 280of which: women 135 129 129 110Upper secondary and post-secondary non-tertiary education 92 79 68 55of which: women 47 42 34 29Tertiary education 29 22 17 16of which: women 18 14 10 10
1) At the agencies for employment, at the end of the year.2) Source: National Agency for Employment.
Registered unemployed1), by educational level
thou persons
The number of unemployed registered with the National Agency forEmployment (ANOFM) had a downward evolution since 2014, reaching 351thousand persons at the end of 2017. The registered unemployment rateshowed the same evolution during 2014-2017 (accounting for 5.4% at the endof 2014, 5.0% in 2015, 4.8% in 2016, falling to 4.0% at the end of 2017 -provisional rate until recalculated with civil active population on January 1st,2018).

��� �� ��� ���
���� ��
���
���� ���� ��� �����
���
���
��
��
����
� �� � �
� �� � � � ��
�
�
�
��
�� �� �� ���
ROMANIA IN FIGURES26
Number of registered unemployed and unemployment rate
Number of registeredunemployed - totalNumber of registeredunemployed - women
thou persons
Unemployment rate- total1)
Unemployment rate - women1)
%
2014 2015 2016 20172)
Total 6.8 6.8 5.9 4.9Under 25 years 24.0 21.7 20.6 18.325 years and over 5.5 5.6 4.8 3.9Male 7.3 7.5 6.6 5.6Under 25 years 23.6 20.6 19.9 18.125 years and over 6.0 6.4 5.5 4.6Female 6.1 5.8 5.0 4.0Under 25 years 24.7 23.4 21.8 18.625 years and over 4.8 4.6 3.9 3.0Urban 8.1 7.0 5.6 4.5Under 25 years 32.6 26.9 24.9 20.825 years and over 6.7 5.9 4.7 3.8Rural 5.3 6.6 6.3 5.4Under 25 years 18.3 18.5 18.3 17.025 years and over 3.9 5.2 4.9 4.1
Note: The series of data have been calculated according to the usually resident population, taking into account the usual residence criterion.
1) According to the international definition (ILO - International Labour Office).2) Provisional data.Source: Household Labour Force Survey (HLFS).).
Unemployment rate1), by age group, sex and area (%)
The unemployment rate according to the international definition (ILO) -calculated as share of unemployed in the economically active populationsignificantly fell during recent years, reaching 4.9% in 2017 (as compared to5.9% in 2016 and 6.8% in 2014).
LABOUR MARKET
1) For 2017, provisional data.
During 2014-2017, men prevailed among registered unemployed (58.2% in2014, 57.7% in 2015, 58.6% in 2016, respectively 57.5% at the end of 2017).The number of unemployed women followed a decreasing trend from 2014 to2017 (from 200 thousand persons in 2014 to 149 thousand persons at the endof 2017).
Statistical abstract 27
LABOUR MARKET
The ILO unemployment rate decreased in 2017 as against previous year forboth women and men. Thus, the unemployment rate for women was 4.0%,decreasing by 1.0 percentage points as against 2016, while for men theunemployment rate was 5.6%, decreasing by 1.0 percentage points ascompared to previous year.
In 2017, the unemployment rate was lower in urban than in rural area (4.5% asagainst 5.4%).
The young persons aged 15-24 years are the most severely affected by theunemployment phenomenon. Thus, in 2017, the youth unemployment ratewas 18.3% (lower value than that recorded during 2014-2016), with quitesignificant differences by area (20.8% in urban as against 17.0% in rural area).The value of this indicator was 3.9% for those aged 25 years and over.
2014 2015 2016 20172)
Total (12 months and over) 2.8 3.0 3.0 2.0Male 3.1 3.3 3.3 2.4Female 2.4 2.6 2.5 1.5Urban 3.4 3.0 2.9 1.9Rural 2.1 2.9 3.0 2.2
Young people(6 months and over) 14.3 13.1 13.0 11.1
Male 14.2 12.6 12.3 11.1Female 14.6 14.0 14.1 11.1Urban 19.3 15.8 15.2 11.3Rural 11.0 11.5 11.8 11.0
Note: The series of data have been calculated according to the usually resident population, taking into account the usual residence criterion.
1) According to the international definition (ILO - International Labour Office).2) Provisional data.Source: Household Labour Force Survey (HLFS).
Long-term unemployment rate1), by sex and area (%)
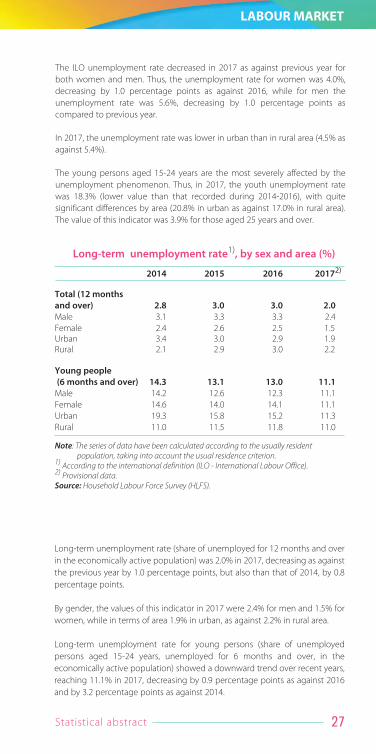
Long-term unemployment rate (share of unemployed for 12 months and overin the economically active population) was 2.0% in 2017, decreasing as againstthe previous year by 1.0 percentage points, but also than that of 2014, by 0.8percentage points.
By gender, the values of this indicator in 2017 were 2.4% for men and 1.5% forwomen, while in terms of area 1.9% in urban, as against 2.2% in rural area.
Long-term unemployment rate for young persons (share of unemployedpersons aged 15-24 years, unemployed for 6 months and over, in theeconomically active population) showed a downward trend over recent years,reaching 11.1% in 2017, decreasing by 0.9 percentage points as against 2016and by 3.2 percentage points as against 2014.

ROMANIA IN FIGURES28
Activity rate and employment rate, by sex and area (%)
2014 2015 2016 20171)
Activity rateTotal 65.7 66.1 65.6 67.3Male 74.3 75.3 74.8 76.2Female 56.9 56.7 56.2 58.2Urban 65.8 65.9 66.4 67.9Rural 65.5 66.4 64.6 66.6
Employment rateTotal 61.0 61.4 61.6 63.9Male 68.7 69.5 69.7 71.8Female 53.3 53.2 53.3 55.8Urban 60.5 61.3 62.6 64.8Rural 61.7 61.7 60.2 62.7Note: Data calculated for the working age population (15 - 64 years).
The series of data have been calculated according to the usually resident population, taking into account the usual residence criterion.
1) Provisional data.Source: Household Labour Force Survey (HLFS).
LABOUR MARKET
2014 2015 2016 20172)
Total (12 months and over) 41.1 43.9 50.0 41.4Male 41.8 43.8 50.1 43.6Female 40.0 44.1 49.8 37.5Urban 42.1 43.3 51.8 41.5Rural 39.2 44.6 48.1 41.4
Young people(6 months and over) 59.7 60.6 63.1 60.4Male 60.0 61.2 62.0 61.1Female 59.2 59.9 64.8 59.5Urban 59.1 58.6 61.3 54.2Rural 60.3 62.4 64.4 64.3Note: The series of data have been calculated according to the usually resident
population, taking into account the usual residence criterion.1) According to the international definition (ILO - International Labour Office).2) Provisional data.Source: Household Labour Force Survey (HLFS).
Incidence of long-term unemployment1) (%)- as percentage of the total unemployed 1) -
The incidence of long-term unemployment (share of those unemployed for 12months and over in total unemployed) was 41.4% in 2017 (increasing asagainst 2014, but decreasing as against 2015-2016 period). In urban area, theindicator value was 41.5%, 0.1 percentage points over that recorded in ruralarea.
In 2017, the activity rate of working age population (15-64 years) was 67.3% (ascompared to 65.6% in 2016) and recorded higher values for male population(76.2%, as against 58.2% for female population). By area, the indicator valueswere quite close: 67.9% in urban and 66.6% in rural area.
The employment rate of working age population (15-64 years) in 2017 was63.9%, increasing as against previous year (61.6%).In 2017, the employment rate for the population aged 20-64 years was 68.8%,increasing as compared to previous year (66.3%), a distance of 1.2 percentagepoints to the national target of 70% set out in the context of Europe 2020Strategy.
Statistical abstract 29
LABOUR MARKET
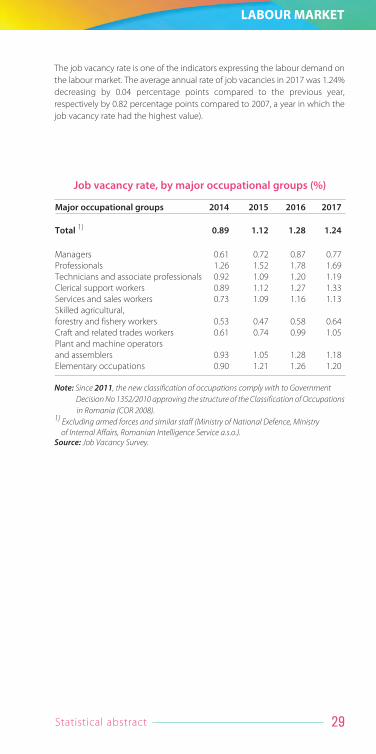
The job vacancy rate is one of the indicators expressing the labour demand onthe labour market. The average annual rate of job vacancies in 2017 was 1.24%decreasing by 0.04 percentage points compared to the previous year,respectively by 0.82 percentage points compared to 2007, a year in which thejob vacancy rate had the highest value).
Job vacancy rate, by major occupational groups (%)
Major occupational groups 2014 2015 2016 2017
Total 1) 0.89 1.12 1.28 1.24
Managers 0.61 0.72 0.87 0.77Professionals 1.26 1.52 1.78 1.69Technicians and associate professionals 0.92 1.09 1.20 1.19Clerical support workers 0.89 1.12 1.27 1.33Services and sales workers 0.73 1.09 1.16 1.13Skilled agricultural,forestry and fishery workers 0.53 0.47 0.58 0.64Craft and related trades workers 0.61 0.74 0.99 1.05Plant and machine operatorsand assemblers 0.93 1.05 1.28 1.18Elementary occupations 0.90 1.21 1.26 1.20
Note: Since 2011, the new classification of occupations comply with to Government Decision No 1352/2010 approving the structure of the Classification of Occupations in Romania (COR 2008).
1) Excluding armed forces and similar staff (Ministry of National Defence, Ministry of Internal Affairs, Romanian Intelligence Service a.s.o.).
Source: Job Vacancy Survey.
ROMANIA IN FIGURES30
LABOUR MARKET
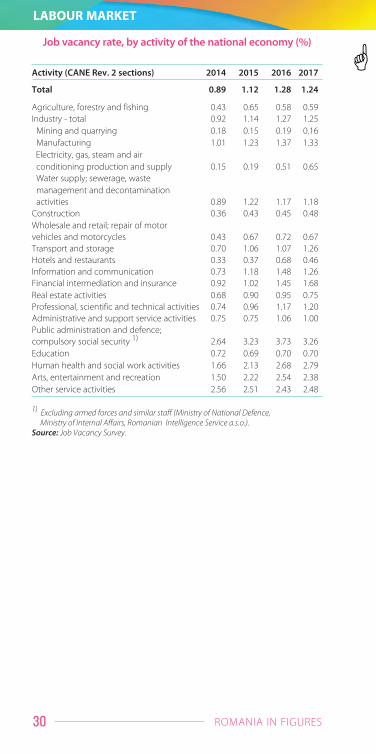
Job vacancy rate, by activity of the national economy (%)
Activity (CANE Rev. 2 sections) 2014 2015 2016 2017
Total 0.89 1.12 1.28 1.24
Agriculture, forestry and fishing 0.43 0.65 0.58 0.59Industry - total 0.92 1.14 1.27 1.25
Mining and quarrying 0.18 0.15 0.19 0.16Manufacturing 1.01 1.23 1.37 1.33Electricity, gas, steam and air conditioning production and supply 0.15 0.19 0.51 0.65Water supply; sewerage, waste management and decontamination activities 0.89 1.22 1.17 1.18
Construction 0.36 0.43 0.45 0.48Wholesale and retail; repair of motor vehicles and motorcycles 0.43 0.67 0.72 0.67Transport and storage 0.70 1.06 1.07 1.26Hotels and restaurants 0.33 0.37 0.68 0.46Information and communication 0.73 1.18 1.48 1.26Financial intermediation and insurance 0.92 1.02 1.45 1.68Real estate activities 0.68 0.90 0.95 0.75Professional, scientific and technical activities 0.74 0.96 1.17 1.20Administrative and support service activities 0.75 0.75 1.06 1.00Public administration and defence; compulsory social security 1) 2.64 3.23 3.73 3.26Education 0.72 0.69 0.70 0.70Human health and social work activities 1.66 2.13 2.68 2.79Arts, entertainment and recreation 1.50 2.22 2.54 2.38Other service activities 2.56 2.51 2.43 2.48
1) Excluding armed forces and similar staff (Ministry of National Defence, Ministry of Internal Affairs, Romanian Intelligence Service a.s.o.).
Source: Job Vacancy Survey.

Statistical abstract 31
POPULATION INCOME
Total income of households
2014 2015 2016 20171)
- lei , monthly per household -
Total income 2500.7 2686.8 2944.6 3391.7- percentage -
Money income 84.1 87.9 89.4 90.3Equivalent value of the incomein kind obtained by employeesand receivers of social benefits 1.7 1.4 1.3 1.4Equivalent value of the consumption of agricultural products from own resources 14.2 10.7 9.3 8.3Note: Starting with 2014, data are estimated based on usually resident population and
are not comparable with the data series published for previous periods.1) Provisional data.Source: Family Budgets Survey (FBS).
During 2014-2017, the main source of total household income formation wasthe money income, which increased from 84.1% in 2014, to 90.3% in 2017. During the same period, the income in kind had a downwardtrend, reaching 9.7% in 2017, mainly due to the equivalent value of theconsumption of agro-food products from own resources (which experienced adecrease of 5.9 percentage points as compared to 2014).
In 2017, salaries and other similar income represented the most importantincome category, with the highest share in the money income of households(67.7%), increasing by 2.0 percentage points as compared to 2016. A majorshare in the money income of households is that of social benefits (24.0%, adecrease of 1.3 percentage points as compared to 2016). On the contrary, theincome from agriculture, the income from independent activities and theproperty income have a low share in the money income of households.
1) Provisional data.Source: Family Budgets Survey (FBS).
� ��
� �
� �
�� ��
� ��
Structure of money income, in 2017 1)
- total households -
Gross salaries andother salary rights
Income fromagriculture
Income from non- agriculturalindependent activities
Income from socialprovisions
Other income

ROMANIA IN FIGURES32
Monthly average net nominal earnings,by activity of the national economy
Activity (CANE Rev. 2 sections) 2014 2015 2016 20171)
Total 1697 1859 2046 2384
Agriculture, forestry and fishing 1270 1371 1621 1883Industry 1720 1827 1987 2245Mining and quarrying 3260 3454 3410 3724Manufacturing 1578 1704 1883 2148Electricity, gas, steam and air conditioningproduction and supply 3093 3077 3225 3415Water supply; sewerage, waste management and decontamination activities 1509 1575 1741 1965Construction 1240 1422 1525 1708Wholesale and retail; repair of motor vehicles and motorcycles 1412 1588 1736 2115Transport and storage 1707 1863 1994 2297Hotels and restaurants 958 1080 1232 1393Information and communication 3357 3822 4358 4738Financial intermediation and insurance 3708 4004 4061 4475Real estate activities 1344 1516 1822 2146Professional, scientific and technical activities 2442 2748 3012 3333Administrative and support service activities 1261 1427 1613 1873Public administration and defence; compulsory social security 2) 2754 2893 3084 3704Education 1733 1886 2035 2324Human health and social work activities 1496 1656 2065 2679Arts, entertainment and recreation 1249 1385 1589 2102Other service activities 1141 1297 1392 1631
1) Operative data, excluding the earnings of employees in the economic units havingless than 4 employees.
2) Excluding armed forces and similar staff (Ministry of National Defence, Ministry of Internal Affairs, Romanian Intelligence Service a.s.o.).
Source: Labour Cost Survey (2014 - 2016 period);Monthly Survey on Earnings ( 2017).
EARNINGS
lei / employee
If the first decade of the last twenty years was characterised by economicinstability, strongly influenced by the level and evolution of the inflation rate,the second decade was marked by the end of the transition to the marketeconomy.
Thus, a reinvigoration of the real value of earnings started in 2003, with thelevel reached in 2007 exceeding by 11.8% the level of 1990, for the first timesince 1990.

Statistical abstract 33
EARNINGS
Indices of real earnings
� ��� �
��� ��� � ��� � ��� ���� �
���
�� �
�� �
�
��
��
���
���
���
���
�������
����
�
����
����
����
����
����
���
����
����
���
���� ���� ���� ���
�
���
��
����
���
����
����
���
����
����
��
����
���
����
!"#��$%# !"#��$%# !"#��$%# !"#��$%#
�������
���
���� ����
���
���
��
����
���
Monthly average gross and net nominalearnings, by sex
Note: For 2017, provisional data.
Note: For 2017, the data will be available in September 2018.Source: Labour cost survey
%
1990 = 100
Male Female
lei / employee
In 2008, the real earnings index was 130.3% compared to 1990, the trend in theyears that followed being slightly downwards. Starting 2012, the real earningsindex followed an upward trend, peaking in 2016 (161.7% compared to 1990).Thus, compared to the previous year, in 2016 there was an increase of the realearnings index by 17.1 percentage points and compared to 2008 by 31.4percentage points.
In 20171), the real earnings index was 185.9% compared to 1990, 24.2percentage points higher than that of previous year.
1) Operative data, excluding the earnings of employees in the economic units havingless than 4 employees.

ROMANIA IN FIGURES34
Total household consumption expenditure
2014 2015 2016 20171)
- lei , monthly per household -
Total consumption expenditure 1637.48 1702.87 1810.75 2039.03- percentage -
Agro-food products and non-alcoholic beverages 40.0 38.2 36.1 34.3Alcoholic beverages, tobacco 7.7 7.8 8.0 8.2Clothing and footwear 5.3 5.7 6.5 7.1Housing, water, electricity, gasand other fuels 17.2 17.9 17.6 17.1Furniture, dwelling equipmentand maintenance 4.0 4.2 4.8 5.6Health 4.6 4.9 4.8 4.9Transport 6.2 6.3 6.1 6.6Communications 4.8 5.0 5.2 5.0Leisure and culture 4.5 4.0 4.2 4.0Education 0.5 0.4 0.4 0.3Hotels, cafés and restaurants 1.4 1.4 1.6 1.8Miscellaneous products and services 3.8 4.2 4.7 5.1
Note: Starting with 2014, data are estimated based on usually resident population andare not comparable with the data series published for previous periods.
1) Provisional data.Source: Family Budget Survey (FBS).
�� ��
�� ��
� ��
Structure of money expenditure for consumption, in 2017 1)
- total households -
1) Provisional data.Source: Family Budget Survey (FBS).
During 2014-2017, agro-food products and non-alcoholic beverages had thehighest share in the total consumption expenditure (34.3%), decreasing by 5.7percentage points as compared to 2014. In contrast, the amount spent on thedwelling, its endowment and maintenance had an upward trend every year (in2017 by 1.5 percentage points higher as compared to 2014).
In 2017, for total households, the food consumption expenditure had a shareof 31.4% in the total consumption expenditure. On average, for totalhouseholds, the share of the expenditure on non-food goods was 39.9%, whilethe expenditure on services had a share of 28.7%.
Food products
Non-food products
Payment of services
POPULATION EXPENDITURE
Statistical abstract 35
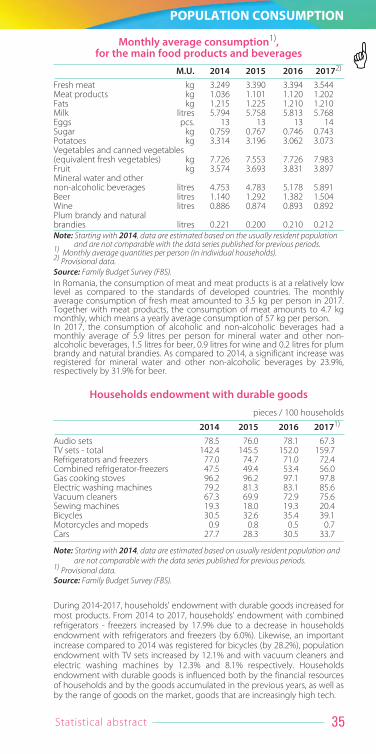
POPULATION CONSUMPTION
Monthly average consumption1),for the main food products and beverages
M.U. 2014 2015 2016 20172)
Fresh meat kg 3.249 3.390 3.394 3.544Meat products kg 1.036 1.101 1.120 1.202Fats kg 1.215 1.225 1.210 1.210Milk litres 5.794 5.758 5.813 5.768Eggs pcs. 13 13 13 14Sugar kg 0.759 0.767 0.746 0.743Potatoes kg 3.314 3.196 3.062 3.073Vegetables and canned vegetables(equivalent fresh vegetables) kg 7.726 7.553 7.726 7.983Fruit kg 3.574 3.693 3.831 3.897Mineral water and othernon-alcoholic beverages litres 4.753 4.783 5.178 5.891Beer litres 1.140 1.292 1.382 1.504Wine litres 0.886 0.874 0.893 0.892Plum brandy and natural brandies litres 0.221 0.200 0.210 0.212Note: Starting with 2014, data are estimated based on the usually resident population
and are not comparable with the data series published for previous periods.1) Monthly average quantities per person (in individual households).2) Provisional data.Source: Family Budget Survey (FBS).In Romania, the consumption of meat and meat products is at a relatively lowlevel as compared to the standards of developed countries. The monthlyaverage consumption of fresh meat amounted to 3.5 kg per person in 2017.Together with meat products, the consumption of meat amounts to 4.7 kgmonthly, which means a yearly average consumption of 57 kg per person.In 2017, the consumption of alcoholic and non-alcoholic beverages had amonthly average of 5.9 litres per person for mineral water and other non-alcoholic beverages, 1.5 litres for beer, 0.9 litres for wine and 0.2 litres for plumbrandy and natural brandies. As compared to 2014, a significant increase wasregistered for mineral water and other non-alcoholic beverages by 23.9%,respectively by 31.9% for beer.
2014 2015 2016 20171)
Audio sets 78.5 76.0 78.1 67.3TV sets - total 142.4 145.5 152.0 159.7Refrigerators and freezers 77.0 74.7 71.0 72.4Combined refrigerator-freezers 47.5 49.4 53.4 56.0Gas cooking stoves 96.2 96.2 97.1 97.8Electric washing machines 79.2 81.3 83.1 85.6Vacuum cleaners 67.3 69.9 72.9 75.6Sewing machines 19.3 18.0 19.3 20.4Bicycles 30.5 32.6 35.4 39.1Motorcycles and mopeds 0.9 0.8 0.5 0.7Cars 27.7 28.3 30.5 33.7
Note: Starting with 2014, data are estimated based on usually resident population andare not comparable with the data series published for previous periods.
1) Provisional data.Source: Family Budget Survey (FBS).
Households endowment with durable goods
pieces / 100 households
During 2014-2017, households' endowment with durable goods increased formost products. From 2014 to 2017, households' endowment with combinedrefrigerators - freezers increased by 17.9% due to a decrease in householdsendowment with refrigerators and freezers (by 6.0%). Likewise, an importantincrease compared to 2014 was registered for bicycles (by 28.2%), populationendowment with TV sets increased by 12.1% and with vacuum cleaners andelectric washing machines by 12.3% and 8.1% respectively. Householdsendowment with durable goods is influenced both by the financial resourcesof households and by the goods accumulated in the previous years, as well asby the range of goods on the market, goods that are increasingly high tech.

ROMANIA IN FIGURES36
Evolution of the dwellings stock
2014 2015 2016 2017
Dwellings stock (thou) - 8841 8882 8929 8977private majority ownership (thou) 8735 8776 8822 8867Habitation rooms (thou) - 24021 24167 24329 24488private majority ownership (thou) 23834 23979 24139 24293Useful floor area (thou m2) - 416870 419860 423174 426411private majority ownership (thou m2) 413385 416345 419623 422721Finished dwellings - total 44984 46984 52206 53347- from private funds 41660 45687 50978 51578
The dwellings stock has kept its upward trend in recent years, recording 8977thousand dwellings at the end of 2017. By ownership, the largest share of thedwellings stock at the end of 2017 is represented by the dwellings under bythe private majority ownership (98.8%).
DWELLINGS
In 2017, 53.3 thousand dwellings were finished, 1.1 thousand more than the previous year.
Finished dwellings, by area
�� �� �
�� � �� �
�� � �� �� � �� �
���� ���� ��� ������������������������������
�� � �� ��� � �� �
Total finisheddwellings Rural Urban
thou dwellings
Statistical abstract 37
DWELLINGS
�� �� �� ��
� �� �� ��
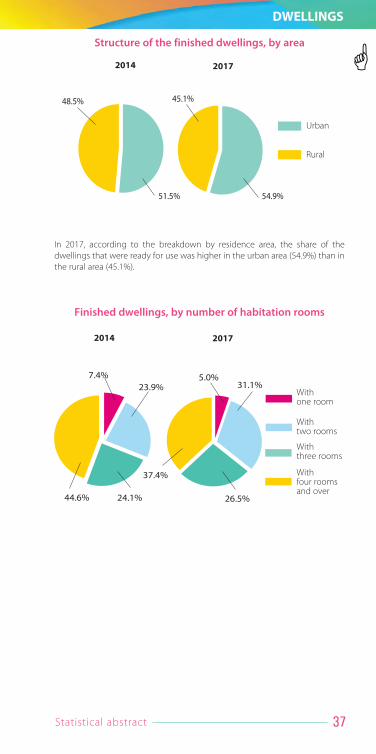
Structure of the finished dwellings, by area
Rural
Urban
2014 2017
� �� � ���� �� �� ��
�� �� � ���� �
�� ��
Finished dwellings, by number of habitation rooms
With one room
2014 2017
With four rooms and over
With three rooms
With two rooms
In 2017, according to the breakdown by residence area, the share of thedwellings that were ready for use was higher in the urban area (54.9%) than inthe rural area (45.1%).

ROMANIA IN FIGURES38
UNEMPLOYED SOCIAL PROTECTION
Unemployment benefits
2014 2015 2016 2017
Monthly average (lei / person)Unemployment benefit(unemployed with work experience)1) 424 427 443 460Unemployment benefit (unemployed without work experience)2) 226 219 230 222
In percentage as against the gross minimum salary in the economy
Unemployment benefit(unemployed with work experience)1) 48.5 42.2 37.4 32.1Unemployment benefit(unemployed without work experience)2) 25.8 21.6 19.4 15.5
1) The unemployment benefit granted to the persons who are unemployed as a result oflosing their jobs, in accordance with Article 39 of Law No 76/2002.2) The unemployment benefit granted to graduates from educational institutions, inaccordance with Article 40 of Law No 76/2002.
In 2017, the monthly average unemployment benefit was 460 lei, 8.5% morethan in 2014 and accounted for 32.1% of the minimum gross national salary.The unemployment benefit for graduates from educational institutions (222 lei)accounted for 15.5% of the minimum gross national salary in 2017 ascompared to 25.8% in 2014.
In 2017, the highest share in the total expenditure on the social protection ofthe unemployed was that of the unemployment benefits (46.0%).
� ���
� ���
�� ����
Structure of the expenditure on unemployed socialprotection, in 2017
1) According to Law No 76/2002 regarding the unemployment insurance system and employment stimulation.
2) Including incentives for the unemployed who are employed before the period in whichthis allowance is granted expires; for stimulating labour force mobility, for stimulatingthe employers who hire people from the underprivileged categories that areunemployed, for the qualification and requalification of the unemployed, forstimulating graduates, for combating social marginalisation.
Source: National Agency for Employment.
Unemployment benefit 1)
Graduates unemployment benefits
Other expenditure2)
Statistical abstract 39
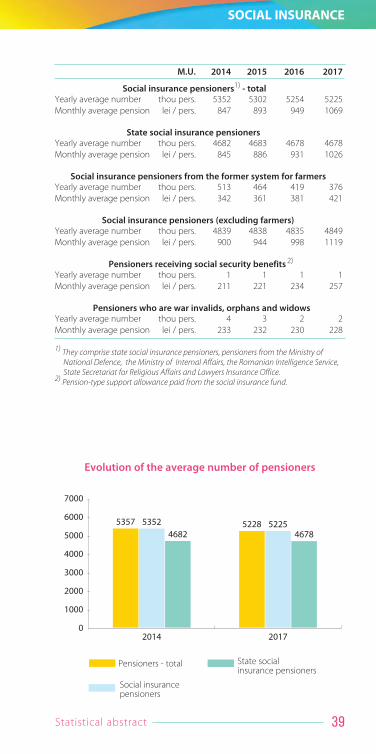
SOCIAL INSURANCE
M.U. 2014 2015 2016 2017
Social insurance pensioners1) - totalYearly average number thou pers. 5352 5302 5254 5225Monthly average pension lei / pers. 847 893 949 1069
State social insurance pensionersYearly average number thou pers. 4682 4683 4678 4678Monthly average pension lei / pers. 845 886 931 1026
Social insurance pensioners from the former system for farmersYearly average number thou pers. 513 464 419 376Monthly average pension lei / pers. 342 361 381 421
Social insurance pensioners (excluding farmers)Yearly average number thou pers. 4839 4838 4835 4849Monthly average pension lei / pers. 900 944 998 1119
Pensioners receiving social security benefits 2)
Yearly average number thou pers. 1 1 1 1Monthly average pension lei / pers. 211 221 234 257
Pensioners who are war invalids, orphans and widowsYearly average number thou pers. 4 3 2 2Monthly average pension lei / pers. 233 232 230 228
1) They comprise state social insurance pensioners, pensioners from the Ministry ofNational Defence, the Ministry of Internal Affairs, the Romanian Intelligence Service, State Secretariat for Religious Affairs and Lawyers Insurance Office.
2) Pension-type support allowance paid from the social insurance fund.
Evolution of the average number of pensioners
�� ������ �������� ���
���� �����
����
����
����
����
����
���
����
Pensioners - total
Social insurancepensioners
State socialinsurance pensioners
ROMANIA IN FIGURES40
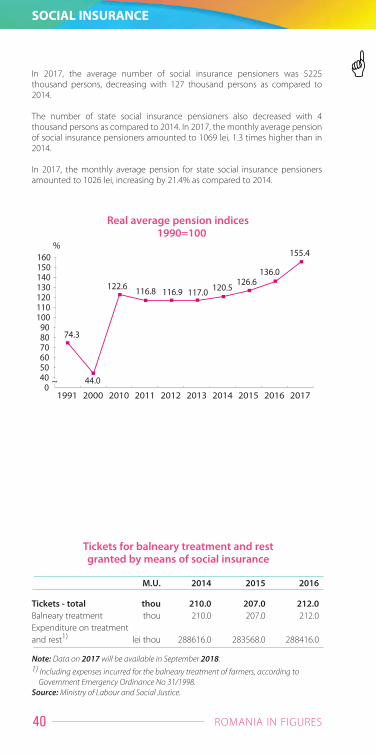
In 2017, the average number of social insurance pensioners was 5225thousand persons, decreasing with 127 thousand persons as compared to2014.
The number of state social insurance pensioners also decreased with 4thousand persons as compared to 2014. In 2017, the monthly average pensionof social insurance pensioners amounted to 1069 lei, 1.3 times higher than in2014.
In 2017, the monthly average pension for state social insurance pensionersamounted to 1026 lei, increasing by 21.4% as compared to 2014.
SOCIAL INSURANCE
�� �
�� �
��� �� �� � ��� � ��� ���
�� �
��� �
���� ���� ���� ���� ���� ���� ���� ���� ��� �����������������������������������
�
%
M.U. 2014 2015 2016
Tickets - total thou 210.0 207.0 212.0Balneary treatment thou 210.0 207.0 212.0Expenditure on treatment and rest1) lei thou 288616.0 283568.0 288416.0
Note: Data on 2017 will be available in September 2018.1) Including expenses incurred for the balneary treatment of farmers, according to
Government Emergency Ordinance No 31/1998.Source: Ministry of Labour and Social Justice.
Tickets for balneary treatment and rest granted by means of social insurance
Real average pension indices1990=100

Statistical abstract 41
SOCIAL ASSISTANCE
Social assistance benefits and services financed by the Ministry of Labour and Social Justice budget
lei thou2014 2015 2016
Paid amounts - total 8146442.5 9975256.5 11704181.5I. Social assistance benefits
financed by MLSJ budgetState children allowances 2684862.1 3541590.8 4415501.6
Child rearing benefit 1552480.6 1578924.7 2060258.5Insertion bonus and monthly bonus for child rearing 207881.0 230359.0 263932.9Accommodation allowance for adoption - - 986.3Social security contributions for beneficiaries of accommodation allowance for adoption - - 52.9Family allowance 260682.7 535518.0 525919.9Benefits for thermal energy provided by district heating grid 50383.9 42905.0 26538.7Benefits for natural gas heating 80588.7 72019.4 50994.1Benefits for wood, coal or petroleum fuels 91165.3 78300.4 67197.7Electric power heating aid 4465.5 4559.3 3835.5Social aid for ensuring the guaranteed minimum income 662894.3 673411.1 811680.7Allowances for family placement 71387.8 317207.6 324894.2Benefits for refugees 1836.0 1273.9 1194.5Financial aid 1523.0 1567.0 1594.0Emergency aid 3866.1 7885.1 9499.4Health social insurance contributions for guaranteed minimum income beneficiaries 36361.8 37112.9 44614.7Compulsory payment of dwellingsinsurance for families receiving social benefit for ensuring the minimumguaranteed income 650.1 3075.0 3055.1Health insurance contributionscoresponding to the indemnityfor child rearing 86614.2 88054.2 114680.3Allowance, indemnity and facilities for disabled personsSupport for child rearing granted forpersons with disabilities 37356.0 36238.8 48060.6Monthly indemnity for the caregiver of the visually impaired, with major disability 331200.3 374383.6 477555.0Monthly indemnity for adults with severe or major disability 1213394.8 1468290.4 1546959.1Complementary budget for severe,major or moderate disabled persons 593355.6 721205.1 750352.4Monthly indemnity for persons with HIV/AIDS 41819.1 44642.8 50037.8Monthly allowance for children with HIV/AIDS 653.4 662.7 724.6Free of charge interurban transport 72443.5 59027.5 68453.5Interests for bank loans to purchase an adapted car or to adapt the dwelling 2887.6 1756.4 1748.3II. Social services financed by MLSJ budgetSubsidies for associations and foundations (persons assisted) 27317.2 20769.4 17033.1Programs of national interest (persons assisted) 12006.8 13266.0 79.1Financing social assistance institutions 16365.1 21250.4 16747.0
Note: Data on 2017 will be available in September 2018.Source: Ministry of Labour and Social Justice.

ROMANIA IN FIGURES42
Social assistance included social services and social assistance benefits. Theirfinancing was, according to the law, from funds allocated from the statebudget, local budgets, donations, sponsorships and other contributions ofnatural or legal persons, from the country and from abroad, contributions ofbeneficiaries, as well as other sources.
The Ministry of Labour and Social Justice is the central public authority whichdraws up the social assistance policy and promotes the rights of families,children, elderly persons, disabled persons and any other persons in need. In2016, the amount spent from the state budget allocated to MLSJ for socialassistance was 11704181.5 lei, by 17.3% more than in 2015 and by 43.7% moreas compared to 2014. The increase was mostly due to the increased quantumof certain benefits: state allowance for children, allowance for family withchildren support, placement allowance, some benefits paid to disabledpersons.
Within total expenses for social benefits and services performed through thebudget of the Ministry of Labour and Social Justice, state allowances forchildren prevailed (33.0% in 2014, 33.5% in 2015 and 37.7% in 2016), followedby the benefits for children care (19.1% in 2014, 15.8% in 2015 and 17.6% in2016).
2014 2015 2016
Number of units and sections 99 109 96Number of places 23771 28688 24513
Note: Data on 2017 will be available in September 2018.1) Financed from the local budget.Source: Ministry of Labour and Social Justice.
Social assistance canteens 1)
SOCIAL ASSISTANCE

Statistical abstract 43
HEALTH
Main health care unitsnumber of units
2014 2015 2016 20171)
Hospitals 2) 527 554 567 576Integrated hospital ambulatories and specialised ambulatories 448 458 469 461Polyclinics 297 143 146 143Dispensaries 186 187 187 184Health care centres3) 19 18 17 15Tuberculosis sanatoria 2 2 2 2Balneary sanatoria4) 11 10 11 10Preventoria 2 2 2 2Health and social care units 64 65 67 66Diagnosis and curative centres 37 30 30 26Specialised health centres 309 626 667 692Mental health centres 86 86 80 80Blood establishments 41 41 42 43General practitioner offices5) 795 770 752 776Family doctors offices5) 11163 11397 11274 11055Specialised health offices5) 10063 10332 10754 11079Medical offices in schools and universities 1784 1797 1931 1929Dentist offices5) 14052 14763 14879 15095Dental offices in schools and universities 476 471 476 480Other health care offices 519 693 749 737Pharmacies and pharmaceuticaldispensaries6) 9286 9485 9495 9700Medical laboratories 3418 3856 4009 4077Dental laboratories 2226 2217 2263 2198
1) Provisional data. 2) Including institutes, medical centres with hospital beds.3) Including health care centres with hospital beds.4) Including neurosis or neuropsychiatric sanatoria.5) In the number of general practitioner offices, family doctors offices, dentist offices,
health specialized offices are not included offices from other sanitary units structure, such as: polyclinics, medical civil societies, diagnosis and curative centers.6) Including drugstores.
Source: NIS - The annual statistical survey “The activity of health care units”.
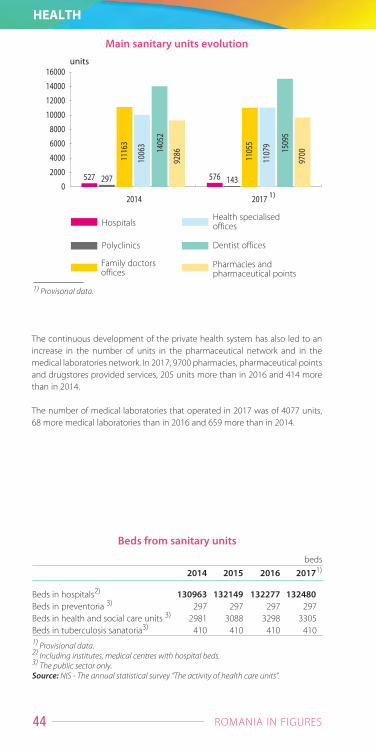
The health care services within the health system1) were provided by a networkof health care units (hospitals, polyclinics, medical centres, specialisedambulatories and other medical institutions) belonging to the public andprivate sectors.In 2017, this network comprised 576 hospitals2), 9 more than in 2016 and 49more than 2014. 132480 hospital beds were available for the patientshospitalized in 2017, 203 beds more than in 2016 and 1517 more than in 2014.In 2017, as compared to 2016, increases were recorded in the number of somemedical units and decreases in the number of others. In 2017, the number ofindependent general practioner offices3) (776 offices) increased with 24 unitscompared to 2016, but decreased with 19 units compared to 2014; the numberof specialized health centres (692 units) increased with 25 units compared to2016 and 2.2 times compared to 2014, while the number of independentspecialized health offices3) (11079 offices) increased with 325 units comparedto 2016 and with 1016 units as compared to 2014. The number of independentfamily doctors offices3) (11055 offices) decreased with 219 units in 2017compared to 2016 and with 108 units compared to 2014.
1) Data on 2017 are provisional.2) Including institutes, medical centres with hospital beds.3) In the number of general practitioner offices, family doctors offices, dentist offices, health specialized offices are not included offices from other sanitary units structure, such as: polyclinics, medical civil societies, diagnosis and curative centers.
ROMANIA IN FIGURES44
HEALTH
beds2014 2015 2016 20171)
Beds in hospitals2) 130963 132149 132277 132480Beds in preventoria 3) 297 297 297 297Beds in health and social care units 3) 2981 3088 3298 3305Beds in tuberculosis sanatoria3) 410 410 410 4101) Provisional data.2) Including institutes, medical centres with hospital beds.3) The public sector only.Source: NIS - The annual statistical survey “The activity of health care units”.
Beds from sanitary units
The continuous development of the private health system has also led to anincrease in the number of units in the pharmaceutical network and in themedical laboratories network. In 2017, 9700 pharmacies, pharmaceutical pointsand drugstores provided services, 205 units more than in 2016 and 414 morethan in 2014.
The number of medical laboratories that operated in 2017 was of 4077 units,68 more medical laboratories than in 2016 and 659 more than in 2014.
Main sanitary units evolution
��� ������ ���
����
����
���
���
�����
�����
�����
����
����
���� �����
�� �����
����� �����
����
���� ���� ��
units
Hospitals
Polyclinics
Family doctorsoffices
Health specialisedoffices
Dentist offices
Pharmacies andpharmaceutical points
1) Provisonal data.

Statistical abstract 45
HEALTH
Number of medical staff
persons
2014 2015 2016 20171)
Physicians 2) 54929 56110 57304 58575Population per physician 363 353 344 335Physicians per 10000 inhabitants 27.6 28.3 29.1 29.8
Dentists 14879 15556 16442 15653Population per dentist 13393) 1274 1199 1255Dentists per 10000 inhabitants 7.5 7.8 8.3 8.0
Pharmaceutical chemists 17099 17135 17180 17833Population per pharmaceutical chemist 1165 1157 1147 1102Pharmaceutical chemists per 10000 inhabitants 8.6 8.6 8.7 9.1
Ancillary medical staff 128899 133173 137246 142103Population per member of the ancillary medical staff 1553) 149 144 138Ancillary medical staff per 10000 inhabitants 64.7 67.2 69.6 72.3Ancillary medical staff per physician 2.3 2.4 2.4 2.4
Note: For the 2014-2016 period, the rates were calculated based on the usually residentpopulation on July 1st each year, populations estimated under conditions ofcomparability with the final results of the Population and Housing Census 2011.For the year 2017, the rates were calculated based on the usually resident population on January 1st, populations estimated under conditions of comparability with the final results of the Population and Housing Census 2011.
1) Provisional data.2) Dentists excluded.3) Rectified data as against those previously published.Source: NIS - The annual statistical survey “The activity of sanitary units”.
The health system benefited, in 2017, of 58.6 thousand doctors (excludingdentists), 15.7 thousand dentists, 17.8 thousand pharmacists and 142.1thousand health workers with secondary education. In 2017, there was adoctor (excluding a dentist), as average, to 335 inhabitants, 9 inhabitants lessthan in 2016 and 28 inhabitants less than in 2014. A dentist had 1255inhabitants, 56 inhabitants more than in 2016, but 84 fewer than in 2014 and apharmacist was available for 1102 inhabitants, 45 less than in 2016 and 63 lessthan in 2014.
In 2017, 10000 inhabitants benefited of services provided by 29.8 physicians;8.0 dentists; 9.1 pharmaceutical chemists and 72.3 ancillary medical staff.

ROMANIA IN FIGURES46
Number of medical staff from hospitals
���� �����
�����������������������������������������������������
��
����
������
�����
����
����
����
�����
����
persons
Physicians 2)
Dentists
Pharmaceutical chemists
Ancillary medical staff
1) Provisional data.2) Excluding dentists.Source: The annual statistical survey “The activity of health care units”.
�� ��
� ��
�� ��
��
Hospitals, by type of ownership and by area, in 2017
Source: The annual statistical survey “The activity of health care units”.
Urban
Rural
HEALTH
The share of hospitalsunder public majority
ownership
The share of hospitalsunder private majority
ownership

Statistical abstract 47
EDUCATION
Education by level
2014/ 2015/ 2016/ 2017/2015 2016 2017 2018
Number of educational units
Total 7127 7108 7010 7047
Enrolled population by level of education (thou)
Total 3736 3643 3597 3579Level of education:Early childhood 19 19 20 21- private sector 1 1 1 1Pre-primary 560 535 521 521- private sector 20 20 21 26Primary and lower secondary 1732 1712 1695 1678- private sector 11 13 15 19Upper secondary 727 674 651 638- private sector 13 11 11 10Vocational 51 69 84 90- private sector 1 1 2 2Post secondary non-tertiaryand foremen 105 99 94 92- private sector 46 41 39 40Tertiary 542 535 532 539- private sector 78 70 67 67
Enrolment rate for the school age population 1);2) (%)
Total 73.63) 72.5 72.13) 72.04)
By sexMale 72.03) 70.9 70.53) 70.34)
Female 75.43) 74.1 73.83) 73.84)
Number of early childhood and studentsper member of the teaching staff
Early childhood 16 16 15 15Students (ISCED levels 1-4) 14 15 14 14Students (ISCED levels 5-8) 20 20 20 21
Number of pupils and students per 10000 inhabitants 1)
Students (ISCED levels 1-4) 13133) 1289 12813) 12714)
Students (ISCED levels 5-8) 272 270 2703) 2744)
1) For the 2014/2015 - 2016/2017 period the usually resident population on July 1st
of each year was used, and for the 2017/2018 year the usually resident population on January 1st was used, populations estimated under conditions of comparability with the final results of the Population and Housing Census 2011.
2) Including the number of children in early childhood education (creches).3) Revised data .4) Provisional data.Source: Statistical survey on the activity of educational units.

ROMANIA IN FIGURES48
EDUCATION
The changes taking place in the educational field, in the last ten years,especially the new legal regulations in the educational field, as well as therestructuring of the national educational system have led to the reorganisationof the network of educational units in Romania.
Thus, during the 2017/2018 academic year, the number of educational unitsincreased to 7047 units, 37 units more (by 0.5% more, respectively) ascompared to the 2016/2017 academic year.
The configuration of the educational network has been correlated with the sizeof the school population and with the conditions offered by the existingmaterial resources in order to ensure a high quality educational process.
The number of pupils attending pre-university education decreased, so thatduring the 2017/2018 school year their number was by 0.5% less than in the2016/2017 school year. The data on school population enrolled in tertiaryeducation also include, beside the students attending Bachelor's degreecourses, the students who attend Master's and Doctoral degree courses, andthose attending post-university and post-doctoral courses. Of the totalstudents and trainees enrolled in tertiary education, 75.7% are studentsattending Bachelor's degree courses, 20.6% are students attending Master'sdegree and post-university courses, while the rest are students attendingDoctoral degree courses as well as post-doctoral programmes. 12.5% of thetotal number of students enrolled in tertiary education attend privateeducation institutions.
During the 2017/2018 school year, for all educational levels, the enrolment rateof the school age population (0-23 years) had different values by sex (70.3% forboys, 73.8% for girls respectively).
School age population, by level of education
��� ���
��� ���� ��
����
���� ��
�� ���
�� ���
����������������������������
����&���� ����&���
Early childhoodeducationPre-primary educationPrimary and lowersecondary educationUpper secondaryeducation
Vocational educationPost-secondary non-tertiaryand foremen educationTertiary education
thou

Statistical abstract 49
EDUCATION
Students in tertiary education institutions, by fields of study in the academic year 2017/2018
� ��� ��
�
�� �
� �� �
�� ��
� ��
�� �
� ��
ISCED-F1) Fields of education and training
Business, administrationand law
Natural sciences,mathematics and statistics
Information and CommunicationTechnologies (ICT)
Health and welfare
Engineering, manufacturingand construction
Arts and humanities
Education
Social sciences, journalismand information
Agriculture, forestry,fisheries and veterinarysciences
Services
1)ISCED-F2013 (the International Standard Classification of Education, Fields of Education and Training 2013) was adopted in 2014, following the revision of ISCED-2011.
The structure of the students enrolled in tertiary education (bachelor's, master'sand doctorate degree courses, post-university and post-doctoral programmes)in the 2017/2018 academic year by fields of education and training shows thatmost students and trainees study: business, administration and law (23.8%),engineering, manufacturing and construction (21.0%) and health and welfare(13.8%). In the private education sector, the highest share is that of thestudents and trainees who study business, administration and law (57.0%).
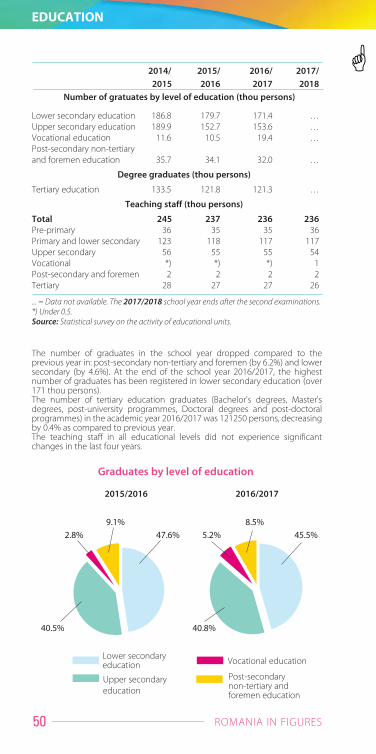
ROMANIA IN FIGURES50
EDUCATION
The number of graduates in the school year dropped compared to theprevious year in: post-secondary non-tertiary and foremen (by 6.2%) and lowersecondary (by 4.6%). At the end of the school year 2016/2017, the highestnumber of graduates has been registered in lower secondary education (over171 thou persons).The number of tertiary education graduates (Bachelor's degrees, Master'sdegrees, post-university programmes, Doctoral degrees and post-doctoralprogrammes) in the academic year 2016/2017 was 121250 persons, decreasingby 0.4% as compared to previous year.The teaching staff in all educational levels did not experience significantchanges in the last four years.
Graduates by level of education
�� �
�� ��
� �� ��
�� ��
�� �
� �� ��
2015/2016 2016/2017
Lower secondaryeducation
Upper secondaryeducation
Vocational education
Post-secondarynon-tertiary andforemen education
2014/ 2015/ 2016/ 2017/2015 2016 2017 2018
Number of gratuates by level of education (thou persons)
Lower secondary education 186.8 179.7 171.4 …Upper secondary education 189.9 152.7 153.6 …Vocational education 11.6 10.5 19.4 …Post-secondary non-tertiaryand foremen education 35.7 34.1 32.0 …
Degree graduates (thou persons)
Tertiary education 133.5 121.8 121.3 …
Teaching staff (thou persons)
Total 245 237 236 236Pre-primary 36 35 35 36Primary and lower secondary 123 118 117 117Upper secondary 56 55 55 54Vocational *) *) *) 1Post-secondary and foremen 2 2 2 2Tertiary 28 27 27 26
... = Data not available. The 2017/2018 school year ends after the second examinations. *) Under 0.5.Source: Statistical survey on the activity of educational units.
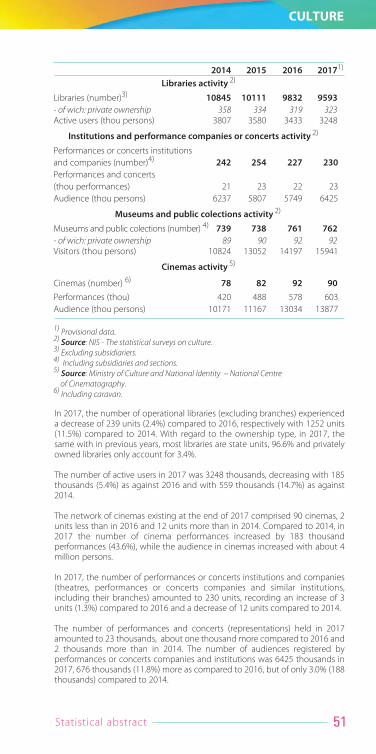
Statistical abstract 51
CULTURE
2014 2015 2016 20171)
Libraries activity 2)
Libraries (number)3) 10845 10111 9832 9593- of wich: private ownership 358 334 319 323Active users (thou persons) 3807 3580 3433 3248
Institutions and performance companies or concerts activity 2)
Performances or concerts institutions and companies (number)4) 242 254 227 230Performances and concerts (thou performances) 21 23 22 23Audience (thou persons) 6237 5807 5749 6425
Museums and public colections activity 2)
Museums and public colections (number) 4) 739 738 761 762- of wich: private ownership 89 90 92 92Visitors (thou persons) 10824 13052 14197 15941
Cinemas activity 5)
Cinemas (number) 6) 78 82 92 90Performances (thou) 420 488 578 603Audience (thou persons) 10171 11167 13034 13877
1) Provisional data.2) Source: NIS - The statistical surveys on culture.3) Excluding subsidiariers.4) Including subsidiaries and sections.5) Source: Ministry of Culture and National Identity – National Centre
of Cinematography.6) Including caravan.
In 2017, the number of operational libraries (excluding branches) experienceda decrease of 239 units (2.4%) compared to 2016, respectively with 1252 units(11.5%) compared to 2014. With regard to the ownership type, in 2017, thesame with in previous years, most libraries are state units, 96.6% and privatelyowned libraries only account for 3.4%.
The number of active users in 2017 was 3248 thousands, decreasing with 185thousands (5.4%) as against 2016 and with 559 thousands (14.7%) as against2014.
The network of cinemas existing at the end of 2017 comprised 90 cinemas, 2units less than in 2016 and 12 units more than in 2014. Compared to 2014, in2017 the number of cinema performances increased by 183 thousandperformances (43.6%), while the audience in cinemas increased with about 4million persons.
In 2017, the number of performances or concerts institutions and companies(theatres, performances or concerts companies and similar institutions,including their branches) amounted to 230 units, recording an increase of 3units (1.3%) compared to 2016 and a decrease of 12 units compared to 2014.
The number of performances and concerts (representations) held in 2017amounted to 23 thousands, about one thousand more compared to 2016 and2 thousands more than in 2014. The number of audiences registered byperformances or concerts companies and institutions was 6425 thousands in2017, 676 thousands (11.8%) more as compared to 2016, but of only 3.0% (188thousands) compared to 2014.
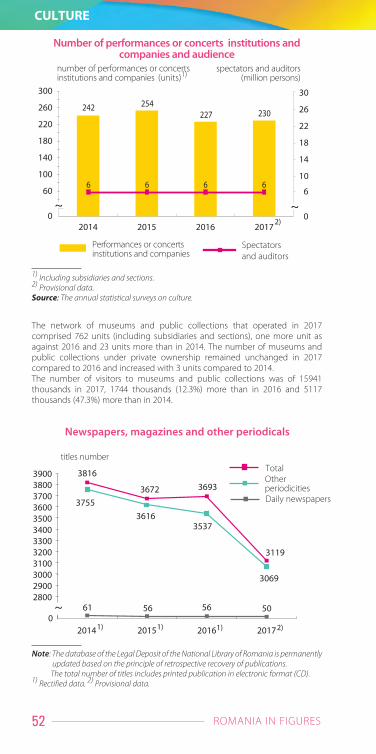
CULTURE
52
��
��� ���
����
� � � ��
������
����
���
���� ���� ��� �����
���������������������������������������������
������� ��
Newspapers, magazines and other periodicals
Total
Daily newspapers
Other periodicities
Note: The database of the Legal Deposit of the National Library of Romania is permanently updated based on the principle of retrospective recovery of publications.
The total number of titles includes printed publication in electronic format (CD).1) Rectified data. 2) Provisional data.
The network of museums and public collections that operated in 2017comprised 762 units (including subsidiaries and sections), one more unit asagainst 2016 and 23 units more than in 2014. The number of museums andpublic collections under private ownership remained unchanged in 2017compared to 2016 and increased with 3 units compared to 2014.The number of visitors to museums and public collections was of 15941thousands in 2017, 1744 thousands (12.3%) more than in 2016 and 5117thousands (47.3%) more than in 2014.
ROMANIA IN FIGURES
titles number
������
��� ���
���� ���� ��� �����
�
���
���
��
���
��
���
��� ���
�
��
��
�
��
�
��
� ���
��� ���
Number of performances or concerts institutions andcompanies and audience
number of performances or concertsinstitutions and companies (units)1)
spectators and auditors(million persons)
Performances or concertsinstitutions and companies
Spectatorsand auditors
1) Including subsidiaries and sections.2) Provisional data.Source: The annual statistical surveys on culture.

Statistical abstract 53
CULTURE
Mass-media productions
2014 2015 2016 20171)
Newspapers, magazines and other periodicals 2)
Titles - total3) 3816 3672 3693 3119
Radio programmes
Broadcast by public stations(thousand broadcast hours)4) 149 154 154 148Broadcast by private stations(thousand broadcast days)5) 133 132 132 133
Television programmes
Broadcast by public stations(thousand broadcast hours)6) 53 53 53 53Broadcast by private stations(thousand broadcast days)5) 35 14 7) 7)
Note: The database of the Legal Deposit of the National Library of Romania ispermanently updated based on the principle of retrospective recovery ofpublications.
The total number of titles includes printed publication in electronic format (CD).1) Provisional data.2) Which entered the Legal Deposit of the National Library of Romania.3) For 2014-2016 period, the data were rectified by the National Library of Romania.4) Source: Romanian Radio Broadcasting Company.5) Source: Audio-Visual National Council.6) Source: Romanian Television Company.7) Since 2015, the terrestrial boadcasting of TV stations was ceased, in accordance
with the provisions of Government Decision No 403/2013.
In 2017, the number of broadcast hours of public radio stations decreased by6 thousand hours, compared to 2016, while the number of broadcast hours ofpublic TV stations remained unchanged throughout the 2014-2017 period (53thousands broadcast hours per year).In 2017, as compared to 2016, the number of broadcast hours of private radiostations (with terrestrial broadcast) increased with 1 thousand broadcast days,keeping the level of 2014 (133 thousand broadcast days).

ROMANIA IN FIGURES54
PRICES
In 2017, the average annual inflation rate was 1.3%, mainly influenced byhigher prices of food goods, fuels and tobacco. Thus, after two years ofnegative inflation, the average annual index of consumer prices for food goodswas 102.48%, 5.1 percentage points higher than the corresponding index of2016. In case of non-food goods, the average annual index of 2017 was101.41%, the trend of the previous year being the same only for services, wherethe average annual index was 99.23%.
2014 2015 2016 2017
Consumer price indices (%)(previous year = 100)
Total 101.07 99.41 98.45 101.34Food goods 98.37 96.20 97.43 102.48Non-food goods 102.45 100.93 98.96 101.41Services 103.16 102.04 99.21 99.23
Monthly average inflation rate (%)Total 0.1 -0.1 0.0 0.3Food goods 0.0 -0.5 0.1 0.3Non-food goods 0.1 0.2 -0.1 0.3Services 0.2 0.2 -0.2 0.0
Average exchange rate in Decemberlei / Euro 4.4591 4.5040 4.5173 4.6359lei / USD 3.6185 4.1390 4.2820 3.9186
���� ���� ���� ���� ���� ���� ���� ��� �������������������������
���
�
�
1) Provisional data for 2017.
Evolution of consumer price, real earningsand yearly average exchange rate indices
In 2017, as compared to the overall index of industrial production prices, theindustrial production price indices by CANE Rev. 2 section had the followingevolution (while maintaining the comparison base - the year 2010=100): industrial production prices for water supply, sewerage, waste
management and decontamination activities and manufacturing increased by52.0 percentage points and 1.1 percentage points respectively; industrial production prices in mining and quarrying and those for the
electricity, gas, steam and air conditioning production and supply decreasedby 3.4 percentage points, 6.7 percentage points respectively.
%
Consumer priceindices - total
Yearly average exchangerate indices - lei/euroYearly average exchange rateindices - lei/dolar USD
Real earningsindices1)
current year / previous year
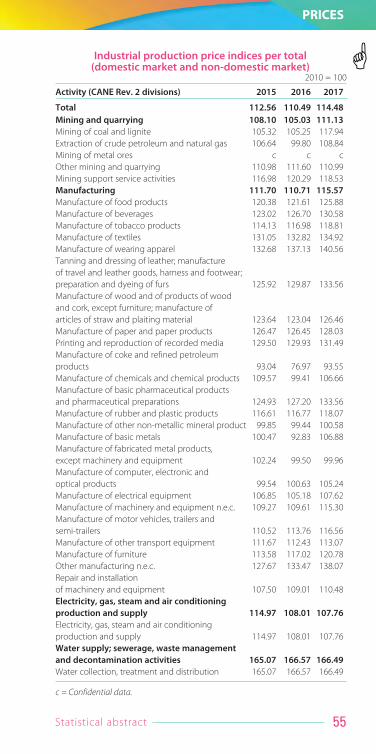
Statistical abstract 55
PRICES
Industrial production price indices per total(domestic market and non-domestic market)
2010 = 100
Activity (CANE Rev. 2 divisions) 2015 2016 2017
Total 112.56 110.49 114.48Mining and quarrying 108.10 105.03 111.13Mining of coal and lignite 105.32 105.25 117.94Extraction of crude petroleum and natural gas 106.64 99.80 108.84Mining of metal ores c c cOther mining and quarrying 110.98 111.60 110.99Mining support service activities 116.98 120.29 118.53Manufacturing 111.70 110.71 115.57Manufacture of food products 120.38 121.61 125.88Manufacture of beverages 123.02 126.70 130.58Manufacture of tobacco products 114.13 116.98 118.81Manufacture of textiles 131.05 132.82 134.92Manufacture of wearing apparel 132.68 137.13 140.56Tanning and dressing of leather; manufactureof travel and leather goods, harness and footwear;preparation and dyeing of furs 125.92 129.87 133.56Manufacture of wood and of products of wood and cork, except furniture; manufacture of articles of straw and plaiting material 123.64 123.04 126.46Manufacture of paper and paper products 126.47 126.45 128.03Printing and reproduction of recorded media 129.50 129.93 131.49Manufacture of coke and refined petroleum products 93.04 76.97 93.55Manufacture of chemicals and chemical products 109.57 99.41 106.66Manufacture of basic pharmaceutical products and pharmaceutical preparations 124.93 127.20 133.56Manufacture of rubber and plastic products 116.61 116.77 118.07Manufacture of other non-metallic mineral product 99.85 99.44 100.58Manufacture of basic metals 100.47 92.83 106.88Manufacture of fabricated metal products, except machinery and equipment 102.24 99.50 99.96Manufacture of computer, electronic and optical products 99.54 100.63 105.24Manufacture of electrical equipment 106.85 105.18 107.62Manufacture of machinery and equipment n.e.c. 109.27 109.61 115.30Manufacture of motor vehicles, trailers and semi-trailers 110.52 113.76 116.56Manufacture of other transport equipment 111.67 112.43 113.07Manufacture of furniture 113.58 117.02 120.78Other manufacturing n.e.c. 127.67 133.47 138.07Repair and installation of machinery and equipment 107.50 109.01 110.48Electricity, gas, steam and air conditioning production and supply 114.97 108.01 107.76Electricity, gas, steam and air conditioning production and supply 114.97 108.01 107.76Water supply; sewerage, waste management and decontamination activities 165.07 166.57 166.49Water collection, treatment and distribution 165.07 166.57 166.49
c = Confidential data.
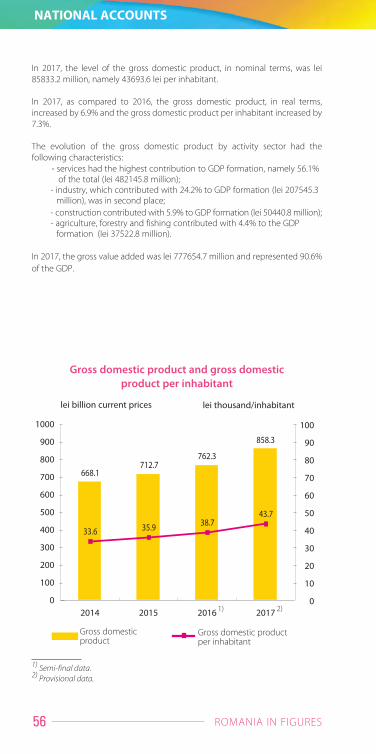
ROMANIA IN FIGURES56
NATIONAL ACCOUNTS
In 2017, the level of the gross domestic product, in nominal terms, was lei85833.2 million, namely 43693.6 lei per inhabitant.
In 2017, as compared to 2016, the gross domestic product, in real terms,increased by 6.9% and the gross domestic product per inhabitant increased by7.3%.
The evolution of the gross domestic product by activity sector had thefollowing characteristics:
- services had the highest contribution to GDP formation, namely 56.1%of the total (lei 482145.8 million);
- industry, which contributed with 24.2% to GDP formation (lei 207545.3 million), was in second place;
- construction contributed with 5.9% to GDP formation (lei 50440.8 million);- agriculture, forestry and fishing contributed with 4.4% to the GDP
formation (lei 37522.8 million).
In 2017, the gross value added was lei 777654.7 million and represented 90.6%of the GDP.
�������
����
���
���� ���� ��� �����
���
���
���
���
���
��
���
��
���
����
�� �� � � ��� �
���� �
�
��
��
��
��
��
�
��
�
��
���
�� ��
�� �
� �
lei billion current prices
Gross domesticproduct
Gross domestic product per inhabitant
lei thousand/inhabitant
Gross domestic product and gross domesticproduct per inhabitant
1) Semi-final data.2) Provisional data.

Statistical abstract 57
NATIONAL ACCOUNTS
lei million current prices
2014 20151) 20161) 20172)
Agriculture, forestry and fishing 31568.5 29825.4 31147.1 37522.8Industry 168952.2 171555.4 183832.3 207545.3Construction 41626.1 41841.1 46559.4 50440.8Services 349059.7 383330.4 422499.9 482145.8
Gross value added(GVA) 591206.5 626552.3 684038.7 777654.7Net taxes on products 76937.1 86106.2 78303.1 80678.1
Gross domestic product (GDP) 668143.6 712658.5 762341.8 858332.8
Actual final consumption 506112.1 537723.8 586474.2 667076.7Households actual individualfinal consumption 455587.4 487036.8 531215.5 600727.8General government actualcollective final consumption 50524.7 50687.0 55258.7 66348.9
Gross capital formation 164972.0 179363.2 182726.1 209504.9Gross fixed capital formation 162412.9 176342.7 175053.6 193640.9Change in stocks3) 2559.1 3020.5 7672.5 15864.0
Net exports4) -2940.5 -4428.5 -6858.5 -18248.8
Gross national income (GNI) 661538.7 697762.3 744293.4 838782.6
Note: The data were calculated according to the methodology of the European Systemof Accounts 2010 (ESA 2010).
1) Semi-final data.2) Provisional data.3) Including acquisitions less disposals of valuables.4) Exports - imports.
Gross domestic product, by category of resources and category of uses
In 2017, in terms of GDP use, the actual final consumption was lei 667076.7million and the value of its most important component - the actual individualfinal consumption of population households - was lei 600727.8 million.
In 2017, the amounts allocated for gross fixed capital formation totalised lei193640.9 million.
The gross value added rate increased in 2017, reaching 47.6%, 0.5 percentagepoints above the level of 2016 (47.1%).
The investment rate dropped last year, with the value of 24.9%, 0.7 percentagepoints below the level recorded previous year (25.6%).

ROMANIA IN FIGURES58
NATIONAL ACCOUNTS
previous year = 100
2014 2015 20161) 20172)
RESOURCESAgriculture, forestry and fishing 104.3 88.9 104.7 118.3Industry 103.6 105.8 105.3 108.0Construction 101.9 106.9 112.7 99.4Services 103.1 103.5 104.0 106.5
Gross value added 103.2 103.6 105.0 107.0Net taxes on products 101.8 106.9 103.6 106.9
Gross domestic product (GDP) 103.1 104.0 104.8 106.9
USESActual final consumption 104.0 104.9 106.8 108.4Households actual individualfinal consumption 104.4 105.7 107.4 109.0General government actual collective final consumption 100.5 97.7 100.7 102.8
Gross capital formation 101.7 107.0 101.0 105.2Gross fixed capital formation 103.2 107.4 98.0 104.7Change in stocks3) 60.3 83.5 273.6 117.3
Net exports 144.0 427.2 184.4 182.9
Note: The data were calculated according to the methodology of the European Systemof Accounts (ESA) - 2010.
1) Semi-final data.2) Provisional data.3) Including acquisitions less disposals of valuables.
Gross domestic product indices (%)
Gross domestic product growth variation
�
��� �
��� �
��� �
�� �
��� �
���
��� �
��� �
��� �
���
�� �
�
��
�
�
��
��
���
���
���
��� ���� ���� ���� �������� ���� �������� ��� ����
previous year = 100%
Note: Semi-final data for 2016 and provisional data for 2017.

Statistical abstract 59
NATIONAL ACCOUNTS
2014 2015 20161) 20172)
Gross domestic product- lei million current prices 668143.6 712658.5 762341.8 858332.8- changes as against the
previous year (%) 3.1 4.0 4.8 6.9
Gross domestic product per inhabitant3)
- lei 33547.3 35957.1 38684.7 43693.6- changes as against the
previous year (%) 3.5 4.5 5.4 7.3- dollars (based on the
purchasing power parity)4) 19855 20950 22369 24508- purchasing power standard4) 15200 16300 16900 …
Gross value added rate(GVA / Output) (%) 43.9 44.9 47.1 47.6
Investment rate(GFCF / GVA) (%) 27.5 28.1 25.6 24.9
Note: The data were calculated according to the methodology of the European Systemof Accounts (ESA) - 2010.
1) Semi-final data.2) Provisional data.3) For the 2014 - 2016 period the usually resident population on July 1st of each year
was used, populations estimated under conditions of comparability with the finalresults of the Population and Housing Census 2011.For 2017, the usually resident population at January 1st, was used.
4) Revised data.... = Data not available.
2014 2015 20161) 20172)
Agriculture, forestry and fishing 4.7 4.2 4.1 4.4Industry 25.3 24.1 24.1 24.2Construction 6.2 5.9 6.1 5.9Services 52.3 53.7 55.4 56.1Gross value added 88.5 87.9 89.7 90.6Net taxes on products 11.5 12.1 10.3 9.4Gross domestic product (GDP) 100.0 100.0 100.0 100.0
1) Semi-final data.2) Provisional data.
Contribution of the main activitiesto the gross domestic product (%)
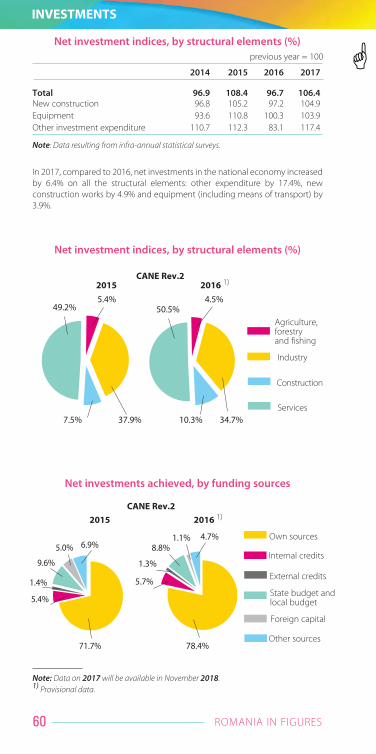
ROMANIA IN FIGURES60
Net investment indices, by structural elements (%)previous year = 100
2014 2015 2016 2017
Total 96.9 108.4 96.7 106.4New construction 96.8 105.2 97.2 104.9Equipment 93.6 110.8 100.3 103.9Other investment expenditure 110.7 112.3 83.1 117.4
Note: Data resulting from infra-annual statistical surveys.
Net investment indices, by structural elements (%)
�� ��� ��
�� ��� ��
�� ���� ��
�� ��� ��
�� ��
� ��
� ��
� �
� �� ��
� ��
� ��
� ��
�� �� � ��
Note: Data on 2017 will be available in November 2018.1) Provisional data.
Agriculture, forestry and fishing
Industry
Construction
Services
CANE Rev.22016 1)2015
Own sources
Internal credits
External credits
State budget andlocal budget
Foreign capital
Other sources
CANE Rev.22016 1)2015
In 2017, compared to 2016, net investments in the national economy increasedby 6.4% on all the structural elements: other expenditure by 17.4%, newconstruction works by 4.9% and equipment (including means of transport) by3.9%.
INVESTMENTS
Net investments achieved, by funding sources

Statistical abstract 61
AGRICULTURE
Agricultural production 1)
lei million current prices
2014 2015 2016 20172)
Total 74524 68749 69349 79733Crop production 49058 43574 45155 54821Animal production 24482 24315 23294 23809Agricultural services 984 860 900 1103
1) According to the Eurostat methodology on “Economic Accounts for Agriculture”.2) Provisional data.
Within the structure of agricultural production, crop production is prevalent,with a 68.7% share in the total production in 2017, as compared to 29.9% foranimal production and 1.4% for agricultural services.
Agricultural production structure 1)
� �
�� ��
� ��
��
�� ��
� ��
2014 2017 2)
CropproductionAnimalproductionAgriculturalservices
1) According to the Eurostat methodology on “Economic Accounts for Agriculture”.2) Provisional data.
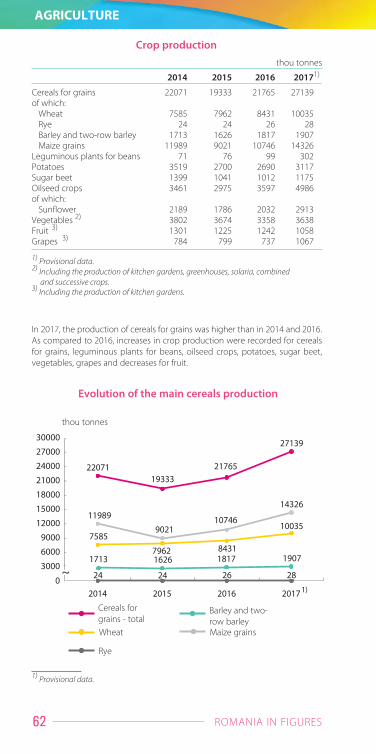
ROMANIA IN FIGURES62
AGRICULTURE
Evolution of the main cereals production
����������
����
�����
���
��� ���
�����
�� �� � �
���� �� ��� ����
����
��������
����
���� ���� ��� �����
����
���
����
�����
�����
����
�����
�����
�����
�����
���
Cereals for grains - total
Maize grains
Barley and two-row barley
Wheat
Rye
thou tonnes
2014 2015 2016 20171)
Cereals for grains 22071 19333 21765 27139of which:
Wheat 7585 7962 8431 10035Rye 24 24 26 28Barley and two-row barley 1713 1626 1817 1907Maize grains 11989 9021 10746 14326
Leguminous plants for beans 71 76 99 302Potatoes 3519 2700 2690 3117Sugar beet 1399 1041 1012 1175Oilseed crops 3461 2975 3597 4986of which:
Sunflower 2189 1786 2032 2913Vegetables 2) 3802 3674 3358 3638Fruit 3) 1301 1225 1242 1058Grapes 3) 784 799 737 1067
1) Provisional data.2) Including the production of kitchen gardens, greenhouses, solaria, combined
and successive crops.3) Including the production of kitchen gardens.
Crop productionthou tonnes
In 2017, the production of cereals for grains was higher than in 2014 and 2016.As compared to 2016, increases in crop production were recorded for cerealsfor grains, leguminous plants for beans, oilseed crops, potatoes, sugar beet,vegetables, grapes and decreases for fruit.
1) Provisional data.
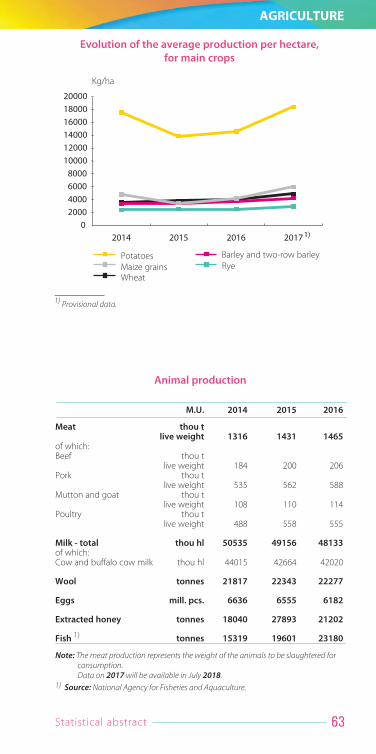
Statistical abstract 63
AGRICULTURE
M.U. 2014 2015 2016
Meat thou tlive weight 1316 1431 1465
of which:Beef thou t
live weight 184 200 206Pork thou t
live weight 535 562 588Mutton and goat thou t
live weight 108 110 114Poultry thou t
live weight 488 558 555
Milk - total thou hl 50535 49156 48133of which:Cow and buffalo cow milk thou hl 44015 42664 42020
Wool tonnes 21817 22343 22277
Eggs mill. pcs. 6636 6555 6182
Extracted honey tonnes 18040 27893 21202
Fish 1) tonnes 15319 19601 23180
Note: The meat production represents the weight of the animals to be slaughtered forconsumption.Data on 2017 will be available in July 2018.
1) Source: National Agency for Fisheries and Aquaculture.
Animal production
Evolution of the average production per hectare, for main crops
���� ���� ��� �����
������������������������������������������
��
Kg/ha
PotatoesMaize grainsWheat
Barley and two-row barleyRye
1) Provisional data.

ROMANIA IN FIGURES64
AGRICULTURE
Livestock (on December 1st)
Majority private ownership livestock (on December 1st)
���� ���� ��� �����
����
����
���
���
�����
�����
�����
����
��
��
������
����
����
��� �����
��
����
���� �������
����
����
����
M.U. 2014 2015 2016 20171)
Cattle thou heads 2069 2092 2050 2011Pigs thou heads 5042 4927 4708 4406Sheep thou heads 9518 9810 9876 9982Goats thou heads 1417 1440 1483 1503Horses thou heads 525 503 520 481Poultry - total thou heads 75447 78648 75690 73289- majority private ownership thou heads 75435 78635 75677 73267Bees - total thou families 1351 1393 1437 1423- majority private ownership thou families 1350 1392 1437 1423
1) Provisional data.
thou heads
Cattle
Pigs
Sheep
Goats
Horses
1) Provisional data.

Statistical abstract 65
FORESTRY
Forest resources area, by category of use
thou hectares
Category of use 2014 2015 2016 20171)
Forest resources - total 6545 6555 6559 6565Forest area 6387 6399 6404 6406
Coniferous trees 1930 1931 1929 1924Deciduous trees 4457 4468 4475 4482
Other lands from the forest resources 158 156 155 159
1) Provisional data.
At the end of 2017, forest resources covered an area of 6565 thousandhectares, 20 thousand hectares more than in 2014 (0.3% respectively). In 2017,as compared to 2016, the forest resources area increased by about 0.1%.
In 2017, the forest area amounted to 6406 thousand hectares, with theconiferous trees covering 1924 thousand hectares (30.0% respectively) and thedeciduous trees covering 4482 thousand hectares (70.0% respectively).
In 2017, the volume of wood harvested was by 1119 thousand m3 higher thanin 2016 (+6.5% respectively) and by 427 thousand m3 higher than in 2014(+2.4% respectively). In 2017, according to the breakdown by wood species,coniferous trees accounted for 35.6% of the total volume harvested, beechtrees covered 33.9%, oak trees 9.8% and the various hard and soft species20.6%.
thou m3 - gross volume
Wood species 2014 2015 2016 20171)
Volume of wood harvested- total 17889 18133 17197 18316Coniferous trees 7225 6782 6268 6531Beech trees 5836 6215 5799 6212Oak trees 1664 1769 1688 1788Various hard species 1876 1951 2008 2228Various soft species 1288 1416 1435 1557
1) Provisional data.
Volume of wood harvested, by main species
�� ���� ��� ��
�� ��
� �� ��
�� �
�� �� ��
�� �
Structure of the volume of wood harvested, by main species
2014 2017 1)
Coniferous trees
Beech trees
Oak trees
Various hard species
Various soft species
1) Provisional data.

ROMANIA IN FIGURES66
ENTERPRISE ACTIVITY
Activity (CANE Rev. 2 sections) 2014 2015 2016 Sem. I20171)
Total 481425 486529 498730 495264Mining and quarrying 1092 1085 1060 1047Manufacturing 47309 47633 47580 47105Electricity, gas, steam and air conditioning production and supply 1468 1426 1316 1304Water supply; sewerage, waste management and decontamination activities 3092 2981 2898 2867Construction 47727 48245 49621 49467Wholesale and retail; repair of motor vehicles and motorcycles 176031 171786 169524 167957Transport and storage 39568 41639 44391 44873Hotels and restaurants 25083 25468 25582 25362IInformation and communication 19426 20537 21932 21681Real estate activities 13838 14467 15344 15226Professional, scientific and technical activities 56828 57755 60260 59740Administrative and support services activities 19232 19775 20614 20366Education 2) 3771 4251 4940 4900Human health and social work activities 2) 10076 10942 13170 13091Art, entertainment and recreation 5738 6754 7717 7634Other service activities 11146 11785 12781 126441) Provisional data. 2) Only the enterprises whose activities are related to education or
health and social welfare and which are organised as trading companies are included.
Active enterprises in industry, construction, trade and other services, by activity of the national economynumber
Activity (CANE Rev. 2 sections) 2014 2015 2016 Sem. I20171)
Total 483066 488210 500428 496955Mining and quarrying 1112 1107 1076 1063Manufacturing 48090 48404 48347 47868Electricity, gas, steam and air conditioning production and supply 1503 1460 1350 1338Water supply; sewerage, waste management and decontamination activities 3160 3049 2968 2937Construction 47814 48341 49716 49561Wholesale and retail; repair of motor vehicles and motorcycles 176202 171959 169712 168144Transport and storage 39666 41746 44504 44986Hotels and restaurants 25111 25497 25612 25392Information and communication 19499 20619 22012 21761Real estate activities 13844 14472 15349 15231Professional, scientific and technical activities 56886 57812 60324 59804Administrative and support services activities 19406 19965 20802 20555Education 2) 3772 4252 4942 4902Human health and social work activities 2) 10093 10959 13188 13108Art, entertainment and recreation 5758 6778 7740 7656Other service activities 11150 11790 12786 126491) Provisional data. 2) Only the enterprises whose activities are related to education or
health and social welfare and which are organised as trading companies are included.
Active small and medium-sized enterprises in industry,contruction, trade and other services, by activity
of the national economy number

Statistical abstract 67
INDUSTRY
Value indices of turnover in industry (%)previous year = 100
CANE Rev. 2 2014 2015 2016 2017
Total - by sections 107.5 103.3 103.4 111.4Mining and quarrying 114.9 95.5 77.3 114.3Manufacturing 107.2 103.6 104.4 111.3Total - by main industrial groupings 107.5 103.3 103.4 111.4Intermediate goods industry 107.8 105.2 99.5 109.9Capital goods industry 108.6 109.7 108.9 115.9Durable consumer goods industry 112.3 108.8 114.0 108.3Non-durable consumer goods industry 104.1 104.6 104.9 104.3Energy industry 109.0 78.9 89.9 120.2
Note: Data resulting from infra-annual statistical surveys.For the 2014-2016 period, data were recalculated as result of changing the base year and the weigthing system.
In 2017, the value index of turnover in industry increased by 11.4% as againstthe previous year, growth sustained by mining and quarrying (+14.3%) and bymanufacturing (+11.3%).
In 2017, as compared to 2016, the industrial production index (unadjustedseries) increased by 7.8% as result of the increases in the three industrialsectors: mining and quarrying (+10.2%), manufacturing (+8.4%) and electricity,gas, steam and air conditioning production and supply (+3.4%).
The most important increases were reported for the following activities:manufacture of machinery and equipment n.e.c. (+38.2%); printing andproduction of recorded media (+20.1%); manufacture of computers, electronicand optical products (+19.4%); manufacture of motor vehicles, trailers andsemi-trailers (+17.0%); manufacture of basic pharmaceutical products andpharmaceutical preparations (+15.2%); manufacture of electrical equipment(+10.9%); manufacture of paper and paper products (+9.8%); manufacture ofbase metals (+8.3%); manufacture of fabricated metal products, exceptmachinery and equipment (+7.8%); manufacture of rubber and plasticproducts (+6.9%).

ROMANIA IN FIGURES68
INDUSTRY
Industrial production indices (%)previous year = 100Unadjusted series
Activity (CANE Rev. 2 divisions) 2014 2015 2016 2017
Total 106.1 102.7 103.1 107.8Mining and quarrying 101.0 87.5 88.3 110.2Mining of coal and lignite 95.4 108.1 90.3 111.8Extraction of crude petroleum and natural gas 99.1 99.3 90.0 105.3Mining of metal ores 106.2 104.8 111.4 85.9Other mining and quarrying 94.2 112.5 103.9 107.0Mining support service activities 106.5 61.7 66.7 140.2Manufacturing 107.5 103.5 104.8 108.4Manufacture of food products 104.2 105.2 109.2 102.8Manufacture of beverages 96.7 110.0 103.4 106.5Manufacture of tobacco products 118.5 120.2 99.7 95.3Manufacture of textiles 102.1 90.8 99.6 106.5Manufacture of wearing apparel 100.4 92.6 99.4 88.8Tanning and dressing of leather; manufacture of travel and leather goods, harness and footwear; preparation and dyeing of furs 105.2 94.6 97.0 98.3Manufacture of wood and of products of wood and cork, except furniture; manufacture of articles of straw and plaiting materials 97.3 98.0 99.8 96.7Manufacture of paper and paper products 127.0 108.6 113.9 109.8Printing and reproduction of recorded media 110.8 97.4 103.1 120.1Manufacture of coke and refined petroleum products 113.7 100.1 108.6 100.0Manufacture of chemicals and chemical product 102.3 94.7 100.5 105.8Manufacture of basic pharmaceutical products and pharmaceutical preparations 98.2 98.4 92.6 115.2Manufacture of rubber and plastic products 105.4 108.2 104.3 106.9Manufacture of other non-metallic mineral products 104.5 124.1 102.0 104.2Manufacture of basic metals 104.4 103.4 103.5 108.3Manufacture of fabricated metal products, except machinery and equipment 101.4 108.7 102.8 107.8Manufacture of computer, electronic and optical products 153.9 103.6 119.2 119.4Manufacture of electrical equipment 113.7 108.0 112.9 110.9Manufacture of machinery and equipment n.e.c. 103.6 87.7 100.0 138.2Manufacture of motor vehicles, trailers and semi-trailers 103.8 110.3 111.5 117.0Manufacture of other transport equipment 119.0 98.6 86.0 101.7Manufacture of furniture 102.9 107.9 113.1 98.0Other manufacturing n.e.c. 116.7 88.2 102.2 108.7Repair and installation of machinery and equipment 97.0 94.0 96.7 100.8
Electricity, gas, steam and air conditioning production and supply 95.3 101.3 100.5 103.4Electricity, gas, steam and air conditioning production and supply 95.3 101.3 100.5 103.4Industry - total by main industrial groupings:- intermediate goods industry 103.9 102.3 103.1 107.3- capital goods industry 111.4 104.2 105.2 116.3- industria bunurilor de folosinþã îndelungatã 108.6 111.5 113.6 103.0- non-durable consumer goods industry 103.2 99.1 102.4 101.7- energy industry 97.4 101.0 98.7 103.6
Note: For the 2014-2016 period, data were recalculated as result of changing the base year and the weigthing system.

Statistical abstract 69
ENERGY
Primary energythou tonnes oil equivalent 1)
2014 2015 2016 20172)
Resources 40235 40769 40910 42223of which:- production 3) 26314 26387 24798 24883- import 10757 11333 13113 12988
Production 3) 26314 26387 24798 24883of which:- coal 4448 4711 4233 4655- crude oil 3952 3906 3714 3536- natural gas 4) 8854 8874 7862 8224- electric energy 5) 5195 5096 5086 4890
Imports 10757 11333 13113 12988of which:- coal 498 546 521 510- crude oil 6725 6594 7466 7754- natural gas 470 163 1188 944- electric energy 93 325 307 314
1) Conventional fuel with a calorific power of 10000 Kcal/kg.2) Provisional data.3) Including energy products obtained and consumed in households.4) Excluding gasoline and ethane from extraction oil wells, which are included in crude oil.5) Including wind and solar photovoltaic energy .
In 2017, primary energy production recorded an increase compared to theprevious year (+0.3%), while imports recorded a decrease (-1.0%), their share inthe total primary energy resource being of 30.8%; imports of crude oilaccounted for 59.7% of total imports and imports of natural gas decreasecompared to 2016 (-20.5%).
2014 2015 2016 20171)
Resources 66.8 70.1 68.7 67.3Production 65.7 66.3 65.1 63.6- in thermo-power stations 26.9 28.7 26.9 28.1- in hydro-power stations 19.3 17.0 18.5 14.8- in nuclear-electric stations 11.7 11.6 11.3 11.5- wind 2) 7.8 9.0 8.4 9.2Imports 1.1 3.8 3.6 3.7
Destinations - total 66.8 70.1 68.7 67.3Consumption - total 51.5 52.4 53.0 54.6- in economy 39.1 39.7 40.3 42.6- public lighting 0.5 0.6 0.6 0.6- population 11.9 12.1 12.1 11.4Exports 8.2 10.5 8.6 6.6Own technological consumptionin networks and stations 7.1 7.2 7.1 6.11) Provisional data.2) Including solar photovoltaic energy.
billion kWh
Electric energy balance

ROMANIA IN FIGURES70
CONSTRUCTION
Indices of construction works (%)previous year = 100
2014 2015 2016 2017
Construction works - total 93.3 110.6 95.6 94.4
of the total, by structure elements:new construction works 96.8 105.3 97.9 104.7capital repair works 82.1 131.7 76.3 82.3maintenace and current repairs works 91.0 113.6 101.8 74.8
of the total, by type of construction:buildings 121.3 99.0 104.6 114.3
of which:residential buildings 132.6 94.2 112.0 170.4non-residential buildings 116.6 101.2 101.3 87.3civil engineering 78.2 120.3 89.4 78.3
Note: Data resulting from infra-annual statistical surveys.For the 2014-2016 period, data were recalculated as result of changing the base year and the weigthing system.
unadjusted series
Construction works, by manner of performing
�� ��
�� ��
� ��
�� ��
Note: Data on 2017 will be available in November 2018.1) Provisional data.
Structure of construction works on contract, by category of objects
�� ��
�� ��� ��
� �� �� ��
�� ���� ��
� ��
Note: Data on 2017 will be available in November 2018.1) Provisional data.
New constructionand capital repairs
Maintenance andcurrent repairs
2015 2016 1)
2015 2016 1)
Residentialbuildings
Non residentialbuildings
Transportinfrastructures
Other constructionand engineering
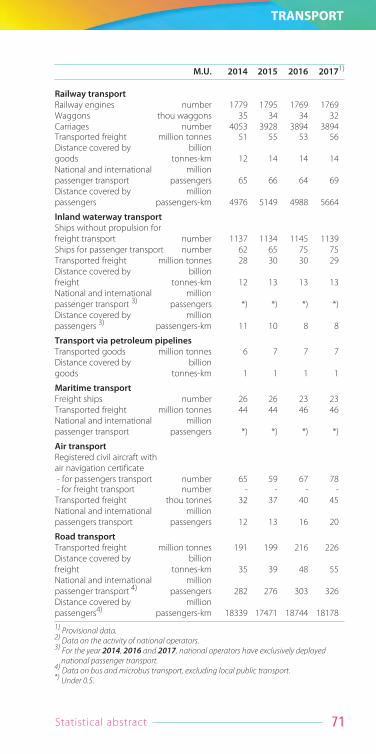
Statistical abstract 71
TRANSPORT
M.U. 2014 2015 2016 20171)
Railway transportRailway engines number 1779 1795 1769 1769Waggons thou waggons 35 34 34 32Carriages number 4053 3928 3894 3894Transported freight million tonnes 51 55 53 56Distance covered by billiongoods tonnes-km 12 14 14 14National and international millionpassenger transport passengers 65 66 64 69Distance covered by millionpassengers passengers-km 4976 5149 4988 5664
Inland waterway transportShips without propulsion for freight transport number 1137 1134 1145 1139Ships for passenger transport number 62 65 75 75Transported freight million tonnes 28 30 30 29Distance covered by billionfreight tonnes-km 12 13 13 13National and international millionpassenger transport 3) passengers *) *) *) *)Distance covered by millionpassengers 3) passengers-km 11 10 8 8
Transport via petroleum pipelinesTransported goods million tonnes 6 7 7 7Distance covered by billiongoods tonnes-km 1 1 1 1
Maritime transportFreight ships number 26 26 23 23Transported freight million tonnes 44 44 46 46National and international millionpassenger transport passengers *) *) *) *)
Air transportRegistered civil aircraft with air navigation certificate- for passengers transport number 65 59 67 78- for freight transport number - - - -
Transported freight thou tonnes 32 37 40 45National and international millionpassengers transport passengers 12 13 16 20
Road transportTransported freight million tonnes 191 199 216 226Distance covered by billionfreight tonnes-km 35 39 48 55National and international millionpassenger transport 4) passengers 282 276 303 326Distance covered by millionpassengers4) passengers-km 18339 17471 18744 181781) Provisional data.2) Data on the activity of national operators.3) For the year 2014, 2016 and 2017, national operators have exclusively deployed
national passenger transport.4) Data on bus and microbus transport, excluding local public transport.*) Under 0.5.

ROMANIA IN FIGURES72
TRANSPORT
In 2017, as compared to 2016, increases were recorded for the transportedgoods for air, railway and road transport, by 12.5%, by 5.7% and by 4.6%,respectively.
Maritime transport and transport via petroleum pipelines registered similarvalues in the volume of goods transported in 2017 and the inland waterwaytransport marked decreases compared to the values recorded in the previousyear.
In 2017 compared to 2016, national and international passenger transport wasmarked by increases in the number of passengers for air, railway and roadtransport, by 25.0%, by 7.8% and 7.6%, respectively, while maritime and inlandwaterways transport recorded constant values.
2014 2015 2016 2017
Maritime transport in harbour 43753 44533 46295 46182- loaded goods 25349 24954 25739 24848- unloaded goods 18404 19579 20556 21334
Inland waterway transport 27834 30020 30484 29043- international 8985 11216 10399 9153- national 14421 13246 14697 14632- transit1) 4428 5558 5388 5258
1) It includes data on the transport between the Bulgarian harbours (transit transport forRomania), in accordance with the European legislation.
thou tonnes
Goods transport on harbour
����
�
���
�����
���
�
��
����
���� ���� ��� �����
��������������������������������������������
thou
embarked passengers
disembarked passengers
Airport passengers transport
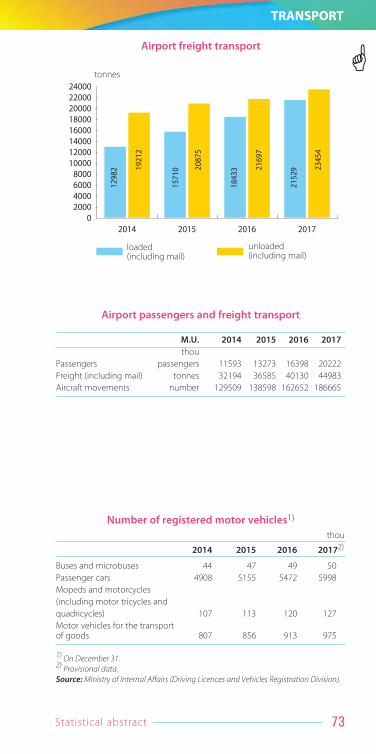
Statistical abstract 73
TRANSPORT
Airport freight transport
�����
����
����
�����
����
�����
����
�����
���� ���� ��� �����
����������������������������������������������������
tonnes
M.U. 2014 2015 2016 2017thou
Passengers passengers 11593 13273 16398 20222Freight (including mail) tonnes 32194 36585 40130 44983Aircraft movements number 129509 138598 162652 186665
Airport passengers and freight transport
2014 2015 2016 20172)
Buses and microbuses 44 47 49 50Passenger cars 4908 5155 5472 5998Mopeds and motorcycles(including motor tricycles and quadricycles) 107 113 120 127Motor vehicles for the transport of goods 807 856 913 975
1) On December 31.2) Provisional data.Source: Ministry of Internal Affairs (Driving Licences and Vehicles Registration Division).
Number of registered motor vehicles1)
loaded(including mail)
unloaded(including mail)
thou

ROMANIA IN FIGURES74
INTERNATIONAL TRADE IN GOODS
2014 2015 20161) 20172)
FOB exportseuro million 52466 54610 57392 62642USD million 69886 60618 63589 70627lei million 233247 242747 257701 286113
CIF importseuro million 58522 62971 67364 75598USD million 77907 69861 74627 85318lei million 260135 279906 302462 345370
Sold (exp. FOB - imp. CIF)euro million -6056 -8361 -9972 -12956USD million -8021 -9243 -11038 -14691lei million -26888 -37159 -44761 -59257
Note : For 2015, the data have been revised and are final.1) Semi-final data.2) Provisional data.
FOB exports registered a value of euro 62642 million (+9.1% compared to2016) in 2017 and CIF imports were euro 75598 million (+12.2% compared to2016), the trade balance (FOB-CIF) being of euro -12956 million.
Exports, imports and balance of internationaltrade in goods operations
'�� '�� '���� '����
����
����
���
����
���
����
�����
���
���� ���� ��� ����'�����'�����'�����
���������������������������������������
����
euro million
Note : For 2015, the data have been revised and are final.1) Semi-final data.2) Provisional data.
FOB exports
Balance (FOB exports - CIF imports)
CIF imports
FOB exports, CIF imports and FOB/CIF balance of international trade in goods operations

Statistical abstract 75
INTERNATIONAL TRADE IN GOODS
International trade in goods by section, according to the Combined Nomenclature euro million
CN code Name of CN code 2014 2015 20161) 20172)
FOB exports E 52466 54610 57392 62642CIF imports I 58522 62971 67364 75598I Live animals and animal E 743 782 814 944
products I 1226 1254 1441 1691II Vegetable products E 3072 3075 3437 3513
I 1514 2037 2329 2371III Animal or vegetable E 213 224 194 211
fats and oils I 164 184 189 192IV Prepared foodstuffs, E 1549 1838 1724 1746
beverages and tobacco I 2218 2580 2830 3144V Mineral products E 3253 2557 2173 2471
I 5786 4381 4157 5388VI Chemical products E 2110 2047 1860 2078
I 5959 6330 6705 7403VII Plastics, rubber and E 2943 3092 3262 3583
articles thereof I 4249 4611 4893 5537VIII Raw hides and skins,
leather, furskins and E 332 364 380 414articles thereof I 845 882 917 1011
IX Wood and articles of wood, E 1855 1809 1642 1655excluding furniture I 440 533 639 703
X Pulp of wood, paper,paperboard and E 352 377 426 489articles thereof I 1004 1063 1145 1185
XI Textiles and textile articles E 3885 3954 4071 4043I 3932 4266 4678 4843
XII Footwear, headgear,umbrellas and similar E 1435 1335 1335 1380articles I 709 692 799 957
XIII Articles of stone, plaster,cement, ceramic, glass E 293 314 346 376and similar materials I 712 795 885 994
XV Base metals and articles E 4696 4697 4486 5329of base metal I 6313 6738 6764 7968
XVI Machinery and mechanicalappliances; electrical equipment; sound andimage recorders and E 13651 15193 16882 17813reproducers I 15978 17918 18954 20962
XVII Vehicles, aircraft, vesselsand associated E 8621 9160 10111 11314transport equipment I 5015 5770 6791 7526
XVIII Optical, photographic, cinematographic, medical or surgical instruments andapparatus and similar; clocks and watches; musicalinstruments; parts and E 771 984 1291 2165accessories thereof I 1152 1432 1472 1733
XX Miscellaneous E 2218 2388 2547 2643manufactured articles I 1136 1313 1556 1700
XXII Goods not elsewhere E 473 423 410 476classified in the CN I 172 190 221 291
Note: The differences between the total data and the data obtained by summing up the different structures used are due to rounding.
1 ) Semi-final data. 2) Provisional data.

ROMANIA IN FIGURES76
INTERNATIONAL TRADE IN GOODS
2014 2015 20161) 20172)
FOB exports 98.5 100.2 98.2 101.6CIF imports 97.6 97.7 97.6 102.9
Note: Data calculated from values expressed in euro.1) Semi-final data.2) Provisional data.
Unit value indices of international trade in goodscalculated based on values expressed in euro (%)
previous year = 100
euro million
2014 2015 20161) 20172)
FOB exports by mode of transport
Total 52466 54610 57392 62642of which:Road transport 36238 39245 42227 46973Maritime transport 10806 10162 9795 9826Railway transport 2459 1983 1888 2059Air transport 1019 1051 1179 1343Inland waterway transport 349 362 438 603
CIF imports by mode of transport
Total 58522 62971 67364 75598of which:Road transport 43375 47629 50751 55861Maritime transport 8940 8574 8761 10494Railway transport 1436 1512 1437 1952Air transport 1980 2179 2493 2879Inland waterway transport 280 386 420 398
1) Semi-final data.2) Provisional data.
International trade in goods, by mode of transport
The main structural changes in the evolution of exports by section of theCombined Nomenclature in 2017 as compared to 2016 consist of: - increases in the shares of the sections "Optical, photographic,cinematographic, medical or surgical instruments and apparatus and similar;clocks and watches; musical instruments; parts and accessories thereof" by 1.2percentage points, "Base metals and articles of base metal" by 0.7 percentagepoints;- decreases in the shares of the sections "Machinery and mechanicalappliances; electrical equipment; sound and image recorders and reproducers"by 1.0 percentage points, "Textiles and textile articles" by 0.6 percentage points.With regard to the evolution of imports by section of the CombinedNomenclature, the following structural changes took place, in 2017 comparedto 2016:- increases in the shares of the sections: "Mineral products" by 0.9% percentagepoints, "Base metals and articles of base metal" by 0.5 percentage points;- decrease in the share of the section: "Textiles and textile articles" by 0.5percentage points.

Statistical abstract 77
INTERNATIONAL TRADE IN GOODS
(FOB) Exportswith the main partner countries, in 20171)
�� ��
�� ��
�
� ��� ��
�� ��
(�����)
*��+)
,���-�
.��/��)"����0�1��/0��
2�����-��������
1) Provisional data.
euro 62642 million
2014 2015 20162) 20173)
Total 52466 54610 57392 62642Europe 44440 46296 48690 54008European Union (UE-28) 37315 40257 43080 47482EFTA 875 813 583 645Other European countries 6250 5226 5027 5882Asia 3835 3992 4241 4142Middle and Near East 2028 2238 2309 2264Other Asian countries 1807 1754 1932 1878Africa 2266 2213 2174 2134North Africa 1716 1787 1709 1563Other African countries 551 427 465 571America 1847 1709 1625 1868of which:North America 1130 1128 1061 1303Central America and the Caribbean 248 230 175 189South America 469 351 389 377Oceania 49 330 588 403Extra-EU not specified countries 4) 29 71 75 87
Note: The differences between the total data and the data obtained by summing up the different structures used are due to rounding.
1) Country of destination for exports.2) Semi-final data.3) Provisional data.4) Includes the goods for which the country of destination for exports has not been filled
in on customs declaration.
euro million
FOB exports, by group of countries 1)

INTERNATIONAL TRADE IN GOODS
ROMANIA IN FIGURES78
(�����)
*��+)
.��/��)
3�+��0
2�����-��������
,���-�
�� ��
�� ��
� ��
� ��
� ��
�� �
1) Provisional data.
(CIF) Importswith the main partner countries, in 20171)
euro 75598 million
CIF imports, by group of countries 1)
2014 2015 20162) 20173)
Total 58522 62971 67364 75598Europe 50325 55049 58908 65652European Union (EU-28) 44124 48598 51951 57279EFTA 583 527 460 518Other European countries 5618 5925 6497 7855Asia 6457 6052 6658 7552Middle and Near East 284 377 506 693Other Asian countries 6174 5675 6152 6859Africa 438 518 523 548North Africa 256 267 340 392Other African countries 182 250 183 156America 1257 1283 1224 1792of which:North America 737 739 710 1209Central America andthe Caribbean 117 130 156 169South America 403 414 358 415Oceania 25 42 38 38Extra-EU not specified countries 4) 19 27 14 16
Note: The differences between the total data and the data obtained by summing up thedifferent structures used are due to rounding.
1) Country of dispatch for intra-Community imports and origin country forextra-Community imports.
2) Semi-final data.3) Provisional data.4) Includes the goods for which the origin country for imports has not been filled
in on customs declaration.
euro million
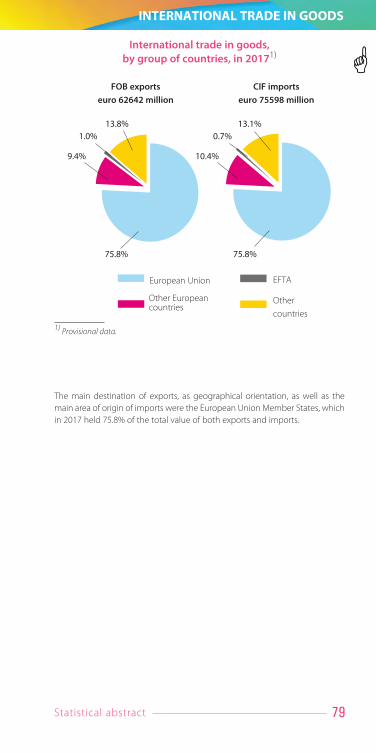
INTERNATIONAL TRADE IN GOODS
Statistical abstract 79
International trade in goods,by group of countries, in 20171)
�� �
� ��
� ���� �
�� �
�� ��
� ���� ��
1) Provisional data.
FOB exportseuro 62642 million
CIF importseuro 75598 million
European Union EFTA
Othercountries
Other Europeancountries
The main destination of exports, as geographical orientation, as well as themain area of origin of imports were the European Union Member States, whichin 2017 held 75.8% of the total value of both exports and imports.

ROMANIA IN FIGURES80
DOMESTIC TRADE
Retail 1), by group of goodslei million current prices
CANE Rev. 2 2014 2015 20162)
Total 199894.6 212500.6 222651.0Food goods 66699.1 72865.5 79062.2Non-food goods 81878.1 91393.0 99225.0Retail of fuels 51317.4 48242.1 44363.8
Note: Data resulting from the Structural Business Survey.Data on 2017 will be available in November 2018.
1) Excluding the sale, maintenance and repair of motor vehicles, motorcycles and the retail of fuels.2) Provisional data.
Turnover volume indices for retail, except motorvehicles and motorcycles, by group of goods
previous year = 100
CANE Rev. 2 2014 2015 2016 2017
Total 106.4 109.5 112.4 110.8Predominant sales of food goods,beverages and tobacco 105.3 119.4 113.7 106.5Predominant sales of non-food goods 110.8 103.2 113.4 114.0Retail of fuels for motor vehicles,in specialised stores 100.3 107.3 108.6 112.3
Note: Data resulting from infra-annual statistical surveys.For the 2014-2016 period, data were recalculated as result of changing the base year and the weigthing system.
In 2017, the volume indices of turnover in enterprises whose main activity isretail, except motor vehicles and motorcycles, increased by 10.8% comparedto 2016, due to the rises reported for predominant sales of non-food goods(+14.0), the retail of fuels for motor vehicles (+12.3%) and for food goods,beverages and tobacco (+6.5%).
�� ��
�� �
�� ���� ��
�� ��
�� ��
Note: Data on 2017 will be available in November 2018.1) Excluding the sale, maintenance and repair of motor vehicles and motorcycles.2)Provisional data.
2015 2016 2)
Retail 1), by group of goods
Food goods
Non-food goods
Retail of fuels

Statistical abstract 81
MARKET SERVICES
CANE Rev. 2 2014 2015 2016 2017
Total 99.7 112.2 105.2 115.3of which:Hotels and restaurants 100.9 111.2 112.7 114.2Travel agency andtour operator services;tourist assistance services 98.5 123.5 97.7 112.2
Note: Data resulting from infra-annual statistical surveys.1) Data were recalculated as result of changing the base year and the weighting system.
Turnover volume indices for market services mainlyrendered to the population
previous year = 100
In 2017, the market services mainly rendered to the population increased by15.3% compared to the previous year.
�� ��
� �
�� ��
�� �� �� �
� ��
�� ��
�� ��
Note: Data on 2017 will be available in November 2018.1) Provisional data.
2015 20161)
Market services mainly renderend to the population,by activity
Restaurants
Hotels and other similaraccommodation facilities
Travel agency and touroperator services
Other market services mainlyrendered to the population
Unadjusted series
CANE Rev. 2 2014 2015 20161)
Market services mainly rendered to the population 20768.4 23167.8 25108.0Market services mainly rendered to economic operators 220479.0 239515.4 247705.8
Note: Data resulting from the Structural Business Survey.Data on 2017 will be available in November 2018.
1) Provisional data.
Income from market service activities
lei million current prices
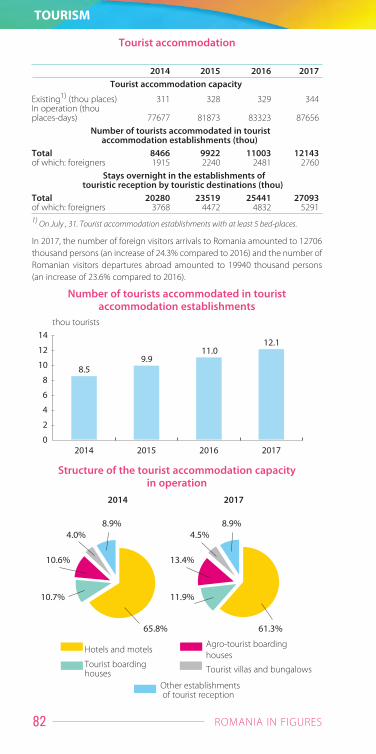
ROMANIA IN FIGURES82
TOURISM
Tourist accommodation
2014 2015 2016 2017Tourist accommodation capacity
Existing1) (thou places) 311 328 329 344In operation (thou places-days) 77677 81873 83323 87656
Number of tourists accommodated in touristaccommodation establishments (thou)
Total 8466 9922 11003 12143of which: foreigners 1915 2240 2481 2760
Stays overnight in the establishments of touristic reception by touristic destinations (thou)
Total 20280 23519 25441 27093of which: foreigners 3768 4472 4832 52911) On July , 31. Tourist accommodation establishments with at least 5 bed-places.
In 2017, the number of foreign visitors arrivals to Romania amounted to 12706thousand persons (an increase of 24.3% compared to 2016) and the number ofRomanian visitors departures abroad amounted to 19940 thousand persons(an increase of 23.6% compared to 2016).
Structure of the tourist accommodation capacityin operation
� �
�� ��
�� �
� �� ��
� ��
�� ��
�� ��
� �� ��
2014 2017
Hotels and motels
Tourist boardinghouses
Agro-tourist boardinghouses
Tourist villas and bungalows
Other establishmentsof tourist reception
Number of tourists accommodated in touristaccommodation establishments
�� �
�� ��� �
���� ���� ��� �����
�
�
��
��
��thou tourists

Statistical abstract 83
TOURISM
���� ���� ��� �����
����
����
���
���
�����
�����
�����
����
����
�����
����
���
���� �
��
����� �����
����
thou
Arrivals Departures
2014 2015 2016 2017
Arrivals of foreign visitors to Romania (thou)
Total 8442 9331 10223 12706of which:
Austria 202 180 142 174Bulgaria 1209 1524 1527 1668Italy 355 324 425 685Germany 470 438 466 614Republic of Moldova 1277 1633 1918 2079Turkey 255 301 327 405Ukraine 716 823 1055 1220Hungary 1495 1662 1562 1472
Arrivals of foreign visitors to Romania,by means of transport used (thou)
Total 8442 9331 10223 12706of which:
Road 6390 7475 7677 8008Railway 173 143 123 118Air 1690 1535 2256 4419Waterways 189 178 167 161
Departures of Romanian visitors abroad, bymeans of transport used (thou)
Total 12299 13118 16128 19940of which:
Road 9362 10245 11101 13822Railway 158 135 96 95Air 2756 2712 4906 5999Waterways 23 26 25 24
Note: Since 2009, the international trips registered at Romanian borders also include the trips on foot.
Source: Ministry of Internal Affairs, Romanian Border Police General Inspectorate.
International trips registered at Romanian borders
International trips registered at Romanian borders

ROMANIA IN FIGURES84
JUSTICE
number
2014 2015 2016 20171)
Judges (number) 4438 4504 4285 4063Actions which entered the Courts of Justice (thou) 2272 2033 2175 1836- penal (thou) 320 299 421 382- civil (thou) 1952 1734 1754 1454Persons definitively convicted 40832 42276 32720 35543of which, for:Offences against the person 6527 6426 5744 6118Offences against the patrimony 2) 15429 15684 7661 7594Forest offences 1045 1156 455 519Work-related offences, of which: 403 419 949 1103- giving a bribe 64 69 98 108- taking a bribe 72 81 143 165- trading of Influence 95 112 118 125Offences against the authorities 323 309 357 698Economic offences 19 12 13683) 16393)
Offences causing damageto social cohabitation relations 1597 1602 1509 1405Offences against traffic regulations 11200 12137 10839 12559Criminality rate 4)
(persons definitively convictedper 100000 inhabitants) 205 213 166 181
1) Provisional data.2) Offences against private and public assets.3) Starting with 2016, the data are no longer comparable to previous years becausereporting is done under the new Penal Code and other laws. 4) To calculate the criminality rate for the 2014-2016 period, the usually residentpopulation on July 1st of each year was used, population estimated under conditions of comparability with the final results of the Population and Housing Census 2011.In 2017, for criminality rate calculation the usually resident population on January 1st
used, estimated under conditions of comparability with the final results of the Population and Housing Census 2011.
Source: Superior Council of Magistracy.
In 2017, in Romania there were 4063 judges, 222 less than previous year anddecreasing with 375 judges as against 2014.
Of the total actions registered by the Courts of Justice in 2017 (1836 thousandcases), 1454 thousands (79.2%) were civil actions. The average number of penaland civil actions was 452 per judge in 2017, 56 actions less than in 2016,respectively 60 actions less than in 2014.
During 2014-2017, the number of definitively convicted persons per 100000inhabitants decreased from 205 in 2014 to 181 in 2017.
2014 2015 2016 20171)
Offences - total (thou) 2) 401 342 338 335Criminality rate 2);3)
(offences per 100000 inhabitants) 2014 1726 1716 17061) Provisional data.2) The offences investigated and solved by the Police, as well as those for which the
responsability is thrown to the Prosecutor's Office are included.3) To calculate the criminality rate for the 2014-2016 period, the usually resident
population on July 1st of each year was used, population estimated under conditions of comparability with the final results of the Population and Housing Census 2011.In 2017, for criminality rate calculation the usually resident population on January 1st
used, estimated under conditions of comparability with the final results of the Population and Housing Census 2011.
Source: Romanian Police General Inspectorate within the Ministry of Internal Affairs.
number

Statistical abstract 85
JUSTICE
��
���
��� �� ���
���� ���� ��� �����
���
���
���
���
���
1) The offences investigated and solved by the Police, as well as those for which the responsability is thrown to the Prosecutor's Office are included.
2) Provisional data.
Offences investigated and solved by the Police
offences 1)
(thou)
����
��� ��� ���
���� ���� ��� �����
����
���
���
����
����
��
�
1) Offences investigated and solved by the Police are included, as well as offences declined by Police to the Prosecutor’s Office, per100000 inhabitants. In order to calculate the offence rate for the 2014-2016 period, the usually residentpopulation on July 1st of each year was used, and for 2017 the usually resident population on January 1st was used, populations estimated under conditions of comparability with the final results of the Population and Housing Census 2011.2) Provisional data.
Offences rate 1)
The number of offences solved and declined by the Police to the Prosecutor'sOffice in 2017 was 335 thousand offences, a decrease with 3 thousand offencesagainst the previous year and with 66 thousand offences (16.5%) as against2014.In 2017, 1706 offenses (solved and declined by the Police to the Prosecutor'sOffice) were recorded on by 100000 inhabitants, as compared to 2014 offenceson 100000 inhabitants in 2014.
offences number per 100000 inhabitants

ROMANIA IN FIGURES86
INTERNATIONAL STATISTICS
Population, on January 1st
Country 2000 2010 2015 2017
Total
EU-28 487.31) 503.21) 508.51);2) 511.51);3)
EU-27 482.81) 498.91) 504.31);2) 507.41);3)
Austria 8.0 8.4 8.6 8.8Belgium 10.2 10.8 11.2 11.4Bulgaria 8.2 7.4 7.2 7.1Czech Republic 10.3 10.5 10.5 10.6Cyprus 0.7 0.8 0.8 0.9Croatia 4.52) 4.3 4.2 4.2Denmark 5.3 5.5 5.7 5.7Estonia 1.4 1.3 1.31) 1.3Finland 5.2 5.4 5.5 5.5France 60.5 64.7 66.51) 67.03)
Germany 82.2 81.8 81.2 82.5Greece 10.8 11.1 10.9 10.8Ireland 3.8 4.5 4.7 4.8Italy 56.9 59.2 60.8 60.6Latvia 2.4 2.1 2.0 2.0Lithuania 3.5 3.1 2.9 2.8Luxembourg 0.4 0.5 0.6 0.61)
Malta 0.4 0.4 0.4 0.5Netherlands 15.9 16.6 16.9 17.1Poland 38.31) 38.01) 38.0 38.0Portugal 10.2 10.6 10.4 10.3United Kingdom 58.8 62.5 64.92) 65.8Romania4) 22.51) 20.3 19.9 19.6Slovakia 5.4 5.4 5.4 5.4Slovenia 2.0 2.0 2.1 2.1Spain 40.5 46.5 46.4 46.5Sweden 8.9 9.3 9.7 10.0Hungary 10.2 10.0 9.9 9.8
1) Break in the series.2) Estimates.3) Provisional data.4)Data for 2010, 2015, 2017 refers to the usually resident population in accordance with
international requirements and regulations.Source: Eurostat.
Statistical abstract 87
INTERNATIONAL STATISTICS
(million inhabitants)2000 2010 2015 2017
of which: women
250.11) 257.71) 260.31);2) 261.51);3)
247.81) 255.41) 258.11);2) 259.31);3)
4.1 4.3 4.4 4.55.2 5.5 5.7 5.84.2 3.8 3.7 3.75.3 5.3 5.4 5.40.4 0.4 0.4 0.42.32) 2.2 2.2 2.12.7 2.8 2.8 2.90.7 0.7 0.71) 0.72.6 2.7 2.8 2.8
31.2 33.4 34.31) 34.63)
42.1 41.7 41.4 41.85.5 5.7 5.6 5.51.9 2.3 2.4 2.4
29.4 30.5 31.3 31.11.3 1.1 1.1 1.11.9 1.7 1.6 1.50.2 0.3 0.3 0.31)
0.2 0.2 0.2 0.28.0 8.4 8.5 8.6
19.71) 19.61) 19.6 19.65.3 5.5 5.5 5.4
30.2 31.8 32.92) 33.211.51) 10.4 10.2 10.0
2.8 2.8 2.8 2.81.0 1.0 1.0 1.0
20.6 23.5 23.6 23.74.5 4.7 4.9 5.05.4 5.3 5.2 5.1
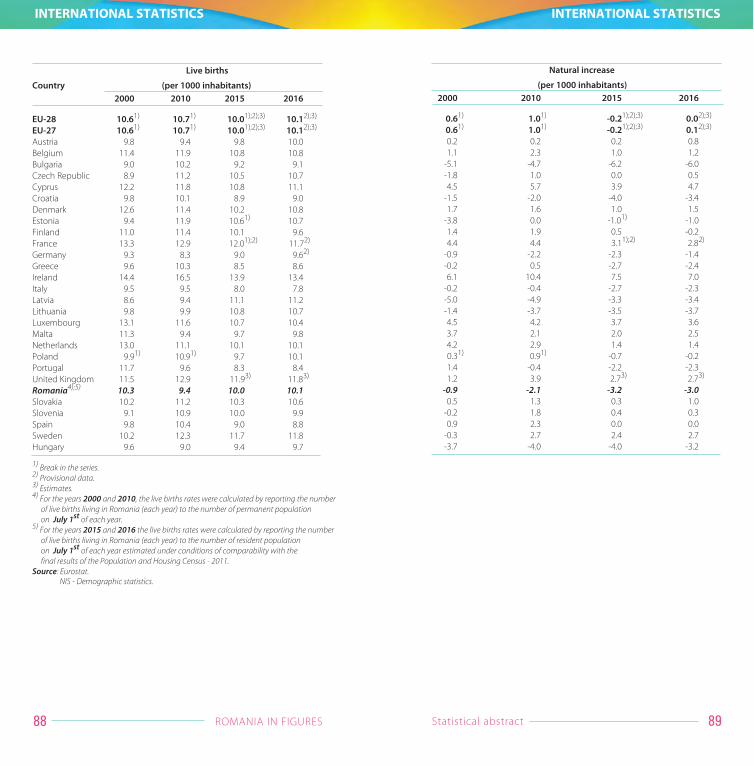
Live births
Country (per 1000 inhabitants)2000 2010 2015 2016
EU-28 10.61) 10.71) 10.01);2);3) 10.12);3)
EU-27 10.61) 10.71) 10.01);2);3) 10.12);3)
Austria 9.8 9.4 9.8 10.0Belgium 11.4 11.9 10.8 10.8Bulgaria 9.0 10.2 9.2 9.1Czech Republic 8.9 11.2 10.5 10.7Cyprus 12.2 11.8 10.8 11.1Croatia 9.8 10.1 8.9 9.0Denmark 12.6 11.4 10.2 10.8Estonia 9.4 11.9 10.61) 10.7Finland 11.0 11.4 10.1 9.6France 13.3 12.9 12.01);2) 11.72)
Germany 9.3 8.3 9.0 9.62)
Greece 9.6 10.3 8.5 8.6Ireland 14.4 16.5 13.9 13.4Italy 9.5 9.5 8.0 7.8Latvia 8.6 9.4 11.1 11.2Lithuania 9.8 9.9 10.8 10.7Luxembourg 13.1 11.6 10.7 10.4Malta 11.3 9.4 9.7 9.8Netherlands 13.0 11.1 10.1 10.1Poland 9.91) 10.91) 9.7 10.1Portugal 11.7 9.6 8.3 8.4United Kingdom 11.5 12.9 11.93) 11.83)
Romania4);5) 10.3 9.4 10.0 10.1Slovakia 10.2 11.2 10.3 10.6Slovenia 9.1 10.9 10.0 9.9Spain 9.8 10.4 9.0 8.8Sweden 10.2 12.3 11.7 11.8Hungary 9.6 9.0 9.4 9.7
1) Break in the series.2) Provisional data.3) Estimates.4) For the years 2000 and 2010, the live births rates were calculated by reporting the number
of live births living in Romania (each year) to the number of permanent population on July 1st of each year.
5) For the years 2015 and 2016 the live births rates were calculated by reporting the number of live births living in Romania (each year) to the number of resident population on July 1st of each year estimated under conditions of comparability with the final results of the Population and Housing Census - 2011.
Source: Eurostat.NIS - Demographic statistics.
ROMANIA IN FIGURES88
INTERNATIONAL STATISTICS
Natural increase
(per 1000 inhabitants)2000 2010 2015 2016
0.61) 1.01) -0.21);2);3) 0.02);3)
0.61) 1.01) -0.21);2);3) 0.12);3)
0.2 0.2 0.2 0.81.1 2.3 1.0 1.2
-5.1 -4.7 -6.2 -6.0-1.8 1.0 0.0 0.54.5 5.7 3.9 4.7
-1.5 -2.0 -4.0 -3.41.7 1.6 1.0 1.5
-3.8 0.0 -1.01) -1.01.4 1.9 0.5 -0.24.4 4.4 3.11);2) 2.82)
-0.9 -2.2 -2.3 -1.4-0.2 0.5 -2.7 -2.46.1 10.4 7.5 7.0
-0.2 -0.4 -2.7 -2.3-5.0 -4.9 -3.3 -3.4-1.4 -3.7 -3.5 -3.74.5 4.2 3.7 3.63.7 2.1 2.0 2.54.2 2.9 1.4 1.40.31) 0.91) -0.7 -0.21.4 -0.4 -2.2 -2.31.2 3.9 2.73) 2.73)
-0.9 -2.1 -3.2 -3.00.5 1.3 0.3 1.0
-0.2 1.8 0.4 0.30.9 2.3 0.0 0.0
-0.3 2.7 2.4 2.7-3.7 -4.0 -4.0 -3.2
Statistical abstract 89
INTERNATIONAL STATISTICS

ROMANIA IN FIGURES90
Average life expectancy (years)
INTERNATIONAL STATISTICS
Country 2010 2015 2016
EU-28 79.91) 80.61);2);3) 81.02);3)
EU-27 80.01) 80.61);2);3) 81.02);3)
Austria 80.7 81.3 81.8Belgium 80.3 81.1 81.5Bulgaria 73.8 74.7 74.9Czech Republic 77.7 78.7 79.1Cyprus 81.5 81.8 82.7Croatia 76.7 77.5 78.2Denmark 79.3 80.8 80.9Estonia 76.0 78.01) 78.0Finland 80.2 81.6 81.5France 81.8 82.41);3) 82.73)
Germany 80.5 80.7 81.0Greece 80.6 81.1 81.5Ireland 80.8 81.5 81.8Italy 82.2 82.7 83.4Latvia 73.1 74.8 74.9Lithuania 73.3 74.6 74.9Luxembourg 80.8 82.4 82.7Malta 81.5 82.0 82.6Netherlands 81.0 81.6 81.7Poland 76.41) 77.5 78.0Portugal 80.1 81.3 81.3United Kingdom 80.6 81.02) 81.22)
Romania 73.9 75.4 75.6Slovakia 75.6 76.7 77.3Slovenia 79.8 80.9 81.2Spain 82.4 83.0 83.5Sweden 81.6 82.2 82.4Hungary 74.7 75.7 76.2
1) Break in the series.2) Estimates.3) Provisional data.Source: Eurostat.
NIS - Demographic statistics.

Statistical abstract 91
Yearly average inflation rate (%)
INTERNATIONAL STATISTICS
Country 2000 2010 2015 2017
EU-28 1.9 2.1 0.0 1.7EU-27 … … … …Austria 2.0 1.7 0.8 2.2Belgium 2.7 2.3 0.6 2.2Bulgaria 10.3 3.0 -1.1 1.2Czech Republic 3.9 1.2 0.3 2.4Cyprus 4.9 2.6 -1.5 0.7Croatia 4.5 1.1 -0.3 1.3Denmark 2.8 2.2 0.2 1.1Estonia 3.9 2.7 0.1 3.7Finland 3.0 1.7 -0.2 0.8France 1.8 1.7 0.1 1.2Germany 1.4 1.1 0.1 1.7Greece 2.9 4.7 -1.1 1.1Ireland 5.3 -1.6 0.0 0.3Italy 2.6 1.6 0.1 1.3Latvia 2.6 -1.2 0.2 2.9Lithuania 1.1 1.2 -0.7 3.7Luxembourg 3.8 2.8 0.1 2.1Malta 3.0 2.0 1.2 1.3Netherlands 2.3 0.9 0.2 1.3Poland 10.1 2.6 -0.7 1.6Portugal 2.8 1.4 0.5 1.6United Kingdom 0.8 3.3 0.0 2.7Romania 45.7 6.1 -0.4 1.1Slovakia 12.2 0.7 -0.3 1.4Slovenia 9.0 2.1 -0.8 1.6Spain 3.5 2.0 -0.6 2.0Sweden 1.3 1.9 0.7 1.9Hungary 10.0 4.7 0.1 2.4
... = Data not available.Source: Eurostat.
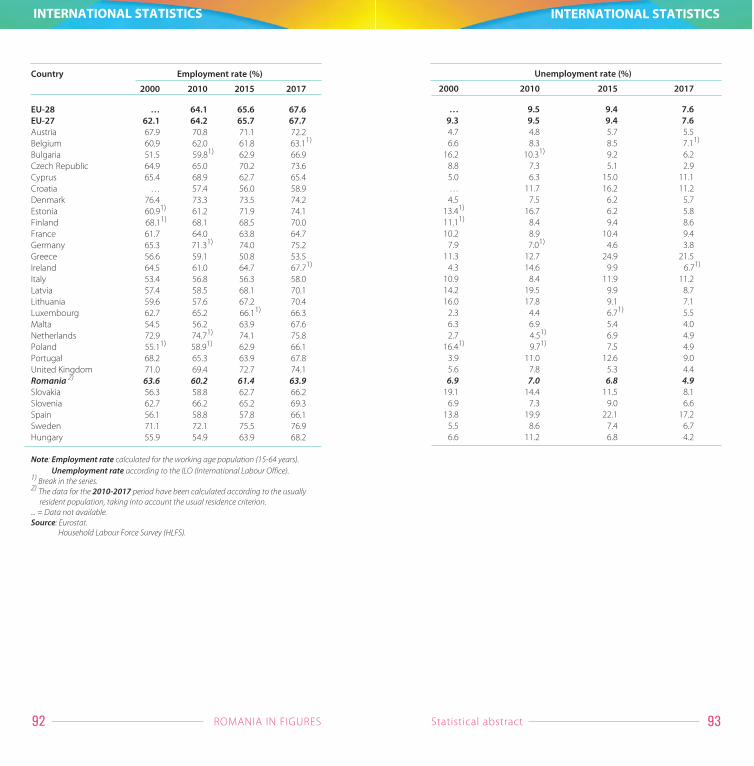
ROMANIA IN FIGURES92
INTERNATIONAL STATISTICS
Country Employment rate (%)
2000 2010 2015 2017
EU-28 … 64.1 65.6 67.6EU-27 62.1 64.2 65.7 67.7Austria 67.9 70.8 71.1 72.2Belgium 60.9 62.0 61.8 63.11)
Bulgaria 51.5 59.81) 62.9 66.9Czech Republic 64.9 65.0 70.2 73.6Cyprus 65.4 68.9 62.7 65.4Croatia … 57.4 56.0 58.9Denmark 76.4 73.3 73.5 74.2Estonia 60.91) 61.2 71.9 74.1Finland 68.11) 68.1 68.5 70.0France 61.7 64.0 63.8 64.7Germany 65.3 71.31) 74.0 75.2Greece 56.6 59.1 50.8 53.5Ireland 64.5 61.0 64.7 67.71)
Italy 53.4 56.8 56.3 58.0Latvia 57.4 58.5 68.1 70.1Lithuania 59.6 57.6 67.2 70.4Luxembourg 62.7 65.2 66.11) 66.3Malta 54.5 56.2 63.9 67.6Netherlands 72.9 74.71) 74.1 75.8Poland 55.11) 58.91) 62.9 66.1Portugal 68.2 65.3 63.9 67.8United Kingdom 71.0 69.4 72.7 74.1Romania 2) 63.6 60.2 61.4 63.9Slovakia 56.3 58.8 62.7 66.2Slovenia 62.7 66.2 65.2 69.3Spain 56.1 58.8 57.8 66.1Sweden 71.1 72.1 75.5 76.9Hungary 55.9 54.9 63.9 68.2
Note: Employment rate calculated for the working age population (15-64 years).Unemployment rate according to the ILO (International Labour Office).
1) Break in the series.2) The data for the 2010-2017 period have been calculated according to the usually
resident population, taking into account the usual residence criterion.... = Data not available.Source: Eurostat.
Household Labour Force Survey (HLFS).
Statistical abstract 93
INTERNATIONAL STATISTICS
Unemployment rate (%)
2000 2010 2015 2017
… 9.5 9.4 7.69.3 9.5 9.4 7.64.7 4.8 5.7 5.56.6 8.3 8.5 7.11)
16.2 10.31) 9.2 6.28.8 7.3 5.1 2.95.0 6.3 15.0 11.1… 11.7 16.2 11.24.5 7.5 6.2 5.7
13.41) 16.7 6.2 5.811.11) 8.4 9.4 8.610.2 8.9 10.4 9.4
7.9 7.01) 4.6 3.811.3 12.7 24.9 21.5
4.3 14.6 9.9 6.71)
10.9 8.4 11.9 11.214.2 19.5 9.9 8.716.0 17.8 9.1 7.1
2.3 4.4 6.71) 5.56.3 6.9 5.4 4.02.7 4.51) 6.9 4.9
16.41) 9.71) 7.5 4.93.9 11.0 12.6 9.05.6 7.8 5.3 4.46.9 7.0 6.8 4.9
19.1 14.4 11.5 8.16.9 7.3 9.0 6.6
13.8 19.9 22.1 17.25.5 8.6 7.4 6.76.6 11.2 6.8 4.2

ROMANIA IN FIGURES94
INTERNATIONAL STATISTICS
Share of the research and development expenditurein the gross domestic product (%)
Country 2000 2010 2015 2016
EU-28 1.771) 1.93 2.04 2.032)
EU-27 … … … …Austria 1.891) 2.731) 3.05 3.092)
Belgium 1.92 2.05 2.47 2.492)
Bulgaria 0.50 0.56 0.96 0.78Czech Republic 1.11 1.34 1.93 1.682)
Cyprus 0.23 0.45 0.48 0.502)
Croatia … 0.74 0.84 0.852)
Denmark 2.19 2.92 2.962) 2.871)
Estonia 0.60 1.58 1.49 1.28Finland 3.25 3.73 2.90 2.75France 2.083) 2.183) 2.272) 2.252)
Germany 2.39 2.71 2.92 2.941)
Greece … 0.601) 0.97 1.01Ireland 1.09 1.591) 1.20 1.181)
Italy 1.01 1.22 1.34 1.292)
Latvia 0.44 0.61 0.63 0.44Lithuania 0.58 0.78 1.04 0.85Luxembourg 1.58 1.50 1.27 1.242)
Malta … 0.61 0.77 0.612)
Netherlands 1.81 1.72 2.00 2.032)
Poland 0.64 0.72 1.00 0.972)
Portugal 0.721) 1.53 1.24 1.272)
United Kingdom 1.63 1.671) 1.67 1.692)
Romania 0.37 0.45 0.49 0.484)
Slovakia 0.64 0.62 1.18 0.79Slovenia 1.36 2.06 2.20 2.002)
Spain 0.89 1.35 1.22 1.19Sweden … 3.221) 3.27 3.252)
Hungary 0.79 1.14 1.36 1.21
1) Estimates.2) Provisional data.3) Break in the series.4) Semi-final data. ... = Data not available.Source: Eurostat.
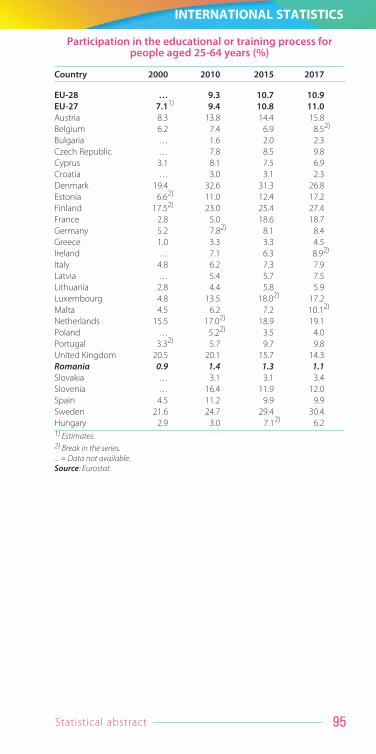
Statistical abstract 95
INTERNATIONAL STATISTICS
Participation in the educational or training process forpeople aged 25-64 years (%)
Country 2000 2010 2015 2017
EU-28 … 9.3 10.7 10.9EU-27 7.11) 9.4 10.8 11.0Austria 8.3 13.8 14.4 15.8Belgium 6.2 7.4 6.9 8.52)
Bulgaria … 1.6 2.0 2.3Czech Republic … 7.8 8.5 9.8Cyprus 3.1 8.1 7.5 6.9Croatia … 3.0 3.1 2.3Denmark 19.4 32.6 31.3 26.8Estonia 6.62) 11.0 12.4 17.2Finland 17.52) 23.0 25.4 27.4France 2.8 5.0 18.6 18.7Germany 5.2 7.82) 8.1 8.4Greece 1.0 3.3 3.3 4.5Ireland … 7.1 6.3 8.92)
Italy 4.8 6.2 7.3 7.9Latvia … 5.4 5.7 7.5Lithuania 2.8 4.4 5.8 5.9Luxembourg 4.8 13.5 18.02) 17.2Malta 4.5 6.2 7.2 10.12)
Netherlands 15.5 17.02) 18.9 19.1Poland … 5.22) 3.5 4.0Portugal 3.32) 5.7 9.7 9.8United Kingdom 20.5 20.1 15.7 14.3Romania 0.9 1.4 1.3 1.1Slovakia … 3.1 3.1 3.4Slovenia … 16.4 11.9 12.0Spain 4.5 11.2 9.9 9.9Sweden 21.6 24.7 29.4 30.4Hungary 2.9 3.0 7.12) 6.21) Estimates.2) Break in the series. ... = Data not available. Source: Eurostat.

ROMANIA IN FIGURES96
INTERNATIONAL STATISTICS
Share of households with Internet access (%)
Country 2010 2015 2016 2017
EU-28 70 83 85 87EU-27 70 83 85 87Austria 73 82 85 89Belgium 73 82 85 86Bulgaria 33 59 64 67Czech Republic 61 79 82 83Cyprus 54 71 74 79Croatia 56 77 77 76Denmark 86 92 94 97Estonia 67 88 86 88Finland 81 90 92 94France 74 83 86 86Germany 82 90 92 93Greece 46 68 69 71Ireland 72 85 87 88Italy 59 75 79 81Latvia 60 76 771) 79Lithuania 61 68 72 75Luxembourg 90 97 97 97Malta 70 82 82 85Netherlands 91 96 97 98Poland 63 76 80 82Portugal 54 70 74 77United Kingdom 80 91 93 94Romania 421) 68 72 76Slovakia 67 79 81 81Slovenia 68 78 78 82Spain 58 79 82 83Sweden 88 91 941) 95Hungary 58 76 79 82
1) Break in the series.Source: Eurostat.
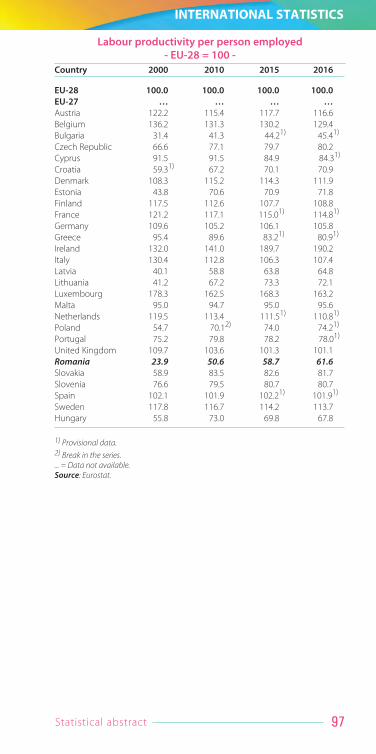
Statistical abstract 97
INTERNATIONAL STATISTICS
Labour productivity per person employed - EU-28 = 100 -
Country 2000 2010 2015 2016
EU-28 100.0 100.0 100.0 100.0EU-27 … … … …Austria 122.2 115.4 117.7 116.6Belgium 136.2 131.3 130.2 129.4Bulgaria 31.4 41.3 44.21) 45.41)
Czech Republic 66.6 77.1 79.7 80.2Cyprus 91.5 91.5 84.9 84.31)
Croatia 59.31) 67.2 70.1 70.9Denmark 108.3 115.2 114.3 111.9Estonia 43.8 70.6 70.9 71.8Finland 117.5 112.6 107.7 108.8France 121.2 117.1 115.01) 114.81)
Germany 109.6 105.2 106.1 105.8Greece 95.4 89.6 83.21) 80.91)
Ireland 132.0 141.0 189.7 190.2Italy 130.4 112.8 106.3 107.4Latvia 40.1 58.8 63.8 64.8Lithuania 41.2 67.2 73.3 72.1Luxembourg 178.3 162.5 168.3 163.2Malta 95.0 94.7 95.0 95.6Netherlands 119.5 113.4 111.51) 110.81)
Poland 54.7 70.12) 74.0 74.21)
Portugal 75.2 79.8 78.2 78.01)
United Kingdom 109.7 103.6 101.3 101.1Romania 23.9 50.6 58.7 61.6Slovakia 58.9 83.5 82.6 81.7Slovenia 76.6 79.5 80.7 80.7Spain 102.1 101.9 102.21) 101.91)
Sweden 117.8 116.7 114.2 113.7Hungary 55.8 73.0 69.8 67.8
1) Provisional data.2) Break in the series.... = Data not available.Source: Eurostat.

ROMANIA IN FIGURES98
INTERNATIONAL STATISTICS
Agricultural production indices
Country 2000 2010 2015 20171)
EU-28 … 99.5 99.2 100.6EU-27 … 99.5 99.2 100.7Austria 96.0 98.1 98.9 100.8Belgium 106.3 99.4 105.4 104.5Bulgaria 90.1 94.0 91.8 99.5Czech Republic 94.4 93.0 95.2 91.4Cyprus 0.0 100.9 109.1 108.3Croatia … 93.3 102.9 94.0Denmark 101.4 97.6 98.4 99.0Estonia 113.7 96.0 108.7 109.5Finland 105.5 96.3 101.8 101.7France 99.3 97.9 98.6 102.3Germany 99.2 100.2 94.2 100.6Greece 100.4 99.4 97.2 101.9Ireland 98.4 106.0 104.7 103.2Italy 98.2 99.8 102.8 97.1Latvia 107.1 97.6 114.0 100.0Lithuania 95.9 92.8 108.6 101.0Luxembourg 99.0 96.4 92.5 99.6Malta … 100.5 95.9 100.8Netherlands 101.2 101.2 101.0 100.7Poland 96.1 96.7 97.4 102.8Portugal 93.7 100.9 106.3 103.8United Kingdom 95.8 101.4 100.7 102.1Romania 85.2 101.0 93.2 114.7Slovakia 90.0 91.8 96.8 91.1Slovenia 101.1 100.7 106.3 90.6Spain 108.0 103.5 100.2 96.9Sweden 101.3 100.0 102.4 101.1Hungary 94.3 88.9 97.6 94.8
1) Estimates.... = Data not available.Source: Eurostat.
previous year = 100

Statistical abstract 99
INTERNATIONAL STATISTICS
Industrial production indices Indices of(total industry, excluding construction
Country construction) works
2016 2017 2016 2017
EU-28 101.7 105.0 102.5 106.6EU-27 … … … …Austria 102.9 107.6 102.4 108.2Belgium 104.61) 107.81) 100.3 101.0Bulgaria 102.7 106.6 83.5 87.41)
Czech Republic 103.2 110.4 94.2 97.5Cyprus 109.1 117.2 109.0 132.9Croatia 105.0 107.0 102.4 103.91)
Denmark 103.8 106.1 104.4 109.1Estonia 103.0 111.2 104.6 123.1Finland 103.8 108.2 105.42) 111.12)
France 100.3 102.7 99.8 102.7Germany 101.0 104.3 105.3 108.7Greece 102.61) 107.51) 122.9 104.91)
Ireland c c 118.3 138.91)
Italy 101.9 105.6 99.9 100.7Latvia 104.9 113.8 82.2 98.1Lithuania 102.8 109.7 90.4 99.1Luxembourg 100.5 103.01) 103.3 104.61)
Malta 1) 95.4 99.3 96.2 108.7Netherlands 102.2 104.31) 106.91) 113.61)
Poland 102.8 109.9 85.5 97.6Portugal 102.4 106.1 96.2 98.3United Kingdom 101.4 103.5 103.91) 109.81)
Romania 1) 104.2 113.2 93.3 91.4Slovakia 103.7 106.9 89.0 92.2Slovenia 107.1 116.41) 82.3 96.91)
Spain 1) 101.7 105.0 105.1 103.3Sweden 101.3 106.1 109.4 117.7Hungary 100.7 106.3 81.1 105.1
Note: Series adjusted by number of working days, according to CANE Rev. 2.1) Provisional data.2) Estimates.... = Data not available.Source: Eurostat.c = Confidential data.
2015 = 100

ROMANIA IN FIGURES100
INTERNATIONAL STATISTICS
Gross domestic product/inhabitant (in PPS1))Country
2000 2010 2015 2016
EU-28 19800 25500 29000 29100EU-27 19900 25600 29100 29200Austria 25700 32100 37700 37200Belgium 24500 30600 34400 34300Bulgaria 5600 11400 13700 14200Czech Republic 14200 21100 25300 25600Cyprus 18700 25400 23800 24100Croatia 9400 15100 17200 17400Denmark 25100 32900 36800 36100Estonia 8200 16500 21700 21900Finland 23400 29600 31800 31900France 23000 27500 30600 30400Germany 24100 30500 36100 36000Greece 17100 21500 20200 19700Ireland 26500 33100 52400 53300Italy 23700 26500 27700 28200Latvia 7000 13400 18500 18800Lithuania 7400 15400 21700 22000Luxembourg 48400 65400 77400 75100Malta 16000 21300 27100 27900Netherlands 27700 34100 37400 37200Poland 9300 15900 19800 19900Portugal 16500 20900 22300 22500United Kingdom 23000 27400 31400 31300Romania 5200 13100 16500 16900Slovakia 9900 19000 22300 22400Slovenia 15800 21200 23800 24100Spain 18900 24400 26300 26700Sweden 25700 31800 36200 36000Hungary 10400 16500 19800 19700
1) PPS = The PPS (Purchasing Power Standard) represents the reference currencyestablished at the level of the European Union in order to express the results of the European Comparison Programme and it is a conventional currency unitwhich excludes the influence of the differences among countries in termsof price level.
2) Provisional data.3) Estimates.... = Data not available.Source: Eurostat.

Statistical abstract 101
INTERNATIONAL STATISTICS
GDP growth rate (%)Country (previous year = 100)
2000 2010 2015 2016 2017
EU-28 3.8 2.1 2.3 2.0 2.4EU-27 … … … … …Austria 3.4 1.8 1.1 1.5 2.9Belgium 3.6 2.7 1.4 1.4 1.7Bulgaria 4.9 1.3 3.6 3.9 3.62)
Czech Republic 4.3 2.3 5.3 2.6 4.4Cyprus 5.7 1.3 2.0 3.42) 3.92)
Croatia 3.8 -1.4 2.3 3.2 2.8Denmark 3.7 1.9 1.6 2.0 2.2Estonia 10.6 2.3 1.7 2.1 4.9Finland 5.6 3.0 0.1 2.1 2.6France 3.9 2.0 1.12) 1.22) 1.82)
Germany 3.0 4.1 1.7 1.9 2.2Greece 3.9 -5.5 -0.32) -0.22) 1.42)
Ireland 9.6 1.8 25.6 5.1 7.8Italy 3.7 1.7 1.0 0.9 1.5Latvia 5.4 -3.9 3.0 2.2 4.5Lithuania 3.8 1.6 2.0 2.3 3.8Luxembourg 8.2 4.9 2.9 3.1 2.3Malta … 3.5 9.9 5.5 6.6Netherlands 4.2 1.4 2.3 2.22) 3.22)
Poland 4.6 3.6 3.8 3.0 4.6Portugal 3.8 1.9 1.8 1.62) 2.73)
United Kingdom 3.7 1.7 2.3 1.9 1.8Romania 2.4 -2.8 4.0 4.8 6.92)
Slovakia 1.2 5.0 3.9 3.3 3.4Slovenia 4.2 1.2 2.3 3.1 5.0Spain 5.3 0.0 3.42) 3.32) 3.12)
Sweden 4.7 6.0 4.5 3.2 2.4Hungary 4.2 0.7 3.4 2.2 4.0

ROMANIA IN FIGURES102
INTERNATIONAL STATISTICS
General government netCountry lending/net borrowing - % in GDP
2010 2015 2016 2017
EU-28 -6.4 -2.3 -1.6 -1.0EU-27 -6.4 -2.3 -1.6 -1.0Austria -4.4 -1.0 -1.6 -0.7Belgium -4.0 -2.5 -2.5 -1.0Bulgaria -3.1 -1.6 0.2 0.9Czech Republic -4.2 -0.6 0.7 1.6Cyprus -4.7 -1.3 0.3 1.8Croatia -6.5 -3.4 -0.9 0.8Denmark -2.7 -1.5 -0.4 1.0Estonia 0.2 0.1 -0.3 -0.3Finland -2.6 -2.8 -1.8 -0.6France -6.9 -3.6 -3.4 -2.6Germany -4.2 0.8 1.0 1.3Greece -11.2 -5.7 0.6 0.8Ireland -32.1 -1.9 -0.5 -0.3Italy -4.2 -2.6 -2.5 -2.3Latvia -8.7 -1.4 0.1 -0.5Lithuania -6.9 -0.2 0.3 0.5Luxembourg -0.7 1.4 1.6 1.5Malta -2.4 -1.1 1.0 3.9Netherlands -5.0 -2.1 0.4 1.1Poland -7.3 -2.6 -2.3 -1.7Portugal -11.2 -4.4 -2.0 -3.0United Kingdom -9.4 -4.3 -3.0 -1.9Romania -6.9 -0.8 -3.0 -2.9Slovakia -7.5 -2.7 -2.2 -1.0Slovenia -5.6 -2.9 -1.9 0.0Spain -9.4 -5.3 -4.5 -3.1Sweden 0.0 0.2 1.2 1.3Hungary -4.5 -1.9 1.7 -2.0
Source: Eurostat.
For information, purchasing
the publications and subscriptions, please contact
NIS Statistical Data and Publications Dissemination Office(Phones:+40 0213181871,+40 0213177770,+04 0213181824/ extension 1278, 2479)
Dissemination Offices of County Statistical Directions
(http://www.[name county].insse.ro)/ e-mail: [email protected]
Publishing House “Romanian Statistical Review”
or The Bookshop “Ion Ionescu de la Brad“
(Phone:+40 0213181842/ extension 1073, 2254)
and e-mail: [email protected]