rooftop dc solar system for university campus
TRANSCRIPT
©Daffodil International University
ROOFTOP DC SOLAR SYSTEM FOR UNIVERSITY
CAMPUS
A Thesis submitted in partial fulfillment of the requirements for the Award of
Degree of Bachelor Science in Electrical and electronic Engineering.
By
MD. IFRAN AHMMED
ID#:162-33-3299
NANDA SUTRADHAR
ID#:162-33-3306
Supervised by
NUSRAT CHOWDHURY
Lecturer, Department of EEE
Daffodil International University
Department of Electrical and Electronic Engineering
Faculty of Engineering
DAFFODIL INTERNATIONAL UNIVERSITY
October 2020

i ©Daffodil International University
CERTIFICATION This is to certify that this thesis entitled “ROOFTOP DC SOLAR SYSTEM FOR UNIVERSITY
CAMPUS” is done by the following students under my direct supervision and this work has been
carried out by them in the laboratories of the Department of Electrical and Electronic Engineering
under the Faculty of Engineering of Daffodil International University in partial fulfillment of the
requirements for the degree of Bachelor of Science in Electrical and Electronic Engineering. The
presentation of the work was held on 17th December 2020.
Signature of the candidates
_____________________
Name: Md. Ifran Ahmmed
ID No: 162-33-3299
_______________________
Name: Nanda Sutradhar
ID No: 162-33-3306
Countersigned
_______________________
Nusrat Chowdhury
Lecturer
Faculty of Science and Engineering
Daffodil International University

ii ©Daffodil International University
The thesis entitled “ROOFTOP DC SOLAR SYSTEM FOR UNIVERSITY CAMPUS” submitted by Md.
Ifran Ahmmed, ID No: 162-33-3299 and Nanda Sutradhar, ID No: 162-33-3306, Session: Summer-
16 has been accepted as satisfactory in partial fulfillment of the requirements for the degree of
Bachelor of Science in Electrical and Electronic Engineering on ……….
BOARD OF EXAMINERS
_________________________
Dr. Md.Fayzur Rahman
Professor & Head EEE, GUB External Member
_________________________
Dr. Md. Rezwanul Ahsan Internal Member
Assistant Professor Department of EEE, DIU
___________________________
Tasmia Baten Internal Member
Sr. Lecturer Department of EEE, DIU

iii ©Daffodil International University
Dedicated to
Our Parents and our beloved
Teachers.
iv ©Daffodil International University
CONTENTS
Page List of Figures vii List of tables viii List of Abbreviation Ix Acknowledgment X Abstract xi
Chapter 1: INTRODUCTION 1-26
1.1 Introduction 1 1.2 Generation of Electricity 1-2 1.3 Source of Energy 2 1.3.1 The Sun 2 1.3.2 The Wind 3 1.3.3 Water 3 1.3.4 Fuels 3 1.3.5 Nuclear Energy 3 1.4 Type of Energy 3 1.4.1 Non-renewable Energy 3 1.4.2 Renewable Energy 3 1.5 World Energy Demand 4-5 1.6 World energy demand for COV19 6 1.6.1 Oil demand 6-7 1.6.2 Gas demand 7 1.6.3 Renewables demand 7 1.6.4 Electricity demand 7 1.7 World energy consumption 7-8 1.7.1 Energy supply, consumption and electricity 8-9 1.7.2 Electricity generation 9-10 1.8 World Non-renewable Energy consumption 10 1.8.1 Coal 10-11 1.8.2 Oil 11 1.8.3 Natural Gas 11 1.8.4 Nuclear power 11 1.9 World Renewable Energy consumption 12 1.9.1 Hydro 12-13

v ©Daffodil International University
1.9.2 Marine energy 13 1.9.3 Wind 13 1.9.4 Solar 13 1.9.5 Geothermal 13 1.10 Energy Demand In BANGLADESH 13-14 1.11 Energy Consumption In BANGLADESH 14-15 1.12 Renewable Energy Consumption In BANGLADESH 15-17 1.12.1 Solar 17-18 1.12.2 Biofuel/biomass/biogas 18-19 1.12.3 Wind energy 19-20 1.12.4 Hydro Energy 20 1.12.5 Geothermal Energy 21 1.13 Rooftop solar system 21-24 1.14 Hybrid Solar System 25 1.15 Problem Statement 25 1.16 Scopes 26 1.17 Objective of Thesis 26 1.18 Thesis Outline 26
Chapter 2: Literature 27-28
Chapter3: Theory 29-34
3.1 Solar Panel 29 3.2 Charge Controller 30 3.3 Battery 30=31 3.4 Inverter 31-32 3.4.1 String Inverter 33 3.4.2 Power Plant inverter 33 3.5 Hybrid Optimization of Multiple Electric Renewable (HOMER) 33-34
Chapter:4 System Design 35-43
4.1 Location 35 4.2 Explanation of Design 36 4.3 System design by HOMER 36 4.4 Daily Load profile 37 4.5 Seasonal profile 39 4.6 Homer Input value 39 4.7 Photovoltaic Array (PV) 40

vi ©Daffodil International University
4.8 Battery 41 4.9 Solar resource 42 4.10 Economics 43
Chapter:5 Calculation 44-46
5.1 Load Definition 44 5.2 Daily load Profile 45 5.3 Size Consideration of PV Array 45 5.4 Battery Size 46 5.5 Charge controller 46 5.6 Solar Radiation 46
Chapter:6 Result and Discussion 47-51
6.1 6.2 6.3
Optimized result Overall result Cost Analysis
47 48-49 49-50
6.4 Environmental Impacts 50-51
Chapter7: Conclusion 52
References 53-56

vii ©Daffodil International University
LIST OF FIGURES
Figure Figure Caption Page
Fig.1.2.1 The conversion of energy 2
Fig.1.5.1 Global electricity demand by region in the Stated Policies Scenario, 2000-2040
4
Fig. 1.5.2 Electricity demand by sector and scenario, 2018-2040 5
Fig. 1.6.1 Share of global primary energy demand affected by mandatory lockdowns, January-April 2020
6
Fig.1.7.1 World energy consumption 8
Fig. 1.7.2 2018 World electricity generation (26,700 TWh) by source (IEA, 2019)
10
Fig. 1.8.1 World total coal production, 1978-2019 provisional 11
Fig. 1.11.1 Primary energy consumption in Bangladesh 15
Fig. 1.12.1 Renewable electricity generation by source (non-combustible), Bangladesh 1990-2018
16
Fig. 1.12.2 Contribution of different instigated renewable source in Bangladesh
18
Fig. 1.13.1 Primary energy consumption in different sector 22
Fig. 1.14.1 Hybrid solar system 25
Fig. 3.1.1 Solar Panel 29
Fig. 3.2.1 Charge controller 30
Fig. 3.3.1 Battery 31
Fig. 3.4.1 Inverter 31
Fig. 3.4.2 String Inverter 32
Fig. 3.4.3 Power plant inverter 33
Fig. 4,1 Location Selection 35 Fig. 4.1.1 Block Diagram of System Design 36
Fig. 4.2.1 System Design by HOMER 37
Fig. 4.3.1 Daily Load November to February 38
Fig. 4.3.2 Daily Load March to June 38
Fig. 4.3.3 Daily Load July to October 39
Fig. 4.4.1 Seasonal Profile 39
Fig. 4.6.1 Photovoltaic Array 40
Fig. 4.7.1 Battery details 41
Fig. 4.8.1 Solar Resource 42 Fig. 4.9.1 Economics details 43
Fig. 6.1.1 Optimize result from HOMER 47
Fig. 6.2.1 Monthly average electric production 49
Fig. 6.3.1 Cash flow summary for SHS 49
Fig. 6.3.2 Annual cash flow chart 50

viii ©Daffodil International University
LIST OF TABLES
Table Table Caption Page
table-1.7.1 World primary energy supply, Final energy consumption and Electricity generation yearly
9
table-1.9.1 World Renewable energy production and use by type 12
table-1.11.1 Bangladesh’s electricity scenario in 2018 15
table-1.12.1 Installed renewable energy technologies in Bangladesh 17
table-1.12.2 Measures of renewable technology installed in Bangladesh 17
table-1.12.3 Biogas Technical Potential 19
table-1.12.4 Different places in Bangladesh for Wind energy 20
table-1.12.5 Bangladesh Hydro power sector 20
Table-1.13.1 On-grid solar power project in Bangladesh 23
Table-1.13.2 Some examples of industrial &commercial rooftop solar projects in Bangladesh
24
Table-5.1.1 load definition-1 44
Table-5.1.2 load definition-2 44
Table-5.1.3 load definition-3 45
Table-6.2.1 System Capital cost 48
Table-6.2.2 System annual cost 48
Table-6.4.1 Environmental impact for grid and solar PV 51
ix ©Daffodil International University
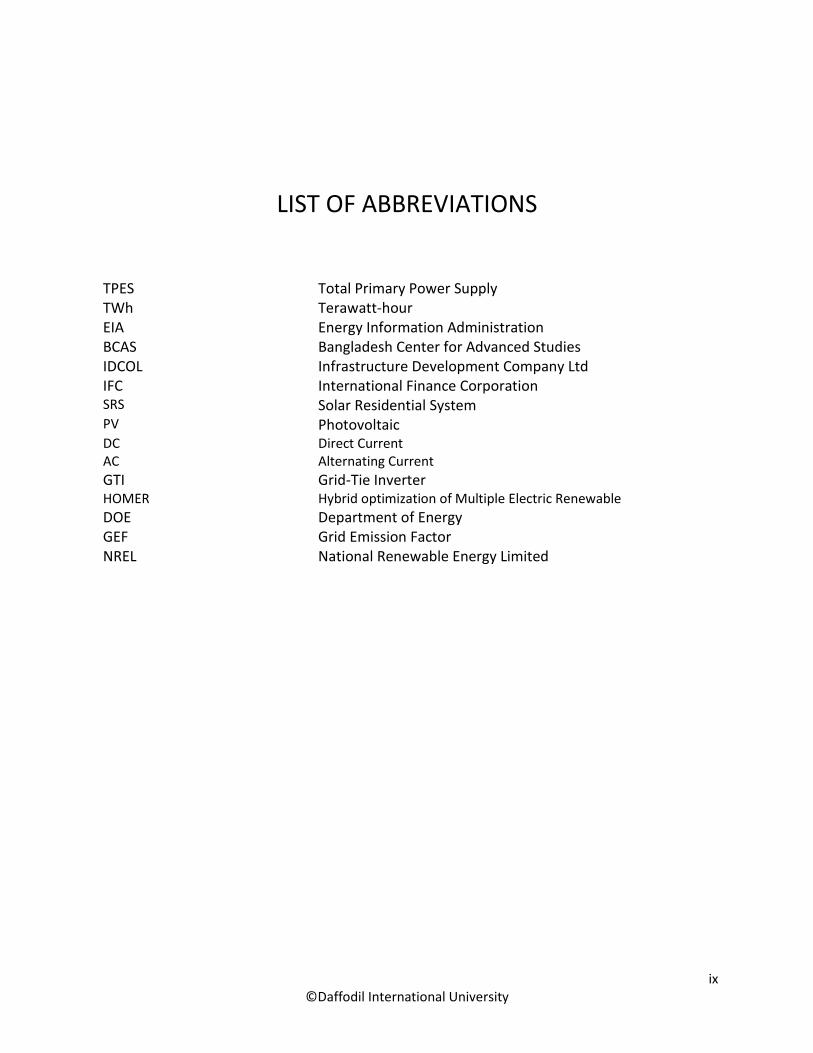
LIST OF ABBREVIATIONS
TPES Total Primary Power Supply TWh Terawatt-hour EIA Energy Information Administration BCAS Bangladesh Center for Advanced Studies IDCOL Infrastructure Development Company Ltd IFC International Finance Corporation SRS Solar Residential System PV Photovoltaic DC Direct Current AC Alternating Current
GTI Grid-Tie Inverter HOMER Hybrid optimization of Multiple Electric Renewable DOE Department of Energy GEF Grid Emission Factor NREL National Renewable Energy Limited

x ©Daffodil International University
ACKNOWLEDGEMENT
First of all, we give thanks to Allah or God. Then we would like to take this opportunity to express
our appreciation and gratitude to our project and thesis supervisor Nusrat Chowdhury Lecturer,
Faculty of Engineering at Department of EEE for being dedicated in supporting, motivating and
guiding us through this project. This project can’t be done without her useful advice and helps.
Also thank you very much for giving us opportunity to choose this project.
Apart from that, we would like to thank our entire friends for sharing knowledge; information
and helping us in making this project a success. Also, thanks for lending us some tools and
equipment.
To our beloved family, we want to give them our deepest love and gratitude for being very
supportive and also for their inspiration and encouragement during our studies in this University.

xi ©Daffodil International University
ABSTRACT
Bangladesh is a developing country and the country's economy is dependent on agricultural work
and industrial factories, it is constantly struggling to meet this growing energy demand. Most of
Bangladesh's energy consumption comes from fossil fuels. And to meet this energy demand we
have to rely mainly on natural gas and coal-based power plants. As a result, the pressure on fossil
fuels is increasing and its amount is decreasing day by day which is not pleasant for us at all.
In order to solve this problem, we have tried to highlight in this study the use of solar power and
the pioneering role it can play in meeting the national electricity demand. In our proposed
system, we have compared the difference between solar panel-based power and the power
generated from the national grid. From which it is found that the cost of solar panel-based
electricity is less than the electricity generated from the national grid. Although its initial cost for
solar panel-based power generation is a little higher, but after a certain period of time these costs
can be recovered. Also, solar panel based solar power plants are environmentally friendly,
meaning that it does no harm to the environment, as fossil fuel-based power plants do by
producing carbon-dioxide. In this proposal we have used Hybrid Optimization of Multiple Energy
Renewables (HOMER) software for cost analysis, energy analysis etc. and the results obtained
from it have also been analyzed.
1 ©Daffodil International University
CHAPTER-1 Introduction
1.1 Introduction:
It has been an integral part of our lives since the discovery of electricity on Earth. Electricity
continues to play an important role in the economic, social and overall development of a country
starting from daily life. For a good reason, a country needs a lot of electricity for its development.
The more electricity a country has, the more developed it is because uninterrupted power
connections increase business, trade and factory production capacity, which in turn boosts the
country's economy. Most of the electricity in the world is generated from non-renewable energy
sources i.e. fossil fuels using coal, diesel, gas, nuclear etc. Due to this need for electricity, the
demand for it has been increasing day by day, which has resulted in the increasing use of fossil
fuels. [1]. According to a study by BP, energy demand will increase to 41 percent between 2012
and 2035, which will increase to 1.5% per year, even in Asia, where energy demand has increased
by 2.6% [2].
1.2 Generation of electrical energy:
The process of making a product such as electrical apparel clothing, observation, or equipment
will be celebrated at the ceremony. Just as a certain raw material, which is in nature and from
which a certain product can be made, so electricity can be generated from a certain raw material,
which exists in nature. Although other components or products can be used and stored at will
after production, in the case of electrical energy, its production and use become instantly vital.
Other products take much longer to produce but electricity can be generated instantly. The
instantaneous production of electricity reminds us how important it is to us for technology and
industrialization.

2 ©Daffodil International University
In nature, energy exists in various sources such as water pressure, chemical energy, nuclear
energy, radioactive substances, etc. These energy sources can be converted into electrical energy
through a specific process. In this process an alternator is connected to a prime mover. This prime
mover is rotated through the use of different sources of energy such as burning fuel energy,
water pressure, air flow etc. For example, fuel from chemical energy (such as coal) is used to
evaporate water at high pressure and temperature. The steam is sent to the prime mover, which
could be a steam engine or a steam turbine. This turbine converts steam energy into mechanical
energy and subsequently mechanical energy is converted into electrical energy through
alternators [3].
Fig. 1.2.1: The conversion of energy
1.3 Source of Energy:
Energy in nature comes from various sources such as:
1.The sun
2.Thewind
3. Water
4.Fuels and
5. Nuclear energy.
1.3.1 The Sun:
The sun is the main source of energy. The sun's photons can be used to generate electricity.

3 ©Daffodil International University
1.3.2 The Wind:
Here wind flows can be used to generate electricity through windmills. This process is possible
where the airflow is running all the time.
1.3.3 Water:
When water is stored in a certain place, pressure is created in between. The prime mover is
rotated by the flow of water at high pressure, which generates mechanical energy, which is then
converted into electrical energy by means of an alternator. Currently this process of power
generation is very popular.
1.3.4 Fuels:
The main sources of energy are fuels such as coal, oil, natural gas etc. Mechanical energy is
generated from these fuels. The mechanical power is then converted into electrical energy by
connecting the prime mover to the alternator.
1.3.5 Nuclear Energy:
Towards the end of World War II, it was discovered that a large amount of heat was generated
by fission reactions from uranium or all radioactive substances. It is estimated that 1 kg of nuclear
fuel produces the same amount of heat energy as burning 4500 tons of coal.
1.4 Type of Energy:
Electric energy can be generated by utilizing the thermal energy of radioactive material. Power
sources can usually be divided into two parts.
1.4.1 Non-renewable Energy:
A source of renewable energy is a source of energy that cannot be reused once used. The amount
of non-renewable energy sources is decreasing day by day, such as coal, natural gas, oil, nuclear
energy, etc. A 2016 study found that about 95% of the world's energy comes from non-renewable
energy sources (coal, natural gas, oil, nuclear energy [4].
1.4.2 Renewable Energy:
A renewable energy source is a source of energy that will never run out. This energy source can
be used to generate electricity repeatedly, such as sun rays, wind currents, water pressure, water
currents etc. A 2016 study found that only 5% of the world's energy comes from renewable
energy sources (sunlight, wind, water, water pressure etc.) [4].

4 ©Daffodil International University
1.5 World Energy Demand:
Electricity is the main driving force of the modern economy and the lion's share of energy services
are supplied by electricity. The demand for electricity is increasing day by day due to the
development of modern transport system, production and use of modern equipment and
increasing use of these equipment’s in human life system. The amount of electricity generated in
2018 to meet the growing electricity demand of the people, as a result of the record amount of
carbon dioxide emitted from the power sector into the environment [6].
According to the State Policy Scenario, the demand for electricity will increase by 2.1% per annum
by 2040, which is 2 times that of primary energy. The amount of electricity at the Total Final
Energy Consumption will increase from 19% in 2018 to 24% in 2040. This demand for electricity
is going to be stronger, especially for developing economies. Electricity plays such an important
role in sustainable development that it occupies 31% of the total energy consumption [6].
Fig. 1.5.1: Global electricity demand by region in the Stated Policies Scenario, 2000-2040
The demand for electricity complies with two separate regional terms. Developed economies are
heavily involved in digitalization and electrification, and digitalization and electrification depend
on increasing energy efficiency, so in order to enrich the economy, energy efficiency must be
increased. In a developing economy, growing income, mills and refineries are increasing the
demand for electricity. According to the State Policy Scenario, the demand for electricity in

5 ©Daffodil International University
developing economies is expected to exceed 90% by 2040, but will be 60 percent lower per capita
than in developed economies [6].
Today, global demand for electricity for industrial and urbanization has grown by 90 percent,
with less than 2 percent of electricity used in transportation [6].
According to the State Policy Scenario, the main reasons for the increase in electricity demand
are the development of the motor industry (more than 30% of total development by 2040), space
cooling (17%), use of large machinery, small machinery and electric vehicles (10%) [6]. For the
first time when electricity was supplied to 530 million people which was only 2% of the demand
[6]. Electric vehicles are the main cause of electricity demand for sustainable development [6].
Fig. 1.5.2: Electricity demand by sector and scenario, 2018-2040
6 ©Daffodil International University
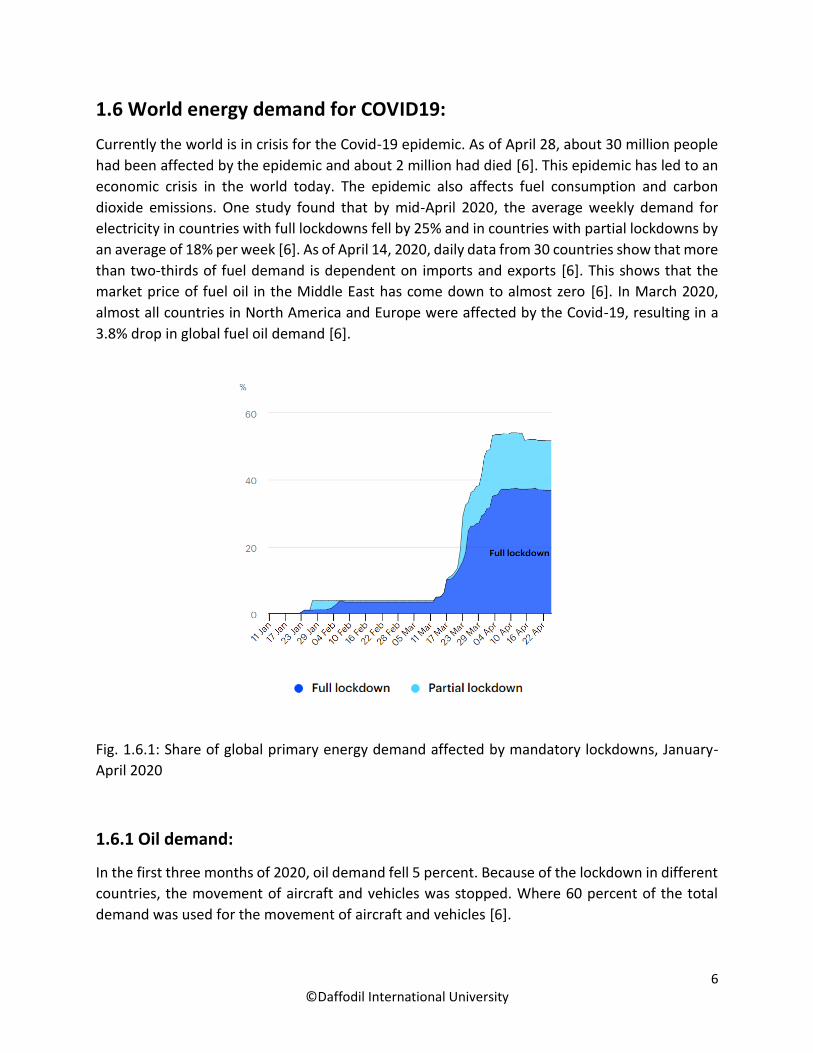
1.6 World energy demand for COVID19:
Currently the world is in crisis for the Covid-19 epidemic. As of April 28, about 30 million people
had been affected by the epidemic and about 2 million had died [6]. This epidemic has led to an
economic crisis in the world today. The epidemic also affects fuel consumption and carbon
dioxide emissions. One study found that by mid-April 2020, the average weekly demand for
electricity in countries with full lockdowns fell by 25% and in countries with partial lockdowns by
an average of 18% per week [6]. As of April 14, 2020, daily data from 30 countries show that more
than two-thirds of fuel demand is dependent on imports and exports [6]. This shows that the
market price of fuel oil in the Middle East has come down to almost zero [6]. In March 2020,
almost all countries in North America and Europe were affected by the Covid-19, resulting in a
3.8% drop in global fuel oil demand [6].
Fig. 1.6.1: Share of global primary energy demand affected by mandatory lockdowns, January-
April 2020
1.6.1 Oil demand:
In the first three months of 2020, oil demand fell 5 percent. Because of the lockdown in different
countries, the movement of aircraft and vehicles was stopped. Where 60 percent of the total
demand was used for the movement of aircraft and vehicles [6].

7 ©Daffodil International University
1.6.2 Gas demand:
Covid-19 also has an impact on gas demand. In early 2020, gas demand fell by about 2% [6].
1.6.3 Renewables demand:
The only renewable energy was not affected by covid-19. Because of the lockdown in various
countries, the import and export of coal, oil, gas etc. was stopped and the whole world realized
the need for renewable energy and focused on its widespread expansion [6].
1.6.4 Electricity demand:
The impact of the lockdown has also led to a sharp decline in electricity demand. Although
residential demand increased during the lockdown, electricity demand fell by 20% or more as
commercial and industrial management systems were shut down throughout the lockdown in
several countries [6]. As demand decreases, renewable energy production declines slightly,
although the output of renewable energy generation is not affected. Power generation from
other energy sources such as oil, gas, nuclear energy, coal, etc. is greatly reduced [6].
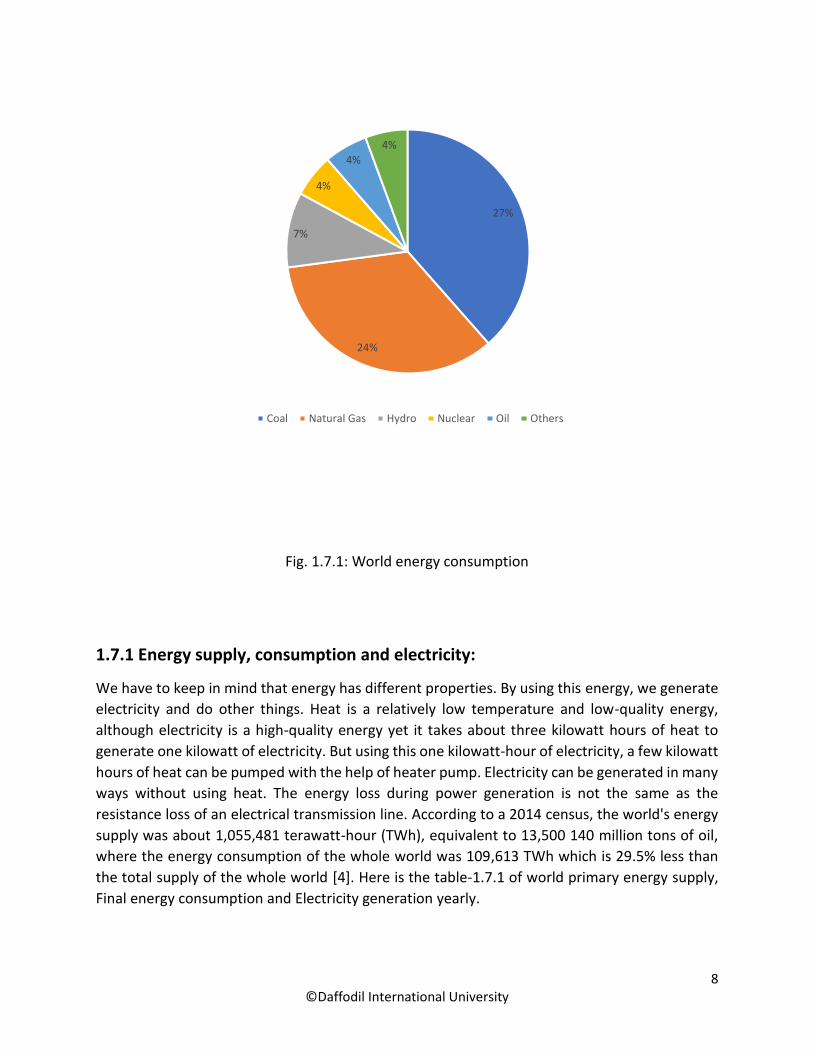
1.7 World energy consumption:
World energy consumption refers to the total amount of energy produced and consumed by
mankind. Generally, an account is kept of how much energy is generated from the sources of
energy production and how much energy is consumed each year.
This accounting sector accounts for each country's industrial, technology sector and each energy
sector used in human life. It does not take into account the energy generated from food and
biomass. Since the source of energy is one of the elements in the development of civilization, the
application of global energy has a profound effect on people's socio-economic and political life.
The world's Total Primary Power Supply (TPES) is different from the world's primary energy.
Because the energy that we use is made usable by various processes to make it usable. In the
process of making energy usable, some energy is lost otherwise. For example, when oil is
extracted from the ground, it is then refined into gasoline so that it can be used and transported
to various gas stations over long distances so that customers can use it [4].
8 ©Daffodil International University
Fig. 1.7.1: World energy consumption
1.7.1 Energy supply, consumption and electricity:
We have to keep in mind that energy has different properties. By using this energy, we generate
electricity and do other things. Heat is a relatively low temperature and low-quality energy,
although electricity is a high-quality energy yet it takes about three kilowatt hours of heat to
generate one kilowatt of electricity. But using this one kilowatt-hour of electricity, a few kilowatt
hours of heat can be pumped with the help of heater pump. Electricity can be generated in many
ways without using heat. The energy loss during power generation is not the same as the
resistance loss of an electrical transmission line. According to a 2014 census, the world's energy
supply was about 1,055,481 terawatt-hour (TWh), equivalent to 13,500 140 million tons of oil,
where the energy consumption of the whole world was 109,613 TWh which is 29.5% less than
the total supply of the whole world [4]. Here is the table-1.7.1 of world primary energy supply,
Final energy consumption and Electricity generation yearly.
27%
24%
7%
4%
4%
4%
Coal Natural Gas Hydro Nuclear Oil Others

9 ©Daffodil International University
Key figures (TWh)
Year primary energy supply
Final energy consumption
Electricity generation
2010 147,899 100,914 21,431
2011 152,504 103,716 22,126
2012 155,505 104,426 22,668
2013 157,482 108,171 23,322
2014 155,481 109,613 23,816
2015 158,715 109,136
2017 162,494 113,009 25,606
Table-1.7.1 world primary energy supply, Final energy consumption and Electricity generation
yearly.
According to the U.S. Energy Information Administration (EIA), the estimated cost of energy
worldwide in 2013 was 5.67 * 10 ^ 20 joules, or 157,481 TWh [4].
The IEA agency cites data from several other years, including the estimated energy consumption
in 2008 was 143,851 TWh, in 2005 133,602 TWh, in 2000 117,687 TWh, in 1990 1 lakh 2 thousand
569 TWh[4].According to one source, in 2012, 22% of the world's energy was used in North
America, 5% in Central and South America, 23% in Europe and Eurasia, 3% in Africa and 40% in
the Asia-Pacific region[4].
1.7.2 Electricity generation:
According to the EIA, worldwide electricity consumption in 2013 was 19,504 TWh, in 2008 16,503
TWh, in 2005 15,105 TWh, and in 2000 12,116 TWh [4]. According to a 2014 data, the total power
generation capacity worldwide was about 6.4 million watts, which was only connected to the
local grid [4].
In addition, electricity was required for the operation of isolated villages and isolated industrial
cities and electricity was generated which was beyond this information. According to 2014 data,
41% of the world's electricity is generated from coal, 22% from natural gas, 11% from nuclear,
16% from hydro, 4% from oil, and 6% from other energy sources [4]. Coal and natural gas
generated the most electricity. In 2012, 18608 TWh of electricity was used worldwide. Due to
grid losses, storage losses, and the power plant's own consumption, this number was 18% lower
than the electricity generated worldwide. Co-generation power stations sometimes use some
thermal energy that cannot be used in residential buildings or the industrial sector, and is wasted.

10 ©Daffodil International University
In 2016, 80% of the world's energy comes from fossil fuels, 10% from biofuels, 5% from nuclear
energy and 5% from renewable energy sources (water, wind, solar, geothermal [4]. Only 18% of
the world's energy was in the form of electricity, and the other 82% was used for heating and
transportation [4].
Fig. 1.7.2: 2018 World electricity generation (26,700 TWh) by source (IEA, 2019)
1.8 World Non-renewable Energy consumption:
In the twentieth century the demand for energy has increased so much that the amount of fossil
fuels used in energy production has multiplied.
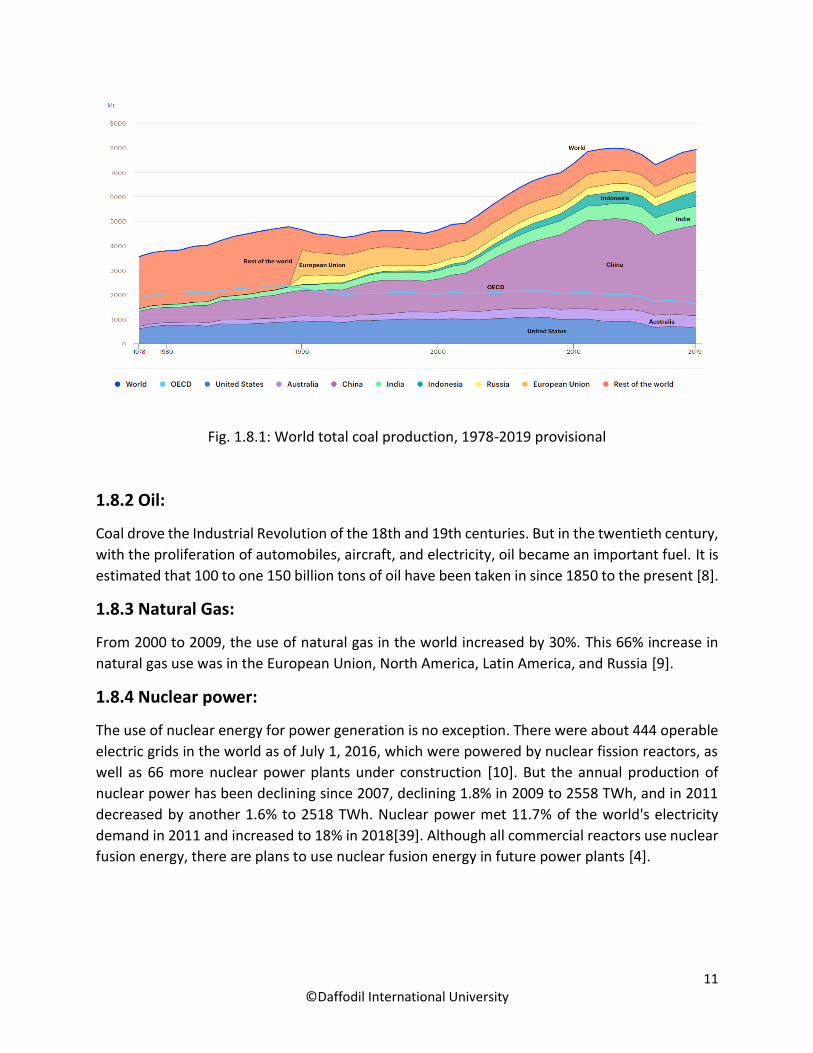
1.8.1 Coal:
As of 2000, China accounted for 28% of the world's coal use, 19% for other Asians, 25% for North
America, and 14% for the European Union. Meanwhile, China is the world's largest coal
consumer. China's coal use increased from 28% in 2000 to 48% in 2009 and more than 70% in
2019.In fact, most of the increase in coal use has been in China and the rest in other parts of Asia
[5]. The world's annual coal production increased by 1905 metric tons or 32% in the six years
between 2005 and 2011, where it was 70% in China and 8% in India [7]. Coal production in 2009
was 6,903 metric tons, in 2011 7783 metric tons, in 2019 7921 metric tons [6].
38%
23%
19%
10%
7%3%
Coal Gas Hydro and Others Nuclear Solar PV and wind Oil
11 ©Daffodil International University
Fig. 1.8.1: World total coal production, 1978-2019 provisional
1.8.2 Oil:
Coal drove the Industrial Revolution of the 18th and 19th centuries. But in the twentieth century,
with the proliferation of automobiles, aircraft, and electricity, oil became an important fuel. It is
estimated that 100 to one 150 billion tons of oil have been taken in since 1850 to the present [8].
1.8.3 Natural Gas:
From 2000 to 2009, the use of natural gas in the world increased by 30%. This 66% increase in
natural gas use was in the European Union, North America, Latin America, and Russia [9].
1.8.4 Nuclear power:
The use of nuclear energy for power generation is no exception. There were about 444 operable
electric grids in the world as of July 1, 2016, which were powered by nuclear fission reactors, as
well as 66 more nuclear power plants under construction [10]. But the annual production of
nuclear power has been declining since 2007, declining 1.8% in 2009 to 2558 TWh, and in 2011
decreased by another 1.6% to 2518 TWh. Nuclear power met 11.7% of the world's electricity
demand in 2011 and increased to 18% in 2018[39]. Although all commercial reactors use nuclear
fusion energy, there are plans to use nuclear fusion energy in future power plants [4].
12 ©Daffodil International University
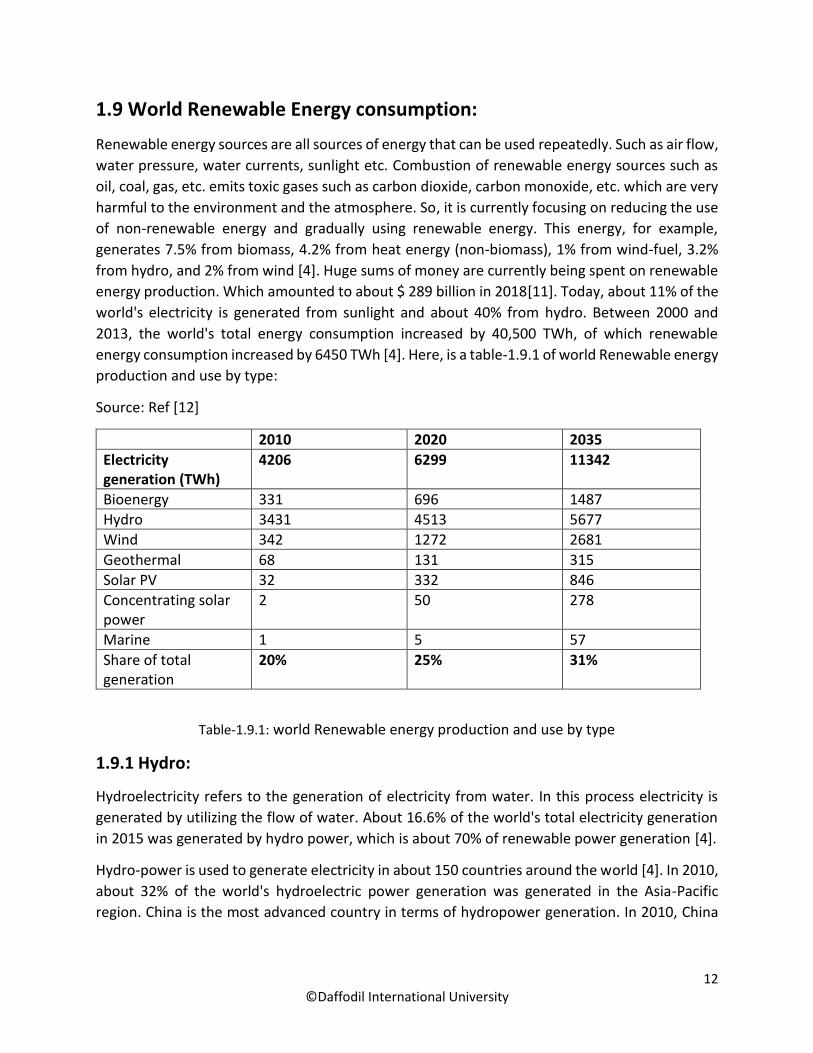
1.9 World Renewable Energy consumption:
Renewable energy sources are all sources of energy that can be used repeatedly. Such as air flow,
water pressure, water currents, sunlight etc. Combustion of renewable energy sources such as
oil, coal, gas, etc. emits toxic gases such as carbon dioxide, carbon monoxide, etc. which are very
harmful to the environment and the atmosphere. So, it is currently focusing on reducing the use
of non-renewable energy and gradually using renewable energy. This energy, for example,
generates 7.5% from biomass, 4.2% from heat energy (non-biomass), 1% from wind-fuel, 3.2%
from hydro, and 2% from wind [4]. Huge sums of money are currently being spent on renewable
energy production. Which amounted to about $ 289 billion in 2018[11]. Today, about 11% of the
world's electricity is generated from sunlight and about 40% from hydro. Between 2000 and
2013, the world's total energy consumption increased by 40,500 TWh, of which renewable
energy consumption increased by 6450 TWh [4]. Here, is a table-1.9.1 of world Renewable energy
production and use by type:
Source: Ref [12]
2010 2020 2035
Electricity generation (TWh)
4206 6299 11342
Bioenergy 331 696 1487
Hydro 3431 4513 5677
Wind 342 1272 2681
Geothermal 68 131 315
Solar PV 32 332 846
Concentrating solar power
2 50 278
Marine 1 5 57
Share of total generation
20% 25% 31%
Table-1.9.1: world Renewable energy production and use by type
1.9.1 Hydro:
Hydroelectricity refers to the generation of electricity from water. In this process electricity is
generated by utilizing the flow of water. About 16.6% of the world's total electricity generation
in 2015 was generated by hydro power, which is about 70% of renewable power generation [4].
Hydro-power is used to generate electricity in about 150 countries around the world [4]. In 2010,
about 32% of the world's hydroelectric power generation was generated in the Asia-Pacific
region. China is the most advanced country in terms of hydropower generation. In 2010, China

13 ©Daffodil International University
generated about 720 TWh of electricity, which is about 17% of China's total electricity generation
[13].
1.9.2 Marine energy:
Marine energy is also called ocean energy, hydro kinetic energy etc. Marine energy is created by
utilizing ocean tides, waves, currents, etc. which creates a new possibility in renewable energy
[4].
1.9.3 Wind:
Wind power is increasing at a rate of about 17% per year. In 2015, wind generated about 432,883
megawatts (MW) of electricity [14][15][16]. In Europe, Asia and America, large amounts of wind
are used to generate electricity. Some countries in the world have been very successful in using
the wind to season. In 2010, Denmark generated 21%, Portugal 18%, Spain 16%, Ireland 14%, and
Germany 9% electricity using wind [17][18]. About 3% of the electricity generated on Earth in
2016, is generated by wind flow [19].
1.9.4 Solar:
People have been using solar energy since ancient times. Electricity is generated by using the rays
coming from the sun. Solar heating, solar photovoltaics, solar concentrated, solar architecture,
etc. are several technologies of solar energy. Many of the world's problems can be solved by
using these technologies. The International Energy Agency estimates that by 2060, one-third of
the world's energy will be generated from solar energy. This will reduce the amount of carbon
dioxide emissions into the environment at an incredible rate [20]. Solar technologies can be
identified as active solar or passive based on the reception, distribution, and conversion of solar
energy. Power generation using photovoltaic systems and solar thermals is done with active solar
technology. The work of passive solar technology is to generate energy by utilizing the material
of windows, roofs or walls of a building (where sunlight always falls and air can come and go
naturally). Between 2012 and 2016, the world's solar power generation capacity tripled and
provided 1.3 percent of the world's solar energy [21].
1.9.5 Geothermal:
About 70 countries in the world use geological energy [22]. About 200 petajoules (56 TWh) of
electricity was generated from geothermal energy in 2004. And the extra about 270 petajoules
of geothermal energy were mostly used for space heating.
1.10 Energy Demand In BANGLADESH:
Bangladesh is a fast growing densely populated developing country in South Asia. So, the demand
for electricity for rural economy, mills, readymade garment industry, and rural and urban housing

14 ©Daffodil International University
in this fast-developing country is increasing day by day. Energy demand in Bangladesh has
increased by 10% in the last one decade [23]. Bangladesh's power generation capacity in 2017
was 15,351 MW and in 2018 it exceeded 20,000 MW [24][25]. The industrial and residential
sectors use most of the electricity generated in Bangladesh, followed by the commercial and
agricultural sectors [26]. According to 2015 data, 92% of the urban population and 62% of the
rural population had access to electricity [27]. According to the Bangladesh Power Development
Board, in 2018, 90% of the total population of the country have access to electricity. However,
per capita electricity consumption in Bangladesh is considered low [28]. By 2030, the country will
need 34,000 MW of electricity to sustain Bangladesh's economic growth of 7% [29].
1.11 Energy Consumption In BANGLADESH:
Bangladesh's economy is dependent on agricultural work and mills. Bangladesh is largely
dependent on fossil fuels such as coal, gas, diesel and hydropower for power generation. 99% of
the electricity demand of rural life system of Bangladesh is generated from fossil fuels. Although
the cost of electricity generated from fossil fuels is very high and has an adverse effect on the
environment, it has become a catastrophic threat to the environment and even the world's
climate change. So, the solution to this problem is to generate electricity from renewable energy
sources, which is very readily available at very low cost and without harming the environment
[30]. Sources of renewable energy include geothermal, ocean currents, wind power, solar energy,
etc.
Bangladesh is largely dependent on natural gas for power generation. About 80 percent of the
total electricity generation in Bangladesh is generated by natural gas. Bangladesh has about
201532.1 trillion cubic feet of gas reserves [31]. It also has about 2797 megatons of coal reserves,
which is equivalent to about 37 million cubic feet of gas[32].During the last operation on
September 21-22, 2015, it was learned that Bangladesh has about 2725 million cubic feet of gas
and 9263.7 million cubic feet of condensate reserves in its own gas field[33].In 2015, the growth
rate of power generation in Bangladesh was about 15%[34]. Bangladesh Power Development
Board (BPDB) expected that power generation in Bangladesh would increase by about 1000 MW
in 2015.
The table-1.11.1 below shows Bangladesh’s electricity scenario in 2018:
Source: Ref [35][36]

15 ©Daffodil International University
Item January 2018
Power Generation Capacity 17060 MW
Access to Electricity 79%
Distribution Line 341,000 km
Transmission Line 15665 circuit km
Per Capita Power Generation 460 kWh
Average System Loss 15%
Table-1.11.1: Bangladesh’s electricity scenario in 2018
According to a 2016 survey, about 65% of the total primary energy consumption in Bangladesh
comes from gas, 5% from imports, 2% from coal, 5% from renewable energy, 7% from high speed
diesel (HSD) and 18% from heavy fuel oil (HFO).
Fig. 1.11.1: Primary energy consumption in Bangladesh
1.12 Renewable Energy Consumption In BANGLADESH:
Renewable energy sources are environmentally friendly, sustainable, clean. So, the sources can
be reproduced at any time without any duration. The amount of fossil fuel in the world is
decreasing day by day. The renewable energy source does not allow the fossil fuel reduction
65%18%
17%
5%3%
2%
Gas HFO HSD Import Renewable Energy Coal

16 ©Daffodil International University
effect. Renewable energy sources can counteract the damage caused to the environment by
burning fossil fuels. For a low-income country like Bangladesh, greenhouse gas emissions are not
the primary initiative. However, as the amount of fossil fuels from the world is declining rapidly,
Bangladesh is focusing on renewable energy sources. Due to the geographical location of
Bangladesh, there is a lot of potential for renewable energy, one of which is solar power, besides
some potential for hydropower [37]. In the absence of sufficient funds, it is somewhat difficult to
measure wind power generation [38]. Renewable energy sources generate about 433 MW of
electricity in Bangladesh, which is only 3.5% of the total electricity generation in Bangladesh. In
2015, Bangladesh was supposed to generate 5% of electricity from renewable energy sources,
but failed to meet the target in the Bangladesh Policy of Renewable Energy (BPRE). Only 3.5% of
electricity was generated in 2015.However, the Government of Bangladesh is working to
generate 10% of Bangladesh's total electricity generation from renewable energy by 2020[38].
Fig. 1.12.1: Renewable electricity generation by source (non-combustible), Bangladesh 1990-
2018
Here is the table-1.12.1 of Installed renewable energy technologies in Bangladesh.
Source: Ref [39]

17 ©Daffodil International University
Technology Off-grid (MW) On-grid (MW) Total (MW)
Biogas to electricity 5 - 5
Biomass to electricity 1 - 1
Hydro - 230 230
Solar PV 184 1 185
Wind 1 .9 1.9
Total 191 232 423
Table-1.12.1: Installed renewable energy technologies in Bangladesh
Here is the table-1.12.2 of Measures of renewable technology installed in Bangladesh.
Source: Ref [39]
Type Number
Solar home system 3.6 million
Solar irrigation pump 366
Solar water heater -
Solar drinking water system 140
Biogas plant 38000
Improved cook stove 20,00,000
Improved rice parboiling system 68
Total 5.63 million
Table-1.12.2: Measures of renewable technology installed in Bangladesh
1.12.1 Solar:
In terms of geographical location, Bangladesh is located 84.04 and 92.44 degrees east and 20.30
and 26.38 degrees north. So solar energy can be retained and used very easily [40][41]. As a
result, Bangladesh gets less sunlight for 10 hours a day throughout the year. The average solar
energy intensity in Bangladesh is about 5 kwh / m2 / day [41][42]. As a result, solar power plants
can play an important role in increasing power generation in the national grid of Bangladesh.
Since solar energy is very readily available, and it does not produce any gas i.e. pollution free, its
maintenance cost is low, the only problem is that it fails to generate electricity in cloudy skies,
but its efficiency is much higher than that of other renewable energy sources.
Bangladesh has already gained accurate and successful experience in generating electricity using
solar energy [43]. The country has the capacity to generate 50,174 MW of electricity using solar
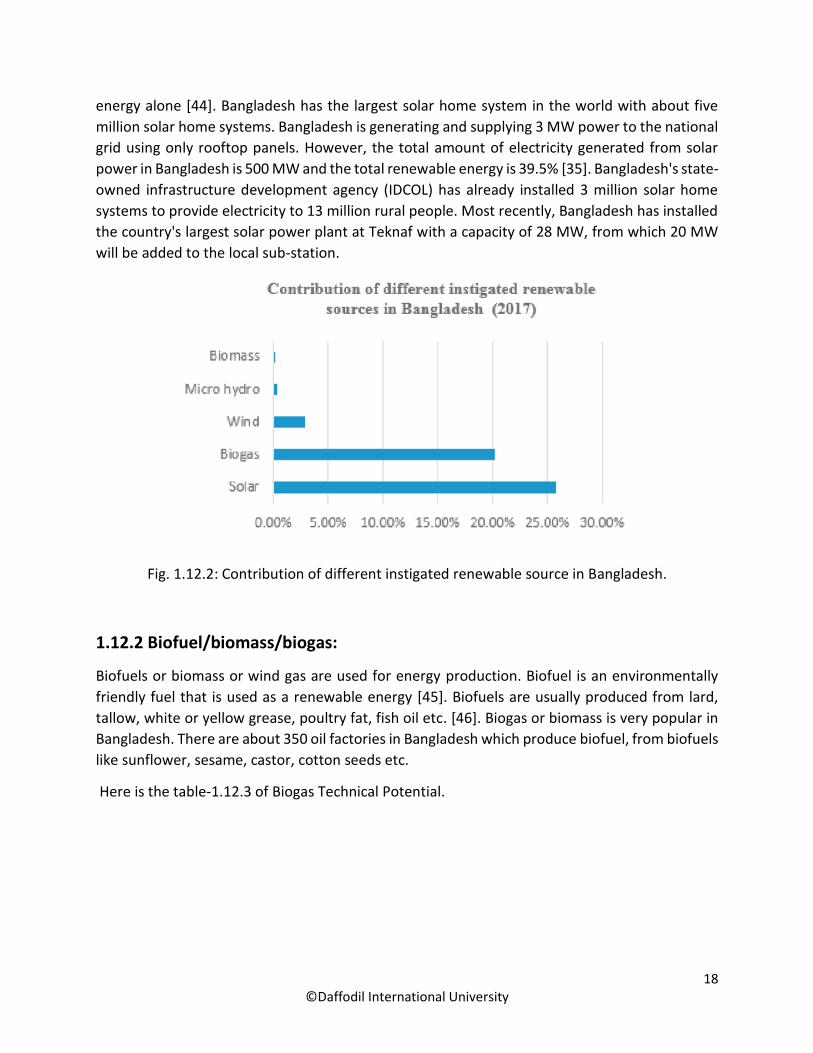
18 ©Daffodil International University
energy alone [44]. Bangladesh has the largest solar home system in the world with about five
million solar home systems. Bangladesh is generating and supplying 3 MW power to the national
grid using only rooftop panels. However, the total amount of electricity generated from solar
power in Bangladesh is 500 MW and the total renewable energy is 39.5% [35]. Bangladesh's state-
owned infrastructure development agency (IDCOL) has already installed 3 million solar home
systems to provide electricity to 13 million rural people. Most recently, Bangladesh has installed
the country's largest solar power plant at Teknaf with a capacity of 28 MW, from which 20 MW
will be added to the local sub-station.
Fig. 1.12.2: Contribution of different instigated renewable source in Bangladesh.
1.12.2 Biofuel/biomass/biogas:
Biofuels or biomass or wind gas are used for energy production. Biofuel is an environmentally
friendly fuel that is used as a renewable energy [45]. Biofuels are usually produced from lard,
tallow, white or yellow grease, poultry fat, fish oil etc. [46]. Biogas or biomass is very popular in
Bangladesh. There are about 350 oil factories in Bangladesh which produce biofuel, from biofuels
like sunflower, sesame, castor, cotton seeds etc.
Here is the table-1.12.3 of Biogas Technical Potential.

19 ©Daffodil International University
Technical Potential (MWh*) Estimated Capacity Potential (kW**)
Division Commercial Cattle and
Buffalo
Commercial Fowl and Duck
Commercial Cattle and
Buffalo
Commercial Fowl and Duck
Barisal 1,989 16,189 45 370
Chittagong 11,364 69,243 259 1,581
Dhaka 18,452 188,138 421 4,295
Khulna 11,095 26,983 253 616
Rajshahi 15,999 33,193 365 758
Sylhet 1,383 18,946 32 433
Total 60,282 352,692 1,376 8,052
*Based on a heating rate of 10,000 btu/kWh, **Determined by assuming an efficiency of 50%.
Table-1.12.3: Biogas Technical Potential.
1.12.3 Wind energy:
The world is moving very fast in the field of wind energy generation. Usually a turbine is used to
generate electricity from wind energy. Bangladesh is using wind energy to generate about 900
Kw of electricity from Sonagazi Muhuri Dam in Feni and about 1000 Kw from Kutubdia Island [47].
Grameen Shakti, Bangladesh Center for Advanced Studies (BCAS), Bangladesh Army, IFRD, is
generating about 19.2 KW of electricity from wind power using coastal areas of Bangladesh [48].
Bangladesh is located on the largest beach in the world about 724 km long. Bangladesh is
planning to use this long beach to generate electricity from bio energy. BPDB has identified about
22 places in the coastal areas of Bangladesh, from which plans are underway to generate 50-200
MW of electricity, and plans to generate about 15 MW of electricity from Muhuri Dam [48].

20 ©Daffodil International University
The table-1.12.4 bellow shows different places in Bangladesh for Wind energy.
Site Reference Height (m) Annual-Average Wind Speed (m/s)
Cox’s Bazaar 10 2.42
Sandip Island 5 2.16
Teknaf 5 2.16
Patenga Airport 5 2.45
Comilla Airport 6 2.21
Khepupara 10 2.36
Kutubdia Island 6 2.09
Bhola Island 7 2.44
Hatia Island 6 2.08
Table-1.12.4: Different places in Bangladesh for Wind energy.
1.12.4 Hydro Energy:
Hydropower is a natural renewable energy source. By making a reserve of water, the turbine is
rotated by converting the water head into kinetic energy. The mechanical energy generated at
the turbine is then converted into electrical energy by means of an alternator [49].
Bangladesh's sources of hydropower are less than the world's rate of hydropower generation
[50]. At the end of 2014, hydropower generation was 879 MTOP, which is 3.3% of the average
hydropower generation in the last 10 years. In 2014, the world's total hydropower generation
was 406.83%, most of which was generated in China (27.4%) [51]. In 2014, Bangladesh's
hydropower generation capacity was 230 MW, which is very low compared to other countries in
the world [51].
Here is the table-1.12.5 of Bangladesh Hydro power sector.
Source: Ref [51]
Name of the River Potential of Electrical Energy in MW
Kaptai 100
Shangu river 100
Matamuhuri river 100
Mohamaya 23-65
Lohajari 4.5
Table-1.12.5: Bangladesh Hydro power sector.

21 ©Daffodil International University
1.12.5 Geothermal Energy:
Geothermal energy is the main energy of the earth and one of the sources of renewable energy.
Bangladesh has the potential to generate energy from geothermal energy, with warm water
areas in Rangpur (700 m below), Madhupur (20 m), Kuchma and Bogra (60-125 km), and
Thakurgaon being the main sources of geothermal energy. Meanwhile, the Government of
Bangladesh and Anglo MGH have jointly planned to build a 200 MW geothermal power plant at
Thakurgaon [52].
1.13 Rooftop solar system:
A rooftop solar system or PV system is a process where electricity is generated through solar
panels on the roofs of residential and commercial buildings, and the generated power is used in
that residential or commercial building [53]. Accessories such as photovoltaic modules, mounting
systems, cables, solar inverters, etc. are one of the components of rooftop solar systems [54].
Due to the geographical location of Bangladesh, rooftops may be able to generate enough
electricity using solar systems. The Bangladesh government is planning to generate about 300
MW of electricity on the roofs of government factories and various companies using rooftop solar
systems, which will reduce dependence on fossil fuels and reduce carbon emissions [55]. The
Government of Bangladesh also introduced the Net Metering Guideline on 28 July 2018 to take
the rooftop solar system forward. Rooftop Solar is directly connected to the grid, in the process
the electricity generated goes to the grid after meeting the customer's demand and can get the
price of electricity generated at the end of the year [55].

22 ©Daffodil International University
Fig. 1.13.1: Primary energy consumption in different sector.
A review of our country's power sector shows that about 30.5% of electricity is used in the
residential sector, which is the second highest utilization sector in our country [56]. There is huge
potential for rooftop solar in this residential area, although not all homeowners can afford solar
power. To solve this problem, each building needs to have a net meter.
For the residential sector, according to the rules of net metering, the generating capacity of each
building should not exceed 100 kW, which is an unnecessary constraint. SHS is a type of rooftop
based solar system. Rooftop solar systems have a huge success story in rural Bangladesh. The
project has been dubbed as the largest and fastest growing renewable energy program in the
world [57]. SHS can be successfully installed in urban areas of Bangladesh [57].
Bangladesh has great potential to accelerate power generation through grid-connected solar
photovoltaic systems [58]. This is a good idea for those who want to reduce their electricity bills.
It will cost extra to install net metering, but customers can save a lot more money for life.
Bangladesh on-grid system installation capacity is at least 42 MW. But not all of these are
connected to the net metering system.
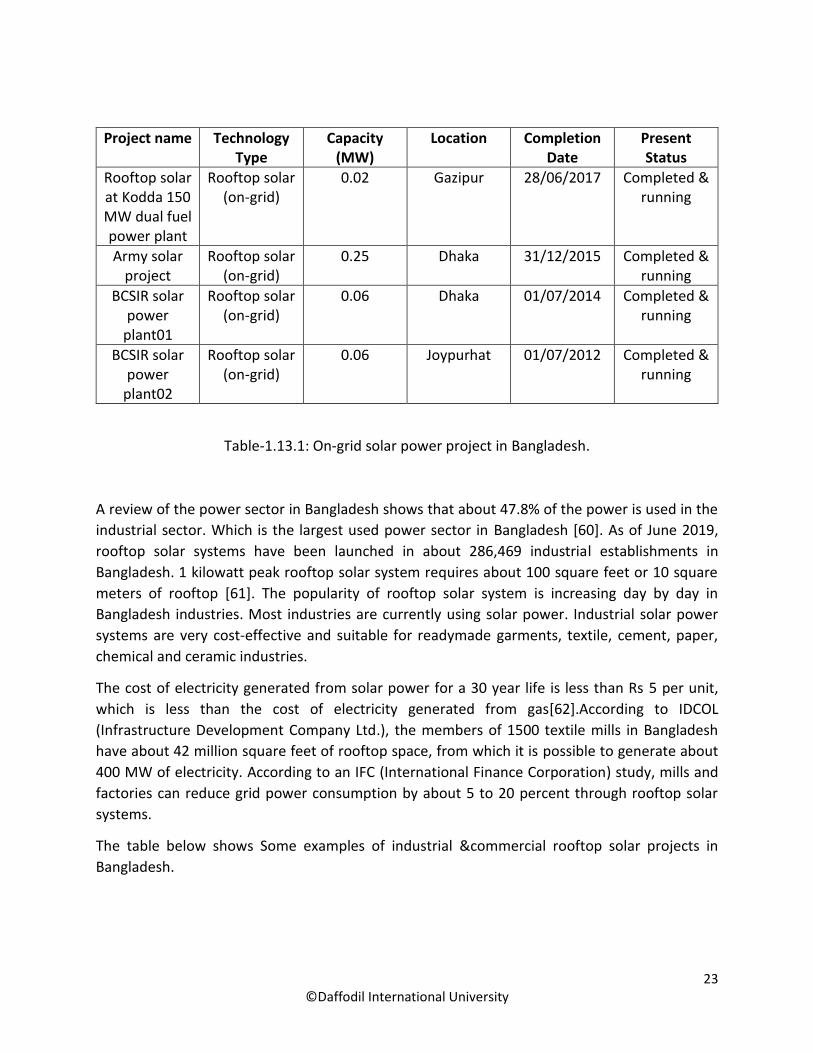
The table gives an example of an on-grid solar power project in Bangladesh.
Source: Ref [59].
23 ©Daffodil International University
Project name Technology Type
Capacity (MW)
Location Completion Date
Present Status
Rooftop solar at Kodda 150 MW dual fuel power plant
Rooftop solar (on-grid)
0.02 Gazipur 28/06/2017 Completed & running
Army solar project
Rooftop solar (on-grid)
0.25 Dhaka 31/12/2015 Completed & running
BCSIR solar power
plant01
Rooftop solar (on-grid)
0.06 Dhaka 01/07/2014 Completed & running
BCSIR solar power
plant02
Rooftop solar (on-grid)
0.06 Joypurhat 01/07/2012 Completed & running
Table-1.13.1: On-grid solar power project in Bangladesh.
A review of the power sector in Bangladesh shows that about 47.8% of the power is used in the
industrial sector. Which is the largest used power sector in Bangladesh [60]. As of June 2019,
rooftop solar systems have been launched in about 286,469 industrial establishments in
Bangladesh. 1 kilowatt peak rooftop solar system requires about 100 square feet or 10 square
meters of rooftop [61]. The popularity of rooftop solar system is increasing day by day in
Bangladesh industries. Most industries are currently using solar power. Industrial solar power
systems are very cost-effective and suitable for readymade garments, textile, cement, paper,
chemical and ceramic industries.
The cost of electricity generated from solar power for a 30 year life is less than Rs 5 per unit,
which is less than the cost of electricity generated from gas[62].According to IDCOL
(Infrastructure Development Company Ltd.), the members of 1500 textile mills in Bangladesh
have about 42 million square feet of rooftop space, from which it is possible to generate about
400 MW of electricity. According to an IFC (International Finance Corporation) study, mills and
factories can reduce grid power consumption by about 5 to 20 percent through rooftop solar
systems.
The table below shows Some examples of industrial &commercial rooftop solar projects in
Bangladesh.

24 ©Daffodil International University
Source: [61,63]
Project name Technology type Location Capacity Present status
Rooftop solar for Paragon Poultry Ltd
Industrial rooftop solar
Gazipur 723.06kW Completed & running
Rooftop solar FESIL
Industrial rooftop solar
Habiganj 1.1MW Completed & running
Rooftop for Tosrifa industry
ltd
Industrial rooftop solar
Dhaka 50kWp Completed & running
Rooftop for M&U packaging
industry
Industrial rooftop solar
Dhaka 200kWp Completed & running
Rooftop for Bashundhara
industrial complex
Industrial rooftop solar
Dhaka 2.46MW Under implementation
Rooftop for Robintex group
company
Industrial rooftop solar
Narayanganj 3.1MW Under implementation
Rooftop for Dhaka stock
exchange
Industrial rooftop solar
Dhaka 47kWp Completed & running
Table-1.13.2: Some examples of industrial &commercial rooftop solar projects in Bangladesh.

25 ©Daffodil International University
1.14 Hybrid Solar System:
Fig. 1.14.1: Hybrid solar system.
The scheme is similar to an on-grid solar system with a hybrid inverter attached, allowing
customers to use the grid only when they need electricity. One of its features is that this hybrid
solar system provides power when the power goes out and in case of emergency [64]. Having a
lot of light produces a lot of energy which is stored in the battery after meeting the demand.
Hybrid solar systems with battery backup are dependent on sunlight, so the process does not
generate much electricity in the winter. Due to the complexity of the hybrid solar system,
installing batteries in it is quite expensive. This hybrid solar system is not very popular in
Bangladesh due to its initial difficulties.
1.15 Problem Statement:
At present, global warming has become a major problem. Because the amount of carbon emitted
into the atmosphere, and the polar ice caps melting, the extinction of various wildlife, reminds
us that we are destroying the earth. So, the demand for clean energy is increasing day by day all
over the world. It is now a popular means of generating electricity from solar radiation using
sunlight as a source.
Although there are some obstacles in the process of generating electricity from solar. As it cannot
generate energy at the same rate throughout the year, it has the effect of weather change. Until
we can develop a solar system whose efficiency remains the same throughout the year, we must
continue to work on solar system development. Because we can't think of a world where there
will be people and no world.
26 ©Daffodil International University
1.16 Scopes:
Bangladesh is a developing country and so far, 100% of the people of the country have not got
access to electricity. As fossil fuels are the main source of energy production in the country and
its quantity is declining day by day, fossil fuels have adverse effects on the environment, and solar
power can play an important role in moving the country towards future sustainable
development. The country's residential and commercial buildings can generate electricity
through rooftop solar systems, which reduces the pressure on the country's power generation,
thereby reducing a large pressure on fossil fuels.
1.18 Objective of Thesis:
1.This could be a game changer for achieving sustainable energy development of Bangladesh.
2. Since the average income of the people of Bangladesh is low, to provide electricity facility at
very low cost.
3. Reducing the pressure on the power plant through hybrid system.
4. Generating more and more electricity from renewable energy sources.
5. Reducing stress on fossil fuels.
6. Reducing the amount of carbon dioxide in the environment.
1.19 Thesis Outline:
1.Introduction
2.Literature review
3.Theory
4.Calculation
5.Result
6.Conculation

27 ©Daffodil International University
CHAPTER-2 Literature
Electricity is a very important element of our lives without which life has become almost
impossible. Compared to the world energy, the condition of primary energy power of Bangladesh
is not good at all. With most of Bangladesh's electricity generated from fossil fuels , access to
electricity has become a major challenge. And to meet this challenge, Bangladesh can meet the
demand for electricity by using solar energy. With solar, biomass, biogas, hydropower, wind
power, etc. all around us, it is possible to develop rural and urban economies by generating
electricity from these sources.
However, shifting to a renewable energy source reduces carbon emissions in nature, and on the
other hand, aids in the goal of moving to an alternative source of energy. Renewable energy
currently accounts for 17% of the world's total energy, with a target of 60% by 2070[65]. Due to
its geographical location, solar energy has become a major source of renewable energy in
Bangladesh. The popularity of hilly, coastal, rural national grid has increased day by day.
Considering the various opportunities and future possibilities of solar technology, the
Government of Bangladesh and various NGOs are working together to understand and address
the power shortage by encouraging the public to use the Solar Home System (SHS) in both off-
grid and on-grid. According to the Renewable Energy Policy, solar panels should be used in cases
where the power requirement exceeds 2 KW.
There is no alternative to reviewing, testing, and researching on the use of solar energy in
Bangladesh, commercial production, increasing its use in factories, and for the overall economic
development of the country, to further increase the efficiency of solar energy. Very little research
has been done on the technology and economic evaluation of renewable energy sources in
Bangladesh [66,67]. Hossain and his colleagues conducted a study on various marketing
strategies for the solar business [68]. The study highlights the problems associated with
Bangladesh's solar energy business.
Haldar studies the economic viability of three different power (20 Wp, 30Wp, 42Wp) solar home
systems in two randomly selected villages in Bangladesh [69]. Khan and Matin review their
research on various biogas digester technologies used in Bangladesh [70]. They have found in
their research that it is possible to improve the quality and quantity of biogas, if different
parameters (e.g., temperature, pH, movement, etc.) can be controlled.
On the other hand, Hussein and his colleagues have done research on power generation and
chemical production from biomass [71]. Taskin Jamal and his colleagues have worked with

28 ©Daffodil International University
rooftop solar panels. Where they highlight the various advantages and possibilities of rooftop
solar panels [72]. Shahriar Ahmed and his colleagues have done research on the Solar rooftop. In
the study, they compared the city of Dhaka in Bangladesh and some cities in Germany and
pointed out the possibility of meeting the electricity demand through solar rooftops on different
roofs of Dhaka city [73].
In this paper we have tried to highlight the aspect of meeting the demand for electricity through
solar rooftops using the roofs of mills, commercial buildings, residential buildings located in
Dhaka city.
On the main building of our university (Daffodil International University) located in Dhaka city,
we have conducted an experiment of solar rooftop. And we have tried to highlight the issues in
this paper.

29 ©Daffodil International University
CHAPTER-3 Theory
Solar energy is created through sunlight. Solar modules or photovoltaic systems convert light into
electrical energy during the day. It usually has a limitation of 20 to 100WP. Electricity generated
in solar panels is stored in batteries for uninterrupted power in bad weather and at night. A
charge controller is a device that protects the battery from electrical damage. When the battery
is not charged or the module does not work properly, the charge controller warns the buyer.
Solar Residential System (SRS) typically operates at a 12volt coordinate current, and this power
is used in lights and other equipment through light emitting diodes (HANKINS 1993: 10) [74]. A
50WP SRS can provide uninterrupted connection for up to about five hours on 4 lights and a 15-
inch TV. A solar PV system usually has solar panels, charge controllers, batteries, inverters, loads,
etc. connected.
3.1 Solar Panel:
Solar panels are usually made of photovoltaic (PV) cells, which convert daylight into electrical
energy.
Fig.3.1.1: Solar Panel

30 ©Daffodil International University
3.2 Charge controller:
If a battery is installed in a solar PV system then a charge controller is required. A charge
controller controls the uncertain volt build-up of a solar PV system. On a bright day, solar cells
can generate excess voltage, which can significantly damage the battery. The charge controller
protects the battery from damage by maintaining a balance of excess voltage.
Fig. 3.2.1: Charge controller
3.3 Batteries:
Batteries are usually used to store charges. There are many types of batteries on the market, but
not all are suitable for solar PV technology. Batteries made of nickel or cadmium are more
commonly used. High concentration batteries like sodium, sulfur, zinc, bromine etc. are also
used. But medium-term batteries made of nickel, metal have the highest cycling performance.

31 ©Daffodil International University
Iron, Chromium, Red Ox and Zinc or Manganese batteries are best for long term performance.
Absorbent glass mat (MAT) batteries are also ideal for use in solar PV systems[75].
Fig. 3.3.1: Battery
3.4 Inverter:
Fig. 3.4.1: Inverter

32 ©Daffodil International University
The job of an inverter is to convert direct current (DC) to alternating current (AC). Alternating
current (AC) can be converted to any frequency and voltage through the inverter, resulting in
proper use of transformers, switching and control circuits. Inverters are commonly used to supply
renewable energy or direct current (DC), such as alternating current (AC) power from solar panels
or batteries. Electrical inverter is a high-power electronic oscillator.
Inverters are designed to convert from 12-volt current (DC) source to 115-volt alternating current
(AC). This inverter generates 1.2Amps alternating current (AC) which can turn on two 60-watt
lights.
3.4.1 String inverter:
Fig. 3.4.2: String Inverter
1. Beautiful to see string inverter.
2. Small and medium size PVs are commonly available at power stations.
3. User-friendly interface.
4. Its power level is 1.5 KW to 6 KW.

33 ©Daffodil International University
3.4.2 Power plant inverter:
It is usually a long size PV Transformer type and transformer-less type is designed. As if it can be
used in any power station. A grid-tie inverter (GTI) is a special type of inverter used to convert
direct current (DC) from renewable energy to alternating current (AC) and to be used in utility
grids. The technical name of this grid-tie inverter is “grid-interactive inverter”. It is also called
synchronous inverter. Grid-interactive inverters are not commonly used in standalone
applications, where utilities are not commonly available.
Fig. 3.4.3: Power plant inverter
3.5 Hybrid optimization of Multiple Electric Renewable (HOMER):
Homer is a micro power optimization model that simplifies the design of power systems for a
variety of applications such as off-grid and on-grid. Homer can model both single and multiple
technologies and compare multiple combinations of different technologies. But due to the huge
number of alternative technologies and the high cost of technology, the availability of energy
resources makes it difficult to model the system. The sensitivity of Homer's system optimization
and algorithm analysis makes it possible to evaluate many potential system configurations. This

34 ©Daffodil International University
software was first developed in 1993 to understand trade-offs in various word production
configurations of the DOE (Department of Energy). But a few years later, NREL (National
Renewable Energy Limited in the United States) released the software for free to provide a
growing expansion service to designers interested in renewable energy production.

35 ©Daffodil International University
CHAPTER-4 SYSTEM DESIGN
Currently about one-third of the world's population lives in poverty. About 75% of this poor living
population lives in villages. Rural areas often lack energy, clean water and healthcare, as there is
little incentive to increase these services as they are costly. Traditional grids in rural areas cannot
be easily extended, so diesel generators are used for power generation and water extraction,
which is harmful to the environment, climate and wind. Considering the technical aspects of
protection from this harmful aspect, it is seen that photovoltaic solar system is a good way for
the rural community. Photovoltaic systems are now modular and easily expandable. Photovoltaic
systems and panel production have increased worldwide, and their market value is now
declining.
4.1 Location
A photovoltaic solar home system project with 20kW power capacity is done on our permanent
campus. Our permanent campus is located at Ashulia, Savar, Dhaka, Bangladesh. In this
photovoltaic solar home system, we have considered a 11 kilowatts solar photovoltaic system.
Fig. 4.1: Location Selection.
36 ©Daffodil International University
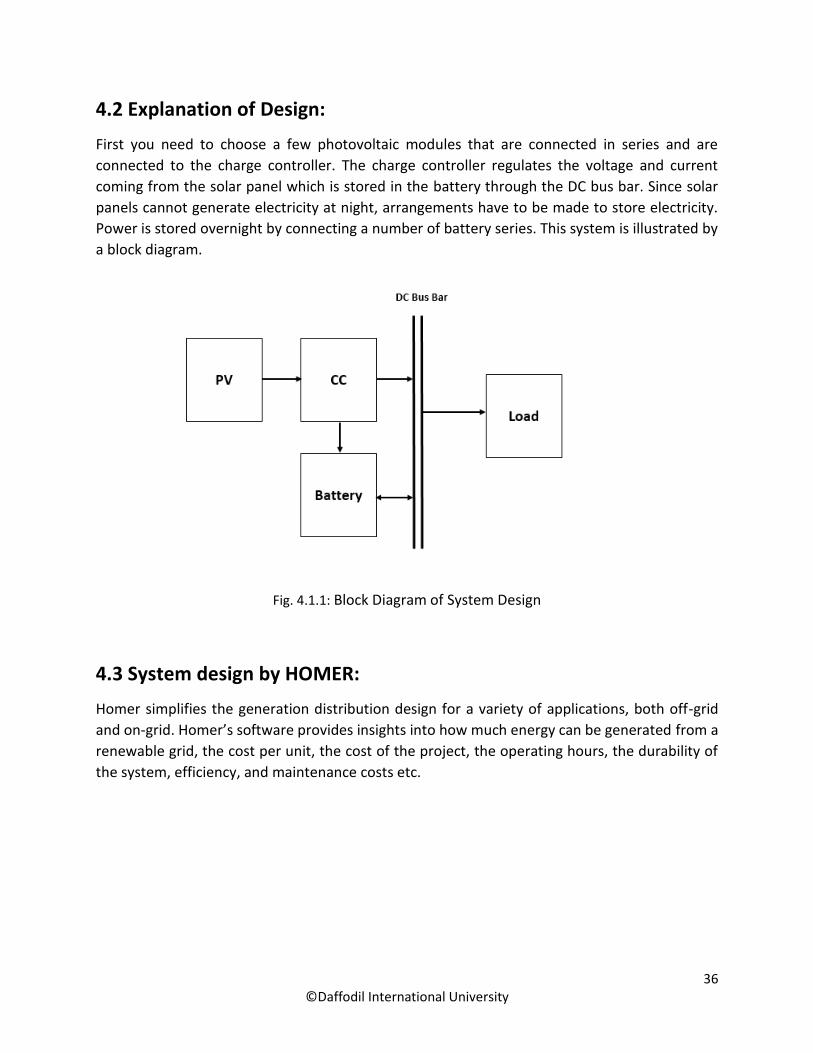
4.2 Explanation of Design:
First you need to choose a few photovoltaic modules that are connected in series and are
connected to the charge controller. The charge controller regulates the voltage and current
coming from the solar panel which is stored in the battery through the DC bus bar. Since solar
panels cannot generate electricity at night, arrangements have to be made to store electricity.
Power is stored overnight by connecting a number of battery series. This system is illustrated by
a block diagram.
Fig. 4.1.1: Block Diagram of System Design
4.3 System design by HOMER:
Homer simplifies the generation distribution design for a variety of applications, both off-grid
and on-grid. Homer’s software provides insights into how much energy can be generated from a
renewable grid, the cost per unit, the cost of the project, the operating hours, the durability of
the system, efficiency, and maintenance costs etc.

37 ©Daffodil International University
Fig. 4.2.1: System Design by HOMER
4.4 Daily Load profile:
Educational institutions generally do not require electricity 24 hours a day, seven days a week.
So, the profile is usually made on an hourly basis, when the load is used. Usually in the afternoon
solar panels can't do much due to lack of light. Bangladesh does not have the same solar radiation
every time of the year so the same amount of electricity is not generated every day. Since
Bangladesh is a conspiratorial country, the demand for electricity is not always the same. The
daily load profile can generally be divided into three categories based on this power demand.
November to February
March to June
July to October
Daily Load November to February:

38 ©Daffodil International University
Fig. 4.3.1: Daily Load November to February
Daily Load March to June:
Fig. 4.3.2: Daily Load March to June

39 ©Daffodil International University
Daily Load July to October:
Fig. 4.3.3: Daily Load July to October
4.5 Seasonal profile:
Considering the above daily load curve is used in the monthly load curve. This monthly load curve
is created using the seasonal profile where the maximum load, the minimum load, of the month
is shown.
Fig. 4.4.1: Seasonal Profile
4.6 Homer Input value:
Since Homer software is an off-grid design system, we have to give some number of input values
like photovoltaic, diesel generator, biomass generator, battery etc. To design an off-grid system
is to give input values to everything in Homer software.

40 ©Daffodil International University
4.7 Photovoltaic Array (PV):
The lifespan of a photovoltaic array is 25 years. Here an 11-kW photovoltaic array is used with a
nominal operating cell temperature of 47⁰C.
Fig. 4.6.1: Photovoltaic Array

41 ©Daffodil International University
4.8 Battery:
12 voltage Vision FM 200 D type battery is used, With a capacity of 200Ah, lifetime 917 kWh.
Here five batteries are used where the maintenance cost of each battery is .10$. And replacement
cost 1000.
Fig. 4.7.1: Battery details

42 ©Daffodil International University
4.9 Solar resource:
Fig. 4.8.1: Solar Resource

43 ©Daffodil International University
4.10 Economics:
Lifetime of the project is 25 years; annual interest is 6%. The fixed capital cost of the system is
700$ and the maintenance cost is 120$.
Fig. 4.9.1: Economics details

44 ©Daffodil International University
CHAPTER 5 CALCULATION
5.1 Load Definition:
Here are all the classrooms in a unit of Daffodil International University's EEE department, where
30 LED lights, 30 DC fans are considered. Since the load profile is divided into 3 parts, the
operating time of the light and the fan is different. Needless to say, the operating time of the 14
lights of the year is a total of 3 hours/day from 6 pm to 9 pm. So, from November to February the
operating time of 30 lights is 9 hours/day, and the operating time of 15 fans is 3 hours/day. The
power of each light is 7W, and the power of DC fan is 30W. So, the amount of daily total load is
3.534KWh. It is described in Table.
Loads Power Ratings[W] No. of Pieces Operating hours/day
LED light 7 30 9
LED light 7 14 3
Fan 30 15 3
Table-5.1.1: load definition-1
From March to June the operating time of thirty lights is 6 hours/day and the operating time of 30 DC fans
is 9 hours/day and. So, the amount of daily load is 9.654KWh. It is described in Table.
Loads Power Ratings[W] No. of Pieces Operating hours/day
LED Light 7 30 6
LED Light 7 14 3
Fan 30 30 9
Table-5.1.2: load definition-2
The operating time of 30 lights from July to October is 7 hours/day, and the operating time of 30 DC fans
is 9 hours/day so the daily load is 9.864KWh. It is described in Table.

45 ©Daffodil International University
Loads Power Ratings[W] No. of Pieces Operating hours/day
LED Light 7 30 7
LED Light 7 14 3
Fan 30 30 9
Table-5.1.3: load definition-3
From the equation bellow, the energy per day 𝐸𝑑 can be determined.
Where,
k=index of each type of load like fan, light etc.
𝐴𝑘=numbers of hours 𝑘𝑡ℎdevice type used per day
𝑄𝑘=device number of 𝑘𝑡ℎtype
𝑃𝑘=power of 𝑘𝑡ℎ device type.
5.2 Daily load Profile:
Observing the seasonal profile shows that, the maximum value of daily load is 9.864KWh, which
is required from July to October. At this time about 187.968 KWh load is required per month.
Also 77.75 KWh load is required from November to February and 178.068 KWh load is required
from March to June.
5.3 Size Consideration of PV Array:
The lifetime of a photovoltaic system is 25 years. The cost of PV system per kilowatt
250$.Complete PV system installation cost 700$, operation and maintenance cost 120$.From the
bellow equation, we can find PV generation capacity.
Where,

46 ©Daffodil International University
𝐼𝑑=number of avg. hours sun shine.
d=de-rating factor, which defines the effect of efficiency and solar generation changes through
day.
In Bangladesh, 𝐼𝑑 and d values are 5h and 80% respectively.
5.4 Battery Size:
Batteries are usually used to supply electricity at night or in bad weather. Here 12-volt 200Ah
battery is used. Whose lifetime is 6 years. The installation, replacement and operation, and
maintenance costs of this battery are 241$, 241$ and 0.1 $/year respectively.
5.5 Charge controller:
The charge controller is identical to the voltage regulator. Charge controllers usually protect the
battery. The voltage and current generated from the solar panel are stored in the battery through
a charge controller. Charge controllers are usually 16 to 20-volts and cost 70$.
5.6 Solar Radiation:
Through HOMER software, for solar radiation, the value of solar radiation is taken from the NASA
website. Our solar panel installation locations are 23⁰ 59’ north latitude and 90⁰19’ east
longitude.

47 ©Daffodil International University
CHAPTER 6 Result and Discussion
In this solar system, the solar panels are installed on the roof. This system has no grid connection.
The power supply starts shortly after the solar system is switched on, and the battery is charged
as a backup so that there is no problem with the power supply at night and in bad weather. The
charge controller protects the battery from being fully discharged and from overcharging.
Homer Software designed the complete solar home system, where the maximum load per day
was 9.864 kWh, and the full load per hour was 1.11 kWh.
6.1 Optimized Result:
Figure 6.1.1: optimize result from HOMER.
We've got an optimized result after the entire system has been managed by Homer Software. An
analysis by Homer Software shows that the 13 kW photovoltaic panel requires four 6FM200D
batteries, each 200Ah and 12 V. The results are based on the minimum LCOE and SHS operating.
The following equation is used to calculate LCOE.
Where, LCOE=0.280$/kWh (23.76 tk/kWh).
In this complete system, 13 kW solar panels are installed in the parallel form so that there is no
shortage of power in the system's load. Four 6FM200D batteries are connected in series so that
there is no problem in load demand, and the bag is connected at night or in bad weather.

48 ©Daffodil International University
6.2 Overall Result:
Overall, the results analysis shows that the whole system is 13 kW. This complete system uses
four Vision 6FM200D batteries. The entire system costs 7180$ to install, the cost per kilowatt of
electricity is about .280$, and the operating cost is $177 / year. The system capital costs 3250$
for solar panels, 964$ for batteries, 700$ for other capital costs, and total capital cost 4914$.
Capital cost are shown in Table:
Component Capital Cost($)
PV 3250
Vision 6FM200D 964
Other 700
System 4914
Table 6.2.1: System Capital cost
There is an annual cost to maintain the entire system, such as yearly capital cost for solar panels
254$, annual capital cost 75$ for batteries, and other annual capital costs 55$, total annual capital
cost 384$. The annual capital cost is shown in Table:
Component Capital cost($)
PV 254
Vision 6FM200D 75
Other 55
System 384
Table 6.2.2: System annual cost
The system generates about 16998 kilowatts of electricity per year. The maximum power
generation capacity of this system is from October to April. But only 2003 kilowatts of electricity
are used. The system generates 13 kW, mean output 1.94 kW, daily mean output 46.6 kW, and
about 16998 kWh of electricity per year. This system has string size 1, strings in parallel 4,
batteries 4, and bus voltage 12 v. The system's nominal capacity is 9.60 KWh, Usable nominal
capacity 5.76KWh, Autonomy 25.2 hr. Lifetime throughput 3668KWh, Battery wear cost .294
$/KWh, and average energy cost 0.00 W/KWh.

49 ©Daffodil International University
Fig. 6.2.1: Monthly Avg. electric production.
6.3 Cost Analysis:
If the system was connected to the grid, users would have to pay an average of about 464.16
units of electricity per month. Where the price of electricity per unit 0.071$. And after 25 years
a total of 9925$ had to pay the electricity bill. And the total cost of installing this complete solar
home system is 7180$, we can profit 2745$ from this project. It is possible to reduce the
electricity bill about 109.8$ per year by installing solar home system. Calculations can be made
using payback period equations.
Where,
𝐶𝑝𝑣=total cost of rooftop solar system
𝐶𝐶𝑢𝑛𝑖𝑡=cost of per unit energy
After about 18 years, its initial cost will be recovered. This means that the payback period of the
system is about 18 years. If the rooftop solar home system user gets 40% support from the
Figure 6.3.1: Cash flow summary for SHS.

50 ©Daffodil International University
government, its payback period will be much less than the current payback period. And users will
be able to save their money. In an SHS, 80% of the total cost is battery-based because of its short
lifespan. Below is a picture of the price. The cost summary above shows that most of the capital
cost is for solar panels. The replacement cost is higher for the short life of the battery. The specific
model of the battery is 6FM200D. The longer the life span of PV solar panels, the greater the
benefits of solar systems. Below is the annual cash flow chart.
Figure 6.3.2: Annual cash flow chart.
6.4 Environmental Impacts:
Fossil fuels are the main source of power generation in Bangladesh. And these fossil fuels emit
carbon dioxide into the atmosphere. Therefore, it can be said that for power generation in
Bangladesh, a large amount of carbon is constantly being emitted into the environment, which is
having an adverse effect on the environment.
If the efficiency of a power plant is 34%, and coal is used as fuel, 1kg of carbon dioxide is emitted
into the environment for every 1 kilowatt of electricity generated. This shows that if we use
5605.92 kwh of electricity per year from the national grid, it will emit 5.605 tons of carbon dioxide
per year and 140.148 tons of carbon dioxide in 25 years. Natural gas power plants generate 0.549
kg of carbon dioxide to generate 1 kilowatt of electricity [76]. This stands at 76.941 tons of carbon
emitted in 25 years.
Grid Emission Factor (GEF) of Bangladesh is 0.67-ton carbon dioxide per MWh, according to the
Government of Bangladesh, Ministry of Environment [77]. This amounts to 93.899 tons of carbon
dioxide emissions in 25 years.

51 ©Daffodil International University
Our proposed solar system does not produce any carbon dioxide. Therefore, it is possible to
reduce the amount of carbon dioxide in the environment by increasing its use. So we can say
that, the proposed solar system is not only economically affordable, but also plays a very helpful
role in reducing the amount of carbon dioxide in the environment. There is a table for
environmental impact:
For Grid
Electricity Produce(KW) Carbone Emission(Ton) Year
Coal 140148 140.148 25
Natural Gas 140148 76.94 25
According Ministry of Environment
140148 93.899 25
For Solar PV
Electricity Produce(KW) Carbone Emission(Ton) Year
424950 0.00 25
Table 6.4.1: Environmental impact for grid and solar PV.

52 ©Daffodil International University
CHAPTER 7 Conclusions
Most of the energy needed to meet world energy demand comes from fossil fuels. Bangladesh is
no exception. Most of the national power generation in Bangladesh also comes from fossil fuel-
based power plants, highly cost-effective. Even burning fossil fuels to generate electricity will
increase the pressure on natural resources such as coal, gas, oil, etc. and negatively impact the
environment.
On the other hand, the production of electricity from solar energy reduces the pressure on fossil
fuels, lowers production costs, and has no adverse effects on the environment. And because of
the easy availability of solar energy in our country, it makes electricity generation easier. Our
study shows that the cost of electricity generated in this system is low. The price per unit of
electricity falls to .280 $, and its maintenance cost is also low so that the desired power can be
obtained continuously from this system for 25 consecutive years. This will reduce costs and
reduce the demand for electricity on the national grid and reduce the amount of carbon dioxide
in the atmosphere. Like other countries globally, Bangladesh is leaning towards renewable
energy sources, and solar energy can play an essential role as a source of renewable energy.
Through its proper use, it is possible to take the country's economy forward.
It is impossible to get 100% output from any system, so the efficiency of every component used
in the system to generate electricity from solar energy needs to be increased, continuous
research needs to be done on it, the initial investment cost of solar system needs to be reduced.
In conclusion, solar power can play a valuable and complementary role in meeting the power
demand of Bangladesh's economic sectors, above all, to keep the country's economy afloat.

53 ©Daffodil International University
References [1] I. A. Adejumobi, S.G. Oyagbinrin, F. G. Akinboro & M.B. Olajide, “Hybrid Solar and Wind Power: An Essential
for Information Communication Technology Infrastructure and people in rural communities”, proc. IJRRAS,
Volume 9, Issue1, October 2011, pp 130-138
[2] British Petroleum Energy Outlook 2035, January 2014, available at <<https://on.bp.com/2UfCvW5>>, last access
on 27-07-2020.
[3] V.K Mehta, Rohit Mehta, “Principles of Power Systems”, Chapter 1, 2005
[4] World energy consumption available at <<https://en.wikipedia.org/wiki/World_energy_consumption>>, last
access on,27-07-2020.
[5] “Table 52 Global supply of coal, 1990–2009” pp. 44-45, proc in "Energy in Sweden — facts and figures 2010"
(PDF). Swedish Energy Agency. Archived from the original (PDF) on 14 October 2013, data from IEA Energy
Balances of Non-OECD countries 2010.
[6] Global Energy Review 2020, available at <<https://www.iea.org/reports/global-energy-review-2020>>,last
access on, 27-07-2020.
[7] Key statistics 2012, 2010 and 2006, proc. IEA
[8] “How Much Oil Have We Used?”, proc. in Science Daily, 8 May 2009. Retrieved March 2014, last access on,
03-08-2020.
[9] “Table 50 Global supply of gas 1990–2009” pp. 44, proc. in "Energy in Sweden — facts and figures 2010" (PDF).
Swedish Energy Agency. Archived from the original (PDF) on 14 October 2013, data from IEA Energy Balances
of Non-OECD countries 2010.
[10] World Nuclear Association, at <<www.world-nuclear.org >>, last access on 03-08-2020
[11] "Renewables 2019: Global Status Report" (PDF), proc. in REN21 (2019). last access on, 03-08-2020.
[12] Ellabban O, Abu-Rub H, Blaabjerg F. “Renewable energy resources: current status, future prospects and their
enabling technology” Renew Sustain Energy Rev 2014
[13] "Use and Capacity of Global Hydropower Increases" proc. in Worldwatch Institute, January 2012.
[14] "GWEC Global Statistics" proc in Global Wind Energy Council.
[15] Lars Kroldrup,” Gains in Global Wind Capacity Reported Green Inc.”, 15 February 2010.
[16] "Renewables 2011: Global Status Report" (PDF), REN21 (2011), pp. 15.
[17] "World Wind Energy Report 2010" (PDF) Archived from the original (PDF) on 4 September 2011. Retrieved 30
April 2011.
[18] “REN21 Renewables 2011: Global Status Report" (PDF). p. 11.
[19] Statistical review of worldenergy, at <<https://on.bp.com/2UdduLa>> last access on,10-08-2020.
[20] Npsum Solar, available at << http://www.iea.org/Textbase/npsum/solar2011SUM.pdf>> last access on,10-08-
2020.
[21] Renewable energy, available at << https://www.bp.com/en/global/corporate/energy-economics/statistical-
review-of-world-energy/renewable-energy>> last access on, 18-08-2020.
[22] “The Future of Geothermal Energy" (PDF) Archived from the original (PDF) on 10 March 2011. Retrieved 7
February 2007.
[23] The world bank, “Bangladesh review”.
[24] Bangladesh Power Development Board “Key Statistics", Retrieved 3 November 2014.
[25] “Celebrating 20,000MW of power" proc. in Dhaka Tribune, 8 September 2018. Retrieved 4 January 2019.
[26] Rashid and Sajjad "Powering the nation", proc. in Dhaka Tribune, 20 August 2018.
[27] “Source of Light in Bangladesh: 2015", Archived from the original on 15 August 2017. Retrieved 8 June 2017.
[28] "Booming Energy Sector of Bangladesh: 90 Percent Have Access to The Electricity", proc. in Bangladesh News
Network, 12 July 2018. Retrieved 17 July 2018.
[29] "Govt plans to sign energy pact with Bangladesh", proc. in The Himalayan Times, 16 April 2018. Retrieved 9
May 2018.
[30] H. Abdolrahimi and H. K. Karegar, “Optimization and sensitivity analysis of a hybrid system for a reliable load
supply in KISH_IRAN,” proc. in International Journal of Advanced Renewable Energy Research, vol. 1, no.
4, pp. 33–41, 2012.

54 ©Daffodil International University
[31] M.R. Islam, P.C. Sarker, S.K.J.R. Ghosh, S.E. Reviews, “Prospect and advancement of solar irrigation in
Bangladesh: A review”, proc. in sciencedirect, volume 77 (2017).
[32] B.R. Scanlon, B.L. Ruddell, P.M. Reed, R.I. Hook, C. Zheng, V.C. Tidwell, S.J.W.R.R. Siebert, “The food‐
energy‐water nexus: Transforming science for society”, proc. in AGU publications (2017).
[33] Z. Tan, H. Zhang, J. Xu, J. Wang, C. Yu, J.J.J.o.E.E. Zhang,” Photovoltaic power generation in China:
Development potential, benefits of energy conservation and emission reduction”, 138 (2011) 73-86.
[34] N.G.M.J.G. BPDB, Bangladesh Power Development Board, 88 (2010).
[35] P. Action, “Poor People's Energy Outlook 2016: National Energy Access Planning from the Bottom Up”, proc.
in Practical Action Publishing (2016).
[36] G. Plan, Power Division, Ministry of Power, Energy and Mineral Resources, Government of the people ‘s
republic of Bangladesh in, 2018.
[37] Wazed M, Ahmed S. “Micro hydro energy resources in Bangladesh: a review”. Proc.in Australian Journal of
Basic and Applied Sciences, 2(4): 1209-1222, 2008.
[38] Mondal MAH, Kamp LM, Pachova NI. “Drivers, barriers, and strategies for implementation of renewable energy
technologies in rural areas in Bangladesh—An innovation system analysis”.
[39] Sustainable and Rural Energy Development Authority. Available at << http://www.sreda.gov.bd/>> last access
on,05-09-2020
[40] Islam, M.Z.; Mashsharat, A.; Mim, M.S.; Rafy, M.F.; Pervei, M.S.; Rahman Ahad, M.A. “A Study of Solar
Home System in Bangladesh: Current Status, Future Prospect and Constraints”. Proc. in 2nd International
Conference on Green Energy and Technology, Dhaka, Bangladesh, 5–6 September 2014; pp. 110–115.
[41] Amin,A.;Sultana,A.;Hasan,J.;Islam,M.T.;Khan,F.”Solar home system in Bangladesh: Prospects,challenges and
constraints”. Prroc in 2014 3rd International Conference on the Developments in Renewable Energy Technology
(ICDRET), Dhaka, Bangladesh, 29–31 May 2014; pp. 1–5.
[42] Hasan, F.; Hossain, Z.; Rahman, M.; Ar Rahman, S. “Design and Development of a Cost Effective Urban
Residential Solar PV System”.proc. in In Proceedings of the 3rd International Conference on the Developments
in Renewable Energy Technology, Dhaka, Bangladesh, 29–31 May 2014.
[43] Chowdhury, P.; Jenkins, A.; Islam, Z.S.; Jenkins, A.; Islam, Z.S. “Feasibility of solar-biomass hybrid cold storage
for unelectrified rural areas of Bangladesh”. “In The Environmental Sustainable Development Goals in
Bangladesh”; Selim, S.A., Saha, S.K., Sultana, R., Roberts, C., Eds.; Routledge: London, UK, 2018; pp. 45–55.
[44] Faraz, T. “Benefits of Concentrating Solar Power over Solar Photovoltaic for Power Generation in
Bangladesh”.proc. in IEEE 2nd International Conference on the Developments in Renewable Energy Technology
(ICDRET 2012), Dhaka, Bangladesh, 5–7 January 2012; pp. 1–5.
[45] M.T. Islam, S. Shahir, T.I. Uddin, A.J.R. Saifullah, S.E.” Current energy scenario and future prospect of
renewable energy in Bangladesh”, Renewable and Sustainable Energy Reviews 39 (2014) 1074–1088.
[46] M. Uddin, K. Techato, J. Taweekun, M. Rahman, M. Rasul, T. Mahlia, S. Ashrafur, “An Overview of Recent
Developments in Biomass Pyrolysis Technologies”, Energies, 11 (2018) 3115.
[47] S. Jacobsson, A.J.E.p. Johnson, “The diffusion of renewable energy technology: an analytical framework and
key issues for research”, 28 (2000) 625-640.
[48] S. Baek, E. Park, M.-G. Kim, S.J. Kwon, K.J. Kim, J.Y. Ohm, A.P.J.R.E. del Pobil, “Optimal renewable power
generation systems for Busan metropolitan city in South Korea”, Renewable Energy 88 (2016) 517-525.
[49] P. Halder, N. Paul, M. Joardder, M.J.R. Sarker, S.E. Reviews, “Energy scarcity and potential of renewable energy
in Bangladesh”, Renewable and Sustainable Energy Reviews 51 (2015) 1636–1649.
[50] M.A.H. Mondal, M. Denich, T.J.E.S.R. Mezher,” Deployment of renewable energy technologies in Bangladesh:
Long-term policy implications in power sector”, Energy Strategy Reviews 2 (2014) 307-312.
[51] B.J.B. Petroleum, London, Statistical review of world energy 2007, (2009).
[52] M. Hassanuzzaman, A. Shahriar, S.T. Faisal, “Geothermal energy and its scope in Bangladesh, in: Developments
in Renewable Energy Technology (ICDRET)”, proc. in 2014 3rd International Conference on the, IEEE, 2014,
pp. 1-5.
[53] Armstrong, Robert (12 November 2014). "The Case for Solar Energy Parking Lots". Absolute Steel. Retrieved
15 November 2014.
[54] "Photovoltaic power generation in the buildings. Building integrated photovoltaic–BIPV" (PDF). bef-de.org.
Retrieved 2011-06-20.

55 ©Daffodil International University
[55] “Govt eyes 300MW rooftop solar power” Daily star,17 sept,2019.
[56] Annual Report 2017-2018 by SREDA (Sustainable and Renewable Energy Development Authority), ROOFTOP
SOLAR SYSTEM, p. 99.
[57] Sustainable & Renewable Energy Development Authority (SREDA), Solar Home System, available at
<<http://www.sreda.gov.bd/index.php/site/page/c5ab-2cb1-00a8-0579-02a3-f64c-7db9-8a50-1d2b-5670>>,last
access on,07-09-2020
[58] Arup Kumar Biswasa, BoonrodSajjakulnukita, PattanaRakkwamsukb,” Subsidy Policy Instruments for Rapid
Growth of Photovoltaic Electricity Generation in Bangladesh”, proc. in 2013 International Conference on
Alternative Energy in Developing Countries and Emerging Economies, p. 69.
[59] Sustainable & Renewable Energy Development Authority (SREDA), available at
<<http://www.sreda.gov.bd/index.php/site/re_present_status>>,last access on,12-09-2020
[60] Annual Report 2017-2018 by SREDA (Sustainable and Renewable Energy Development Authority), ROOFTOP
SOLAR SYSTEM, p. 99.
[61] Mohammad Alauddin,” Rooftop solar power: The go-to option for industrial consumers”, published: December
09, 2019 in The Financial Express, available at << https://bit.ly/3pf82Wz>> last access on,12-09-2020.
[62] SCUBE Industrial rooftop solar power plant, Grid-tied Rooftop Solar System-Low cost power to your company
available at <<http://scube.com.bd/solutions/industrial-rooftop-solar-power-plant/>>,last access on,15-09-2020.
[63] “Net Metering Solar Rooftop System”, Rahimafrooz Renewable Energy Limited, published in 9 March
2019,available at <<http://www.sreda.gov.bd/d3pbs_uploads/files/Raahim%20Afrooz.pdf>>,last access on,15-
09-2020.
[64] Rooftop solar systems in Bangladesh, available at <<http://vec.com.bd/rooftop-solar-systems-bangladesh/>>,
last access on,20-09-2020.
[65] Hossain A, Badr O. “Prospects of renewable energy utilisation for electricity generation in Bangladesh”.
Renewable and Sustainable Energy Reviews 11 (2007) 1617–1649.
[66] Salehin S, Rahman MM, Islam AS. “Techno-economic feasibility study of a solar PV diesel System for
applications in Northern Part of Bangladesh”. proc. in International Journal of Renewable Energy Research
(IJRER) 2015; 5:1220–9.
[67] Islam A, Shima FA, Khanam A. “Analysis of grid connected solar PV system in the southeastern part of
Bangladesh”. Applied Solar Energy 2013; 49:116–23.
[68] Hossain MF, Hossain S, Uddin MJ. “Renewable energy: Prospects and trends in Bangladesh”. Renewable and
Sustainable Energy Reviews 70 (2017) 44–49.
[69] Halder PK. “Potential and economic feasibility of solar home systems implementation in Bangladesh”.
Renewable and Sustainable Energy Reviews 65 (2016) 568–576.
[70] Khan EU, Martin AR. “Review of biogas digester technology in rural Bangladesh”. Renewable and Sustainable
Energy Review 2016; 62:247–59.
[71] Mosaddek Hossen M, Sazedur Rahman AHM, Kabir AS, Faruque Hasan MM, Ahmed S. “Systematic assessment
of the availability and utilization potential of biomass in Bangladesh”. Renewable Sustainable Energy Review
2017; 67:94–105.
[72] Taskin Jamal, Weerakorn Ongsakul, Jay Govind Singh, Sayedus Salehin, S.M. Ferdous,”Potential Rooftop
Distribution Mapping using Geographic Information Systems (GIS) for Solar PV Installation: A Case Study for
Dhaka, Bangladesh”.
[73] Shahriar Ahmed, KH. NazmulAhshan, Md. NurAlamMondal,” Rooftop Solar:A Sustainable Energy Option for
Bangladesh By”.
[74] HANKINS, M. (1993): Solar Rural Electrification in the Developing World.Washington, D.C.
[75] “Photovoltaics in Buildings, A Design Handbook for Architects and Engineers”. Editors Friedrich Sick and
Thomas Erge, Fraunhofer Institute for Solar Energy Systems ISE Freiburg, Germany.
[76] “Natural gas power plants emit 40% less CO2 than coal plants, says study”.Available at
<<https://www.bizjournals.com/denver/blog/earth_to_power/2014/01/natural-gas-power-plants-produce-
40.html>> last access on,30-10-2020.
[77] Department of Environment, Government of People’s Republic of Bangladesh. Available at
<<https://bit.ly/3nan4uP>> last access on,30-10-2020.

56 ©Daffodil International University
[78] “Specific Carbon Dioxide Emissions of Various Fuels”, available at << https://www.volker-
quaschning.de/datserv/CO2-spez/index_e.php>> ,last access on ,30-10-2020.