roosting behavior of male eastern and … behavior of male eastern and rio grande wild turkeys...
TRANSCRIPT

ROOSTING BEHAVIOROF MALE EASTERNAND RIO GRANDEWILD TURKEYS
Michael E. Byrne1,2
Savannah River Ecology Lab,
University of Georgia,
P.O. Drawer E,
Aiken, SC 29802, USA
Bret A. CollierSchool of Renewable Natural Resources,
Louisiana State University Agricultural Center,
227 Highland Rd,
Baton Rouge, LA 70803, USA
Michael J. ChamberlainWarnell School of Forestry and Natural Resources,
University of Georgia,
180 E Green St,
Athens, GA 30602, USA
Abstract: Roosting behavior is poorly understood relative to other facets of wild turkey (Meleagris gallopavo; hereafter,
turkey) ecology. However, GPS technology has provided an opportunity to detail aspects of roosting behavior that have
traditionally eluded researchers. We quantified various characteristics of roosting behavior, including numbers of roost sites
used, roost site fidelity, and distances between consecutive nightly roost locations for eastern (M. g. silvestris) and Rio
Grande (M. g. intermedia) turkeys along a broad ecological gradient. Our study sites were in 3 Bird Conservation Regions
(BCR) characterized by varying proportions of forest cover and presumably roost site availability: the Southeast Coastal
Plain (SECP, abundant forest cover), the Tamaulipan Brushlands (TB, sparse forest cover), and the Oaks and Prairies region
(OP, intermediate forest cover). We hypothesized that roosting behavior would vary as a function of available forest cover.
We monitored 36 VHF–GPS radiotagged male turkeys, which provided 4,683 nightly roost locations from 1,724 unique roost
sites. We developed a roosting index (RI) to quantify roost site fidelity and found that turkeys in SECP and OP exhibited
relatively little fidelity to individual roost sites and longer distances between consecutive nightly roost locations during
reproductive season (Mar–May). Roost site fidelity increased and nightly inter-roost distances decreased during summer
months. These shifts were potentially linked to seasonal shifts in behavioral state, resource availability, and space use
patterns. Roost site fidelity during the reproductive season was most pronounced in the arid TB BCR, least pronounced in
SECP, and intermediate in OP, corresponding to variation in availability of forest stands within individual ranges. Median
distance between nightly roost locations of Rio Grande turkeys in TB approached an order of magnitude less than that of Rio
Grande turkeys in OP or eastern turkeys in SECP. Additionally, spatial distribution of roost sites and forest stands within
individual ranges was limited to riparian areas in TB, but was evenly dispersed within ranges in the other 2 BCRs. Based on
our findings, we suggest that management actions to create or maintain roost habitat are likely unnecessary in forested
landscapes with near ubiquitous roost site availability. However, in sparsely forested landscapes, management practices
aimed at maintaining and creating roost sites may be important.
Proceedings of the National Wild Turkey Symposium 11:175–185
Key words: behavior, eastern wild turkey, habitat use, Louisiana, Meleagris gallopavo intermedia, Meleagris gallopavo
silvestris, Rio Grande wild turkey, roost, South Carolina, space use, Texas.
Associate Editor: Stewart and Miller1 Present address: Halmos College of Natural Sciences and Oceanography, Nova Southeastern University, 8000 North Ocean Drive,
Dania Beach, FL 33004, USA.2 E-mail: [email protected]
175

Roosting is an important aspect of wild turkey(Meleagris gallopavo; hereafter turkey) ecology, andpresumably influences demography and spatial distribution.Roosting provides refuge from ground-based predators, andis hypothesized to provide thermal cover in adverseweather (Austin and DeGraaf 1975, Vander Haegen et al.1989). Availability and distribution of suitable roostinglocations may be a key factor limiting individual andpopulation range distributions of western (Rio Grande [M.g. intermedia], Gould’s [M. g. mexicana], and Merriam’s[M. g. merriami]) turkeys (Glazner 1967, Boeker and Scott1969, Crockett 1973, Caveny et al. 2011). To date, mostroost studies have focused on description of roost trees andassociated habitat conditions surrounding roost trees (e.g.,Mackey 1984, Flake et al. 1995, Swearingin et al. 2011), orhave quantified aspects of roost site selection at microhab-itat or landscape scales (e.g., Kilpatrick et al. 1988,Chamberlain et al. 2000, Keegan and Crawford 2005,Perlichek et al. 2009, Frary et al. 2011, Phillips et al. 2011).However, other aspects of roosting behavior, such asfidelity of individuals to specific roost sites or the nature ofroosting behavior in relation to diurnal movements, hasreceived comparatively less attention, even though thesebehavioral activities underlie roost site selection. Althoughinherent linkages between roost location, landscape levelhabitat conditions, and turkey movements and rangerestrictions should be evident, these linkages remainunquantified (Chamberlain et al. 2000, Wakeling 2005),primarily due to historical limitations of VHF-style radio-transmitters (Guthrie et al. 2011, Byrne et al. 2014).
Advances in GPS technology have enabled insightsinto aspects of turkey ecology and life history that havebeen historically difficult to document (Collier andChamberlain 2011, Guthrie et al. 2011). Collectingconsecutive nightly roost locations affords an opportunityto describe aspects of roosting behavior at a level of detailthat has traditionally eluded researchers. To better under-stand roosting ecology of turkeys, our goal was to describeseveral aspects of their roosting behavior that would bedifficult or otherwise impossible to quantify via VHFradiotelemetry. Specifically, we quantified patterns of roostsite reuse and inter-roost distances of individual turkeysacross biological seasons and landscapes. We drew from asample of both eastern (M. g. silvestris) and Rio Grandemale turkeys from multiple study locations in the southernUnited States. We assumed that roost availability increasedproportionally with percentage forest cover. Subsequently,we hypothesized that fidelity to specific roost sites wouldincrease as available forest cover decreased becauseindividual turkeys would be forced to reuse a small numberof unique roosts regularly. We based this assumption onobservations that traditional roost sites exist in semi-aridregions that are known to consistently harbor large groupsof roosting Rio Grande turkeys (Beasom and Wilson 1992),presumably as a result of limited roost availability on thelandscape. Conversely, there is little evidence that turkeysin forested regions of the southeastern United States exhibitsuch behavior. Additionally, we hypothesized that distanc-es between roosts used on consecutive nights would bepositively correlated with availability of forest cover asincreased availability of roost sites would translate intoroost sites being widely distributed within a turkey’s range.
STUDY AREA
We conducted our research on 7 study sites within 3Bird Conservation Regions (BCR, Fig. 1). Bird Conserva-tion Regions are large scale, ecologically distinct regions ofNorth America characterized by similar habitat types,resource management issues, and bird communities asdelineated by the North American Bird ConservationInitiative (NABCI; 2000). We did this because of greatlyvariable samples sizes among individual study sites andbecause spatial distribution of sites was such that severalsites were similar in general habitat characteristics.Because habitat characteristics of study areas within thesame BCRs were similar (see below), we expected roostavailability and roosting behavior to vary more amongBCRs than study areas within BCRs.
Two study sites in Louisiana and 1 site in SouthCarolina were within the Southeast Coastal Plain (SECP)region. This region encompassed extensive riverineswamps and coastal marshes along the Atlantic coast, withinterior vegetation dominated by longleaf pine (Pinuspalustris), slash pine (P. elliottii), and loblolly pine (P.taeda) forests. Three study sites in Texas were in the Oaksand Prairies (OP) region. This region encompassed thetransition zone between the Great Plains and forests ofeastern North America, and consisted of a complex mix ofprairie, savannah, cross timbers, and shrubland. Finally, 1study site in south Texas was located in the TamaulipanBrushlands (TB) region, a plain consisting of a mix ofgrassland, savannah, and thornscrub greatly influenced bypast grazing history (NABCI 2000). Individual sitedescriptions are provided below.
In Louisiana, we conducted research on 2 study sitesduring 2012–2013. Our primary study area was the 2,390-ha Tunica Hills Wildlife Management Area (WMA)
Figure 1. Distribution of study sites used to study roosting
ecology of male wild turkeys across 3 Bird Conservation Regionsin the southern United States during 2009–2014.
176 Habitat Use and Movements

located in West Feliciana Parish, Louisiana. Tunica Hillswas owned and operated by the Louisiana Department ofWildlife and Fisheries, and was located at the southernmostedge of the loess blufflands. Tunica Hills and surroundingprivate lands were composed of dissected uplands charac-terized by steep bluffs, ravines, and rugged hills. Foresttypes were primarily upland hardwoods. Common oversto-ry species included American beech (Fagus grandifolia),oaks (Quercus spp.), hickories (Carya spp.), yellow-poplar(Liriodendron tulipifera), red maple (Acer rubrum var.rubrum), and loblolly pine. Understory plants included oakleaf hydrangea (Hydrangea quercifolia), two-wing silver-bell (Halesia diptera), pawpaw (Asimina triloba), musca-dine grape (Vitis rotundifolia), flowering dogwood (Cornusflorida), and sweetleaf (Symplocos tinctoria).
Mosher Hill Hunting Club (hereafter Mosher) was a2,500-ha property owned and managed by WeyerhaeuserCompany located in Washington Parish, Louisiana. Mosherbordered the Bogue Chitto River to the east and BogueChitto State Park to the north. Mosher was located in theLower Coastal Plain region, and consisted mostly of well-drained, sandy soils. Forest cover was primarily loblollypine managed intensively for producing pine sawtimber.The area also contained small drainages and low areas withhardwood forests consisting of water oak (Q. nigra), greenash (Fraxinus pennsylvanica), sweet bay (Magnolia virgin-iana), southern magnolia (M. grandiflora), wild azalea(Rhododendron canescens), and red bay (Persea borbo-nia).
Our South Carolina study site was on 3 contiguouswildlife management areas (WMAs) owned and managedby the South Carolina Department of Natural Resources(SCDNR) in Hampton and Jasper counties. The James W.Webb Wildlife Center and Management Area (WWC)comprised 2,374 ha. Approximately 917 ha of WWC wasdominated by bottomland hardwoods typical of southeast-ern river floodplains. The remaining 1,458 ha were uplandhabitat types typical of the Atlantic coast flatwoods,consisting of longleaf, loblolly, and slash pine interspersedby hardwood stands along drainages. Hamilton RidgeWMA (HR) was 5,374 ha and consisted of bottomlandhardwoods, palustrine emergent wetlands, and lacustrineand riverine wetlands. Uplands were primarily pine standsof various ages with the predominant species beingloblolly. Palachucola WMA (PC) was comprised of 2,734ha dominated by planted loblolly pine with interspersedupland and bottomland hardwood stands. On this area,SCDNR was converting much of the planted loblolly pineto longleaf pine. Primary management activities acrosssites included both dormant and growing season prescribedfire and maintenance of agricultural food plots. We studiedturkeys in South Carolina during 2014.
In Texas, we conducted our research on 4 sites, 3within the OP BCR and 1 in the TB BCR during 2012–2013. Sites in the OP BCR were within the Cross Timbersecoregion in north–central Texas. Our work in Stephensand Palo Pinto counties was conducted on MT7 Ranch,several additional small private ranches, and the Lyndon B.Johnson National Grasslands in Wise County. These sitesconsisted of rolling hills and steep canyons (Gould 1962).This region was predominately rangeland with variousspecies of bluestem (Andropogon spp.), grama (Bouteloua
spp.), and panicum (Panicum spp.), with common overstoryspecies including live oak (Quercus virginiana), ashejuniper (Juniperus ashei), post oak (Q. stellata), black jackoak (Q. marilandica), and mesquite (Prosopis glandulosa).Cedar elm (Ulmus crassifolia), pecan (Carya illinoinensis),and cottonwood (Populus deltoides) were found alongriparian areas. Cross Timbers study sites were managed forwhite-tailed deer (Odocoileus virginianus) with othermanagement strategies focused on Rio Grande turkeysand northern bobwhite (Colinus virginianus). Livestockgrazing occurred on all study sites. However, a rotationalgrazing regime was implemented on 2 sites (Stephens andWise counties).
Our TB BCR site was the Temple Ranch northwest ofSan Diego, Texas, located in the eastern portion of theCentral Rio Grande plains eco-region in Duvall County,Texas. This 5,261-ha study site was bisected by a broadriparian corridor (San Diego Creek), and was intensivelymanaged for white-tailed deer and northern bobwhitehunting, with limited turkey hunting (Guthrie et al. 2011,Byrne et al. 2014). Vegetation consisted of thornscrubparklands with well-defined mosaic patterns of shrubclusters scattered throughout early succession grasslands(Northup et al. 2005). Closed-canopy woodlands werelimited to riparian corridors and were intermittently presentin clay loam drainages along San Diego Creek. Woodlandsconsisted primarily of honey mesquite (Prosopis glandu-
losa), hackberry (Celtis occidentalis), and Texas persim-mon (Diospyros texana; Archer 1990). Grassland herba-ceous species included thin paspalum (Paspalum seta-
ceum), fringed signal grass (Urochloa ciliatissima), redgrama (Bouteloua trifida), and coastal sandbur (Cenchrus
incertus; Archer 1990). We studied turkeys on the Templeranch during 2009 and 2010.
METHODS
Capture and Monitoring
Following standard methods, we captured turkeysusing rocket nets, drop nets (Glazner et al. 1964), andwalk-in traps (Davis 1994) baited with milo and corn. Weaged and sexed all captured individuals and we markedthem with an aluminum rivet leg band (National Band andTag Company, Newport, Kentucky, USA). We radiotaggedturkeys with combination GPS–VHF backpack-style radio-transmitters (Collier and Chamberlain 2011, Guthrie et al.2011). All GPS–VHF units were produced by eitherSirtrack Wildlife Tracking Solutions (Havelock North,New Zealand) or Biotrack Ltd. (Wareham, Dorset, UnitedKingdom). Texas A&M University Institutional AnimalCare and Use Committee (Permit 2010-287, Permit 2013-0225) and University of Georgia Animal Care and UseCommittee (Permit A2011 07-003-R1) approved captureand handling protocols. We monitored all individuals viaradiotelemetry weekly. We either downloaded GPS loca-tions directly from recovered units, or remotely from unitsattached to living turkeys via transmission to a hand-heldUHF receiver. For this work, we focus solely on capturedmale eastern and Rio Grande turkeys.
Turkey Roost Ecology � Byrne et al. 177

Data Analysis
Variability in GPS performance and collection sched-ules occasionally led to us obtaining multiple locationsduring nighttime hours or missing nighttime locations.Thus, we defined a nightly roost location as the GPSlocation obtained nearest to midnight between 0000 and0400 hours, assuming that locations obtained closer to themiddle of the night were most likely to be roost locations.By using GPS locations within this time window, weincreased our chances of identifying a roost location.Turkeys may use specific roost sites on multiple occasionsbut be located in different individual trees. Therefore, todefine independent roost sites used by each individual, webuffered all nightly roost locations by 20 m based onpublished GPS error estimates (Guthrie et al. 2011) and wemerged any overlapping buffers of nightly roost locationsinto single polygons. Thus, a roost site was represented by apolygon that may have contained multiple nightly roostlocations. For reference, a roost site consisting of a singleroost location would be represented by a circular polygonwith an area of 0.12 ha. Given greatly variable sample sizesat each study site across years, we combined across yearsfor all analyses. We calculated 99% kernel utilizationdistribution (KUD) ranges for each individual based on allGPS locations (day and night) obtained during trackingperiods. Our goal was to obtain an estimate of space use byeach turkey, and thus the space in which roost locationswere available to be selected, based on when we radio-tracked turkeys. We estimated KUDs using packageadehabitatHR (Calenge 2006) in program R (R Core Team2015). All turkeys we included in analyses provided at least1 month of nightly GPS locations.
We developed a roost index (RI) to quantify patterns ofroost site fidelity and reuse within a given time period. Wecalculated RI as number of individual roost sites usedduring a given time period divided by number of nightsduring the period. An RI value of 1 would indicate that anindividual exhibited no fidelity and roosted at a differentsite each night, whereas values approaching 0 indicate greatfidelity to a small number of roost sites. Because wedefined roost sites as polygons, this index may becompromised if many roost locations were merged togetherin such a way that a resulting roost site polygonencompassed a large portion of an individual’s range. Insuch a case, potential number of available roost sites maybe artificially small as a function of the roost sitedelineation process, in turn leading to biased inference ofroost site fidelity. Thus, for each turkey, we examined sizeof the largest roost site polygon in relation to area of the99% KUD to ensure that no individual roost sitesencompassed more than 2% of the entire range of anindividual.
As an additional metric of roosting behavior, wecalculated distance (m) between consecutive nightly roostlocations for each turkey (hereafter, inter-roost distance).To make inferences about broad scale temporal patterns inroosting behavior, we calculated monthly RI values andmedian inter-roost distances for all turkeys, censoringmonths with ,20 nights of roost locations. We plottedmonthly RI values and median inter-roost distances for allturkeys in which �3 months of data were available. We
demarcated seasons as spring (Mar–May), summer (Jun–Aug), fall (Sep–Nov), and winter (Dec–Feb).
To examine influence of habitat conditions on roostingbehavior, we used data during spring (Mar–May). Wefocused on spring for this comparative analysis because, asa result of concurrent studies focusing on other aspects ofecology and behavior during reproductive seasons (e.g.,Gross et al. 2015b), all turkeys used in our study were beingmonitored during this time period and, as such, thisrepresented the period with the most robust sample sizes.To quantify behavior during this period, we calculatedspring (Mar–May) RI and median inter-roost distances forall turkeys. Our goal was to determine influence of roostavailability within turkey ranges and general, large scalehabitat characteristics of each BCR on each metric ofroosting behavior. We assumed that roost availability wasdirectly proportional to availability of forest within aturkey’s range. To quantify roost availability, we intersect-ed KUD range of each individual with data from the 2011National Land Cover Database (NLCD; 2011). NLCDaccuracy at this scale has been estimated at approximately80% correct classification (Wickham et al. 2013). Wereclassified NLCD forest (deciduous forest, evergreenforest, and mixed forest) and woody wetlands into a singleforest classification assigned a raster value of 1. Wereclassified all other NLCD habitat classifications and gavethem a value of 0. This allowed us to separate forest fromnon-forest within the range of each turkey and quantifyportion of each range that was forested using zonalstatistics tools in ArcGIS 10.2 (ESRI, Redlands, California,USA).
As an additional metric to describe dispersion of forestcover within ranges, we calculated a contagion index (Liand Reynolds 1993) in Fragstats (http://www.umass.edu/landeco/research/fragstats/fragstats.html). This index pro-vides a useful measure of dispersion of habitat types acrossa landscape; values approaching 0 indicate patches aremaximally disaggregated, and values approaching 100indicate maximum aggregation. In context of our study,lesser contagion index values indicate that forest cover waswell dispersed within individual ranges, whereas greatervalues indicate that forest cover was clumped within arange.
We modeled both spring RI and median inter-roostdistance as a function of either percentage forest coverwithin an individual’s range or as a function of BCR, whichwe included as a categorical value representing large scaleregional characteristics. We did not include both variablestogether in models as relationships between forest coverand BCR (see results) would have led to confoundingresults. We used OP as our reference category. Because RIvalues were constrained between 0 and 1, we modeledspring RI using a generalized linear model approach,defining a binomial distribution with a logit link function.We assessed goodness-of-fit for these models using theHosmer–Lemeshow statistic (Hosmer and Lemeshow1980). We modeled median inter-roost distance via linearregression. We included an intercept only model for eachmetric, thus giving us a set of 3 candidate models:percentage forest cover, BCR, and intercept. For each setof models, we calculated Akaike’s Information Criterionadjusted for small sample size (AICc), and used DAICc and
178 Habitat Use and Movements
Akaike weights (wi) to rank and determine the mostparsimonious models of roosting behavior (Burnham andAnderson 2002). We reported parameter estimates forexplanatory variables in top performing models in each set.To avoid erroneous biological inference, we followedArnold (2010) and calculated an 85% CI for all parameterestimates to distinguish between informative and uninfor-mative parameters. We considered a parameter uninforma-tive if the 85% CI crossed 0.
RESULTS
We based our analyses on 36 male turkeys from SECP(n = 20), OP (n = 9), and TB (n = 7) in which �1 fullmonth of data were available (range 1–11 months). Allturkeys in SECP were eastern turkeys, whereas all turkeysfrom OP and TB were Rio Grande turkeys. Due to timing
of capture periods (Jan–Mar), number of turkeys thatprovided sufficient data in any year was greatest in springmonths and decreased through the year due to mortality orradiotransmitter failure. Sample sizes decreased such thatonly a single turkey provided sufficient data duringNovember and no turkeys provided data for multiple years.As such, we did not make inferences on roosting behaviorduring winter. Additionally, because only 3 turkeys fromTB provided �3 months of data, we did not makeinferences on seasonal patterns in roosting behavior for TB.
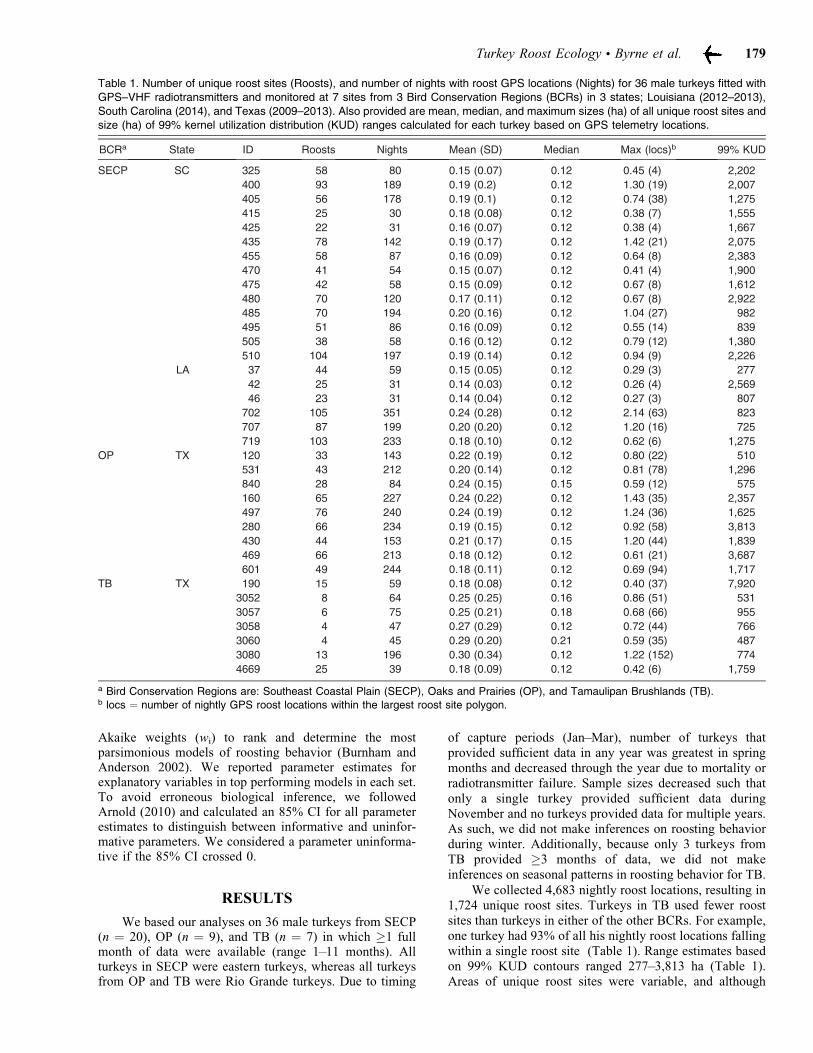
We collected 4,683 nightly roost locations, resulting in1,724 unique roost sites. Turkeys in TB used fewer roostsites than turkeys in either of the other BCRs. For example,one turkey had 93% of all his nightly roost locations fallingwithin a single roost site (Table 1). Range estimates basedon 99% KUD contours ranged 277–3,813 ha (Table 1).Areas of unique roost sites were variable, and although
Table 1. Number of unique roost sites (Roosts), and number of nights with roost GPS locations (Nights) for 36 male turkeys fitted withGPS–VHF radiotransmitters and monitored at 7 sites from 3 Bird Conservation Regions (BCRs) in 3 states; Louisiana (2012–2013),
South Carolina (2014), and Texas (2009–2013). Also provided are mean, median, and maximum sizes (ha) of all unique roost sites andsize (ha) of 99% kernel utilization distribution (KUD) ranges calculated for each turkey based on GPS telemetry locations.
BCRa State ID Roosts Nights Mean (SD) Median Max (locs)b 99% KUD
SECP SC 325 58 80 0.15 (0.07) 0.12 0.45 (4) 2,202
400 93 189 0.19 (0.2) 0.12 1.30 (19) 2,007
405 56 178 0.19 (0.1) 0.12 0.74 (38) 1,275
415 25 30 0.18 (0.08) 0.12 0.38 (7) 1,555
425 22 31 0.16 (0.07) 0.12 0.38 (4) 1,667
435 78 142 0.19 (0.17) 0.12 1.42 (21) 2,075
455 58 87 0.16 (0.09) 0.12 0.64 (8) 2,383
470 41 54 0.15 (0.07) 0.12 0.41 (4) 1,900
475 42 58 0.15 (0.09) 0.12 0.67 (8) 1,612
480 70 120 0.17 (0.11) 0.12 0.67 (8) 2,922
485 70 194 0.20 (0.16) 0.12 1.04 (27) 982
495 51 86 0.16 (0.09) 0.12 0.55 (14) 839
505 38 58 0.16 (0.12) 0.12 0.79 (12) 1,380
510 104 197 0.19 (0.14) 0.12 0.94 (9) 2,226
LA 37 44 59 0.15 (0.05) 0.12 0.29 (3) 277
42 25 31 0.14 (0.03) 0.12 0.26 (4) 2,569
46 23 31 0.14 (0.04) 0.12 0.27 (3) 807
702 105 351 0.24 (0.28) 0.12 2.14 (63) 823
707 87 199 0.20 (0.20) 0.12 1.20 (16) 725
719 103 233 0.18 (0.10) 0.12 0.62 (6) 1,275
OP TX 120 33 143 0.22 (0.19) 0.12 0.80 (22) 510
531 43 212 0.20 (0.14) 0.12 0.81 (78) 1,296
840 28 84 0.24 (0.15) 0.15 0.59 (12) 575
160 65 227 0.24 (0.22) 0.12 1.43 (35) 2,357
497 76 240 0.24 (0.19) 0.12 1.24 (36) 1,625
280 66 234 0.19 (0.15) 0.12 0.92 (58) 3,813
430 44 153 0.21 (0.17) 0.15 1.20 (44) 1,839
469 66 213 0.18 (0.12) 0.12 0.61 (21) 3,687
601 49 244 0.18 (0.11) 0.12 0.69 (94) 1,717
TB TX 190 15 59 0.18 (0.08) 0.12 0.40 (37) 7,920
3052 8 64 0.25 (0.25) 0.16 0.86 (51) 531
3057 6 75 0.25 (0.21) 0.18 0.68 (66) 955
3058 4 47 0.27 (0.29) 0.12 0.72 (44) 766
3060 4 45 0.29 (0.20) 0.21 0.59 (35) 487
3080 13 196 0.30 (0.34) 0.12 1.22 (152) 774
4669 25 39 0.18 (0.09) 0.12 0.42 (6) 1,759
a Bird Conservation Regions are: Southeast Coastal Plain (SECP), Oaks and Prairies (OP), and Tamaulipan Brushlands (TB).b locs = number of nightly GPS roost locations within the largest roost site polygon.
Turkey Roost Ecology � Byrne et al. 179

roost sites sometimes consisted of many individual nightlylocations, all roost sites were ,1% of total area of therespective turkey’s range (Table 1). This increased ourconfidence in using RI as a meaningful metric of roostfidelity.
We observed seasonal patterns in monthly RI valuesfor SECP and OP (Fig. 2). In both regions, mean valuespeaked in March and April and reached minimum levels inJuly and June, respectively. Mean RI for SECP in Marchwas 0.75, falling to a low of 0.42 in July. Mean number ofunique roosts used by individuals in this region decreasedfrom 22.5 in March to 12.5 in July. In OP, RI valuesdecreased from 0.60 in March to 0.26 in June, with meannumber of unique roost sites used per turkey declining from17 to 7.75. Thus, we observed a pattern in which turkeys inthese 2 regions used many roost sites during thereproductive period, but exhibited a relatively great rateof fidelity to specific roost sites afterwards.
We observed a similar pattern to RI in median inter-roost distances, with median distances peaking in springand declining afterwards (Fig. 3). In SECP, mediandistances peaked in April (mean = 728 m) and fell to theirleast levels in August (mean = 318 m) and September(mean = 291 m). In OP, median distances were longest inApril (mean = 995 m) and shortest in July (mean = 143m). Several turkeys in both regions had monthly medianvalues below 100 m during June and July. Three turkeysfrom OP exhibited median inter-roost distances .1,500 mduring a single spring month (March or April). Visualinspection showed these individuals ranged widely withintheir respective ranges during these months, resulting inusing roost sites on consecutive nights that were often .2km apart.
Although turkeys in TB did not provide enough datato make inferences on seasonal trends, we observed thatoverall monthly RI values tended to be less for turkeys inTB than either SECP or OP (mean = 0.21, range = 0.03–0.84). Mean number of unique roost sites used in TB was4.8 (range = 1–16). We observed 5 turkeys to use no morethan 5 roost sites in any month. Monthly median inter-roost distances for turkeys in TB tended to be shorter thanthose in other BCRs; median distances for 6 of 7individuals were ,40 m for all months in which datawere available.
All models of spring RI exhibited adequate goodness-of-fit based on Hosmer–Lemeshow goodness-of-fit statis-tics (P . 0.05). The 2 models that included forest cover orBCR as explanatory variables had considerably moresupport than intercept only models (Table 2), but bothmodels exhibited equal levels of support (DAICc = 0.37,cumulative wi = 0.98). We observed that 85% CI for bothcategorical variables in the BCR model crossed 0,identifying them as uninformative (Table 3). However,forest cover within turkey ranges was informative,indicating that forest cover was positively correlated withspring RI. Our biological inference is that roost site fidelitydecreased as proportion of available forest cover within aturkey’s range increased. In general, we observed thatforest cover within turkey ranges varied along a gradientacross BCRs, being greatest in SECP (mean = 76.3%),least in TB (mean = 10.7%), and intermediate in OP (mean= 30%; Fig. 4). This regional pattern was mirrored bymean spring RI values of 0.63, 0.40, and 0.20 for SECP,OP, and TB BCRs, respectively. Contagion index valueswithin turkey ranges were similar in SECP (mean = 41.1)and OP (mean = 31.4), and greater in TB (mean = 62.1).
Figure 2. Monthly roost index values (individual roost sites usedduring a given time period divided by number of nights during a
period) for GPS–VHF radiotagged male wild turkeys with �3months of data across 2 Bird Conservation Regions during
2012–2014. Heavy gray lines indicate mean values.
Figure 3. Monthly median distances (m) between consecutive
nightly roost locations for VHF–GPS radiotagged male wildturkeys with �3 months of data across 2 Bird Conservation
Regions during 2012–2014. Heavy gray lines indicate meanvalues.
180 Habitat Use and Movements

The model which evaluated median inter-roost dis-tance as a function of BCR was best supported (wi = 0.99,r2 = 0.55; Table 2). Parameter estimates indicated thatmedian distance between nightly roost locations were lessin TB than OP, but there was little difference between OPand SECP (Table 3). Distributions of median inter-roostdistances were similar for OP and SECP (mean = 546 mand 605 m, respectively), but were less for turkeys in TB(mean = 72 m, Fig. 4).
DISCUSSION
Historically, quantifying roost habitat for turkeys hasfocused on identifying and measuring tree-specific struc-tural metrics, which are then described or compared withsome set of other trees that are thought to be unused withinsimilar areas (Keegan and Crawford 2005, Perlichek et al.2009, Phillips et al. 2011). By using large datasets providedby GPS technology, we were able to evaluate how roostingbehavior varied along a broad ecological gradient. In ourstudy, tendency toward roost site fidelity was a result ofgeneral landscape features characteristic of each studyregion, and was moderated by availability and distributionof forest.
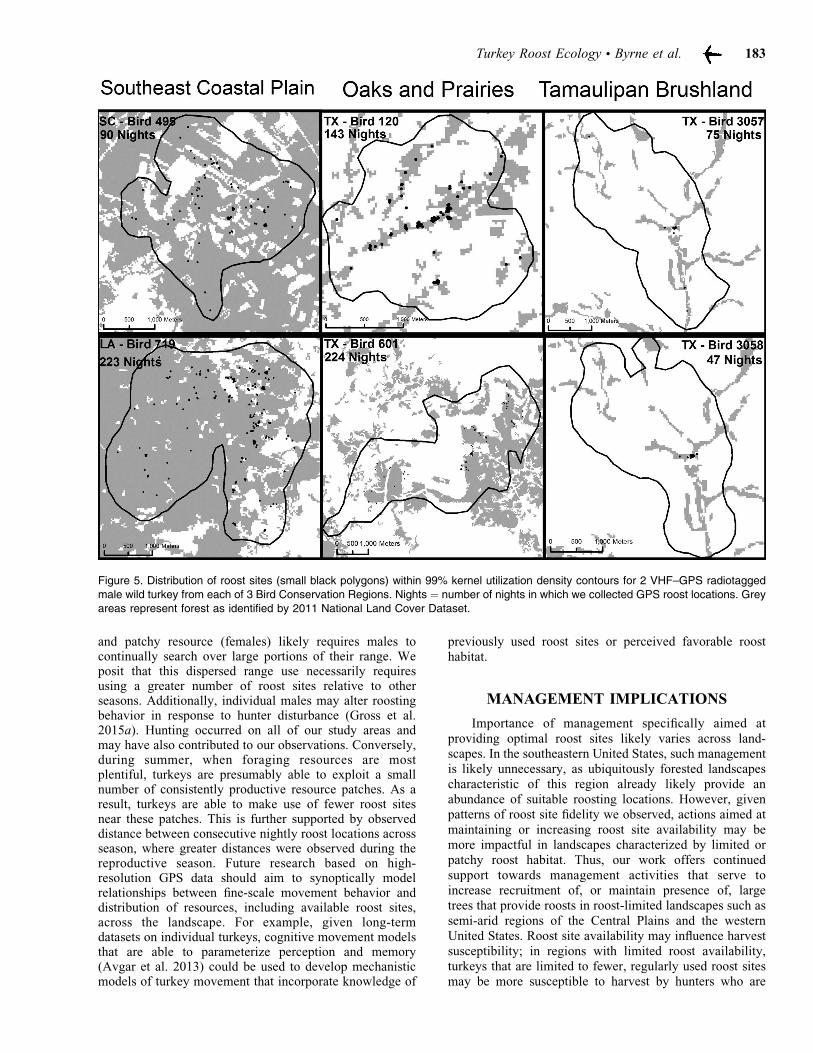
In the primarily forested SECP, potential roost sitesappeared ubiquitous given availability of forest cover, andthus roost site selection was probably not a factorinfluencing range size. Indeed, we observed that spatialdistribution of roost sites was generally evenly distributedwithin individual ranges (Fig. 5), and fidelity to specificroost sites was less, relative to other regions. However, inthe arid TB BCR of south Texas, roost site locations werelimited to riparian corridors where adequate moistureexisted to ensure growth and retention of preferred roostingsites in old-growth hackberry or mesquite (Beasom andWilson 1992), and turkeys in this region had greatest levels
of fidelity to specific roost sites. In the OP BCR of northTexas, we observed that spatial distribution of, and fidelityto, roost sites was intermediate to extremes shown byturkeys in SECP and TB (Fig. 5), as was availability offorest cover within turkey ranges.
While patterns of roost site fidelity scaled relative toamount of forest cover available within turkey ranges,patterns of distances between consecutive nightly roostlocations were more complex. Inter-roost distances weresimilar for SECP and OP BCRs, despite differences inavailable forest cover. Roost sites in both of these regionswere well-dispersed throughout turkey ranges, as indicatedby contagion index values, suggesting that distance amongroosts was likely mediated more so by dispersion ofavailable forest cover as opposed to availability. In otherwords, there was less forest cover available to turkeys inOP, but it was dispersed widely across individual ranges.As a result, although turkeys in OP may have been limitedin number of potential roost sites, roost sites that wereavailable were widely distributed within their respectiveranges. This is in stark contrast to turkeys in TB, whereavailability of forest cover was less and confined to ripariancorridors within the landscape. Based on our results, spatialdistribution of riparian conditions and thus availableroosting habitat may in fact be a significant driver of rangesize and species distribution across some landscapes, asprevious literature suggests (Glazner 1967, Crockett 1973,Caveny et al. 2011). From this, we can conclude thatpatterns of roost site use and fidelity were mediatedprimarily by habitat availability and were not necessarilyintrinsic behavioral traits specific to either subspecies; thisis evidenced by considerable differences observed betweenRio Grande turkeys in OP and TB BCRs. Indeed, roostingbehaviors of OP Rio Grande turkeys were in many ways
Table 2. Model selection results of logistic regression models ofspring (Mar–May) roost index (individual roost sites used during
a given time period divided by number of nights during a period)values (Spring RI) and linear models of median distance (m)
between consecutive nightly roost locations (Distance) as a
function of either bird conservation region (BCR) or percentageforest cover within 99% kernel utilization distribution ranges. For
each model, we report number of parameters (K), Akiake’sInformation Criterion adjusted for small sample sizes (AICc),
difference in AICc relative to the smallest value (DAICc), andAkaike weight (wi). Data are from 36 male wild turkeys fitted with
GPS–VHF radiotransmitters monitored at 7 sites in 3 states;Louisiana (2012–2013), South Carolina (2014), and Texas (2009
– 2013).
Model K AICc DAICc wi
Spring RI
BCR 3 42.93 0 0.54
Forest cover 2 43.30 0.37 0.45
Intercept 1 51.75 8.83 0.01
Distance
BCR 3 488.01 0 0.99
Forest cover 2 505.59 17.58 ,0.01
Intercept 1 511.59 23.58 ,0.01
Table 3. Parameter estimates, standard errors, and 85%confidence intervals for explanatory variables in 2 highest
ranked logistic model or spring (Mar–May) roost index values(individual roost sites used during a given time period divided by
number of nights during a period) and single highest ranked
linear model of median distance between consecutive nightlyroost locations. Explanatory variables include categorical values
representing bird conservation region (BCR) and percentageforest cover within 99% kernel utilization distribution range
estimates. Data are from 36 male wild turkeys fitted with GPS–VHF radiotransmitters monitored at 7 sites in 3 states; Louisiana
(2012–2013), South Carolina (2014), and Texas (2009–2013)
Parameter Estimate SE 85% CI
Spring RI models
BCR
SECPa 0.99 0.82 –0.19 to 2.21
TB –1.09 1.17 –2.96 to 0.50
Forest cover
% Forest 0.02 0.01 0.01 to 0.04
Distance model
SECP 58.8 78.3 –56.6 to 174.2
TB –474.4 98.3 –619.3 to �329.5
a Bird conservation regions include the Southeast Coastal Plain
(SECP), and Tamaulipan Brushlands (TB), with Oak and Prairies
as the reference category.
Turkey Roost Ecology � Byrne et al. 181

more similar to eastern turkeys inhabiting SECP than to RioGrande turkeys at TB.
Based on our results, it seems apparent that selectionfor roost sites and tree-specific metrics is likely to vary inimportance relative to general availability of potentialroosting sites on a landscape. When potential roost sites areabundant, turkeys are likely able to be more selective ofroost sites with specific microhabitat characteristics, asopposed to landscapes with limited potential roost sites. Forinstance, during our research, Temple Ranch has seensignificant use (.85% used on a monthly basis) ofartificially created roost sites both near (,100 m) anddistant (.1 km) from known historic roost sites during thelast 5 years (B. A. Collier, unpublished data). From anecological perspective, relationships between availabilityof roost sites at the landscape scale and strength of selectionfor microhabitat characteristics at roost sites represents aninteresting avenue of future research. While previousresearch has focused on landscape-level selection of roostsites (e.g., Chamberlain et al. 2000) or selection for specifictrees within a roost site (e.g., Boeker and Scott 1969),
incorporating GPS will make hierarchical studies of roosthabitat selection at multiple spatial scales feasible.
In both SECP and OP, we observed seasonal variationin fidelity to specific roost sites. Turkeys used numerousroost sites during spring and had relatively little sitefidelity. Roost site fidelity increased in summer as turkeysused a lesser number of roost sites. Resource availabilityon a landscape varies in space and time, and animals areknown to adjust their movements and space use patternsaccordingly to optimally exploit such resources (Turchin1991, Fauchald 1999). The trends we observed may bemanifestations of interplay between seasonal shifts in malebehavioral state and distribution of seasonally importantresources. Male turkeys shift from a reproductively focusedbehavioral state during spring to a maintenance stateduring summer and fall. During reproductive periods, matesearching behavior appears to be the primary driver ofmovement patterns by male turkeys (Kelley et al. 1988,Holdstock et al. 2006, Gross et al. 2015a). Movements ofmales have been reported to be greater in spring thansummer (Godwin et al. 1994), and searching for a dynamic
Figure 4. Box plots of (A) spring (Mar–May) roost index values (individual roost sites used during a given time period divided by number
of nights during a period), (B) median distances between consecutive nightly roost locations during spring, and (C) percentage forestcover within 99% kernel utilization distribution ranges for VHF–GPS radiotagged male wild turkeys across 3 Bird Conservation Regions,
2009–2014.
182 Habitat Use and Movements
and patchy resource (females) likely requires males tocontinually search over large portions of their range. Weposit that this dispersed range use necessarily requiresusing a greater number of roost sites relative to otherseasons. Additionally, individual males may alter roostingbehavior in response to hunter disturbance (Gross et al.2015a). Hunting occurred on all of our study areas andmay have also contributed to our observations. Conversely,during summer, when foraging resources are mostplentiful, turkeys are presumably able to exploit a smallnumber of consistently productive resource patches. As aresult, turkeys are able to make use of fewer roost sitesnear these patches. This is further supported by observeddistance between consecutive nightly roost locations acrossseason, where greater distances were observed during thereproductive season. Future research based on high-resolution GPS data should aim to synoptically modelrelationships between fine-scale movement behavior anddistribution of resources, including available roost sites,across the landscape. For example, given long-termdatasets on individual turkeys, cognitive movement modelsthat are able to parameterize perception and memory(Avgar et al. 2013) could be used to develop mechanisticmodels of turkey movement that incorporate knowledge of
previously used roost sites or perceived favorable roosthabitat.
MANAGEMENT IMPLICATIONS
Importance of management specifically aimed atproviding optimal roost sites likely varies across land-scapes. In the southeastern United States, such managementis likely unnecessary, as ubiquitously forested landscapescharacteristic of this region already likely provide anabundance of suitable roosting locations. However, givenpatterns of roost site fidelity we observed, actions aimed atmaintaining or increasing roost site availability may bemore impactful in landscapes characterized by limited orpatchy roost habitat. Thus, our work offers continuedsupport towards management activities that serve toincrease recruitment of, or maintain presence of, largetrees that provide roosts in roost-limited landscapes such assemi-arid regions of the Central Plains and the westernUnited States. Roost site availability may influence harvestsusceptibility; in regions with limited roost availability,turkeys that are limited to fewer, regularly used roost sitesmay be more susceptible to harvest by hunters who are
Figure 5. Distribution of roost sites (small black polygons) within 99% kernel utilization density contours for 2 VHF–GPS radiotagged
male wild turkey from each of 3 Bird Conservation Regions. Nights = number of nights in which we collected GPS roost locations. Grey
areas represent forest as identified by 2011 National Land Cover Dataset.
Turkey Roost Ecology � Byrne et al. 183
aware of such sites. Turkeys are known to alter their spaceuse patterns in relation to hunting pressure (Gross et al.2015a); thus actions that provide roost habitat that isdispersed across a landscape may also provide turkeys withlocations in which they can seek refuge from hunters.
ACKNOWLEDGMENTS
We thank numerous volunteers and technicians forassistance with trapping and data collection. We thank thestaff of the Louisiana Department of Wildlife and Fisheries(LDWF), Texas Parks and Wildlife Department (TPWD),and the South Carolina Department of Natural Resources(SCDNR) Webb Center Wildlife Management Area forlogistical support during our study. Funding and supportwere provided by LDWF, Texas Parks and Wildlife UplandGame Bird Stamp Fund, the National Wild TurkeyFederation (NWTF), the Louisiana Chapter of NWTF, theTexas State Chapter of NWTF, the Texas A&M UniversityInstitute of Renewable Natural Resources, the School ofRenewable Natural Resources at Louisiana State University(LSU), the LSU Agricultural Center, and the WarnellSchool of Forestry and Natural Resources at the Universityof Georgia. Additionally, we thank A. and E. Temple, andR. J. Sanders from Temple Ranch, M. and M. Terry and T.Bartoskewitz from MT7 Ranch, and J. Stafford fromLDWF for their assistance. K. Skow provided valuable GISassistance.
LITERATURE CITED
Archer, S. 1990. Development and stability of grass/woody mosaicsin a subtropical savanna parkland, Texas, USA. Journal ofBiogeography 17:453–462.
Arnold, T. W. 2010. Uninformative parameters and model selectionusing Akaike’s information criterion. Journal of WildlifeManagement 74:1175–1178.
Austin, P. D., and L. W. DeGraff. 1975. Winter survival of wildturkeys in the southern Adirondacks. Proceedings of theNational Wild Turkey Symposium 3:55–60.
Avgar, T., R. Deardon, and J. M. Fryxell. 2013. An empiricallyparameterized individual based model of animal movement,perception, and memory. Ecological Modeling 251:158–172.
Beasom, S. L., and D. Wilson. 1992. Rio Grande turkey. Pages 129–143 in J. G. Dickson, editor. The wild turkey: biology andmanagement. Stackpole, Harrisburg, Pennsylvania, USA.
Boeker, E. L., and V. E. Scott. 1969. Roost tree characteristics forMerriam’s turkey. Journal of Wildlife Management 33:121–124.
Burnham, K. P., and D. R. Anderson. 2002. Model selection andmultimodel inference: a practical information-theoretic ap-proach. Second edition. Springer, New York, New York, USA.
Byrne, M. E., J. D. Guthrie, J. Hardin, B. A. Collier, and M. J.Chamberlain. 2014. Evaluating wild turkey movement ecolo-gy: an example using first-passage time analysis. WildlifeSociety Bulletin 38:407–413.
Calenge, C. 2006. The package adehabitat for the R software: a toolfor the analysis of space and habitat use by animals. EcologicalModeling 197:516–519.
Caveny, R. J., S. J. Voelkel, W. T. Brademan, J. B. Hardin, M. J.Peterson, and B. A. Collier. 2011. Distribution, fidelity, andabundance of Rio Grande wild turkey roosts in the Texascoastal sand plains. Proceedings of the Southeastern Associ-ation of Fish and Wildlife Agencies 65:45–50.
Chamberlain, M. J., B. D. Leopold, and L. W. Burger. 2000.
Characteristics of roost sites of adult wild turkey females.Journal of Wildlife Management 64:1025–1032.
Collier, B. A., and M. J. Chamberlain. 2011. Redirecting researchfor wild turkey using global positioning system transmitters.Proceedings of the National Wild Turkey Symposium 10:81–92.
Crockett, B. C. 1973. Quantitative evaluation of winter roost sites ofthe Rio Grande turkey in north-central Oklahoma. Pages 211–218 in G. C. Sanderson and H. C. Schultz, editors. Wild turkeymanagement: current problems and programs. University ofMissouri Press, Columbia, Missouri, USA.
Davis, B. D. 1994. A funnel trap for Rio Grande turkey. Proceedingsof the Southeastern Association of Fish and Wildlife Agencies48:109–116.
Fauchald, P. 1999. Foraging in a hierarchical patch system. TheAmerican Naturalist 153:603–613.
Flake, L. D., R. A. Craft, and W. L. Tucker. 1995. Vegetationcharacteristics of wild turkey roost sites during summer insouth-central South Dakota. Proceedings of the National WildTurkey Symposium 7:159–164.
Frary, V. J., M. F. Ingraldi, S. E. Sesnie, V. Horncastle, and Z.Reichold. 2011. Landscape-scale identification of Merriam’swild turkey roosting habitat in a managed ponderosa pineforest. Proceedings of the National Wild Turkey Symposium10:293–300.
Glazner, W. C. 1967. Management of the Rio Grande wild turkey.Pages 453–492 in O. H. Hewitt, editor. The wild turkey andits management. The Wildlife Society, Washington, DC, USA
Glazner, W. C., A. S. Jackson, and M. L. Cox. 1964. The Texasdrop-net turkey trap. Journal of Wildlife Management 28:280–287.
Godwin, K. D., G. A. Hurst, and B. D. Leopold. 1994. Movementsof wild turkey gobblers in central Mississippi. Proceedings ofthe Southeastern Association of Fish and Wildlife Agencies48:117–122.
Gould, F. W. 1962. Texas plants-a checklist and ecologicalsummary. Texas Agricultural Experiment Station. MP-585.
Gross, J. T., B. S. Cohen, B. A. Collier, and M. J. Chamberlain.2015a. Influences of hunting on movements of male wildturkeys during spring. Proceedings of the National WildTurkey Symposium 11:259–268.
Gross, J. T., A. R. Little, B. A. Collier, and M. J. Chamberlain.2015b. Space use, daily movements, and roosting behavior ofmale wild turkeys during spring in Louisiana and Texas.Journal of the Southeastern Association of Fish and WildlifeAgencies 2:229-234.
Guthrie, J. D., M. E. Byrne, J. B. Hardin, C. O. Kochanny, K. L.Skow, R. T. Snelgrove, M. J. Butler, M. J. Peterson, M. J.Chamberlain, and B. A. Collier. 2011. Evaluation of a GPSbackpack transmitter for wild turkey research. Journal ofWildlife Management 75:539–547.
Holdstock, D. P., M. C. Wallace, W. B. Ballard, J. H. Brunjes, R. S.Phillips, B. L. Spears, S. J. Demaso, J. D. Jernigan, R. D.Applegate, and P. S. Gipson. 2006. Male Rio Grande turkeysurvival and movements in the Texas panhandle andsouthwestern Kansas. Journal of Wildlife Management70:904–913.
Hosmer, D. W., and S. Lemeshow. 1980. A goodness-of-fit test forthe multiple logistic regression model. Communications inStatistics – Theory and Methods 9:1043–1069.
Keegan, T. W., and J. A. Crawford. 2005. Roost habitat selection byRio Grande turkeys in Oregon. Proceedings of the NationalWild Turkey Symposium 9:253–259.
Kelley, R. L., G. A. Hurst, and D. E. Steffen. 1988. Home ranges ofwild turkey gobblers in central Mississippi. Proceedings of theSoutheastern Association of Fish and Wildlife Agencies42:470–475.
Kilpatrick, H. J., T. P. Husband, and C. A. Pringle. 1988. Winterroost site characteristics of eastern wild turkeys. Journal ofWildlife Management 52:461–463.
184 Habitat Use and Movements
Li, H., and J. F. Reynolds. 1993. A new contagion index toquantify spatial patterns of landscapes. Landscape Ecology8:155–162.
Mackey, D. L. 1984. Roosting habitat of Merriam’s turkeys insouth-central Washington. Journal of Wildlife Management48:1377–1382.
Multi-resolution Land Characteristics Consortium. 2011. NationalLand Cover Database 2011. ,http://www.mrlc.gov/nlcd2011.php.. Access 15 April 2015.
North American Bird Conservation Initiative. 2000. Bird conserva-tion region descriptions: a supplement to the North AmericanBird Conservation Initiative bird conservation regions map.U.S. Fish and Wildlife Service.
Northup, B. K., S. F. Zitzer, S. Archer, C. R. McMurty, and T. W.Boutton. 2005. Above-ground biomass and carbon andnitrogen content of woody species in a subtropical thornscrubparkland. Journal of Arid Environments 62:23–43.
Perlichek, K. B., L. A. Harveson, B. J. Warnock, and B. Tarrant.2009. Habitat characteristics of winter roost sites of wildturkeys in Trans-pecos, Texas. The Southwestern Naturalist54:446–452.
Phillips, C. E., S. J. Demaso, W. P. Kuvlesky, Jr., L. A. Brennan,and D. G. Hewitt. 2011. Landscape metrics related to Rio
Grande wild turkey winter roosts in south Texas. Proceedingsof the National Wild Turkey Symposium 10:251–264.
R Core Team. 2015. R: a language and environment for statisticalcomputing. R Foundation for Statistical Computing, Vienna,Austria. ,http://www.R-project.org/.. Access 15 April 2015.
Swearingin, R. M., M. J. Butler, W. B. Ballard, M. C. Wallace, R. S.Phillips, R. N. Walker, S. McKenzie-Damron, and D. C.Ruthven, III. 2011. Winter roost characteristics of Rio Grandewild turkeys in the rolling plains of Texas. Proceedings of theNational Wild Turkey Symposium 10:265–277.
Turchin, P. 1991. Translating foraging movements in heterogeneousenvironments into the spatial distribution of foragers. Ecology72:1253–1266.
Vander Haegen, W. M., M. W. Sayre, and W. E. Dodge. 1989.Winter use of agricultural habitats by wild turkeys inMassachusetts. Journal of Wildlife Management 53:30–33.
Wakeling, B. F. 2005. Landscape-level habitat use by Merriam’sturkey in north-central Arizona. Proceedings of the NationalWild Turkey Symposium 9:185–188.
Wickham, J. D., S. V. Stehman, L. Gass, J. Dewitz, J. A. Fry, and T.G. Wade. 2013. Accuracy assessment of NLCD 2006 landcover and impervious surface. Remote Sensing of Environment130:294–304.
Michael E. Byrne is currently a postdoc at the Nova Southeastern
Oceanographic Institute. He received his Ph.D. from Louisiana State
University and his M.S from the University of Rhode Island. Mike
is a vertebrate ecologist with research interests in behavioral and
population ecology, with a particular focus on animal movement
ecology, habitat use, and elucidating the links between individual
behaviors and population level processes. He conducts research on a
wide variety of species in both marine and terrestrial ecosystems,
and has been involved in wild turkey research since 2007.
Bret A. Collier is an Assistant Professor in the School of Renewable
Natural Resources at Louisiana State University. Bret’s research
focus is wildlife population dynamics and development of statistical
methods for wildlife biologists, although he has been known to
delve into a variety of wildlife-related topics. He has been actively
conducting research on wild turkey demography and spatial ecology
for the past 12 years. Bret and his wife, Reagan, have a daughter,
Kennedy, and he is both a hunter and landowner.
Michael J. Chamberlain is a Professor of Wildlife at the Warnell
School of Forestry and Natural Resources at the University of
Georgia. Mike received his B.S. degree from Virginia Tech, and his
M.S. and Ph.D. degrees from Mississippi State University. Mike’s
research interests are broad, but he focuses much effort into
evaluating relationships between wildlife and their habitats. He has
conducted research on wild turkeys for the past 20 years. Mike is a
dedicated hunter and dad, and enjoys spending time outdoors
regardless of the pursuit.
Turkey Roost Ecology � Byrne et al. 185