root cause ppt. - clark county school district · does a site create a culture for focusing on...
TRANSCRIPT

Root Cause Analysis: Root Cause Analysis: School Level Teams
Assessment, Accountability, Research, and School Improvement Division

School Improvement 855‐7783
AARSI TEAM:Lisa BiesingerBrett Campbell Kim MaukBrett Campbell Kim MaukSue Daellenbach Becca MeyerKrista Donnelly Stacie NelsonS e Egloff Deb Robe oSue Egloff Deb RobersonRamona Esparza Wayne RobersonJeff Halsell Nathan TrenholmL L L k i h Y gLaura Love Lakeisha YoungGreg Manzi Tim Zeidler

Talk a Mile a MinuteTalk a Mile a Minute
Find a partner One person is designated the “Talker” and the other the “Receiver”Receiver
The “Talker” will give clues to each of the words on the list without saying the word
The “Receiver” tries to guess h d h li b hthe words on the list by the clues

Things associated with the Growth Model
Student Growth PercentileStudent Growth PercentileCatch up
Academic Peer GroupMGP
Academic Peer GroupMove Up
M di G th P tilMedian Growth PercentileN‐ count
SGPKeep Up SGP

Things associated with the h l f kSchool Performance Framework
Academic GrowthAcademic GrowthMedian Growth Percentile
Academic Achievement (Status)Academic Achievement (Status)Median Adequate Growth
PercentilePercentileAcademic Growth GapsDisaggregated GroupsDisaggregated Groups

PurposePurpose
The most powerful fuse of root cause
analysis in schools occurs within a systemic process of
EvaluateImplementSchool
Improvement y pschool improvement
Process
improvement.(Preuss, 2003) Plan

Session Outcomes – pg 3Session Outcomes – pg. 3
Complete the 7 steps of Root Cause Analysis:R i id tifi d f Review identified performance concerns
Write ALL possible explanations Categorize and sort explanations based on 4 levels of RCA Categorize and sort explanations based on 4 levels of RCA Decide if it is really a cause Narrow the focus Complete Why/Because Validate root causes
Time to complete Inquiry Process and Plan Next Steps

Norms for TodayNorms for Today
Be present participate and engage fully Be present, participate, and engage fully. Listen to learn, limit sidebars. Monitor personal technology.Monitor personal technology. Pay attention to hand signals. Provide feedback in the “Parking Lot.”g Response Cards at your table. Keep an open mind.p p

Crucial ConversationsCrucial Conversations
At your table, share:
Your current level of comfort in facilitating crucial gconversations at the school level (select one): A discussion with a colleague about his/her individual
classroom data results within a grade level meetingclassroom data results within a grade level meeting. Data walls are displayed in the hallway by grade level. How
does a site create a culture for focusing on student learning ff l i bl h f l k f ?versus staff placing blame upon others for lack of progress?
A discussion with site administration about a lack of school process or structure (e.g. criteria for students to be placed p ( g pinto Tier II interventions).
MaterialsMaterials

AgendaIdentify and Focus on concerns from Trends
C id E t l D t d f t Consider External Data and factors that cause performance challenges
Brainstorm possible causes for the Brainstorm possible causes for the concern
Group like causes togetherGroup like causes together
Narrow explanations
“Why ….Because” Process
Validate Root Cause with other Data Sources

Review HomeworkReview Homework
Completed the Performance Data Inventory p y(pg. 6‐7).
Utilized additional performance data that was used to finalize your trend analysis.
Completed performance trend analysis (Section III of SIP Inquiry Process).
Finalized prioritization of concerns (chose 2‐4 areas )on which to focus improvement efforts).
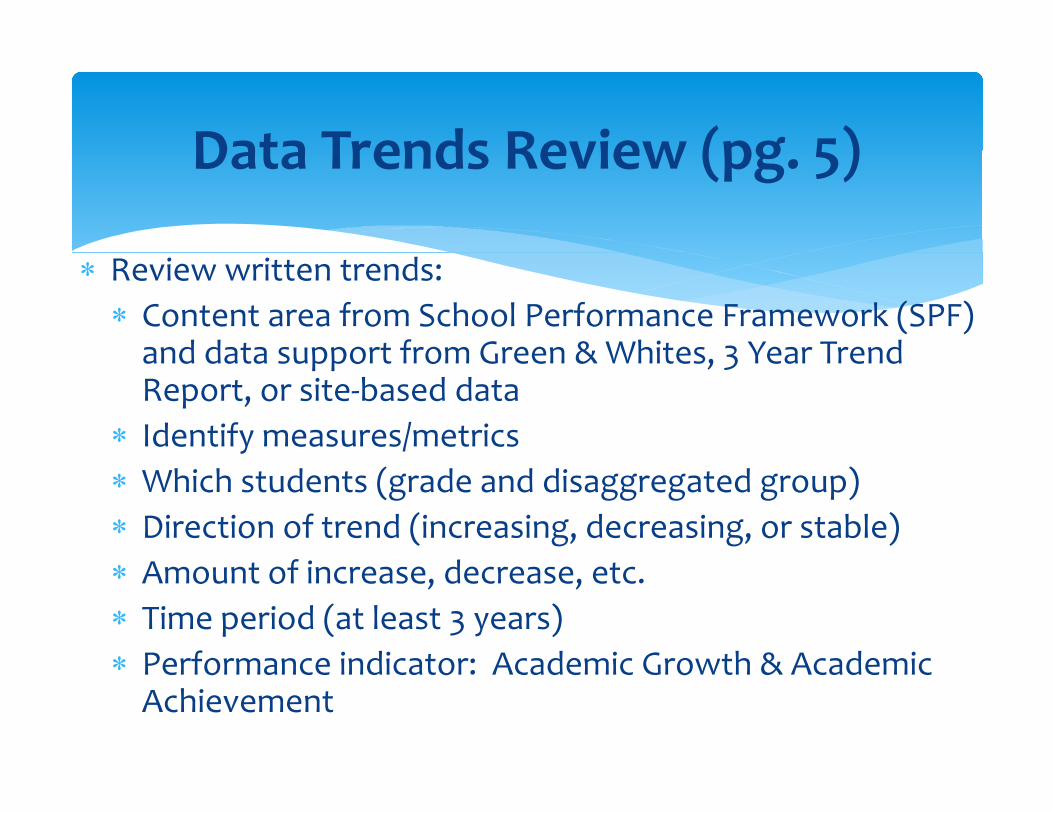
Data Trends Review (pg 5)Data Trends Review (pg. 5)
Review written trends: Content area from School Performance Framework (SPF) and data support from Green & Whites 3 Year Trend and data support from Green & Whites, 3 Year Trend Report, or site‐based data
Identify measures/metrics Which students (grade and disaggregated group) Direction of trend (increasing, decreasing, or stable)
f i d Amount of increase, decrease, etc. Time period (at least 3 years) Performance indicator: Academic Growth & Academic Performance indicator: Academic Growth & Academic Achievement

Data Trends Checklist Data Trends Checklist
Completed Use Quality Criteria (pg.8)
In Progress Finalize Data Analysis.Q y (pg )
to evaluate Performance Trends.
y Use Performance Data Inventory (pg. 6‐7) to
Indicate that your team is ready for a facilitator to
id f db k b
gwrite positive/negative trend statements.
provide feedback about your positive and negative performance trend
Identify 2‐4 priority concerns.
performance trend statements.

Priority Concerns ReviewPriority Concerns Review
Priority Concerns ARE … Specific statements about performance
Strategic focus for the improvement efforts
About the students
Priority Concerns are NOT… What caused or why we have the performance challengey p g
Action steps that need to be taken
Concerns about budget, staffing, curriculum, or instructiong , g, ,
About the adults
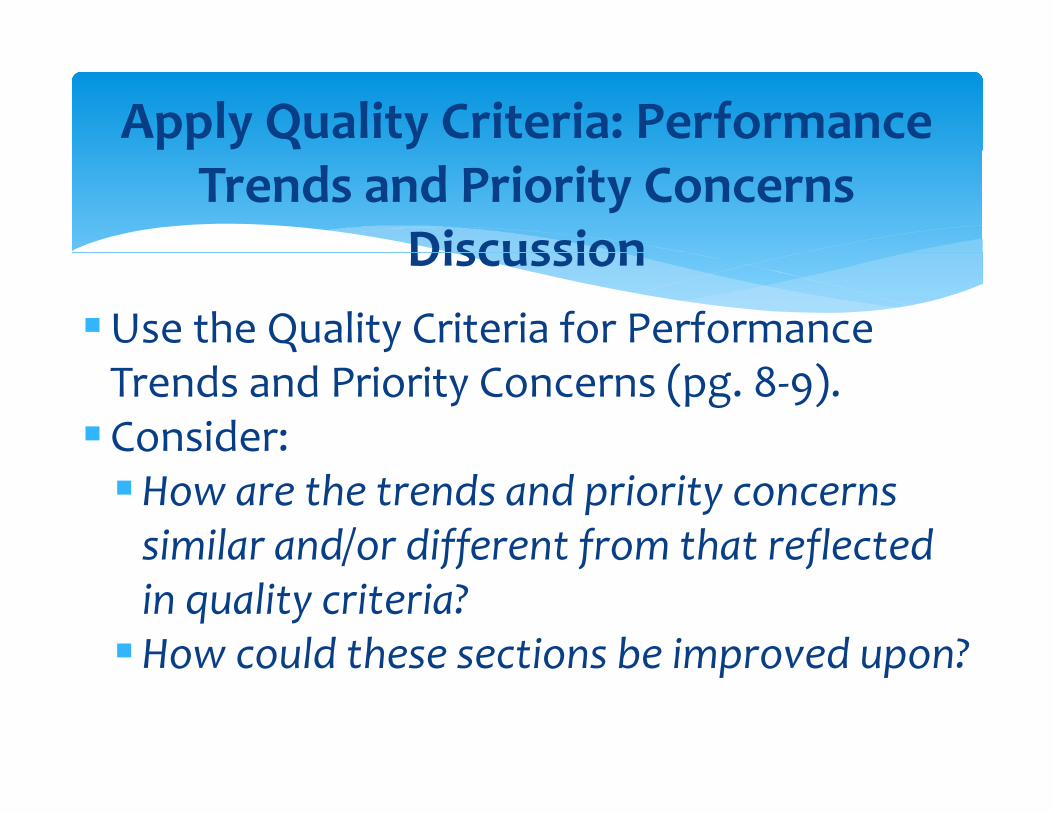
Apply Quality Criteria: Performance Trends and Priority Concerns
DiscussionDiscussionUse the Quality Criteria for Performance Trends and Priority Concerns (pg. 8‐9).Consider:How are the trends and priority concerns similar and/or different from that reflected / ff f fin quality criteria?How could these sections be improved upon?How could these sections be improved upon?

AgendagIdentify and Focus on concerns from Trends
C id E t l D t d f t Consider External Data and factors that cause performance challenges
Brainstorm possible causes for the Brainstorm possible causes for the concern
Group like causes togetherGroup like causes together
Narrow explanations
“Why ….Because” Process
Validate Root Cause with other Data Sources

Why Root Cause Analysis?Why Root Cause Analysis?
Eliminates unfounded opinion, prejudice, and Eliminates unfounded opinion, prejudice, and organizational myth
Reduces false starts patching of symptoms Reduces false starts, patching of symptoms, and waste of scarce resources
Con erts data to information kno ledge Converts data to information, knowledge, understanding, and wisdom
Improves data‐based decision making(Preuss, 2003)

Root CausesRoot Causes
Professional Read (pg 10 13) and Professional Read (pg. 10‐13) and highlight central ideas R i l i i lReview root cause analysis terminology(pg. 22‐24) (pg ) = “I got it” ? = Could use further clarification * = New term or new definition for a familiar term

Reading Key IdeasReading Key Ideas
Identify deepest and most basic concern & barriers to increasing student performancestudent performance
Determine if they are within the school’s control and evidence basedschool s control and evidence based
Treat the cause, not the symptom Focus on the adult actions of the leaders and teachers
Consider climate/culture, organization, structures, processes, curriculum & instruction

Utica HS RCA Process pg 15Utica HS – RCA Process – pg. 15
In 1996, Utica’s Proctor High School was under In 1996, Utica s Proctor High School was under New York State’s list of “Schools Under Regents Review” due to the high dropout rate ‐ in 1993 e e due to t e g d opout ate 993(14.7%) and in 1994 (14.6%). These rates were the third highest in the state. The school would d g e e a e e c oo ou dneed to reduce dropout rates or face state sanctions or closure. sanctions or closure.

Utica HS RCA ProcessUtica HS – RCA Process
Red Flags Red Flags
Failure to dropout record keeping.
Ninth graders were added with no advanced
Students feared for their safety.
planning. Fights were common
School climate/culture was lacking.Di d b h l
occurrences on campus. Discipline was i i t t Discord between school
and BOE, and parents.inconsistent across classrooms.

Utica HS RCA ProcessUtica HS – RCA ProcessRoot Cause Findings
Low attendance was a concern.f
g
Students who were falling behind in their freshman year had difficulty catching‐up to
dgraduate. Some students opted to work instead of completing high school career.
Some students had extenuating family g ysituations that prompted them to drop out.

Utica HS RCA ProcessUtica HS – RCA Process
Night School implemented to accommodate work
Solutions/Strategic Improvement Strategies Night School implemented to accommodate work schedules/family situations
Partnership with Community College for dual credits p y gincentive program
Academic Plans were created prior to ninth grade Mentoring Program and caring culture established for students to feel safe and successful
Alternative Route for non‐proficient students implemented for GED/technical vocational programs

Utica HS RCA ProcessUtica HS – RCA Process
In 1996 Utica’s Proctor High School In 1996, Utica’s Proctor High School had decreased the drop out rates to ( ) ( )(8.1%), in 1997 to (4.2%), and in 1998 to (4.3%). ( )

Sorting Levels of RCASorting Levels of RCA
Incident or ProceduralIncident or ProceduralProgrammaticSystemicExternal External
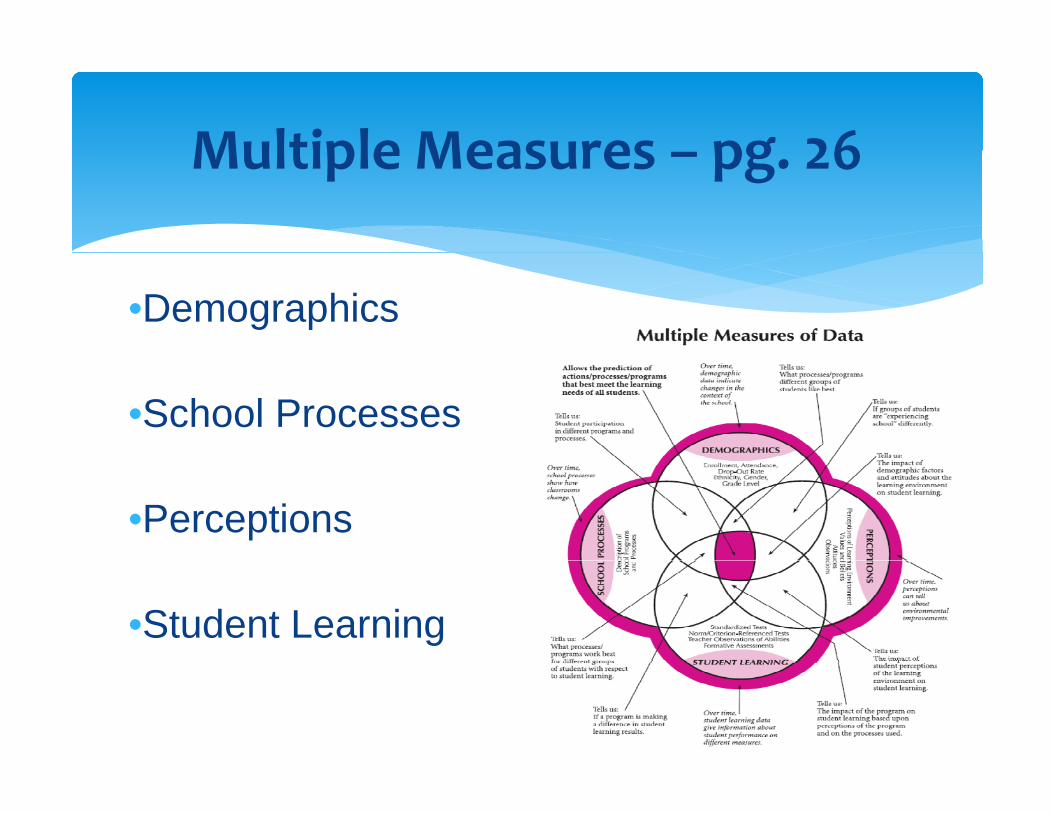
Multiple Measures pg 26Multiple Measures – pg. 26
•Demographics
•School Processes
•Perceptions
•Student Learning

Demographic EvidenceDemographic EvidenceEthnicity
Multi‐Race2%
American Indian1%
Asian1% Pacific Islander
1%
Black1%
Ethnicity
SubgroupsSubgroups
IEP 11 2%Hispanic
50%
White
IEP 11.2%
845% LEP 32.8%
6FRL 67.2%

Qualitative School Process QEvidence
Evidence:• Lesson Plans• Meeting Minutes
• Team• Dept• Dept.
• FOSL Data

School Process Evidence – 2 yrs.y

School Process/Perception
E id
School Process/Perception
Evidence:• Block Schedule Plan• Teacher SurveyTeacher Survey• Survey Results• Block Schedule• Staff Development
Activities

Perception EvidencePerception Evidence
Teacher Perception of Block Schedule EffectivenessSchedule Effectiveness
Effective Not Effective
June 2011 Survey
97% 3%December 2011 72% 28%Survey
7

School Process Observation School Process Observation Evidence

School Process EvidenceSchool Process Evidence

School Process Evidence
Reflective Activity Reflective Activity
• Discuss what other measures of• Discuss what other measures of data you should collect in the 2012 13 h l2012-13 school year.

RCA ProcessIdentify and Focus on concerns from Trends
C id E t l D t d f t Consider External Data and factors that cause performance challenges
Brainstorm possible causes for the Brainstorm possible causes for the concern
Group like causes together
How do we identify Group like causes together
Narrow explanations
identify root causes?
“Why ….Because” Process
Validate Root Cause with other Data Sources

Step 3: Identify Root Cause ActivityStep 3: Identify Root Cause Activity
Draw a circle map and write your main
P ibl y
performance challenge. Use sticky notes to write down ALL
Possible Explanation
Possible Explanation
write down ALL possible explanations related to student learning demographics
EPerformance Challenge
Possible learning, demographics, school processes, and perceptions.
Possible Explanation
Explanation
Possible Explanation

RCA ProcessIdentify and Focus on concerns from Trends
C id E t l D t d f t Consider External Data and factors that cause performance challenges
Brainstorm possible causes for the Brainstorm possible causes for the concern
Group like causes together
How do we identify Group like causes together
Narrow explanations
identify root causes?
“Why ….Because” Process
Validate Root Cause with other Data Sources

Step 4: When is a Cause a Root Cause?
1. Would the problem have occurred if the cause had not b ?been present?If no…then root cause If yes…then contributing cause
2. Will the problem reoccur as the result of the same if h i d di l dcause if the cause is corrected or dissolved?
3. Will correction or dissolution of the cause lead to i il t ? Oth i di t d d d ll similar events? Other indicators: dead end, all agree,
controlled, dissolved, logical and makes sense.

Step 4: When Do We Stop Seeking a Step 4: When Do We Stop Seeking a Cause?
A professional j dgment call is madeA professional judgment call is made.Sufficient data is available. A solid effort has been made to arrive at a reasonable root causea reasonable root cause.

Step 4: Sort & Categorize Explanations
Sort and gro p Possible ExplanationSort and group
similar
p
Possible Explanationexplanations
into the 4 levels E
Performance Challenge
Explanation
Possible Explanation
of RCA – see pg. 14. Possible
Possible Explanationpg. 14.
Explanation

AgendagIdentify and Focus on concerns from Trends
C id E t l D t d f t Consider External Data and factors that cause performance challenges
Brainstorm possible causes for the Brainstorm possible causes for the concern
Group like causes togetherGroup like causes together
Narrow explanations
“Why ….Because” Process
Validate Root Cause with other Data Sources

Step 5: Narrow Focus ActivityStep 5: Narrow Focus Activity
Use RCA pg. 17 to narrow root cause focus 1. Eliminate explanations that are not within our control.
2. Evaluate the quality of your explanations (reach consensus on which ones to keep).(reach consensus on which ones to keep).
3. Clarify the language used in your explanations explanations.

Step 6: Why…Because Activity‐ pg. 19p y y pg 9

AgendagIdentify and Focus on concerns from Trends
C id E t l D t d f t Consider External Data and factors that cause performance challenges
Brainstorm possible causes for the Brainstorm possible causes for the concern
Group like causes togetherGroup like causes together
Narrow explanations
“Why ….Because” Process
Validate Root Cause with other Data Sources

Step 7 : Validating Root Cause pg 20Step 7 : Validating Root Cause – pg. 20
1.What is the proof that this cause exists?2.What is the proof that this cause could lead to the stated
ff t?effect?3.What proof is there that this cause actually contributed to the problem?problem?
4.Is anything else needed, along with this cause, for the stated effect to occur? EX: Are the special education student pschedules the only factor that prevents them from grade level curriculum exposure, or is there another key factor?
5.Can anything else, besides this cause, lead to the stated effect?

Step 7 : Validating Root Cause Step 7 : Validating Root Cause Activity
Use Validating Root Ca se to determine Use Validating Root Cause to determine that this is the root cause (pg. 21).
Inquiry Process in SIP TemplateInquiry Process in SIP Template
Time to work with your site team to ycomplete the inquiry process, Section III of SIP templateof SIP template
Facilitators will assist with clarification of questions
Collaborate with feeder schoolsCo abo ate t eede sc oo sTitle I Overview Meeting (if applicable)

Root Cause Analysis HomeworkRoot Cause Analysis Homework
What data so rces are still needed What data sources are still needed for Root Cause Analysis validation?
What school processes/structures need to be analyzed further?need to be analyzed further?

Taking it back to the schoolTaking it back to the school
Next steps:Complete the Inquiry Process Complete the Inquiry Process Finalize Data Trends‐Positive/NegativeDetermine Key Strengths & Priority Concerns
Identify Root Cause(s)