root scaling study - icann.org
TRANSCRIPT

Nederlandse Organisatie voor toegepast-natuurwetenschappelijk onderzoek / Netherlands Organisation for Applied Scientific Research
Brassersplein 2 P.O. Box 5050 2600 GB Delft The Netherlands www.tno.nl T +31 15 285 70 00 F +31 15 285 70 57 [email protected]
TNO report
Root Scaling Study Description of the DNS Root Scaling Model
Date 29 September 2009 Author(s) Bart Gijsen, Almerima Jamakovic, Frank Roijers Number of pages 36 (incl. appendices) Number of appendices 3 All rights reserved. No part of this report may be reproduced and/or published in any form by print, photoprint, microfilm or any other means without the previous written permission from TNO.
All information which is classified according to Dutch regulations shall be treated by the recipient in the same way as classified information of corresponding value in his own country. No part of this information will be disclosed to any third party.
In case this report was drafted on instructions, the rights and obligations of contracting parties are subject to either the Standard Conditions for Research Instructions given to TNO, or the relevant agreement concluded between the contracting parties. Submitting the report for inspection to parties who have a direct interest is permitted. © 2009 TNO
TNO report | 2 / 36
Reading guide
Background This report is a deliverable of the Root Scalability Study. A specification of the study context, the goals, timelines, deliverables, etc. can be found in [2]. This report describes the modeling contribution to the study team by TNO. The model has been developed based on information documented in the Scaling the Root report [6]. This modeling contribution has been focused on transforming the available information about the Root DNS system into a quantitative model and simulation software. Given the time frame of the root scalability study, there was barely time to perform scalability analysis with the model. However, for purpose of model validation and to illustrate typical use of the simulation model several numerical cases were simulated. Purpose of this document The purpose of this document is to describe the root DNS scalability model, as a basis for:
• explanation of the quantitative root scalability model for the RSST and potentially other interested audience,
• development of the quantitative simulation model by TNO.

TNO report | 3 / 36
Contents
1 Introduction 5
2 Model Description 7 2.1 Flowcharts of modeled provisioning and publication process 7 2.1.1 Overview level: model components, flow sequence and parameters 7 2.1.2 Provisioning side 9 2.1.3 Publication side 15 2.2 Modeled resources 21 2.3 Model output 22 2.3.1 Change request lead time 22 2.3.2 Change request throughput 23 2.3.3 Change request error rate 23 2.3.4 Root zone file loading time 23
3 Model Validation 24 3.1 Model input 24 3.2 Simulation cases 25 3.3 Numerical results 26
4 Summary and recommendation 30
TNO report | 4 / 36
Symbols and Acronyms
DM Distribution Master (part of the Verisign system) DNS Domain Name System DoC Department of Commerce eIANA Automated version of the TLD change request process at IANA gTLD Generic TLD IANA Internet Assigned Numbers Authority ICANN Internet Corporation for Assigned Names and Numbers IDN TLD International TLD IPv6 Internet Protocol version 6 RSO Root Server Operator RSS Root Server System RSSAC Root Server System Advisory Committee RSST Root Scaling Study Team SOA Start Of Administration SSAC Security and Stability Advisory Committee TLD Top Level Domain
TNO report | 5 / 36
1 Introduction
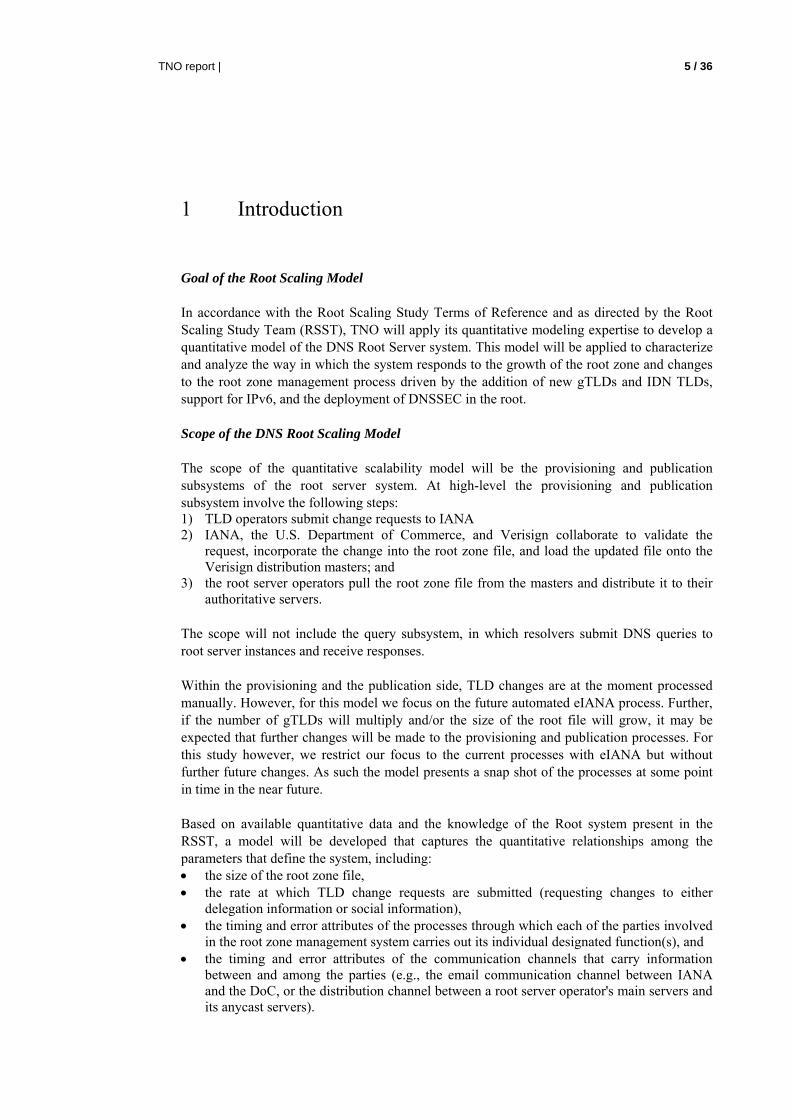
Goal of the Root Scaling Model In accordance with the Root Scaling Study Terms of Reference and as directed by the Root Scaling Study Team (RSST), TNO will apply its quantitative modeling expertise to develop a quantitative model of the DNS Root Server system. This model will be applied to characterize and analyze the way in which the system responds to the growth of the root zone and changes to the root zone management process driven by the addition of new gTLDs and IDN TLDs, support for IPv6, and the deployment of DNSSEC in the root. Scope of the DNS Root Scaling Model The scope of the quantitative scalability model will be the provisioning and publication subsystems of the root server system. At high-level the provisioning and publication subsystem involve the following steps: 1) TLD operators submit change requests to IANA 2) IANA, the U.S. Department of Commerce, and Verisign collaborate to validate the
request, incorporate the change into the root zone file, and load the updated file onto the Verisign distribution masters; and
3) the root server operators pull the root zone file from the masters and distribute it to their authoritative servers.
The scope will not include the query subsystem, in which resolvers submit DNS queries to root server instances and receive responses. Within the provisioning and the publication side, TLD changes are at the moment processed manually. However, for this model we focus on the future automated eIANA process. Further, if the number of gTLDs will multiply and/or the size of the root file will grow, it may be expected that further changes will be made to the provisioning and publication processes. For this study however, we restrict our focus to the current processes with eIANA but without further future changes. As such the model presents a snap shot of the processes at some point in time in the near future. Based on available quantitative data and the knowledge of the Root system present in the RSST, a model will be developed that captures the quantitative relationships among the parameters that define the system, including: • the size of the root zone file, • the rate at which TLD change requests are submitted (requesting changes to either
delegation information or social information), • the timing and error attributes of the processes through which each of the parties involved
in the root zone management system carries out its individual designated function(s), and • the timing and error attributes of the communication channels that carry information
between and among the parties (e.g., the email communication channel between IANA and the DoC, or the distribution channel between a root server operator's main servers and its anycast servers).

TNO report | 6 / 36
• the likelihood of error1 (a) between the submission of a change request and the corresponding update to the root zone distribution master (provisioning subsystem), and (b) between the distribution master and all of the anycast servers (publication subsystem).
Modeling Approach The art of modeling consists of including all relevant parameters and relations between them that capture the dynamic behavior of the modeled system, while omitting all other aspects that are not relevant to the goal of the model based analysis. Typically the development of such a quantitative model is an iterative process with several model adjustment and fine-tuning steps. In order to support a flexible model development approach TNO will use its model development approach PerfICT [1]. Two specific features of this approach are its hierarchical concept and the decoupling of workflows and resources. The hierarchical modeling concept enables the creation of an initial model in which for example IANA is modeled as a black-box, which can be worked out in more detail during the modeling process without having to model the interaction between IANA and other systems in the provisioning process again. Likewise, the decoupling of resources and workflows enables to swap a modeled human resource by an automated one, without having to modify other modeled resources or workflows. Besides providing flexibility during model development the PerfICT approach also enables flexible creation of alternative models for future variants of the Root system. In line with this modeling approach, we chose to use the simulation model SW package ExtendSim (or in fact, Extend OR, version 6.0.8) to enable fast simulation SW development. The model will first of all present a comprehensive overview of the dynamical behavior of the provisioning and publication processes of the Root system. If time permits the dynamical behavior will be visualized by means of graphical animation. Further, by performing sensitivity analyses on the input parameters the model enables ICANN to answer scalability questions such as what amount of resources are required to keep a near-zero error rate for specific scenarios of change request rates, how effective would it be to further automate specific provisioning actions, etc.
1 In this study the term ‘error’ is interpreted as the event that a TLD change that should not be made gets made in the name servers. In particular, if that results in the undesired effect that a zone becomes “invisible". More details on the error model are described in appendix B.

TNO report | 7 / 36
2 Model Description
2.1 Flowcharts of modeled provisioning and publication process
2.1.1 Overview level: model components, flow sequence and parameters
The scope of the quantitative scalability model is the provisioning and publication subsystems of the Root Server system. The following actors will be modeled:
• TLDs, • the IANA, a department within ICANN, • the National Telecommunications and Information Administration (NTIA), an
office within the US Department of Commerce (DoC), • the Verisign Corporation, and • the 12 Root Server operators who administer 13 ‘letter’ root servers.
Furthermore, two types of change are distinguished: 1. delegation/name server change2 2. contact info change Figure 1 gives an overview of the provisioning and publication Root Server subsystem, including the five actors to be modeled. Figure 1 gives also the flow sequence of the type of request to change delegation/name server info.
TLD Change Request
DoC
1 2
5
6 DM
Publication side
A
root DNS
ac ac .
Provisioning side
8
B
.
.
.
C
M
3
4
7
Figure 1: Overview of the actors and processes within the provisioning and the publication subsystem of the Root Server system
2 Note that in the terms of reference this request type is distinguished in two: changes in the set of name servers and changes in the addresses. However, as far as modeling the dynamic behaviour of the provisioning and processing side is concerned this distinction is not essential.
TNO report | 8 / 36
The flow sequence of delegation/name server change request is essentially different from a flow sequence of a request to change contact info data. For the delegation/name server type, a request to change will receive a flag3 that will be assigned to the requested TLD when IANA has a legitimate request, and will be released when the previous change is submitted to the A-root server. In this sense a request to change contact info data is different from the other two provision transaction types: it does not result in a change to the root zone file, it results in a change of the social data database.4 This means that “per TLD one change at a time” processing method only applies to changes that result in an update of the root zone file. A request to change delegation/name server info is processed in the following manner. Changes are requested by the TLD operators5. In the automated eIANA process, IANA initiates the EPP transaction with Verisign (2). Verisign receives the EPP message, generates a token consisting of a human readable ASCII version of the change request, and sends it via EPP transaction back to IANA (3). Upon reception of a token, IANA sends a PGP- encrypted email request for approval to DoC (4). Verisign starts the 10-day timeout period immediately when it sees a PGP-signed email from IANA to DoC. At the same time it begins its technical check, meaning that this process is conducted in parallel with the DoC check. DoC performs its authorization process and sends a PGP-encrypted email message stating “YES” to Verisign, with an identical copy to IANA (5). Versign receives the DoC approval and performs a check after which it assembles changes into the root zone database and generates the root zone file (6). Verisign completes the EPP transaction after checking that the root zone file is successfully uploaded onto the A-server (7). If the results of the DoC authorization check are such that the DoC cannot send a "YES" within the holding period, the DoC will notify IANA via PGP-encrypted email (8), which in turn will notify Verisign to abort the EPP transaction. Versign receives the message and discards the request. A request to change contact info data is processed in the following manner. IANA does not initiate the EPP transaction with Verisign; instead it sends a similarly as PGP-signed formulated request in an email message to DoC. Once IANA receives the DoC authorization, it updates the social data database. In the following sections we will explain in detail the process to be followed by each individual actor.
3 This flag is also referred to as “semaphore” since it forces TLD operators to submit one delegation/ name server change request at a time. 4 The social data database is maintained by IANA. It consists of contacts and addresses. IANA derives the published “whois” database from this database. The “whois” is thus a subset of the information in the social data database. 5 There are currently 268 TLDs, each with one sponsoring organisation, a designated administrative contact and a designated technical contact.

TNO report | 9 / 36
2.1.2 Provisioning side
2.1.2.1 Generation of TLD change requests
Two different statistical distributions are distinguished: for social data and name server/delegation change.
TLD Change Request
1
TLD Request
Generator
Request is forwarded to the next component.
Zoom
Set Attributes
Output Port
Figure 2: Overview of the process within the TLD Change Request Component
In the automated eIANA process, a change request will be submitted through a custom web based tool, which performs some basic syntax checks in real-time. Users obtain access to the IANA change request tool via a username and a password previously allocated uniquely to them by IANA. Hence a legitimate source of a change request is any party who can log into the eIANA change request system. In most cases this is a TLD operator. If for any reason a TLD is unable to get to the automated web tool, IANA will act as intermediary, and upon receipt of the request (in this case by email, phone and fax) and conformation that the source is legitimate, will load the information into the automated web tool. This generation process is out of the scope. Requests which are generated internally by actors in the DNS Root Provisioning subsystem are also out of the scope for this model. The request arrival process of the delegation/name server request type as well as the contact info change type will be modeled as a Poisson process with parameter λ. This means that the rate of incoming requests is λ, and the time between arriving requests has a mean of β = λ−1. By default the change request rate input parameter is set to 1 change request per year, per TLD. Further, in our model we use hours as the default time unit. For each arriving request the (configurable) Success Rate attribute is set to 1, indicating that the probability that the request content contains an error is zero. See appendix B for details about the error model. Further, the Count attribute represents the number of administrative and technical contact persons that need to be consulted during the authorization check (see section on IANA). This attribute can be used to simulate cases where change requests need to be verified by multiple parties, for example in case a name server is shared between several parties. The parameter value is drawn from a uniform distribution between 1 and N (for a configurable Integer value N). Table 1 shows the model input parameters of the TLD change request component of the model. It also shows their default values. These default values (in this table and the following

TNO report | 10 / 36
tables) are either based on current practice or, if no values were received by the study team, best guesses of their values.
Table 1 Input parameters for TLD change request component
Input Parameter Input Parameter Value (default)
<#TLDs> 280 <N> (maximum number of authorization checks)
3
<Rate of requests> 1 per year, per TLD <Rate of request to change contact info>
10% of the requests
<Rate of requests to change delegation/name server info>
(Equals 100%-10% = 90% of requests)
2.1.2.2 TLD change request at IANA
Upon reception of a change request, a human resource from IANA performs an authorization/authentication check to make sure that both the administrative and technical contacts agree with the TLD request. This conformation check helps to prevent “stealth” redelegations (changing the zone management). For example, the contact info changes might be combined with name server changes, which could lead to “stealth” redelegation if not well synchronized. The Count parameter dictates how many times the authorization check is performed. This is included in the model to simulate the case where IANA performs multiple subsequent authorization checks towards multiple stakeholders. The model also includes a delay representing the reaction time of the external parties that need to authorize the request. As opposed to the other request handling steps this delay does not require resources from IANA. This may for example be the case for a change name server request for a name server that is shared by more than one TLD. Note: the study team recognizes that provisioning process steps performed by human resources (at IANA, but also at Verisign and DoC) may well become more automated in the future. For example by the introduction of a process workflow system. However, we consider it likely that at least several authorization checks, executed by authorized persons, will remain in the process. Based on this assumption and the fact that human actions will be more time and resource consuming than automated process steps, our model is focused on manual steps. Further, even if several provisioning process steps become automated in the future the model will typically remain valid and would simply require adjustment of input parameters. Once a change request passes all of the IANA administrative and technical checks, a distinction is made between the contact info change request and the delegation/name server request type. A contact info change request results in a change to the social data database, therefore no EPP transaction with Verisign has to be initiated. Instead, IANA sends a similarly formulated request in an email message to DoC and waits for DoC authorization. Once the authorization is received, the database containing social contact information is updated. For the purpose of gathering statistics the request is then forwarded to the output module of the simulation model.
TNO report | 11 / 36
After IANA has validated a delegation/name server change request, the request will try to obtain a semaphore (or a ‘lock’). If there is no change request in process for the concerning TLD, then the semaphore will be assigned to the request. Otherwise the request in process holds the semaphore, until:
a) Verisign indicates that the request is completed by sending an EPP Stop message, or
b) DoC sends a message to withdraw the request.
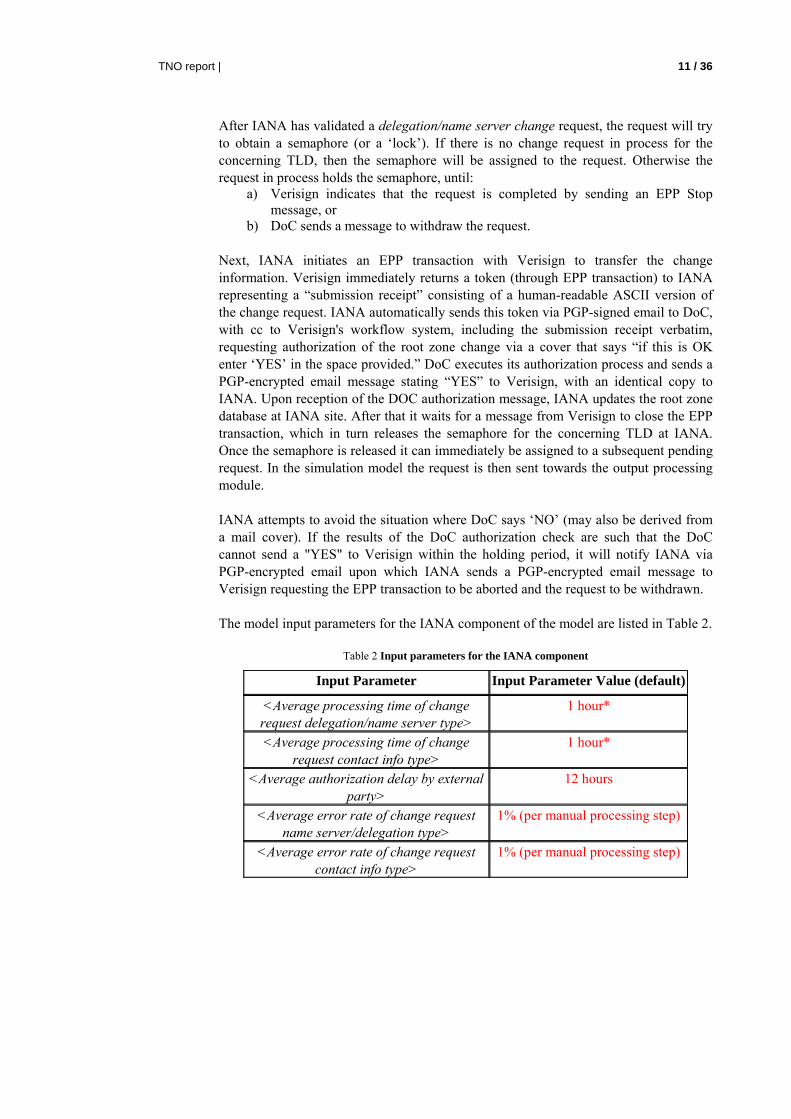
Next, IANA initiates an EPP transaction with Verisign to transfer the change information. Verisign immediately returns a token (through EPP transaction) to IANA representing a “submission receipt” consisting of a human-readable ASCII version of the change request. IANA automatically sends this token via PGP-signed email to DoC, with cc to Verisign's workflow system, including the submission receipt verbatim, requesting authorization of the root zone change via a cover that says “if this is OK enter ‘YES’ in the space provided.” DoC executes its authorization process and sends a PGP-encrypted email message stating “YES” to Verisign, with an identical copy to IANA. Upon reception of the DOC authorization message, IANA updates the root zone database at IANA site. After that it waits for a message from Verisign to close the EPP transaction, which in turn releases the semaphore for the concerning TLD at IANA. Once the semaphore is released it can immediately be assigned to a subsequent pending request. In the simulation model the request is then sent towards the output processing module. IANA attempts to avoid the situation where DoC says ‘NO’ (may also be derived from a mail cover). If the results of the DoC authorization check are such that the DoC cannot send a "YES" to Verisign within the holding period, it will notify IANA via PGP-encrypted email upon which IANA sends a PGP-encrypted email message to Verisign requesting the EPP transaction to be aborted and the request to be withdrawn. The model input parameters for the IANA component of the model are listed in Table 2.
Table 2 Input parameters for the IANA component
Input Parameter Input Parameter Value (default)
<Average processing time of change request delegation/name server type>
1 hour*
<Average processing time of change request contact info type>
1 hour*
<Average authorization delay by external party>
12 hours
<Average error rate of change request name server/delegation type>
1% (per manual processing step)
<Average error rate of change request contact info type>
1% (per manual processing step)

TNO report | 12 / 36
* In fact, the processing time of change requests consists of several steps; see the description above. Each of those can be assigned its own processing time in the simulation model. In order to keep the number of input parameters limited we assumed a rather even distribution of processing time over the steps. The default parameter value shown here is the sum of the processing time over all steps for handling a single change request.
2.1.2.3 TLD change request at Verisign
In the automated eIANA process, IANA initiates an EPP transaction with Verisign to transfer the redelegation / name server change request information. After receiving the message, Verisign creates and returns along with the EPP transaction a token to IANA representing a “submission receipt”, consisting of a human-readable ASCII version of the change request. Verisign performs a number of technical checks on the change request while waiting for authorization from DoC. The technical checks start as soon as Verisign sees the PGP-signed email with validation token from IANA to DoC. At this moment, Versign starts the timeout period in order to hold the information while it waits for authorization from DoC6. The holding time of the information is limited to 10 working days (336 hours), after which the request is discarded by Verisign. However, in practice the situation where this 10 working day timer actually expires does not occur. Therefore, we chose not to include this timer in the model. If the results of the DoC authorization check are (timely and) positive, Versign performs a check after which it updates the change into the root zone database. If the results of the DoC authorization check are though such that the DoC does send a "YES" to Verisign within the holding period, the DoC will notify IANA via PGP-encrypted email. Versign receives a PGP-encrypted email message from IANA requesting the EPP transaction to be aborted. In this case Verisign does not preserve any state with respect to an expunged request. This means that if the request is re-submitted at a later point in time, Verisign will consider it as a new request. Independent of the provisioning process7 Versign generates a new Root zone file from the root zone database twice a day, at random times. The zone file is then published via the hidden Distribution Masters (DM) towards the Root zone name servers. A final check is performed to conform that the update has reached the A-root after which Verisign ends the EPP transaction between IANA and Verisign. The input parameters of the Verisign module and their default values are presented in Table 3. Note, that the first four parameters are part of the provisioning process, while the latter three are actually part of the publication side model. In fact, the latter three specify the size of the root zone file, according to the following formula: Root Zone file size = Base Root zone file size x (#TLDs / 280) x Multiply Factor (1)
6 Note, that “while it waits for …” requires special attention in the simulation model logic. It means that it may not simply merge a request that passed the technical checks with the next request coming from DoC. Due to the fact that the process is not necessarily order-conserving simply merging two request may lead to a situation where a Verisign check on request X is merged with a DoC approval for request Y. Instead, a ‘join’ construct is needed that matches the request passing the checks with the request coming from DoC, based on a request ID. 7 As far as we know this is the case and in the model the zone file production time is assumed to be independent from changes being updated in the DM database.
TNO report | 13 / 36
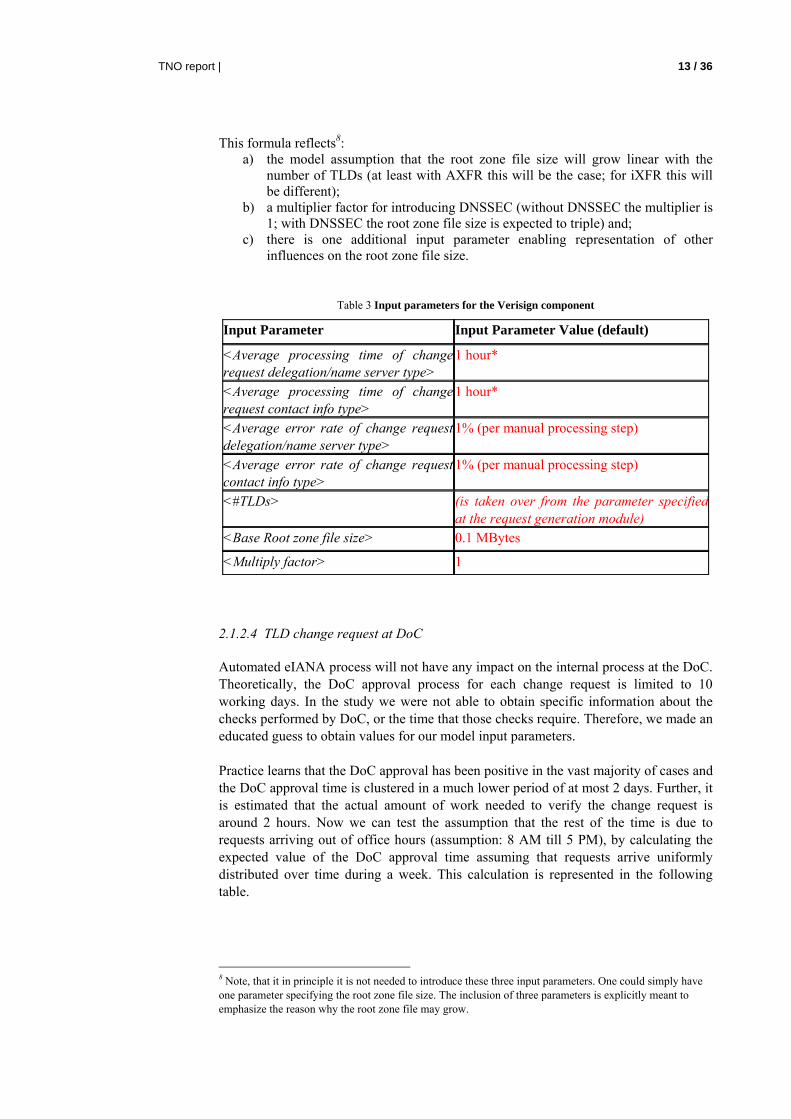
This formula reflects8:
a) the model assumption that the root zone file size will grow linear with the number of TLDs (at least with AXFR this will be the case; for iXFR this will be different);
b) a multiplier factor for introducing DNSSEC (without DNSSEC the multiplier is 1; with DNSSEC the root zone file size is expected to triple) and;
c) there is one additional input parameter enabling representation of other influences on the root zone file size.
Table 3 Input parameters for the Verisign component
Input Parameter Input Parameter Value (default)
<Average processing time of change request delegation/name server type>
1 hour*
<Average processing time of change request contact info type>
1 hour*
<Average error rate of change request delegation/name server type>
1% (per manual processing step)
<Average error rate of change request contact info type>
1% (per manual processing step)
<#TLDs> (is taken over from the parameter specified at the request generation module)
<Base Root zone file size> 0.1 MBytes
<Multiply factor> 1
2.1.2.4 TLD change request at DoC
Automated eIANA process will not have any impact on the internal process at the DoC. Theoretically, the DoC approval process for each change request is limited to 10 working days. In the study we were not able to obtain specific information about the checks performed by DoC, or the time that those checks require. Therefore, we made an educated guess to obtain values for our model input parameters. Practice learns that the DoC approval has been positive in the vast majority of cases and the DoC approval time is clustered in a much lower period of at most 2 days. Further, it is estimated that the actual amount of work needed to verify the change request is around 2 hours. Now we can test the assumption that the rest of the time is due to requests arriving out of office hours (assumption: 8 AM till 5 PM), by calculating the expected value of the DoC approval time assuming that requests arrive uniformly distributed over time during a week. This calculation is represented in the following table. 8 Note, that it in principle it is not needed to introduce these three input parameters. One could simply have one parameter specifying the root zone file size. The inclusion of three parameters is explicitly meant to emphasize the reason why the root zone file may grow.

TNO report | 14 / 36
Table 4 Input parameters for the DoC component
Request arrives at DoC during Avg. duration (hours)
Probability
office hours 2 9x5 / 24x7 week days, out of office hours (15+0)/2 + 2 15x4 / 24x7 Weekend (63+0)/2 + 2 63 / 24x7
The overall expected value of the DoC approval time then becomes the sum product of the values in the table above. This results in the value of 16 hours, which roughly matches with the experience that requests are handled in at most 2 days. We are not suggesting that this is the actual operation (requests arriving at random times and DoC only handling requests within office hours), but it does give a plausible argument for the experienced values. Further, given the fact that the provisioning process contains several manual checks it is likely that request handling will, in some cases, be interrupted by office hour time frames. Therefore we include an office hours time frame in our model for the manual actions performed by DoC. We emphasize that this only means that processing new requests will only start during office hours. If during some office hour window more requests arrive than can be handled within the window, then we assume that the human resource will keep processing the request in the out-of-office time window! However, if the results of the DoC authorization check are such that the DoC does not send a "YES" to Verisign within the holding period, it will notify IANA via PGP-encrypted email, which in turn will notify Verisign to abort the EPP transaction. As mentioned before this will rarely happen9. We assume that in addition to a first check a double check will be done in this case. This is assumed to be none resource consuming, i.e. someone else will perform the double check. With respect to the likelihood of introducing errors into the content of a change request we assume that DoC will never make actual changes to the content of a change request. DoC will approve, or not. It will not modify. Therefore the error rate at the DoC process steps is assumed to be zero.
Table 5 Input parameters for the DoC component
Input Parameter Input Parameter Value (default)
<Average processing time of change request delegation/name server type>
2 hours
<Average processing time of change request contact info type>
2 hours
<Office hours> 8 AM till 5 PM on week days
<Additional delay for double check> 1 to 4 hours (uniformly distributed)
<DoC non-approval probability> 0.1%
9 We assume the non-approval rate to be 0.1%. With the current change request rate of approximately one per day this would mean that DoC would request to withdraw a change request once every three years.

TNO report | 15 / 36
2.1.3 Publication side
2.1.3.1 Description of the publication side
The publication side consists of Verisign’s Distribution Master (DM) and the Root Service Operators (RSO).
Twice a day Verisign’s root zone database produces a new version of the root zone file. This action is performed 365 days per year and the time the new zone files become available is not the same every day.
After the root zone file is produced, the DM sends a DNS notify message to all RSOs. Each DM uses a randomized back-off time (per RSO) before it sends the DNS notify to the RSO. This is done in order to prevent that all RSOs respond at the same instance.
An RSO responds with an acknowledgement to the DM. If the DM does not receive an acknowledgement within a certain period, a DM may send more than one notifies (RFC 1996, Section 3.6). Details are implementation dependent but the interval between retransmissions, and the total number of retransmissions, should be operational parameters specifiable by the name server administrator, perhaps on a per-zone basis. Reasonable defaults are a multiple of the RTT (or timeout if using TCP), and a maximum of 5 attempts (for UDP). It is considered reasonable to use additive or exponential back off for the retry interval.
An RSO that receives a DNS notify always responds with acknowledging the receipt of the DNS notify (as described above). The DNS notify triggers the SOA request, i.e., the RSO sends a SOA-request in order to check the serial number at the DM. The DM replies with a message which includes the serial number. If this serial number is higher than the number that is currently operated by the RSO, the RSO starts an XFR to retrieve the new root-zone file and if the new root-zone file is successfully retrieved, the RSO will use this new root-zone file. If this serial number in the SOA-response is not higher than the currently used version, then the RSO takes no further actions.
An RSO always responds to the DM from which it receives the DNS notify. If the RSO receives DNS notifies from other DMs while it is active with a SOA or XFR, it buffers the DNS notifies. After it completes the SOA or XFR (successful or not), it will handle the buffered DNS notifies in order of arrival to check whether another DM has a newer version of the root-zone file.
Further, an RSO periodically checks the serial number at a DM, using a SOA request, in case it has missed a DNS notify.
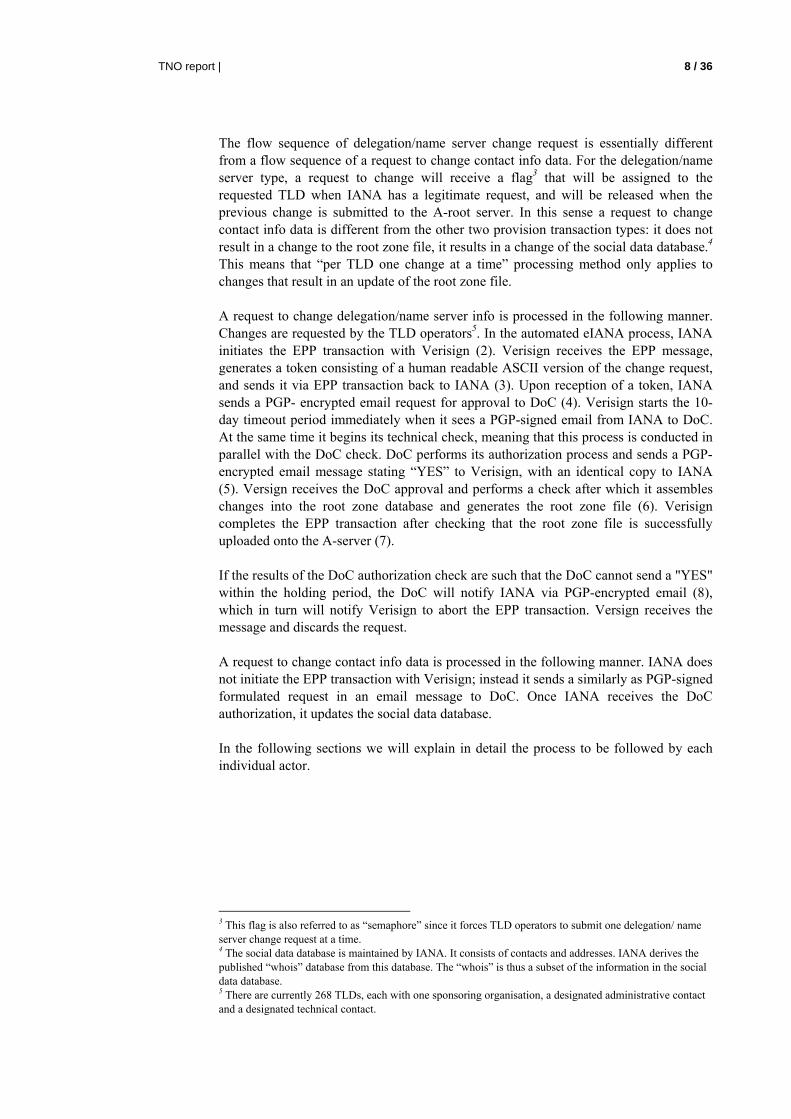
The above-described process is illustrated in Figure 3.
Clearly, there are quite some fail-over techniques in place to resolve a potential unsuccessful upload of a zone file to a name server. From the model point of view we assume that uploading the root zone file to an end point will, ultimately, always succeed. However, this need not always be within the one week period before (as defined by the current EXPIRE timer) an RSO may ‘go dark’. Further, it may not succeed in the first attempt to upload the file, which leads to the undesirable situation where (part of) the zone file is stale. In the model we will primarily focus on the “freshness” of the zone file data. Once again, note that a “freshness” older than one week may cause an RSO to ‘go dark’.

TNO report | 16 / 36
DNS notify
DNS notify
Acknowledgement
XFR start
XFR start file transfer
SOA response
SOA request
XFR Finish
DM RSO
IF notified SOA serial number is higher than
the serial at the RSO
THEN the XFR is started to retrieve the
newer root-zone file
transfer time of the root-zone file
DNS notify
DNS notify
Acknowledgement
XFR start
XFR start file transfer
SOA response
SOA request
XFR Finish
DM RSO
IF notified SOA serial number is higher than
the serial at the RSO
THEN the XFR is started to retrieve the
newer root-zone file
transfer time of the root-zone file
Figure 3: dialog between a DM and an RSO
RSOs differ in the manner that they retrieve the root-zone file, e.g., in a staged or non-staged manner. Further, the RSO can be a cluster at a single location or it can have multiple locations using anycast.
Typically an RSO consists of a number of name servers which have the same function, i.e. handling queries. A query for a root-zone file entry is first handled by a load balancer which forwards a query to one of the name servers. In the root-scalability study we do not consider the query-response side of the RSO, we focus on the publication side.
In the publication we distinguish staged and non-staged RSOs. In case of: - a non-staged RSO, each name server retrieves the root-zone file itself after it receives a DNS notify of a new root-zone file.
- a staged RSO, the root-zone file will be retrieved only once into a (sort of) Internal Distribution Master (I-DM) from which the root-zone file is distributed to all name servers within the RSO. Further, an RSO can be a cluster (single location) or be spread over multiple locations and a query response finds one of the locations due to anycast.
We consider the following types of RSO architectures:
• the RSO architecture which is checked by Verisign to see whether all changes were successful,
• a staged RSO architecture that includes a manual check of the root-zone file

TNO report | 17 / 36
• non-staged name server clusters which are connected by low-capacity links, e.g., satellite link,
• a staged anycast architecture.
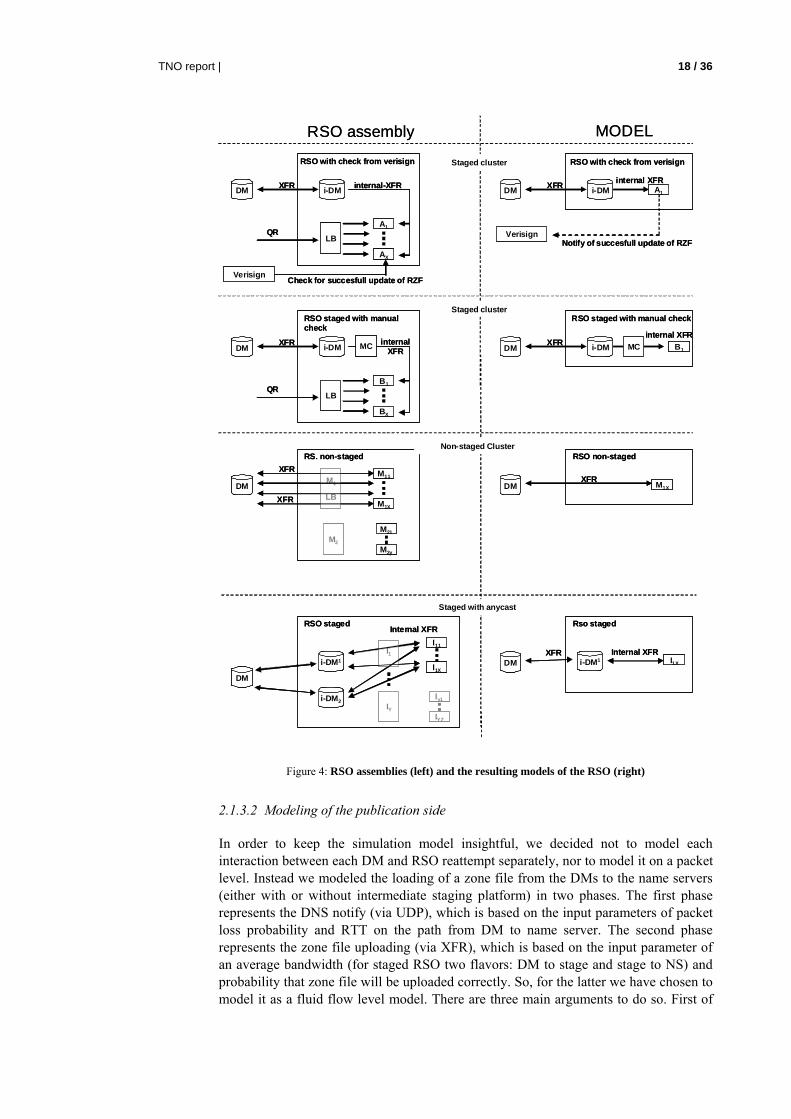
The left sides of Figure 4 show the assemblies of the above described RSOs.
Remarks:
• The top two root assemblies in Figure 4 also illustrate the query-response sides for the purpose of recognition; these are not part of the actual model as query-response is outside the scope of this project.
• Verisign checks a root to see whether the root-zone file was successfully loaded onto the name server. Although this root was classified as non-staged cluster, in practice there is some kind of staging as only a single XFR is done by the cluster and the root-zone file is internally distributed.
• Another root contains a manual check (denoted in the figure by MC). In practice this means that a new root-zone file is first uploaded to a test name-server to investigate whether the file can be successfully uploaded. If this check passes, the new root-zone file is uploaded to all operational name servers. In practice this result in an additional delay in the order of 10 minutes.
TNO report | 18 / 36
DM i-DM
LB
XFR
BX
QR
internalXFR
B1
RSO staged with manualcheck
DM i-DMXFRinternal XFR
B1
RSO staged with manual check
DM M1
LB
XFR
M1X
M11
RS. non-staged
DMXFR M1X
M2M2y
M21
XFR
RSO non-staged
DM
I1
RSO staged
DM I1X
IY
Rso staged
I1X
I11
IYZ
Iy1
i-DM1
i-DM2
Internal XFR
i-DM1XFR Internal XFR
MODELRSO assembly
Non-staged Cluster
Staged cluster
Staged with anycast
MC MC
DM i-DM
LB
XFR
AX
QR
internal-XFR
A1
RSO with check from verisign
DM i-DMXFR internal XFRA1
Staged cluster
Verisign Check for succesfull update of RZF
VerisignNotify of succesfull update of RZF
RSO with check from verisign
DM i-DM
LB
XFR
BX
QR
internalXFR
B1
RSO staged with manualcheck
DM i-DMXFRinternal XFR
B1
RSO staged with manual check
DM M1
LB
XFR
M1X
M11
RS. non-staged
DMXFR M1X
M2M2y
M21
XFR
RSO non-staged
DM
I1
RSO staged
DM I1X
IY
Rso staged
I1X
I11
IYZ
Iy1
i-DM1
i-DM2
Internal XFR
i-DM1XFR Internal XFR
MODELRSO assembly
Non-staged Cluster
Staged cluster
Staged with anycast
MC MC
DM i-DM
LB
XFR
AX
QR
internal-XFR
A1
RSO with check from verisign
DM i-DMXFR internal XFRA1
Staged cluster
Verisign Check for succesfull update of RZF
VerisignNotify of succesfull update of RZF
RSO with check from verisign
Figure 4: RSO assemblies (left) and the resulting models of the RSO (right)
2.1.3.2 Modeling of the publication side
In order to keep the simulation model insightful, we decided not to model each interaction between each DM and RSO reattempt separately, nor to model it on a packet level. Instead we modeled the loading of a zone file from the DMs to the name servers (either with or without intermediate staging platform) in two phases. The first phase represents the DNS notify (via UDP), which is based on the input parameters of packet loss probability and RTT on the path from DM to name server. The second phase represents the zone file uploading (via XFR), which is based on the input parameter of an average bandwidth (for staged RSO two flavors: DM to stage and stage to NS) and probability that zone file will be uploaded correctly. So, for the latter we have chosen to model it as a fluid flow level model. There are three main arguments to do so. First of

TNO report | 19 / 36
all, we do not have information concerning the DM to Name server transport protocol settings, nor do we precisely know where the specific bottlenecks are. Secondly, the level of detail would not match that from the provisioning side. In particular, at the provisioning side of the model we focus at a time scale of hours. Including transport layer details would zoom in on the millisecond to second (maybe minutes) time-scale. Third, this enables the option to do pre-processing of meta-model input parameters, into the ExtendSim model parameters. For example, if we would like to use the 'simple TCP model' results from [5] (in which model one also has to specify the maximum window size, RTT and delayed acknowledgements setting in TCP), then this can be calculated a priori and the resulting throughput can be fed into the ExtendSim model input files. On the other hand, if a specific model applicable to large bandwidth-delay product cases (or any other model) would turn out to be more accurate, then the resulting output from that model can be used as input for the ExtendSim model.
In the following paragraphs the distribution side model calculations will be explained in more detail.
Successful receipt of a DNS notify of a particular DM by an RSO.
Let
p denote the probability of an UDP packet from a DM successfully reaching a particular RSO, r denote the total number of reattempts, and t time-out period for a reattempt
In the ExtendSim simulation model we calculate the probability that the DM successfully notifies a RSO within the maximum number of reattempts by a loop which implements the calculations presented in Table 6.
Table 6 Success (and failure) probability for a DM to notify an RSO with multiple reattempts
Attempt Probability of success in attempt
Delay
1 p 0
2 (1-p) × p 1 × t
3 (1-p)2 × p 2 × t
R (1-p)r-1 × p (r-1) × t
Probability of failure
No success after r attempts
(1-p)r r × t
As default parameter values for the DNS notify and SOA we use the following values:

TNO report | 20 / 36
Table 7 Default parameters for DNS notify and SOA attempts
Parameters Value
PacketLoss probability 1%
RTT 100 ms = 2.77778E-05 hours
Maximum number of attempts 5
Time-out value 1 sec. = 2.77778E-04 hours
Max. random back off time before DM sends DNS notify to RSO 60 sec. = 0.01667 hours
Success rates of a SOA.
The success rate of a SOA is calculated identically to the DNS-notify as both use UDP messages.
Success rates of an XFR and internal XFR (in case of a staged RSO).
For the XFR the user has to provide an overall XFR success probability and the average goodput of a connection. Typically the success probability decreases for an increasing root-zone file.
The XFR uses a TCP-connection for a transfer of the data. Typically if the packet loss is at most a couple of percentages (i.e., < 3%), TCP is capable of offering reliable file transfers and the XFR success-rate should be 100%.
For the XFR transfer time T between the DM and the RSO a goodput R should be specified to make the transfer time dependent on the root-zone file size s. Then the average transfer time is
avg(T) = s/R,
in the model the transfer time is randomly sampled from a statistical distribution with mean value avg(T), e.g., distributed according to the Normal distribution.
Table 8 Default parameters for XFR and internal XFR
Parameters Value
XFR probability of success 99%
XFR goodput 10 Mbps
Internal XFR probability of success 99%
Internal XFR goodput 10 Mbps
Internal trigger for a SOA.
Besides the DNS notifies, also the RSO has an internal periodic check (as defined by the Refresh/Retry timers) as a fail-safe for a missed DNS notify. We assume that the retrieval of a new root-zone file normally results from a DNS notify and only in case all DNS notifies from all DMs fail, that the internal process triggers a SOA and XFR. This is useful if the quality of the link varies over time, i.e., in case the connections between DMs and RSOs are bad or even unavailable when the root-zone file becomes available.

TNO report | 21 / 36
Then, the internal trigger continuously retries the SOA until it is successful after the connection has becomes better/available again.
In the ExtendSim model the internal trigger is not modeled. In ExtendSim we do not incorporate the time-varying quality of the connection between the DMs and the RSOs. In that case it is very unlikely that the internal trigger will initiate the successful retrieval of a new root-zone file after all reattempts of all notifications of DMs have failed just prior to the internal trigger.
RSO assemblies.
In the model we consider the freshness of loading a root-zone file successfully onto a name server, e.g., the time period between the DNS notify and the successful retrieval of the new root-zone file by an RSO. For this reason in the model:
• We consider a single name server of an RSO as all the name servers are identical and there is no relation between the name servers.10
• From the modeling point of view there is no distinction between name servers in a cluster or an anycast assembly. In a non-staged case each has to do its own XFR and from the point of view of a particular name server it is irrelevant whether it is in a cluster. In a staged case the difference is that in a cluster the internal XFR is within the same location and for anycast the internal XFR can be between distinct locations.
The right sides of Figure 4 show how the different assemblies are incorporated into the ExtendSim model.
2.2 Modeled resources
In this model the only modeled resources are human resources (in the provisioning process) and communication resources (in the publication process). Other resources are assumed to be very fast and to have more processing capacity than required to execute their tasks. In other words, the bottlenecks on which the model focuses are the mentioned human and communication resources.
The human resources are assumed to execute their tasks in a first-come-first-served (FCFS) order. In order to be able to experiment with multiple persons handling requests the model includes an input parameter that specifies how many persons will be handling requests at IANA, DoC and Verisign premises. If that input parameter is larger than one, then the request service discipline become a multi-station FCFS discipline.
For DoC working hours during a calendar week are taken into account. In particular, the human resources at DoC are assumed only to process requests between 8 AM and 5 PM from Monday to Friday (see also section about DoC).
The following table presents the model input parameters and their defaults values.
Table 9 Default parameters for human resource capacity
Input Parameter Input Parameter Value (default)
<FTEs at IANA> 2 FTE
<FTEs at VeriSign> 2 FTE
10 We are aware that there are RSOs which have implemented root-zone file distribution between name servers in case of unsuccessful XFR. Extracting from these unique cases keeps the number of cases to consider limited.

TNO report | 22 / 36
<FTEs at DoC> 1 FTE
Several modifications of the modeled human resources are possible, if necessary to make the processing by human resources more accurate. These modifications are not yet implemented in the current model in order to keep the model as simple as possible. Examples of such modifications are:
• Take working hours into account for IANA and Verisign. This would especially have impact on lead times if human personal are handling change requests from premises in different time zones.
• In the current model it is assumed that the human resource starts to process a request at the instant that it arrives (or is passed on). In practice, there will be some ‘idle time’ between arrival of a request and the start of processing it, even within working hours. In particular if more than one change request per day is arriving, persons may start to do batch processing.
Communication path resources are characterized by a number of parameters, as explained in the previous subsection.
2.3 Model output
2.3.1 Change request lead time
The lead time of a TLD change request is the elapsed time between the arrival of the request and the request being processed. By the arrival of the request the time stamp at which a change request is submitted to IANA is meant. For (re)delegation and name server change requests the request completion time is the time when the request is updated in each of the root name servers. For contact info change requests this means that the change is updated in the IANA database with contact information. The lead time model output is distinguished for both of the request types.
For (re)delegation and name server change requests the model has an additional model output parameter, related to the lead time. This is the provisioning lead time parameter that denotes the elapsed time between arrival of the request and its content being updated in the DM database.
If needed the lead time can quite easily be split up further in a request verification time / waiting time / processing time. The request verification time would be the time between submission of a request at eIANA until IANA approves the change request as a valid request; possibly this time is zero. The waiting time is the time that a valid change request for a specific TLD is waiting for processing of the request, because a previous change request for that TLD is not finished processing yet. The processing time is the elapsed time between start and completion of processing on a valid request. This is not worked out in the simulation model. Potentially the lead time can also be distinguished per TLD, but because we make no distinction in the processing of requests between TLDs this is not very useful with the current model.

TNO report | 23 / 36
2.3.2 Change request throughput
The change request throughput denotes the number of change requests that are processed through the provisioning process during the simulation time. The change request throughput output is distinguished per request type.
2.3.3 Change request error rate
As indicated in the description of the flowcharts and resources, the error rate computation is based on a so-called ‘reward model’. In this study the term ‘error’ is interpreted as the event that a TLD change that should not be made gets made in the name servers. In particular, if that leads to the undesired affect that a zone becomes “invisible”. More details on the error model are described in appendix B.
2.3.4 Root zone file loading time
This model output parameter denotes the ‘loading time’ of the root zone file in the name servers. More specific, it specifies the delay between production of the root zone file and the root zone file being uploaded in the name servers. This output parameter is reported for the various types of name servers.

TNO report | 24 / 36
3 Model Validation
The following scenarios are strictly illustrative to show the input and output parameters of the ExtendSim model.
3.1 Model input
In section 2 the default values for the model parameters are mentioned. In the ExtendSim model the parameters can be linked by means of text files which are read by the model at the beginning of the simulation. The used text files are:
• Input_Requests.txt
• Input_Processing.txt
• Input_ZoneFile.txt
• Distribution_DnsSoa_Root_A.txt
• Distribution_DnsSoa_Root_X.txt
• Distribution_XFR_Root_A.txt
• Distribution_XFR_Root_X.txt
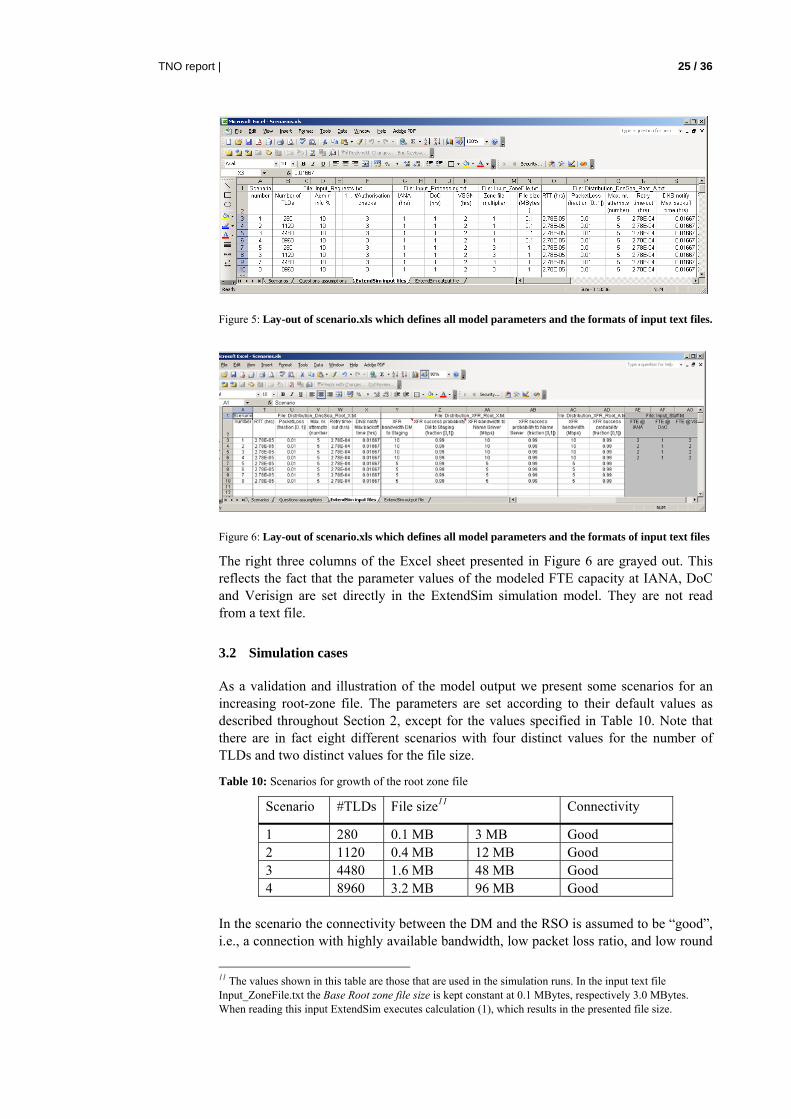
With the model we also provide an Excel workbook (see Figure 5 and Figure 6) which provides an overview of all the input parameters and it also defines in which input file contains which parameter. This Excel workbook is for the purpose of overview; it is not used by ExtendSim for reading input parameters (those are read from the text files).
In an input file each row presents a “run” which uses a particular parameter setting as Extend can run multiple scenarios subsequently from the same input files. In an input file a column is used for a single parameter, as each row entry of the column is used for another run.
Additionally, in Figures 5 and 6 the outline of the file “scenario.xls” is presented which also documents the scenarios. The actual information is read from the various input files mentioned above and not from “scenarios.xls”.
TNO report | 25 / 36
Figure 5: Lay-out of scenario.xls which defines all model parameters and the formats of input text files.
Figure 6: Lay-out of scenario.xls which defines all model parameters and the formats of input text files
The right three columns of the Excel sheet presented in Figure 6 are grayed out. This reflects the fact that the parameter values of the modeled FTE capacity at IANA, DoC and Verisign are set directly in the ExtendSim simulation model. They are not read from a text file.
3.2 Simulation cases
As a validation and illustration of the model output we present some scenarios for an increasing root-zone file. The parameters are set according to their default values as described throughout Section 2, except for the values specified in Table 10. Note that there are in fact eight different scenarios with four distinct values for the number of TLDs and two distinct values for the file size.
Table 10: Scenarios for growth of the root zone file
Scenario #TLDs File size11 Connectivity
1 280 0.1 MB 3 MB Good 2 1120 0.4 MB 12 MB Good 3 4480 1.6 MB 48 MB Good 4 8960 3.2 MB 96 MB Good
In the scenario the connectivity between the DM and the RSO is assumed to be “good”, i.e., a connection with highly available bandwidth, low packet loss ratio, and low round
11 The values shown in this table are those that are used in the simulation runs. In the input text file Input_ZoneFile.txt the Base Root zone file size is kept constant at 0.1 MBytes, respectively 3.0 MBytes. When reading this input ExtendSim executes calculation (1), which results in the presented file size.

TNO report | 26 / 36
trip time (RTT). For the modeling of the DNS notify and the SOA request/response, which are performed by UDP, we use the packet loss ratio and RTT. The XFR uses a TCP connection which provides for a reliable connection that performs retransmission in case of lost packets. The actual success rate of the XFR over the connection and its resulting goodput depends on many parameters, e.g. the TCP version, and cannot be easily determined. Therefore this is implemented in the model by a XFR success probability and a goodput during the transmission. For the numerical results we used the parameter settings for the good connection presented in Tables 7 and 8.
3.3 Numerical results
After running the model, ExtendSim writes the lead-time average and standard deviation per run to an output file. For the scenarios of Table 10 we plotted the output lead time values for delegation / name server change requests (not contact info changes) in the following figure. The blue curve presents the output for the scenario with a 0.1 Mbytes zone file. The vertical bars represent the statistical 90% confidence intervals.
Lead time vs. #TLDs
0.0
20.0
40.0
60.0
80.0
100.0
0 1 2 3 4 5
Scenario number
Lead
tim
e (h
ours
) Increase #TLD,from defaultcase
Increase #TLD,larger zone file
Figure 7: Lead-time for the different scenarios
The curves in Figure 7 match with the expectation, based on the applied model input parameters. In fact, in the scenarios 1 and 2 the offered workload is well below the capacity of all resources, so in those scenarios the average lead time can roughly be estimated by summing the processing times at the subsequent steps. This estimation for the main stream of delegation / name server change requests is as follows:
1. First, the IANA authorization check processing time is dominated by the response time by external authorizing parties. Further, we assumed that on average a change request would have to be authorized by two parties and that the longest authorization delay will take on average 24 hours.
2. Next, DoC handles the change request (partly in parallel with Verisign). Due to the assumed office hours the average holding time by DoC equals 16 hours (see explanation in table 4).
3. Then IANA and Verisign are assumed to get the change request into the root zone database within 2 hours on average.
4. Next we can estimate the time between updating the request in the zone file database and start of distribution towards the name servers. We assume that
TNO report | 27 / 36
the production of the zone file is independent of the provisioning process, and we know that the average time between production of two zone files amounts 12 hours. So the request waiting time in the zone file database is distributed according to a Uniform distribution between 0 and 12 hours: 6 hours on average.
5. Finally, the zone file will be distributed towards the name servers and the request is completed. Since we ran scenarios with good connectivity, the distribution typically takes far less than 1 hour. (see also right hand side of Figure 4).
So this brings us to an overall average lead time of 24+16+2+6+1 = 49 hours, for the light loaded scenarios 1 and 2. This corresponds to the simulation output, as can be seen in Figure 7.
Further, Figure 7 indicates that the overall lead time average starts to increase somewhere around scenario 3. What happens here is that the human resource at DoC starts to get loaded. In fact, in scenario 3 we assume to have 4480 TLDs that each generates one change request per year. And since we assumed that request handling by the single human resource at DoC takes 2 hours on average, we end up with an offered load of: 4480/365 * 2 ≈ 24 hours of workload per day. In other words, the single human resource would work around the clock. If the workload increases beyond this scenario we get into an overload situation where the lead time grows linear with the simulation run length. At least under these model and parameter assumptions made! We emphasize that the developed model is aimed at scenarios were some steady state or at least periodic behavior will be reached; not on permanent overload situations. The model results should not be used to draw conclusions from those scenarios. One reason behind this is that in those cases measures can, should and will be taken (e.g. more efficient checks, more staff, etc.) to prevent this overload situation. And those measures are not included in the model.
Remarks:
• The confidence intervals are rather wide. We emphasize that this is not due to simulation runs that are not long enough. They are the result from the fact that requests arriving during weekends will not be served until Monday mornings, due to the assumption of manual request handling steps during office hours. See also Table 4 and Figure 7.
• It may seem strange that the lead time becomes longer for a larger zone file size. However, the confidence intervals already indicate that the fact that the curve for the scenarios with the larger file size lay under that of the default file size is statistically not significant. Further, we conclude that with these parameter settings the portion of lead time that requests wait for distribution from the DM to the name server is small.
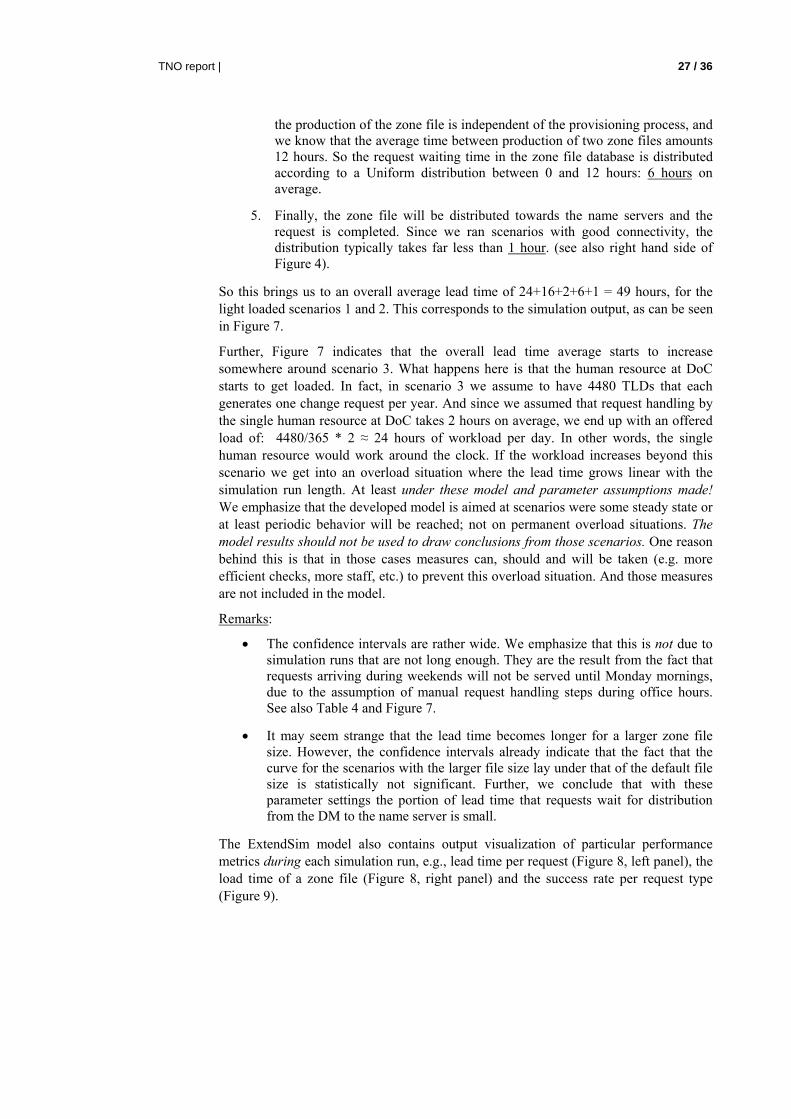
The ExtendSim model also contains output visualization of particular performance metrics during each simulation run, e.g., lead time per request (Figure 8, left panel), the load time of a zone file (Figure 8, right panel) and the success rate per request type (Figure 9).

TNO report | 28 / 36
Figure 8: Left: Lead times per request Right: Load time of a zone file
The blue, red and green curves in the left hand plot present the following output metrics over the simulation time:
• Blue: lead time of redelegation / name server change requests
• Red: lead time of contact info change requests
• Green: provisioning time (= lead time minus the zone file distribution part) of redelegation / name server change requests
As can be seen from the x-axis the plots are based on simulation runs with a simulation time of 2550 hours. The peakedness of the curves shows the lead time fluctuations over time. Of course, this is mainly due to the assumed office hours which make requests arriving on Friday afternoons wait for 60 hours or more. If those request also had to be authorized by three stakeholders and had to wait long before production of the zone file, the lead time can grow up to more than 100 hours. Further, note that there are far fewer data point for the red line, which is due to the fact that we assumed that only 10% of the change requests are contact info changes.
The blue and red curves in the right hand plot present results from a different scenario where we varied the input parameters of the connectivity for two RSOs:
• Blue: root zone file loading time between for RSO with good connectivity
• Red: root zone file loading time between for RSO with good connectivity
We emphasize once more that these cases and numerical results are only included for the purpose of illustration. Figure 9 shows an output histogram of the accumulated error probabilities for redelegation / name server change requests (in blue) and contact info change requests (in red). Compared to the near-zero error rate in practice these error rates are too large. Apparently our assumption of 1% error rate per manual action12 is too large.
12 Recall that the study team was not able to obtain any numbers of error rates in the operational process. Therefore, this 1% value was purely an assumption.
TNO report | 29 / 36
Figure 9: success rate per request type
Remarks:
• We experienced that some scenarios are not “stable” in ExtendSim. In particular, when the offered load of the TLD change requests exceeds the capacity of any of the resources. In that case many performance metrics will grow during the simulation time up to some point in the simulation, where the simulation seems to ‘fast-forward’ to the end of simulation time. Note that this does not really matter for overload cases, because the dynamic behavior is transient anyway: the results do not converge to some value. They keep growing unbounded if one increases the simulation run-time.
Extension of the model can include:
• More automated processes at IANA and Verisign, e.g. manual technical checks, which should be altered if the number of TLD change requests grows too large.
• A more sophisticated (TCP) model of the goodput of a connection as a function of the round-trip time (RTT), packet loss probability, size of the root-zone file, and the bandwidth of the connection.
• Time-varying conditions of a connection to a name server, i.e., a link is not good or bad throughout a single, but it alternates between the two states over time independently of the usage.
• Incremental zone transfer method (IXFR) instead of AXFR.

TNO report | 30 / 36
4 Summary and recommendation
The root zone of the Domain Name System (DNS) is on the verge of undergoing a number of changes, being:
• the introduction of DNS security (DNSSEC)
• the addition of “internationalized” top-level domain names (IDN TLDs)
• increasing Internet Protocol (IP) address length due to the use of IP version 6 (IPv6) and
• the addition of new generic TLDs.
These changes may affect the operational stability of the root zone. As input for decision making regarding these upcoming changes ICANN requested the Root Scalability Study Team (RSST) to investigate the potential scalability risks. During this study both qualitative and quantitative models of the root system were to be developed to show:
• the current management and operation of the root system,
• how the combination of changes are expected to change the circumstances in which the root system operates, and
• how the root system would behave under these changed circumstances.
This report describes the quantitative model and its software implementation that was developed as part of the results of the RSST. In combination with the broader results from the RSST the quantitative model will allow the community to anticipate on the consequences of combinations of changes to the root system; identify “early warning signs” of system stress; and plan ahead for the mitigations that may be necessary to keep the system running smoothly if and when those signs appear.
The quantitative model captures the current understanding of the operation of the root system. The validation tests with the ExtendSim implementation of this baseline model illustrate that the model predictions concerning lead times in the change request provisioning process and the zone file loading process are plausible:
• the order of magnitude of the model output (e.g. change request lead times) are within the range of values that are encountered in practice and
• the ‘breaking points’ are roughly around the input parameter values where they are expected to be.
This can not be said about the included error model. Due to the fact that sound data regarding error causes and probabilities in the provisioning and distribution process are lacking the resulting output does not match the current near zero-failure practice. However, the error model is adaptable, such that obtaining valid error predictions merely requires configuration of input parameters with error data from current practice.
TNO report | 31 / 36
Further, the modeling exercise itself has shown that there remain questions regarding several details of its current operation and that it was quite hard to find quantitative data as input for the model. For example, there was little information obtained to model the request handling by DoC. Also information and quantitative data concerning interaction between IANA, DoC and Verisign, especially in exception cases (e.g. an authorization check that turns out to be not OK) is hardly available. On the root zone file publication side the key, anticipated risk is to load a large zone file over a ‘bad link’, but there is no clear characterization of a ‘bad link’. Based on these observations the delivered model should be regarded as a baseline model.
In case the desire rises to give more accurate boundaries for the scalability of the root, then the model should be taken one step further. The actions needed to do so are:
• Collect (more accurate) quantitative data as model input. This action can typically be combined with the general recommendation to start monitoring the root system in order to get “early warning signs” of system stress.
• During model development we chose some scope regarding the purpose of the model. Once the community starts using the model specific feedback regarding the use of the model should be gathered.
• The model should be fine-tuned and validated more extensively using this collected quantitative data and the more specific intended use of the model.
• After this fine-tuning step the model can be applied to conduct a root scaling analysis in order to give more accurate boundaries for the scalability of the root.

TNO report | 32 / 36
Appendix A: References
[1] An Integrated Performance Modelling Approach for Distributed Applications and ICT Systems, B.M.M. Gijsen, R.D. van der Mei and J.L. van den Berg, proceedings of international conference of the Computer Measurement Group, December 2002, Reno.
[2] Root Scaling Study Terms of Reference, ICANN Board, May 5, 2009.
[3] Human error model adaption and validation for Savannah river side nonreactor facilities, R.E. Veil, H.C. Bernhardt, J.E. Held, L.M. Olsen, S.A. Eide, 1994.
www.osti.gov/bridge/servlets/purl/10102668-ndfaFm/webviewable/10102668.pdf
[4] Trait and state predictors of error detection accuracy in a simulated quality control task, K.L. Schell, A. Woodruff, G. B. Corbin and E.C. Melton, Available online 26 January 2005.
[5] Modeling TCP Throughput: A Simple model and its Empirical Validation, J. Padhye, V. Firoiu, D. Towsley, J. Kurose, ACM SIGCOMM, 1998.
[6] Scaling the Root - Report on the Impact on the DNS Root System of Increasing the Size and Volatility of the Root Zone, Jaap Akkerhuis, Lyman Chapin, Patrik Fältström, Glenn Kowack, Lars-Johan Liman, Bill Manning, September 2009.
TNO report | 33 / 36
Appendix B: Explanation of the error model
In any process several potential threats (or hazards) can be identified. Typical high-level process hazards are errors made in the process (either human or automated) or changes being made to the (provisioning or publication) process itself. Given the relatively short time scale of the root scalability study a quick hazard analysis was performed. The resulting hazard that is selected as most relevant is, that a TLD change that should not be made gets made in the name servers. In particular if that results in the undesired affect that a zone becomes “invisible". The error model described in the document is focused on this hazard.
For a zone to become “invisible” there has to be some error in the published zone file. In order to find out how this may occur we scanned the provisioning and publication process to identify the most relevant failure causes. These are:
1. A TLD change request with an error is submitted to IANA. In the context of this study we regard the correctness of the content of the change request as the responsibility of the change requestor. Besides, IANA performs several double checks with administrative and technical responsible persons, which will typically correct this kind of errors. The syntax of the change request is verified via the eIANA web interface. Therefore, this type of error is considered out of scope.
2. An error in the change request content is introduced in any of the provisioning process steps, that slips through the checks in the process. This can only occur in steps were the change request content may be mutated. It is assumed that there are no bugs in the automated process steps, which means that such errors can only be introduced in the manually performed steps. It is possible that an error introduced in the provisioning process is corrected by a (human) check later in the process.
3. Once the change request is processed it is updated in the DM database. This step may also introduce an error in the zone data.
4. Apart from changes coming into the DM database errors may be introduced in the zone file data during DM database administrative tasks. In particular, more frequent changes to the database may lead to more frequent administrative actions, which can increase the error rate.
5. Then, twice a day the zone file will be produced. Potentially this may also introduce errors in the zone file, such as missing records or an empty zone file.
6. Finally errors may occur during the publication of the zone file. However, although transmission errors may occur that may lead to (long) delays, it is assumed to be very unlikely that errors will be introduced into the content of the zone file. Also the possibility of loading the wrong zone file is very low. After the zone file gets produced the RSOs do not check the content of the zone file (because it is not their responsibility).

TNO report | 34 / 36
7. In the same context as the previous failure mode an overload of DNS queries may introduce error in the process of uploading the zone files. However, the processing time of a lookup is typically extremely fast. Most RSO name servers (several up to many servers per site) can do at least 15.000 lookups per second. Therefore, the processing of lookups on a name server is not expected to be a bottleneck. Further, if it were to become a bottleneck, then the solution of speeding up or adding another name server is at hand. As a consequence, this failure mode is also left out of scope.
In order to include these failure causes in the model we have to determine the relationship between those failure causes and (a) the process steps in which these failure causes may occur and (b) the model input parameters. In the section containing the flowcharts of modeled provisioning and publication process it was already indicated where such failures (including their probability) may be introduced. Therefore, it remains to specify the relation between the model input parameters and the failure probabilities. In the failure mode model we include two concepts:
a) the failure probability of a request increases if the number of human actions to process it increases
b) failure probabilities increase with the amount of workload for human resources.
From the descriptions of the process flowcharts it will be clear that the number of human steps in the process is not fixed. In particular, if the performed change request checks result in “Not OK”, then they result in some iterations between human resources. So the parameters specifying the “Not OK” outcome of checks indirectly influences the failure probabilities, because more human interactions imply higher failure probabilities.
Secondly, an increase in the number of TLDs may lead to higher name server sharing factor, which in turn increases the number of people involved in validation of change requests. In the model this can be reflected by increasing the parameter value that influences the number of iterations between IANA and the requestor. This may require more human interactions and it may make the verification process more complex, which may lead to higher failure probabilities in the provisioning process. This effect on the error probability is not explicitly included in the model (yet). Analyzing this effect would require to define several numerical simulation cases with distinct error probability input parameter values and running the model for those distinct values to see their impact.
Further, it is assumed that an increase in the number of change requests leads to higher workload for human resources, which may increase the failure rate of the manual checks. In the expertise field of human factors knowledge is available regarding quantitative human error modeling. Typically, human error models are used for air traffic control, car driving regulation and pharmacy. Examples of such quantitative data about human errors can be found in [3], [4]. Since no specific error data is available from IANA, DoC nor VeriSign, we base our model input parameters on this literature. This effect on the error probability is also not explicitly included in the model (yet). Again, analyzing this effect would require to define several numerical simulation cases with distinct error probability input parameter values and running the model for those distinct values to see their impact.
These failure causes and their relation with the model flowcharts and input parameters lead to a so-called “reward model”, that is an integral part of the root scalability model. The way it works is as follows.

TNO report | 35 / 36
• Each arriving TLD change request is assigned an attribute that represents the probability that its contents contains no error. Initially, the value of this attribute is set to 1.
• In each manually performed action the error attribute of the request is multiplied by the success probability (this is a model input parameter).
The purpose of this (human) error model is to estimate the quantitative relationship between the model input parameters and the resulting increase or decrease of error probabilities. In particular, it is not aimed assessing the (business) impact of errors, nor on detection or recovery actions for errors that get published in zone files.
Further, we will focus on the relative relationship of the model input parameters and the error rates; not on the prediction of absolute error rate values. This approach makes the error model is less sensitive to the availability and accuracy of data concerning errors in the current provisioning and publication process.

TNO report | 36 / 36
Appendix C: Screenshot of Extend simulation model
Figure 10: Main screen of the ExtendSim model