rosemarie g. edillon, phd undersecretary for policy … g. edillon, phd undersecretary for policy...
TRANSCRIPT

Rosemarie G. Edillon, PhD
UnderSecretary for Policy and Planning
National Economic and DevelopmentAuthority
The state of human capital in the Philippines
1

2

Table 10 .2 B a s i c E d u c a t i o n Ind ica tor s i n t h e Resu l t s M a t r i x of t h e U p d a t e d P h i l i p p i n e
D e v e l o p m e n t P l a n 2 0 1 1 - 2 0 1 6
BASEL INE ANNUAL PDP TARGETS ACCOMPLISHMENTINDICATORS
YEAR VALUE 2014 2015 20 1420 16 2015
Kindergarten 2 0 1 0
Net enrolment rateincreased (in%)
57.2 89.7 100.0 100.0
95.9 97.0 98.0 99.0
64.7 68.0 70.0 71.0
Adjusted net enrolment rateincreased ( n %)
98.5 99.0 99.0 99.0
92.5 95.0 97.0 99.0
Completion rateincreased (n%)
72.1 78.0 81.0 83.0
75.1 76.0 78.0 80.0
Cohort surv ival rate increased ( i n %)
74.2 79.0 81.0 83.0
79.4 81.0 83.0 85.0
Achievement rateincreased ( n%)
79.30 74.65
Elementary 2010 92.57 91.05
Secondary 2 0 1 0 63.23 68.15
Elementary2 0 1 0 93.01 91.84
Secondary 2010 86.19 82.24
Elementary 2010 83.04 83.43
Secondary 2 0 1 0 78.70 73.97
Elementary2 0 1 0 85.08 87.07
Secondary 2010 81.24 80.75
Elementary 2 0 1 0 6 8 . 2 7 3 . 0 75.0 77.0 69.1
Secondary 2 0 1 0 4 7 . 9 5 7 . 0 62.0 65.0 49.48
S o u r c e s : E M I S , D e p E d

NAT IONA L ECONOMIC A N D
5f f i ( } DEVELOPMENT AUTHORITY
Ta b l e 1 0 . 3 H i g h e r a n d Te c h n i c a l E d u c a t i o n I n d i c a t o r s i n t h e Res u l t s M a t r i x of t h e
U p d a t e d Ph i l i p p i n e D e v e l o p m e n t P l a n 2 0 11 - 2 0 1 6
BASEL INE ANNUAL PDP TARGETS ACCOMPLISHMENTINDICATORS
YEAR VALUE 2 0 1 4 2 0 1 5 2 0 1 6 2 0 1 4 2 0 1 5
2010 8 2 . 9 8 6 . 5 8 7 8 7 . 5 9 1 . 3 9 1 . 1
2010 1 , 3 4 4 , 3 7 1 1 ,464 ,000 1 , 6 1 0 , 5 1 0 1 , 7 7 1 , 5 6 0 1 , 7 8 5 , 6 7 9 2,129,758
2010 4 9 8 , 4 1 8 5 6 7 , 5 3 1 5 8 4 , 4 7 4 6 0 1 , 5 0 5 6 3 2 , 0 7 6 6 9 2 , 6 0 2
2010 3 8 . 8 7 5 5 6 0 6 5 4 0 . 8 1 4 0 . 3 4
2010 1 1 . 0 9 2 0 2 5 3 0 1 2 . 5 4 1 2 . 6 2
2010 1 9 . 8 9 2 4 2 5 2 6 2 5 . 3 8 2 6 . 6 3
2010 3 3 . 9 1 4 9 . 7 2 5 0 . 9 4 5 2 . 5 3 6 1 . 4 5 5 8 . 5 9
Certif ication rate in TVET
increased ( in %)
TVET graduates increased
Higher education graduates
increased
Proportion of HEIfacultywith MA increased ( i n %)
Proportion of HEIfaculty with PhD increased (in %)
HEls w i th accredited programs
increased ( in %)
National passing percentage (across disciplines) i n licensure exams increased ( in%)
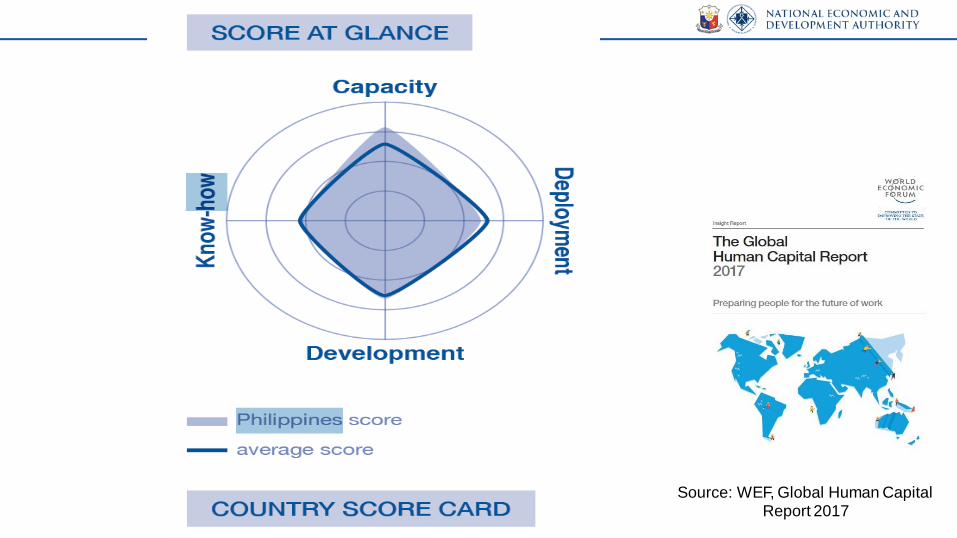
Source: WEF, Global Human Capital Report 2017

0-14 15-24 25-54 55-64 65+
% of popn 32.0 19.4 37.6 6.4 4.7
Capacity 78.8/19 V R V R V R V R V R
Literacy and numeracy 98.2 77 96.6 44 95.4 32 91.4 28
Primary ed attainment rate 99.5 56 98.3 52 97.1 51 94.9 43
Secondary ed attainment rate
85.0 41 75.9 54 56.8 53 41.5 45
Tertiary ed attainment rate 29.3 18 20.9 25 16.5 23
Deployment 60.6/87
LFPR 46.5 57 77.2 102 67.7 50 35.7 33
Employment gender gap 0.63 98 0.65 101 0.70 55 0.60 34
Unemployment rate 13.9 65 4.5 49 2.0 32 1.1 47
Underemployment rate 9.1 50 9.9 67 10.1 71 8.2 68
Source: WEF, Global Human Capital Report 2017

0-14 15-24 25-54 55-64 65+
% of popn 32.0 19.4 37.6 6.4 4.7
Deployment 65.7/60 V R V R V R V R V R
Primary enrolment rate 96.8 61
Quality of primary schools 3.9 70
Secondary ed enrolment rate 64.6 92
Secondary gender gap 1.0 1
Vocational ed gender gap
Tertiary ed enrolment rate 35.8 71
Skill diversity of graduates
Quality of educationsystem 4.3 41
Extent of staff training 4.6 29
Source: WEF, Global Human Capital Report 2017

0-14 15-24 25-54 55-64 65+
% of popn 32.0 19.4 37.6 6.4 4.7
Know-how 52.3/60 V R V R V R V R
High-skilled employment share
24.1 58
Medium-skilled employment share
68.4
Economic complexity 0.46
Availability of skilled
employees4.5
Source: WEF, Global Human Capital Report 2017

The Life We Want
9
Matatag
✓Family is together
✓Time with friends ü
Work-life balance ü
Strong sense of
community
Panatag
✓ Enough Resources for
day-to-day needs and
unexpected expenses✓ Peace and security
✓ Long and healthy life
✓ Comfortable retirement
Maginhawa✓ Free from hunger
and poverty
✓ Comfortable and
secure homes✓ Good transport
✓ Travel and vacation

10
From vision to action
Long-term Developmental Goals
By 2040, Philippines will be a• prosperous,
• predominantly middle-class society
• where no one is poor;Our peoples will
• live long and healthy lives,• be smart and innovative and
• live in a high-trust society
2017-2022
2023-2028
2029-2034
2035-2040
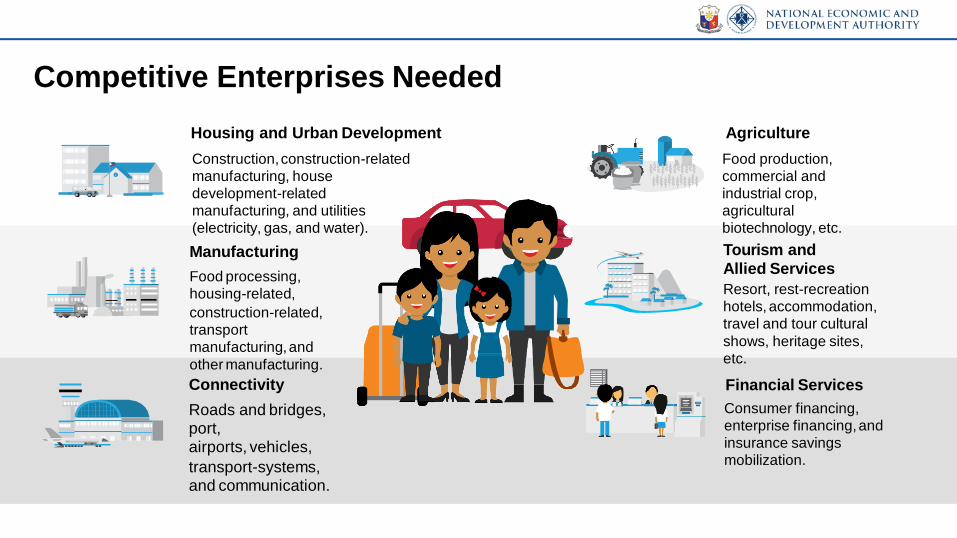
Housing and Urban Development
Construction,construction-related
manufacturing, house
development-related
manufacturing, and utilities
(electricity, gas, and water).
Manufacturing
Food processing,
housing-related,
construction-related,
transport
manufacturing,and
other manufacturing.
Connectivity
Roads and bridges, port,airports, vehicles,
transport-systems, and communication.
Agriculture
Food production,
commercial and
industrial crop,
agricultural
biotechnology, etc.
Tourism and
Allied Services
Resort, rest-recreation
hotels, accommodation,
travel and tour cultural
shows, heritage sites,
etc.
Financial Services
Consumer financing,
enterprise financing,and
insurance savings
mobilization.
Competitive Enterprises Needed

21st CENTURY SKILLS
Foundational Literaci
How students apply core skills to everyday tasks
abc 123
Literacy Numeracy Scienti?cliteracy
ICT Econ Cultural and literacy & fin lit civic literacy
esCompetencies
How students approach
complex challenges
Critical thinking/ Creativity problem-solving
Communication Collaboration
Character Qualities
How students approach their changing
environment
Curiosity Initiatvie Persistence/
grit
AdaptabilityLeadershipSocial andcultural
awareness
http://www.consultancy.uk/news/1734/wef-bcg-students-lack-skills-needed-
The Philippine
Development Plan
(PDP) 2017-2022 isthe first medium-
term plan that is
geared towards
AmBisyon Natin
2040
13
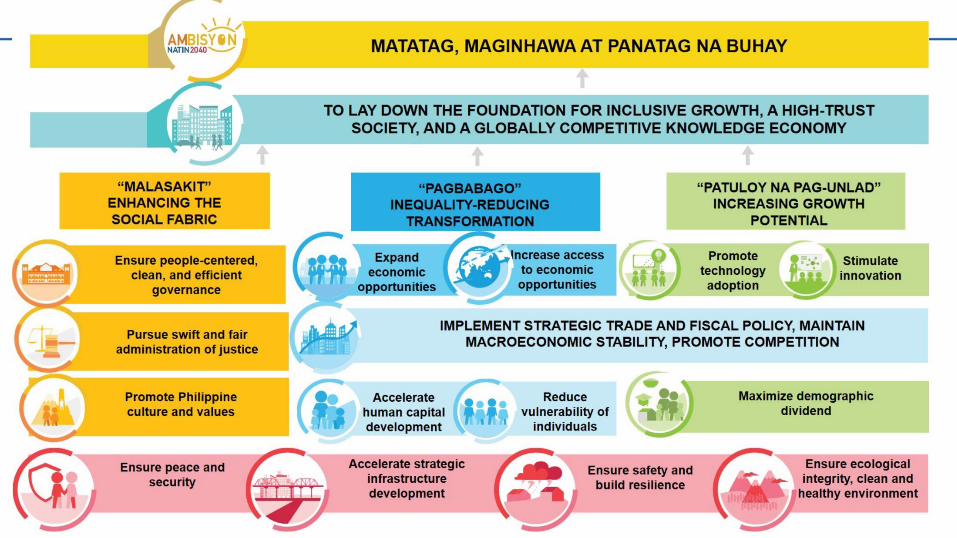
MATATAG, MAGINHAWA AT PANATAG NA BUHAY
"PAGBABAGO"
INEQUALITY-REDUCING TRANSFORMATION
TO LAY DOWN THE FOUNDATION FOR INCLUSIVE GROWTH, A HIGH-TRUST
SOCIETY,AND A GLOBALLY COMPETITIVE KNOWLEDGE ECONOMY
t"MALASAKIT''
ENHANCING THE
SOCIAL FABRIC
Promote Philippine culture and values
Ensure people-centered, clean,and efficient
governance
Pursue swift and fair administration of justice
Ensure peace and security
Expand
economico ortunities
ncrease access to economic opportunities
"PATULOY NA PAG-UNLAD"
INCREASING GROWTH
POTENTIAL
Promote technology adoption
Stimulate innovation
IMPLEMENTSTRATEGIC TRADEAND FISCAL POLICY,MAINTAIN
MACROECONOMICSTABILITY,PROMOTECOMPETITION
Accelerate human capital development
Reduce vulnerability of
individuals
Accelerate strategic infrastructure development
Ensure safetyand build resilience
Maximize demographicdividend
Ensure ecological integrity, clean and
healthy environment

Improved employability
Accelerate human capital development
Income-earning ability increased
Improved productivity
Encourage skills development and
retooling through continuing
education and training
Strengthen employment facilitation
services
Strengthen and expand internship,
apprenticeship and dual training
programs
Implement programs that encourage
women to participate in the labor
market
Strengthen
implementation of the
two-tiered wage system
Ensure safety and
health in the workplace
Nurture workplace harmony
Enhanced labor mobility and income security
Provide income support
and emergency
employment
Enhance the efficacy of
the minimum wage
policy
“Pagbabago”
Inequality-reducing transformation

Quality, accessible, relevant and liberating basic education for all achieved
Quality of higher and technical education and research improved for equity and global competitiveness improved
Strengthen early childhood care and development programs
Pursue full implementation of K to
12
Strengthen inclusion programs
Develop and improve interventions to keep children in school
Continue curricular reforms
Enhance teacher competencies
Enhance community-based training for special groups
Provide access to quality and
relevant, TVET opportunities
Ensure globally competitive
TVET programs
Expand access to higher education
Integrate 21st Century competencies
Promote creative arts
Strengthen QualityAssurance
Mechanisms
Improve research and
innovation, and extension
services
Expand Government-
Academe-Industry
collaboration
Promote excellenceamong
HEIs
“Pagbabago”
Inequality-reducing transformation
Accelerate human capital development
Lifelong learning opportunities for all ensured

T a b l e 10.5 P l a n Targe t s t o E n s u r e Li fe lon g L e a r n i n g O p p o r t u n i t i e s f o r Al l (C o r e
I n d i c a t o r s )
OF PL
Proportion of students at low mastery reduced f rom 14% to 10%
Junior High School 1 4.88
INDICATORS 2A BASELINE(20 15) END ANTARGET
Mean Years of School ing8.9
(2014) 11.3
Functional Literacy Rate• 90.3
(2013)
Net Enrolment Rate
Kindergarten 74.65 95.00
Elementary 91.05 95.00
Junior High School 68.15 75 .44
Completion Rate
Elementary 83 .43 90.00
Junior High School 73.97 78.48
Proportion of students performing at Mov ingtowards mastery,closely approximating
mastery and mastered increased 25
Elementary 63.93 74.39
Junior High School 14.37 20.00
10 .00

T a b l e 1 0 . 5 P l a n T a r g e t s t o E n s u r e L i f e l o n g L e a r n i n g O p p o r t u n i t i e s f o r A l l (C o r e
I n d i c a t o r s )
INDICATORS 2A BASELINE (2 015) ENDOFPLANTARGET
Percentage of students awardedscholarships,grants,and other f inancial assistance(% )
Percentage of tert iary graduates in science, engineering, manufacturing and
construction
Certif ication rate of TVET graduatesa
5 10
26 4 0
GDP
000
Percentage of ETEEAP graduates
Increased government expenditure for higher education research,development,and
innovation 0.
50
17% of GDP
60
0.5% of
Increased number of patents, l icenses,and royalties issued to HEls 2 3 1 500
Increased number of researchers and scientists 8 4 1 2,600
Number of curricula and programs developed I revised based on mult i-discipl ina lplatforms that foster 21st century competencies
Increasednumberof HElsengaged in loca l andglobalpartnershipsandcollaborations
7 2
4 4
100
100
Increased number o f graduate education graduates (MNPhD) engaged in original
research of creative work6,500 10,
Increased number of innovation hubs established within HEls 81 150
9 1 .3
(2016)

Ta b l e 1 0 . 6 P l a n Ta rg e t s t o I n c re a s e I n c o , n e E a r n i n g A b i l i t y ( C o r e I n d i c a t o r s ) )
y
INDICATORS BASELINE(2015) E N OF
Decreased percentage of adult NEET tbd
Decreased percentage of youth NEETa• {%) 22.7(2015) 15-18
Decreased duration of school - to-workb transition of college graduate 2 years (2008 ADB Household Surveyc)
6-9 months
Decreased duration of school -to-workb transition of high schoolgraduate 4 years (2008 ADB Household Surveyc)
9- 12 months
Decreased percentage of discouraged workers{%) 12.5 (2014) 10
Increased number of HE graduates engaged i n job collaboration 440,000 700,000
Percentage of female wi th advanced degrees employed (%) 12.7 20
Increased labor force participation rate of women (%) 49.3 51.3
Labor productivity inindustry sector increased (%) -4 .2 3.0-4.0
Labor productivity i n service sectorincreased (%) 3 . 1 4.0-5.0
Frequency rate of fatal and non-fatal occupational injuries decreased• 2.03
{2013)
Percentage of unemployed covered by unemployment insurance tbd
"Baseline and target are only for not i n educat ion and emp l o ymen t (NEE). T h e indicatorfor n o t i n educat ion,
employ m e n t and train ing (NEET) isfor development i n t h e L a b o r Force Survey.hW o r k isdefin ed as perman en t wagejo b .
c Based o n a n A D B Study: Bird . K . 2 0 1 2 . A r e Filipino Youth off to a Good Star t? Yo u t h Labor M a r k e t Exper ience
i n the Phi l ippines .ADB: Mani laNote: ( * ) are indicators based o n the S DGs

20
“We cannot always build the future for our
youth,but we can build our youth for the
future.”
Franklin D. Roosevelt
Address at University of PennsylvaniaSeptember 20, 1940
