rough surface heat transfer and pressure drop
TRANSCRIPT

^ h-• *
EIR-Bericht Nr 474
<r UJ
Eidg. Institut fur Reaktortorschung Wurenlingen
Schweiz
ROUGH SURFACE Heat Transfer and Pressure Drop
M Hudina
T Wurenlingen, August 1962

EIR-Bericht Nr.474
ROUGH SURFACE
Heat Transfer and Pressure Drop
M. Hudina
August 1982

- 1 -
SUMMARY
Heat transfer on rough surfaces has already been well investi
gated. For the use of these surfaces in thermal engineering,
the frictional characteristics are also important. The theore
tical study of the behaviour of surfaces can contribute to the
understanding of these phenomena. However, well-oriented ex
periments are the best way to investigate their performances.
These are reported under different categories, but a good re
view of the most recent state-of-the-art can still be given and
the influences of the different parameters discussed in detail.
For the determination of the thermal-hydraulic performances of
rough surfaces, the method of evaluation is particularly im
portant. In order to increase confidence in the results, a new
evaluation procedure was introduced. This procedure is based on
the transformation of simple channel experimental results to
equal boundary conditions, and on the suitable application and
confirmation of these transformed values in more complicated
flow channel geometries. Existing methods, applied to the re
sults obtained in an annular channel, do not fulfil all the
transformation requirements. Thus a new, more-complete trans
formation method, which uses the turbulent eddy diffusivity
model, was developed. To check the quality of this transfor
mation, within the scope of the new evaluation procedure, the
results of experimental investigation in annular channels and
in a bundle of hexagonal geometry were used together with the
predictions of benchmark calculations. The success of the new
method was confirmed by extensive comparisons, with the results
of different presently-acknowledged transformations being con
sidered as well. Based on these comparisons an assessment of

- 2 -
the individual transformations is given. Although other methods
also give useful results, the advantage of the new transfor
mation can be clearly recognised under particular conditions.
This is especially true if one considers the possibilities for
its further development.

- 3 -
WAERMEUEBERGANG UND DRUCKABFALL AN RAUHEN OBERFLAECHEN
ZUSAMMENFASSUNG
Der Wärmeübergang an rauhen Oberflächen ist bisher schon gut
untersucht worden; für die Anwendung in der Wärmetechnik sind
aber auch die strömungstechnischen Eigenschaften der rauhen
Oberflächen von Bedeutung. Obwohl auch das theoretische Studium
des Verhaltens der rauhen Oberflächen zum Verständnis der Vor
gänge beitragen kann, sind jedoch für die Untersuchung deren
Eigenschaften gezielte Versuche am besten geeignet. Diese Eigen
schaften wurden zwar auf verschiedene Weise dargestellt, es war
aber trotzdem möglich einen guten Ueberblick der bisherigen Er
gebnisse zu geben und dabei die Einflüsse der verschiedenen
charakteristischen Parameter detailliert zu beschreiben.
Die Auswertungsmethode ist für die Bestimmung der thermohydrau-
lischen Eigenschaften der rauhen Oberflächen besonders wichtig.
Um die Zuverlässigkeit der Resultate zu verbessern, ist ein
neues Auswertungsverfahren eingeführt worden. Die Grundlage da
für stellen die Umrechnung der experimentellen Resultate aus
den einfachen Strömungskanälen auf die gleichen Randbedingungen
und die entsprechende Verwendung bzw. die Bestätigung dieser um
gerechneten Werte in den anspruchvolleren Kanalgeometrien dar.
Die bisherigen Umrechnungen der experimentellen Resultate eines
Ringkanals entsprechen nicht allen gestellten Anforderungen,
deswegen war die Entwicklung einer neuen Umrechnungsmethode mit
der Verwendung des Modells des turbulenten Austausches notwendig.
Zur Prüfung dieser Umrechnung innerhalb des neuen Auswertungs
verfahrens wurden die Resultate experimenteller Untersuchungen
im Ringkanal und im Bündel hexagonaler Geometrie zusammen mit
den Voraussagen der Benchmark-Rechnungen verwendet. Der Erfolg

- 4 -
der neuen Umrechnung wurde durch umfangreiche Vergleiche be
stätigt. Dabei sind die Resultate verschiedener etablierter Um
rechnung smethoden berücksichtigt worden. Aufgrund dieser Ver
gleiche wurden die einzelnen Methoden bewertet. Obwohl auch
andere Methoden verwendbare Resultate liefern, werden jedoch
unter bestimmten Bedingungen die Vorteile der neuen Umrechnungs
methode deutlich, besonders weil die Methode noch weiter ent
wickelt werden kann.
I

- 5 -
CONTENTS
1. INTRODUCTION
2. ROUGH SURFACE CHARACTERISTICS
2.1 Forms of rough surfaces
2.1.1 Artifically roughened surfaces
2.2 Evaluation of rough surface performances
2.2.1 Investigation approach
2.2.2 Dimensional analysis
2.2.3 Experimental investigation
2.3 Rough surface performance
2.3.1 Integral values
2.3.2 Roughness functions
2.3.3 Relative values
2.3.4 Index of performance
2.4 Review of present knowledge
2.4.1 Short review of earlier investigations
2.4.2 Effect of dimensionless rib geometry parameters
2.4.3 Effect of roughness shape
2.4.4 Effect of Reynolds number
2.4.5 Effect of wall-to-bulk temperature ratio
2.4.6 Effect of Biot number and heat transfer
coefficient distribution
2.4.7 Effect of Prandtl and Mach number
2.4.8 Effect of experimental channel
2.4.9 Effect of roughness similarity parameters
2.4.10 Indirect effects of rough surface application
3. TRANSFORMATION OF EXPERIMENTAL RESULTS TO
EQUAL BOUNDARY CONDITIONS
3.1 Significance of transformation

- 6 -
3.2 General requirements for the transformation
methods
3.3 Review of the recent established methods for
Stanton number transformation in annuli
3.3.1 Friction factor transformation
3.3.2 Stanton number transformations
DEVELOPMENT OF A NEW TRANSFORMATION METHOD
4.1 Choice of a consistent approach for evaluating
the performances of rough surfaces
4.2 Principle of the new transformation method and
its application to the annular channel
4.3 Momentum and heat transfer equations for an
annulus
4.3.1 Basic equations
4.3.2 Eddy diffusivity concept
4.3.3 Shear stress and heat flux distributions
4.3.4 Radial velocity and temperature distributions
4.3.5 Friction factor and Stanton number calculation
APPLICATION OF THE NEW TRANSFORMATION IN ANNULAR
CHANNELS
5.1 Solution of the annular channel equations
5.1.1 Eddy diffusivity of momentum
5.1.2 Turbulent Prandtl number
5.1.3 Calculation procedures
5.2 Evaluation of the experimental results obtained
in annular channels
5.2.1 Results of previous evaluations
5.2.2 Application of the new transformation method

- 7 -
6. APPLICATION OF EVALUATED PERFORMANCES TO
GENERAL BUNDLE CONDITIONS
6.1 Direct method
6.2 Use of the roughness functions R and G
6.3 Application of new transformation in different
bundle geometries
7. COMPARISON AND ASSESSMENT OF DIFFERENT TRANSFORMATION
METHODS
7.1 Transformation methods considered in the
comparisons
7.2 Comparison of annular channel results trans
formed by different methods
7.2.1 Friction factors and Stanton numbers
7.2.2 Multipliers and indices of performance
7.2.3 Roughness functions R and G
7.3 Comparison of different predictions for
different bundle geometries
7.4 Assessment of the results of different
transformations
7.4.1 Simplified Hall and Hall-Kjellstrom trans
formation
7.4.2 Simplified Hall and Rapier transformation
7.4.3 Warburton-Pirie and Nathan-Pirie transfor
mation
7.4.4 Dalle Donne and Meyer transformation
7.4.5 New transformation

8 -
CHOICE OF ROUGHNESS FOR PRACTICAL APPLICATIONS
8.1 Thermal-hydraulic performance criteria
8.2 Technological criteria
8.3 Operational criteria
8.4 Assessment of the possibilities of rough
surface application
CONCLUSIONS
REFERENCES

- 9 -
APPENDIX: ROHAN EXPERIMENT
A.l PURPOSE OF THE ROHAN EXPERIMENT
A.2 EXPERIMENTAL CONDITIONS
A.2.1 General test conditions
A.2.2 Channel geometry
A.2.3 Rough surface characteristics
A.3 EXPERIMENTAL EQUIPMENT
A.3.1 Test rig
A.3.2 Measuring equipment
A.4 INVESTIGATION APPROACH
A.4.1 Method of testing
A.4.2 Measuring procedure
A.5 RESULTS
A.5.1 Evaluation of results
A.5.2 Presentation of results
A.5.3 Uncertainties in the results
NOMENCLATURE
SUBSCRIPTS
AKNOWLEDGMENTS

- 10 -
1. INTRODUCTION
Reduction of the temperature difference needed for convective
heat transfer between heated walls and the cooling fluid is
generally desired in thermal engineering. Assuming fixed fluid
and mass flow conditions/ this reduction can be achieved by in
creasing the heat transfer surface area or by improvement of
the heat transfer coefficient.
The augmentation of convective heat transfer reduces the size
of heat exchange surfaces, therefore making the exchangers more
compact and leading generally to a reduction of their costs.
One very useful method is the augmentation of turbulent heat
exchange by an artifical increase in the degree of turbulence
in the flow. The turbulence can be promoted over the entire
flow or in the wall-adjacent region of the channel only. The
latter can be achieved by artificial roughening of the heated
surface in the form of small protuberances or cavities normally
at right angles to the flow direction.
The improvement of heat transfer generally requires an increase
of pumping power. To assess the value of practical application
of rough surfaces, both heat transfer and pressure drop charac
teristics must therefore be known. Moreover, the additional
costs of roughening must also be considered in these evaluations.
Depending on the chosen roughening procedure the additional ex
penditure can substantially increase the heat exchanger costs.
Based on well-known roughening processes, an economical appli
cation of artificially roughened surfaces is in practice limited
to some special cases.
The core of a high-temperature gas-cooled reactor is a typical
case, where the conditions of an economical application are
fulfilled. In comparison with conventional heat exchangers,
the gas-cooled reactor core (particularly in the case of fast

- 11 -
breeder reactors) must be designed for much higher coolant tem
peratures and power densities. Using a gas, which is a relatively
poor coolant, the improvement of heat transfer is necessary in
order to keep temperatures in the fuel rods at an acceptable
level. The enlargement of heat transfer area cannot be allowed,
owing to the increases in neutron absorption and coolant pumping
power that would result. The promotion of local turbulence by
application of artificial roughness is therefore the most pro
mising type of convective heat transfer augmentation for gas-
cooled reactors.
The nucTear power station as a large energy production unit
should operate from economic reasons very close to its upper
load limit but, simultaneously, damage to fuel elements should
be avoided. With a consistent and reliable design procedure a
satisfactory safety maryin Car. be obtained, together with a
high thermal efficiency. In addition to the determination of
thermal-hydraulic performance, investigations are therefore
concentrated on the definition, preparation and approval of
reliable calculation methods.

- 12 -
2. ROUGH SURFACE CHARACTERISTICS
2.1 Forms of rough surfaces
Concerning their quality, the surfaces of flow channels can be
divided into hydraulically smooth and rough. A surface is
called hydraulically smooth if the influence of the existing
natural roughness on the pressure drop and heat transfer per
formances can be practically neglected. The definition of na
tural roughness is well known and is closely connected to the
determination of pressure drop in tubes, applied in practice
(Moody diagramm). In the same group (with the same definition
of roughness) can be inserted the rough surface obtained by
sand blasting, so-called sand roughness. This surface is a kind
of intermediate form between natural and artificial roughness.
If the channel walls are treated in order to obtain ribs over
the surface which are uniformly distributed and repeated in
the flow direction,the surface is defined as artificially
roughened. To achieve maximum effectiveness of these surfaces,
the rib height should exceed the laminar sublayer depth. On the
other hand it should be possible to clearly distinguish between
roughnesses and large ribs or other types of heat transfer sur
face extens on. As a decisive parameter, the relative flow
thickness i.e. the ratio between the characteristic flow thick
ness (distance from the wall to the zero-shear stress or
usually to the maximum velocity position) and the rib height
was introduced. There is of course no immediate change in the
behaviour of surfaces, but as an approximate limiting value
the ratio of 10:1 can be accepted.

- 13 -
2.1.1 Artificially roughened surfaces
Depending upon the distribution of ribs over a surface, the
artificial roughness can be divided into "two-" and "three-
dimensional" forms. The "twodimensional" form is characterised
by the ribs being continuous over the perimeter, in a transverse
or helical pattern. In the case of the "threedimensional" form,
the ribs are periodically interrupted. The properties of rough
surfaces reported here are mostly valid for all forms but apply
strictly only to "twodimensional" roughnesses.
To describe rib geometry, the following characterstic dimensions
are usually used:
- rib profile (shape)
- rib height - h
- pitch between the ribs - p
- width of the rib - w
Different profiles of ribs are presented in Fig. 1. Ribs with
rectangular profile are the most fully investigated ones. Round
or similar profile helical ribs are obtained by wire wrapping,
but sinusoidal or triangular forms are also often used for
helical ribs. Triangular and trapezoidal profiles were applied
recently to transverse ribs. Details of a profile and the
tolerances attainable in the manufacture of small ribs are
strongly dependent on the roughening process. Systematic de
viations from a well-defined profile can, on the other hand,
be appropriate in order to determine the effect of changes in
the profile. In contrast to the rib height and pitch with their
unique definitions, the rib width cannot always be easily de
termined. It is necessary to distinguish between the width at
the rib tip and at its root, and between geometrical mean
width and effective rib width. It is therefore often important
to carefully check this definition in order to ensure that the
performances of different investigations are feing compared
on the same basis.

- 14 -
h" .„VA\ Vs ^v77///y///////77^//yz7:
*77f//A777^////7Zr
777^0^/////////Z^777
777^7^7)^^^^^^
V, , / / / / / / / V
777 T/////,/////T////}/
T7T
FIG. 1: Some characteristic rib profiles of ar t i f i c i a l l y roughened surfaces

- 15 -
2.2 Evaluation of rough surface performances
2.2.1 Investigation approach
With regard to the practical use of rough surfaces different in
vestigations are possible. In this report the investigation of
friction loss and heat transfer behaviour of rough surfaces is
described.
The analytical solution of the differential equations of turbu
lent flow is not generally possible, even for simple forms of
channels. The reason is that important details of turbulence
are smallscale in character. To solve the eguations a numerical
procedure that calculates the values of variables at a high
number of discrete points in space is needed. In most cases this
requirement would stretch the storage capacity of any presently
existing computer.
For practical engineering purposes the consideration of time-
averaged effects, even when the main flow is unsteady, is nor
mally sufficient. Due to the process of time-averaging, stati
stical correlations involving fluctuating velocity and tempera
tures appear in the equations. The magnitudes of these terms
are not known and must be approximated with an appropriate "model
of turbulence". This treatment leads to a system of differential
equations with different empirical constants which can only be
determined experimentally.
In many cases the engineer has to consider only the simple mean
values for pressure drop and heat transfer coefficients (also
called "integral" values):
- friction factor and
- Stanton number (or Nusselt number)
The procedures for *he determination of these values can be
separated as follows:
- 16 -
- Solutions of zero order
From the mea&jred mean flow characteristics (velocity, pressure
drop) and Laermal conditions (heat flux, mean fluid tempera
ture) the f and St values can be calculated. This "integral"
procedure is normally used in experimental investigations
directed toward the practical use of results.
- Solutions of first order
Using the appropriate experimental technique the velocity and
temperature profiles over the channel cross-section can be
measured. Based on these results, satisfactory analytical
predictions can be found, at least in a limited flow range.
Integrating over the cross-section, the mean dimensionless
velocity and temperature are obtained and hence the f and St
values.
- Solutions of second order
With the introduction of a simple algebraic relationship for
turbulent viscosity (eddy diffusivity) and consideration of
the analogy between momentum and heat transfer, the velocity
and temperature distributions over the cross-section of simple
channels (axial symmetry) can be calculated. The values of
turbulent viscosity are supposed to be determined by velocity
and length scales of the mean motion, which have a limited
degree of universality and can only be determined by experi
ment. Further treatment is the same as that for the first
order solutions.
- Solutions of third order
This procedure is based upon a consideration of the differen
tial transport equations. Together with continuity, mean
momentum and energy equations, the approximated differential
transport equations of the turbulent quantities (kinematic
shear stress, turbulent kinetic energy and kinematic

- 17 -
dissipation of turbulent kinetic energy)are solved. Because
the solution procedure is very ccmplex, this method is less
important for practical use. However the results of the
method are more important from the theoretical standpoint and
can be used for the assessment of the quality of simple solu
tion procedures.
The choice of the appropriate investigation approach depends
generally upon how the results are to be applied. Normally the
experimental information, together with some theoretical assump
tions, are combined in order to obtain a satisfactory solution
of the problem. It is often impossible or inconvenient to per
form the needed heat transfer and fluid flow experiments under
operational conditions. These full-scale experiments are
commonly replaced by tests on models under similar thermo-
hydraulic conditions. The evaluation of measured information
is relatively simple in the case of smooth channel walls. For
rough surfaces, particularly in the case of variable surface
quality of channel walls (mixed rough and smooth surface) the
evaluation procedure is much more complicated.
Contemporary with the experimental investigation of different
rough surfaces in an annular channel geometry, suitable methods
for the evaluation of the measured results were studied and
compared. As a result of these investigations, a clear need
was seen for a consistent evaluation approach.
Furthermore, to simplify the comparison of the experimental
results of different investigators, the standardization of
evaluation methods is strongly recommended.
According to these considerations EIR has been working on the
improvement and development of suitable evaluation methods
since 1972. A basis for a consistent approach was drawn up and
published in 1974 /!/. Since that time, many attempts have been

- 18 -
initiated by EIR to achieve international agreement on the
choice of a standard, common evaluation method.
2.2 2 Dimensional analysis
Dimensional analysis is a very useful tool for logical planning
of experiments and for the choice of a suitable investigation
approach. It gives a general understanding of the problems and
a good basis for the correlation of the experimental results.
The method is particularly valuable where the mathematical
relations are unknown or complex, but the quantities controlling
the physical situation are assumed to be known. Then the logical
grouping of the factors in dimensionless groups will help when
interpreting the data.
Investigation is based on the assumption of the following gene
ral conditions:
1. Steady-state, fully-developed turbulent flow.
2. Simple channel geometry (two-dimensional problem).
3. The surface quality of the heated channel vails is restricted
to artificially roughened surfaces, while the unheated walls
are always hydraulically smooth.
4. The friction factor and the Stanton number are based on bulk
properties. The bulk-to-wall temperature ratio is taken as
sufficient to describe the thermal effect on properties.
5. The variables controlling the physical situation on the
walls (smooth and rough surfaces) are known.
6. The influence of channel geometry and roughness shape (pro
file) can be represented by the dimensionless functions F , c, I
and F ,. r,i

- 19 -
The variables which govern the friction factor and the Stanton
number values can be divided into three groups:
- The flow and thermodynamic conditions of the fluid in the channel
- The geometry of the channel
- The conditions on the channel walls
The first two groups represent well-known standard variables
for the smooth channel case. In the third group, the variables
for the definition of surface quality (smooth, natural roughness,
artificial roughness), are the most important.
Considering the macrostructure of the rough wall surface, the
local geometrical conditions change in the flow direction.
Overall heat transfer is governed by local convective transport
and conduction in the canning. In addition to the rib dimensions,
the local heat transfer coefficient, the thickness and the con
ductivity of the heated wall are also to be considered as
variables.
The complete set of quantities describing the physical situation
can be written in the following two equations:
f - f (Fc f, dn, u, uQ, p,v, Tw/Tb, Fr f, h, p, w) (21)
St = St (F st» dn, u, ug, p,v, c , k, Tw/Tb,
(22)
r,st c,i c
In dimensional analysis, the alternate algebraic method, called
the improved w-theorem /2/, is applied. The maximum number of
independent dimensionless groups, n , should equal the number of
physical factors (variables) minus the maximum number of

- 20 -
incompatible factors. Usually more than one set of incompatible
factors may be formed, but the maximum number cannot exceed the
number of dimensions required to describe the phenomena. All the
necessary dimensions must be included in the dimensionally in
compatible factors. In this particular analysis, the following
two sets were chosen:
d. , u, p - for the friction factor (three dimensions: n length, mass and time)
d. , p, v, c - for the Stan.on number (the fourth dimension h p is temperature)
Using the suggestion of Kunsaker and Rightmire /3/, the problem
was solved with a total of 9 dimensionless groups (n = 1 2 - 3 )
for the momentum transport, and 13 dimensionless groups
(n = 17 - 4) for the heat transfer. For convenience, these
may be rearranged, as desired, to obtain the usual, well-known
dimensionless groups. The other groups appearing in the analysis
can be seen to be peculiar to the investigate in of rough sur
face performance.
Finally one can write:
-w w4 f = f (FCf£f Re, Ma, W F^, h / V ^ , R) (2.3)
T h , St « St (F„ _. , Re, Pr, Ma, ="-, F , Bi, r-'- , c,bt ib r,&t nc a
h p-w W t. n A\
IT' h ' h' h> (2'4)
n

- 21 -
The results obtained by applying dimensional analysis are
limited by the validity and completeness of the assumptions,
made prior to the analysis. Suitable experiments form the only
safe basis for proving the correctness and adequacy of these
assumptions.
2.2.3 Experimental investigation
2.2.3.1 Tvpe_of.investigation
Depending on the purpose of an experimental investigation, it
can be defined as fundamental (basic) or applied research. The
mode of the investigation can be qualitative, quantitative or
comparative. As examples of the qualitative mode, two types of
investigation are well known: flow visualisation (research into
momentum transport) and mass transfer experiments (research in
to heat transfer based on the similarity of the two processes).
Qualitative investigations are very important for the funda
mental understanding and exploitation of phenomena. These in
vestigations are normally followed by quantitative ones, which
are normally of longer duration and require more sophisticated
experimental techniques. Therefore, the experiments are often
limited to certain basic conditions which are kept constant
during a series of systematic investigations. During the
assessment of the application of results, the lack of informa
tion under conditions of practical use is often recognised. In
this case additional comparative investigations become necessary.
To predict the pressure drop and temperature distribution in
the case of rough walls under different flow conditions, one
should investigate both the direct effect of different para
meters (as given in chapter 2.2.2) and also the indirect
influence of the application of the rough surfaces. Examples
of indirect influence research are investigations of local
pressure and temperature distributions near and under spacers,

- 22 -
at the point where roughness begins following a smooth channel
surface, or at other similar transitional zones (where velocity
and temperature profiles are developed or distorted).
2.2.3.2 Choice_of _ex£er injenta l_condi tions
To define suitable experimental conditions, the knowledge ob
tained from earlier experiments, together with dimensional
analysis, should be considered.
These conditions should be as simple as possible but must ful
fil the purpose and requirements of the investigation. It can
be assumed that some of the parameters known from experiments in
smooth channels ali,o have similar influences in rough channels.
With some additional theoretical considerations, experimental
conditions can be chosen which practically eliminate the in
fluence of certain parameters or at least allow them to be
neglected.
Negligible influence is defined as meaning that the possible error
made by a particular assumption is smaller than the achievable
accuracy of the measurement and/or evaluation procedure. Some
facts about the influences of different dimensionless para
meters are summarised in the following:
Mach number. For flow at Mach numbers lower than approximately
0.3 the influence of this number can be neglected (see /4/ or
/5/).
Prandtl number. The effect of Prandtl number is well known
from different basic investigations in tubes with smooth and
rough walls. A power function describes this effect very well.
The corresponding exponent is normally given by m = -2/3 /6/,
/7/ or m • -0.6. Considerably higher values can also be observed,
obtained experimentally /8/, /9/ and theoretically /10/. The

- 23 -
choice of the value of this exponent is not important for coolant
with Prandtl number close to 1. The same dependency as obtained
in tubes is also assumed to be valid for other simple channels.
Biot number and heat transfer coefficient distribution. The
effect of Biot number on the heat transfer performances of
rough surfaces is not well known. However, because of the re
quirement to know rough surface performances more accurately
some investigators have recently examined and made some esti
mation of this effect. As basic information the results found
in mass transfer experiments (infinite Biot number, /ll/) are
used, assuming the similarity between mass and heat transfer.
In these experiments the local heat transfer coefficient over
the ribs was determined. These data together with some additional
assumptions /12/, are used to obtain the numerical solution of
the heat conduction in the canning. The influence of the Biot
number can then be estimated, and the correction factors for
the overall mean heat transfer coefficient determined. These
corrections become important in the case of considerable devia
tion be .ween experimental and actual Biot numbers /13/. If
results obtained under similar experimental conditions are com
pared, particularly the results of the same experiment, the
effects of Biot number and heat transfer coefficient distri
bution can be neglected between tests /14/.
Canning thickness-to-rib-height ratio. Because of the important
changes in local heat transfer coefficient between and on the
rib surface, axial conduction in the canning can influence the
local temperature distribution and therefore the mean heat
transfer coefficient. The influence of this ratio can be
neglected for most practical purposes when t/e > 3 (more in
formation about the effect of t/e is given in /12/).
Wall-to-bulk temperature ratio. The influence of this ratio
has been extensively investigated. Normally a power function
- 24 -
of this ratio is used, or the properties are determined at a
corresponding "film" temperature. In the case of low T/T ratios,
smaller than approximately 1.25, and for coolants with Prandtl
number close to 1, the influence of this ratio is assumed to
be negligible. As an additional check, adiabatic friction factor
results should be compared with those of heated runs. This
assumption should be confirmed by these results.
2.2.3.3 ?hoice_of_exgerimental_channel
The purpose of an experiment is of decisive importance when
choosing the appropriate experimental channel. Three basic geo
metries of simple channels are normally considered: tube,
annulus and flat plates. The flow in these channels with smooth
walls has been well investigated. In particular the flows in
tubes and between flat plates (assuming wide enough plates to
be able to neglect the side wall boundary effect) are very
convenient for investigation, because of their symmetrical
flow structure ("one dimensional" problem). The annulus is the
simplest channel for studying asymmetrical flows and has been the
subject of many investigations. This is not only because it
provides an insight into the general flow problems of fully
developed turbulent shear flows, but also because of its en
gineering applications. Annular flow is recognised as important
for the design of heat exchangers and fuel burners, but its im
portance has been particularly increased due to the design re
quirements of nuclear engineering. In addition to the direct
applications of experimental results for annular forms of fuel
elements, the pressure drop and heat transfer performances of
different types of fuel pins can be usefully tested in annular
channels. Most of the recent experiments with rough surfaces
were carried out in this channel geometry. It should be mentioned
that the "one-dimensional" flows (tubes and parallel plates)
previously studied in detail are the limiting cases of annular
flow. All of these simple channels have their advantages and

- 25 -
disadvantages if the comparison is made in order to choose the
most convenient experimental channel for rough surface investi
gations.
Tubes
Advantages:
Disadvantages:
the simplest form of experimental channel
equal boundary conditions
simple and reliable evaluation of results
expensive to produce and measure dimensionally
consistent roughness inside the channel
for systematic investigation many different
test sections with different rib dimensions
are needed
not similar to most practical applications
(usual application is on the outside of tubes
or rods)
Flat plates
Advantages:
Disadvantages:
visualisation of phenomena can be carried out
relatively simply
particularly convenient for the application
of large model roughnesses
relatively simple combination of different
boundary conditions
eliminates the influence of curved walls
influence of side walls
heated experiments with well-defined conditions
are difficult to carry out
not similar to most practical applications
for particularly interesting cases a trans
formation of the results is needed

- 26 -
Annulus (outer smooth and inner rough walls)
Advantages:
Disadvantages:
- simple to change the channel hydraulic dia
meter (exchange of the outer, smooth tube) in
order to investigate different h/d. ratios n
- relatively simple production of ribs (roughe
ning of the rod surface)
- measurements of pressure drop at the outer
surface are not influenced by the rough
surface
- simplest form to investigate asymmetrical
flow
- change of inner wall boundary conditions is
relatively simple (change of rods!)
- simple insulation of the test section
- similarity with practical applications
(particularly the outermost channels of a
bundle)
- less investigated flow structure with
asymmetrical velocity, shear stress and tem
perature profiles (requiring relatively
sophisticated investigation)
- the results must be transformed to equal
boundary conditions
Based on the above characteristics of different channels, the
following conclusions concerning their suitable application can
be made:
- A tube is very convenient for fundamental and initial research.
The overall friction factor and Stanton number can be simply
determined. The first experiments with rough surfaces were
carried out using this geometry.

- 27 -
- Flat plates are very suitable for qualitative investigations
with large-scale model roughnesses. Systematic investigation
of the frictional behaviour of characteristic rib dimensions
and profile forms can be easily made.
- An annulus is particularly prefered if the performance of a
certain roughness is well known and can be used as a basis for
comparison. Systematic relative investigations, including the
optimisation of rough surfaces for practical application, can
be easily done in this channel form. However for the deter
mination of absolute thermal-hydraulic performances, suitable
evaluation procedures (transformation methods) must be
established.
2.2.3.4 £hoice_of_coolant
The most effective application of rough surfaces is with the
use of a poor coolant such as a gas. However, other fluids can
also be succesfully used during experimental investigations.
In initial experiments under adiabatic flow conditions, water
was usually chosen. Together with good visualisation possi
bilities, the accuracy of pressure drop measurements is in this
case very good.
For thermal investigations the use of a gas is more suitable.
The advantages obtained by reducing the influence of Prandtl
number are, on the other hand, offset by the influence of
biot and Mach numbers. It is more convenient in many cases to
use a different coolant for experiments than for engineering
applications. There is the possibility of neglecting the Mach
number effect, but the differences in Biot number can be large.
For practical applications helium and CO- are considered,being
gases with relatively high thermal capacity, whereas in the
majority of experiments air is used, being the simplest coolant.
For higher temperatures nitrogen is prefered because of possible

- 28 -
corrosion problems. For high temperature experiments CO. has
often been used but until recently helium has only rarely been
employed.
2.2.3.5 Choice_of_the_sha£ez_rou2hening_grocedure_an^
of_ribs
For fundamental research into rough surface behaviour the choice
of rib shape is not very important. The most often investigated
are ribs of rectangular profile. Using these performances as a
basis, comparative investigations can be carried out in order
to determine more suitable forms for practical applications.
Extensive studies of different roughening methods /15/ /16/
show that the rib profile depends considerably on the roughening
method. Important differences in the production cost can also
be found. Generally, the choice of a suitable roughening proce
dure is not possible without testing the relative performances
of the actual roughness forms attainable.
Considering thermal-hydraulic performances, one of the most
promising manufacturing methods is roughening by photo masking
on the rod surface followed by electrochemical etching (photo-
etching) . The roughening procedure is similar to the production
of printed circuits (for more details see /17/). Typical rib
profiles obtained by photo-etching are shown in Fig. 2. In
stead of a nominally rectangular profile (dotted line in Fig. 2)
an ill-defined trapezoidal rib profile is reached having the
roots and the tips rounded off. This method can be applied to
produce transverse or spiral ribs. To produce single-start spi
ral ribs, the photo masking procedure can be replaced by tape
covering. A tape-covered and etched surface has a rounding at
the rib roots and relatively sharp edges at the tips. The
favorable profile of photo-etched surfaces can be approximated
after a second (additional) etching operation, without the tape.

- 29 -
FIG. 2: Nominal (dotted l ine ) and actual r ib dimension of photo-etched r ibs
In Pig. 3 the typical rib profiles of tape-covered and etched surfaces are presented.
a) tape covered end etched ribs
b) tape covered and 2 times etched (second etching *ithcn,t tape) ribs
FIG, 3 ; Typical r ib p r o f i l e s of tape-covered and etched surfaces

- 30 -
For all etched surfaces a secondary roughness like a sand (na
tural) roughness was observed. Large deviations between actual
and nominal dimensions were observed for photo-etched ribs. Due
to the ill-defined shape, the definition of representative di
mensions was very difficult. Therefore, the nominal values are
normally given for photo-etched roughnesses (see Fig. 2).
In addition to the etching process, mechanical cutting and
electro-grinding procedures have also been applied. Roughening
by electro-grinding was developed in EIR laboratories /18/. This
method was found to be very suitable because of the low cutting
forces needed. The typical profiles obtained by mechanical
cutting and electro-grinding are presented in Fig. 4. The qua
lity of the macro-surface of the ribs is approximately the same
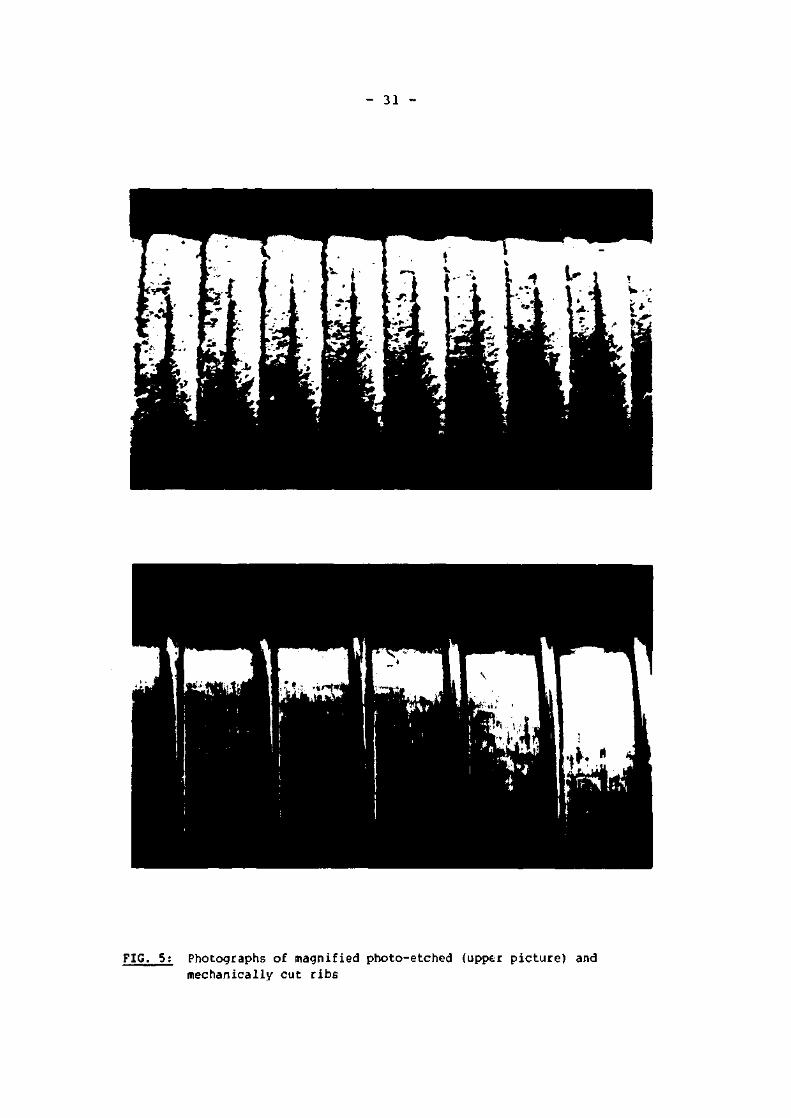
for both procedures. A good optical comparison of the rib sur
face between mechanically roughened and etched ribs is possible
from Fig. 5.
FIG. 4; Typical rectangular and trapezoidal profiles obtained by mechanical cutting and electro-grinding
- 31 -
FIG. 5; Photographs of magnified photo-etched (upper picture) and mechanically cut ribs

- 32 -
The dimensions of the ribs used in systematic investigations
differ considerably. Some limitation on dimensional parameters
can be given, considering on the one hand the definition of
artificially roughened surfaces and on the other hand experi
mental experience. The following ranges of the three most im
portant characteristic parameter ratios are suggested:
rib height-to-hydraulic 0.02 < h/dw < 0.05 diameter ratio — h -
free distance between the ribs 3 < En!* < 20
to rib height ratio — h —
width-to-height ratio 0.25 < w/h < 5
2.3 Different ways of presenting rough surface performance
In the technical literature different forms of presentation of
rough surface performances can be found. To assess the econo
mical aspect of any rough surface application, the pressure
drop due to friction must be considered together with the heat
transfer performances.
2.3.1 Integral values
For practical engineering solutions the integral values of the
friction factor and Stanton (Nusselt) number are the most con
venient forms:
2 d h A P it *\ f = T 2 ' AL (2'5)
pu
s t s Nu m Si (2.6) " Re«Pr AT'p a Cp K '

- 33 -
The results of experimental investigations can be given as a
function of Reynolds and Prandtl numbers
= Cf • Ff (Re) (2.7)
St = cst • Prm • Fgt (Re) (2.8)
and are valid for a certain roughness form, and geometry and
flow condition of experimental channel. Their direct use is
restricted to these particular conditions or else a significant
error in calculated performance must be expected. Therefore
different methods have been developed and tested to transform
these experimental values to the basic values (equal boundary
conditions) suitable for comparison and application under
different actual conditions. These transformed values can be
presented by equations similar to those of (2.7) and (2.8).
2.3.2 Roughness functions
A more suitable method of analysis of results obtained in
simple experimental channels which has good accuracy and wide
application is based on the use of the roughness functions
(called also similary parameters) of momentum (R) and heat (G)
transport.
The roughness function for momentum transport, R, was introduced
by Nikuradse /19/ and defined as an additive constant (for a
certain roughness form) in the "universal" logarithmic velocity
distribution equation. The heat transfer function, G, was de
fined by Dipprey and Sabersky /9/, based on the similarity law
between momentum and heat transfer, as a local wall Stanton
number. The definitions of these fundamental functions which

- 34 -
provide local boundary conditions to the flow field have been
reviewed by Lewis who also summarised their limitations /20/,
/21/. Although these functions were originally derived as boun
dary conditions for logarithmic profiles, they could be used in
conjunction with any suitable profile. Supposing they are
consistently used (i.e. according to definition) and assuming
that the functions are invariant with change of flow channel
geometry, the friction factors and Stanton numbers may be de
termined for any channel by solving the equations of core momen
tum and heat transport matched to these boundary values. The
parameters R and G do not generally have a real physical
meaning. If the velocity and temperature distributions are
approximated by the"universal" logarithmic law, the roughness
functions represent the hypothetical, mean axial values of di-
mensionless velocity and temperature at the rib height (the
local values at rib height changing in the axial flow direction).
Considering a particular channel geometry, the integration of
the logarithmic profiles over the channel cross-section leads
to the determination of the integral values (friction factor
and Stanton number) as follows:
8 (2.9) (R+Fc,u)2
St * (R+F ) (G+F J {2'10)
c,u c,T
The R and G functions include nearly all the dimensionless
groups found in dimensional analysis to be important for the
description of rough surface performance:
R = R (h+' \' h F*'R' *' ^ (2,11)

- 35 -
T - 6 (h . Pr, - , r . F , E. L-) (2.12)
b *o ^
The Reynolds number and the hydraulic diameter of the channel
are replaced here by the dimensionless rib height h (called
also local Reynolds number) and by the characteristic flow
thickness y . The properties of the heated wall (conduction)
are also not considered in equation (2.12).
In the transition region between turbulent and laminar flow (Re
4 lower than approx. 2*10 ), the values of R and G depend additionally upon the Reynolds number. The reason for this is a relatively high deviation of the velocity distribution from the analytical prediction of the "universal" logarithmic law.
In comparison with the integral values, the most important
advantage of roughness functions is their more general and
accurate application under different flow and channel geometry
conditions.
2.3.3 Relative values
To compare the performances of rough surfaces with each other
and with smooth surfaces, relative values are very convenient
for practical use. Normally the ratio is formed between the
integral transformed values of rough and smooth surfaces (f
and St transformed to equal boundary conditions), determined
for equal geometry, flow and thermal conditions:
*" » fr.</f..c <2-13'
Stx = St /St „ (2.14) r,c s,c

- 36 -
In the literature the values for smooth pipes are often used
for comparative purposes, but these relative values do not give
a representative relationship for the channel geometries used
in practice.
2.3.4 Index of performance
A special criterion has been developed to assess the thermohy-
draulic performances of rough surfaces. For a certain rough sur
face the relative friction factor (fx) is much higher than the
relative Stanton number (Stx). A comparison is made either of
thermal efficiency at equal pressure losses in the channel
(pumping power) or, more usually, of pressure losses at equal
thermal power. Based on this comparison a suitable quality
criterion the so-called "index of performance", was obtained /22/
to /24/, which includes the relative ratios fx and Stx:
I = AP /AP = Stx3/fx (2.15) P s r
The value of this index is higher than 1, which means that, for
equal thermal power in a channel, the use of rough surfaces in
stead of smooth ones brings a reduction of the required pumping
power.
2.4 Review of present knowledge
2.4.1 Short review of earlier investigations
A great number of investigation reports can be found in the
technical literature. The first dealing with the pressure losses
in naturally rough channels were started approximately 100 years
ago. The most important research work on pressure drop charac
teristics of rough surfaces was carried out by Nikuradse /19/.

- 37 -
Schlichting /25/ investigated different rib forms of artificially
roughened surfaces. Based on the analogy between momentum and
heat transport von Karman indicated in 1939 /26/ that heat trans
fer is also influenced by rough surfaces, but the first syste
matic investigation of both pressure drop and heat transfer on
rough surfaces was carried out by Nunner /8/.
In the earlier basic investigations, the tube was used as the
experimental channel. For detailed studies of the flow over the
rough surface flat plates were often applied later on. Most
of the experiments were carried out with "two dimensional" well-
defined roughness having rectangular rib profiles (normally
square ribs). Other profile forms were occasionally, but not
systematically, tested. In particular the influence of the rib
shape was seldom investigated.
Recently investigations have been concentrated on tne following
three problems:
- to find a suitable roughness shape for practical application
- to determine performance from laminar through transition up to
fully-developed turbulent flow
- to investigate the indirect effects of rough surface appli
cations
A short summary of the most important experiments is given in
Table 1.
An extensive review of experimental investigations up to 1963
was given by Bhattacharyya /47/. Kjeltstrom /40/ summarised the
data up to 1965. The most recent are reported by Markoczy /48/,
Meerwald /49/ and Baumann /50/.

- 38
Table 1: Summary of the mos: important earlier experimental investigations of r^jgh surfaces
Author
Nikuradse
Schlichting
Moebius
Nunner
Dipprey &
Sabersky
Gargaud &
Paumard
Sutherland
Novozshilov
Gowen &
Smith
Knudsen &
Katz
Kemeny &
Cyphers
Draycott &
Lawther
Malherbe
Burgoyne
Puhkov &
Vinogradov
Sheriff &
Gumley
Kaul 6 Kiss
Wilkie
Kjellstrom
Wilkie et al
Lawn 6 Hamlin
Dalle Donne & Meerwald
Feuerstein &
Rampf
White & White
Hanjalic" fc
Launder
Channel
form
tube
plates
tube
tube
tube
tube
tube
tube
tube
annulus
annulus
annulus
annulus
annulus
annulus
annulus
annulus
annulus
annulus
plates.
annulus
annulus
annulus
annulus
plates
coolant
water
water
water
air
water
co2
steam
water
air/water
water
water
air
air
air
air
air
air
air
air
air
air
air
air
co2
air
f
X
X
X
X
X
X
X
X
X
X
X
X
X
X
X
X
X
X
X
X
X
X
X
X
X
St
X
X
X
X
X
X
X
X
X
X
X
X
X
X
X
X
X
X
X
X
Re • 10~
0.5-1000
100.0- 325
6.0- 400
0.4- 100
10.0- 500
200.0-3500
90.0- 350
4.0- 55
11.0- 50
1.0- 70
4.0- 80
200.0- 500
5.0- 50
100.0- 300
200.0- 300
10.0- 200
40.0- 100
90.0-1000
100.0- 500
20.0- 200
71.0- 270
8.0- 200
20.0- 200
200.0-1000
18.0- 77
Profile form
sand roughness
different forms
rectangular
rectangular and
other
sand roughness
rectangular, round
and other
square
wire wrapped
sand roughness
rectangular
round
different forms
triangular
rectangular
different forms
wire wrapped
rectangular
square
rectangular arJ
other rectangular
rectangular
trapezoidal
triangular
rounded rectangular
rectangular
Ref.
19
25
27
8
9
28
6
29
30
31
3 2
33
34
35
36
37
38
39
40
41
42
43
44
45
46

- 39 -
Attempts were made to describe the theoretical background of
fluid flow and heat transfer over a rough surface and of the
connection between friction losses and heat transfer by Nunner
/8/, Dipprey and Sabersky /9/, Kolar /51/ and, recently, Kob2ar
/52/ and Lewis /53/. Theoretical studies are quite important for
a better understanding of the phenomena and for the correlation
of experimental results. Unfortunately the theories ara re
stricted by some available experimental data and are therefore
of limited validity. An accurate analytical calculation of the
thermohydraulic performance of arbitrarily rough surfaces is
still not possible.
In the following, recent awareness of the influences of the most
important parameters as well as some indirect effects of arti
ficially roughened surfaces are reviewed. The results of the
"KOHAN" experimental investigation /54/ (evaluated partially
by a simplified transformation procedure) are included in this
review.
2.4.2 Effects of dimensionless rib geometry parameters
The performance of rough surfaces is influenced by all of the p—w w
characteristic parameters of rib dimensions, h/d..,, ^r—, r-,
but the parameter representing relative height, h/d..., is the
most important one. This parameter, used very often in British
literature, is particularly suitable for a simple determination
of transformed friction factors and Stanton numbers at high
Reynolds numbers. A very good review of rectangular rib per
formance as a function of h/d. , was given by Wilkie /39/. In-n l -3
creasing this parameter, particularly at values of about 4*10 , increases the friction factor much more than the Stanton number.
-2 At higher h/d.. values of about 2.10 the reduced influence of
this parameter can be observed. Similar effects have been re
ported in the literature for other roughness shapes (triangular

- 40 -
/34/, /44/, other different shapes /22/, /29/, /27/ and the tra
pezoidal ribs of the "ROHAN" experiment, represented by Fig. 6
and Table 2).
,. 1 Six J
fx
w/h-0.5
h l w / h a 3 5
StxJ
Rod No 26
(ThslO
//- 7 P -fTJty
y
16-10
Rod No.
Simbols
3
&
4
O
11
A
13
S7
26
• 27
A
29
•
30
• "1 1
FIG. 6: Multipliers and index of performance as a function of relative roughness height

TABLE 2; Summary of important characteristics of some representative rough surfaces tested in "ROHAN" experiment /54/. For rib dimensions on the rods other than those given in this table, see Appendix to this report.
ROD NUMBER
RIB HEIGHT h im]
PITCH TO HEIGHT
WIDTH TO HEIGHT w / h
TYPICAL RIB PROFILE
ROUGHENING BY ETCHING
PHOTO-ETCHING
TRANSVERSAL RIBS
27
0,14
12.8
4.1
29
0.13
9.4
3.6
SPIRAL RIBS 8
STARTS
16
0.14
15,5
2.2
TAPE COVERING
SPIRAL SINGLE START RIBS
1 TIME ETCHED
25
0.15
11.9
3.5
^*V
2 TIMES ETCHED
22
0.16
11.6
2.6
23
0.15
12.4
3.1
MECHANICAL ROUGHENING
TRANSV.
RIBS
26
0.15
11.5
2.1
SPIRAL RIBS
8STARTS
15
0.15
13.6
2.4
SINGLE START
21
0.12
9.8
2.7
24
0.15
12.4
3.5
ELECTRO
GRINDING
TRANSVERSAL
RIBS
19
0.16
11.5
2.6
20
0.15
12.7
3.1
-> V-

- 42 -
The effect of the *-jp ratio has also been well investigated. In
earlier studies the parameter p/h was used in the presentation
of experimental results (this form was acceptable when conside
ring small and constant w/h ratios). For w/h < 1 and p/h > 5
the influence of the rib width can be neglected. The importance
of the combined rib width and pitch effect was recognised by
Wilkie /39/ and particularly by Kjellstrom /40/, who also intro-
duced the parameter ^r— instead of p/h. Experimental results
show that, depending upon the roughness shape, different optimum p—w ratios of s-r— can be found. This optimum varies between 6 and 9, n
tending to the lower limit for low w/h and rectangular roughness,
and for w/h £ 3 and trapezoidal rib profile, to the higher limit.
This influence can be seen in Fig. 7. A clear qualitative demon
stration can be obtained by visualisation of the flow /55/.
12 * 20
FIG. It Effect of relative rib distance at constant ratio of relative rib height (h/d. , - 10-2)
ni

- 43 -
There are only a few investigations of the effect of relative
rib width. Wilkie found that by increasing the w/h ratio between
0.5 and 4 a considerable reduction in pressure drop occurred /39/,
but he did not investigate the influence on the heat transfer
performance. The first systematic investigation of both pressure
drop and heat transfer was carried out in the "ROHAN" experiment.
From Fig. 8 the importance of the w/h ratio is evident.
CIS 2 - » w / h 3 RATIO p/h f x , I p / S f x
10 •/o
A
12.5 A/6
19 » / *
FIG. 8: Effect of rib width-to-height ratio at constant ratio of relative rib height (h/dv, = 10
-2) ni
Significant performance improvement can be observed if the value
of this parameter increases from 0.5 to 2.5. Further performance
increase with w/h is still evident, but becoming slower, and
for w/h higher than about 4 no further change in performance

- 44 -
can be observed. The effect of this parameter for rectangular
ribs was recently investigated by Dalle Donne /56/. The impor
tance of the ratio was confirmed, but a clear quantitative de
termination of the effect is not possible from these data. The
investigation seems to be not systematic enough and the scatter
of results too large. Based on present knowledge about the
effects of w/h, the reduction of pressure drop can be explained
by the favourable influence of wide ribs on the level of turbu
lence intensivity.
The reduction in heat transfer capability is somewhat smaller
because of the better conditions for local conduction of heat
in the ribs /14/. It should be mentioned that in general the
effect of rib width also depends upon the shape of the rib pro
file. Performance was higher at lower values of the multipliers.
2.4.3 Effect of roughness shape
For artificially roughened surfaces the nominal shape of the
rib profile is usually very well defined. The rib profiles ob
tained by practical roughening procedures depend considerably
upon the roughening method and also on the characteristic rib
dimensions.
The rectangular rib profile is the most extensively investigated
and is therefore normally taken as the basic shape. Other shapes
have been studied fairly infrequently and not systematically.
For a long time it was therefore not possible to determine the
influence of rib profile. The first important results in this
area were reported by Kjellstrom /40/. With a small modification
of a rectangular profile Wilkie also began with a study of the
influence of shape /52/. These investigations were carried out
with more success by W. White and L. White /45/, but a clear
general conclusion was still not possible. The results were
partially better and partially worse than for a well-defined

- 45 -
rectangular profile. With improved experimental equipment (more
accurate measurements of the rod wall temperatures together with
indirectly heated rods) and relative evaluation of the results,
these investigations were continued in the "ROHAN" experiment.
Different roughening methods (see /54/) were used to produce
small ribs for practical application in GCFR. The ribs produced
by photo-etching, characterised by an additional secondary
roughness similar to sand roughness, show better performance
than was found for the regular rectangular profile. Further
results with very similar rib profile but without secondary
roughness confirmed the assumption that the performance im
provement is also influenced by the favourable effect of secon
dary roughness /58/. This conclusion was also confirmed by the
theoretical investigation of Lewis /59/. Trapezoidal ribs
without secondary roughness also perform better than rectangular
ones. This is due to the lower frictional losses, with Stanton
number remaining approximately constant. The comparison of re
sults for different rib profiles is possible from Fig. 9 where
the performance (multipliers and performance index) of various
profiles are presented, measured under equal experimental con
ditions (see /54/, /58/, /60/ and /61/).
Two different types of ribs are commonly used on the surface of
rods, transversal and spiral (or helical). Results obtained
with relatively high ribs of helical single- and multistart
pattern show that this form is particularly convenient for use
in rod bundles because of the occurrence of. relatively high cross-
velocity between the subchannels /62/. Favourable performance
of rectangular ribs in a helical arrangement has also been found
in other different gas cooling investigations in Great Britain
/63/ to /65/. The results of relatively small single- and
multistart helical ribs of trapezoidal profile under the conditions
of a "ROHAN" experiment, have not confirmed these findings. The
cross-flow velocities in a single rod channel could not be
measured /66/ and the performance obtained was not measurably

- 46 -
Rod No. 19/20
• / *
22/23 • /o
24/21
• /o 26/25 • 10
27/29
A / A
FIG. 9; Effect of different rib profiles on the thermohydraulic performances at approximately equal ratios of w/h and (p-w)/h
improved. Both friction factor and Stanton number were considerably
reduced, causing a decrease in the index of performance. The
final decision between transversal and helical ribbing is still
not possible. Additional relative evaluations and comparisons of
results are still required /67/.
Recently, the so-cailad "three-dimensional roughness" /68/ was
investigated giving approximately equal /69/ or improved perfor
mance /68/, /70/, /71/, along with greatly increased friction
factors. It should be noted that, for the performance calcula
tions made at KfK, Karlsruhe, multipliers based on smooth-tube

- 47 -
values are used. With the exception of tube experiments, this
leads to an overestimation of the performance index. Considering
the available inconsistent results from these surfaces further
information is needed before they can be included in an overall
comparison of different basic roughness shapes.
Based on present knowledge, it can be concluded that it is still
not possible to determine an optimum roughness shape for every
practical situation.
2.4.4 Effect of Reynolds number
4 For turbulent Reynolds numbers greater than 8.10 , the friction
factors and Stanton numbers for simple "rough" channels can be
represented by power functions similar to those use3 for smooth
surfaces. These equations are only valid for a defined roughness
and channel geometry. The absolute values of the exponents in
these functions are normally smaller than for smooth channels
and the slope can also be positive /39/. This forr of presen
tation is nowadays almost abandonned, mainly due t) increased
interest in rough surface behaviour in the low turbulent (tran
sition) region. In the "ROHAN" experiment a strong effect of
Reynolds number was found when Re was lower than approximately 4
2.10 /72/. This effect is not only reflected in the structure
of the flow and temperature fields (as in the case of smooth
surfaces) but also in the integral values, i.e. friction factors
and Stanton numbers. Depending on the roughness shape and geo
metry parameters, rough surfaces behave as if they were smooth
3 3 if Re is between approx. 4.10 and 6.10 . Recently other investigators have carried out extensive investigations of rectangular roughness, down to the laminar flow region /73/.

- 48 -
2.4.5 Effect of wall-to-bulk temperature ratio
In most cases experiments have been carried out at relatively
low T/T. ratios (lower than 1.25). For practical applications
the influence of this temperature ratio could be important for
values of the ratio higher than 1.25. The effect of T/T. is
different for different gases depending on the change with tem
perature of their properties (viscosity, conductivity and spe
cific heat). Usually the power functions are used to correct the
results depending on the T/T. ratio. For friction factors, the
exponent of the power function can be easily determined (based
on adiabatic run results). It is more difficult in the case of
Stanton number because of the poor accuracy of measurements
carried out at very low values of T /T. . This is demonstrated W D
in /71/ (particularly in Fig. 12 and 25) where the results of
experiments with different gases are analysed. Often the simple
assumption is made that for rough surfaces the same exponent as
for the smooth ones can be taken.
In the case of smooth surfaces the most important effect of
T /T. was found for helium, but similar behaviour was also de-w b
monstrated with air and nitrogen /75/, /75/. The effect is very low
for C0_, which can be explained by C0_ having quite different
properties in comparison with other gases /77/. These differences
are suprising. Considering the very similar temperature dependency
of density and viscosity for all of these gases, a practically
identical effect of T/T. ratio was expected /78/.
Gentry /79/ found that using rough surfaces the influence of
T/T. changes. The most recent investigations have confirmed this.
For rough surfaces the effect is even stronger than for smooth
ones /74/. The highest exponents are for helium (n. = -.0.28,
nn. » -0.37), with considerably lower values for air and nitrogen st
(n, • -0.13, n_. • -0.2). For C02 the exponents were found to be
moderate for friction factor (nf « -0.2) but the lowest for
Stanton number (ng. - -0.15).

- 49 -
2.4.6 Effect of Biot number and heat transfer coefficient
distribution
The effects of Biot number and heat transfer coefficient distri
bution are still not fully investigated. Based on different ex
perimental results obtained under equal flow and heat transfer
conditions, but with different wall thicknesses, materials and
heating methods it was assumed that the influence of conduction
in the wall was important. Kattchee and Mackewicz /ll/ investi
gated the local heat transfer coefficient between ribs and on
the rib surfaces. Their results were later confirmed by similar
experiments based on the mass transfer analogy /39/, /80/.
Mantle, Freeman and Watts /12/ explained the influence of con
duction in the wall on the heat transfer coefficient and were
the first to suggest a method for Stanton number correction.
Barnett /13/ included in his work in addition the influence of
wall thickness and of heating method. The aim of these investi
gations was mainly to determine the maximum wall temperatures.
For practical engineering calculations the effect of rough sur
face on the mean heat transfer coefficient is more important.
Consequently a new method was developed at EIR /14/. Results
of calculation using this method for experimental and reactor
conditions are only really valid for trapezoidal ribs with given
thermal-hydraulic performances but have also been used as an
approximation for other similar roughnesses. Further investigations
are therefore needed to find out the influence of roughness
shape. The assumption that the distribution of local heat trans
fer coefficient is independent of Biot number was not adequately
confirmed /81/, so further well-directed experiments are needed
to clarify this point.
2.4.7 Effect of Prandtl and Mach number
The effects of Prandtl and Mach number have already been dis
cussed in Chapter 2.2.3.2 of this report. It is assumed that

- 50 -
the same power function exponent can be used for smooth and rough
surfaces. The Prandtl number is a very weak function of the thermo
dynamic state and can be assumed constant over the channel cross-
section.
The very complicated consideration of Mach number is normally
neglected by keeping this number below a value of 0.3.
2.4.8 Effect of experimental channel
Experimental results are influenced by the geometry and relative
dimensions of the channel used. The parameter h/dhl which is
used to define channel similarity according to the hydraulic
diameter concept is not adequate when considering channel geo
metry. The boundary conditions on the channel walls change in
different experimental configurations and the results must be
transformed to uniform boundary conditions in order to ensure
their wider applicability.
Different transformation methods have been developed and tested,
giving considerable scatter of the transformed results. The
description of these methods, their importance for general appli
cation of results and the requirements of the methods will be
given in Chapter 3.
2.4.9 Effect of roughness similarity parameters
The similarity parameters R and G give the most suitable method
for the determination of rough surface performance. The evalua
tion of the thermohydraulic performances of rough surfaces at
EIR is based on the well-known roughness functions. Many in
vestigators have assumed that these functions are invariant
with change in the channel geometry and core flow conditions.
Using the usual transformation methods this assumption was not

- 51 -
convincingly confirmed. Moreover, the results of the "ROHAN" ex
periment, and also the late-»- experimental results of other
authors /82/, show a considerable scatter of results obtained
with different geometries and flow conditions. These discrepancies
can be partially explained by the great sensitivity of the R and
G values to the accuracy of test measurements, but can also be
assumed to be due to the influences of the flow thickness y and J o
wall curvature. Baumann and Rehme /82/ carried out an extensive
study of experimental friction results for rectangular ribs. They
introduced an additional explicit parameter h/y for the cor
relation of the R function. Due to the connection between the
roughness functions (similarity law)it can be assumed that this
parameter has an important effect on the determination of the G
function. The influence of the relative flow thickness y /h on o
the R and G functions was earlier observed in the "ROHAN" ex
periment for other different roughness shapes.
To determine the roughness functions R and G three different
methods are generally possible:
- Measurement of dimensionless velocity and temperature profiles
over the channel cross-section, followed by determination of
the dependence of these profiles on the channel geometry and
surface quality of the channel walls.
- The transformation of the integral values f and St to equal
boundary conditions by an appropriate method, followed by
consideration of the relationship between the analytical
predictions of velocity and temperature profiles and these
transformed values.
- Analytical prediction based on theoretical assumptions together
with some experimental data.
The measured profiles of dimensionless velocity and temperature
both change with axial position between the ribs. However, the
- 52 -
accuracy of these measurements close to the channel walls is low.
The suggestion has not been generally adopted, that, instead of
R and G, the dimensionless values at a particular distance from
the wall (a few rib heights) should be used as a base for the
start of the dimensionless profiles. The roughness functions have
no precise physical meaning and are usually described by the
extension of the "universal" logarithmic profiles in the form
u+ = 2.5 In (yQ7h+) + R (2.16)
T+ = 2.5 • Prt In (y+/h+) + G (2.17)
to the rib tips, matching the profiles either with the measured
velocities and temperatures or with the transformed values of
friction factor and Stanton number. This method was recently
applied for the determination of the R values of rectangular
ribs /83/, /84/.
In Fig. 10 this method is demonstrated for the roughness of a
trapezoidal rib profile. To determine the values of R and G,
the shape of the logarithmic profile and the "origin" of the
profile (y = o) must be correctly chosen. In Fig. 11 the in
fluence of the "origin" is shown using the velocity measure
ments with trapezoidal ribs from this experiment. For the slope
the "universal" value of 2.5 was taken. This was found to be
convenient to represent the measured velocity distribution 4
for the region near the wall at Re > 2.10 (deviation can be
observed in the core flow, wake region, see Fig. 10). From the
physical standpoint the dimensionless values of velocity and
temperature must be zero at a point between the tips and roots
of the ribs, depending upon the axial distance between the ribs.
This observation does not help to determine the "origin", be
cause of the fact that the values obtained by extrapolating the
logarithmic profile have no physical significance (they become

- 53 -
R-5.7
h* •15,5
FIG. 10; Determination of roughness function R from the velocity profile measured in an annulus (dj/d2 = 0.484, Rt = 1.03*10
4, trapezoidal ribs, w/h = 2.5, (p-w)/h = 12.5) considering universal logarithmic velocity profile in inner subchannel.
13
10
R»5.9
h* ' 285
I I i — r — r -
r • r, - h
r * r1 * h
O
O
O
30 102 103 5 103
FIG. 11; Dimensionless velocity profiles considering different origins (y • 0) of logarithmic profile in inner subchannel of annulus <d /& - 0.47, Re « 9.5'104, trapezoidal ribs, w/h - 3.3, (p-w)/h - 9.4T.
- 54 -
negative at very small values of y (< 1)!).
Suggestions from different authors of where to place the origin
/42/ and /84/ to /89/, have varied widely between the rib tips
to a number of rib heights within the wall (under the surface).
These suggestions were based on velocity measurements in diffe
rent experiments. A universal solution of the "origin" problem
is not yet possible but a dependence of the "origin" upon the
characteristic dimensions of the ribs (particularly *-r—) is
evident. Two definitions are often used in the literature. The
first, after Nikuradse /19/, is based on the volumetric mean
coordinate (German works), and the second defines y = o at the
roots of ribs. It is evident from Fig. 11 that for a given rough
ness shape and size, under defined flow conditions, the use of
A = 2.5 together with y = o at the rib roots is the best choice.
For the determination of the roughness functions from the trans
formed integral values the following well-known expressions can
be considered:
-+ u = /8/fj = A In (y*/h+) + R - K Q (2.18)
£i - x 8 • S^
R + — ^ (2.19)
Where K is the constant obtained by the integration of the
logarithmic profile over the flow thickness:
1.5 - 0.5 y /y

- 55 -
Instead of using equation (2.19) a direct determination of the
G value is possible from integration of the logarithmic profile:
T + = g^X-gT » A • Prt • In (y*/h+) + G - KQ • Prt (2.21)
Depending on th*» chosen "origin" and slope of the logarithmic
profile, the scatter of the calculated values is considerable.
The analytical method of determining R and G has very rarely
been used. Comparison between measured results and analytical
prediction /90/, /91/, can give considerable understanding of
the phenomena. Based on these comparisons better oriented ex
periments can then be planned. The most important general bene
fit from analytical predictions is their application towards
improved correlation of experimental results. Very promising
is the method developed by Lewis /53/, which can be used for
both R and G predictions. Based on further studies combined
with more accurate experimental information than is available
today, this method could be improved to fulfil the requirements
of practical engineering solutions. The method would then pro
vide approximate, but very useful, estimations of performances
for different rough surfaces. The application of the method for
relative evaluations has already been successfully demonstrated
/59/.
The roughness functions are relatively well-known for sand rough
ness and ribs of rectangular profile. The values for sand rough
ness have also been determined for small dimensionless roughness
heights /9/, /19/, but for other roughness forms this region
has very rarely been investigated (the use of artificially
roughened surfaces with low h is not of practical interest).
Low dimensionless roughness heights can be obtained by a
corresponding reduction in rib height or by measurement of rough
surfaces down to very low turbulent Reynolds numbers (transi
tion region). At low Re a relatively high accuracy of measure-
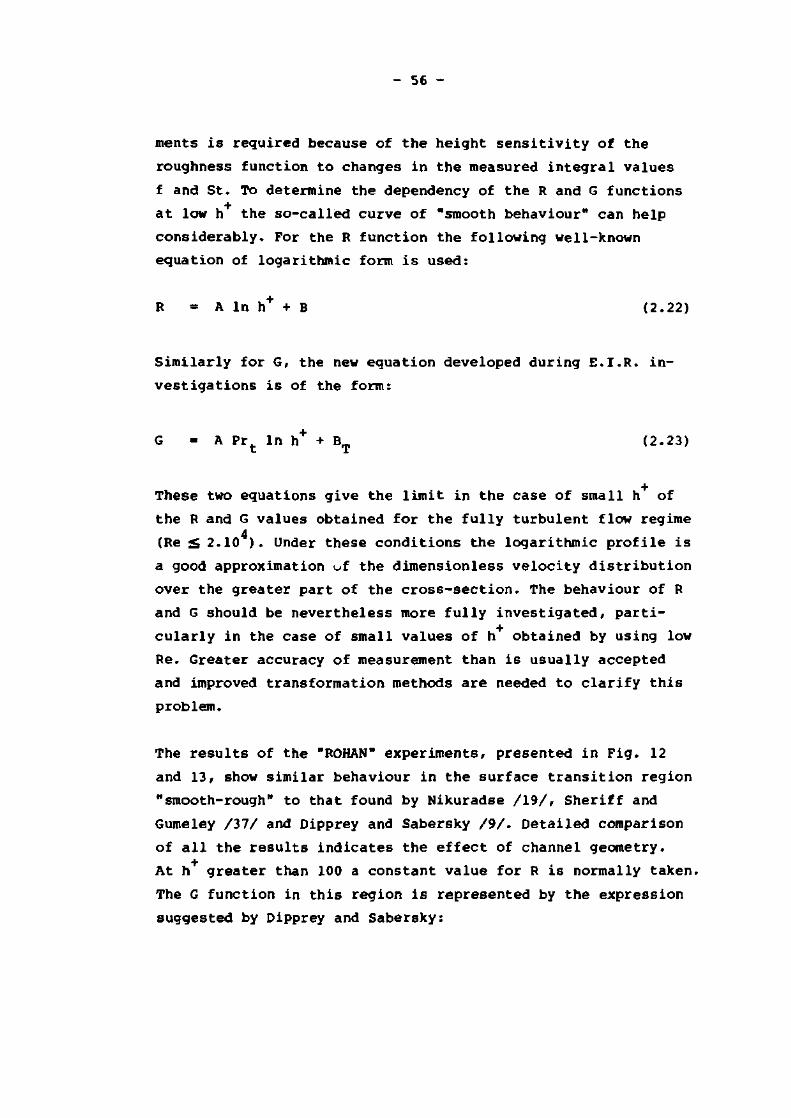
- 56 -
ments is required because of the height sensitivity of the
roughness function to changes in the measured integral values
f and St. To determine the dependency of the R and G functions
at low h the so-called curve of "smooth behaviour" can help
considerably. For the R function the following well-known
equation of logarithmic form is used:
R = A In h+ + B (2.22)
Similarly for G, the new equation developed during E.I.R. in
vestigations is of the form:
G = A Prfc In h+ + B T (2.23)
These two equations give the limit in the case of small h of
the R and G values obtained for the fully turbulent flow regime 4
(Re < 2.10 ). Under these conditions the logarithmic profile is
a good approximation of the dimensionless velocity distribution
over the greater part of the cross-section. The behaviour of R
and G should be nevertheless more fully investigated, parti
cularly in the case of small values of h obtained by using low
Re. Greater accuracy of measurement than is usually accepted
and improved transformation methods are needed to clarify this
problem.
The results of the "ROHAN" experiments, presented in Fig. 12
and 13, show similar behaviour in the surface transition region
"smooth-rough" to that found by Nikuradse /19/, Sheriff and
Gumeley /37/ and Dipprey and Sabersky /9/. Detailed comparison
of all the results indicates the effect of channel geometry.
At h greater than 100 a constant value for R is normally taken.
The G function in this region is represented by the expression
suggested by Dipprey and Sabersky:
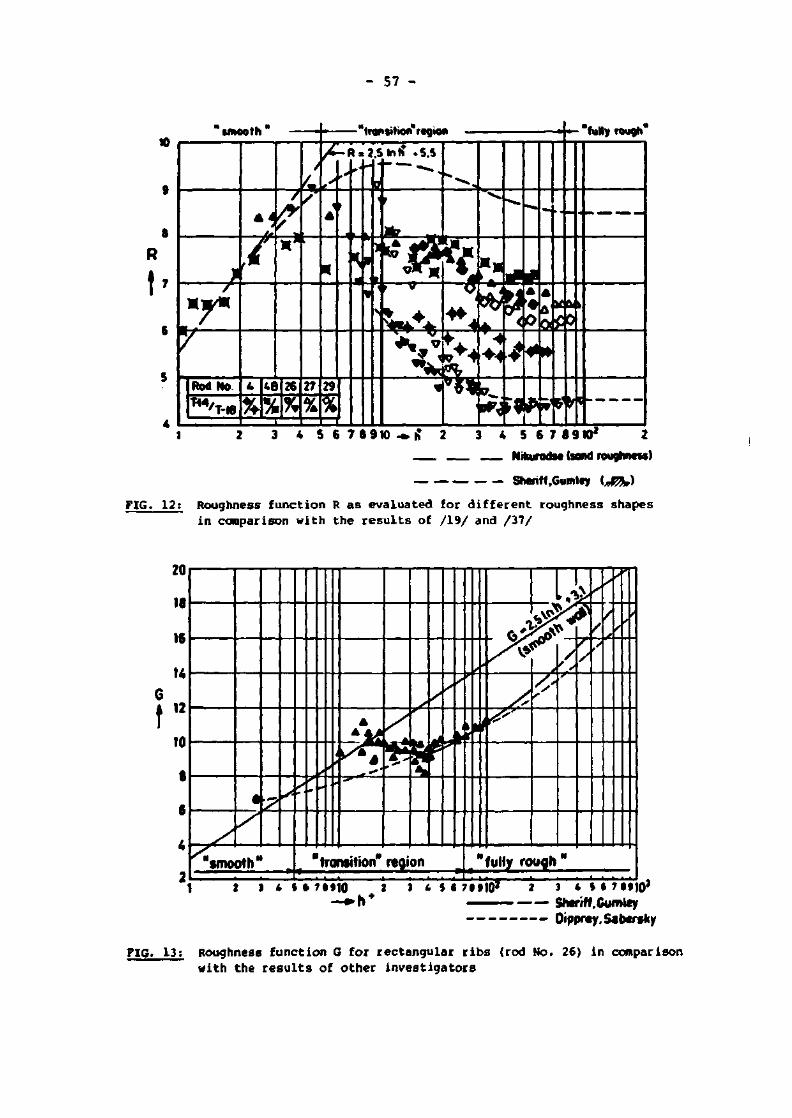
- 57 -
smooth
R
t ' 6 *
+ T &
T Rod No
TM, T-*8 %
7 ^
/C-hmi£*\ti
48
i%. 26
w 27
%
transition region ff • 9 9
5.5
29
%
M-l: „-=L Jl
*S**M4*» Tfcc:
<£a£2
'jgyjy^H"
fully rough
K&k
I 2 3 4 5 6 7 0 9 W — h * 2 3 4 5 6 7 8 9 W 2 2
Nhurods* bond roughness)
Sheriff.Gumlty {*%%,)
FIG. 12; Roughness function R as evaluated for different roughness shapes in comparison with the results of /19/ and /37/
20
18
16
14
r 10
.->
"smooth"
t 3 i < > !
?•'"
m\
, -* \
,1
roraition" region
\ ft 7 M10 ^ i 1 3 1 4 > '. \ < 71
o'3 y^ s*
1 {**
1
^ ^
^ s
1
^
' /
"folly rough "
itio2 3 I 1 I I 1 7 . ^ • • o *
—•» h * • Shtriff .Gumley Drpprcy.Sabersfcy
FIG. 13: Roughness function G for rectangular r ibs (rod No. 26) in comparison with the re su l t s of other invest igators

- 58 -
G = K • < h V Pr°-44 (2.24)
The consideration of the Biot number effect has until now been
limited to the correction of Stanton numbers but it can also be
introduced into the G function. This would be a more elegant
solution. It should however be noted that the effect of Eiot num
ber has still not been adequately investigated. Moreover, in
experiments /74/ with the aim of including the investigation of
Biot effect, there was no clear evidence that there was an
effect. Special experiments to study this effect are therefore
needed.
2.4.10 Indirect effects of rough surface application
Parallel to the experimental investigation of the basic per
formance of different rough surface,experiments and analytical
studies of the possible indirect effects of the application of
rough surfaces have been carried out. It has been found that
under and near spacer grids the fluid flow as well as the heat
transfer can be considerably affected. The investigation of
flow shows that in rough bundles the pressure drop over spacers
increases in comparison with smooth ones /92/, /93/. Barroyer
/94/ developed and successfully tested a new analytical method
of predicting the pressure drop of spacers which included the
indirect effect of rough channel walls. The local heat trans
fer coefficient under and near spacers is also affected by the
use of rough surfaces /95/. Investigations of this effect with
different spacer shapes show that in the presence of rough sur
faces the increase of the local heat transfer coefficient is
smaller than in the case of smooth surfaces only. Rehme and
Marek /96/, and recently Hassan /97/, systematically studied
this effect with a large-scale experiment over the complete
Reynolds number range from laminar to fully turbulent flow.
All the results confirm earlier findings. Comparison with

- 59 -
different available experimental results /97/ leads to empirical
correlations which take account of this effect over a wide range
of different spacer geometries and gas flows. Measurements with
different roughnesses with constant gas flows and the same spa
cers indicate /95/ a significant effect of roughness geometry
on the improvement of local heat transfer. The maximum effect
is reached when the walls become hydraulically smooth. There
have been no additional tests carried out up to the present
varying the roughness only, so the quantitative analysis for
photo-etched surfaces is all that is currently available.
The application of roughness at the inlet and outlet of a
heated section as well as the change from smooth to roughened
surfaces (and vice-versa) also influences the local flow and
heat transfer conditions (redistribution of velocity and tem
perature profiles). These effects have not yet been systemati
cally investigated.

60 -
3. TRANSFORMATION OP EXPERIMENTAL RESULTS TO EQUAL BOUNDARY
CONDITIONS
3.1 Significance of transformation
Presently fundamental knowledge of rough surface behaviour has
reached a level where further investigations should be oriented
towards practical use for engineering problems. Therefore the
investigation of relative performances becomes more and more
important. The choice of the corresponding channel geometry
depends considerably upon the aim of the investigation. The
annulus is a very convenient and simple channel geometry,
therefore most of the experiments for the determination of
thermohydraulic performances of rough surfaces have been carried
out in this channel geometry. In order to apply the annular ex
perimental results to more complicated channel geometries, these
results must be transformed, considering changes in:
- general flow conditions
- channel geometry
- surface quality of the walls (proportion of rough-to-smooth
surfaces in the channel)
- heat fluxes on the walls or proportion of heated-to-unheated
surfaces.
The usual methods proposed for handling experimental results do
not make full allowance for the differences between experimen
tal and actual channel. Therefore, the direct transformation
of the results is not generally possible. The methods attempt
to reduce the experimental results to the uniform boundary con
ditions of the experimental channel. Unfortunately, for the
asymmetric velocity profiles typical of annulus geometries, a
reliable transformation procedure becomes more difficult. In
the case of inner-rough and outer-smooth wall surfaces (normal
experimental situation) this asymmetry is more pronounced.

- 61 -
Additionally, the similarity of velocity and temperature pro
files cannot be assumed due to the asymmetrical (inner wall)
heating.
In order to take experimental advantage of annular channel geo
metry, an adequate and reliable transformation method should be
available. The quality of the experimentally determined per
formances of rough surfaces and their successful application
under more complex flow and heat transfer conditions is strongly
dependent upon the quality of the transformation method.
3.2 General requirements for the transformation methods
To reach a satisfactovy prediction of the pressure and tempe
rature distributions in a rod bundle the following requirements
of a transformation method are regarded as very important:
- Consistency and compatibility of the method. The same trans
formation procedure should be used for the evaluation of the
experimental results and of the analytical predictions.
- Consideration and full inclusion of the different boundary
conditions typical of different geometries.
- Solution of the core flow differential equations for different
channel geometries.
3.3 Review of the recently established methods for friction
factor and Stanton number transformations in annuli
A basic method for the transformation of experimental results
obtained in annular channels was proposed by Hall /98/. This
method is based on the measured velocity and temperature

- 62 -
profiles. The influence of the rough inner wall of the annulus
on the heat transfer characteristics of the flow is incorpo
rated directly into the Stanton number as an integral quantity.
Instead of solving the differential energy equation, the prin
ciple of superposition based on the known temperature distri
bution in the channel was used. To avoid measurement of the
temperature profile many approximate solutions have been pro
posed by different authors. A survey of these methods up to
about 1970 was given by Wilkie /99/, Kjellstrom /40/ and
MarkSczy /100/. Most of these methods were experimentally checked
and gave satisfactory results, at least in a limited range of
experimental investigations. A few of them were used as practi
cal semi-empirical equations introducing some additional correc
tion factors.
In the following, the methods for the friction factor and
Stanton number transformation recently applied by different
investigators are shortly described.
3.3.1 Friction factor transformations
The original transformation proposed by Hall requires velocity
and temperature profiles to be known. The measured values of
friction factor and Stanton number can than be separated into
inner (rough) and outer (smooth) subchannel values. This method
can be simplified assuming equal mean velocities and properties
in subchannels. In addition the simple power function, known
as the equation of tube friction factor, is assumed to be valid
also for the outer "smooth" subchannel of the annulus. The
radius of the zero shear plane which governs the separation of
friction factors (and Stanton numbers) can then be directly ex
pressed as a function of characteristic channel dimensions,
Reynolds number and measured friction factor of the entire

- 63 -
annulus. The roughness function R can be obtained using the
logarithmic velocity profile after Nikuradse /19/.
Maukac^tr^n^fonnation^ioi/
Maubach assumed the validity of the universal logarithmic velo
city profile for both subchannels of the annulus. The constants
of the logarithmic distribution are used according to Nikuradse
for inner "rough" /19/ and outer "smooth" /102/ subchannel. The
zero shear line is assumed to be defined with the intersection
of the logarithmic velocity profiles. The roughness function R
and the separated (transformed) friction factors of subchannels
can be determined by integration of the logarithmic profiles
and matching the results to the measured friction factor of the
entire annulus.
52E!2H£ton^P^r^e_tra^s^orma^ion_^l03^
Based on the results of experimental investigations with measured
velocity and temperature profiles, empiricial equations for the
ratios of some typical variables K. were developed by Wilkie ind
White /104/. The constants of these equations were modified by
Warburton and Pirie. With known values of K. factors the deter
mination of subchannel friction factors is possible by iteration.
Then the R value (not original evaluation procedure) can be
obtained from the universal logarithmic velocity profile. All
the K. equations are based on results with rectangular ribs and
their use for other shapes can therefore not be recommended
without additional verification.

- 64 -
3.3.2 Stanton number transformations
A combination of the simplified "equivalent conductivity"
(assuming e„ constant over the channel and Pr. = 1) and "laminar M t
sublayer" concepts is used to calculate the transformed Stanton
number for an annulus heated on one side only. To obtain the
roughness function G, the heat transfer similarity law of
Dipprey and Sabersky /9/ is applied.
52EiS£_tE225f°5D2^i22_^i25/
In this transformation, the assumption of a linear shear stress
distribution together with the Reynolds analogy is applied. The
investigation over the channel is made assuming the eddy dif-
fusivity of heat to be constant. The variation of the heat flux
between inner and outer wall is taken into account. The effect
of the curvature of the walls is approximated by an additional
correction factor. The original method gives only the trans
formed Stanton number, but the G values can be calculated
according to the heat transfer similarity law of Dipprey and
Sabersky.
5s£G§D~EiEif_£Ea,D§l25I!i£i2D-^I2§^
The Nathan-Pirie method is based on the empirical models obtained
by fitting the experimental results for different trai sverse
and helically ribbed surfaces in limited Reynolds number and 4 5
friction factor ranges (0.04 < f. < 0.16} 5.10 < Re < 3.10 ).
The transformed Stanton numbers can be used to calculate the G
function as for the Rapier transformation (not original eva
luation procedure).

- 65 -
Dalle_Donne-MeYer_transformation_/107^
It is assumed that, for an annulus heated on one side, the
dimensionless temperature profile can be represented by a loga
rithmic law. This logarithmic temperature distribution is
matched to give the measured Stanton number (alternatively the
measured temperature of the outer wall can be fitted to the
logarithmic distribution). The value of the G function is de
fined as the additive constant of the logarithmic law. In order
to compare the transformed Stanton numbers obtained by different
methods, these are calculated considering the logarithmic tem
perature profile in the inner region of the annulus.
Because of the considerable differences between the results of
the transformed Stanton numbers, recent investigations are
oriented towards improvements of the Stanton number transforma
tions. The consideration of heat transport by eddy diffusion is
the common basis for these works. Besides the method published
by the author /108/, a new method considering the theory given
in /108/ was suggested by Firth /109/, who also recommended a
slight modification in Rapier's method.

- 66 -
4. DEVELOPMENT OF A NEW TRANSFORMATION METHOD
4.1 Choice of a consistent approach for evaluating the per
formances of rough surfaces
In order to ensure a wider and reliable application of rough
surfaces, the determination of their performances should be
based on a general and consistent evaluation approach. In the
evaluation procedure the comparison between the transformed
results from different simple experimental channels should be
combined with the qualitative assessment of their application
under different complex channel geometry and flow conditions
typical for the practical solutions of engineering problems.
A general approach to evaluate the thermohydraulic performances
of rough surfaces was suggested earlier /l/. This basic approach
was recently reviewed and adapted at reasonable experimental
costs, considering that the main purpose of the transformation
procedure is to achieve an acceptable accuracy in predicting
the temperature and pressure distributions in rod bundles. This
new approach which uses the R and G functions as basic per
formances data is presented in Fig. 14.
In the case of the well-I'nown original definition of the roughness
functions, the "universal" logarithmic velocity and temperature
distribution is assumed to be valid over the whole flow thick
ness y of the channel. In the fully developed turbulent flow > ° 4 (Re - 2.10 ) this logarithmic distribution agrees well with the
4
measured data, but in the transition region (Re < 2.10 ) the
deviations in the wake flow region become more pronounced (a
small deviation in this region can also be observed for fully
developed turbulent flow). Near the wall, the logarithmic distri
bution can be accurately applied for all turbulent Reynolds
numbers, if the slope (generally also "origin") of the profile
(see equations 2.10, 2.20 and 2.21) is adjusted. This fact can

BASIC j PERFORMANCE i
CHANNEL GEOMETRY
BUNDLE
R and G
functions \u Particular
channel condition
I
ANNULUS
PREDICTIONS OR EVALUATION
Analytical prediction of P.T
distribution
Benchmark calculation
T J .
technical
literature
T — 4-
i single channel computer codes
(different transform.)
evaluation of experimental
information
COMPARISON ANO CHOICE
CHOICE of the suitable
computer code
I COMPARISON
COMPARISON
I CHOICE of
the evaluation method
EXPERIMENT
P and T distribution
Z measured
information
--3 P.T
distribution
or
integral values f .St
• M; A consistent EIR approach for evaluating the performances of rough surfaces and their consideration under different channel geometries

- 68 -
be considered to modify the definition of the R and G roughness
functions. To determine the values of R and G, a particular
logarithmic profile (with rib roots as "origin"), which matches
the measurements of the local near-the-wall distributions of
velocity and temperature, should be prolonged towards the rough
wall up to the rib tips. This new definition extends on the one
hand the use of the R and G functions down to the laminar flow
region, but on the other hand does not influence their values
(negligible deviations) for fully curbulent flow, obtained on
the "universal" logarithmic profile basis.
To obtain the R and G functions from experimental investigations
in annular channels a decision about the standard method of the
evaluation of these experimental results should be made. The
choice of this method should be based on the comparison of the
R and G values (or transformed friction factors and Stanton
numbers) obtained by different transformation methods and on
their experimental confirmation. Earlier investigations show
an acceptable agreement in the transformed friction factors
but, on the other hand, important differences between the re
sults of the different evaluations of the heat transfer ex
perimental data. This leads to the conclusion that further in
vestigation and improvement of the transformation methods are
needed before the final choice for a standard method can be made.
The R and G functions can than be inserted in computer codes
for bundle geometry calculations. Different computer codes
should be used for extensive benchmark calculations. Based on
comparison of the different predictions with the results measured
in bundles, these codes should be continuously improved. Bench
mark calculations together with experimental verifications are
of decisive importance for the final choice of an appropriate
computer code.

- 69 -
4.2 Principle of the new transformation method and its
application to the annular channel
None of the usual transformation methods can fulfil all the
requirements given in chapter 3.2. It was therefore decided
at EIR to develop a new transformation method.
The new transformation method is based on the solution of the
differential equations of the core flow obtained by the "eddy
diffusivity" concept. In these solutions the particular boundary
conditions of the channel geometry are taken i..*o account to
obtain the corresponding dimensionless velocity and temperature
distributions. Integrating these profiles over the flow cross-
section the mean dimensionless values of velocity and tempera
ture are determined. Then the corresponding friction factor
and Stanton number can be calculated,considering the well-known
connections between these integral performances (f, St) and the
mean values of dimensionless velocity and temperature.
Because of a higher priority investigations were started in
order to improve the evaluation of experimental heat transfer
results obtained in an annular channel geometry /108/. It was
therefore assumed that the momentum transport equation is already
solved and all important quantities (riaius of zero shear sur
face, R function, velocity distribution and friction factor)
are known. In this report the "eddy diffusivity" concept is
extended to the momentum transport equation. The values of the
R and G functions are determined by matching the analytical
solution of the momentum and energy transport equations for
core flow with the measured friction factor and Stanton number.
These values are then used to calculate the transformed fric
tion factor and Stanton number in an annulus with equal inner
subchannel thickness and the following uniform boundary con
ditions:

r ASSUMED^ Known boundary conditions of smooth wall
Momentum equation under experim. condition
u*- distribution, considering R as variable
Qo ( R ) - analytical
(^ Momentum equation under equal boundary conditions
Velocity distribution
Qoi tor inner channel
Asumptions: T -distribution r0 - position
Experimental values f and Q for annulus
u« - from measurements
a ; - Q*«
I CO COMPARISON -
CHOICE OF THE EVALUATION METHOD
COMPARISON
Other transformation
methods
fii W
©
FIG. 15: Application of the new transformation method to the annular channel and the choice of a suitable method for the evaluation of the roughness function R

i~
u
ASSUMED: Velocity and shear stress distributions known in experimental as well as in channel with equal boundary conditions
' >
Enerqy equation - under experimental conditions
i
T *—distribution , considering G as variable
1 >
T0* (G) — analytical
Energy equation - under equal boundary conditions
' 1
Temperature distribution
= • .
T| for inner suuwiuniiei
T* am T*
1
Experimental St values for entire, partially rough annulus
•
Tm* - from measurements
I - - T • ** r
« 1
• c* St,
1
Other transform, methods
i
COMPARISON
•
CHOICE OF THE EVALUATION METHOD
1 COMPARISON
_ : 1
Gi
•
i ' C f S* ' I t
I
FIG. 16; Application of the new transformation method to the annular channel and the choice of a suitable method for the evaluation of the roughness function G

- 72 -
- The same roughness form on both walls of the annulus.
- Both walls heated, where the ratio of the heat fluxes is
determined from the condition of adiabatic zero shear plane
The values of the roughness functions and transformed quanti
ties (friction factor and Stanton number) should be compared
with the results of the other transformation methods. The trans
formation procedure is schematically shown in Fig. 15 for
friction and in Fig. 16 for heat transfer performance deter
mination.
4.3 Momentum and heat transfer equations for an annulus
4.3.1 Basic equations
To simplify analytical treatment, the following basic con
ditions and assumption are considered:
- Steady-state, fully-developed turbulent and incompressible
flow.
- Uniform heat flux.
- Symmetrical channel geometry (two dimensional problem (x,r)).
- All important quantities (i.e. velocity, fluid properties,
pressure and temperature) are separated into a time moan
value and a fluctuating component.
- All mean quantities are constant in the circumferential
direction.
- The mean velocity in other than the axial direction is zero.

- 73 -
- The fluid properties across the channel and within one axial
calculation step are taken to be constant.
- The boundary conditions at the inner wall are:
at the roots of the ribs.
u = 0,
.' = 0, u
T
4" = T wl'
= 0
= 0
= 0
r = r,
at the tips of the ribs,
u+ = R
T+ = G
r = r. + h
The root radius of the rough rod is taken as the inner wall
boundary for the start of the velocity and temperature profiles
(the "wall origin"). A similar set of conditions is used for
the outer wall, if the transformation to uniform boundary con
ditions is accomplished.
- The boundary conditions at the outer smooth wall surface,
r = r_, are:
u • 0,
u' » 0,
T = Tw2,
* W 2 = °
v - 0
v' * 0
S - •
(adiabatic outer surface, therefore heat losses neglected).
The momentum and energy equations without viscous dissipation
can then be written:
3x r 3r L 3* (4.1)
- 74 -
3T 1 3 p C
P U ^ " r 37 r p c (a -r- - v'T') p ax = 0 (4.2)
4.3.2 Eddy diffusivity concept
The main problem in solving equations (4.1) and (4.2) is to find
an acceptable relationship for the fluctuation terms u'v' and
v'T', which govern the turbulent momentum and the heat transport
mechanism. One suitable approximation is to introduce the well-
known eddy diffusivity concept. According to its original de
finition, this model is restricted to homogeneous turbulent
flows, although, in non-homogeneous flows with pronounced ve
locity gradient and shear stress in one direction only, the
flow field with symmetrical velocity profiles can be satis
factorily described by this model. For asymmetrical profiles
the displacement between the zero-shear surface and the surface
of maximum velocity is caused by the diffusion of turbulent
energy across the zero-shear surface. This effect can only be
properly described with more sophisticated models of turbulence.
The usefulness of the approximation with the eddy diffusivity
model has been confirmed by many investigators /40/, /105/,
/110/ and /111/. With this concept a new fundamental analogy
between heat and momentum transport is obtained allowing mo
mentum and energy transport across the zero-shear surface to
be considered.
The eddy diffusivities of momentum (eddy viscosity) and heat
(eddy conductivity) are defined by equations
u'v' ,. -.* eM = ""ST" (4'3)
3r

- 75 -
H v'T' 3T 3r
(4.4)
Considering these definitions, equations 3.1 and 3.2 can be
rewritten:
3P 3x
1 3_ r 3r r u (1 + £ s] -« (4.5)
3T p c u —
p 3x
1 r
3_ 3r
r p c (a X 3 T
= 0 (4.6)
The eddy diffusivity of momentum (eddy viscosity) is assumed
here to be known, therefore the introduction of its correlation
with the eddy conductivity is very useful.
1" Pr. (4.7)
For fluids with Prandtl numbers close to 1, an already simple
expression for the tui
satisfactory results.
expression for the turbulent Prandtl number, pr » leads to
4.3.3 Shear stress and heat flux distributions
The direct solution of equations (4.5) and (4.6) can be bypassed
using the following expressions for the shear stress and heat
flux in the radial direction:
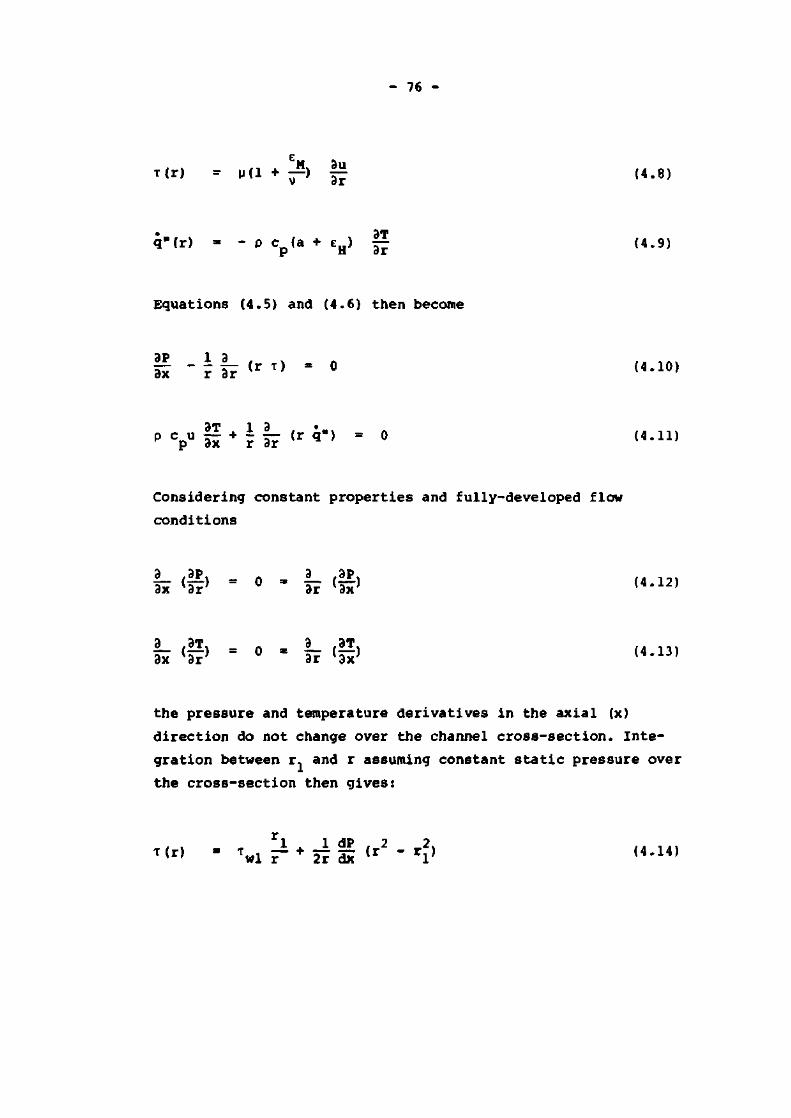
- 76
T(r) = u(l + > §f (4.8)
3T q"(r) = - p cp(a + eH) ^ (4.9)
Equations (4.5) and (4.6) then become
s - J ! F « I T > - ° <4-10>
p cP
u i r l ? (rq"} = ° <4'n>
Considering constant properties and fully-developed flow
conditions
0 , 0 ? . - O » <?P. /••«**»
h <£> = " - 1 ? <S' (4-13'
the pressure and temperature derivatives in the axial (x)
direction do not change over the channel cross-section. Inte
gration between r. and r assuming constant static pressure over
the cross-section then gives:
T<r> - V L r + s I <r2 - ri> (4-14>
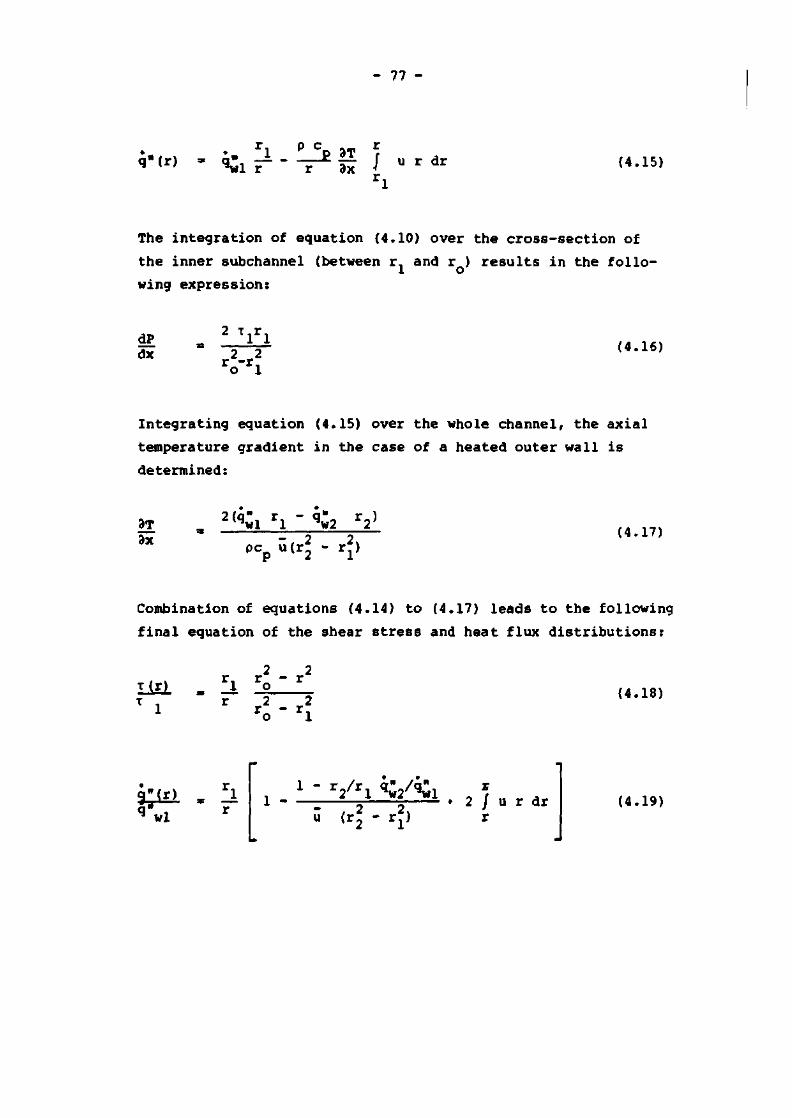
- 77 -
q"(r) = i. !i. Li n r
^wl r r 9x J u r dr r,
(4.15)
The integration of equation (4.10) over the cross-section of
the inner subchannel (between r, and r ) results in the follo-1 o
wing expression:
dP dx
2 Vi 2 2
ro"rl
(4.16)
Integrating equation (4.15) over the whole channel, the axial
temperature gradient in the case of a heated outer wall is
determined:
3T 3x
2(q, wl xl 4w2 r2>
pcp utr2 - rJ)
(4.17)
Combination of equations (4.14) to (4.17) leads to the following
final equation of the shear stress and heat flux distributions:
t(r) T , 1 4-4
(4.18)
q"(r) , ^1
wl 1 -
1 " r2 / rl qw2 / qwl
<4 - 1 2 / u r dr
r (4.19)

- 78
4.3.4 Radial velocity and temperature distributions
For the calculation of radial velocity and temperature distri
butions equations (4.7) to (4.9) are combined giving:
^ = liEl (4.20) 3r p(v + cM)
3T = Pr g"(r) (4 21)
3r p c (v + eMPr/Pr ) *••**•) p M t
It is more convenient to use the dimensionless values of radius,
velocity and temperature
r+ = | • /TTP" (4.22)
< ~= /rfr = V u x i (4-23)
p c u . T + = (T . - T) »P T 1 (4.24)
wi q;i
Equations (4.20) and (4.21) can than be rewritten:
! i T/TWJ 3r+ = 1 + eM/v
3T* Pr q"/q^A
(4.25)
* + i ^ / Pr 3r 1 + eM/v • jp-(4.26)

79
The velocity and temperature distributions in the subchannels
can be obtained by integration of equations (4.15) and (4.26),
supposing the values of eddy diffusivity and turbulent Prandtl
number are known. For the shear stress and heat flux distri
bution, equations (4.18) and (4.19) are employed.
4.3.5 Friction factor and Stanton number calculation
Assuming equal pressure drop in the subchannels, the correspon
ding subchannel friction factors are by definition:
1
2
_
—
dP dx
dP dx
?
P
?
P
d h i
- 2 U l
d h2
-°l
(4.27)
(4.28)
From a force balance on the subchannels the pressure drop can
be expressed as a function of the wall shear stress and corre
sponding hydraulic diameter of the subchannel. This leads to
the following two equations:
(4.29) f l
f 2
s
-
8 T i - 2
P U j
8 l 2
p5j
=
s
8 , -+,2
8
c»y (4.30)
These equations give the connection between the friction factors
and the mean dimensionless velocities of the subchannels. The
subchannel mean velocities are obtained by integrating the
dimensionless velocity distribution.

- 80 -
-+ Ul 2 2
r o " rl
u r dr (4.31)
-+ U2 2 2
r2 " ro
/ u, r dr (4.32)
The bulk Stanton number is normally employed as the fundamental
integral parameter for the calculation of heat transfer in simple
duct channels. In the case of heating on one side only of the
annulus (experimental situation) the bulk Stanton number is
given by
St. = — • b p u c
*wl (T ,-T, )p Q c wl b p
(4.33)
The temperature difference (T .. - T.) can be obtained if the
mean dimensionless temperature is calculated over the entire
channel.
T+
u(r2 - r^ T ur dr (4.34)
Inserting the expression for the dimensionless temperature leads
to:
T+ P UTl CP
^Wl lwl "/ 2 2, u(r2 - r^
Tur dr (4.35)

- 81 -
and considering the definition of the bulk temperature, the -+ following relation between T and (T , - T.) is evident:
wi b
*+ • ( Twi-Tb> ^ - T - T * <4-36> ^ wl
Replacing the mean temperature difference in equ. (4.33)
according to equ. (4.36) the bulk Stanton number is a function
of the mean dimensionless velocity and temperature values:
S t b = ^ <4'37> T u
Under the hypothetical transformation conditions the outer wall
is also heated. The corresponding two Stanton numbers are then
given by:
(4.38) s t b l =
S tb2 =
<Twl
q" 4 wl
- v p cP
G i
• q" H w2
1
Tl Ul
1 -+ -+ (4.39)
(Tw2 " V p Cp U2 T2 U2
The two mean velocities in equations (4.38) and (4.39) are cal
culated by integrating the velocity profiles between the corre
sponding wall and the radius of the adiabatic surface.
- 82 -
5. APPLICATION OF THE NEW TRANSFORMATION IN ANNULAR CHANNELS
5.1 Solution of the annular channel equations
The quality of the solution obtained with the new method depends
considerably on the accuracy of the velocity and temperature
distributions calculated from equations (4.25) and (4.26). The
choice of values for the eddy diffusivity of momentum and the
turbulent Prandtl number which appear in these equations, as
well as the calculation procedure, are therefore important.
5.1.1 Eddy diffusivity of momentum
Many investigators have proposed analytical expressions for the
distribution of radial eddy viscosity in simple channel geo
metries. One of the best known is that given by Reichardt /112/
for smooth pipe flow. Similar curves were also obtained by
Nikuradse /19/ and Hinze /113/. However, no satisfactory ex
pression exists which would be completely consistent with the
physical conditions of turbulent flow in different channels.
Appreciable deviations appear mostly in the central region. The
most important constraints for the eM distribution giving an
adequate expression for the turbulent velocity distribution can
be generally summarised as follows:
1. The eddy diffusivity should vanish at the wall (with the cube
of the distance according to some theoretical consideration
/112/, /114/.
2. The analytical velocity derivative should give a zero value
in the central region of the channel i.e. at the experimen
tally determined position of the maximum velocity.
3. The continuity equation should be satisfied in such a way
that the integration of the predicted velocity distribution

- 83 -
leads to the correct mean velocity.
4. The shear stress distribution should give acceptable friction
factors with Reynolds number dependency.
5. The calculated velocity distribution should agree with the
best available experimental data, particularly in the central
channel region.
All these conditions can be fulfilled for the tube and other
simple channels with symmetrical velocity distribution. In the
case of an annulus, conditions 2, 4 and 5 must be separately
checked so that the velocity distribution, corresponding to the
e„ distribution, matches the experimental results.
The eddy viscosity distribution in the annulus can be determined
experimentally if the pressure drop and velocity profiles are
measured (condition 2).
r2 - r2
1 dP m /c ,. eM = 2 dx" dlT " V (5-1>
r P d?
The measurements of different investigators /115/ to /118/ show
that the radial variations of e„ in an annulus are very similar
to those of tube experiments. For moderate radius ratios of
practical interest (0.28 < cL/d- < 0.75) the same distribution
of the normalized dimensionless eddy viscosity
+ £ M / V ,< ,i
eM = — (5.2) Ar
was observed by Jonsson and Sparrow /117/. Their curves have a
similar form to the ones proposed by Reichardt for smooth tubes.
It is normally assumed that the positions of zero-shear stress
and maximum velocity surfaces coincide, which is a good approxi
mation for a smooth annulus with moderate radius ratio. In the

- 84 -
case of a partially rough annulus the displacement between
these two positions is much larger. Based on the author's own
investigations together with the study of the data obtained in
the literature, a relatively simple expression to determine this
displacement was suggested /119/. One of the two positions (r
or r ) must be known (from measurements or from an iterative m
analytical solution). The second can then be determined accor
ding to the developed expression. The accuracy of the method
(mean value about ± 2 %) was checked by extensive comparisons,
where different measured and analytical results using the higher
turbulence model of Hanjalid /120/ were considered.
In order to fulfil condition 4 the expression for the Reynolds
stress in the equation of shear stress
du T = \i 2 P u'v' (5.3)
must be corrected:
du pu'v' = -P£ w -r- + AT (5.4) M or
The shear stress distribution is therefore given by:
du T = " dr - * + AT (5.5)
From the momentum balance, the approximate equation of the
shear stress distribution in an annulus is determined by
2 2 1 dP o ,(. ,»
T = 2 dx" — (5'6)
Combination of equ. (5.1), (5.5) and (5.6) leads to the ex
pression for the correction term A T :

- 85 -
2 _ 2 1 dP ro ' rm ,_ ,%
AT = 2 S —F— (5-7)
To determine the velocity distribution in an annulus this
correction. AT, should be introduced in equation (4.18) to give
2 2 ^ A r, r - r , + e w T + AT 1 m du ., . M T (1 + ~ ) (5.8) T. r 2 2 1 r0 - rL dr
Corresponding changes should also be considered in equation
(4.25) if the correction term cannot be neglected (in the case
of an important difference between r and r ). m o
Turbulent diffusivity is generally a function of Reynolds number.
These changes of e„ can be determined by matching the measured
velocity profiles (combination of conditions 4 and 5), i.e. the
c„ values are to be changed until a satisfactory agreement bet
ween calculated and measured velocities is achieved.
5.1.2 Turbulent Prandtl number
Relatively few experimental investigations have been carried
ort to determine the temperature profile for heat transfer in
turbulent flow. These profiles are needed, together with the
distribution of eddy viscosity, to calculate the turbulent
Prandtl number.
The first statement of Reynolds /121/ using Pr. = 1 has been
questioned by many authors. Numerous attempts to obtain direct
experimental evidence show no uniform and consistent results
/122/. Most of the measurements are available for gases for
which the molecula:. Prandtl number is close to unity. Ludwig
/123/ measured the variation of Pr with the radius of a tube

- 86 -
for air. The measurements indicate that Pr varies smoothly
and continuously from a value of about 0.9 at the wall, to
about 0.6 at the center. These results are also in agreement
with Taylor's vorticity theory /124/.
Most of the existing theories assume Pr = 1 or an average and
constant value. The results obtained by such assumptions are
acceptably close to the measurements and suitable for most
practical purposes.
Gowen and Smith /30/ investigated the change in turbulent Prandtl
number versus radial position for turbulent air flow in smooth
and rough tubes. The results for smooth tubes agree very well
with those of Ludwig. Additionally important information about
the effect of roughness on the Pr was obtained. The changes
in the radial direction are slightly more pronounced than in
the smooth tube and the Pr values are on average about 20 %
higher.
The effect of the Reynolds number was investigated by different
authors /125/ to /127/, and found to be important.
5.1.3 Calculation procedures
To solve the annulus equations, principally two procedures were
investigated:
- numerical integration
- simplified solution with direct, analytical integration.
5 1.3.1 Numerical_integratign
The aims of this solution were to:
- investigate in detail the velocity and temperature distributions

- 87 -
obtained and to compare these analytical curves with measured resul ts and
- verify the quality of other different simplified methods for the evaluation of measured r e su l t s .
The annulus cross-section i s subdivided into very small calculat ion zones, so that the local conditions in the radial direction are considered constant within one calculation zone. The
Tube r e s u l t s : Annulus r e s u l t s :
Reichardt / 1 1 2 /
. - _ - N i k u r a d s e / 102 /
Rehme / I I S /
61/A2 " ° ' 1
4-10" < Re < 2-105
•Jonsson, Sparrow /117/
0.28 < d x / d 2 < 0.75
3 .1 '10* < Re < 1.3'10*
FIG. 17s Generalised turbulent eddy diffusivity measured in a "smooth" annulus. The tube and annular results of different authors are given for comparison.

- 88 -
values of the eddy viscosity were determined as the best fit of
the available experimental investigations /102/, /111/ to /113/,
/115A /117/. Typical curves according to different experimental
data are presented in Fig. 17. A curve similar to that of
Jonsson and Sparrow /117/ is used for the numerical integration,
but an approximative variation of the values with Reynolds num
ber is introduced.
Different turbulent Prandtl numbers for smooth and rough sub
channels are taken, according to the measurements of Gowen and
Smith /30/. The development of the corresponding NANOC code was
initiated after some encouraging results were obtained by Lawn
with the CONAN code /111/. The original version of this computer
code was adopted at EIR by Lewis and Hudina in order to begin
comparative calculations.
The first results of the R and G function calculations are
available but are restricted to a limited Reynolds number range.
Considering the considerably more complex calculation procedure
in comparison with other possible solutions, the available
values of e„ and Pr. seem not to be accurate enouth to obtain M t
a decisive improvement of the results concerning the reliability
and confidence of the calculated performances. The comparison
between analytically-predicted and measured velocity /128/
distributions (see Fig. 18 and 19) show the benefit of this
method. Considerably better prediction, as in the case of loga
rithmic profile application, is obtained.
With additional investigations, to obtain more accurate e and
Pr values, this method can become more important, particularly
in the case of large variations of the local (subchannel) velo
city and temperature values. Presently efforts are directed to
wards simpler solutions which can perform with an accuracy
acceptable for practical engineering applications.

- 89 -
»"•»'
9 • 7 • •» S 4 »
FIG. 18: Comparison between calculated (code NANOC) and measured /128/ tube velocity profiles.
PIC« 19: Comparison between calculated {code NANOC) and measured /116/ velocity profiles.

- 90 -
5.1.3.2 Simglified_solutions
NANOC is a relatively large computer code reguiring a lot of
computer time. Therefore it is not suitable as a standard
evaluation method for extensive measurement programs. Different
simplified solutions were tested in order to decide on a stan
dard calculation procedure. Two requirements, acceptable accu
racy of roughness function determination and reasonable computer
costs, should be fulfilled. Two solutions have been extensively
studied. Based on test calculations, both solutions can be
suggested for further application
"a" combination of one of the recent friction factor trans
formation methods with the "eddy conductivity" concept
applied to the energy equation
"b" "eddy diffusivity" concept applied to the momentum and
energy equations.
To reduce the computer costs in both cases, numerical inte
gration is replaced by a direct analytical integration. This
was made possible by dividing the channel into a few zones where
the local values of velocity (for energy equations only), eddy
diffusivity and turbulent Prandtl number can be represented by
simple analytical functions (constant or with a linear depen
dency) . The number of these zones can be varied.
Solution "a" is based on the fact that the results of different
friction factor transformation methods do not differ greatly
and can be assumed to be proven values.
The momentum equation can therefore be taken to be solved and
the velocity and shear stress distributions over the channel
cross-section are assumed to be known. The following additional
simplifications are introduced concerning the radial distri
bution of the important quantities:

- 91
The universal logarithmic velocity distribution is used for
the near-wall region. The radius at the rib roots is taken as
the "origin" of the velocity profile (y = o at r = r,). The
velocity in the flow core is taken to be constant in each of
the corresponding zones.
- The eddy diffusivity distribution, linear near the wall and
constant in the core flow, is presented in Fig. 20 for 4 5
Re = 2.10 . For Reynolds numbers higher than 10 the distri
bution is approximately equal to those successfully used by
Lawn /111/. The Reynolds dependency of the E„ values in the
core flow (y/y > 0.23) is determined according to different experimental investigations by the following equation:
2000 EM/V
= 0.076
m
1 -Re
(5.9)
0.10
e M / »0 0 8
006-
00U -
00Z -
— yAm* 'm -r,
curves
•imple. linear distributions
— -»— Relchardt /112/, tube
- ^ — » Jonsson and Sparrow /111/, annulus 3.1 • 10* <Re < 1.27 • 10s
Lawn /111/, for all Re
equation (5.9) for Re • 2 10*
FIG. 20: Approximate values of eddy diffusivity used in different calculation models. The curve of Reichardt for tubes is given for comparison.


- 92 -
- The turbulent Prandtl number is assumed to be constant in
each of the channel zones. These values are based on the radial
distribution measured by Gowen and Smith /30/.
The computer code STANTRA was developed for the evaluation of
heat transfer performances from annular experimental results.
Solution "b" represents simplified but thorough application of
the turbulent diffusivity concept. First the velocity distri
bution is calculated by an iterative procedure, then the mean
values of velocity in each radial subdivision of the channel
cross-section are used to calculate the local temperature
distribution (the number of the cross-section subdivisions was
chosen to be higher than for solution "a").
The same distribution of eddy diffusivity and turbulent Prandtl
number as for solution "a" is also applied here.
The displacement between radii of zero-shear stress and maximum
velocity is determined according to the analytical method
described in /119/. A complete reevaluation of the ROHAN results
was carried out with this solution incorporated into a new
evaluation code NEWTRAM.
5.2 Evaluation ox the experimental results obtained in annular
channels
To determine the performances of rough surfaces, typical of those
of the "ROHAN" experiment, the original measured results of the
experiment /54/ were used, together with single pin experimental
results obtained under high pressure and high temperature con
ditions /74/. These experimental data were processed by the two
versions of a special evaluation code which allows different
transformation methods to be considered.

- 93 -
5.2.1 Results of previous evaluations
All the measured results of the "ROHAN" experiment had pre
viously been evaluated by different, established transformation
methods. During evaluation of the first series of measured re
sults the uncertainties introduced by the choice of the trans
formation method were recognised /17/. Comparison of different
transformation methods (see Fig. 21) indicated that the sim
plified Hall transformation for friction factor and Hall-
Kjellstrom transformation for Stanton number gives reasonable
values of the multipliers (fx and Stx). These values represent
quite closely the mean results of the compared transformations.
It should be noted that both the rough and the smooth-wall trans
formed quantities are similarly affected and transformation un
certainties are therefore relatively reduced in the multipliers.
Unfortunately this statement does not apply to the fundamental
3*
O FONTS. CALCULATED FROM W^LKCS. j POLYNOMIALS « f f
HALL (SMRj/lfcO/ RAPIER / I 0 5 / MALHERBE / 3 V
"— DALLE DONNE / M /
FIG. 21t Variation of Stanton number with friction factor multipliers for different transformation methods (14, 18 and 22 mm channel diameter, Re, 1*10 ) .
94 -
absolute quantities (transformed friction factors and Stanton
numbers as well as roughness function R and G) /58/, /72/. A
comparison of the multipliers may be considered as a useful
guide to the relative efficiency of the surfaces and therefore
this transformation method was used in the first version of the
evaluation code.
Detailed information about the results of different measuring
series were reported in /17/, /58/, /129/ to /131/ (see also
Fig. 6 to 9). A review of these results, together with details
of the criteria of their choice for the GCFR, were also published
/61/, /132/. These reviews concentrated on the results of some
representative surfaces as given in Table 2. Performances were
normally given in the form of multipliers, which are represented
here as functions of transformed Reynolds numbers for three
different diameter ratios (d./d..) of the annulus: 1.63 (Fig. 22),
2.09 (Fig. 23) and 2.56 (Fig. 24). A comparison of multipliers
for different test sections, but at a transformed Reynolds
5
number of 10 , is given in Fig. 25. A curve of the simple per
formance criterion Stx /fx = 3 is given together with the much
flatter curves of the complex performance criterion which was
developed to ensure the consideration of an entire reactor
coolant circuit /132/. These flatter curves demonstrate thac,
for practical use, the magnitude of the reduction in the fric
tion factor multiplier becomes less important in comparison with
the change in Stanton number multiplier.
The absolute values of the transformed friction factors and
Stanton numbers were determined together with the roughness
functions. Due to the uncertainties involved in the transfor
mation method and also in the measuring conditions (low Re, low
temperatures) these absolute values should be viewed with some
caution. Nevertheless, the resultant curves of the R and G
roughness functions (see Fig. 12 and 13) are similar to those
obtained by other authors /9/, /19/, /37/.

95 -
2
Six
t * M *o°
4 I I -1
4 5 6 78910* 2 3 4 5 6 7 8 9 1 0 s
— • Rei
Rod No. fx Stx
29 •
0
11 • 0
4 M
M
4b
• •
26 •
V
27 A
A
FIG. 22s Friction factor and Stanton number multipliers as a function of transformed Reynolds number (<3,/d2
a 0.587, simplified transformation method).

- 96 -
2
Stx
t f\ " ,
V F>3 #
5 D
a o *
1
4 5 6 7 8 9 1 0 4 2 3 4 5 6 7 8 9 1 0 s
- • R e ,
Rod No. fx
Stx
29 • 0
14 • a
4 »
•
4b 4 •
26 •
v
27 A
A
FIG. 23: Friction factor and Stanton number multipliers as a function of transformed Reynolds number (6 /d - 0*459, simplified transformation method).

- 97 -
6 5 4
3
fx
t, s 4 5 6 7 89 W3* 2 3 4 5 6 76910s
- * > R e t
2
Stx
t o*d •tf 1
4 5 6 7 8910* 2 3 4 5 6 7 8 9 1 0 s
Rod No. fx
Stx
ii m 0
4 X M
4b
• •
29 • 0
27 A
A
FIG. 24: Friction factor and Stanton number multipliers as a function of transformed Reynolds number (d-./ , • 0.383, simplified transformation method).

- 98 -
x ft
2 -
Ipe* const
CHANNEL DIAMETERS:
• 14mm O <8mm <Q> 22mm
I 2 3 — f x 4 5
FIG. 25: Summary of experimental results: relation between multipliers (Re = 105, p/h--12, w/h-«3) (simplified transformation method).
RELATIVE UNCERTAINTIES [%J
DIMENSIONLESS VALUES
FRICTION FACTOR MULTIPLIER - fx
STANTON NUMBER MULTIPLIER - Stx
SIMPLE FORM OF PERFORMANCE INDEX Stx3/ fx
MOMENTUM ROUGHNESS FUNCTION - R
HEAT TRANSFER ROUGHNESS FUNCTION-G
CHANNEL DIAMETER tmml
14
1 4,4
14 ,0
112,8
14,1
112,2
18
1 5,3
1 4 , 7
1 15,1
14 ,0
113,8
22
1 6,0
14 ,9
1 15,9
—
-
TABLE 3 Relative uncertainties of experimental results at transformed Reynolds number Re • 105 (uncertainties of the simplified transformation method are not included).

- 99
The relative uncertainties of these results (uncertainties of
the transformation not included!) are given in Table 3.
5.2.2 Application of the new transformation method
The new transformation method was applied in two steps. In the
first step the numerical solution (NANOC) and the solution "a"
were used. Investigations were started with velocity and tem
perature profile calculations using the code NANOC. Particular
efforts were spent on the eddy diffusivity distribution. In the
smooth surface near-wall zone the velocity distribution suggested
by van Driest /133/ was applied. A very limited number of runs
at a few Reynolds numbers were made with rectangular and trape
zoidal ribs. The satisfactory results of simplified solution "a"
together with high computer costs, led to a temporary inter
ruption of further work on the NANOC code.
The most important results of the preliminary calculations have
already been published /108/. Here the results of G function
calculations are presented in Fig. 26. The resultant G function
* *
•*
^
*.» fc* •'
J ,
N
*< N t
>
%
>
4
^ * * *
n * t ^r3
» - k
* <
6 -
_ , - '
Cj(h*>
\
B * * *
:.s?- *
, B .pi
^ «•
• **
•-"
» 10 M * 0 M NO ^ . t IN NO
FIG. 26: Roughness function G in the transition region of h values, for rectangular (26) and trapezoidal (19) roughness profile (solution "a").
«l/d, - *
Red NO
19 2*
1.70
0 &
M l
• A
241
•
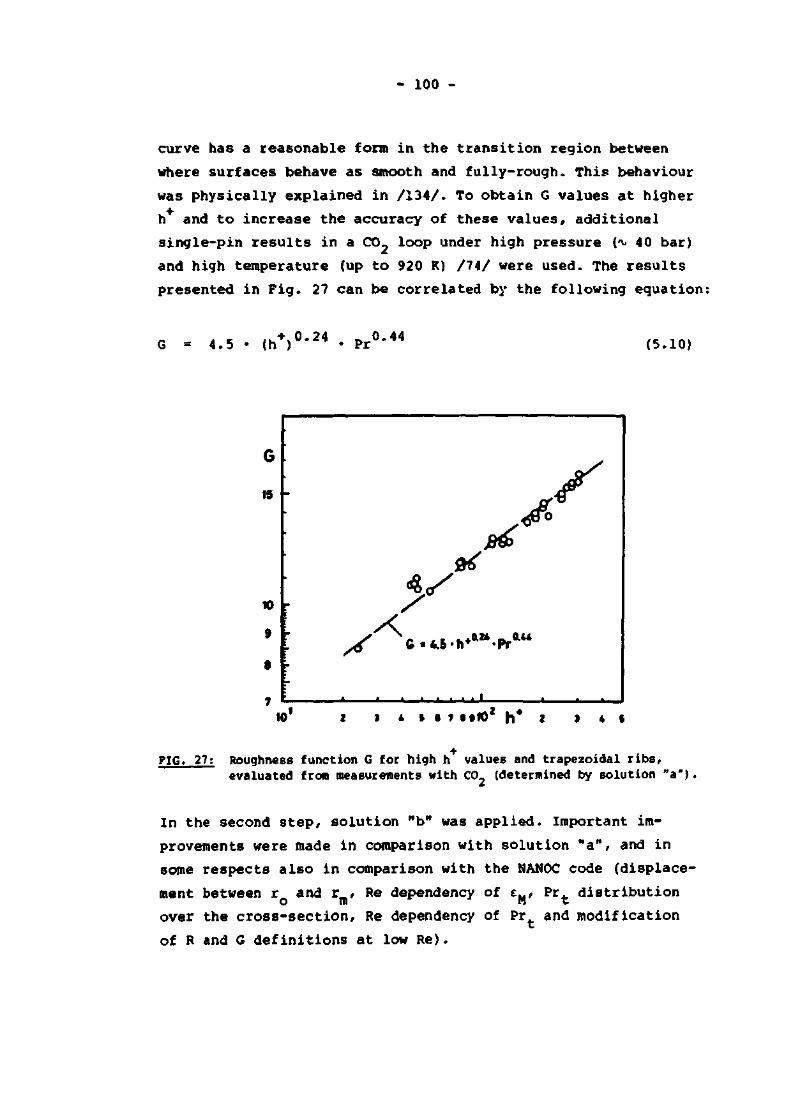
- 100 -
curve has a reasonable form in the t r a n s i t i o n region between
where surfaces behave as smooth and fu l ly - rough . This behaviour
was phys ica l ly explained in / 1 3 4 / . To obta in G values a t higher
h and t o i nc rease t he accuracy of these v a l u e s , a d d i t i o n a l
s i ng l e -p in r e s u l t s in a CO_ loop under high p ressure (^ 40 bar)
and high temperature (up t o 920 K) / 7 4 / were used. The r e s u l t s
presented in F i g . 27 can be co r re l a t ed by the following equat ion:
G = 4 .5 <hV-24 Pr
0.44 (5.10)
G
15
10
9
8
•
; y . •0.24 _0 .44
10' % 4 S • 1 t t l O * h * » I 4 *
PIG. 27; Roughness function G for high h values and trapezoidal ribs, evaluated from measurements with CO. (determined by solution "a")
In the second s t e p , so lu t ion "b" was app l i ed . Important im
provements were made in comparison with so lu t i on "a" , and in
some r e spec t s a l s o in comparison with the NANOC code (displace
ment between r and r . Re dependency of e o m „ , Pr. d i s t r i b u t i o n M t over the cross-section, Re dependency of Pr and modification
of R and G definitions at low Re).

- 101 -
5 .2 .2 .1 Transformed_f£i£tion_f2ctors_and_Stanton_numbers
The variation of transformed f r i c t i o n and Stanton numbers with
Re for rod 19 in a l l three t e s t - s e c t i o n s i s represented in 4
Pig. 28. Up to Re. = 2.10 the values show a strong Re dependency and increase rapidly, then the values s t a b i l i z e and, particularly in the smallest t e s t sect ion (T-14) with cL/di =
1.63, decrease s l i g h t l y towards higher Re..
KT i i 7
2.10"
-
_L_
1
_ l _
i
1 «
1 *
"i r
---zr=r+* " 5 * ^ ^ > -B* •*
11
_1 I 1 1
- * 5?
a -
- * -• . o
D O
| l \fr via
1 I I I ' 1 1 1 0 I 1 • I I 7 M I 0 Re,
10
St, I
2-Kf1
-
-
1 I
11
A D ' * « * ,
J * ' d
l i i i
A** > J l
•J
... 1 _
. •
I 9 o
•
i 0 o
1
rr 11 i e D JtB_ e oo
i i ( ( ) I MO * » * » » T • »io Re,
Teatsection fi and St,
T -14 6
T - » 0
T - 2 2 0
FIG. 28: Transformed friction factors and Stanton numbers as a function of Reynolds number. Results of rod No. 19 in different test sections.

- 102 -
5.2.2.2 F£iction_f5££or_and_Stanton_number_multigliers
In Fig. 29 multipliers for rod 19 in the different test-sections
are presented. The influence of the annulus diameter ratio is
very marked and more pronounced than for the absolute values
(fj and Stj^).
2
fx
1 0.9 0.0 0.7
-
-
•
1 1
t 1 A A
i
a
v &
B
^L*»'
I
i i i i
» * *
a
"oo"
k * k
a
o °
0
0
1 1
O o
\W
o c
-
-
•
. .
1.
4 t ( t • tio* Re, 7 i * * » ? » M O *
s t « :
0,9 0.9 07
-
. 1 a
1 O
oo
k *
D
0 <
fc o
A<
o
i
o 0 <
•
• «
)04 Rt, » » * * • ' • » 10*
TMt Met ion
Mult ipl ier* T - 1*
A T - 1 »
O T - 2 2
O
FIG. 29: Multipliers obtained for rod No. 19 in different test-sections.

- 103 -
The performances of different rods can be compared in Figs. 30
to 33.
2
fit
1 At 0J
•
-
•
c
e
•" 0
i 1 iffl!
l > 0 A
- J * V
. • ' ^
•
•
•
* * t T i t i o 4 Re| » i 4 » • T • » i o 5
2
Sti
1 0.9 0.1 ft?
-
» 1
l&. 1° f&<
1
1
D l 1 •
'
* I i 7 t 1 io* Re, » ^ * * • r • i <o9
Rod No. Multipliers
19 o
23 O
26 V
27 A
FIG. 30; Multipliers obtained for different rough rods in a test-section with diameter ratio of d /d » 0.587.

- 104 -
Important differences in the friction factor multipliers are
evident. Rectangular ribs (rod 26) give the highest values and
the photo-etched rids (rod 27) the lowest, particularly the
multistart helical ribs (see rod 16 in Fig. 32). The Stx re
sults show -^gnificantly smaller differences witn the exception
of helical ribs which give the lowest values.
2
u
I 0.4 0.1 0.7
-
-
•
» *v t
W 0
1 1 1 1
r ^ *
9 V
p
b
* <P
A
V
A
•
l-Al
•
4 i i M i to Rei * i * * • y • »io*
2
St*
1 0.1 0.0 0.7
-
4
1 1 1 1 t > 9V* tf"J
*
-
St?1?!
4 » i 7 • t |Q* R » , J I 4 * • 7 • • ,0*
Rod No. Multipliers
19 0
23 0
26 V
27 &
FIG. 31: Multipliers obtained for different rough rods in a test-section with diameter ratio of d 1/d 2 * 0.459.

- 105 -
2
fx
t 0.1 0.a 07
-
-
•
-' > 9 a
~ ! >
0 o i o . i »
•
D a
•
i" " «
a
<>
4 » * r • * 1 0 * Re, 2 * 4 i i ) i I 1 0 S
2
St*
1 0.9 0.0 0.7
-
•
' t <t . • . . .
v« ' a < V
fa
, -ti
s
-
of.
* * « 7 • » I 0 4 Re, J » » » i » • • JO5
Rod No. Multipliers
ts O
16 O
25 V
FIG. 32: Multipliers obtained for different rough rods in a test-section with diameter ratio of <*,/<* 2 • 0.459.

- 106 -
Depending on the roughness form the surfaces perform as if
they were smooth up to Re between 4.10 and 6.10 . Increase
of performance is proportionally greatest at low Re but even 5 l
at the highest Ret (10 ) the maximum values of the multipliers are still not reached.
2
fx
1 o j 0.1 0.7
•
-
•
0
• °0*
J«
* ,
sit
-
-
L
« » • i t § i o 4 Re i » i 4 » » 7 • »105
2
Stx
1 0J O.t 0.7
-
1 1
1 1 va
• i
p
-
•,|JJ
* • » • • 10* R e , » » * * • » • • I0 5
Rod No. Multipliers
19 O
23 O
26 V
27 A
FIG. 33: Multipl iers obtained for different rough rods in a t e s t - s e c t i o n with diameter rat io of d J & 2 - C.383.

- 107 -
A summary of the performances at Re = 10 is given in Fig. 34.
For some of the test series this high Re. was not reached and
the values were obtained by extrapolation. The curves of simple
(I ) and complex (I c> performance criteria can be used in
order to compare the performances of different roughness shapes
and to assess the possibility of their practical application.
Stx
FIG. 34: Summary of some representative experimental results. Relation between multipliers at Rex = 10
5 (p/e M2, w/h 3). The curves of simple and complex performance indices are given as thermohydraulic performances criteria for these results.
5.2.2.3 52H9!}D§§§_!UD££i2n§_3_3n3_2
The obtained curves for the roughness function R for different
rods can be seen in Fig. 35 for the smallest test section, T-14,
(dj/dj = 1.63) and in Fig. 36 for the test section with d,/^ =
2.09 (T-18).

- 108 -
3 i % 6 7 • 910 * 5 6 7 t 910 h* * 3 4
ROD No.
R
27 A
16 *
26
tf
15
»
23
O
19
O
FIG. 35: Roughness function R for different rough rods (d /d = 0.459).
to
9
f iY'
7 t
_L
*0'
1
9 %,
!'<> A
* A
iv -4BL-.*.?
»
A A
«]«»«,, ^S»nd irpughness(Nifcuradse)
V ^
•I I 1 J^LA I 3 4 S • 7 • 910 3 4 4 6 7 9 910 h* 2 ' 4
FIG. 36; Roughness function R for different rough rods in annulus with d./d » 0.587) (for rod symbols see Fig. 35).

- 109 -
The roughness shape has a strong effect of these values. The
lowest values were found for rectangular sharp-edged ribs.
Higher are the results for trapezoidal mechanically-cut
roughness with relatively wide ribs, then the values for rod
27 (photo-etched) and rod 15 (helical ribs with rectangular
profile) follow. The highest values were obtained for photo-
etched multistart helical ribs (rod 16). The curves are similar
for both test-sections. The values start to increase strongly
if h decreases below a value of approximately 20, and approach
the curve of "hypothetically smooth" surfaces. At h > 50 the
values stabilize and becomes independent of dimensionless rib
height.
The results from rods 19, 24 and 26 shown in Pig. 37 to 39,
demonstrate that, when it is evaluated with the new transfor
mation, the R value does not depend very much upon the annulus
diameter ratio (in effect upon relative flow thickness y /h).
2 J * 5 • 7 • 9 JO 2 3 4 5 6 7 1 91Q* h* * ' *
FIG. 37s Roughness function R evaluated from the measurements in different test sections (rod No. 19).
Test section* R
T - H
a T-18
a T-22
6

- 110 -
10 r
/
/
1
^ r
i
r
_ i .
/ ,
D
0
II
g
<
_ l _
* ^^ ^
c •>• J - 8 ' o *
""""^ * v
w D I D
' 1
JSini r>nghn*ss(Hkurac
*«V i a
_L i ,
se)
—i 3 4 S t 7 I 9 )0 3 * i 6 7 » 910 h* 2 J 4
FIG. 38; Roughness function R evaluated from measurements in different test sections (rod No. 24).
10
T»t sections R
T-14 a
T-1B o
T-22 O
7
^
/
7 7
—.
""f- .SiniJ
)0D °«
-•B-: r* 5&P JL-U.
r si ighness( h ikuraqse)
o | ^
I 2 3 A i » 7 1910 2 3 * S 6 7 » 910 n* 2 ' *
FIG. 39: Roughness function R evaluated from measurements in different test sections (rod No. 26) (for test sections symbols see Fig. 38).

- Ill -
The scatter of results is particularly small for high h*, where
as at h < 20 the scatter is significant. Additional information
on this subject can be obtained from Pigs. 40 and 41, where the
results from different rods with electro-ground ribs are
summarised. Relatively small changes of the parameters w/h
(between 2.6 and 4.4) and of the parameter (p-w)/h (between
7.9 and 11.5), but large changes in the roughness height, are
characteristic of these rods. Nevertheless the scatter of the
results is relatively small. The small effect of the w/h and
(p-w)/h parameter variations (see Figs. 3 and 4) could explain
these results, which, on the other hand, allow the conclusion
to be made that for h > 20 the effect of relative flow thick
ness can be neglected. For very low dimensionless roughness
heights the scatter is relatively high and no clear conclusions
are possible.
y t i • 7 • 9 to 3 t S » 7 • 910* h* ; 3 u
| Rod NO.
u 17 O
18 9
19 0
20 &
FIG. 40: Roughness function R evaluated for electro-ground ribs (d./d 0.587). i' 2

- 112 -
10
5
1
4
/
/
. „ L
J4 y
o
1
f
0
o
o
t
/ • •
e
ok r !
- 1
. ^
L ._
• B
s_
1
"1
' i
i 1 . 1
1 Dighn*ss(fc
j i
a
ikurae
t - - —
. 1 ,
s«)
•
3 4 S I 7 l)|Q 3 4 S t 7 • 910 ft* 2 3 -
Rod No. R
U
O 17
O 18 tf
19 O
20
a
PIG. 41; Roughness function R evaluated for electro-ground ribs (d./d. • 0.459).
The values of the roughness function G for different rods in
the test section with d./d- = 0.459 are given Fig. 42. For some
of the rods (26, 27 and 16) the curve is similar to that ob
tained with the previous evaluation (Fig. 13), for other rods
the values of G increase towards smaller h and become higher
than the values of the "hypothetically-smooth" curve. The
scatter of G values at low dimensionless rib heights is also
high, the differences in G for different surfaces being similar
to that found for the R function.

- 113 -
/
'
A
,-i—
A
V
0
t c
a *
o
y-ft A ° t *
i
^T
V
* A *
1
V V
°
, A
1
9
' , . .
, ' 1 »
1
•f **>/ 9^
i I
1 ' ._t 1 Z 3 4 5 6 7 i 9 JO 2 ) t 5 6 7 U I 0 (,• J 3 4
Rod No. G
15 W
16 A
19 O
23 O
26
V
27
£
FIG. 42; Roughness function G for different rough rods (d /d = 0.459).
The G values for different test sections (see Fig. 43 and 44)
vary much more than the R values. Considering that the values
of R have an indirect influence on G results, this behaviour
is reasonable. For h > 40 the scatter is small, but increases
significantly toward smaller h .
In Figs. 45 and 46 the values of G for different electro-grounJi
surfaces are presented. These results show that, for h > 20,
the influence of relative flow thickness is negligible. At lower
h the behaviour is similar to that found for R values (high
scatter).

- 114 -
ie
16
14
12
10
i
ts
• _ i _
1
D
^
i
0
s'
A
i i
A
O O * , >_
^ ^ r
_l
1^
A *
.,._ . i .
V,
_ J . i. 3 4 5 6 7 • 910 h* 2 i 4
Test section ' T - K 6 j A
T-18 D
T-22
O
PIG' 43i Roughness function G evaluated from measurements in different test sections (Rod No. 19).
18
16
14
12
10
-*£
A A
/4f I - 1
°9 *A
j . X
'*.*
j _ X
1 2 3 4 S 9 7 1 9 1 0 * 3 4 5 6 7 1 9 1 0 f, • 2 3 4 F1G- **'• Roughness function G evaluated from measurements in different test
sections (Rod No. 24, for test-section symbols see Fig. 43).

- 115 -18
16
H
12
10
^
y _ L _ _ l
o a
»
• *
. I
o
• o1
-.1 ,
* ' » » * >
J
X
A *
D * *
_ i_
•5
2^
a tt
o B
•>/
|
j
i
1 1 2 3 i S t 7 1 9 ) 0 2 3 t 5 8 7 » 910 J| • * 3 4
Rod No.
G
14
O
17
0 18
tf
19
O
20
e>
FIG. 45: Roughness func t ion G eva luated for o l c c t r o - g r o u n d r i b s (d / d 0 .587) .
18
16
14
12 -
10
4 1
i
,
1 • . '
0
[
9
' ' '
_ l _
9
f
0
G
J : ^ „ • • • O0«>0 ^ 0
. . . L_ ...
* * •
(
1 1
4
X
«!» v »
irr-"
1 _L
vr»V
* _,
IS
1
^
. _ l , 3 4 S I 7 1910 2 1 4 5 6 7 » 910* (,* 2 3 4
FIG. 46? Roughness function G evaluated for electro-ground ribs in annulus with dj/d, * 0.459 (for rod symbols see Pig. 45).

- 116 -
The accuracy of measurements in the "ROHAN" experiment was
acceptable considering the aim of this investigation, but too
small to determine the reliable values of absolute transformed
quantities, especially R and G. Based on the results of the
"ROHAN" experiment some important conclusions about the behaviour
of the R and G functions are possible, but considering their
high sensitivity to «..ie accuracy of measurement additional,
more-accurate, tests are needed to confirm and extend these
conclusions. An improved accuracy of results is particularly
required at low dimensionless rib heights (h < 20), where the
scatter of the "ROHAN" values is high. An extension of R and G
values for h > 100 was needed in order to obtain reliable
curves for the fully-rough region. Additional measurements were
therefore carried out with C0_ at high pressure {*> 40 bar) and
temperature (up to 1020 K). The most important data of this
experiment are:
diameter ratio of the channel d2^dl = 1 > 9
roughness shape trapezoidal ribs
rib height h = 0.11 mm
rib width-to-height ratio w/h =3.3
relative distance of ribs (p-w)/h = 9
The results at high h have been already published /51/. The
newest results are given in Figs. 47 and 48. As expected the
roughness function R has a constant value at high h . This
value does not change even for small h down to h = 1 0 . For
h < 10 the scatter of the results increases considerably, but
no systematic increase of R values can be observed. The most
important changes can be found for G values, because of the
significant reduction in the scatter of results. Over the full
range of h , the G values are smaller than for the "nypothe-
tically smooth" surfaces;, approaching the smooth curve at
h+ = 4.

- 117 -
^
1
/ .
, ' .
X
. .
V ^ *
* ^ .
u
V
_ i _
- _ . NIKURADSE for sand roughness
» w » »
t
< »
V
»
1
«IN
» * » « 7» »I0 » 1 * » • ? • » 10* 2 J * * • 7 • »10J
h
FIG. 47: Roughness function R evaluated from CO measurements (P = 40 bar, T. = 500°C).
D
^ S ! _ ¥* 1
1
•
X s .* V
/
f
1
y
* *
$
J * 9
*y
\
V
t
y ^ . . . .
z _
I
) 4 & • 7 • < 10 2 I 4 » • 7 I » |0 7 ;,• » t 4 $ « 7 « f f | 0 >
FIG. 48: Roughness function G evaluated from C0_ measurements in the AGATHE loop.

- 118 -
For practical applications the G function is usually presented
on a logarithmic scale. The results can then be accurately re
presented by the power function.
G = 4.5(h+)0'21 • Pr°-44 (5.11)
This equation can be used down to dimensionless rib heights of
approximately 7 (see Fig. 49).
30
G
10
ft
3
;
1
+*
ft}
1
>
G«4 5
Vj&
i
[ i f ]
" \ -
—«—
•Pr
•
044
I , , ,
3 4 S 6 7 • 910 3 6 S 6 7 • 910* „. 2 n
3 4 S 6 7 1910
FIG. 49: Roughness function G presented for practical use in the form of
a power function.

- 119 -
6. APPLICATION OF EVALUATED PERFORMANCES TO GENERAL BUNDLE
CONDITIONS
Fluid flow and heat transfer in rod-bundle geometry are complex
phenomena. Different numerical methods have been introduced in
rod-bundle thermal-hydraulic analysis, each of them having some
basic limitations. For design calculations subchannel analysis
is the most widely used method. This method can be successfully
applied if the axial velocity component is dominant compared
with those in other directions. In such cases simplifications
can be introduced into the transverse momentum equation, which
is particularly advantageous from the computation point of view.
The cross-section of a bundle is normally divided into a certain
number of subchannels with the rod surface as one and tlie plane
of zero shear stress as the other boundary. In the outermost
subchannels of the bundle the conditions are similar to those
in an annular channel (sector), and for inner channels the
"annular concept" can also be applied (see Fig. 50).
FIG. 50: Subdivision of enlarged sector (J»6 of total cross section) of 37-rod bundle (AGATHE HEX experiment). Similarity between the different forms of Fubchannels with annular geometry is indicated.

- 120 -
Important differences can be observed when rod bundle and simple
single-channel experimental conditions are compared. In the
case of gas-cooled bundles the quality of the rod surfaces can
be changed to achieve hydraulically-smooth to fully-rough con
ditions depending upon the channel geometry and flow regime.
Besides surface quality, changes in channel geometry and heating
of the walls are considered here. However, effects of Prandtl
and Biot numbers, which can also be very important, are not
discussed.
Two methods of application of experimental results to bundle
geometry are in common use.
6.1 Direct method
The transformed experimental friction factors and Stanton num
bers obtained with single channel geometry for a particular
roughness shape can be directly applied to other more-complex
channel geometries, assuming that the equal hydraulic diameter
concept {in fact the relative value h/d.,) is valid. Measurements
in the "ROHAN" experiment show significant deviations in the
transformed quantities for equal h/cL, values, particularly at
low Reynolds numbers /72/, but with different test-section dia
meter ratios. In practice this method gives acceptable results
if the "annular" concept can be applied to the bundle geometry
and the ratios r /r1 of the two geometries (experimental and
"equivalent" annulus geometry of the bundle) are approximately
equal. The roughness performance is very strongly dependent on
the h/d., values, but this parameter does not completely
describe the changes occurring in the channel geometry. In
spite of everything, this method is to be preferred if one wants
to keep computer codes for bundle calculations as simple as
possible.

- 121 -
6.2 Use of the roughness functions R and G
A more general transformation of the experimental results to
bundle conditions is achieved by introducing the roughness
functions R and G as the boundary conditions for the rough sur
faces. These functions provide the boundary conditions for the
analytical solutions of the core flow in any system. That is,
once these functions are known (i.e. determined in single pin
experiments), they can be employed as input data for the fric
tion factor and heat transfer coefficient calculations in the
subchannels of rod-bundle geometries.
Comparisons between R and G values obtained in different channel
geometries (tubes, flat walls, annular channels) by the current
evaluation methods, show a considerable scatter in the results.
Considering the assumptions made in the usual transformation
procedures it cannot be excluded that these differences are du^
to imperfections of the transformation methods. It was assumed
/108/, that more accurate solutions of the differential equations
of the core flow could reduce these differences to a practically
negligible amount. Using the new transformation method this
assumption was confirmed.
To analyse the performances of rough surfaces obtained by
single pin experiments, the use of R and G functions was adapted
at EIR. The same procedure as developed for the evaluation of
the annular experimental results (computer code STANTRA) is also
applied for the bundle calculations. The corresponding sub
routine FASTCAL is already incorporated in the EIR subchannel
analysis codes SCRIMP /135/ and CLUHET /136/. At present the
simplest solution (solution "a") is used in FASTCAL. To ensure
the consistency of the procedure, the values of R and G were
also evaluated by this method. For trapezoidal roughness these
values, obtained by a combination of the "ROHAN" experimental
results (for low h ) and of CO, single-pin results (for high

- 122 -
h ), are presented in Pigs. 51 and 52 (for details and the most
recent improvements in transition region see /137/ and /138/).
/s
N V
<?/ _
- I
A
1 —
._
^ • *
, ' . / ' , - '•*
1 $5] ^
^
ANNUIUS MEASUREMENTS
ROHAN ROD 17 | R00 11
* 1 *
'.1
ACATHE
•
_* -
iy
1
2 3 t S t • 10 2 3 * S * • 10' 2 3
FIG. 51; Roughness function R (curves) used in code SCRIMP in comparison with experimental single-pin results.
t 20
10 •
. • -?*>
" .**
,
P% r * T
• M l *
1
2 3 * S • 0 10 2 3 t S • • 10* 2 3 n*
FIG. 52; Roughness function G (curves) used in code SCRIMP in comparison
with experimental data.

- 123
To verify the codes SCRIMP and CLUHET the AGATHE HEX experiment
/139/, /140/ was carried out. In this experiment rod-bundle geo
metries with nominally 37-rods were tested under different flow
and heating conditions in the high pressure and high temperature
C0_ loop AGATHE. The results of these measurements have been
extensively compared with the analytical predictions of the two
codes. In order to demonstrate the quality of the computed R
and G functions a few results of these comparisons are given
here by way of example. In this partirular case the modeling of
other physical phenomena in a bundle geometry are less important
in relation to the values of the roughness functions R and G.
In Fig. 53 the comparison is given between the calculated and
20
t
15
10
05
0 0 400 800 1200
X (mm) — " CALCULATED
O MEASURED • SCRIMP — — - CLUHET
FIG. 53: Comparison between measured and calculated results (37-rod bundle of AGATHE HEX experiment, Re - 3.35-105).

- 124 -
predicted pressure drops over the bundle length, for high
Reynolds number (Re = 3.35 * 10 ). The predictions agree well
with the measurements, even demonstrating the pressure drop over
the spacers and the transition region between the smooth and
rough part of the bundle. Other conditions at this measuring
point are given in Fig. 54, where the measured and predicted
distributions of temperature over the bundle cross-section (rod
wall temperatures) including shroud temperatures can be compared.
600
TfC]
500-
400
300 -
200-
-,\
K .*....*
rrrpr D
1
P * 40 [bar]
Re» 3.35 -t09
tf • 76 [ W/cm* J
MEASURED
CALCULATED SCRIMP
CLUHET
SMOOTH
o ROUGH
•
FIG, 54; Comparison between measured and calculated 37-rod bundle results (comparisons of two axial levels , smooth and rough,are possible).

- 125 -
On the same figure the results at two axial levels of the bundle,
one in the smooth and the other in the rough part (at "he end
of the heated section), are summarised. In Fig. 55 the comparison
between SCRIMP predictions and measurements at low Reynolds
number (transition region) is possible. The calculated tempe
rature distributions in Fig. 54 and 55 agree very well with the
measured results, the deviations being always less than ± 3 %
of the total temperature rise (T -T. ). More information about w in
the - omparisons under di f ferent flow and heat flux conditions
can be found in / 1 3 7 / to / 1 4 5 / .
600
TfC].
500 -
400 -
300
200 -\
•-+-^ * »
n
H
» t - 7.0* • tO
«' - i n C*'cm'J MCASUttCO
CALCUIATC0
5M00IH
O
HOUGH
• —
FIG. 55; Comparison between calculated (SCRIMP) and measured 31-rod bundle results (on smooth and rough axial level ) ,

- 126 -
7. COMPARISON AND ASSESSMENT OP DIFFERENT TRANSFORMATION
METHODS
The relatively large number of different transformation methods
reflect clearly their common weakness: the lack of credibility
and reliability of the transformed results. To choose a common
standard transformation method or at least to reduce the number
of transformations for the final choice, the assessment of the
different transformations, based on comparison of the trans
formed results under different geometry and thermal-hydraulic
conditions, is very important. Kjellstrom /40/ succeeded in
reducing the number of transformations (the methods of:
Kemeny and Cheepers /32/, Malherbe /34/ and Hewitt /147/ have
been found unsuitable) and suggested the following methods for
further applications: simplified Hall and Maubach methods for
friction factor and simplified Hall-Kjellstrcm and Rapier
methods for Stanton number transformations. Recently, other
authors have developed new. or modified known, methods. The most
important of these methods are briefly presented in chapter 3.3.
To assess the quality of the transformation methods the results
evaluated from single-pin experiments should be considered to
gether with the application of derived basic performances (R
and c. functions) in bundle geometries. Most of the transfor
mations calculate the friction factor and Stanton number for an
inner subchannel of the annulus, and so these transformed
values are often used for comparison. Additionally the multi
pliers and the index of performance are to be considered be
cause of their practical importance. These multipliers should
be obtained by consideration of the same channel geometry for
"smooth" and "rough" values. The multipliers are often deter
mined in relation to the smooth-tube values at equal Re. This
insignificant expression does not bring additional information
to the absolute transformed values. If used for the calculation
of performance index, this expression can lead to the wrong

- 127 -
conclusions about the applicability of rough surfaces for engi
neering purposes. In spite of this, the "tube" multipliers are
still difficult to eliminate from the literature.
The roughness functions R and G are the most convenient form of
performance values but their evaluaticn from measured or trans
formed integral quantities is not unique. The influence of dif
ferent methods of R determination by using transformed friction
factor (f ) and universal logarithmic velocity distribution is
evident from Fig. 11 for different "origin" definitions. As
seen from Fig. 56, at low Reynolds numbers the choice of the
slope has quite a pronounced effect on the R value. The roughness
function G is normally determined from the integral value of
transformed Stanton number (St ) using logarithmic temperature
distribution or the similarity law of Dipprey and Sabersky. The
determination of these functions according to the new trans
formation is described in chapter 4.1
5 101 10*
FIG. 56; Influence of evaluation method on the roughness function R (measurements with rectangular ribs at Re * 8.99 • 103 from Ref. /83/).

- 128 -
7.1 Transformation methods considered in the comparisons
Estimation of the applicability of rough surfaces in practice
is possible knowing their thermal and frictional performances.
Therefore as a complete transformation procedure a consistent
combination of the two transformations, both friction factor
and Stanton number, is needed. In order to simplify their use
in the comparisons, abbreviations for different transformations
are introduced. The following transformations were chosen for
comparison:
SH/HK simplified Hall transformation combined with the
method of Hall-Kjellstrom
DDM use of logarithmic velocity and temperature distri
butions according to Dalle Donne and Meyer
WP/NP use of K factors after Warburton and Pirie combined
with the semi-empirical method of Nathan and Pirie
SH/R simplified Hall transformation combined with the
method of Rapier
H new transformation with numerical integration of
velocity and temperature distributions
SH/Ha
Hb
simplified Hall transformation combined with simpli
fied analytical integration of temperature distri
bution (solution "a")
new transformation with simplified analytical
integration of velocity and temperature distributions
(solution "b")
The results of the Hb version and used as the comparative basis.
Some representative data of the experimental investigations re
ported in chapter 5. were considered in these comparisons.

- 129 -
The detailed qualitative behaviour of different transformations
within the limits of measuring results can be seen from different
graphs of the results. In the tables, a quantitative judgement
based on the percentage deviations from the solution Hb is
possible. Besides the different important performance parameters
in the tables the corresponding values of h , r , Re, and Stn„ o l is
(transformed Stanton number of smooth subchannel) e"e also given.
Two values of f1 and St are presented. The values in the
brackets represent the results from an annulus with equal boun
dary conditions and are used to determine the corresponding
multipliers fx and Stx, as well as fx and Stx (in the brackets).
The values in brackets are not suitable for comparison with the
results of other transformations which apply the separation
method of Hall (separation of the effects of the "smooth" flow
zone from the "rough" flow zone) instead of the improved pro
cedure considering equal boundary conditions on both walls of
the annulus. To have the correct value for comparison with other
results, this separation principle was also applied in the case
of the new transformation method. For a certain roughness (given
simply with the number of the rod) the results in all three test
sections were chosen for the comparisons. (The rectangular ribs
of rod No. 26 and trapezoidal ribs of rods No. 19 and 24 are
chosen here, for more information see /148/.)
7.2 Comparison of annular channel results transformed by
different methods
7.2.1 Friction factors and Stanton numbers
The transformed friction factors and Stanton numbers for dif
ferent transformations are presented in Fig. 57 to 60 as a
function of the transformed Reynolds number. Small differences
in f., except at low Re., in largest test-section (T-22), can be
generally observed. The differences in St. are higher parti-
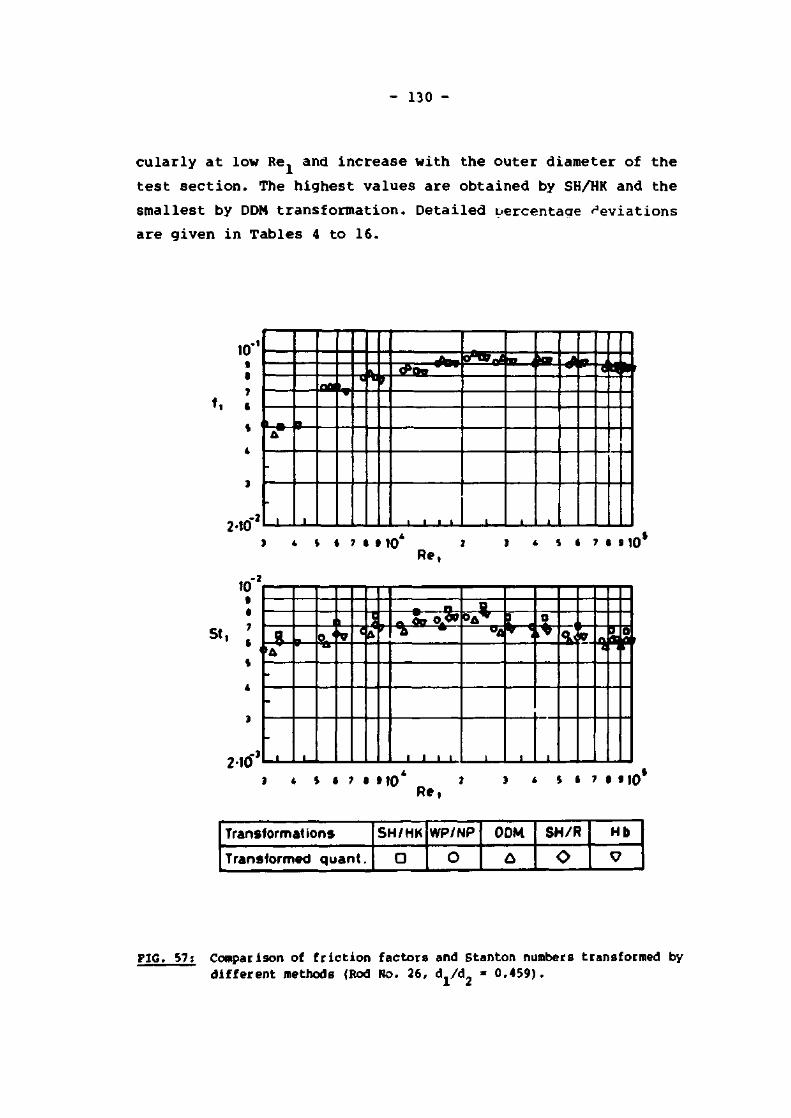
- 130 -
cularly at low Re. and increase with the outer diameter of the
test section. The highest values are obtained by SH/HK and the
smallest by DDM transformation. Detailed percentage deviations
are given in Tables 4 to 16.
10" s
7
I - * - *
2 . 1 0 - 2 L J _ L I
*\y 35* -4b* 8^B-^|tt
• • * • ' i I i I i
m
3 * S » 7 » 9 10* 2 3 * S I 7 I 9 10* Re,
10
2-10 ei
8 >A
-
-
1
V 1 * <!
e t < ft'
n n
a * * * * ^ ™ »
i i i t
Q o A *
°A
i
3
* ^
L_
O
I *
_ 1 _
%< V *A a r
} I ! i ; 1110 2 3 * 5 S 7 I 910 Re,
Transformations
Transformed quant.
SH/HK
O
WP/NP
O
DOM
£
SH/R
O Hb
tf
FIG. 57: Comparison of friction factors and Stanton numbers transformed by different methods (Rod No. 26, d /d * 0.459).

- 131 -
10" » »
7
*
2-10'
-
_ J _ _ 1 _
L L, . ,k» i * A . . < * * ^ »
i I _ I _ i_ — i —
&
U .
* 1
I * 4 * 7 I J 10* 2 J 4 S t 7 • S 10*
Re,
10 t I
a, !
-
-
_ l _ _L_
3 o ^ 5 a ' A
- . L J_LJ_
1? '
1 .-
ft **
'
. J. 3ar
. i_
I * * » 7 • tlO 2 1 4 i » 7 • »10
Re,
Transformations
Transformed quant.
SH/HK
O
WP/NP
O
DDM
A
SH/R
O Hb
9
FIG. 58: Comparison of friction factors and Stanton numbers transformed by different methods (Rod No. 24, dj/d2 * 0.587).
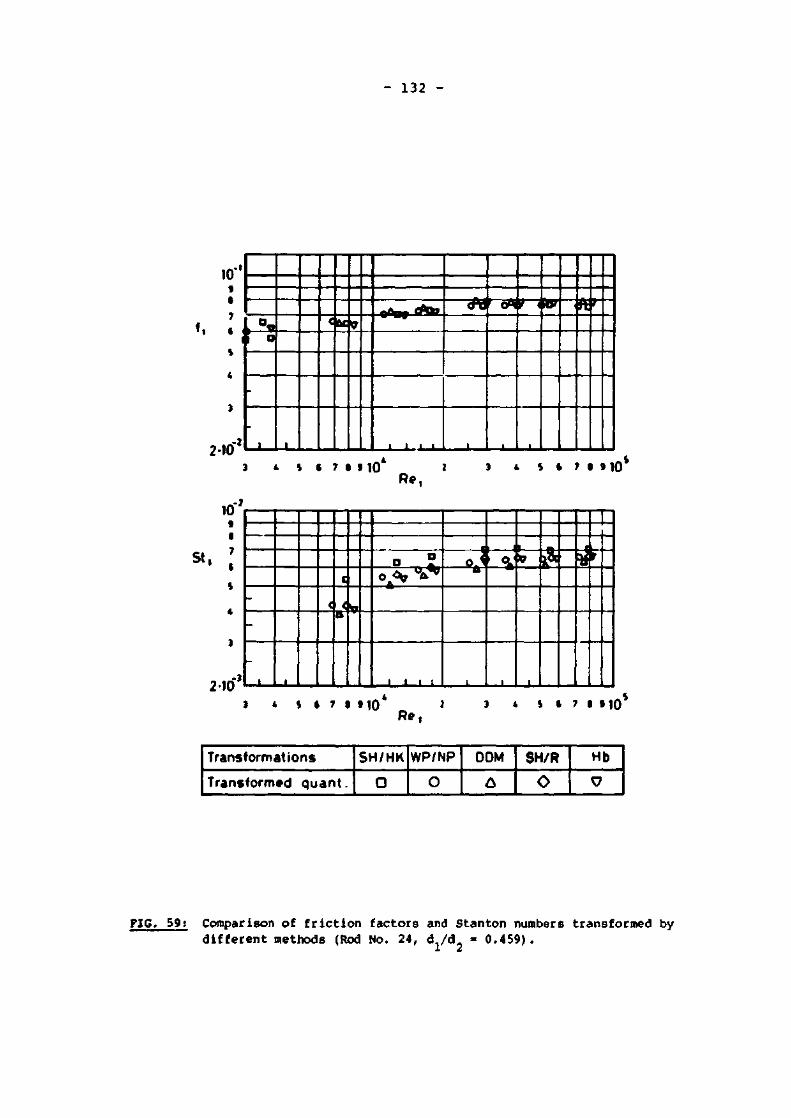
- 132 -
10" 9
7
2-10
I °v ! o
-
_ L _ -I
< u <7 0*0* **lfr
1, l . . i ._ i_
<ft3r cnr <*F
L „ _ | _JU
I ft'
3 * * t 7 • 9 10* * J * 5 » 7 I 9 10* Re,
10 9
-7
a. :
210 •3
-
-
_ i _
E
< < a
° l of. V
\f
.-I J _ i i
•J
i
i i
: oj i *
__L-
I?1
T
3 t f '
3 t S I 7 9 9 1 0 * } ' 4 S 9 7 I 9 10 * Re,
Transformations
Transformed quant.
SH/HK
O
WP/NP
0
DDM
A
SH/R
O Hb
tf
FIG. 59; Comparison of friction factors and Stanton numbers transformed by different methods (Rod No. 24, d./d = 0.459).

- 133 -
10" 9 I ?
f. I
2-10 .-i
-
-1.. _L_
fl 1 1
. X 1 I I
v<t \
— 1 —
w<k *Tt
vn 1
» A; " "0 1 * '
J * 5 » 7 » J 1 0 * _ 2 ' 4 5 * 7 1 9 1 0 * Re,
10
« , :
2-10 ci
-
-
- J _
1 0t
1 1 1 1
• o * V9*
J _ _
9 * * A
1—
9i
_ l _
& J * "S jr
J * S I 7 • 9 1 0 * » » 4 S « 7 • 9 1 0 S
Re,
Transformations
Transformed quant.
SH/HK
O
WP/NP
O
00M
&
SH/R
O Hb
tf
FIG. 60: Comparison of f r i c t ion factors and Stanton numbers transformed by different methods (Rod No. 24, d /d = 0.383) .

^ ^ ^ M E T H O D S
QUANTITIE§^-^^
R
f, • 102
A %
A %
h+
r0 [mm]
fx
f*t
A %
A %
Hb
4 . 4 5
0
1 0 . 8 8 (9.91)
O
92 .4
6 ,28
4 . 3 3
0
5 .19 (4.73)
0
SH
4 . 4 3
- 0 . 5
1 0 . 7 5
- 1 . 7
91 .5
C.28
4 . 7 9
1 0 . 6
5 .13
- 1 . 2
DDM
4 . 3 0
- 3 . 4
11 .14
2 .4
9 0 . 1
6 .23
4 .94
1 4 . 1
5 .23
0 . 8
WP
4 . 5 7
2 . 7
10 .64
- 2 . 2
88 .8
6 . 2 1
4 .66
7 . 6
4 .99
- 3 . 9
H
4 . 4 8
0 . 7
1 0 . 6 1
- 2 . 5
9 2 . 7
6 .22
-
-
5 .15
- 0 . 8
TABLE 4 Comparison of different transformation methods. Pressure drop characteristics for: 4
d./d. = 0.587, Rod No. 26, Re = 2.88'10

^ ^ ^ J / I E T H O D S
Q U A N T I T I E S ' ^ ^
G
St, • 10*
A %
A% St1$ • 103
Re, • 10-3
St*
Stxt
A%
A%
Ht>
1 0 . 2 1
0
6 .26 (5.94)
0
3 . 4 9
9 . 4
1 .80
0
2 .26 (2.14)
O
SH/HK
9 .44
- 7 . 5
6 .93
1 1 . 3
3 . 3 6
9 . 1
2 .06
1 4 . 4
2 .48
9 . 7
DDM
1 2 . 1
1 8 . 5
5 .97
- 4 . 6
3 . 4 1
8 . 5
1.75
- 2 . 8
2 . 1 0
- 7 . 1
SH/R
1 0 . 6 1
3 . 9
6 . 4 3
2 . 7
4 . 1 0
9 . 1
1.57
- 1 2 . 8
2 . 3 0
1 . 8
WFyNP
11 .14
9 . 1
6 . 2 4
- 0 . 3
3 . 4 1
8 . 4
1.83
1 . 7
2 .19
- 3 . 1
„ 9 . 8 0
- 4 . 0
6 .38
1 . 9
-
9 . 5
-
-
2 . 2 9
1 . 3
SH/Ho
8 . 7 4
- 1 4 . 4
6 .83
9 . 1
3 . 3 2
9 . 1
2 . 0 6
14 .4
2 .44
8 . 0
TABLE 5 Comparison of different transformation methods. Heat transfer characteristics for: 4
d /d = 0.587, Rod No. 26, Re = 2.88*10

^^^METHODS^
QUANTITIES^^^_ R
f, • 102
A %
A %
h+
r© [mm]
f t
f«,
A %
A %
Hb
4 . 2 0
(BASE)
9 .75 (9.82)
O
1 9 . 2
6 . 0 1
2 . 9 0
0
3 .06 (3.08)
0
SH
5.05
20 .2
10 .03
2 .9
1 9 . 2
6 .05
2 .74
- 5 . 5
3 .15
2 .9
DDM
5.13
21 .4
10 .04
3 . 0
1 8 . 6
5 .95
2 .89
- 0 . 3
3.08
0 . 7
WP
5.27
2 5 . 5
9 .84
0 . 9
1 8 . 3
5 .95
2.64
- 9 . 0
3 . 0 1
- 1 . 6
H
4 .57
8 .8
9 .74
- 0 . 1
1 9 . 7
6 .03
-
-
3.06
0
TABLE 6 Comparison of different transformation methods. Pressure drop characteristics for:
d /d = 0.587, Rod No. 26, Re = 6.26*10
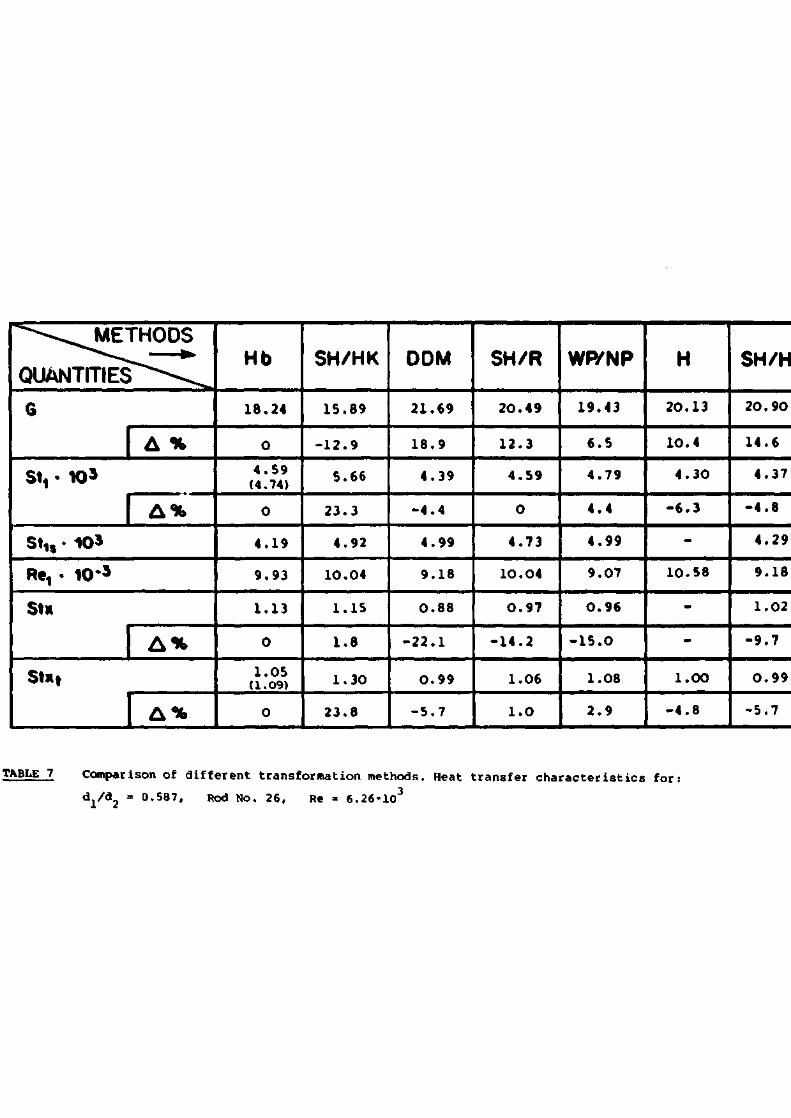
^\^METHODS
QUANTITIES""-*--^
6
St, • 10*
A %
A%
St1$ • 10*
Re, • 10' 3
St*
Stxt
A%
A%
Hb
1 8 . 2 4
0
4 . 5 9 (4.74)
0
4 . 1 9
9 .93
1 .13
0
1.05 U.09)
O
SH/HK
1 5 . 8 9
- 1 2 . 9
5 .66
2 3 . 3
4 . 9 2
10 .04
1 .15
1 . 8
1 .30
2 3 . 8
DDM
21 .69
1 8 . 9
4 . 3 9
- 4 . 4
4 .99
9 .18
0 . 8 8
- 2 2 . 1
0 . 9 9
- 5 . 7
SH/R
2 0 . 4 9
1 2 . 3
4 . 5 9
0
4 . 7 3
10 .04
0 . 9 7
- 1 4 . 2
1 .06
1 . 0
WP/NP
1 9 . 4 3
6 . 5
4 . 7 9
4 . 4
4 . 9 9
9 .07
0 . 9 6
- 1 5 . 0
1 .08
2 . 9
H
2 0 . 1 3
10 .4
4 . 3 0
- 6 . 3
-
10 .58
-
-
1 .00
- 4 . 8
SH/Ho
2 0 . 9 0
1 4 . 6
4 .37
- 4 . 8
4 . 2 9
9 .18
1 .02
- 9 . 7
0 . 9 9
- 5 . 7
TABLE 7 Comparison of different transformation methods. Heat transfer characteristics for;
dl / d2 = °*587» R o d N o« 26» R e = 6.26-103

^ - ^ M E T H O D S
Q U A N T I T I E S ^ ^ ^
R
f, • 102
A %
A %
h+
r0 [mm]
f*
* * •
A %
A %
Hb
4 . 4 9
0
8.64 (7.58)
0
8 1 . 0
7 .56
3 .57
O
4 . 7 0 (4.12)
0
SH
4 . 2 9
- 4 . 5
8 .49
- 1 . 7
7 9 . 3
7 .48
4 . 0 9
14 .6
4 .57
- 2 . 8
DDM
4 .17
- 7 . 1
8 .74
1.2
7 7 . 9
7 .39
4 .32
2 1 . 0
4 .64
- 1 . 3
WP
4 .4
- 2 . 0
8.44
- 2 . 3
7 6 . 0
7 .38
4 . 0
1 2 . 0
4 .47
- 4 . 9
H
4.34
- 3 . 3
8 .46
- 2 . 1
8 2 . 0
7 .47
-
-
4 . 6 0
- 2 . 1
TABLE 8 Comparison of different transformation methods. Pressure drop characteristics for:
d,/a, = 0.459, Rod No. 26, Re = 4.71*10

^ - - ^ M E T H O D S
QUANTITIES - ^
G
St, • 10*
A %
A% St1$ • 10*
Re, • 10-*
Stx
St«t
A%
A %
Hb
1 0 . 5 6
O
7 .33 (7.08)
0
3 . 7 0
5 3 . 3
1 . 9 1
0
2 .35 (2.25)
0
SH/HK
10 .39
- 1 . 6
7 .95
8 . 5
3 .72
5 3 . 1
2 .14
1 2 . 0
2 .55
8 . 5
DDM
12 .87
2 1 . 9
6 .92
- 5 . 6
3 .77
4 9 . 8
1.84
- 3 . 7
2 . 1 9
- 6 . 8
SH/R
1 1 . 5 8
9 .7
7 .35
0 . 3
4 .48
-
1.64
- 1 4 . 1
2 .36
0 .4
WRWP
11 .73
1 1 . 1
7 .28
- 0 . 7
3 .77
4 9 . 8
1 .93
1 . 1
2 . 3 1
- 1 . 7
H
11 .09
5 . 0
7 .46
1 .8
-
53 .3
-
-
5 .39
1.8
SH/HO
11 .27
6 .7
7 .06
- 3 . 7
3 .57
5 3 . 1
1.98
3 .7
2 .26
- 3 . 8
TABLE 9 Comparison of different transformation methods. Heat transfer characteristics for:
dl / d2 = 0 > 4 5 9» R o d No- 26' R e = 4.71«104

- 140 -
~^-^METH0DS O J A N T m E ^ ^ R
ft • 10*
A%
A%
h* f 0 K ) 3
t*
' * !
A%
A%
Hb
4.13
0
8.24 (7.30)
0
13.1
7 .09
2.33
0
2.77 (2.45)
0
SH
4.68
13.3
8.46
2 . 7
12.9
7.05
2.48
6 . 4
2.81
1 .4
DDM
4.63
12 .1
8.62
4 . 6
12.7
6.97
2 .61
12.0
2 .81
1 . 4
WP
4.83
17.0
8.43
1 .9
12.2
t.?i
2.23
4 . 3
2.72
- 1 . 8
^-•--^METHODS QUANTmES"^^ 6
SVK>3
A %
A %
SVK>3
Re,-10'3
su
St*(
A %
A %
Hb
7.88
0
7.08 (7.30)
0
4 . 5 9
13 .0
1.59
O
1.71 (1.77)
0
SH/HK
7.91
0 . 4
7.94
12.2
5 .00
12.4
1.59
0
1.90
11 .1
ODM
10.54
33.8
6 .68
- 5 . 7
4 .90
11.6
1.36
•14.5
1.58
- 7 . 6
SH/R
S.96
13.7
7.35
3 . 8
5.48
12.4
1.34
-15 .7
1.76
2 . 9
WP/NP
9.68
22.8
7.03
- 0 . 7
4 .92
11 .1
1.43
- 1 0 . 0
1.65
- 3 . 5
TABLE 10 Comparison of different transformation methods
d j / d 2 = ° ' 4 5 9 ' Rod No> 2 6 ' R e " 7.68»103

- 141 -
^—^METHODS
QUANTmES^^L R
f, • 102
A%
A%
h* r 0 K 3 3
f t
' " I
A %
A %
Hb
4.43
0
7.50 (6.76)
0
18 .1
8.24
1.85
0
3.08 (2.78)
O
SH
5.21
17 .6
6.76
- 9 . 9
16 .6
7.97
2.07
11 .9
2.66
- 1 3 . 6
DOM
4.66
5.2
7.36
- 1 . 9
16.8
7.86
2.67
44.3
2.89
- 6 . 2
WP
4 .51
1.8
7.57
0 . 9
16.4
7.93
2 .30
24.3
2.96
- 3 . 9
-^METHODS
QUANTITIES'^"^ 6
Sf^K)5
A %
A%
« V » S
R*y *>'3
St i
Stx,
A%
A%
Hb
10.52
0
5.63 (5.49)
0
4.43
28.7
1.24
0
1.60 (1.56)
0
SH/HK
7.99
- 2 4 . 0
6.73
19.5
4.76
23 .9
1.42
14.5
1.84
15 .0
DDM
11.66
10.8
5.51
- 2 . 1
4.76
23.7
1.16
- 6 . 5
1.50
- 6 . 3
SH/R
9.28
-11 .8
6.15
9.2
5.62
23.9
1.09
- 1 2 . 1
1.68
5.0
WfrNP
11.14
5.9
5.75
2.1
4.77
23.4
1.20
- 3 . 2
1.57
- 1 . 9
TABLE 11 Comparison of dif ferent transformation methods
d /d » 0.383, Rod No. 26, Re » 1.53'104

- 142 -
^ ^ M E T H O D S
QUANTmES - ^^ R
f, • 102
A %
A %
h* r0.K>*
f>
f«t
A %
A %
Hb
5 . 0 3
0
9 . 6 6 (8.83)
0
9 6 . 0
6 . 2 1
3 . 9 4
0
4 . 7 2 (4.31)
0
SH
4 . 9 7
- 1 . 2
9 . 5 3
- 1 . 4
9 4 . 7
6 . 2 1
4 . 3 4
1 0 . 2
4 . 6 4
- 1 . 7
DDM
4 . 8 6
- 3 . 4
9 . 8 4
1 . 9
9 3 . 3
6 . 2
4 . 4 S
1 2 . 9
4 . 7 2
0
WP
5 . 1 1
1 . 6
9 . 4 3
- 2 . 4
9 1 . 8
6 . 1 3
4 . 2 2
7 . 1
4 . 5 2
- 4 . 2
^^•^METHODS Q U A N T m E ^ ^ 6
St, • 10s
A %
A %
St,,-103
Re,-10-5
S f i
Stxt
A %
A %
Hb
7.63
0
8.51 (8.25)
0
3.64
5 8 . 9
2.26
0
2.79 (2.70)
0
SH/HK
8.19
7.3
8 .82
3 .6
3.65
58 .2
2 . 4 1
6 .6
2 .88
3 .2
DOM
9.34
29 .0
7.93
- 6 . 8
3 .70
54.7
2.14
- 5 . 3
2.56
- 8 . 2
SH/R
8.56
12.2
8.56
0 .6
4 .39
58.2
1.95
- 1 3 . 7
2 .80
0 .4
WRNP
9.06
18.7
8.25
- 3 . 1
3 .70
54.4
2.23
- 1 . 3
2.66
- 4 . 7
TABLE 12 Comparison of different transformation methods 4
dl/d2 = 0l587' Rod No- 19' Re * 3.22-10

- 143 -
^-^METHODS QUANmnE§^-C R
f, • 102
A%
A%
tf r « - » 3
f«
f* f
A%
A%
Hb
5.19
0
8.18 <8.3o>
0
17 .5
5.88
2 .39
O
2.53 (2.54)
O
SH
6.02
1 6 . 0
8 .33
1 .3
17.3
5 .90
2 .25
- 5 . 9
2 .58
2 . 0
DDM
6.00
15 .6
8.45
3.3
1 7 . 1
5.85
2 .42
1.3
2.58
2 .0
WP
6.24
20.2
8 .21
0 .4
16.4
5 .80
2.17
- 9 . 2
2.47
- 2 . 4
^--^METHODS ajANTrri&^t^ 6
svio3 A %
A %
st„-io* R«y 10'*
Stt
StR|
A %
A %
Hb
14.00
0 5.18
(5.34)
0
4.22
9 .5
1.27
O
1.18 (1.22)
O
SH/HK
12.65
- 9 . 6
6 .21
19 .9
4 .96
9 .5
1 .25
- 1 . 6
1 .41
DDM
17.30
23.6
4.88
- 5 . 8
4 .98
9 .0
0 .98
- 2 2 . 8
1.10
19.5 1 -6.8
SH/R
15.88
13.4
5.19
0 . 2
4.72
9 .5
1.10
- 1 3 . 4
1.18
0
WP/NP
15.51
10.8
5.29
2 .1
5.00
8.5
1.06
- 1 6 . 5
1.18
O
TABLE 13 Comparison of different transformation methods
d./d = 0.587, Rod No. 19, Re = 6.30«103

- 144 -
^--^METHODS Q U A I s m T E ^ ^
R
f, • 102
A%
A %
h* r 0 K ) 3
f*
f»,
A %
A%
Hb
4.84
O
8 . 1 1 (7.16)
O
71.5
7 .45
3.27
O
4 . 3 0 (3.80)
O
SH
4.68
- 3 . 3
7 .91
- 2 . 5
69 .7
7.36
3 .71
13.5
4.15
- 3 . 5
DOM
4.58
- 5 . 4
8.13
0 . 3
66.4
7.27
3 .91
16.6
4 .20
- 2 . 3
WP
4 .80
- 0 . 8
7.86
- 3 . 1
6 7 . 1
7.26
3 .61
10.4
4.06
- 5 . 6
^ - ^ M E T H O D S Q U A N T T f e ^ - ^
6
St, • 103
A%
A%
St,,-10*
R«y10-5
St i
Sti,
A%
A %
Hb
7.78
0
7.15 (6.82)
0
3.36
89 .8
2 .03
0
2.53 (2.41)
0
SH/HK
7.67
- 1 . 4
7.63
6 . 7
3.43
80.7
2.22
9 . 4
2.66
5 . 1
DDM
9.57
23 .0
6.76
- 5 . 5
3.48
75.4
1.94
- 4 . 4
2.33
- 7 . 9
SH/R
8.07
3 . 7
/ . 4 0
3 . 5
4.16
80 .7
1.78
- 1 2 . 3
2 .59
2 . 4
WfrNP
8.88
1 4 . 1
7.00
- 2 . 1
3.48
75 .0
2 .01
- 1 . 0
2 .41
- 4 . 7
TABLE 14 Comparison of different transformation methods
d./d = 0.459, Rod No. 19, Re = 4.31«104
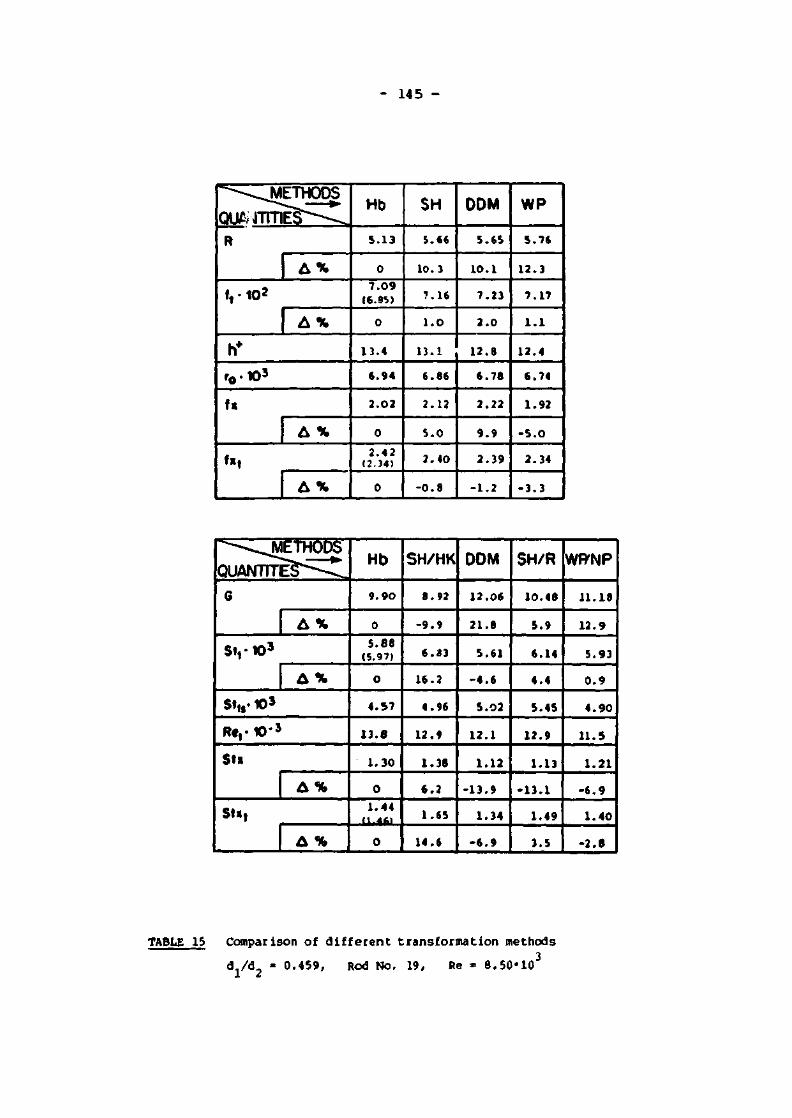
- 145 -
^"-^METHODS
R
ft • 102
A %
A %
h*
r 0 K) 3
fx
fx,
A %
A %
Hb
5.13
0
7 .09 (6.S5)
0
13.4
6.94
2 .02
0
2.42 (2.34)
0
SH
5.66
10.3
7.16
1 .0
13.1
6.86
2.12
5 . 0
2 .40
- 0 . 8
DDM
5.6S
l O . l
7 .23
2 . 0
12.8
6 .78
2 .22
9 .9
2 .39
- 1 . 2
WP
5.76
12 .3
7.17
1 .1
12.4
6.74
1.92
- 5 . 0
2.34
- 3 . 3
^--^METHODS QUANTTTE^^ 6
SyK)3
A%
A %
St„-10'
RtyK)-3
S»x
Stx,
A%
A%
Hb
9.90
0
5.88 (5.97)
0
4.57
13 .6
1.30
0
1.44 11.461
0
SH/HK
8.92
- 9 . 9
6 .33
16.2
4 .96
12 .9
1.38
6 .2
1.65
14.6
DOM
12 .06
21 .8
S.61
- 4 . 6
5 .02
12 .1
1.12
- 1 3 . 9
1.34
- 6 . 9
SH/R
10.48
5.9
6.14
4.4
5.45
12 .9
1.13
- 1 3 . 1
1.49
3.5
WRNP
11.18
12.9
5.93
0 . 9
4 .90
11.5
1.21
- 6 . 9
1.40
- 2 . 8
TABLE 15 Comparison of d i f f erent transformation methods
d /d = 0.459, Rod No. 19, Re = 8.50*10

- 146 -
""---^METHODS QUAtsnTTES^^L R
f, • 102
A%
A%
h* r 0 1 0 3
f t
f»,
A%
A%
Hb
4 . 7 1
0
7.12 (6.SI)
0
15.6
8 .08
1 .70
0
2 .82 (2.Sfl)
O
SH
5.68
20.6
6.33
- 1 1 . 1
14.2
7.59
1.85
8.8
2.38
- 1 5 . 6
DDM
5.12
8 .7
6 .89
- 3 . 2
14.4
7 .67
2 .39
40 .6
2 .59
- 8 . 2
WP
4.86
3.2
7.19
1.0
14 .1
7.76
2.10
23.5
2.70
- 4 . 3
r*--^^METHODS QUANTITEr*-^ G
St, • 103
A%
A %
Sf„-103
Re,-*)"3
St*
Stxt
A%
A %
Hb
8.89
0
6 . 1 0 (6.01)
0
4 .63
24 .7
1.32
0
1.67 (1.65)
0
SH/HK
7.06
- 2 0 . 6
7.05
15.6
4.92
2 0 . 1
1.43
8 .3
1.86
11.4
DOM
9 .91
11 .5
5.96
- 2 . 3
4 .92
2 0 . 1
1 .21
- 8 . 3
1.S8
- 5 . 4
SH/R
7.57
-14.9
6.78
11.2
5.77
20 .1
1.18
-10.6
1.79
7.2
WBWP
9 .71
9 .2
6.16
1.0
4.94
19 .8
1.25
- 5 . 3
1.62
- 3 . 0
TABLE 16 Comparison of different transformation methods 4
d./d = 0.383, Rod No. 19, Re = 1.36*10

- 147 -
2
fx
1 0.9 0.8 0.7
-
-
-
- < I
1
i i
• i i i
A
k°° S*
7
1
V
I
Lv -
-
i i
i J_
* S ( 7 • 9 10 Re t 2 » * 5 * M MO"
Stx
0.9 0.8 0.7
-
11
11
t
ti \
*•
e
-
i '4 r c
W:
* * » • » 1 0 4 Re , » 3 4 4 t 7 • 9 103
Transformations
Multipliers
SH/HK O
NP/WP
O
DDM A
SH/R
o Hb
tf
FIG. 61; Comparison of mul t ip l i ers obtained by di f ferent transformation methods (Rod. No. 24, d /d = 0.587) .

- 148 -
2
fx
1 0.9 0.8 0.7
_
-
-
_ <
!
\ '
o
*v 1*
1 1 1 1
_ . . . _ .
foto
T _
i
i
%$
!
'~i \\\
i
-
-
* s t 7 • 9 io 4 Re | ' J * s • ? i 9 io5
Stx
1 0.9 0.8 0.7
-
11
11
:
- Bio
>r a . i . i 1
a
i< **£ v< • <
• V
-
_
* * • ' • » JO 4 R e , : 3 * * i r • 9 1C-
Transformations
Multipliers
SH/HK
O NP/WP
O
DDM A
SH/R
O Hb
9
FIG. 62: Comparison of multifliers obtained by different transformation methods (Rod N o . 24 d j ^ = 0.459)

- 149 -
6
S
4
3
2
fx
1 U.9 0.8 0.7
-
-
•
1 1
1
1
1
r i
I
t
t
1 . o« o °
A *
v *
A D ' D
1
1 t 1 I 1
ft *
"
A *
-
t » * 7 « 9 io Re • 2 9 4 s i 7 i » i o
2
Stx
1 0.9 08 0.7
-
J.UJ
.
c
1 I I I 1
a o
_ L _
-
4 S I 7 I • 104 Re , i » 4 * * 7 • » 1 05
Transformations
Multipliers
SH/HK
O
NP/WP
0 DDM
6
SH/K j Mb
O 1 v
FIG. 63; Comparison of mul t ip l i ers obtained by di f ferent transformation methods (Rod No. 24, d /d * 0.383) .

- 150 -
7.2.2 Multipliers and indices of performance
For multipliers related to the smooth tube values, fx and stx
(given in /148/ only), the same conclusions as for the absolute
values of the transformed friction factors and Stanton numbers
can be made. Much more important are the results in Figs. 61 to
63, showing a considerable effect of the annulus diameter ratios.
In the largest test-section (T-22) large deviations between the
transformations can be observed for both friction and Stanton
number multipliers. The highest friction multipliers are always
calculated by the DDM method. Systematic and significant are the
deviations in Stx for the SH/HK, and SH/R methods, giving the
highest and lowest values respectively. At Re < 10 some trans
formations (DDM, SH/R, WP/NP) result in the multipliers being
lower than 1, which considerably reduces the credibility of
these procedures. This is particularly evident when the per
formance indices are lower than 1 (Fig. 64).
su
09
O.i
0.7
0*
0»
3 .
•
-
o
1 1 1 1 1
1
0
_i
o
l _ .
V
_ L _
1
p
A
V
O
0
fe
7 o
o o A
A
t i l l J _ _
D
9
A
1
V
o
A
_ l _
I C
o A
C
w 0
A
1 0
9 'v o o
1 A A
9
i
10» S 6 1 9 9 10* R»1
4 i 9 7 9 t 10*
tr«n»form»tion»
lp • * < • ' / ( »
SH/5HK
0
W / N P
o 00M
A
Hb
V
FIG. 64; Comparison of performance indices obtained by different transformation methods (Rod No. 26, d /d = 0.459)

- 151 -
7.2.3 Roughness functions R and G
The important influence of the transformation on the values of
the roughness functions can be found if the results of Fig. 39
and 65 are compared. All other transformations show a consi
derably higher influence of the diameter ratios (relative flow
thickness) than the Hb method. These influences can also be
observed for h > 50.
10 1
A [?
• I r /
•
r i i
' i
y i *
L_I_
/
•
•
i i 1
» I I
0
o 0
•
< o • 0
• © 1 1 r m +
•
,
-J
b o to
• —
•
•
i j
v£ i V
i
!
i
i
i • •
rbughness(N
T |
ikurac
i
i
i -L •I
, 1 ,
se)
i
3 4 S 6 7 8 910 3 * 5 i 7 8 910 h ' 2 ) <.
TRANSFORMATION
R T - K T - : e T - 2 2
SH O
• a
WP
o • 9
DDM a * A
FIG. 65; Comparison of roughness functions R obtained by application of different transformation methods to the results of different test sections (Rod No. 26).

- 152 -
The values of G for different transformations differ considerably
and their scatter exceeds that of R (see Fig. 66). Considering
that G is indirectly influenced by the value of R, this behaviour
is reasonable. The curves for different transformations are
similar but, at egual h , the differences are large and exceed
for most of the transformations at h < 10 the "hypothetically-
smooth" prediction (2.51n h+ + 3.1).
Percentage deviations of R and G values are evident from the
tables 4 to 16.
The R and G functions, evaluated from more-accurate additional
results obtained in the single pin "AGATHE" test-section, are
determined only by the two methods DDM and Hb. Whereas R values
at h > 20 do not have a large scatter (see Fig. 67), signifi
cant differences can be found in G values (see Fig. 68). The
values of G, calculated by the new method, are systematically
lower for all h and do not exceed the "hypothetically-smooth"
prediction.
18
16
14
12
10
A&
^ -
«<t
fc
^—y
o
Transformations SHK NP DDM SH/R Hb
G I P 1 O • ' • I • I . I 'l I M l
O I C I I I I
t s e 7 • 9 io 3 4 5 8 7 * 910
FIG. 66: Influence of the transformation method on the heat transfer roughness function G (Rod No. 26, d./d, * 0.459).
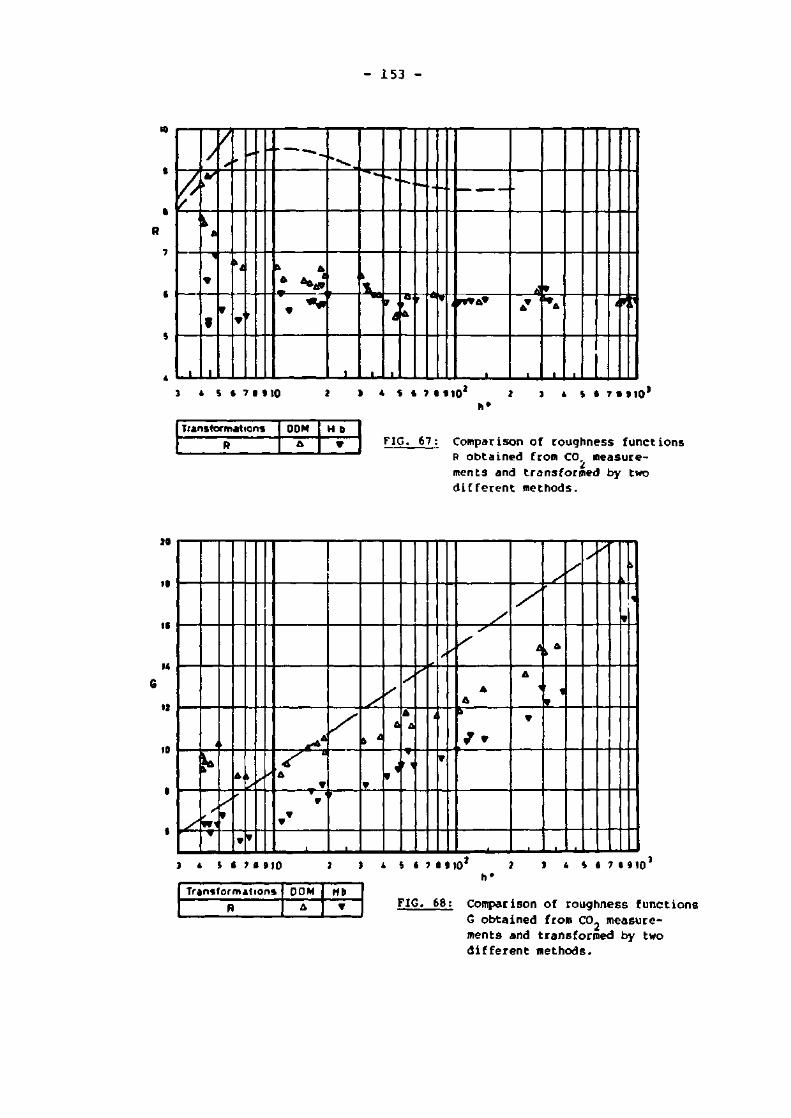
- 153 -
•0
fi
_ J _
/ . 1?
1
5T
, ' v
_L
> .
* A * A*J
\ *
,
T
L_
k
_ J _
• " " * -
4 *
_l_ _
- - .
"°* (rrrft»
- »
A 9
* * *
_ l _
i*P
. » _ . _ . _ J 4 S I 7 1 1 1 0 3 * 5 * 7 • 910 2 3 4 S C 7 • 910
Transformations
R
DOM
& H b
V FIG. 67: Comparison of roughness functions R obtained from CO, measurements and transformed by two different methods.
20
10
10
14
12
10
I r /
t \
* . ,
y ' . <
**
V r
/
'
/
t *
w
A A a
y s*
/
A A
7* »
t
/
t
A \
V
,
^ '
V*
V
1
t
2 4 S I 7 1 1 1 0
Transformations
R
DOM A
Hb
»
3 4 5 6 7 8 910 2 0*
3 4 5 ( 7 1 9 1 0
FIG. 68: Comparison of roughness functions G obtained from CO, measurements and transformed by two different methods.

- 154 -
7.3 Comparison of different predictions for different bundle
geometries
The results of the annulus experiment, evaluated by the new
transformation have been applied in the two subchannel analysis,
steady-state, single-phase, rod bundle codes SCRIMP and CLUHET.
Comparison with the results of some other available rod bundle
codes has been performed during international participation in
extensive benchmark calculations /149/. Detailed comparisons of
the results were carried out at EIR before, during and sometimes
af -?r the benchmark meetings, in total 4 bundle geometries
were considered in these calculations: 19-rod bundle (KfK, /150/,
12-rod 3R-2 bundle (KfK /151/), 7-rod bundle (WHPDL, /152/) and
the 37-rod bundle of the "AGATHE HEX" experiment. The task de
finitions of the "AGATHE HEX" experiment are given in /153/ to
/155/, and the detailed results of calculations with the two
EIR codes can be seen in /156/ to /158/. The review of these
activities, together with summary of all 37-rod bundle predictions,
is given in the EIR final benchmark report /149/. The two EIR
codes perform well, successfully demonstrating the application
of the new transformation method to these bundle geometries.
7.4 Assessment of the results of different transformations
The basic data for the assessment of different transformation
methods are the transformed results of the single-pin experi
ments. The conclusions from the benchmark calculations given in
/149/ are also considered here.
7.4.1 Simplified Hall and Hall-Kjellstrom transformation
The calculation of friction factors is slightly too optimistic
but generally good (deviations less than - 3 %) except at small
Reynolds numbers, where the strong effect of relative flow

- 155 -
thickness also exists. This method generally produces consider
ably higher transformed Stanton numbers (up to + 10 %) and is
very sensitive to changes in relative flow thickness. Correspond
ing multipliers (Stx) are generally overpredicted, leading to
high indice.-i of performance and can therefore only be used for
relative evaluation of different rough surface results.
The roughness parameters do not show large deviations at high
Re (< + 5 % for R and within + 10 % for G), but the quality is
strongly reduced at low Re (up to + 21 % ) . In spite of partial
success ana being a simple calculation procedure this transfor
mation cannot be generally recommended for further use, but may
be suitable for simple calculations in particular cases.
7.4.2 Simplified Hall and Rapier transformation
This combination of simple transformations was introduced in
order to combine the relatively good frictional results obtained
by simplified Hall transformation, with the simple procedure of
Stanton number transformation according to Rapier. The Stanton
numbers obtained are very good in the whole Reynolds number
range. Unfortunately a strong effect of the relative flow thick
ness is observed. Applied to the smooth subchannel of an annulus,
the calculated Stanton numbers are very low, resulting in low
values of the Stanton number multipliers and performance indices.
The values of parameter G show high deviations and are strongly
affected by annulus diameter ratios, but the determination of
the G function was not originally considered.
Recent modifications /109/ would improve the results using the
simple Rapier method in combination with a more sophisticated
friction factor transformation. However, an improved momentum
transport solution should consequently be followed by a similar
procedure for the heat transfer transport.

- 156 -
This transformation cannot be suggested as a unique standard
method but can be very useful in particular cases because of
its simple calculation procedure.
7.4.3 Warburton-Pirie and Nathan-Pirie transformation
In the full range of Reynolds numbers the deviations of friction
factor and Stanton number are within ± 4 % (relative to Hb). The
effect of the relative flow thicknesses is low and can be practi
cally neglected. Except at low Re., the results for multipliers
and performance indices are reasonable. This method is origi
nally not based on the use of roughness functions, therefore not
too much attention should be paid to the large deviations of
these values.
The important advantage of this method is its simplicity, parti
cularly for Stanton numbers, with no significant reduction of
accuracy of the transformed results. However, because of the
empirical basis of the method, the validity of the transforma
tion for other than rectangular ribs still has to be confirmed.
The method is strictly valid only for the evaluation of annular
experimental results. It can also be used in rod bundle calcu
lations, particularly for geometrical conditions in the sub
channels which are very similar to those of single-pin tests,
by application of the equivalent hydraulic diameter concept.
The final conclusions made for the simplified Hall and Rapier
transformation also apply here.
7.4.4 Dalle Donne and Meyer transformation
This transformation gives good friction factors but these are
dependent upon the relative flow thickness. In comparison with
the results of other transformations the deviations are larger
and systematically negative for Stanton numbers. The friction
factor multipliers are generally the highest of any method (up
to 15 % higher than for Hb) and at low Re. are strongly affected

- 157 -
by relative flow thickness. Stanton number multipliers are only
slightly lower at high Re (up to - 5 % ) , but the deviation in
creases at low Re , particularly towards lower relative flow
thickness (also values less than 1 are observed!). The perfor
mance indices obtained are low, reaching, at low Re.. , values
lower than 1, and are therefore only of comparative importance.
The roughness functions perform differently at high Re . Where
as the R values do not deviate significantly from th^ Hb method
(up to - 4 % only) the values of G are up to 25 1 higher. At
low Re. a strong effect of relative flow thickness is observed
for both roughness functions.
The DDM transformation generally gives good results for trans
formed friction factors, but also gives the lowest heat trans
fer performance, which can be accepted as a slightly conser
vative prediction. A great number of data for rectangular ribs
have been transformed by this method and the results reported
in the form of roughness functions. The strong effect of re
lative flow thickness was compensated by the correlation of
these results. The method still needs to be approved for other
roughness forms (new correlations required for each new rough
ness form). At low Re. (low h ) the roughness functions obtained
deviate considerably from the boundary values of dimensionless
velocity and temperature. The results of calculations for uni
formly heated bundles show that this method can be success
fully applied to bundle geometries, using these correlations
for the R and G functions (noting that this G function corre
lation must be restricted to use in the DDM method). Applied
in other transformation methods, these R and G correlations
cause a certain decrease of heat transfer performance which
may produce results which are too pessimistic. In the case of
different heat fluxes in subchannels and use of other-than-
correlated roughness forms, the results must be considered with
some caution. The multipliers and performance indices seem to

- 158 -
be less reliable. Without additional confirmation, these values
cannot be recommended for use in the assessment of the practical
applicability of rough surface.
7.4.5 New transformation
The results of the new transformation are chosen as a basis for
comparison. The extensive comparison of results in annular as
well as rod-bundle geometries shows clearly some advantages of
the new method. These can be found particularly at low Reynolds
numbers (reasonable curves of multipliers, of indices of per
formance and of roughness functions) and for different relative
flow thicknesses (reduction of this effect to an acceptable,
practically negligible level). The results in rod-bundles con
firmed the favourable single-pin results, showing additionally
the advantage of the consideration of different heat fluxes of
the neighbouring rods in the subchannels.
From the three versions of the new transformation, solution Hb
seems to be the most convenient. This solution represents a
reasonable compromise between the calculation procedure and
available experimental information. The numerical integration
needs much more computing time, but the values of eddy diffusi-
vity and turbulent Prandtl number must be approximated (based
on very limited experimental information), which results in a
limitation of the solution accuracy. The solution SH/Ha is the
very simple one but can be (as demonstrated) successfully
applied in bundle codes. The use of SH for friction factor cal
culation has a negative influence at low Reynolds numbers as
well as at different relative flow thicknesses.
The very important advantage of the new method is its additional
development potential. Further improvement of the quality of
this method can be achieved by reducing the uncertainties of
experimentally determined coefficients. With more accurate

- 159 -
values for eddy diffusivity and turbulent Prandtl number the
numerical integration would probably be reasonable and would
considerably improve the reliability of results under different
complex geometry, flow and thermal conditions.

- 160 -
8. CHOICE OF ROUGHNESS FOR PRACTICAL APPLICATIONS
The choice of roughness for practical use should generally
evolve from an optimisation procedure considering all the fac
tors which could significantly influence the efficiency of the
heat generation and transfer processes. These factors are nor
mally not independent, and so such a procedure is very complex.
The range of variables may conveniently be reduced by intro
ducing some criteria which would include the limits of the
design features. Since the behaviour of different designs can
not be accurately predicted, a simplified study which considers
the influence of the dominant factors can be used as a guide.
Heat transfer, pumping power and properties suitable for the
particular processes are the most important and therefore most
often used parameters for the assessment of power generation
systems. The criteria for the choice of a roughness suitable
for gas-cooled reactors (particularly GCFR),as developed and
suggested by EIR /61/, /131/, are summarised here. These can
be divided into three groups: thermal-hydraulic performance,
technological and operational criteria.
8.1 Thermal-hydraulic performance criteria
The experimental information needed for the choice of roughness
from the thermal-hydraulic standpoint can generally be obtained
from single-pin or bundle experiments. With the single-pin (annu
lar) experiment well-directed investigations of different mo
mentum and heat transfer phenomena can be carried out. The in
fluence of these individual phenomena cannot be separated under
bundle geometry conditions. With evaluation of the single-pin
results the single performance index I can be obtained. This
index only considers the performance in a single channel and
is not satisfactory for assessing the economic use of rough
- 161 -
surfaces either in more-complicated flow geometries or for a
complete coolant circuit. The results of the rod-bundle tests
are used as a check of the validity of the models assumed for
the momentum and heat transport in rod-bundle computer codes.
Comparisons between the predicted and measured bundle conditions
are therefore of decisive importance.
For the assessment of the practical application of rough surfaces
in heat transport processes, a new complex criterion was deve
loped, which considers the whole coolant loop and is based on
the earlier work of Wilkie /159/. This criterion gives the ratio
of the required pumping powers at constant thermal conditions
with a reference surface (channel wall) which may be smooth or,
more generally, any other specified rough surface. Consider
the particular conditions of a coolant loop (e.g. those of a
GCFR with only one part of the total bundle length roughened).
The total pressure drop in the primary circuit of a gas-cooled
reactor is a sum of individual pressure drops:
AP. = AP. T1 + AP. T_ + AP. . + AP (8.1) 1 i,Ll i,L2 i,in ex
The first and second terms on '.he right-hand side of equation
(8.1) represent the pressure leases in the part of the core with
smooth rod surfaces over the length L. (entry, outlet and in
particular cases also a part of the heated length), and in the
rough part of the core over the length L,. All other pressure
losses in the core are combined in the third term which can be
subdivided as follows:
AP. .„ = AP + AP. (8.2) i,in i,sg i,v
where AP. is the pressure loss over the spacers and AP. i,sg i,v
summarises the pressure losses caused by contractions, expansions

- 162 -
and changes of the flow direction. The last term in equation
(8.1) contains all other pressure drops of the coolant loop
(outside the core section of the circuit). Assuming constant
thermal power and coolant mass flow, these external pressure
losses are constant.
For usual design conditions of fuel elements and equal thermal
efficiency (T -T,)/(T--T.) the following relationship bet-w,m i / i
ween the important variables can be obtained from Ginn's equation
/160/:
St U L St U L (8.3)
For the same lengths and diameters of the rods in smooth and
rough bundles the ratio of the respective Stanton numbers is
proportional to the ratio of the channel cross-sections
St (8.4)
At the same thermal power and mass flow, the mean temperature
increase of the coolant is constant. Using the standard friction
loss expression, the pressure losses in smooth and rough channels
with length L- are respectively:
AP s,L2 2 • 2
s 2 dhg p s (8.5)
AP r,L2
u2 ' 2 • f „ „ — ( m / A ) r 2 d. p r'
hr y
(8.6)
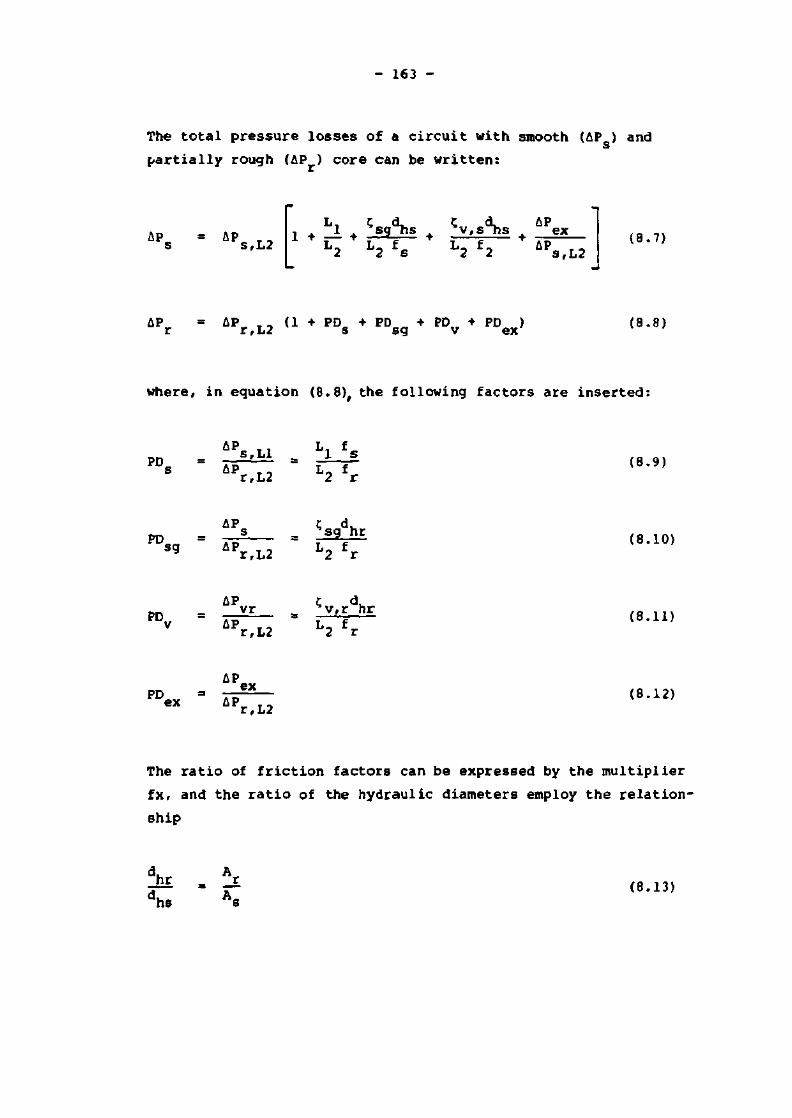
- 163 -
The total pressure losses of a circuit with smooth (AP ) and s
partially rough (AP ) core can be written:
AP = AP s,L2
L. t. d. C d. AP 1 + -L + sg "s v,s hs ex
L2 L2 fs L2 f2 APS,L2
(8.7)
APr = APr,L2 (1 + P Ds + PDsg + PDv + PDex> (8"8)
where, in equation (8.8)r the following factors are inserted:
PD
PD sg
PD
APS,L1 APr,L2
AP S
APr,L2
AP vr APr,L2
=
=
L l f s L 2 f r
sg hr L 2 f r
5 dv, v,r hr
2 r
(8.9)
(8.10)
(8.11)
AP. PD ex ex AP
(8.12) r,L2
The ratio of friction factors can be expressed by the multiplier
fx, and the ratio of the hydraulic diameters employ the relation
ship
hr 3hs
(8.13)

- 164 -
Considering equations (8.4) and (8.9) to (8.13), the equation
of pressure drop in a "smooth" circuit can be finally written
as:
A P s * A P s , L 2 l+fx(PD +C PD )+C i r -PD + ^*-^PD s v v sg Stx sg 3 ex
(8.14)
For the assessment of the rough surface performance the ratio
between the pressure losses in circuits with smooth and partially-
roughened rod bundles is important. This ratio represents the
new complex performance index:
AP % +Stx (PD +C PD )+Stx C PD +PD T = _ ? . = |x s v v sg sg ex pc AP 1 + PD + PD + PD + PD v ' r r s v sg ex
The factor C is the ratio between the spacer pressure drop
coefficients of the "smooth" and "rough" rod bundles respecti
vely. Based on measurements /92/, /93/ the value of this factor
is about 0.7 but as a first approximation the value C = 1
can be taken.
In the factor C the influence of different layouts of the fuel
elements is considered. For gas-cooled bundle geometries this
factor varies between 1 and 1.2, so a conservative value of 1
is also a good approximation here. Comparison between the curves
of simple and of complex (much flatter) performance criteria,
as well as their influence on the choice of roughness, is de
monstrated in Fig. 34.
The procedure for the determination of thermohydraulic criteria
and a review of EIR activities in this field is schematically
shown in Fig. 69.

- 165 -
THERMOHYDRAULIC CRITERIA
1 BASIC CHARACTERISTICS FROM EXPERIMENTAL INVESTIGATIONS
1 L. ..• „ 1 ]
1 INVESTIGATIONS OP SINGLE EFFECTS
1
EVALUATION OF RESULTS AND TRANSFORMATIONS
'
1 J
" >
SIMPLE CRITERION
,
1 INVESTIGATION UtIDER BUNDLE CONDITIONS
COMPARISON
Experiment - Analytical predictions
DEVELOPMENT OF SUITABLE COMPUTER CODES
1 ASSESSMENT :? \ 1 APPI.T^AfTLITY |
^^^^J I PRACTICAL USE
CONSIDERATION OF THF APPLICATION CONDITIONS
- GEOMETRY
- PROPERTIES (Pr)
- EFFECT OF Bi
1 • COMPLEX CRITERION WITH
CONSIDERATION OF WHOLE
COOLANT CIRCUIT
1 ,
FIC. 69: Thermohydraulic criteria and their consideration (assessment of
applicability of rough surfaces).
8.2 Technological criteria
In the "ROHAN" experiment different roughening methods were
used to produce nominally rectangular ribs. It was observed
that the rib profile and surface quality depended considerably
on the roughening method.
The photo-etched rib had an ill-defined trapezoidal profile
with the roots and tips rounded off. The tape-covered and
etched surfaces were very similar but had relatively sharp
edges at the tips of the ribs. For all etched surfaces a secon
dary roughness like sand roughness was observed. This secondary
roughness on the one hand increase their thermalhydraulic per
formance but could on the other hand also influence their

- 166 -
corrosion and erosion behaviour under operational conditions.
As long as the possible corrosion and erosion effects have not
been investigated the use of ribbed surfaces with a significant
secondary roughness is questionable.
Well-defined ribs were only obtained by mechanical cutting and
electro-grinding. The mechanical roughening process gave the
best reproducibility of ribs, but somo localised distortion of
the cladding could occur. In particular the inner wall of the
cladding can be deformed (damaged) due to the high cutting
forces needed. This can lead to considerable changes in local
conduction which is very important at high heat fluxes in the
rods. The electro-grinding procedure, developed at EIR, gave
acceptable tolerances in rib dimensions, avoiding significant
cutting forces. Considerable variation of rib height around
the perimeter could be obtained due to local eccentricity of
the rods during the cutting procedure. Cutting problems are
particularly serious for tubes with thin walls.
From experiences with different roughening processes, the follo
wing absolute tolerances for the rib dimensions can be re
garded as attainable limits:
rib height + 0.02 / - 0.01 mm
rib width ± 0.05 mm
rib pitch +0.1 mm
These tolerances can be very important for small ribs typical
for GCFR application. Recently, a further improvement of small
rib production was achieved in the Technological Development
Laboratory at EIR producing rib heights within ± 0.1 mm. The
other two dimensions, width and pitch, are not so important and
therefore need no further development. For relatively high ribs
(i.e. lower relative tolerances) the thermohydraulic performances
are less sensitive to the deviation of the rib dimensions from

- 167 -
the nominal value.
Because of the increased channel friction and thermal coeffi
cients, the use of rough surfaces has an indirect influence on
the design and construction of heat exchangers. For equal
thermal efficiency the pitch of rough rods can be increased.
In the case of high heat fluxes and equal mechanical tolerances
this results in a more favourable temperature distribution than
is to be expected for a closely-pitched smooth-rod bundle
design.
The most important technological criteria are still the manu
facturing costs. The solution of all the above-mentioned pro
duction problems leads to high manufacturing costs, which is
in most cases of decisive importance for the application of the
rough surfaces. Recent fabrication experience for most of the
roughening methods is limited to laboratory dvelopments. in
formation on the comparative costs of different procedures if
applied to the production line is insufficient for their final
selection.
8.3 Operational criteria
No experience regarding the operational behaviour of rough sur
faces can be reported. Depending on the coolant, the influence
of corrosion and erosion can be dominant. It is usually assumed
that by using helium as a coolant these effects can be neglected.
Because of the great influence of shape changes and of rib di
mensions on the thermohydraulic characteristics, this statement
must be re-examined. As long as no results from experimental in
vestigations are available, at least an indirect evaluation of
possible effects should be carried out in order to reduce and
control the risk. A suitable rib profile with rounded ribs of

- 168 -
relatively high w/h and h/d., ratios would appear to minimize
the risk of performance-induced changes.
For single-pin test conditions the temperature gradients in the
canning caused by axial variation of the heat transfer coeffi
cient are negligible. Under reactor conditions (thinner canning,
higher fluxes) these axial temperature gradients, particularly
those at the onset of roughness, may produce significant thermal
stresses. A suitable roughness profile, with wide ribs and a
stepwise increase of roughness height to the nominal value (in
the transition region from smooth to rough surfaces) could be
applied to decrease these gradients to an acceptable level. Be
haviour under radiation, and other nuclear, chemical, metal-
urgical and mechanical conditions, may also be of importance for
the choice of the roughness.
8.4 Assessment of the possibilities of rough surface application
To assess the possibility of practical application of rough sur
faces, decisive criteria must be determined which may however
change depending upon their particular use. The wider application
of rough surfaces in thermal engineering is limited, in parti
cular by the additional roughening costs. The heat exchange sur
face is generally decreased (reduced length and number of tubes
needed, but increased diameter of heat exchanger and the re
quired pumping power for constant thermal load is also smaller.
However, the general conditions must be fulfilled, that the
economic gain of the reduced heat transfer area and pressure
losses must be at least as high as the additional costs of
roughening. For a relatively poor coolant one should attempt to
fulfil the following requirements or conditions for an economic
application of rough surfaces (not necessarily in order of im
portance) :

- 169 -
- high power density
- high temperatures of the coolant
- reduction of the pumping power
- reduction of the structural material
- low roughness production costs
A typical case for application is the core of a GCFR, where four
of these requirements are fulfilled. Based on the results of
the "ROHAN" experiment a roughness suitable for use in the GCFR
was suggested. This roughness geometry, presented in Fig. 70,
was also chosen for the tests in the "AGATHE HEX" rod-bundle
experiment.
p . 1.1 J 0.1 mm «,.ftJ5sftl»mm
r,.0.25t0lMmm
FIG. 70; Boughness form used in AGATHE HEX bundle experiment.
Recently^ many attempts have been made t o develop a low-cost
roughening procedure. F i r s t r e s u l t s a re very promising so t h a t
the chances of rough surfaces being appl ied in conventional heat
exchanger design begin to appear s i g n i f i c a n t l y b e t t e r .

- 170 -
9. CONCLUSIONS
The promotion of local turbulence by the application of artifi-
ally roughened surfaces is a suitable method for the augmenta
tion of convective turbulent heat transfer. To use artifially
roughened surfaces in thermal engineering and design, their
heat transfer and frictional characteristics have been exten
sively investigated by different research workers. In this
report suitable investigation methods and the present state of
knowledge have been reviewed, based on the information available
to the author and considering specifically in more detail the
authors own contributions in the field.
Particular attention has been paid to the evaluation of the
thermal-hydraulic performance of the rough surfaces from annular
experiments and their application in more complex channel geo
metries. Based on the solution of the simplified differential
equation of core flow and considering the eddy diffusivity
concept, a new method for the transformation of annular ex
perimental results to equal boundary conditions was developed.
This method fits very well into the consistent approach of rough
surface performance evaluation adopted at EIR. To prove the
method, the results of experimental investigations in annular
channels were re-evaluated and the obtained results applied to
different bundle geometries. The resultant performances, as
well as the predictions for bundle geometries, were compared
with the results of other different transformations. Based on
these comparisons an assessment of the different transformation
methods was made.
Although no definitive decision about the best method has been
made, the number of methods recommended for the final selection
of a common standard method is reduced as a result of this study.
If consistently applied, some other transformation method can

- 171 -
also be successful, but some advantages of the new method are
evident particularly at low Reynolds numbers and with varying
heat flux conditions. The results transformed by the new method
have demonstrated that the roughness functions, as measures of
thermal-hydraulic performance, do not depend very much upon the
relative flow thickness. This confirms the assumption that, by
using an improved transformation method, the effect of relative
flow thickness can be reduced to a negligible amount. The new
method also has the highest generalisation and development po
tential. Additional experimental information concerning the
eddy diffusivity of momentum and the turbulent Prandtl number
may yet increase confidence in the method and improve its
accuracy under complicated flow and heat transfer conditions.
The criteria for the choice of a suitable rough surface for a
specific practical application were reviewed and summarised. A
new, more-complex index of thermohydraulic performance was de
veloped for considering a complete coolant circuit. In addition
to evaluating this complex index of performance it seems as if
the costs of the roughening procedure are of decisive importance
when considering a wider application of rough surfaces in thermal
engineering.
- 172 -
10. REFERENCES
/l/ Lewis, M.J.: Roughness functions, the thermohydraulic performance of rough surfaces and the Hall transformation " An overview Int.J.Heat&Mass Transfer, Vol.17, pp.809-814, 1974
/2/ Langhaar, H.L.: Dimensional analysis and theory of models New York, 1960
/3/ Hunsaker J.C. and Rightmire B.G.: Engineering Applications of Fluid Mechanics Witey, New York, 1951
/4/ Shapiro, A.H.: The dynamics and thermodynamics of compressible fluid flow New York, 1953
/5/ Jakob, M.: Heat transfer pt I New York 1956, pt II, New York 1957
/6/ Sutherland, W.A.,Miller, C.W.: Heat transfer to superheated steam II - Improved performance with turbulence promoters GEAP-4749, 1964
/!/ McAdams: Heat transmission New York 1954
/8/ Nunner, W.: WSrmedbergang und Druckabfall in rauhen Rohren VDI Forschungsheft 455, 1956
/9/ Dipprey, D.F., Sabersky, R.H.: Heat and Momentum Transfer in Smooth and Rough Tubes Int. J. Heat&Mass Transfer, Vol.6, pp.329-53, 1963

- 173 -
/10/ Rannie, W.D.: Heat transfer in Turbulent Shear Flow California Institude of Technology J. Aeron.Sci.23, pp. 485-489, 1956
/ll/ Kattchee, N., Mackewicz, W.V.: Effects of Boundary Layer Turbulence Promoters on the Local Film Coefficients of ML-1 Fuel Elements Nuclear Science and Engineering, 16, pp.31-38, 1963
/12/ Mantle, P.L., Freeman, A.R., Watts, J.: Conductivity effects on ribbed surface heat transfer Int. J. Heat&Mass Transfer, Vol.14, pp.1825-1834, 1971
/13/ Barnett, P.G.: The influence of wall thickness, thermal conductivity and method of heat input on the heat transfer performance of some ribbed surfaces TRG-Report 2074 (W), 1972
/14/ Hudina, M., Yanar, S.: The Influence of Heat Conduction on the Heat Transfer Performance of some Ribbed Surfaces Tested in ROHAN Experiment EIR-TM-IN-572, WUrenlingen, 1974
/15/ MarkSczy, G.: Ueberlegungen bezUglich der Verwendung von kUnst-lichen Rauhigkeiten in Brennelementen fUr gasge-ktihlte schnelle Brutreaktoren EIR-TM-IN-405, WUrenlingen, 1969
/16/ Gas-cooled Fast Breeder Reactor Annual Progress Report GA8107, San Diego, 1968
/17/ Hudina, M.: Heat transfer and pressure drop measurements with surfaces roughened by photo-etching Presented at the ENEA Specialist Meeting on Thermo-hydraulics, Paper 12, EIR-SL-R/3, Windscale, 1972

- 174 -
/18/ Von Holzen, G.: Aufrauhen von Heizelementen durch elektrolytisches Schleifen (Elisieren) EIR-AN-IN-TLV-401, WUrenlingen, 1973
/19/ Nikuradse, J.: StrQmungsgesetze in rauhen Rohren VDI Forschungsheft 361, 1933
/20/ Lewis, M.J.: A new method for analysing the subsonic flow over any rough surface at all Reynolds nn^bers EIR-TM-IN-524, Wurenlingen, 1972
/21/ Lewis, M.J.: Flow over a rough surface - an analysis for heat transfer EIR-TM-IN-538, WUrenlingen, 1973
/22/ Walker, V., Wilkie, D.: The wider application of roughened heat transfer surfaces as developed for AGR Report on Symposium on High Pressure Gas as a Heat Transport Medium, Paper No. 26, London, 1967
/23/ Naegeling, R.: Optimizing a Reactor Coolant Channel for Minimum Blower Power Journal of Nuclear Energy, Parts A/B, Vol. 18, pp. 377-385, 1964
/24/ Melese d'Hospital, G.B.: Merit Index for Gas-Cooled Reactor Heat Transfer Nuclear Science and Engineering, 50, pp.83-85, 1973
/25/ Schlichting, H.: Experimentelle Untersuchungen zum Rauhigkeitsproblem Ing.Archiv VII/1, 1936
/26/ Karman, vTh.: The Analogy Between Fluid Friction and Heat Transfer Trans. ASME 61, p. 705, 1939

- 175 -
/27/ Moebius, H.: Experimentelle Untersuchung des Widerstandes und der Geschwindigkeitsverteilung in Rohren mit regelmässig angeordneten Rauhigkeiten bei turbulenter Strömung. Physikal. Zeitschrift 41, pp. 202-225, 1940
/28/ Gargaud, J., Paumard, G.: Amelioration du transfer de chaleur par l'emploi de surfaces corruguees CEA-R-2464, 1964
/29/ Novozhilov, I.F., Migai, V.K.: Intensifying Convective Heat Transfer withir Tubes by means of Induced Roughness Thermal Engng., 11, 1964
/30/ Gowen, R.A., Smith, S.W.: Turbulent heat transfer from smooth and rough surfaces Int. J. Heat&Mass Transfer, Vol.11, pp.1657-1673, 1968
/31/ Knudsen, J.G., Katz, D.L.: Heat transfer and pressure drop in annuli Chemical Engineering Progress 46, pp.490-500, 1950
/32/ Kemény, G.A., Chyphers, J.A.: Heat Transfer and pressure drop in an annular gap with surface spoilers ASME Trans. Journ. of Heat Transfer, Vol.83, 1961
/3 3/ Draycott, A., Lawther, K.R.: Improvement of fuel element heat transfer by use of roughened surfaces and the application to a 7-rod cluster. International deve]opments in heat transfer part 111. ASME, pp. 543-552, 1961
/34/ Malherbe, J.M.: Influence des rugosités de paroi sur les coefficients d'échange thermique et de perte de charge CEA-2283, 1963
/35/ Burgoyne, T.B., Burnett, P., Wilkie, D.: Forced convection heat transfer from surfaces roughened by transverse ribs TRG Rep. 781 (W), 1964

- 176 -
/36/ Puchkov, P.I., Vinogradov, O.S.: Heat Transfer and Hydraulic Resistance in Annular Channels with Smooth and Rough Heat Transfer Surfaces Heat and Mass Transfer, vol. 1, p.65, 1965
/37/ Sheriff, N., Gumley, P.: Heat Transfer and Friction Properties of Surfaces with Discrete Roughness Int. J. Heat&Mass Transfer, Vol.9, p.1297, 1966
/38/ Kaul, V., Kiss, M.: Forced Convection Heat Transfer and Pressure Drop in Artificially Roughened Flow Passages Neue Technik, Bd. 5, 297, 1964
/39/ Wilkie, D.: Forced Convection Heat Transfer from Surfaces Roughened by Transverse Ribs Proc. of 3rd Int. Heat Transfer Conf. Chicago, p.l, 1966
/40/ KjellstrSm, B.: Influence of Surface Roughness on Heat Transfer and Pressure Drop in Turbulent Flow AE-RTL-819, 1965, AE-RTL-820, 1966, AE-RTL-821, 1966
/41/ Wilkie, D., Cowin, M., Burnett, P., Burgoyne, T.: Friction Factor Measurements in a Rectangular Channel with Walls of Identical and Non-Identical Roughness Int. J. Heat&Mass Transfer, Vol.10, pp.611-621, 1967
/42/ Lawn, C.J., Hamlin, M.J.: Velocity Measurements in Roughened Annuli CEGB Report RD/B/N-1278, Berkeley, 1969
/43/ Dalle Donne, M., Meerwald, E.: Heat Transfer from Surface Roughened by Thread-Type Ribs at High Temperatures Proceedings of the 1970 Heat Transfer and Fluid Mechanics Institute, Stanford, California, 1970

- 177 -
/44/ Feuerstein, G., Rampf, H.: Der Einfluss rechteckiger Rauhigkeiten auf den Wärmeübergang und den Druckabfall in turbulenter Ringspaltströmung Wärme- und StoffÜbertragung, Bd. 2, Nr.l, 1969
/45/ White, W.J., White, L.: The effect of Rib Profile on Heat Transfer and Pressure Loss Properties of Transversely Ribbed Roughened Surface "Zürich-Club" Gas Cooled Fast Reactor Heat Transfer Meeting, Würenlingen, 1970
/46/ Hanjalic, K., Launder, B.E.: Fully developed asymmetric flow in a plane channel J. Fluid Mech. 51, p. 301, 1972
/47/ Bhattacharyya, A.: Heat transfer and pressure drop with rough surfaces-A literature survey AE-141, 1964
/48/ Marköczy, G.: Berechnung der Reibungszahlen und Stanton Zahlen an Oberflächen mit künstlicher Rauhigkeit in Form von kleinen Querrippen. EIR-TM-IN-377, Würenlingen, 1968
/49/ Meerwald, E.: Druckverlust und Wärmeübergang an glatten und rauhen Flächen bei hohen Temperaturen und turbulenter Strömung, und deren Darstellung durch universelle Gesetze KfK Externer Bericht 4/71-29, Karlsruhe, 1971
/50/ Baumann, W.: Pressure Drop Performance of Artificial Roughness as a Function of Roughness Geometry Paper No. 68 of Internat. Meeting - Reactor Heat Transfer, Karlsruhe, 1973
/51/ Kolar, V.: Heat transfer in turbulent flow of fluids through smooth and rough tubes Int.J. Heat&Mass Transfer, Vol.8, pp.639-53, 1965

- 178 -
/52/ Kobzar, L.L: Eine Methode zur Berechnung von Druckverlustbeiwert und Geschwindigkeitsprofil in Rohren mit regelmas-siger Rauhigkeit Bericht FEI-418, Obninsk, 1973
/53/ Lewis, M.J.: An elementary analysis for predicting the momentum-and heat-transfer characteristics of a hydraulically rough surface J. Heat Transfer, Vol.97, pp.249-254, 1975
/54/ Hudina, M.: Investigation of different artificially roughened surfaces in annular channels (ROHAN experiment-final report), Part I EIR-TM-IN-694, Wurenlingen, 1977
/55/ Morris, H.M.: Flow in rough conduits Trans.Am.Soc.Civ.Eng. 120, pp.373-410, 1955
/56/ Dalle Donne M.: WSrmeiibergang von rauhen OberflMchen Report KFK 2397, EUR 5506d, Karlsruhe, 1977
/57/ Wilkie, D.: Forced Convection Heat Transfer from Surfaces Roughened by Transverse Ribs Proceedings of EAES Heat Transfer Symposium on Superheated steam or gas, Bern, 1966
/58/ Hudina, M.: The Influence of Roughness Shape on the Thermo-hydraulic Characteristics of Ribbed Surfaces Proceedings of International Meeting: Reactor Heat Transfer, Session I, p.Ill, Karlsruhe, 1973
/59/ Lewis, M.J.: Ill-Defined Roughness EIR-TM-IN-529, Wurenlingen, 1973

- 179 -
/60/ Hudina, M.: Thermohydraulic performance of some ribbed surfaces and their choice for GCFR Nuclear Energy Maturity, Proceedings of the European Nuclear Conference, Paris 1975, Progress in Nuclear Energy Series 1976, Volume 9, Pergamon Press Oxford and New York, 1976
/61/ Hudina, M.: Roughening characteristics and choices for the Gas-Cooled Fast Breeder Reactor Nuclear-Engng. and Design, Vol.40, pp.133-144, 1977
/62/ Fraser, J.P.: The Induction of Coolant Crossflow in a Flat Channel by Wall Fins Nucl. Engng. and Design, Vol.25, pp.403-408, 1973
/63/ White, L. , Wilkie, D.: The heat transfer and pressure loss characteristics of some multistart ribbed surfaces. Augmentation of convective Heat and Mass Transfers ASME 1970, pp. 55-62, 1970
/64/ Pirie, M.A.M.: The performances of heat transfer surfaces with multistart helical roughening CEGB-Report RD/B/N4243, Berkeley, 19 77
/65/ Rapier, A.C., Jones, I.M.: Heat transfer tests on single pins with helical rib roughness ND-R-302 (W) j HTSP/P(79)3. Presented also at the 5.NEA Heat Transfer Specialists Meeting, Wurenlingen, GCFR/UK-R58, 1979
/66/ Hudina, M., NOthiger, H.: Messungen der Quergeschwindigkeit im Versuch ROHAN mit Hilfe eines Hitzdrahtanemometers EIR-TM-IN-519, Wurenlingen, 1972
/67/ Hudina, M.: Comments to Session 2 "Thermohydraulic performances of rough surfaces" NEA-Report, CO-19, 1981-04, p.11, Studsvik, 1981

- 180 -
/68/ Dalle Donne, M., Meyer, L.: Experimental heat transfer and pressure drop at rods with three-dimensional roughnesses in annuli Presented at the OECD-NEA Heat Transfer Specialist Meeting, Petten, 1975
/69/ Mantle, P.L.: A new type of roughened heat transfer surface selected by flow visualisation techniques Proc. of 3rd. Int. Heat Transfer Conf., Vol. 1, pp. 45-55, Chicago, 196j
/70/ Dalle Donne, M., Meyer, L.: Heat transfer and pressure drop at single rods roughened with three-dimensional ribs. Presented at the OECD-NEA 6th GCFR Heat Transfer Specialists Meeting, Berkeley, England, 1980
/71/ Rehme, K.: Thermalhydraulic experiments with a cluster of 19 rods roughened by a novel type of roughness Report KfK 3102, Karlsruhe, 1981
/72/ Hudina, M.: Experimental Investigation of the Thermohydraulic Characteristics of some Rough Surfaces at Low Reynolds Numbers NEA Specialist Meeting on Core Performance, Studsvik, 1973
/73/ Dalle Donne, M., Meyer, L.: Convective heat transfer from rough surfaces with two-dimensional ribs: Transitional and Laminar flow Report KfK 2566, Karlsruhe, 1978
/74/ Dalle Donne, M., Hudina, M., Huggenberger, M., Meyer, L., Rehme, K.: EIR, KfK joint heat transfer experiment on a single rod roughened with trapezoidal rounded ribs and cooled by various gases KfK 2674, EUR 5755e, EIR-Bericht Nr. 349, Karlsruhe, Wtlrenlingen, 1978

- 181 -
/75/ Pfriem, H.J.: Der turbulente Wärmeübergang an Helium und Wasserstoff in beheizten Rohren bei grossen axial steigenden Temperaturdifferenzen und das sich daraus ergebende Temperaturprofil Report KfK 1860, Karlsruhe, 1963
/76/ Dalle Donne, M., Bowditch, F.H.: Experimental local heat transfer and friction coefficients for subsonic laminar transitional and turbulent flow of air or helium in a tube at high temperatures Dragon Project Report DP 184, U.K.A.E.A. Winfrith, Dorchester, England, 1963
/77/ Walker, V., White, L.: The effect of physical property variations on heat transfer roughened surfaces Heat Transfer Conf. 1970, Paris, Paper FC 5.4, Vol. 2, 1970
/78/ Barnes, J.F.: An experimental investigation of heat transfer from the inside surface of a hot smooth tube to air, helium and carbon dioxide National Gas Turbine Establishment, Pyestock, Hants, England, N.G.T.E. R. 241, 1960
/79/ Gentry, P.J.: Effect of coolant physical property variation on the heat transfer and pressure loss performance of some smooth and ribbed surfaces TRG Report 2129 (W), 1971
/80/ Williams, F., Watts, L.: The development of rough surfaces with improved heat transfer performance? a study of the mechanism involved 4th Int. Heat Transfer Conf., Versailles, Paper FC 5.4, 1970
/81/ Seban, R.A.: Heat Transfer and Flow in a Shallow Rectangular Cavity with Subsonic Turbulent Air Flow Int. J. Heat&Mass Transfer, Vol-8, II, pp.1353-1368, 1965

- 182 -
/82/ Baumann, W., Rehme, K.: Pressure drop performance of artificial roughness as a function of roughness geometry NEA Co-ordinating Group on Gas Cooled Fast Reactor Dev. Core Performance Specialist Meeting, Studsvik, 1973
/83/ Bauman, W.: Geschwindigkeitsverteilung bei turbulenter Stromung an rauhen WSnden Report KfK 2618, Karlsruhe, 1978
/84/ Aytekin, A., Berger, F.P.: Turbulent flow in rectangular ducts with varying aspect ratios having one rough wall NEA Co-ordinating Group on Gas Cooled Fast Reactor Dev. Heat Transfer Specialist Meeting, Karlsruhe, 1977
/85/ Berger, F.P. , Whitehead, A.W.: Fluid flow and heat transfer in tubes with internal square rib roughening J. Br. Nucl. Energy Soc, Vol.16,2, pp.153-160, 1977
/86/ Lawn, C.J.: Flow measurements for establishing the mechanisms of heat transfer from a rib-roughened surface CEGB Report RD/B/N-3514, Berkeley, 1976
/87/ Perry, A.E., Joubert, P.N.: Rough-wall boundary layers in adverse pressure gradients J. Fluid Mech., Vol.17, pp.193-211, 1963
/88/ Perry, A.E., Schofield, W.H., Joubert, P.N.: Rough wall turbulent boundary layers J. Fluid Mech., Vol.37, pp.383-413, 1969
/89/ Liu, C.K., Kline, S.J., Johnston, J.P.: An experimental study of turbulent boundary layers on rough walls Stanford Univ. Rep. MD-15. 1966

- 183 -
/90/ Hassan, M.A.: Comparison of roughness parameters between experimental results and Kobzar's theoretical method Report KfK 2631, Karlsruhe, 1978
/91/ Lewis, M.J.: The momentum losses of ribs with sharp or rounded edges EIR-TM-IN-528, Wiirenlingen, 1973
/92/ Rehme, K.: The pressure drop of spacer grids in rod bundles of 12 rods with smooth and roughened surfaces Report KfK 2697, Karlsruhe, 1978
/93/ Barroyer, P.: PROSPECT II - Part 1: Experimental Facility, Program of Measurements and Principles of the Data Reduction Part 2: Experimental Results and Analytical Prediction of Spacer Co-efficients EIR-TM-IN-689, Wiirenlingen, 1977
/94/ Barroyer, P.: Analytical model for the prediction of spacer pressure drop co-efficients EIR report Nr. 350, September, 1978, also Paper presented at the A.N.S. 1978 Winter Meeting, Washington, D.C., 1978
/95/ Hudina, M., NSthiger, H.: Experimental study of local heat transfer under and near grid spacers developed for GCFR EIR-TM-IN-526, Wurenlingen, 1973
/96/ Marek, J., Rehme, K.: Heat transfer in smooth and roughened rod bundles near spacer grids Presented at the OECD-NEA Heat Transfer Specialist Meeting, Petten, 1975
/97/ Hassan, M.A.: warmeUbergang im Abstandshalterbereich gas-gektthlter StabbUndel Report KfK 2954, Karlsruhe, 1980

- 184 -
/98/ Hall, W.B.: Heat Transfer in Channels Having Rough and Smooth Surface J. Mech. Eng. Sc., 4 (3), 1962
/99/ Wilkie, D.: Calculation of Heat Transfer and Flow Resistance of Rough and Smooth Surfaces Contained in a Single Passage Third Int. Heat Transfer Conf., Paper No. 2, Chicago, 1966
/100/ Markdczy, G.z Konvektive WSrmeubertragung in langsangestr5mten Rohr oder Stabbiindeln EIR-TM-IN-430, Wtirenlingen, 1970
/101/ Maubach, K.: Reibungsgesetze turbulenter Str5mungen in geschlos-senen glatten und rauhen KanSlen von beliebigem Querschnitt Diss. Univ. Karlsruhe, Externer Bericht INR-4/69-22, Karlsruhe, 1969
/102/ Nikuradse, S.: GesetzmSssigkeiten der turbulenten StrSmung in glatten Rohren VDI-Forschungsheft 356, 1932
/103/ Warburton, C , Pirie, M.A.M. : An Improved Method for Analysing Heat Transfer and Pressure Drop Tests on Roughened Rods in Smooth Channels Presented at the ASME Winter Annual Meeting, New York, Paper No. 74-WA/HT-56, 1974
/104/ Wilkie, D., White, L.: Calculation of flow resistance of passages bounded by a combination of rough and smooth surfaces TRG Report 1113 (W), 1966
/105/ Rapier, A.C.: Forced Convection Heat Transfer in Passages with varying Roughness and Heat Flux Around the Perimeter TRG Report 519, 1963

- 185 -
/106/ Nathan, D.I., Pirie, M.A.M.: On the interpretation of heat transfer and pressure drop tests on roughened rods in smooth circular channels CEGB Rep. RD/B/N 1370, Berkeley, 1970
/107/ Dalle Donne, M., Meyer, L.: Turbulent convective heat transfer from rough surfaces with two-dimensional rectangular ribs Int. J. HeatsMass Transfer, Vol.20, pp.583-620, 1977
/108/ Hudina, M.: Evaluation of heat transfer performances of rough surfaces from experimental investigation in annular channels Int. Journal of Heat and Mass Transfer, Vol. 22, pp. 1381-1392, 1979
/109/ Firth, R.J.: A method for analysing heat transfer and pressure drop data obtained from partially roughened annular channels Presented at the 5th OECD/NEA Heat Transfer Specialists Meeting, Session II, Paper L, Wurenlingen, 1979
/110/ Lawn, C.J., Elliot, C.J.s Fully developed turbulent flow through concentric annuli CEGB report RD/B/N 1878, Berkeley, 1971
/111/ Lawn, C.J.: The use of an eddy viscosity model to predict the heat transfer and pressure drop performance of roughened surfaces Int. J. Heat Mass Transfer, Vol. 17, pp.421-428, 1974
/112/ Reichardt, H.: VollstMndige Darstellung der turbulenten Geschwindig-keitsverteilung in glatten Leitungen Z. angew. Math. Mech., Vol. 31, p.208, 1951
/113/ Hinze, J.O.: Turbulence and introduction to its mechanism and theory Mc Graw-Hill Book, Co. Inc., New York, p.525, 1969

- 186 -
/114/ Townsend, A.A.: The structure of turbulenr shear flow Camb. Univers. Press, 1956
/115/ Rehme, K.: Turbulent flow in smooth concentric annuli with small radius ratios J. Fluid Mech., Vol.64, part 2, pp.263-287, 1974
/116/ Quarmby, A.: An experimental study of turbulent flow through concentric annuli Int. J. Mech. Sci., Vol.9, pp.205-221, 1967
/117/ Jonsson, V.K., Sparrow, E.M.: Turbulent Diffusivity for Momentum Transfer in Concentric Annuli TRANS, cf the ASME, J. Basic Engng., Vol. 88, pp. 550-552, 1966
/118/ Durst, F.: On turbulent flow through annular passages with smooth and rough cores M. SC. thesis, Imperial College, London, 1968
/119/ Hudina, M.: Prediction of displacement between the maximum velocity and zero shear position in asymmetric annular flow Presented at the 5. NEA Heat Transfer Specialists Meeting, Wiirenlingen, 1979
/120/ Hanjalic, K.: Prediction of turbulent flow in annular ducts with differential transport model of turbulence WSrme und StoffUbertragung, BD 7, S.71-78, 1974
/121/ Reynolds, 0.: On the extent and action of the heating surface for steam boilers Proc. Lit. Phil. Soc., Manchester, 14, pp.7-12, 1874
- 187 -
/122/ Kestin, J., Richardson, P.O.: Heat transfer across turbulent, incompressible boundary layers Int. J. Heat Mass Transfer, Vol.6, pp.147-189, 1963
/123/ Ludwig, H.: Bestiminung des Verhaltnissec der Austauschkoeffizienten fflr WSrme und Impuls bei turbulenten Grenzschichten Z. Flugwiss., 4, pp. 73-81, 1956
/124/ Taylor, 6.1.: The transport of vorticity and heat through fluids in turbulent motion Proc. Roy. Soc. A 135, pp. 685-702, 1932
/125/ Corcoran, W.H. et al.: Temperature gradients in turbulent gas streams Industr. Engng. Chem. 44, pp. 410-419, 1952
/126/ Schleicher, C.A. Jr: Emperimental velocity and temperature profiles for air in turbulent pipe flow Trans. Americ. Soc. Mech. Engrs. 80, pp.693-704, 1958
/127/ Page, F. Jr. et al.: Point values of eddy conductivity and viscosity in uniform flow between parallel plates Ind. and Engng. Chemistry, Vol.44, pp.424-430, 1952
/128/ Patel, V.C., Head, M.R.: Some observations on skin frictions and velocity profiles in fully developed pipe and channel flows J. Fluid Mech., Vol.38, Part 1, pp.181-201, 1969
/129/ Hudina, M.: warmeUbergang und Druckverlust an Brennelementen mit durch Aetzen gerauhter Oberflache Reaktortagung 1973 des Deutschen Atomforums, Bericht Nr. 140, Karlsruhe, 1973
/130/ Hudina, M.: Experimentelle Untersuchung und Vergleich der thermo-hydraulischen Eigenschaften verschiedener OberflMchen-rauhigkeiten ftir gasgekUhlte schnelle Heaktoren Reaktortagung 1975 des Deutschen Atomforums, NUrnberg, 1975

- 188 -
/131/ Hudina, M.: Criteria for choice of artificial roughness to be used in GCFR Presented at the 3rd NEA Heat Transfer Specialist Meeting, Petten, 1975
/132/ Hudina, M.: Thermohydraulic performance of some ribbed surfaces and their choice for GCFR Annals of Nuclear Energy, Vol. 3, pp.351-356, Pergamon Press, 1976
/133/ Van Driest, E.R.: On turbulent flow near a wall J. Aeronaut. Soc, 23, 1007, 1956
/134/ Hudina, M.: Evaluation of Heat Transfer Performances of Rough Surfaces from Experimental Investigation in Annular Channels EIR report SL-R/21. Paper presented at the NEA Specialists Meeting on GCFR Heat Transfer, Karlsruhe, 1977
/135/ Huggenberger, M.: SCRIMP, A Thermal-Hydraulic Subchannel Analysis Computer Code EIR-Bericht Nr. 322, WUrenlingen, 1977
/136/ Barroyer, P.: CLUHET: A Computer Code for Steady State and Single-Phase Thermohydraulic Analysis of Rod Bundles ANS/ASME International Topical Meeting on Nuclear Reactor Thermal Hydraulics, Session 13, Saratoga Springs, 1980
/137/ Huggenberger, M.: SCRIMP, Verification of the code by the 37-rod bundle AGATHE HEX experimental data EIR-Bericht No. 408, WUrenlingen, 1980
/138/ Huggenberger, M.: AGATHE HEX Experiment, Verification of the thermal-hydraulic computer code SCRIMP by the AGATHE HEX 31-rod bundle 2 experimental data EIR-TM-23-82-2, Wttrenlingen, 1982

- 189 -
/139/ Hudina, M., Markoczy, G.: The hexagonal bundle heat transfer and fluid flow experiment AGATHE HEX Nuclear Energy and Design 40 (1), Special issue: GCFR Engineering and Design, pp.121-132, 1977
/140/ Markdczy, G., Hudina, M.: AGATHE HEX bundle experiment, Review and status report Presented at the 5th OECD-NEA GCFR Heat Transfer Specialists Meeting, Paper 5 of Session III, SL-R/25, Wiirenlingen, 1979
/141/ Hudina, M., Huggengerber, M.: Verification of the Thermohydraulic code SCRIMP by Different Rod Bundle Experiments Proceedings of ENC, Vol. 31, TANSAI 31.1-666, pp. 70-73, Hamburg, 1979
/142/ Huggenberger, M., Hudina, M.: Verification of the thermohydraulic code SCRIMP by different rod bundle experiments Presented at the 5th OECD-NEA GCFR Heat Transfer Specialists Meeting, Paper 5 of Session IV, SL-R/26, Wurenlingen, 1979
/143/ Hudina, M., Huggenberger, M.: AGATHE HEX Bundle Experiment, Status Report EIR-SL-R/32, Presented at the 6th OECD/NEA Specialist Meeting on Heat Transfer, Session 3, Paper 5, Berkeley, 1980
/144/ Barroyer, P.: CLUHET Computer Code. Status report EIR-SL-R/33, Presented at the 6th OECD/NEA Specialists Meeting on GCFR Heat Transfer, Session 4, Paper 2, Berkeley, 1980
/145/ Huggenberger, M.: Verification of the computer code SCRIMP under extremely non-uniform heating conditions EIR-SL-R/34, Presented at the 6th OECD/NEA GCFR Heat Transfer Specialists Meeting, Session 4, Paper 3, Berkeley, September 1980

- 190 -
/146/ Hudina, M., Markdczy, G.: The Hexagonal Bundle Heat Transfer and Fluid Flow Experiment AGATHE HEX ANS/ASME International Topical Meeting on Nuclear Reactor Thermal Hydraulics, Session 13, Saratoga Springs, 1980
/147/ Hewitt, G.F.: Interpretation of pressure-drop data from an annular channel AERE-R 4340, 1964
/148/ Hudina, M.: Investigation of different artificially roughened surfaces in annular channels, ROHAN-Experiment -final report, Part II TM-23-81-19, WUrenlingen, 1981
/149/ Barroyer, P., Hudina, M., Huggenberger, M.: Benchmark thermal-hydraulic analysis with the AGATHE HEX 37-rod-bundle EIR Bericht Nr. 439, WUrenlingen, 1981
/150/ Rehme, K.: Experimentelle thermo- und fluiddynamische Unter-suchungen an einem 19-Stabblindel mit ki inst l ichen Oberflachenrauhigkeiten Report KfK 2313, Karlsruhe, 1976
/151/ Dalle Donne, M. et al.: BR 2 Bundle Mockup Heat Transfer Experiments Nuclear Engineering and Design, Vol. 40, No. 1, Special Issue GCFR, pp. 143-156, 1977
/152/ Rapier, A.C., Jones, T.M.: Forced convection heat transfer from rib roughened pins tested singly and in a cluster of seven ND-R-487 (W), Risley, 1980
/153/ Hudina, M., Barroyer, P., Huggenberger, M.: Benchmark calculation III., Task definition EIR-AN-IN-684, Wttrenlingen, 1977

- 191 -
/154/ Hudina, M., Huggenberger, M.: Benchmark calculation IV., Task definition EIR-AN-IN-796, WUrenlingen, 1978
/155/ Hudina, M., Huggenberger, M.: Benchmark Calculation V., Task definition EIR-AN-IN-852, Wiirenlingen, 1979
/156/ Barroyer, P., Hudina, M., Huggenberger, M.: Pressure and temperature distributions in the 37-rod bundle of AGATHE HEX experiment Benchmark calculations III EIR-TM-IN-719, Wtirenlingen, 1978
/157/ Barroyer, P., Hudina, M., Huggenberger, M.: Pressure and temperature distributions in the 37-rod bundle of AGATHE HEX experiment Benchmark calculations IV EIR-TM-IN-781, Wiirenlingen, 1979
/158/ Barroyer, P., Hudina, M., Huggenberger, M.: Pressure and temperature distributions in the 37-rod bundle of AGATHE HEX experiment Benchmark calculations V EIR-TM-IN-799, Wtirenlingen, 1979
/159/ Wilkie, D.: Criteria of choice of roughness form Presented at the "Ziirich-Club" Heat Transfer Meeting Wtirenlingen, 1970
/160/ Diamond, J., Hall, W.B.: Heat removal from nuclear power reactors J. Brit. Nuclear Energy Conference, pp.227-240, 1956

- 192 -
A P P E N D I X : "ROHAN" EXPERIMENT
A.l. PURPOSE OF THE ROHAN EXPERIMENT
The core of a gas-cooled fast-breeder reactor (GCFR) must be
designed for very high coolant temperatures and power densities.
Using a gas, which is a relatively poor coolant, improvement of
the heat transfer is desirable, in order to keep temperatures
in the fuel rods at an acceptable level (at fixed, high outlet
gas temperatures). The enlargement of the heat transfer area
cannot be allowed, owing to the increases in neutron absorption
and coolant pumping power that would result. The promotion of
local turbulence by the application of artificial roughnesses
is therefore the most promising way of increasing convective
heat transfer for GCFR.
To study the heat transfer and fluid flow within the fuel ele
ments of a typical GCFR a joint GAC-EIR investigation program
has been carried out. As a part of this program the thermohy-
draulic performance characteristics of different rough surfaces
have been tested in the ROHAN (ROugh surface Heat transfer
ANalysis) experiment.
The thermodynamic performances of artificially roughened sur
faces, having some basic rib shapes (profiles), are known from
extensive studies on different large-scale, model roughnesses.
These experimental data show that relatively small changes in
rib geometry can cause significant differences in performance.
The roughness forms applicable in a typical GCFR core do not
correspond to the well-defined rib geometry used in large-scale
tests. Additional experiments were therefore needed. The aims
of the "ROHAN" experimental study were to:
- 193 -
- Investigate the thermohydraulic performances of different
rough surfaces, having particular rib shapes and surface
finishes obtained by some practicable roughening procedures.
- Carry out these tests in a simple experimental channel under
turbulent and transient Reynolds number conditions with the
actual roughness quality which may be used in GCFR (similar
conditions including rod geometry and canning material).
- Determine the influence of mechanical tolerances, typical for
the roughening procedure, on the thermohydraulic performance
and check if this influence can be neglected when balanced
against manufacturing costs.
- Compare the results with data obtained in other investigations.
- Suggest the dimensions and shape of a roughness suitable for
use in GCFR. These should be then tested in a 37-rod hexagonal
bundle experiment.
A.2. EXPERIMENTAL CONDITIONS
A.2.1 General test conditions
To define the most suitable experimental conditions the purpose
of the experiment was considered together with dimensional ana
lysis and the experience gained in earlier experiments. In
order to simplify the experimental equipment, it was decided
to eliminate the influence of some dimensionless groups (Ma,
Tw/Tb, t/e, Bi). The requirements for neglecting these effects,
as given in cheaters 2.3 and 2.4, were therefore fulfilled.
However, some analytical studies and additional experimental
runs were made to confirm these requirements.

- 194 -
A.2.2 Channel geometry
An annulus with inner-rough and outer-smooth surfaces was found
to be the most suitable geometry for this experiment. The
advantages of the annular channel, in comparison with the
simplest, tube geometry, are particularly evident for the com
parative investigation of different rough surfaces and can be
summarised as follows:
- The manufacturing of roughened rods is much easier than the
roughening of the inner surface of a tube. This is parti
cularly true if small roughnesses of the original GCFR di
mensions are to be produced. The manufacturing tolerances
are smaller, the check of the roughening quality is easier and
the production costs are lower.
- The exchange of different roughnesses in the test-section is
very simple (by mounting different rods in the test-section)
and the change can be carried out in a very short time.
- By using the same rough rod in smooth tubes with different
diameters, a relatively large range of different rib-height-
to-hydraulic-diameter ratios can be investigated.
- The measurement of static pressures and pressure drops with
pressure tappings on the outer smooth wall gives much more
accurate results than on the rough wall (effect of local
disturbances caused by the roughness on the static pressure
measurements).
- The geometry of the annular channel is similar to those of the
outermost channels in a bundle. The proper consideration of
wall channels is of great importance, particularly in smaller
bundles. The accuracy of overall analytical predictions
strongly depends on the calculation method applied in the
outermost channels.

- 195 -
The disadvantages of an annular channel can be overcome if a
suitable method can be found for the evaluation of experimental
results (transformation of results to uniform boundary conditions).
A.2.3 Rough surface characteristics
Based on the results of earlier rough surface investigations,
and limiting the friction pressure losses to an acceptable value
(GCFR conditions), Stanton numbers approximately twice those
obtained with smooth surfaces have been calculated. The corre
sponding roughness height under typical GCFR conditions is
approximately 0.1 mm. The dimensional and shape tolerances of
such small ribs are strongly dependent on the roughening proce
dure. Different roughening procedures were considered in order
to determine the performances of the actual attainable rough
nesses. In testing the first series of rods, roughened by photo-
masking or tape covering (single-start helical ribs) of the rod
surface followed by electrochemical etching, some important
effects of the roughness shape on the thermohydraulic perfor
mances were found. Consequently, for the following test series,
the desired profile was approximately reached after a second
(additional) etching operation without the tape. Additionally
to the etching process, mechanical cutting and electro-grinding
procedures were also applied. The quality of the macro surface
of the ribs was approximately the same for these two procedures.
Two different rib profiles were produced by mechanical cutting:
a well-defined rectangular profile and a trapezoidal profile
with rounding at the tip and root of the ribs. The rectangular
form was chosen because of the large amount of available data
obtained by investigations of large-scale roughnesses.
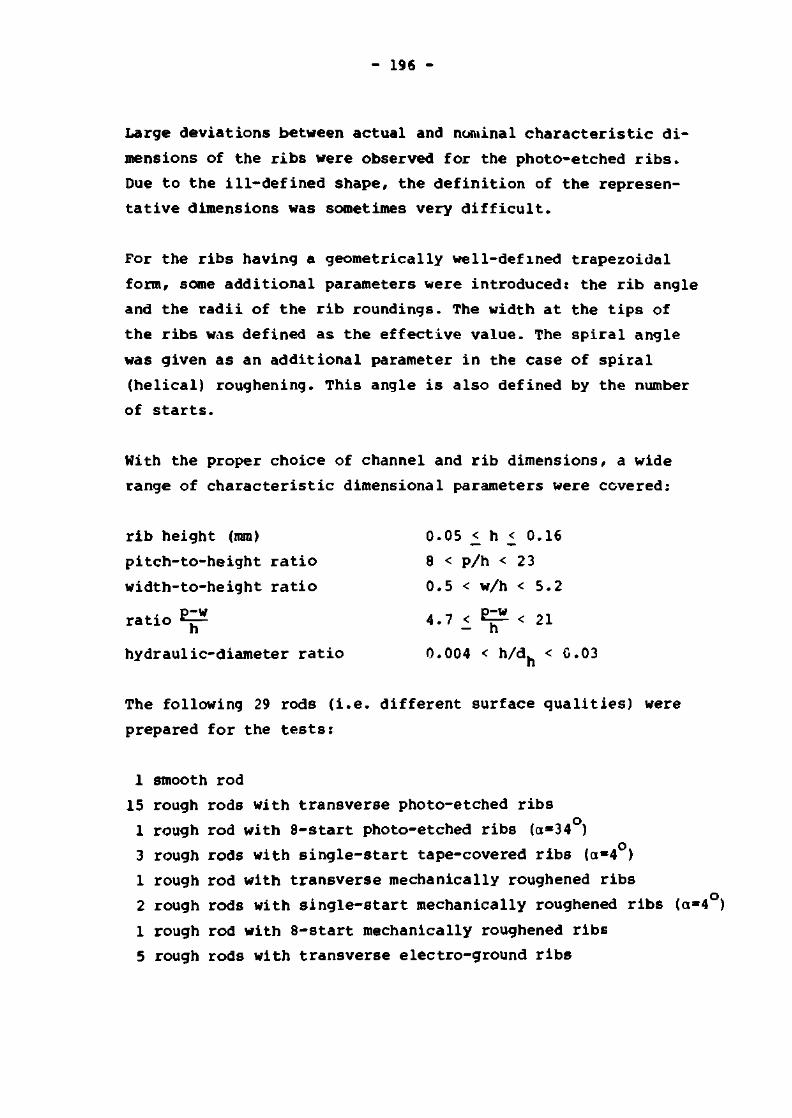
- 196 -
Large deviations between actual and nominal characteristic di
mensions of the ribs were observed for the photo-etched ribs.
Due to the ill-defined shape, the definition of the represen
tative dimensions was sometimes very difficult.
For the ribs having a geometrically well-defined trapezoidal
form, some additional parameters were introduced: the rib angle
and the radii of the rib roundings. The width at the tips of
the ribs was defined as the effective value. The spiral angle
was given as an additional parameter in the case of spiral
(helical) roughening. This angle is also defined by the number
of starts.
With the proper choice of channel and rib dimensions, a wide
range of characteristic dimensional parameters were covered:
rib height (mm) 0.05 <_ h _< 0.16
pitch-to-height ratio 8 < p/h < 23
width-to-height ratio 0.5 < w/h < 5.2
>-w ratio 4.7 < ^ < 21
h " ' - h
hydraulic-diameter ratio 0.004 < h/dh < 0.03
The following 29 rods (i.e. different surface qualities) were
prepared for the tests:
1 smooth rod
15 rough rods with transverse photo-etched ribs
1 rough rod with 8-start photo-etched ribs (a=34 )
3 rough rods with single-start tape-covered ribs (<x=4 )
1 rough rod with transverse mechanically roughened ribs
2 rough rods with single-start mechanically roughened ribs (a-4 )
1 rough rod with 8-start mechanically roughened ribs
5 rough rods with transverse electro-ground ribs

- 197 -
Dimensional surveys of all the rods were carried out before
and after the roughening procedure. The rib dimensions, quality
of the rib surface and typical rib profiles were checked using
a surface profile measuring instrument, or an optical magnifi
cation of the surface. These checks were made at different
axial and circumferential positions to give a good average
picture over the total roughened length of the rods.
The nominal and actual roughness heights and other dimensional
parameters (p/h and w/h) are given in Tables Al to A4 (Nominal
and actual characteristic rib parameters, for typical profiles
see chapter 2.1).
Rod No.
1
2
3
H
H A
1* B
5
8
11
12
13
l6»
27
28
29
30
31
h - 1 0 2
n RHI
smooth
5-0
7.0
10.0
10.0
10.0
5.0
5.0
5.0
10.0
5.0
15-0
15.0
8.0
12.0
10.0
15.0
h -102
mi
-
5.08
6.06
9.86
8.13
9.35
5.59
5.10
U.98
8.03
5.23
11.30
14.33
8.0
12.70
10.26
12.33
%
-
2.0
3.3
1.0
2.5
2.2
1.8
6.5
2.0
5.0
2.9
4.0
3.5
2.4
9.5
2.0
5.7
(p/h)n
-
18
18
18
18
18
16
in
12
12
10
12
12
10
10
8
8
p/h
-
18.1
20.2
18. 4
22.k
19. 4
11.6
15.0
12.4
15.0
9.9
15.5
12.8
10.2
9.4
8.1
9.8
l°p/h it
-
2.3
3.5
1.0
2.6
2.8
2.3
6.5
2.0
5.3
3.1
4.1
3.6
2.5
9.9
2.3
5.8
(w/h ) n
-
1-5
1.5
1.5
2
3
1.5
1.5
1.5
3
1.5
w/h
-
1.3
0.5
0.6
1.7
2.3
0.5
1.1
0.5
1.1
0.6
5.2
4.1
3.8
3.6
3.4
3.9
i°w/h %
-
4.6
27.3
23.2
8.9
7.7
19.5
18.7
21.0
14.7
12.5
9.1
8.1
7.6
13-0
6.5
8.3
TABLE Al Values for photo-etched ribs *single-start spiral ribs +rectangular profile

- 198 -
Rod
No.
2S
22
23
h -102
I I
0.15
0.15
0.15
h -10*
0.152
0.160
0.150
X
6.7
3.7
4.2
W\
12
12
12
p/h
11.9
11.6
12.4
*°p/h X
6.8
3.6
4.4
<*n 3
3
3 , . . J
w/h
3.5
2.6
3.1 -
X
7.7
4.8
5.3
TABLE A2 Values for tape-covered and etched s ingle-start spiral ribs
Rod
No.
15»+
21
24
26*
h -itf n m
0.15
0.12
0.15
0.15
h-102
•m
0.158
0.12
0.150
0.15&
X
3.2
3.3
3.2
4.0
[ p / ^
12
12
12
12
p/h
13.6
9.8
12.4
11.5
k°p/h t
3.4
3.4
3.50
4.1
>/h)„
2
3
3
2
tf/h
2.4
2.7
3.5
2.1
X
7.4
5
4.7
7.8
TABLE A3 Values for mechanically cut ribs
Rod
No.
14
17
IB
19
20
h '10* n
MR
0.10
0.10
0.15
0.15
0.15
h«102
MR
0.080
0.104
0.137
0.160
0.156
X
12
4
6
4.7
7.1
P / * ) f
12
12
12
12
12
P/h
15.9
11.9
14.3
11.5
12.7
X
12.3
4.3
6.5
4.8
7.2
[•"•>•
3
3
3
3
3
w/h
4.4
4.0
4.1
2.6
3.1
13.2
5.4
9.8
7.1
9.9
TABLE A4 For electro-ground ribs

- 199 -
A.3. EXPERIMENTAL EQUIPMENT
A.3.1 Test rig
Tests were performed with air in an open test rig, shown in
Fig. Al. The filtered air, normally slightly above atmospheric
pressure, was driven by e. blower (if pressures greater than
1,5 bar were needed, the piston compressor and storage tank
system was used) through a calibrated orifice into the annular
test section. Depending on the mass flow, the orifice was
changed in order to ensure the required accuracy of the pressure
drop measurement across the orifice. The inlet temperature of
air (normally ambient temperature) could be varied, thanks to
the electrical preheater. This was needed to determine the heat
losses of the test-section.
AIR $ V6 OUTLET
TESi SECTION (ANNULUS)
ELECTRICAL PREHEATING OF AIR
AIR INLET
FI6i A.Is "ROHAN" tes t rig PISTOfJ
COMPRESSOR

- 200 -
The test section (Fig. A2) consisted of a thermally insulated,
smooth, stainless-steel tube in which smooth or roughened rods
of nominally 8.6 mm diameter were concentrically mounted. The
length of the inlet part of the test section was determined by
considering that the velocity and temperature profiles should
be fully developed.
OOP HEATED LENGTH
03 0 s i rag M T l - T«: C R / A L THERMOCOUPLES INSTALLED AT 30°
INTERVALS AROUND THE CIRCUMFERENCE Dl - M : POSITIONS OF PRESSURE DROP MEASUREMENTS C r N i
(THREE TAPPINGS AT EACH POSITION) M t A « R S I - S4: SPACER POSITIONS Cu
MgO
FIG. A.2: ROHAN test -sect ion
Three d i f f e ren t outer tube diameters were used. The nominal
and the ac tua l values of these diameters a re given in Table
A.5. The nominal radius r a t i o s r . / r . ( r . / r . ) a re then: 0.614
(1 .63) , 0.478 (2.09) and 0.391 (2 .56) .

- 201 -
TABLE A.5
OUTER
DIAMETERS OF
ANNULUS (mm)
S ign
Nominal
Measured mean va lues
T-14
1 4 . 0 0 0
1 4 . 0 8 6
T-18
18 .000
17.990
T-22
2 2 . 0 0 0
2 1 . 7 2 0
The dimensions of the channel (inner and outer diameters) were
careful ly measured at d i f ferent ax ia l pos i t ions . The actual
values of the rod radius measured a t the t i p of the r ibs a rs
summarised in Table A.6.
Rod No.
4A
4B
Mean Measured value (DPI)
4.305
4.308
4.306
4.308
4.305
4.307
4.306
4.308
4.309
4.305
4.300
4.290
4.180
4.200
4.290
Rod No.
18
19
20
21
22
23
24
25
26
27
28
29
30
31
Mean measured value (m)
4.295
4.200
4.295
4.300
4.255
4.265
4.305
4.300
4.290
4.310
4.228
4.308
4.200
4.306
TABLE A.6 Mean values of rod radius (Measured at rib t ips ) . Basic nominal value for a l l rods is 4.300 mm

- 202 -
Each rod was supported by four spacers (SI to S4 in Fig. A.2),
and was uniformly electrically heated (over a length of 1000 mm)
by an indirect method (alternative current passing through the
electrically insulated CrNi heater). The obtainable heat fluxes
were very low in comparison with the GCFR values, but typical
GCFR values of the T /T, ratios were reached. w b
To measure the pressure drop along the annulus, three tappings
were provided, at each of four measuring points on the outer
tube (Dl to D4 in Fig. A.2). The inlet air pressure and the
barometric pressure were also measured.
The air bulk temperature was measured at the inlet and the out
let of the annulus (T. and T in Fig. A.2). The rod surface
temperatures were obtained from the measured internal tempe
ratures of the rod and the calculated temperature gradient
through the canning (four thermocouples Tl to T4 in Fig. A.2
were installed inside the rod at 90 intervals around the
circumference). The wall temperature of the outer tube (T in
Fig. A.2) was measured at the end of the heated section. This
temperature and the room temperature were measured to determine
the heat losses.
The characteristics operating data
summarised in the Table A.7.
TABLE A. 7
OPERATING DATA OF "ROHAN" EXPERIMENT
of the ROHAN experiment are
GEOMETRY
COOLAJiT
PRESSURE
COOLANT
TEMPERATURE
AV. VELOCITY
IN CHANNEL
IN
OUT
MIN.
MAX.
MACH NUMBER
REYNOLDS
NUMBER
KIN.
MAX.
KEATING POWER
HEAT FLUX
MAX. ROUGH WALL TEMPERATURE
ANNULUS
AIR (Pr x 0 , 7 )
1,2 - 2 t a r
298 °K
363 °K
2 Rl/S
73 m/»
< 0,3
1 . 0 . I 0 }
6 , 0 . 1 0 *
0 - 1J00 W
0 - » ,6 W/cm2
•v 460 °K

- 203 -
A.3.2 Measuring equipment
Temperaturejmeasurements
Chromel/Alumel thermocouples were used for temperature measure
ments. The room temperature was additionally checked by a Hg
thermometer- The following uncertainties of the temperature
measurements, given in K, are estimated:
inlet air temperature ± 0.5
outlet air temperature ± 0.8
temperature of outer wall ± 0.6
rod temperatures < ±2.3
room temperature + 0.5
All these temperatures were continously measured and recorded.
Measurements and instruments used for the determination of mass
flow:
- absolute pressure before orifice: U-tube measurement (Hg) -4
with an accuracy of ± 7 • 10 bar
- pressure drop across the orifice: micromanometer with an
uncertainly of ± 5 • 10 bar
Measurements and instruments for friction factor calculation:
- absolute value of the inlet pressure: U-tube measurements -3
(Hg) with an accuracy of ± 1.4 • 10 bar
- pressure drop on the three axial sections: u-tube measurements -4
(water or tetrachloro-methane) with an accuracy of ± 10 bc.rf
for low pressure drops, inclined pressure gauges with an un--5 certainty of ± 10 bar

- 204 -
The total electric heat power to the rod was determined by
measuring voltage and current through the resistance heater
and the electrical losses in the connections were subtracted.
The accuracies of the instruments were respectively ± 0.45 V
and ± 0. .4 A. This gives a possible error of approximately
± 1.6 % for the nominal heat power.
Mass_flow_measurements
Two different calibrated orifices were installed to determine
the mass flow of air. Usually the 50/100 mm (orifice opening/
tube diameter) orifice, suitable for Reynolds numbers higher
than approximately 5 • 10 , was used. At Reynolds numbers
lower then 5 • 10 , a part of the inlet section together with
the orifice was exchanged. The dimensions of this second
orifice were 25/50 mm.

- 205 -
A.4 INVESTIGATION APPROACH
A.4.1 Method of testing
Combining the results of dimensional analysis and the circum
scribed test conditions, the corresponding equations reduced
to:
St = Prm • Pst (Re, F r s t , 6-, E = , *) ,A.2)
The influence of the different parameters in the equations
(A.l) and (A.2) were investigated by the usual method described
in the following. The tests were divided intc different series.
In each of these series only one of the dimensionless para
meters was systematically varied. To determine the influence
of different parameters, the experimental results were trans
formed to uniform boundary conditions and then compared.
To investigate the influence of the channel geometry , the same
roughened surface should be tested in different forms of the
experimental channel. In the ROHAN experiment a comparative
study of the roughness performance is desired. Therefore, a
general investigation of the dimensionless factor P . was not c, l
needed.
The behaviour of the GCPR core, at the low helium flow rates
which may occur with part-load or depressurised reactor con
ditions, becomes important from the safety point of view. In
order to obtain the required information for the GCPR design,
the rough surfaces were investigated over a wide range of

- 206 -
Reynolds numbers, starting at high turbulent Re numbers and
going down to the laminar flow region.
To investigate the influence of the rib shape or profile (F . ) , r, 1
the different roughness shapes were tested in the same experi
mental channel. All tests were carried out in the annular channel
geometry but to vary the h/d. ratio (to investigate the effect
of the relative flow thickness), different outer diameters of
the annulus were chosen. The influence of the characteristic
dimensionless parameters h/d. and (p-w)/h is well known for
the rectangular rib form. At the time when the experiment was
planned it was assumed that the thermohydraulic performances
of the different roughnesses were similarly influenced by the
parameters h/d. and (p-w)/h. This assumption was confirmed,
and, additionally, the effect of w/h on the Stanton number
was investigated.
A.4.2 Measuring procedure
The measurement series was divided into: calibration measure
ments, heat loss determination, smooth rod and rough rod
measurements. Each of these measurements was carried out at
10 or more different mass flows in the Reynolds number range 4 4
between 10 and 6 • 10 . In most cases this range was extended
to even lower Re numbers. In the annulus with the 18 mm outer
tube, even the laminar region was studied. The intervals between
adiabatic measurements were relatively short. When changing flow
and electric power conditions in the heated cases, enough time
was allowed for the conditions to stabilise. At very low mass
flows, approximately 40-minute time intervals were needed. Be
fore each measuring series all instruments were carefully
checked and their correct functioning confirmed by appropriate
tea*- runs.

- 207 -
Calibration rr^asurements
To calibrate the experimental equipment the friction losses in
all three smooth tubes used for the annular test section were
measured. The friction factor for smooth tubes is well known,
and these ireasurements were a good check of the pressure drop
and mass flow measurements. The results are given in Fig. A.3
and can be represented by the following equation:
= 0.3 Re -0.25 (A.3)
two
TESTS ECTlOlf
SIGNS
U
0 W
0 22
0
3 4 5 t 7 I • »* _ _ f • o.n«. n*"025 (iu»iu») /
_ _ ^ _ _ _ r • o.i«»« R«"°-2 — 1/jTt 2'1( (KfVT) • O.t (rraitftl,MibuTO4M>
r • o.3« *• -o.«
FIG. A.3; Fric"ion factor measured in three tubes used for the outer annu> is wall
This equation gives results which are approximately 5 % lower 4
than the well-known equation of Blasius for Re between 10
and 10 . The deviation can be explained by increasing measuring
errors towards lower pressure drops (over the same measuring
length and at equal Re, the pressure drop in a smooth tube is
approximately one order of magnitude lower than in the equi
valent smooth annulus).

- 208 -
The accuracy of the commercial thermocouples was checked, before
their installation (against the manufacturer's data) and also
under built-in conditions at different mean gas temperatures in
the test-section.
The level of the mean gas temperatures in the test-section was
not high (about 340 K), but the corresponding heat losses at
low mass flow were still important when making a proper total
energy balance. To determine these losses as a function of the
temperature difference between the cuter wall and the ambient,
the air was preheated (see Fig. A.l) before entering the
test section. Measurements were made at different mass flows
and mean gas temperatures in the test-section. To obtain a
good heat balance (deviation lower than approximately ± 5 %)
the required accuracy of the heat loss determination was ± 20 %.
The following equation was found to be a good approximation for
the heat losses calculation:
QHL • 1 3*4 • Fw,out <*g " V (A-4>
This series of measurements was also used for an additional
check of the temperature measuring devices.
§!D22£l}-SD5_E2H9lJ_£23_5!§S§H£S5!§D£§
The measurements with the smooth rod were carried out in all
three annular channels with different r./r2 ratios. An exten
sive measurement programme was needed in these series, in
order to obtain good basic values for comparison with the
rough rod results.

- 209 -
The programme of measurements with different rough surfaces
was slightly modified, according to the importance of the par
ticular surface. Only a few of the rough rods were tested over
the whole Reynolds number range. In the smallest test section
(T - 14) the pressure drop was relatively high and the piston
compressor was required to obtain the highest Reynolds numbers.
A.5 RESULTS
A.5.1 Evaluation of results
The evaluation of measured data was performed on a CDC 6500
computer. The inptrument readings were directly used as input
values for the evaluation code. For these calculations the
annulus was divided into three axial sections, corresponding
to the 4 axial pressure drop measuring positions. The air
properties were calculated, using the mean pressure and tem
perature values in the corresponding axial section. To deter
mine the friction factor of an annular channel, the accurate
dimensions of the inner and outer diameter are of great im
portance (dependency of the fifth power). In the case of rough
surfaces, the definition of the wall reference coordinate
("origin" for the definition of the distance from the wall)
is very difficult. This definition has been investigated by
many authors and different inner radius values have been sugge
sted, depending on the roughness geometry (particularly im
portant is the (p-w)/h parameter). The mean volumetric radius,
introduced by Nikuradse, has been used by different investi
gators as the origin, and was primarily applied also for the
evaluation of the ROHAN results. Later the radius of the rib
roots was found to be more adequate and was therefore chosen

- 210 -
for final evaluations.
The mass flow was calculated according to the usual equations,
considering the general VDI guide lines:
m = c (1 - C o ex P
AP A
o B \
AP • P - ^ S tt.5)
o
The flow cross-section, the discharge coefficient and other
constants are contained within the value ol
the constant for the expansion coefficient,
constants are contained within the value of C . C represents o ex
The Reynolds number for each axial section was defined using
the local dynamic viscosity:
Re. = —73—--3—r— (A. 6) 1 TT(dlv+d2)yi
In heated cases, where the dynamic viscosity changes consi
derably, the mean value in the corresponding axial section
v/as always used.
S£f§§H£f_^£2Ei-iD^-l£i££^25.If££2£
For friction factor calculation, the pressure losses over the
spacers together with the acceleration pressure losses (de
duction of the momentum change of the air stream in the axial
direction) were considered. The pressure drop over the spacers
was determined by comparison of the measured pressure drops
along the test section (one of the axial sections did not
contain any spacer). The following equation for the spacer
pressure drop was obtained as the result of these comparisons:

- 211 -
AP = C „ _, • Re sg sg,d2
1.75 (A. 7)
The constant C . changes, depending on the outer diameter of sg, l
the annulus:
sg,14
:sg,18
:sg,22
= 2.55 • 10 -6
= 1.02 • 10 -6
= 5.10 • 10 -7
The frictional pressure drop for adiabatic flow conditions was
obtained from the following equation:
AP, . = AP . - AP . - ^- (?)2ln ^ ± -f,i m,i sg,i p. A P Q u t a
(A.8)
In heated cases, the last term in equation A.8, representing
the acceleration pressure drop, is exchanged by:
" a c i " <!>* out,i in,i P* • P . . P" • P-
out,i 'in,! p Pout,i
(A.9)
The basic friction factor equation
2 d h dP
p u2 d x (A.10)
was slightly transformed giving:
- A 2 APi f i - 4 < r 2 ' r l v > P <l> ALT (A.11)
- 212 -
Heat_flux_and_Stanton_number
To determine the convective heat flux the heat losses by radia
tion were also considered:
«r" - Sr • °o " Fl (Twl4 " Tw2 4 ) (A-12)
where the radiation emissivity was calculated from the
equation:
e = _± (A.13) 1 1 1
i—+ r (e - x )
er,l F2 r,2
To check the quality of the temperature and power measurements,
an overall heat balance was made. Only the measured data having
a heat balance deviation smaller than ± 3 % were considered.
To calculate the Stanton number, the bulk temperature of the
gas and the wall temperature of the rod were needed:
st ' *"• °D < w (A'14' p w o
The bulk temperature of the air at different axial positions
was calculated by interpolation on the basis of measured inlet
and outlet temperatures, assuming constant heat flux over the
total heated length.
very good design of the heater rods, with negligible distortion
of the temperature field (checked by electrical analogy),
allowed very accurate measurement to be made of the inner
canning temperature. The surface temperatures were calculated
by extrapolation of the temperature drop through the canning.

- 213 -
q * rn, ri
T • T r- - in — (A.15) w m k r \« ••»•-'#
c m
The heat conductivity of the stainless steel canning was de
termined at the measured canning temperature T .
A.5.2 Presentation of results
The friction factor and the Stanton number for the entire an-
nulus were chosen for the presentation of results as a function
of the measured Reynolds number. This information, together with
some other typical dimensions of experimental equipment, can
be used es a starting point for the different methods of trans
formation to uniform boundary conditions. As long as no final
overall decision about a standard transformation method has
been reached, these basic results are of great importance. The
complete set of experimental results, presented in Tables as a
direct computer code output, is given in EIR Internal Report
TM-IN-694. To show some typical changes in friction factor and
Stanton number, depending on the different roughness form, the
results of a few characteristic roughnesses are presented in
Figs. A.4 to A.7.

*
f- laminar
\ -V-
7? 4
T v W ^ f » <9»^«
M 4 _ A - f * *
\ \
0'fi ***^
B*
f s ( Nikuradse)
«^<s -jft- «>_s j ^ a i l h - t ^
•^ <98°8^ro^:
' • k | Sts(Mc Adams)
10J J 4 1 • T • » v->4
Re 10* 1 4 5 »
ROD No f( heated) ffadiab) and St
1
0
22
0
25
o
26
v
27
A
FIG.A.4: F r i c t i o n f ac to r s and Stanton numbers for d i f f e r en t rods in 14 mm channel
10-' i
! '
i —
f- laminar
\ „_X
\ -X
U T^y;
oT
> V-
° o tn'g' S3
10-2 + i * * — i
f« (Nikuradse)
^ , W > Si*
;p* £* ILA^! afrff-a0
St 6>8°8°3oq^ O-fb
• • • •
Sts(Mc Adams) • ' • i •
10' ) * I ' ' • 1 i n *
-Re i * » i
ROD No f(heated) Kadiab) and St
1
o
24
o
15
0
19
V
16
a
FIG.A.5; F r i c t ion fac tors and Stanton numbers for d i f f e r en t rods in 14 mm channel

ROD No. f( heated) KxftabJand St
1
o
24
o
15
o
19
w
16
A
FIG.A.6: Friction factors and Stanton numbers for different rods in 18 mm channel
ROD No. f (heated) f (adiab)and St
1 • o
22 • o
25 • o
26 » V
27 * A
I
to M 1/1
I
FIG.A.7; Friction factors and Stanton numbers for different rods in 18 mm channel

- 216 -
A.5.3 Uncertainties in the results
The uncertainties in the results were calculated according to
a general theory for similar experimental investigations. The
calculation is based on the estimated uncertainties of the
measured values and of the geometrical dimensions (given in
Tables A.l to A.6). The uncertainties generally change with the
flow and heating conditions. The calculated values are summarised
in Table A.8. All these values were obtained for normal heating
conditions. Because of the small deviations from these condi
tions, no corrections in particular cases were needed. The
given values are the highest of the corresponding Reynolds
number range and were normally obtained at the lowest Re num
bers (at higher Re a better accuracy was generally reached).
CHANNEL
DIAMETER (inn)
18 Re < 3.103
Re > 3.103
14
22
<±
<i
<*
<±
UNCERTAINTIES {%)
Re
5,7
2,6
2,5
2,2
f
<± 15
<± 4,6
<± 4,8
i. 6,4
St
<±6,4
<± 8,5
<* 7,2
±5,6
TABLE A.8 Uncertainties of results measured in annulus

- 217 -
NOMENCLATURE
2 a - thermal diffusivity (m /s)
2 A - flow area or cross-section (m ) also constant of
logarithmic law (see equation 2.18)
B - constant of velocity logarithmic law in smooth
channel (see equation 2.22)
B - constant of temperature logarithmic law in smooth
channel (see equation 2.23)
Bi - Biot number
c - specific heat (J/kg K)
C. - constants in different equations
d - diameter (m)
d. - hydraulic diameter (m)
e - emissivity of radiation
f - friction factor
fx - friction factor multiplier
2 P - surface (m )
F. - different functions
F , - dimensionless function describing the influence
of channel geometry on friction factor or Stanton
number respectively
F - temperature function considering particular channel CjT
geometry
F . - dimensionless function describing the influence
of the roughness shape
F - velocity function considering particular channel
geometry
G - roughness function for heat transport

- 218 -
heat transfer coefficient (W/m K)
rib height (m)
dimensionless rib height or local rib Reynolds
number (h»u /v)
index of performance (simple)
complex index of performance
conductivity (W/m K)
ratios of some typical variables in WP transformation
integration constant (defined by equation 2.20)
length (m)
exponent of the Prandtl number power function
mass flow (kg/s)
Mach number
exponent of power functions
maximum number of independent dimensionless groups
Nusselt number
rib pitch (m)
2 pressure (N/m )
Prandtl number
turbulent Prandtl number
relative pressure loss
heat flux (W/m2)
heat power (W)
radius (m)
dimensionless radius (r*u /v) T
roughness function of momentum transport
Reynolds number
- 219 -
Stanton number
Stanton number multiplier
thickness of canning (m)
absolute temperature (time-mean) ( K)
temperature fluctuation (°K)
dimensionless temperature defined by equation 4.24
abbreviations for different test-sections
axial (time mean) velocity (m/s)
velocity of sound (m/s)
axial velocity fluctuation (m/s)
dimensionless axial velocity (u/u )(equation 4.23)
shear stress velocity (/TW/P) (m/s)
wetted perimeter (m)
radial velocity (time mean) (m/s)
radial velocity fluctuation (m/s)
rib width (m)
axial distance (m)
distance from the channel wall (m)
dimensionless wall distance (yu /v)
spiral angle ( )
angle of trapezoidal rib ( )
3 density (kg/m )
2 kinematic viscosity (m /s)
pressure dorp coefficient
dynamic viscosity (kg/m s)
- 220 -
2 shear stress (N/ra )
difference
heat conductivity (W/m K)
eddy diffusivity of heat 2
eddy conductivity (m /s)
eddy diffusivity of momentum 2
eddy viscosity (m /s)
standard deviation (%)
Stefan Boltzmann constant = 5.67*10 (W/m K )
SUBSCRIPTS
1 - transformed value for inner channel or inner
channel wall
2 - transformed value for outer channel or outer
channel wall
a - analytical
ac - acceleration
b - bulk
B - barometric
c - calculated or channel (also canning or convection)
eff - effective
ex - external or expansion
t - related to friction factor or frictional
g - geometry function or gas
G - related to roughness function G
HL - heat losses
i - generally applied index
T
A
A
H
M
o

- 221 -
inlet, internal
local
over a certain length
maximum velocity position or measured
nominal
zero-shear position or basic conditions
outlet or outer
orifice
rough or radiation
rough channel, also related to roughness function R
smooth
grid spacer
related to Stanton number
zero heat transfer position
tube
various pressure losses or volumetric
wall
mean value over the cross section (e.g. mean velo
city u)

- 222 -
A C K N O W L E D G M E N T S
The author's research work on rough surfaces was started in
1970. The information upon which this report is based was also
extensively used in the author's PhD thesis (1980, written in
Slovenian, his native tongue).
The author wishes to aknowledge the assistance of many collegues
at EIR who have contributed to the progress of this work, parti
cularly M.J. Lewis, G. MarkSczy, U. Stiefel, G. Varadi,
P. Barroyer and M. Huggenberger.
Exchange of information was also performed, within the frame
work of the NEA organisation, with the participants at the NEA
Heat Transfer Specialists Meetings, particularly with research
workers from: KfK, Karlsruhe (W. Baumann, M. Dalle Donne,
E. Meerwald, L. Meyer and K. Rehme), CEGB, Berkely (H.G. Lyall
and M.A.M. Pirie) and UKAEA Windscale (A.C. Rapier and
D. Wilkie). These contacts, accompanied by extensive dis
cussions, contributed significantly to the research efforts.
Many thanks are also due to all those who helped to conduct
the experimental investigations, in particular to H. NSthiger
and P. Beck for their careful measurements and operation of
the test loop.
Special thanks are extended to EIR for supporting the investi
gations and allowing the results to be used for the author's
PhD thesis.