round-robin-test pass-by noise tracks europe
TRANSCRIPT

Round-Robin-Test Pass-by Noise tracks Europe
Final report, 17th January 2017
Gregor Richartz, Porsche
Manuel Männel, Müller-BBM
Christoph Wibmer, Fakt motion GmbH
Dr. Herbert Finsterhölzl, Consultant
EXCERPT for GRBP Task Force on Measurement Uncertainties
Brussels, 22nd May 2019
Review by Hans-Martin Gerhard, Porsche

Confidential C
22.05.2019 Round-Robin-Test Europe Page 2
Content
1. Motivation and objectives
2. Tested Proving Grounds
3. Instrumentation
4. Pass-by measurements
4.1. Measurement process
4.2. Definition of rolling sound curve
4.3. Comparison of test tracks
4.4. Comparison of tyres
5. Surface measurements
5.1. Measurement process
5.2. Comparison of MPD and shape factor alpha
5.3. Comparison of mechanical impedance
6. Correlation of surface parameters and pass-by noise results
7. Detection of driving directions by surface parameters and pass-by noise results
8. Summary and conclusions
9. Outlook

Confidential C
22.05.2019 Round-Robin-Test Europe Page 3
Why do we call the test Round-Robin ?
• The term round-robin denotes…
…in computer science a process that computing processes allocates limited resources
…in quality assurance, a ring trial under identical conditions
…a tournament format, a round-robin tournament
• The term dates from the 17th-century French ruban rond (round ribbon). This described the
practice of signatories to petitions against authority (usually Government officials petitioning
the Crown) appending their names on a document in a non-hierarchical circle or ribbon
pattern (and so disguising the order in which they have signed) so that none may be identified as
a ringleader. This practice was adopted by sailors petitioning officers in the Royal Navy(first
recorded 1731).
• First of all French government officials should practice the round robin,
by fixing tapes under their petitions in a circle instead of sign with their
name. This type of signature is in French so called ruban rond
(literally translated to tape or ribbon around) what from in the
Anglo-Saxon language area came to round robin by oral tradition.

Confidential C
22.05.2019 Round-Robin-Test Europe Page 4
Motivation and objectives
• Assessment of tyre road noise with OEM tires with regard to limit value
reduction to 68dB (A) according to R540 / 2014 and upcoming review of the
limits for tires according to GSR661 / 2009
• Gain experience with ISO10844:2014
• Comparative assessment of the track surface (eg diversification)
• Physical, acoustic description of the track surface (parameters, micro /
macrogeometry)
• Evaluation of parameters
• Collect suggestions for future review of ISO-standard
• Comparison of track surfaces in Europe among themselves and compared
to Chinese tracks

Confidential C
22.05.2019 Round-Robin-Test Europe Page 5
Almeria
Aprilia
Colmar-Berg
Vizzola
Weissach Neustadt
Sindelfingen
Dudenhofen
Erding
Memmingerberg
Wolfsburg
All tracks are build according to
ISO10844-2014
Tracks and participants

Confidential C
22.05.2019 Round-Robin-Test Europe Page 6
Pictures of road surface
Test Track 5
Test Track 6
Test Track 2Test Track 1 Test Track 4
Test Track 7 Test Track 9 Test Track 10
Test Track 12Test Track 11 Test Track 14Test Track 13

Confidential C
22.05.2019 Round-Robin-Test Europe Page 7
Tyres and test car
Tested tyres:
• Four different typical summer tyres by different manufactures, size 205/55 R16
• One typical summer tyre, size 245/40 R18
• One slick tyre (without negative profile), size 205/55 R16
• One SRTT (TIGER PAW M+S), size 225/60 R16
Test car:
• VW e-Golf VII
• Engine power: 85 kW
• Transmission: 1-gear-automatic
• 4 Doors
Measured values:
• Sound level left/right [dB(A)], Vehicle speed [km/h], Ambient sound level (before each run) [dB(A)],
Air temperature [°C], Surface temperature [°C], Tyre temperature [°C], Air pressure [mbar],
Humidity [%], Wind speed [m/s], Wind direction [deg]

Confidential C
22.05.2019 Round-Robin-Test Europe Page 8
Driving conditions:
• Rolling at different speeds from 40-80 km/h (in 10km/h-steps) 2 runs for each speed level
• Cruising 45/55/65km/h 2 runs for each speed level
• Cruising at 50km/h 6 runs
• Acceleration with 2m/s² as well 50km/h at line PP’ 6 runs
Test conditions
Tolerances:
• Max. speed variation: ±0,5 km/h from target speed
• Max. level difference: left-right ≤ 0,6 dB for each run in the same direction
Ambient and weather conditions:
• low ambient noise: expected measured sound level minus 15 dB(A)
• Surface Temperature: 10°C – 40°C

Confidential C
Measurement system
22.05.2019 Round-Robin-Test Europe Page 9
light barrier
test track exit
light barrier
test track entrance
Quelle: Stalker
radar system for
speed measurements
Quelle: Reinhardt
weather station
surface
temperature
Measurement system
Quelle: GRAS
Microphone
right side
Quelle: GRAS
Microphone
left side
Quelle: Sick
Quelle: Müller BBM

Confidential C
22.05.2019 Round-Robin-Test Europe Page 10
Sensor installed in the
left front wheel case
Telemetric transmitter Telemetric receiver
Quelle: Volkswagen
Tyre temperature measurement system

Confidential C
22.05.2019 Round-Robin-Test Europe Page 11
Tyre measurements
0°
270°
180°
90°
inside outside
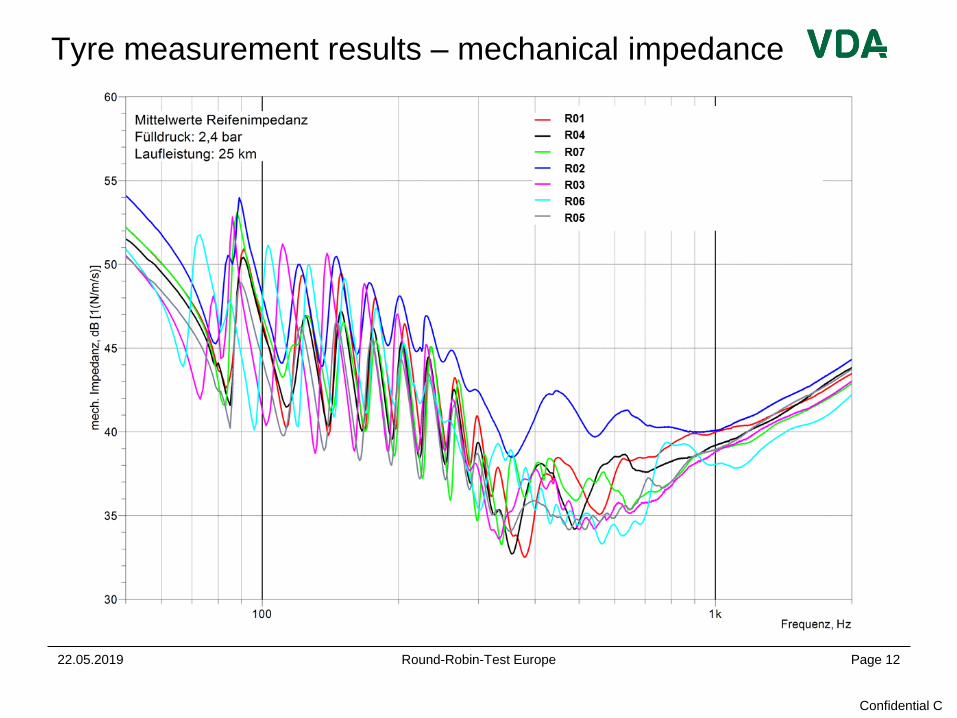
• Measurement of mechanical impedance of all 6 (4 driving, 2 backup) tyres of each type (42 tyres)
at the beginning, in the middle and at the end of the pass-by measurements.
Confidential C
22.05.2019 Round-Robin-Test Europe Page 12
Tyre measurement results – mechanical impedance

Confidential C
22.05.2019 Round-Robin-Test Europe Page 13
Comparison sound level cruising vs. rolling

Confidential C
22.05.2019 Round-Robin-Test Europe Page 14
Comparison of test tracks and tyres
Cruising at 50 kph
- The sound level spread of the profile-tyres is approx. 1,6-3,6 dB
(w/o SRTT 1,4-2,4 dB)
- The sound level spread of the tracks is approx. 3,2-4,4 dB

Confidential C
Comparison of test tracks and tyres
Accelerating at 50 kph
22.05.2019 Round-Robin-Test Europe Page 15
- The sound level spread of the profile-tyres is approx. 2,5-3,5 dB
(w/o SRTT 1,0-3,0 dB)
- The sound level spread of the tracks is approx. 4,1-5,0 dB

Confidential C
Comparison sound level cruise vs. accelerated
22.05.2019 Round-Robin-Test Europe Page 16

Confidential C
22.05.2019 Round-Robin-Test Europe Page 17
Content
1. Motivation and objectives
2. Tested Proving Grounds
3. Instrumentation
4. Pass-by measurements
4.1. Measurement process
4.2. Definition of rolling sound curve
4.3. Comparison of test tracks
4.4. Comparison of tyres
5. Surface measurements
5.1. Measurement process
5.2. Comparison of MPD and shape factor alpha
5.3. Comparison of mechanical impedance
6. Correlation of surface parameters and pass-by noise results
7. Detection of driving directions by surface parameters and pass-by noise results
8. Summary and conclusions
9. Outlook

Confidential C
22.05.2019 Round-Robin-Test Europe Page 18
Measurement methods - Texture
• Mean Profile Depth (MPD),
according to ISO 13473-1
• Shape factor g
• Roughness spectrum

Confidential C
22.05.2019 Round-Robin-Test Europe Page 19
Measurement methods - Texture
8 Measurement points according to
ISO 10844:2014
6 parallel profiles (distanced by 20 mm)
Scanning length: 2 m
Horizontal resolution: 0,2 mm
Vertical resolution: 8 mm
Additionally 4 measurement points
close to the PP’
180 parallel profiles (distanced by
1mm)
Mikrofonlinie PP‘
10 m
10 m
5 m2 m
2 m
MP1
MP3
MP5
MP7
MP2
MP4
MP6
MP8

Confidential C
22.05.2019 Round-Robin-Test Europe Page 20
Textur evaluation for MPD and g
Raw data per ISO-measurement point:
6 profiles each 2 meters long
resolution in driving direction: 0.2 mm
6*2*1/0.0002 = 60.000 Points
Apply high pass filter to reduce unevenness
Divide each profile in segements of 10 cm
Calculate MPD and g for each 10 cm segment
2m / 10 cm * 6 Profiles/measurement point =
= 120 MPD and g values per measurement point

Confidential C
22.05.2019 Round-Robin-Test Europe Page 21
-2000
-1800
-1600
-1400
-1200
-1000
-800
-600
-400
-200
0
Text
ure
de
pth
, mm
10 cm
-2000
-1800
-1600
-1400
-1200
-1000
-800
-600
-400
-200
0
Text
ure
de
pth
, mm
10 cm
Principle – evaluation of MPD value
Mean value = -407 mm
Mean value = -613 mm
Max height 1st half of the segment = -74 mm
Max height 2nd half of the segment = -52 mm
MPD = (-74 mm - 52mm)/2 + 407mm = 344 mm
= 0,34 mm
Max height 1st half of the segment = -38 mm
Max height 2nd half of the segment = -8 mm
MPD = (-38 mm - 8mm)/2 + 613mm = 590 mm
= 0,59 mm

Confidential C
22.05.2019 Round-Robin-Test Europe Page 22
-2070
-1570
-1070
-570
-70
Text
ure
de
pth
, mm
10 cm
Principle – evaluation of shape factor g
-1710
-1510
-1310
-1110
-910
-710
-510
-310
-110
Text
ure
de
pth
, mm
10 cm-1710
-1510
-1310
-1110
-910
-710
-510
-310
-110
Text
ure
de
pth
, mm
10 cm
-2070
-1570
-1070
-570
-70
Text
ure
de
pth
, mm
10 cm
-1710
-1510
-1310
-1110
-910
-710
-510
-310
-110
Text
ure
de
pth
, mm
10 cm
-2070
-1570
-1070
-570
-70
Text
ure
de
pth
, mm
10 cm
-1710
-1510
-1310
-1110
-910
-710
-510
-310
-110
Text
ure
de
pth
, mm
10 cm
-2070
-1570
-1070
-570
-70
Text
ure
de
pth
, mm
10 cm
-1710
-1510
-1310
-1110
-910
-710
-510
-310
-110
Text
ure
de
pth
, mm
10 cm
-2070
-1570
-1070
-570
-70
Text
ure
de
pth
, mm
10 cm
-1710
-1510
-1310
-1110
-910
-710
-510
-310
-110
Text
ure
de
pth
, mm
10 cm
-2070
-1570
-1070
-570
-70
Text
ure
de
pth
, mm
10 cm
0
10
20
30
40
50
60
70
80
90
100
0 20 40 60 80 100
Inte
rse
ctio
n d
ep
th, %
cross section ratio, %
0
10
20
30
40
50
60
70
80
90
100
0 20 40 60 80 100
inte
rse
ctio
n d
ep
th, %
cross section ratio, %
0
10
20
30
40
50
60
70
80
90
100
0 20 40 60 80 100
inte
rse
ctio
n d
ep
th, %
cross section ratio, %
0
10
20
30
40
50
60
70
80
90
100
0 20 40 60 80 100
Inte
rse
ctio
n d
ep
th, %
cross section ratio, %
g = 97%
g = 86%

Confidential C
22.05.2019 Round-Robin-Test Europe Page 23
Measurement methods – Acoustic Absorption
• Measurement of the transfer
function (sound pressure level and
velocity, including reflections);
• Calculation of the surface
impedance;
• Derivation of the Acoustic
Absorption coefficient

Confidential C
22.05.2019 Round-Robin-Test Europe Page 24
Measurement methods – Acoustic Absorption
Microphone line PP‘
5 m
10 m
10 m
8 Measurement points according to
ISO 10844:2014 on the track +
6 measurement points on the
propagation area
2 additional measurements with the p-u
probe near the P-P’ line
Spherical sound field
Measurements in 4 angles (90°, 75°,
60°, 45°)

Confidential C
22.05.2019 Round-Robin-Test Europe Page 25
Measurement methods – Mechanical Impedance
Road Surface Tyres
𝑍𝑚𝑒𝑐ℎ =Ԧ𝐹
Ԧ𝑣= Ԧ𝐹 ∙
1
𝑎 𝑑𝑡

Confidential C
22.05.2019 Round-Robin-Test Europe Page 26
Measurement methods – Mechanical Impedance
10 m
10 m
Measurements at both lanes
Average of 3 measurements
very close to each other
Microphone line PP‘

Confidential C
22.05.2019 Round-Robin-Test Europe Page 27
Evaluation of MPD and a as standard parameters
Track 1
-
Track 2
-
Track 4
-

Confidential C
22.05.2019 Round-Robin-Test Europe Page 28
Evaluation of MPD and a as standard parameters
Track 5
-
Track 6
-
Track 7
-

Confidential C
22.05.2019 Round-Robin-Test Europe Page 29
Evaluation of MPD and a as standard parameters
0,00
0,20
0,40
0,60
0,80
1,00
1 2 3 4 5 6 7 8
MPD
, mm
Measurement position
MPD value Upper limit Lower limit
Track 9
-
Track 10
-
Track 11
-

Confidential C
22.05.2019 Round-Robin-Test Europe Page 30
Evaluation of MPD and a as standard parameters
Track 12
-
Track 13
-
Track 14
-

Confidential C
22.05.2019 Round-Robin-Test Europe Page 31
Evaluation of MPD and a as standard parameters
Track 15
-

Confidential C
22.05.2019 Round-Robin-Test Europe Page 32
Evaluation of mechanical impedance – Road Surface

Confidential C
22.05.2019 Round-Robin-Test Europe Page 33
Content
1. Motivation and objectives
2. Tested Proving Grounds
3. Instrumentation
4. Pass-by measurements
4.1. Measurement process
4.2. Definition of rolling sound curve
4.3. Comparison of test tracks
4.4. Comparison of tyres
5. Surface measurements
5.1. Measurement process
5.2. Comparison of MPD and shape factor alpha
5.3. Comparison of mechanical impedance
6. Correlation of surface parameters and pass-by noise results
7. Detection of driving directions by surface parameters and pass-by noise results
8. Summary and conclusions
9. Outlook

Confidential C
22.05.2019 Round-Robin-Test Europe Page 34
Pass-by noise vs. surface parameters
Influence of surface properties (MPD, shape factor, sound absorption)
Present knowledge
• Increasing profile depth increases pass-by noise:
the higher the profile depth is, the deeper the rubber is penetrated by the
road surface irregularities;
• Increasing shape factor decreases pass-by noise:
the lower the shape factor is, the less contact area is available in the tyre-
road-contact;
• Increasing sound absorption decreases pass-by noise:
Horn effect is reduced and propagation damping takes place.
• BUT: all of these parameters depend on each other, in
granular media, e.g. no sound absorption if there are no
irregularities!

Confidential C
22.05.2019 Round-Robin-Test Europe Page 35
Pass-by noise vs. surface parameters
Bringing data together
Mean profile depth MPD Shape factor, g
Sound absorption amean, Points 3-6Pass-By noise Lcruise50, alltyres ex. slick
VDA_Number Lcruise50, alltyres ex. Slick
1 64,25
2 65,37
4 66,37
5 64,26
6 64,06
7 64,79
9 63,95
10 63,15
11 63,36
12 60,80
13 64,32
14 65,05
15 66,39
VDA number 1 2 3 4 5 6 7 8
1 0,41 0,55 0,45 0,49 0,44 0,46 0,36 0,48
2 0,57 0,58 0,59 0,60 0,62 0,59 0,60 0,60
4 0,41 0,39 0,45 0,38 0,38 0,34 0,40 0,43
5 0,33 0,35 0,37 0,41 0,39 0,43 0,38 0,42
6 0,36 0,35 0,32 0,35 0,32 0,35 0,36 0,35
7 0,40 0,41 0,42 0,46 0,35 0,44 0,41 0,44
9 0,55 0,52 0,73 0,77 0,69 0,80 0,65 0,53
10 0,32 0,31 0,30 0,30 0,32 0,31 0,30 0,29
11 0,35 0,32 0,31 0,30 0,31 0,31 0,32 0,30
12 0,45 0,49 0,47 0,47 0,48 0,50 0,46 0,49
13 0,32 0,30 0,34 0,33 0,31 0,35 0,31 0,37
14 x x 0,43 0,46 0,44 0,47 0,42 0,39
15 0,49 0,54 0,52 0,58 0,55 0,54 0,43 0,53
measurement position
Mechanical
Impedance Zsurf
VDA number 315 400 500 630 800 1000 1250 1600
1 0,02 0,02 0,03 0,04 0,03 0,05 0,05 0,03
2 0,02 0,03 0,03 0,04 0,04 0,04 0,05 0,04
4 0,01 0,00 0,00 0,00 0,01 0,01 0,00 0,00
5 0,02 0,02 0,02 0,03 0,03 0,03 0,03 0,02
6 0,01 0,00 0,00 0,02 0,01 0,01 0,01 0,01
7 0,02 0,03 0,02 0,03 0,02 0,02 0,04 0,02
9 0,17 0,15 0,13 0,14 0,13 0,13 0,13 0,11
10 0,01 0,01 0,02 0,04 0,02 0,02 0,03 0,01
11 0,02 0,02 0,02 0,03 0,03 0,03 0,03 0,02
12 0,11 0,12 0,12 0,15 0,14 0,13 0,14 0,10
13 0,00 0,01 0,01 0,02 0,01 0,01 0,02 0,00
14 0,03 0,02 0,03 0,05 0,04 0,04 0,06 0,05
15 0,01 0,02 0,01 0,01 0,01 0,02 0,00 0,01
f in Hz
VDA_Number MechImp630lin
1 80,7
2 76,2
4 73,4
5 77,1
6 78,9
7 78,1
9 74,7
10 75,7
11 78,5
12 75,5
13 80,9
14 76,7
15 77,3
VDA number 1 2 3 4 5 6 7 8
1 89,5 89,9 90,3 89,8 90,6 89,5 91,1 90,0
2 81,2 81,9 81,6 81,1 81,7 80,9 80,8 82,6
4 78,8 79,0 79,2 80,9 77,8 78,2 80,6 79,9
5 87,8 87,5 88,4 89,6 88,3 88,5 88,8 88,9
6 88,3 88,5 89,1 88,5 88,8 88,6 88,3 88,6
7 88,5 89,0 89,4 89,2 90,4 89,9 88,8 88,9
9 79,5 79,8 68,6 72,9 68,2 71,3 72,3 80,8
10 84,6 85,5 84,6 83,6 81,4 83,0 87,6 86,8
11 87,5 86,9 89,2 88,7 88,3 88,9 87,6 90,0
12 87,8 88,0 87,0 87,8 85,9 87,1 88,0 86,6
13 89,9 88,4 88,4 89,1 88,1 88,6 90,1 87,6
14 x x 90,2 89,8 88,9 89,9 89,7 90,5
15 86,5 83,9 84,5 83,6 84,1 84,7 84,3 83,7
measurement position

Confidential C
22.05.2019 Round-Robin-Test Europe Page 36
Pass-by noise vs. surface parameters
Influence of single parameters
Analysis of a single parameter
does not show significant trends,
but taking all 3 parameter into
account explains pass-by levels
qualitatively.
A combined data analysis is
necessary for quantitative
analysis!
Examples: S04 , S09 , S15 , S12

Confidential C
22.05.2019 Round-Robin-Test Europe Page 37
Pass-by noise vs. surface parameters
Contribution analysis

Confidential C
22.05.2019 Round-Robin-Test Europe Page 38
Pass-by noise vs. surface parameters
𝐿𝑃,𝑐𝑟𝑢𝑖𝑠𝑒50 = 60,3 + 27,7 ∙ 𝑀𝑃𝐷1,5 − 126 ∙ 𝑔𝑀𝑃𝐷4,3 −36 ∙ 𝛼0,9 𝑑𝐵(𝐴)

Confidential C
22.05.2019 Round-Robin-Test Europe Page 39
Pass-by noise vs. surface parameters
The result of the combined data analysis gives a statistically good and
physically reasonable solution.
• It can be used to characterize ISO-tracks based on surface properties!
• It can be used to do a contribution analysis.
• It can also be used to test the influence of further parameters.
First conclusions for combined data analysis and next steps

Confidential C
Summary and conclusions
22.05.2019 Round-Robin-Test Europe Page 40
• The average differences between test tracks approved according to
ISO10844:2014 are between 3,2-4,4 dB(A) for cruising and between 4,1-5,0 dB(A)
for accelerated measurements.
• For a single tyre, the spread is up to 5,6 dB(A) for cruising and an additional 1
dB(A) must be added in case of accelerated measurements.
• The result of the combined data analysis gives a statistically good and physically
reasonable solution.
• It can be used to characterize ISO-tracks based on surface properties.
• It can be used to do a contribution analysis.
• It can also be used to test the influence of further parameters.
• Based on pass-by and surface measurements a simulation model for sound level
forecast for an average tyre was developed.
• Different acoustical performance between ISO10844-2014 tracks are not only
explainable by Mean Profile Depth, shape factor, absorption and mean peak
shape (skewness), the sound level of a track can be quantified and simulated
with an accuracy of < 0,2 dB by a mathematic model.
Confidential C
22.05.2019 Round-Robin-Test Europe Page 41
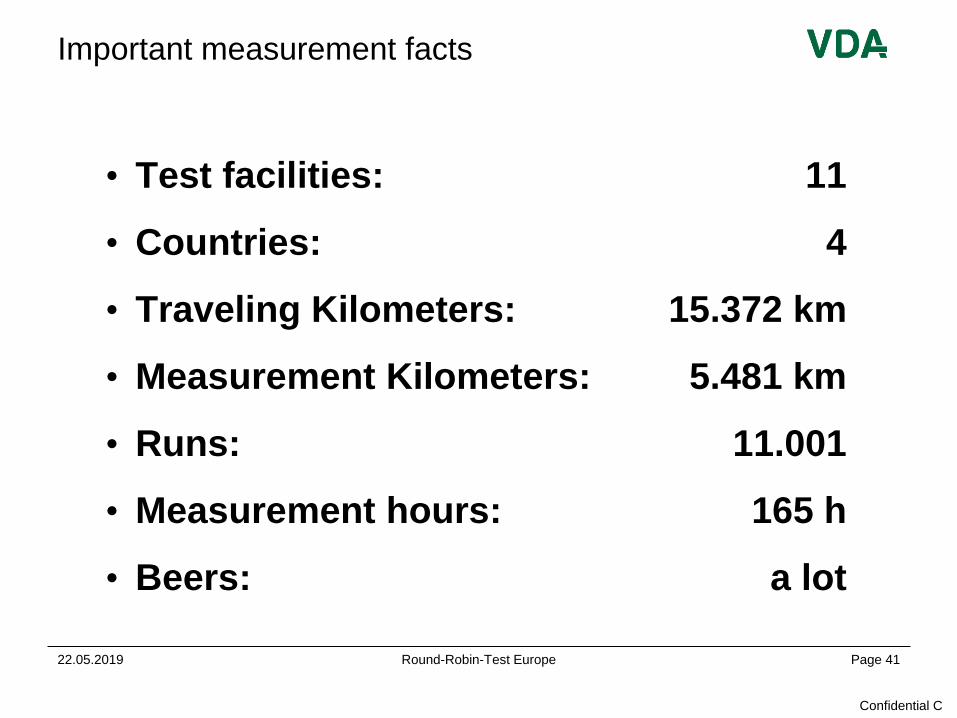
Important measurement facts
• Test facilities: 11
• Countries: 4
• Traveling Kilometers: 15.372 km
• Measurement Kilometers: 5.481 km
• Runs: 11.001
• Measurement hours: 165 h
• Beers: a lot

Confidential C
22.05.2019 Round-Robin-Test Europe Page 42
Thank you very much for your attention!