route 22 over liberty avenue and conrail hillside … · fhwa-nj-2012-002 route 22 over liberty...
TRANSCRIPT
FHWA-NJ-2012-002
Route 22 over Liberty Avenue and Conrail Hillside Township, Union
County, Monitoring of Tensar MSE Walls
FINAL REPORT December 2011
Submitted by
Andrew Foden, Ph.D. Ali Maher, Ph.D.* Supervising Engineer Professor and Chairman Parsons Brinckerhoff Rutgers, The State University of New Jersey
*Dept of Civil & Environmental Engineering Center for Advanced Infrastructure & Transportation (CAIT)
Rutgers, The State University Piscataway, NJ 08854-8014
NJDOT Project Manager Priscilla Ukpah
In cooperation with New Jersey
Department of Transportation Bureau of Research
And U.S. Department of Transportation
Federal Highway Administration

DISCLAIMER STATEMENT
“The contents of this report reflect the views of the author(s) who is (are) responsible for the facts and the accuracy of the data presented herein. The contents do not necessarily reflect the official views or policies of the New Jersey Department of Transportation or the Federal Highway Administration. This report does not constitute a standard, specification, or regulation.” The contents of this report reflect the views of the authors, who are responsible for the facts and the accuracy of the information presented herein. This document is disseminated under the sponsorship of the Department of Transportation, University Transportation Centers Program, in the interest of information exchange. The U.S. Government assumes no liability for the contents or use thereof.

TECHNICAL REPORT STANDARD TITLE PAGE
1. Report No. 2.Government Accession No. 3. Recipient’s Catalog No. FHWA NJ-2012-002
4. Title and Subtitle 5. Report Date Route 22 Over Liberty Avenue and Conrail Hillside Township, Union County, Monitoring of Tensar MSE Walls
December, 2011 6. Performing Organization Code CAIT/Rutgers
7. Author(s) 8. Performing Organization Report No. Wilson-Fahmy, Ragui, PE, Ph.D. Liu, Wanxing, PE, Ph.D. Foden, Andrew, PE, Ph.D. and Maher, Ali, Ph.D.
9. Performing Organization Name and Address 10. Work Unit No. Rutgers, The State University of New Jersey Center for Advanced Infrastructure and Transportation 100 Brett Road Piscataway, NJ 08854-8014
11. Contract or Grant No.
12. Sponsoring Agency Name and Address 13. Type of Report and Period Covered Final Report
10/01/2010 – 11/30/2011 14. Sponsoring Agency Code
15. Supplementary Notes
16. Abstract This report discusses the application of Tensar geogrids as the reinforcement elements in the construction of mechanically stabilized earth (MSE) walls on the Route 22 over Conrail and Liberty Avenue bridge replacement project in Hillside, NJ. As this is a relatively new product to the New Jersey Department of Transportation, the geogrids were instrumented with strain gages and tiltmeters to allow performance monitoring of the MSE walls during and after construction. This report documents the results and findings of the monitoring data at the end of construction and after six months, as well as an optical surveying of the MSE wall faces to determine post-construction wall movement. The monitoring effort is in collaboration with the Federal Highway Administration’s Long Term Bridge Performance Program.
17. Key Words 18. Distribution Statement Mechanically stabilized earth (MSE) walls, Tensar geogrids, monitoring, Long Term Bridge Performance Program
19. Security Classif (of this report) 20. Security Classif. (of this page) 21. No of Pages 22. Price
Unclassified Unclassified
66
Form DOT F 1700.7 (8-69)
Federal Highway Administration U.S. Department of Transportation Washington, D.C.
New Jersey Department of Transportation PO 600 Trenton, NJ 08625

ii
ACKNOWLEDGEMENTS
The research team would like to acknowledge the support of the New Jersey Department of Transportation on this project under the direction of Priscilla Ukpah. Richard Dunne guided the project’s inception, and the NJDOT has continued its support under Nat Kasbekar. This project was also made possible by the Federal Highway Administration’s Long-Term Bridge Performance Program. Collaboration with the LTBP program will support the long-term monitoring of the MSE walls. The team would also like to thank Geocomp Consulting, Inc., who created and installed the instrumentation system and provided real-time data monitoring, and Union Paving, who was the contractor on the Route 22 bridge replacement project and accommodated and coordinated the needs of the research team into the construction schedule.

iii
TABLE OF CONTENTS
Page
INTRODUCTION ........................................................................................................ 1 MSE WALL GEOGRID REINFORCEMENT .............................................................. 4 INSTRUMENTATION CONFIGURATION AND MONITORING ................................ 4 INSTRUMENTATION DATA ...................................................................................... 5
Strain Data ............................................................................................................ 5 Tiltmeter Data ....................................................................................................... 9 Optical Prism Data ............................................................................................. 10
FINITE ELEMENT ANALYSES ............................................................................... 11 SUMMARY ............................................................................................................... 11 REFERENCES ......................................................................................................... 12 APPENDIX A – TENSAR GEOGRID LOAD-EXTENSION CURVES ...................... 13 APPENDIX B – STRAIN GAGE, TILTMETER, AND OPTICAL PRISM SELECTED LOCATIONS ............................................................................................................ 18 APPENDIX C – STRAIN GAGE INSTALLATION LOGS ...................................... ..25 APPENDIX D – TILTMETER INSTALLATION LOGS ............................................. 35 APPENDIX E – CONSTRUCTION PHOTOS ........................................................... 38 APPENDIX F – INSTRUMENTATION MONITORING DATA SUBMITTED BY GEOCOMP .............................................................................................................. 43

iv
LIST OF FIGURES
Page Figure 1. Route 22 over Liberty Avenue and Conrail Site Plan ................................. 3 Figure 2. Variation of strain along geogrid at wall 1 .................................................. 6 Figure 3. Variation of strain along geogrid at wall 3 .................................................. 6 Figure 4. Conservatism in estimating geogrid tension force ...................................... 8 Figure 5. Empirical curve for estimating lateral displacement during construction for
MSE walls (after FHWA RD 89-043 {Christopher et al., 1990}) .......................... 10 Figure 6. Marv Tensile Strength Values, Tensar UX1400HS Grid .......................... 14 Figure 7. Marv Tensile Strength Values, Tensar UX1500M SE Grid ....................... 15 Figure 8. Marv Tensile Strength Values, Tensar UX1600HS Grid .......................... 16 Figure 9. Marv Tensile Strength Values, Tensar UX1700MSE Grid ........................ 17 Figure 10. Section A – MSE Wall 1 ......................................................................... 19 Figure 11. Detail 1 – Elevation MSE Wall 1 ............................................................. 20 Figure 12. Section B – MSE Wall 3 ......................................................................... 21 Figure 13. Detail 2 – Elevation MSE Wall 3 ............................................................. 22 Figure 14. Optical Prism Locations at Wall 1 ............................................................ 23 Figure 15. Optical Prism Locations at Wall 3 ............................................................ 24 Figure 16. Microstrain over time for Wall 1 Geogrid C .............................................. 26 Figure 17. Microstrain over time for Wall 3 Geogrid C .............................................. 27 Figure 18. Installation Log for Tiltmeter 1-1 and 1-2 ................................................ 36 Figure 19. Installation Log for Tiltmeter 1-1 and 1-2 ................................................ 37 Figure 20. Bodkin Joint ............................................................................................. 39 Figure 21. Instrumented Geogrid with Strain Gages ................................................ 40 Figure 22. Place Select Fill on Top of Geogrid ......................................................... 41 Figure 23. Wall 1 and Wall 3 at End of Construction ................................................ 42 Figure 24. Profile View of Wall 1 .............................................................................. 45 Figure 25. Microstrain over time for Wall 1 Geogrid A .............................................. 46 Figure 26. Microstrain over time for Wall 1 Geogrid B .............................................. 47 Figure 27. Microstrain over time for Wall 1Geogrid C............................................... 48 Figure 28. Profile view of Wall 3 ............................................................................... 49 Figure 29. Microstrain over time for Wall 3 Geogrid A .............................................. 50 Figure 30. Microstrain over time for Wall 3 Geogrid B .............................................. 51 Figure 31. Microstrain over time for Wall 3 Geogrid B .............................................. 52 Figure 32. Microstrain over time for Wall 3 Geogrid C ............................................. 53 Figure 33. Tilt over time for Wall 1 ........................................................................... 54 Figure 34. Tilt over time for Wall 3 ........................................................................... 55 Figure 35. Wall 1 Survey Point Locations ................................................................. 56 Figure 36. Wall 3 Survey Point Locations ................................................................. 57
v
LIST OF TABLES
Page Table 1 – Geogrid design parameters ........................................................................ 4 Table 2 – Tensile strains and forces in instrumented geogrids .................................. 7 Table 3 – Tiltmeter measurement .............................................................................. 9 Table 4 – Route 22 Liberty Avenue & Conrail Bridge Instrumentation ..................... 28 Table 5 – Installation Log for Wall 3, Layer A, Gage Readings ................................ 29 Table 6 – Installation Log for Wall 3, Layer B, Gage Readings ................................ 30 Table 7 – Installation Log for Wall 3, Layer C, Gage Readings ................................ 31 Table 8 – Installation Log for Wall 1, Layer A, Gage Readings ................................ 32 Table 9 – Installation Log for Wall 1, Layer B, Gage Readings ................................ 33 Table 10 – Installation Log for Wall 1, Layer C, Gage Readings .............................. 34 Table 11 – Data from manual survey performed June 30, 2011 and October 28,
2011….. ............................................................................................................. 58 Table 12 – Summary tables with measured displacements of all survey points from June
30, 2011 to October 28, 2011 manual surveys .................................................. 59
1
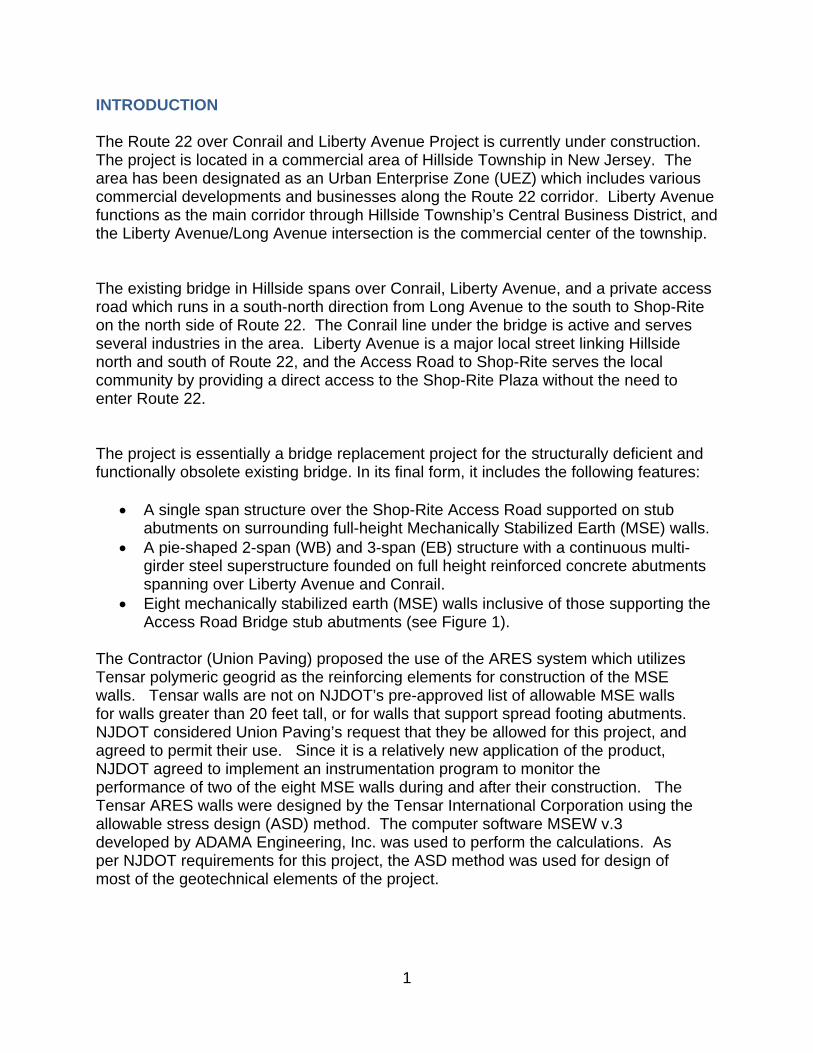
INTRODUCTION The Route 22 over Conrail and Liberty Avenue Project is currently under construction. The project is located in a commercial area of Hillside Township in New Jersey. The area has been designated as an Urban Enterprise Zone (UEZ) which includes various commercial developments and businesses along the Route 22 corridor. Liberty Avenue functions as the main corridor through Hillside Township’s Central Business District, and the Liberty Avenue/Long Avenue intersection is the commercial center of the township. The existing bridge in Hillside spans over Conrail, Liberty Avenue, and a private access road which runs in a south-north direction from Long Avenue to the south to Shop-Rite on the north side of Route 22. The Conrail line under the bridge is active and serves several industries in the area. Liberty Avenue is a major local street linking Hillside north and south of Route 22, and the Access Road to Shop-Rite serves the local community by providing a direct access to the Shop-Rite Plaza without the need to enter Route 22. The project is essentially a bridge replacement project for the structurally deficient and functionally obsolete existing bridge. In its final form, it includes the following features:
• A single span structure over the Shop-Rite Access Road supported on stub abutments on surrounding full-height Mechanically Stabilized Earth (MSE) walls.
• A pie-shaped 2-span (WB) and 3-span (EB) structure with a continuous multi-girder steel superstructure founded on full height reinforced concrete abutments spanning over Liberty Avenue and Conrail.
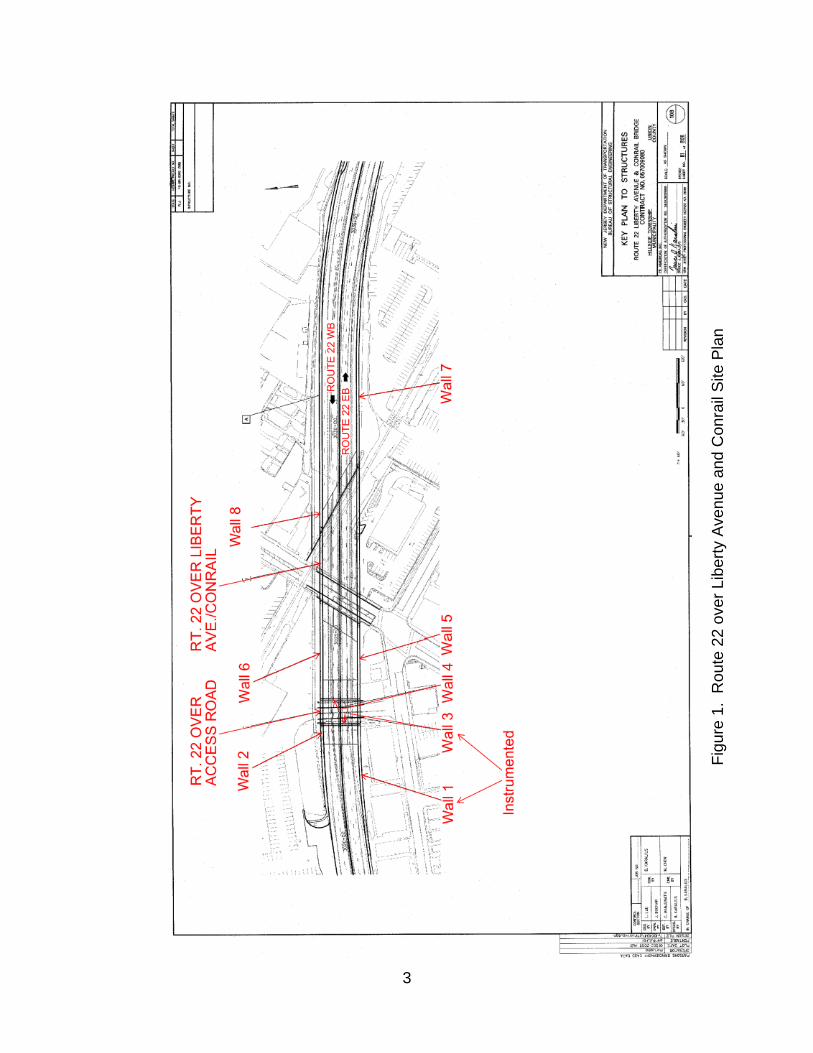
• Eight mechanically stabilized earth (MSE) walls inclusive of those supporting the Access Road Bridge stub abutments (see Figure 1).
The Contractor (Union Paving) proposed the use of the ARES system which utilizes Tensar polymeric geogrid as the reinforcing elements for construction of the MSE walls. Tensar walls are not on NJDOT’s pre-approved list of allowable MSE walls for walls greater than 20 feet tall, or for walls that support spread footing abutments. NJDOT considered Union Paving’s request that they be allowed for this project, and agreed to permit their use. Since it is a relatively new application of the product, NJDOT agreed to implement an instrumentation program to monitor the performance of two of the eight MSE walls during and after their construction. The Tensar ARES walls were designed by the Tensar International Corporation using the allowable stress design (ASD) method. The computer software MSEW v.3 developed by ADAMA Engineering, Inc. was used to perform the calculations. As per NJDOT requirements for this project, the ASD method was used for design of most of the geotechnical elements of the project.

2
The two instrumented walls are Walls 1 and 3 (see Figure 1). The instruments consist of the following:
• Eighteen strain gages attached to three geogrids (six per geogrid) at three different levels for each of the two walls.
• Two tiltmeters installed at two different levels on the facing of each of the two walls.
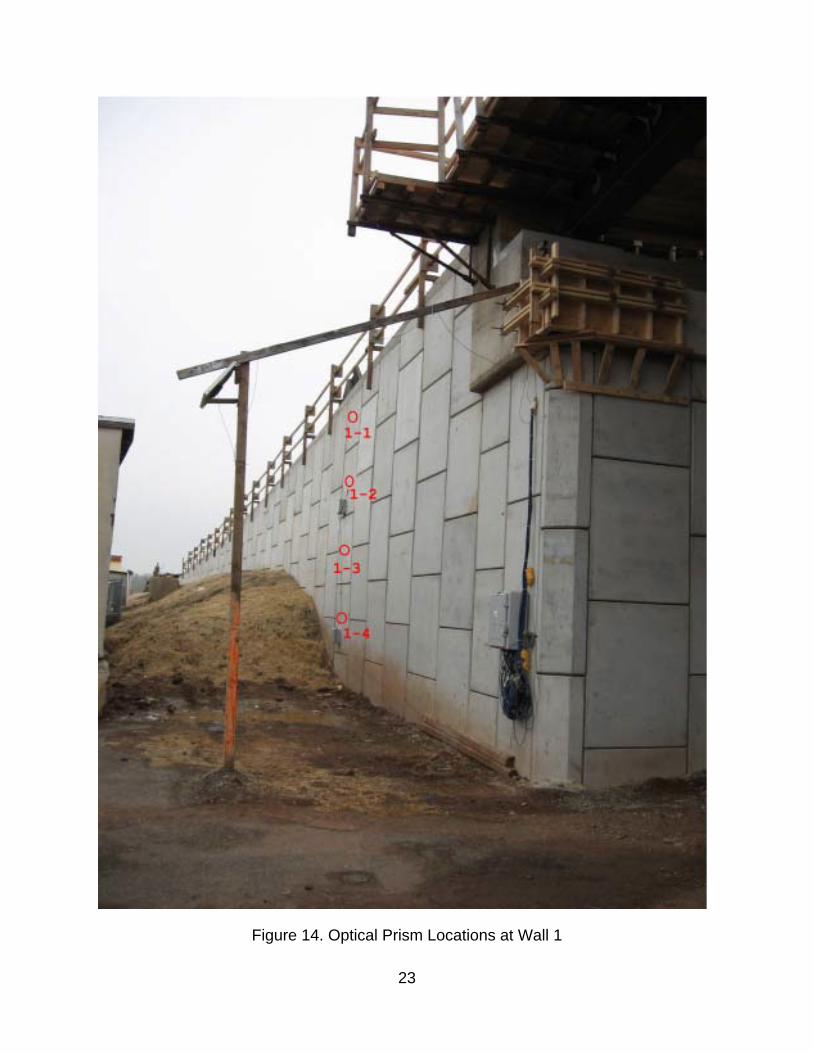
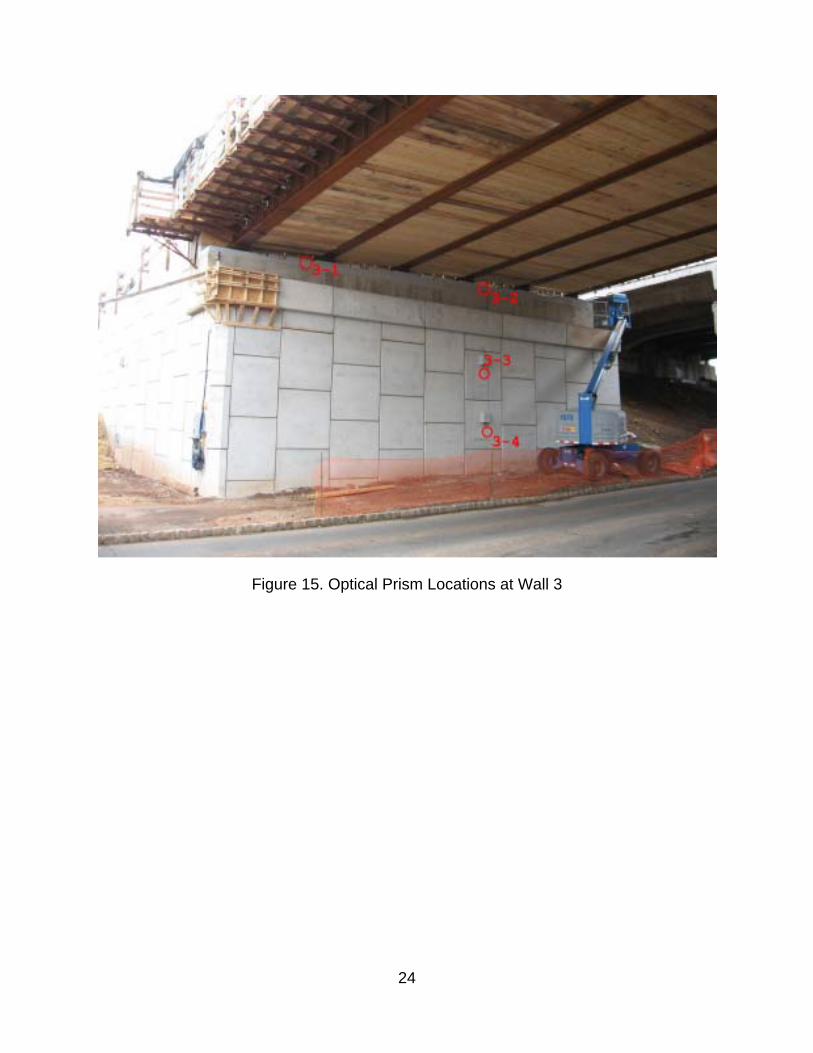
• Four optical prisms mounted on the face of each wall after construction Geocomp Consulting, Inc of Boxborough, Massachusetts, provided the service for the MSE wall instrumentation installation and real-time monitoring during and after construction as part of the FHWA Long-Term Bridge Performance Program. Monitoring will continue after completion of this report to evaluate the long-term performance of the walls. In addition to collecting the strain gage and tiltmeter data in real-time, Geocomp performed an automated survey of the facing of the two walls to determine the post-construction movement at the locations of the optical prisms up to the time of preparation of the report. Rutgers University will continue to monitor and receive data to evaluate the MSE wall performance over time and report to NJDOT, also as a part of the FHWA Long-Term Bridge Performance Program. This contract is limited to the following:
• Review the monitoring program plans developed by Geocomp. • Provide field consultation including the initial readings during construction. • Evaluate the real-time monitoring data during and after construction (short-term). • Prepare Interim and Final Data Reports shortly after construction and 6 months
later, respectively, to evaluate the observed strains and movements of the walls and to compare with anticipated design values.
An interim report was submitted in July 2011 and included the monitoring data at the time of preparation of the report. This final report describes the instrumentation program and provides an update of the monitoring data.
3
Figu
re 1
. R
oute
22
over
Lib
erty
Ave
nue
and
Con
rail
Site
Pla
n

4
MSE WALL GEOGRID REINFORCEMENT Tensar geogrids are extruded from High Density Polyethylene (HDPE). The HDPE sheets are punched and drawn to generate the final geogrid structure, which consists of longitudinal ribs and elongated apertures. The geogrids used in the Route 22 Project are designated as UX1400MSE, UX1500MSE, UX1600MSE, and UX1700MSE, which have apertures and ribs about 18 inches long. Table 1 provides the geogrid design properties for a 100 year design life as obtained from the Tensar International Corporation.
Table 1 – Geogrid design parameters Geogrid
Type Tult
(lb/ft) RFcr RFid RFd Tall
(lb/ft) Ci Coverage
Ratio (%)
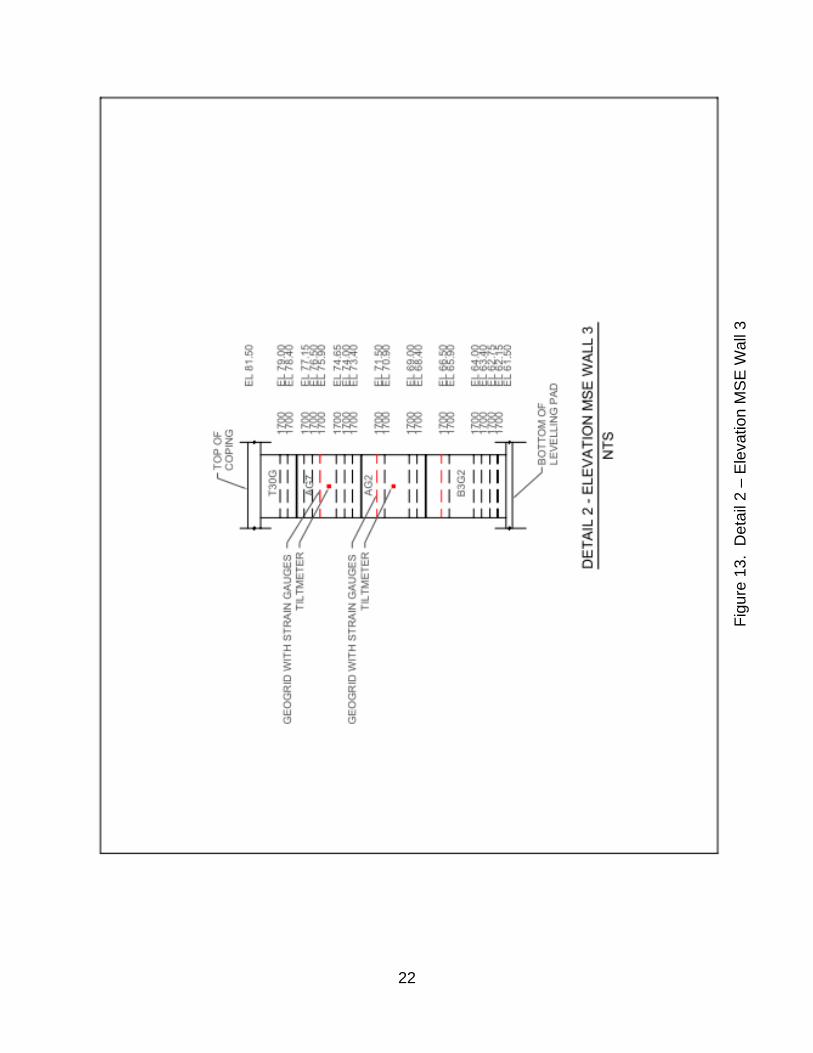
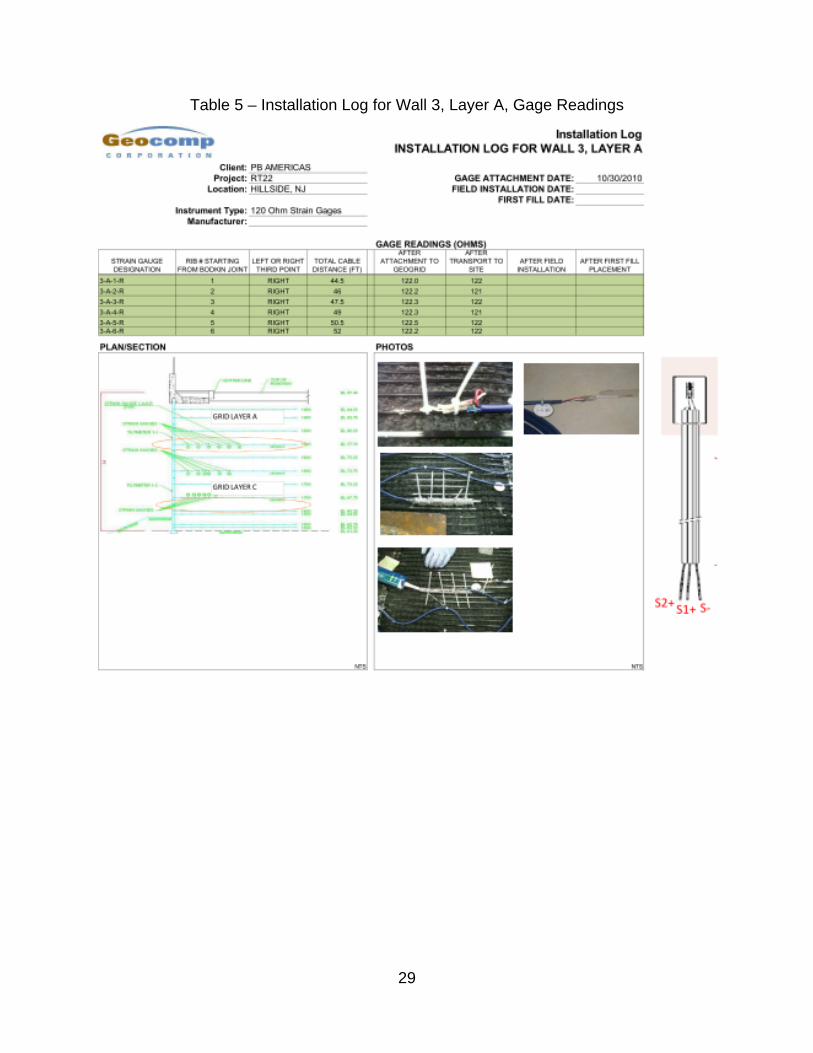
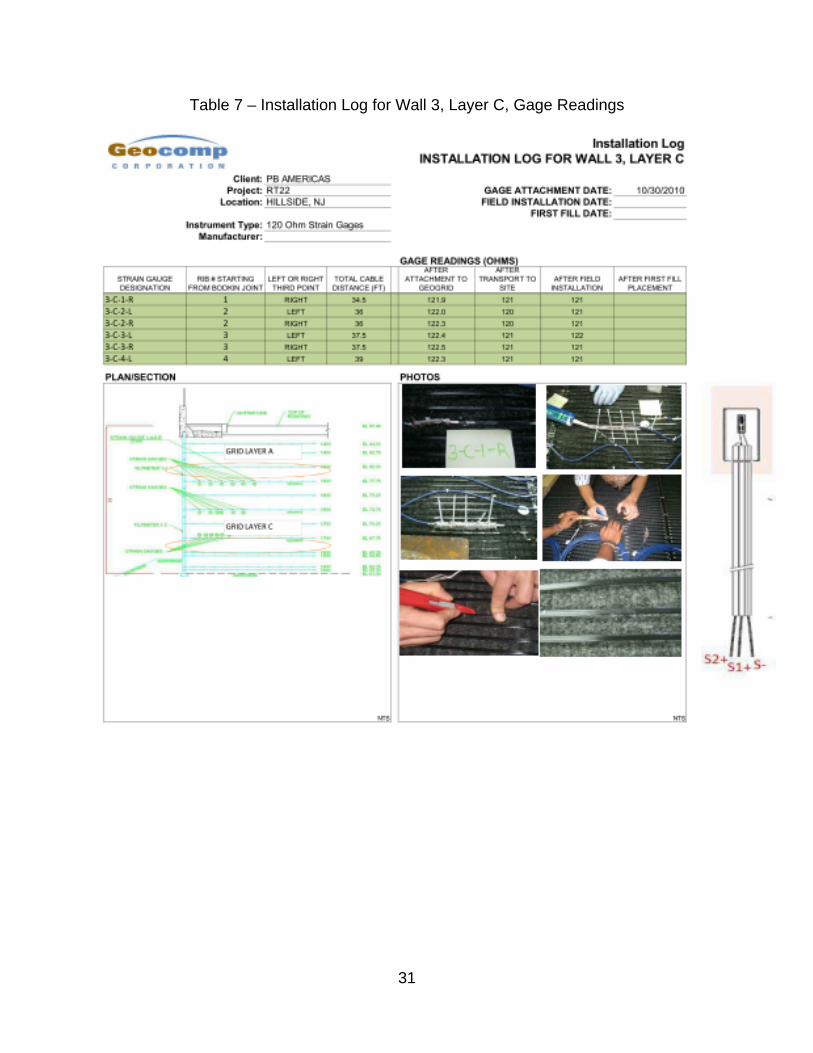
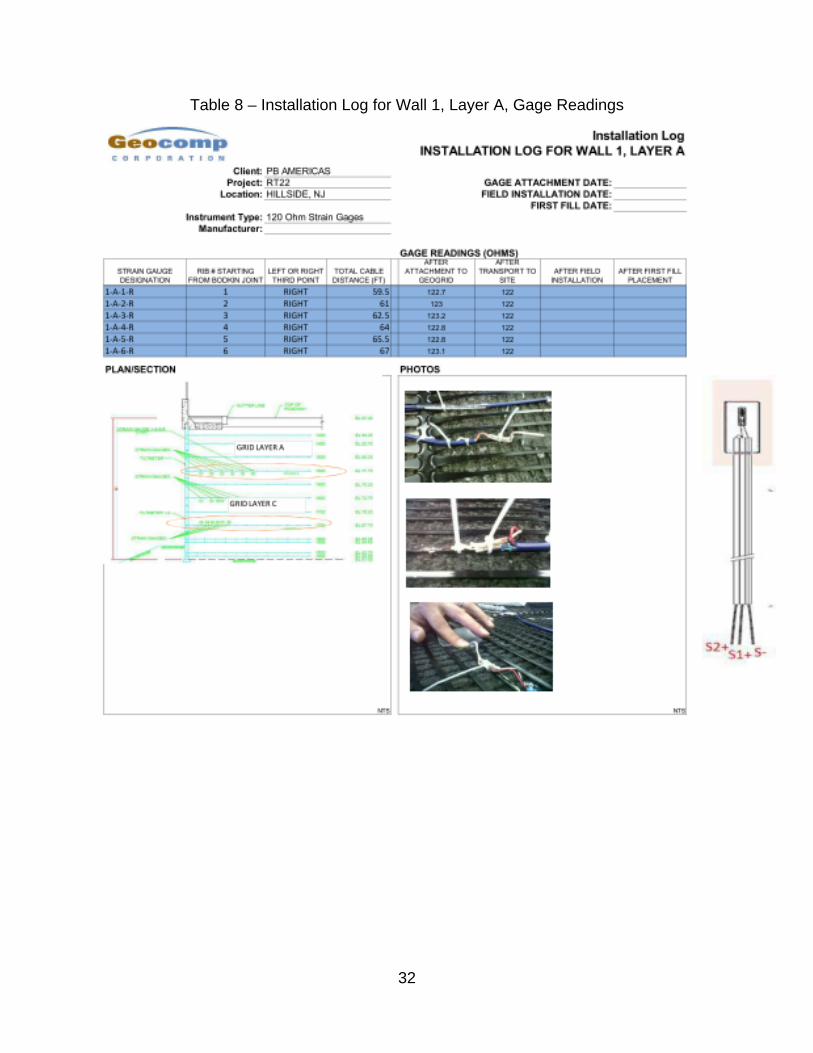
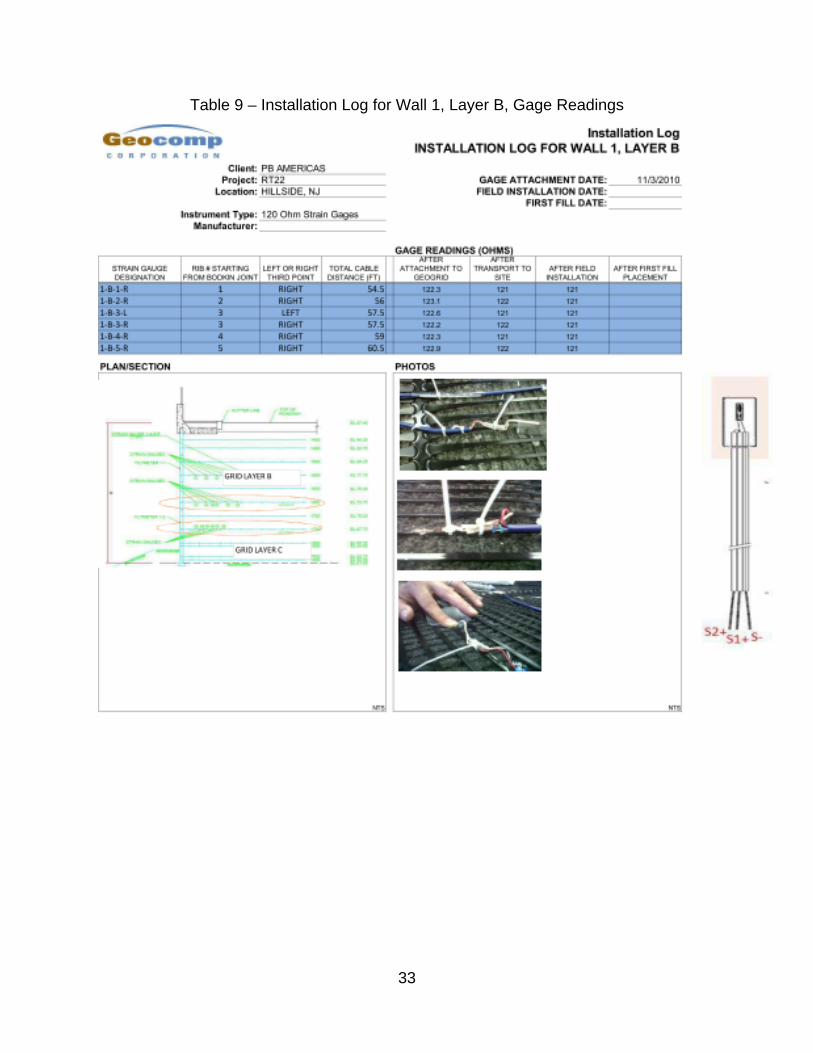
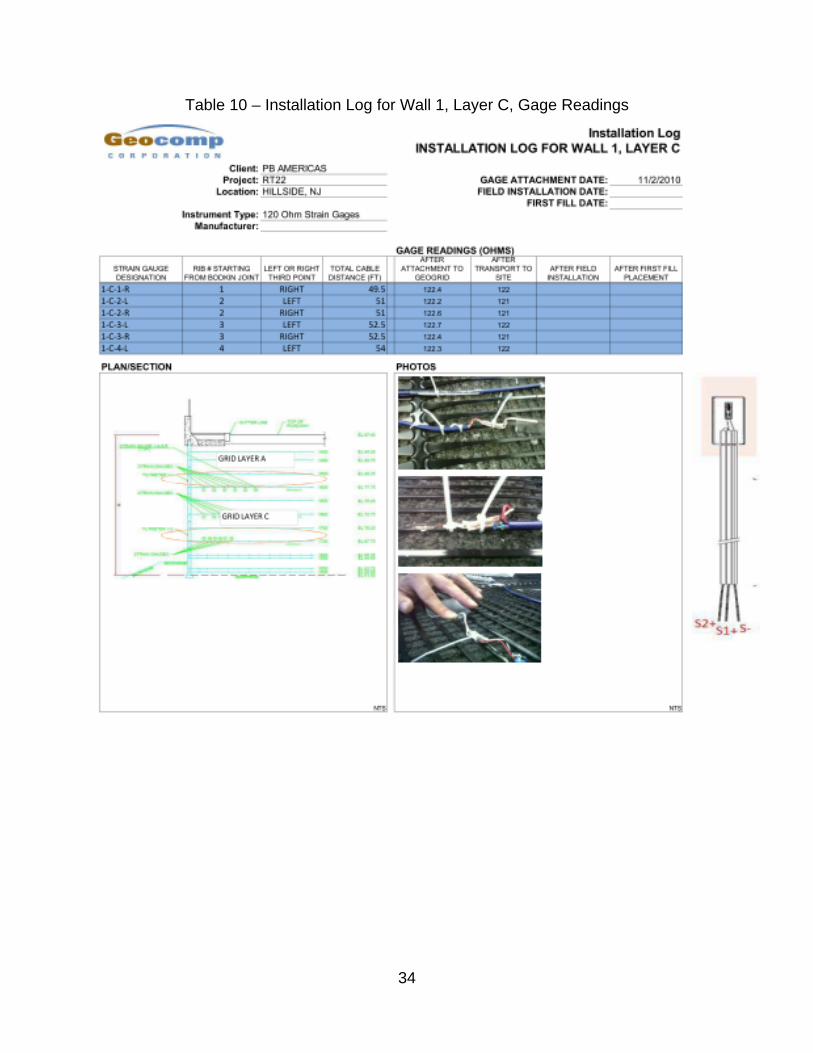
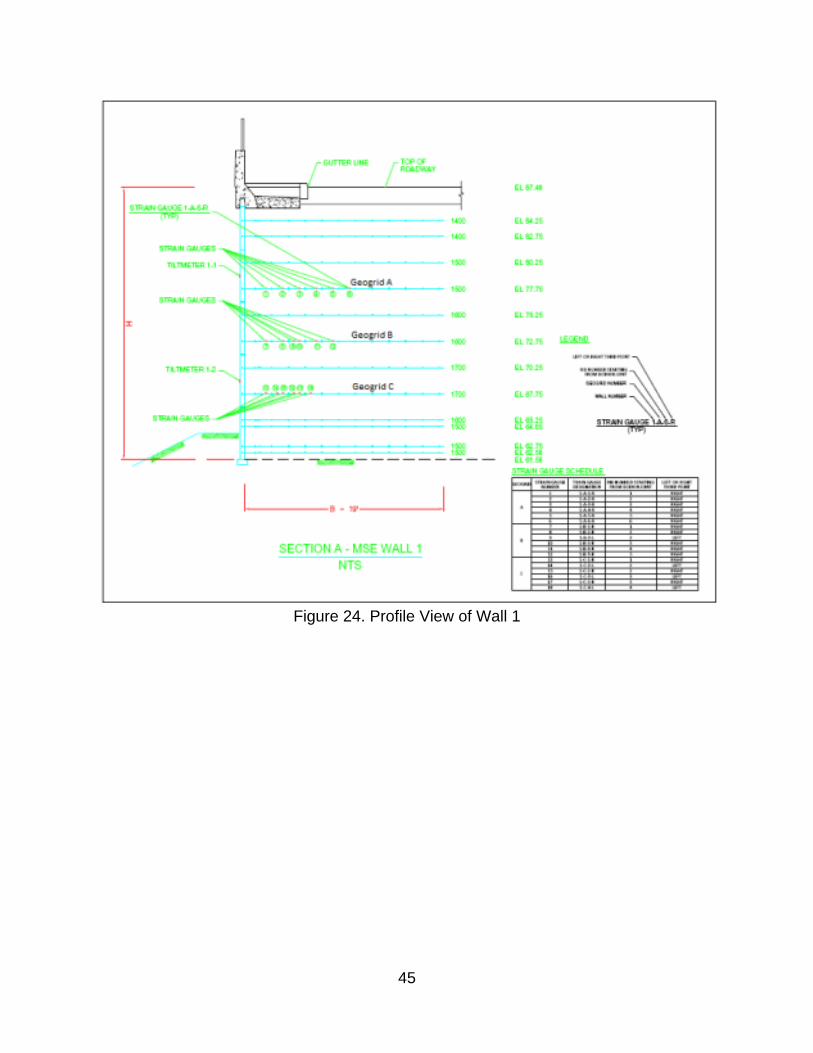
UX1700MSE 11,990 2.58 1.25 1.10 3,380 0.8 89 UX1600MSE 9,870 2.58 1.25 1.10 2,782 0.8 89 UX1500MSE 7,810 2.58 1.25 1.10 2,202 0.8 89 UX1400MSE 4,800 2.58 1.25 1.10 1,353 0.8 89 The parameters listed in Table 1 are defined as follows: Tult = Tensile strength in a quick tension test, ASTM D6637 RFcr = Reduction factor for creep RFid = Reduction factor for installation damage RFd = Reduction for chemical and biological degradation Tall = Long-term design strength Ci = Pullout interaction coefficient As shown in Table 1, a coverage ratio of 89% was used in the instrumented walls. The load-extension curves measured according to ASTM D6637 for the four geogrid types are included in Appendix A. The tests were conducted at a strain rate of about 10% per minute. INSTRUMENTATION CONFIGURATION AND MONITORING The strain gage, tiltmeter and optical prism locations were selected by PB. Appendix B includes cross-section and elevation views showing the levels of the instrumented geogrids, the locations of the strain gages along the geogrids, and the locations of tiltmeters on the wall faces. Appendix B also includes the selected locations of the optical prisms. In order to capture the maximum tension in the geogrids, the locations of the strain gages were selected such that they are intersected by the theoretical line of maximum tension within the wall which corresponds to the plane of failure assumed in design. The strain gages were positioned at one third of the length of the longitudinal ribs rather than in the middle considering the fact that the width of the ribs is smallest in the middle and largest where they meet the transverse ribs. By doing so, two strain gages could be accommodated within a single rib where needed. As already mentioned, each of the two instrumented walls included three instrumented geogrids at

5
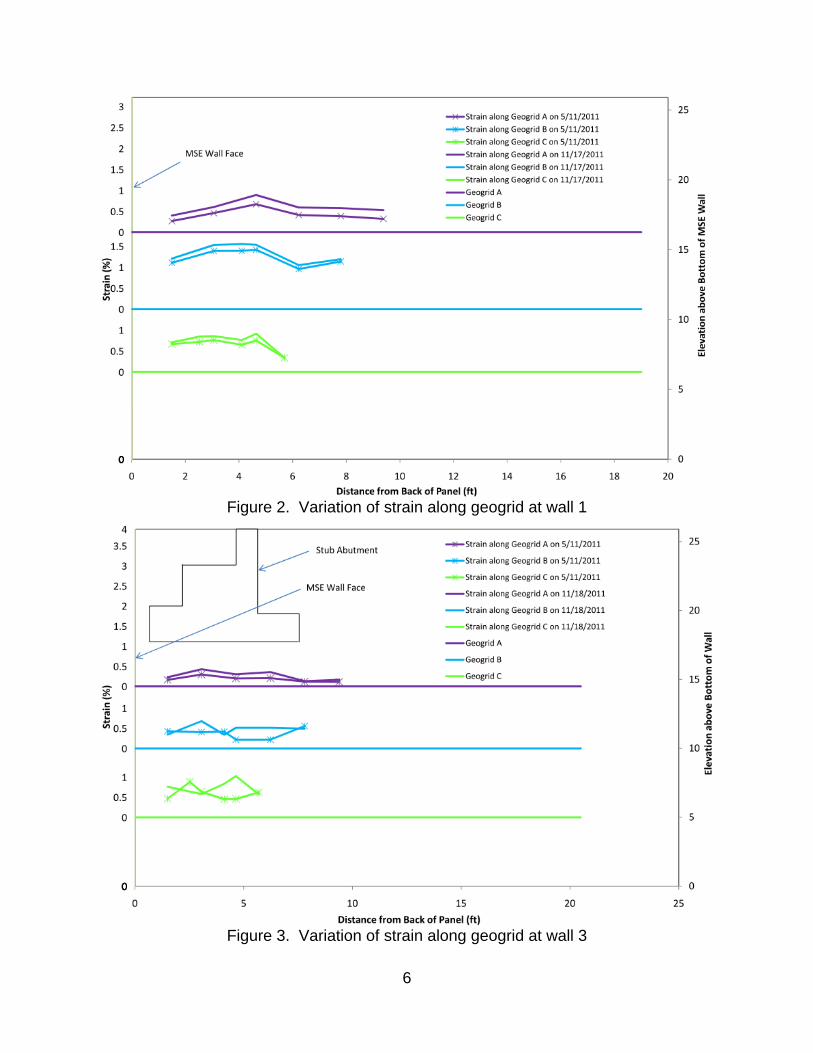
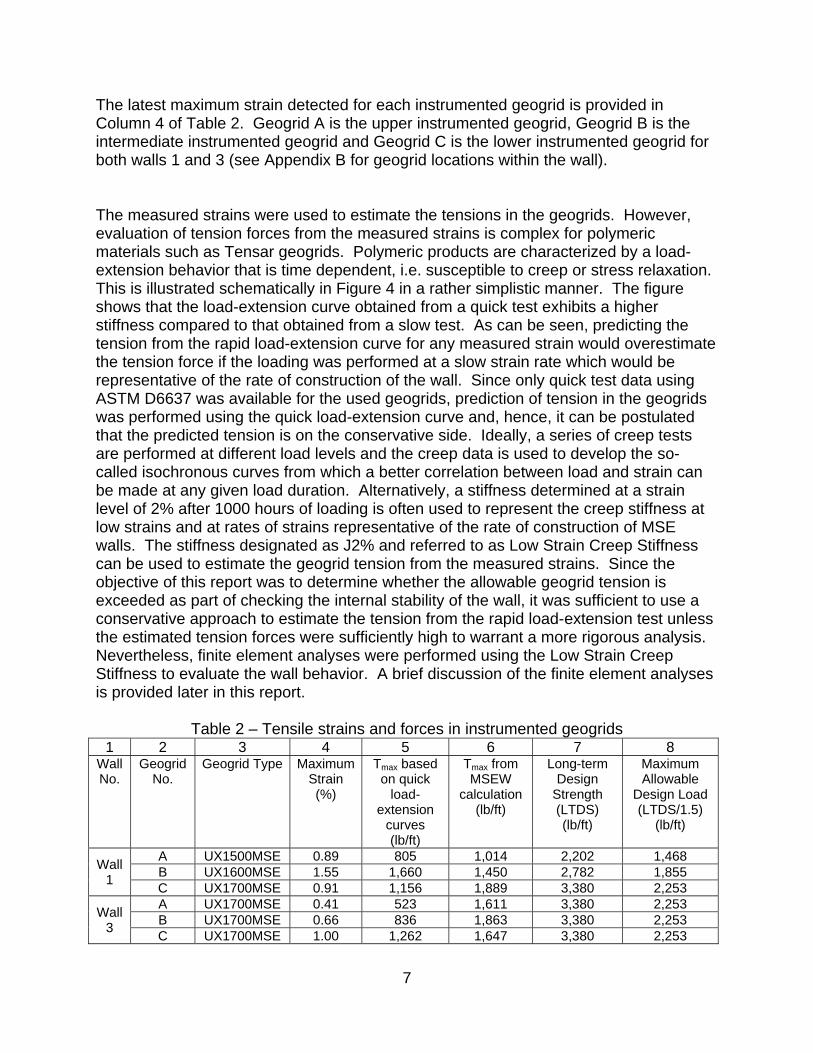
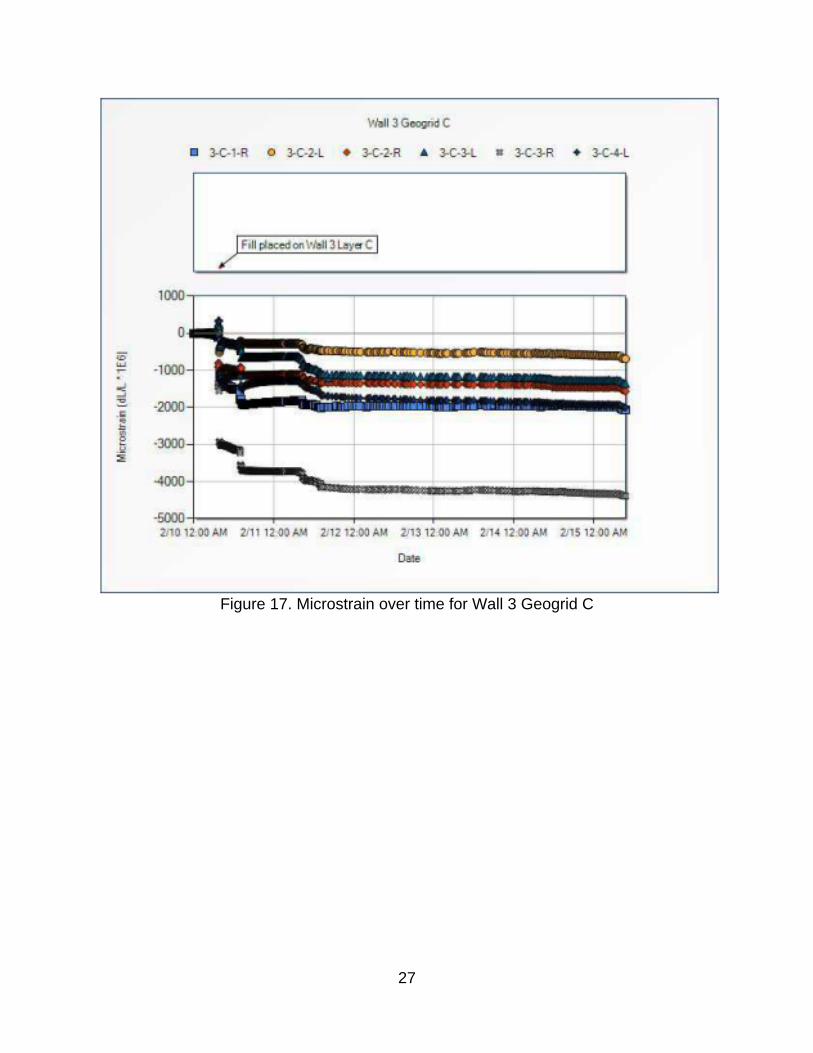
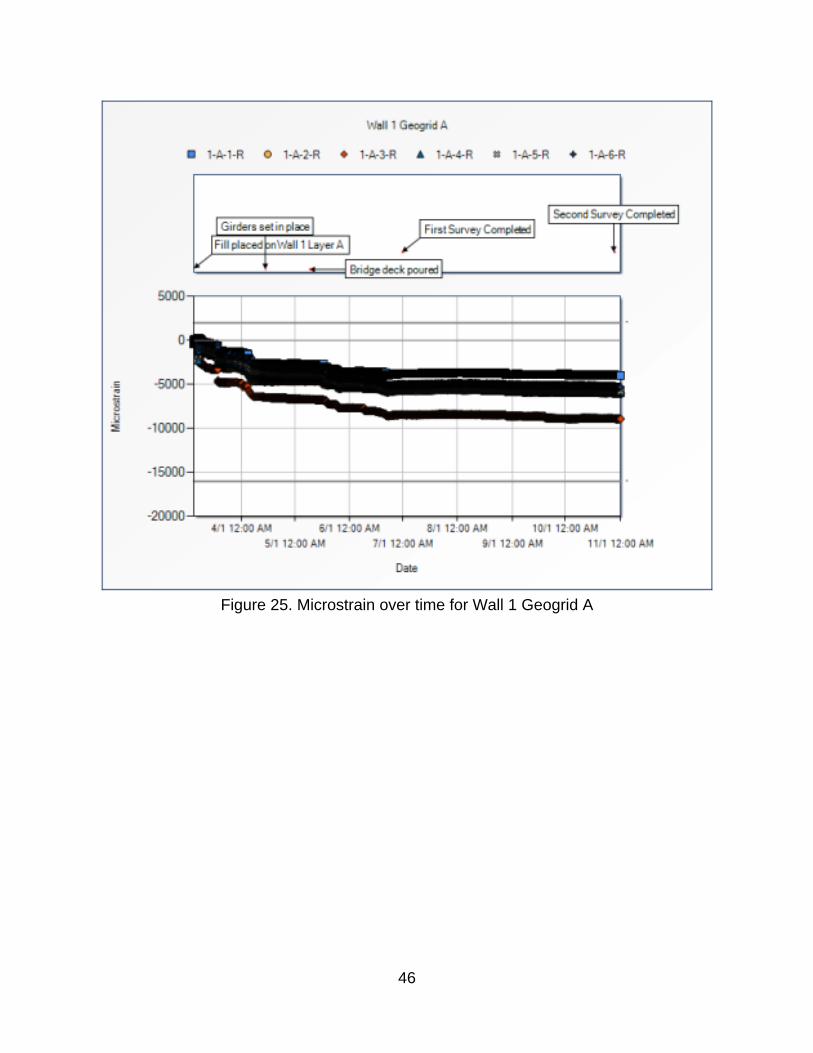
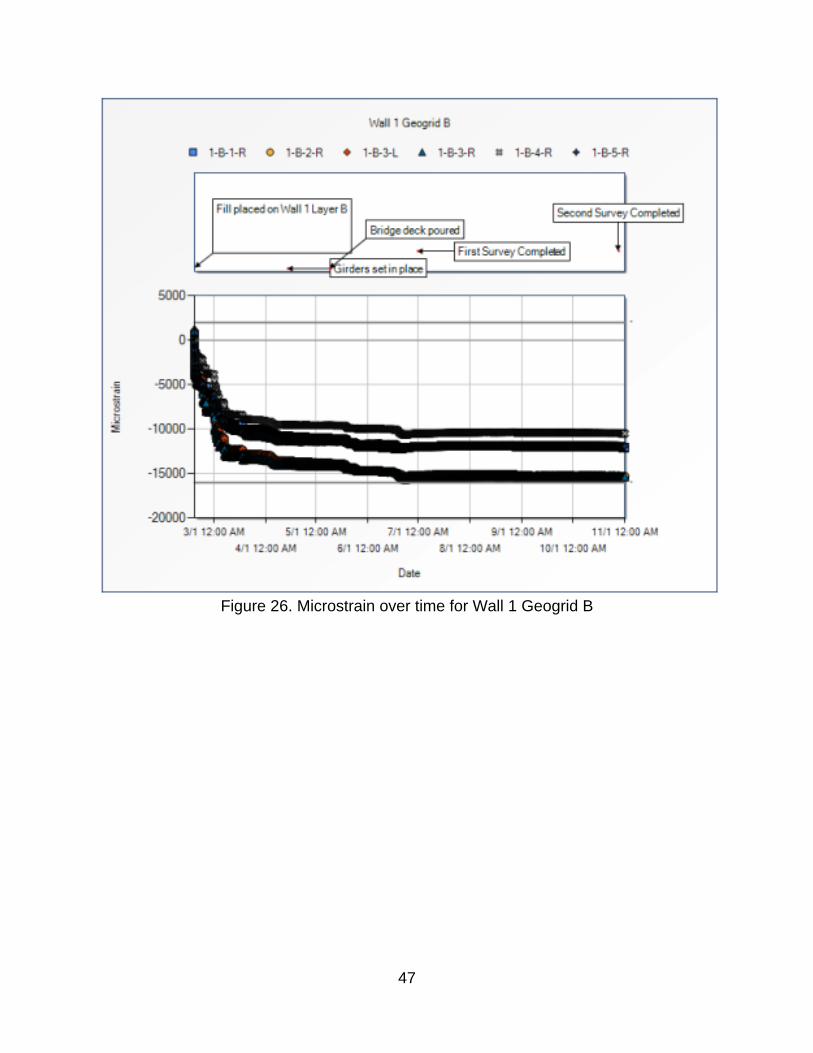
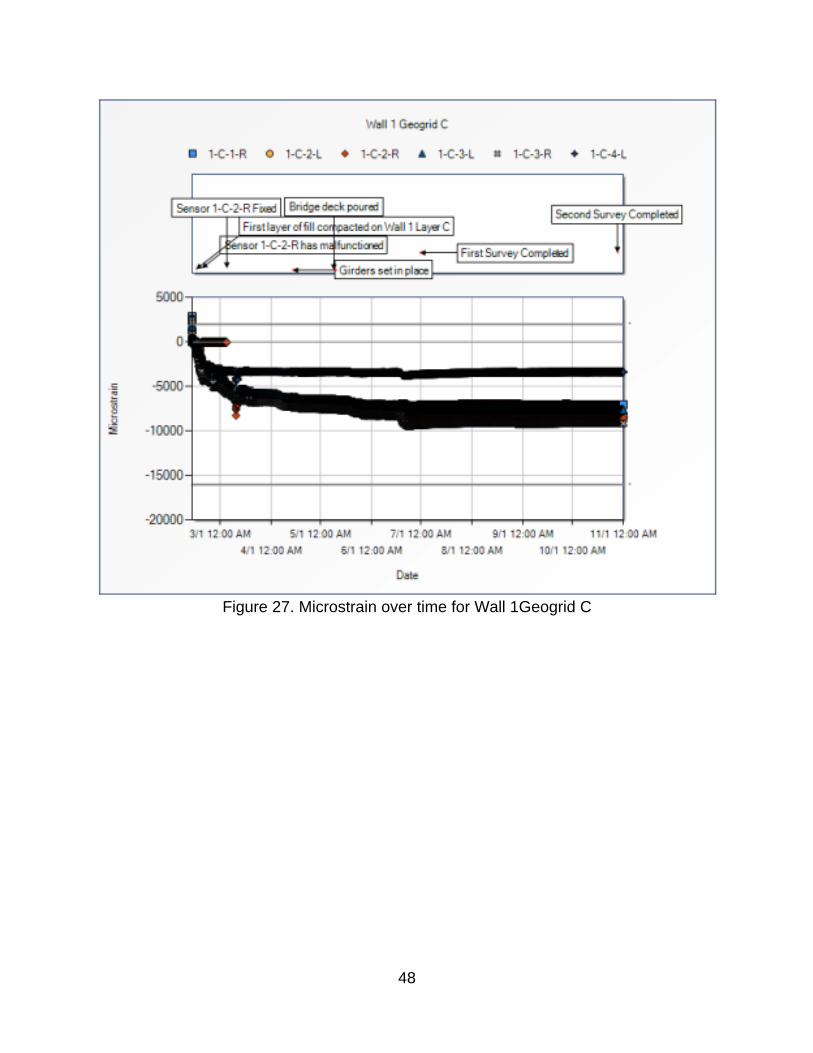
three different levels with a total of six gages installed on each instrumented geogrid panel. All gages were installed at or near the center of the geogrid panel in the transverse direction. Installation of the strain gages was performed in GeoComp’s laboratory in Boston, MA, before shipping the instrumented geogrid panels to the job site. The installation logs of the instrumented geogrids, prepared by Geocomp, are provided in Appendix C. Two tiltmeters were installed on each of the instrumented walls during wall construction. In order to be able to correlate the tiltmeter and strain gage data, the tiltmeters were mounted on the column of panels to which the instrumented geogrids were attached. The installation logs of the tiltmeters are provided in Appendix D. Automatic logging of the strain gages and tiltmeters was performed by Geocomp using a battery operated data logger that was mounted temporarily on the face of Wall 1 near the corner with Wall 3 (see last photograph in Appendix E). A solar panel provided energy to charge the battery. The data logger and solar panels were mounted on the side of the abutment supported by Wall 3 after completion of the construction activities. The data is transferred wirelessly through an iSite remote monitoring system via a proprietary Remote Area Network (RAN). The research team is granted automatic access to the data, which is provided in the form of charts and tables. All data is safely stored and backed up on redundant iSiteCentral servers. INSTRUMENTATION DATA Strain Data Plots showing the variation of geogrid strain during construction since the time of installation are provided in Appendix E for all geogrids. Figures 2 and 3 provide the variation of strain along the instrumented geogrids for Walls 1 and Wall 3 respectively at the time of preparation of the Interim Report and the time of preparation of this Final Report. It can be seen that the maximum tension was captured by the strain gages. The data in Figures 2 and 3 indicate that the geogrids experienced some relatively small creep within the five month duration between the two sets of readings for both Walls.
6
Figure 2. Variation of strain along geogrid at wall 1
Figure 3. Variation of strain along geogrid at wall 3
7
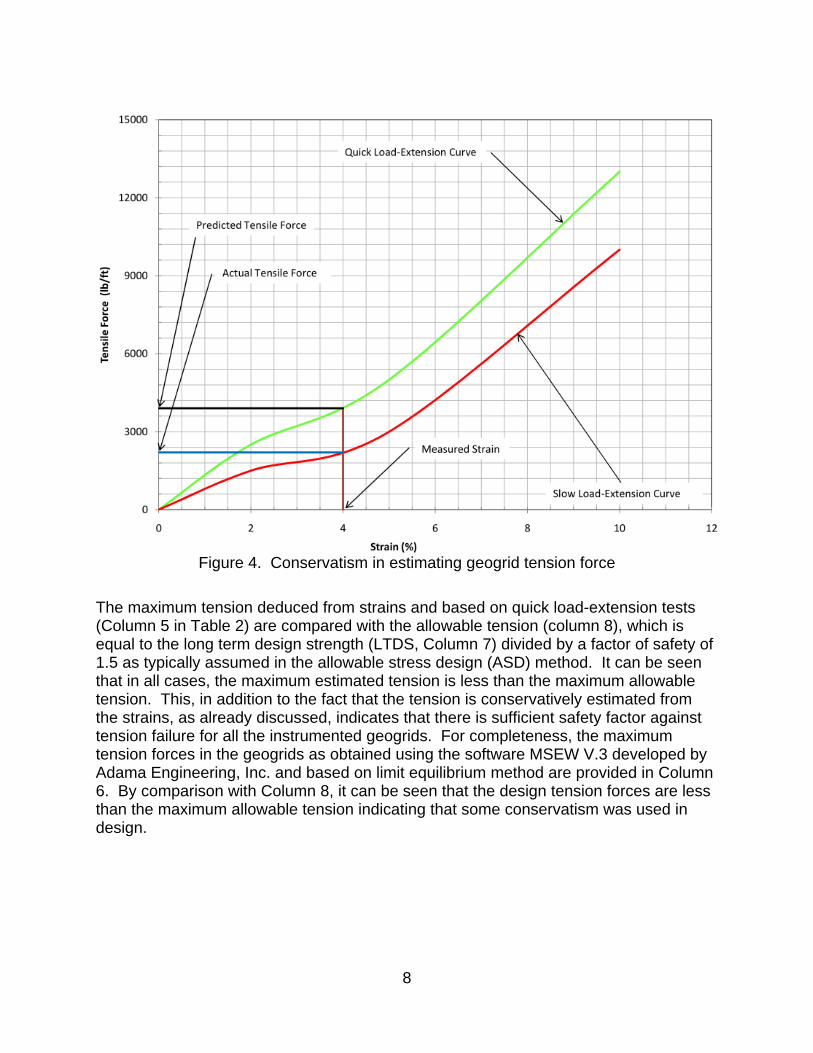
The latest maximum strain detected for each instrumented geogrid is provided in Column 4 of Table 2. Geogrid A is the upper instrumented geogrid, Geogrid B is the intermediate instrumented geogrid and Geogrid C is the lower instrumented geogrid for both walls 1 and 3 (see Appendix B for geogrid locations within the wall). The measured strains were used to estimate the tensions in the geogrids. However, evaluation of tension forces from the measured strains is complex for polymeric materials such as Tensar geogrids. Polymeric products are characterized by a load-extension behavior that is time dependent, i.e. susceptible to creep or stress relaxation. This is illustrated schematically in Figure 4 in a rather simplistic manner. The figure shows that the load-extension curve obtained from a quick test exhibits a higher stiffness compared to that obtained from a slow test. As can be seen, predicting the tension from the rapid load-extension curve for any measured strain would overestimate the tension force if the loading was performed at a slow strain rate which would be representative of the rate of construction of the wall. Since only quick test data using ASTM D6637 was available for the used geogrids, prediction of tension in the geogrids was performed using the quick load-extension curve and, hence, it can be postulated that the predicted tension is on the conservative side. Ideally, a series of creep tests are performed at different load levels and the creep data is used to develop the so-called isochronous curves from which a better correlation between load and strain can be made at any given load duration. Alternatively, a stiffness determined at a strain level of 2% after 1000 hours of loading is often used to represent the creep stiffness at low strains and at rates of strains representative of the rate of construction of MSE walls. The stiffness designated as J2% and referred to as Low Strain Creep Stiffness can be used to estimate the geogrid tension from the measured strains. Since the objective of this report was to determine whether the allowable geogrid tension is exceeded as part of checking the internal stability of the wall, it was sufficient to use a conservative approach to estimate the tension from the rapid load-extension test unless the estimated tension forces were sufficiently high to warrant a more rigorous analysis. Nevertheless, finite element analyses were performed using the Low Strain Creep Stiffness to evaluate the wall behavior. A brief discussion of the finite element analyses is provided later in this report.
Table 2 – Tensile strains and forces in instrumented geogrids 1 2 3 4 5 6 7 8
Wall No.
Geogrid No.
Geogrid Type Maximum Strain (%)
Tmax based on quick
load-extension
curves (lb/ft)
Tmax from MSEW
calculation (lb/ft)
Long-term Design
Strength (LTDS) (lb/ft)
Maximum Allowable
Design Load (LTDS/1.5)
(lb/ft)
Wall 1
A UX1500MSE 0.89 805 1,014 2,202 1,468 B UX1600MSE 1.55 1,660 1,450 2,782 1,855 C UX1700MSE 0.91 1,156 1,889 3,380 2,253
Wall 3
A UX1700MSE 0.41 523 1,611 3,380 2,253 B UX1700MSE 0.66 836 1,863 3,380 2,253 C UX1700MSE 1.00 1,262 1,647 3,380 2,253
8
Figure 4. Conservatism in estimating geogrid tension force
The maximum tension deduced from strains and based on quick load-extension tests (Column 5 in Table 2) are compared with the allowable tension (column 8), which is equal to the long term design strength (LTDS, Column 7) divided by a factor of safety of 1.5 as typically assumed in the allowable stress design (ASD) method. It can be seen that in all cases, the maximum estimated tension is less than the maximum allowable tension. This, in addition to the fact that the tension is conservatively estimated from the strains, as already discussed, indicates that there is sufficient safety factor against tension failure for all the instrumented geogrids. For completeness, the maximum tension forces in the geogrids as obtained using the software MSEW V.3 developed by Adama Engineering, Inc. and based on limit equilibrium method are provided in Column 6. By comparison with Column 8, it can be seen that the design tension forces are less than the maximum allowable tension indicating that some conservatism was used in design.

9
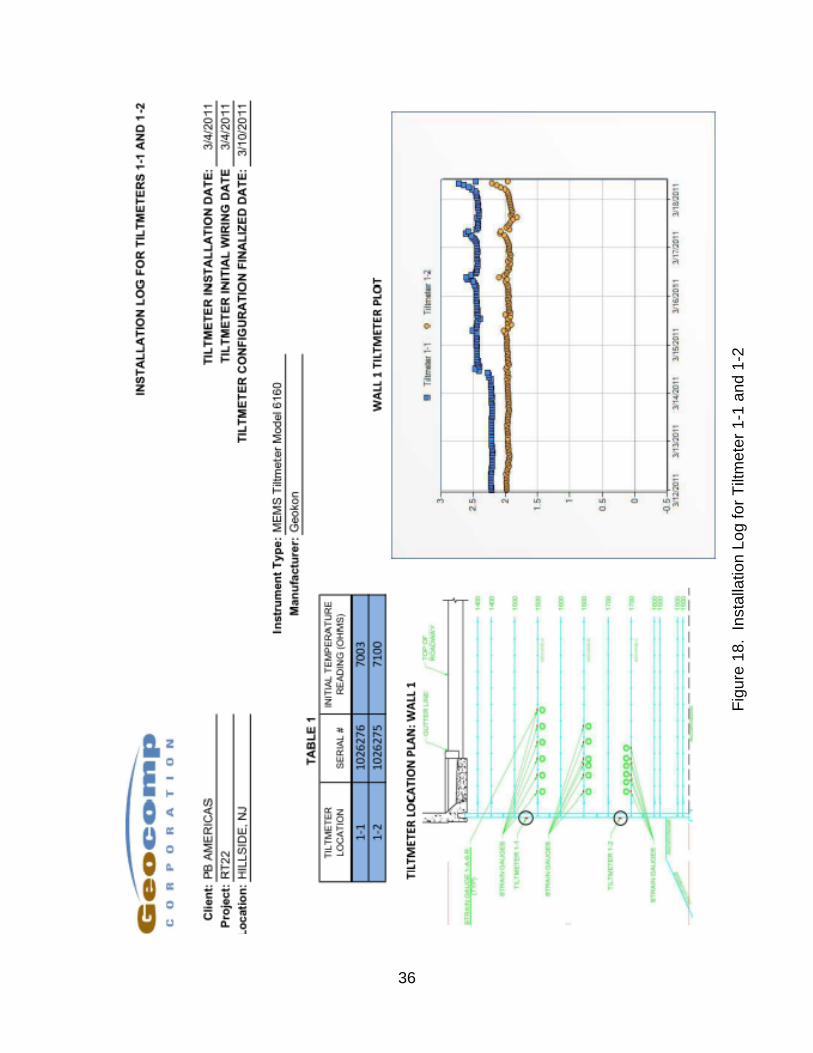
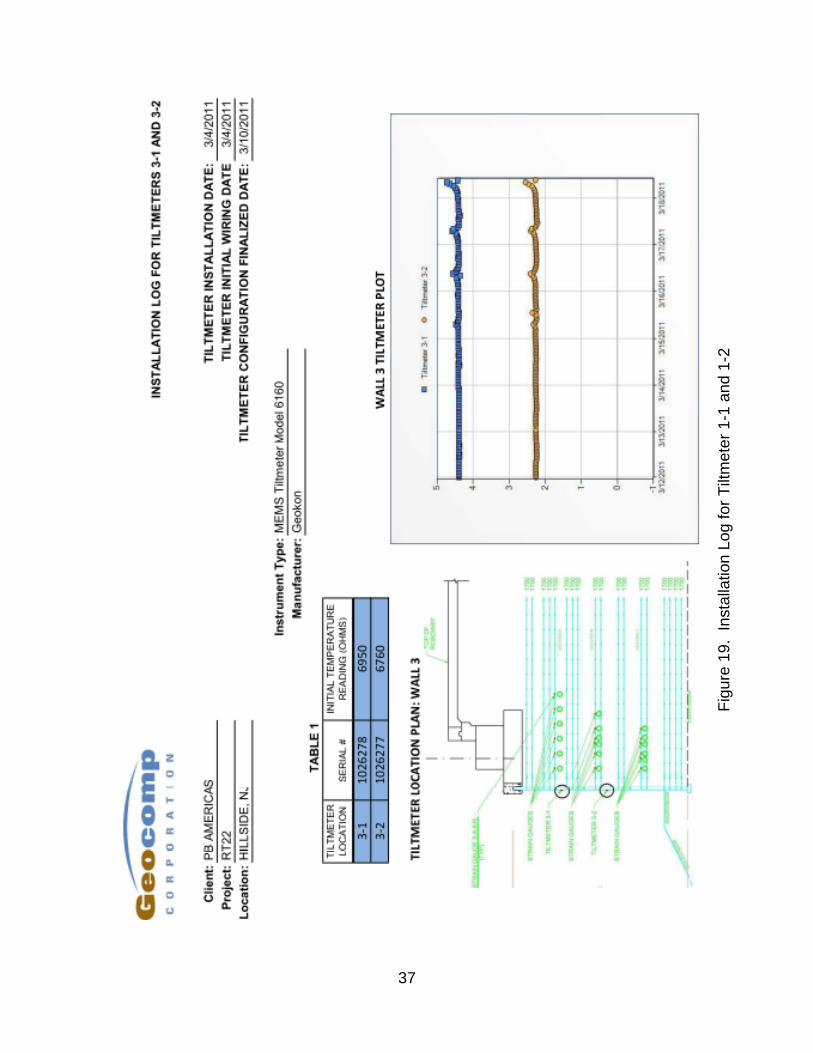
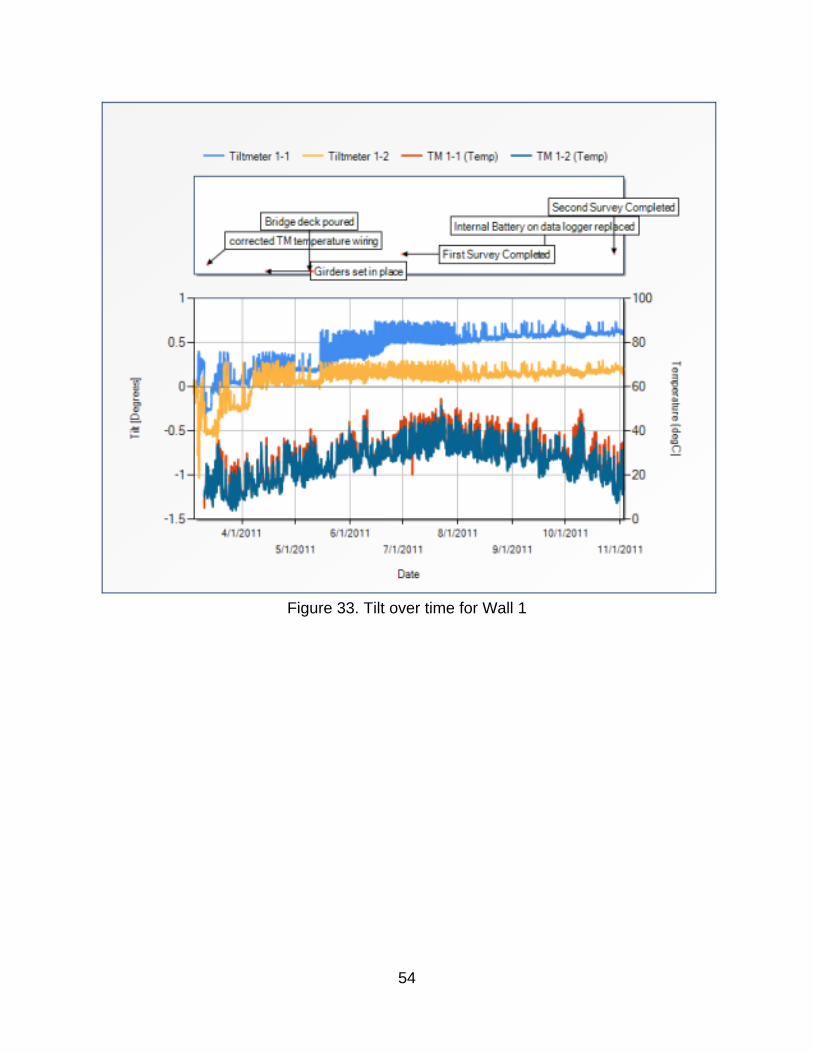
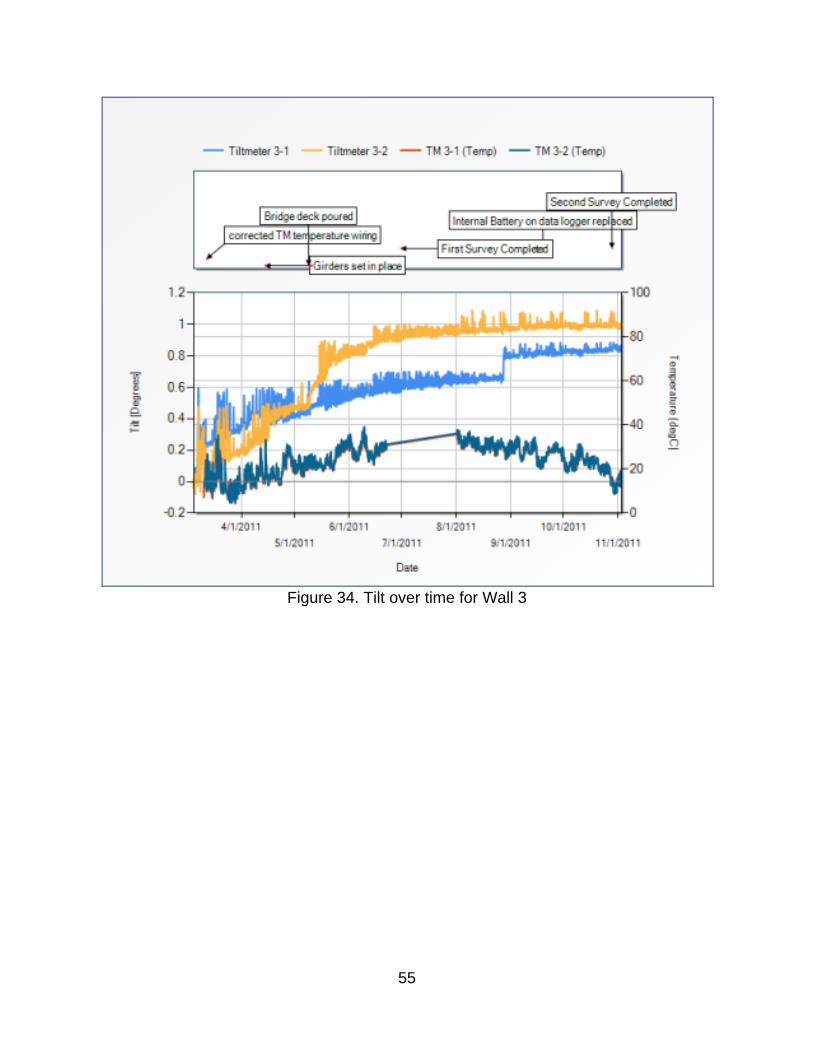
Tiltmeter Data Plots showing the variation of facing tilt during construction since the time of installation are provided in Appendix F for all tiltmeters. The maximum tilts measured in May and November of 2011 at the four tiltmeter locations are summarized in Table 3. It is to be noted that the tilts reported in the interim report were overestimated due to the fact that the reference initial readings were not representative of the stabilized values. Proper zeroing after stabilization of the initial readings is reflected in the present results. Table 3 indicates an increase in tilt over a period of 6 months after construction of the wall which is to be expected since the geogrids experienced some additional strain due to creep.
Table 3 – Tiltmeter measurement Wall No. Titlmeter Number Maximum Tilt (radians) Average Tilt
(radians) 5/11/2011 11/17/2011 5/11/2011 11/17/2011
Wall 1 1-1 (Upper) 0.003 0.010 0.002 0.007 1-2 (Lower) 0.001 0.004
Wall 3 3-1 (Upper) 0.008 0.015 0.009 0.016 3-2 (Lower) 0.011 0.018 FHWA publication FHWA-NHI-024, 2009 provides an empirical estimate of the ratio of maximum lateral movement to the wall height for different L/H values where L is the reinforcement length and H is the wall height. The maximum lateral deformation can be obtained from Figure 5, which is reproduced from Figure 2-15 of the FHWA manual. The same figure is also provided in the 2010 AASHTO LRFD Bridge Design Specifications (Figure C111.10.4.2.1). Using Figure 5, the ratio of maximum lateral movement to wall height would be equal to 0.013 for Wall 1 and 0.010 for Wall 3. These values are of the same order of magnitude of the values in Table 3. However, all values should be viewed in light of the fact that direct comparison between the average measured tilts and the empirical ratio of maximum lateral movement to wall height obtained from Figure 5 is not strictly valid since the maximum displacement does not necessarily occur at the top of the wall. If, for example, the maximum lateral movement occurs in the middle of the wall, then the maximum tilt along the wall would be double or more than double the ratio of maximum lateral movement to wall height from Figure 5. It may be mentioned that there was an increase in tilt of Tiltmeter 1-2 on April 14, 2011, which corresponded to construction activities involving heavy equipment on the wall. Based on the order of magnitude of the wall tilt, it can be concluded that the wall deformation is not excessive and comparable to typical MSE wall behavior.

10
Figure 5. Empirical curve for estimating lateral displacement during construction for
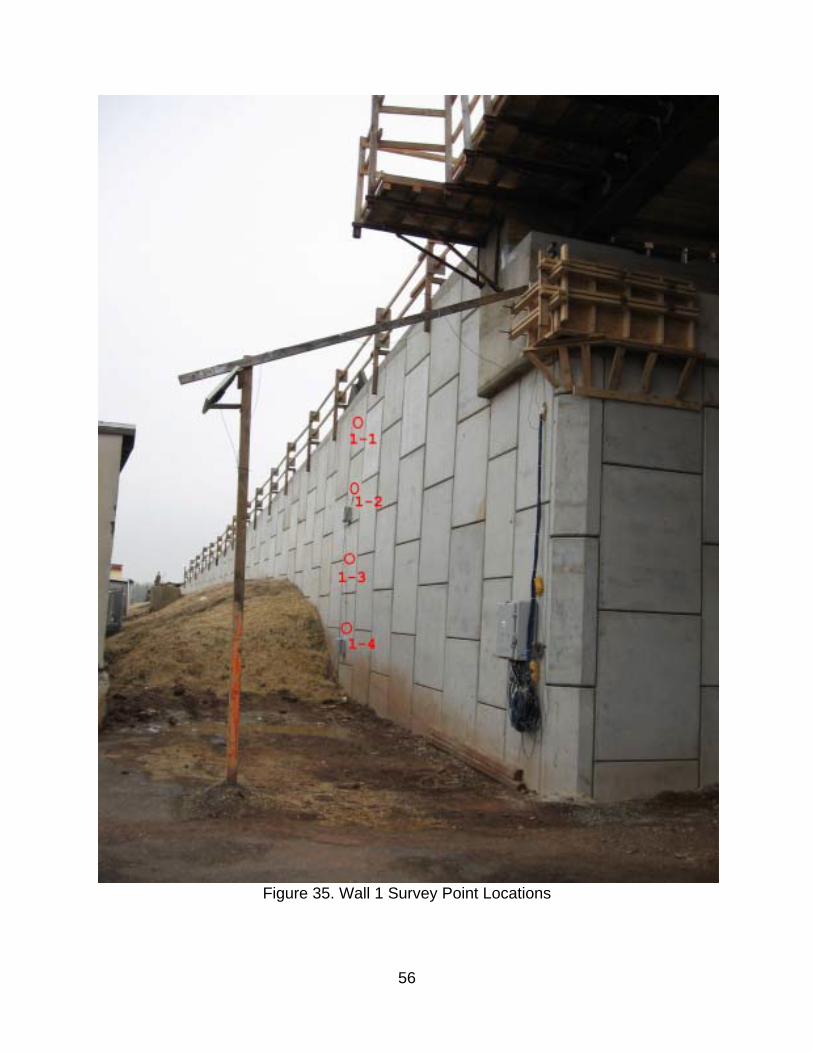
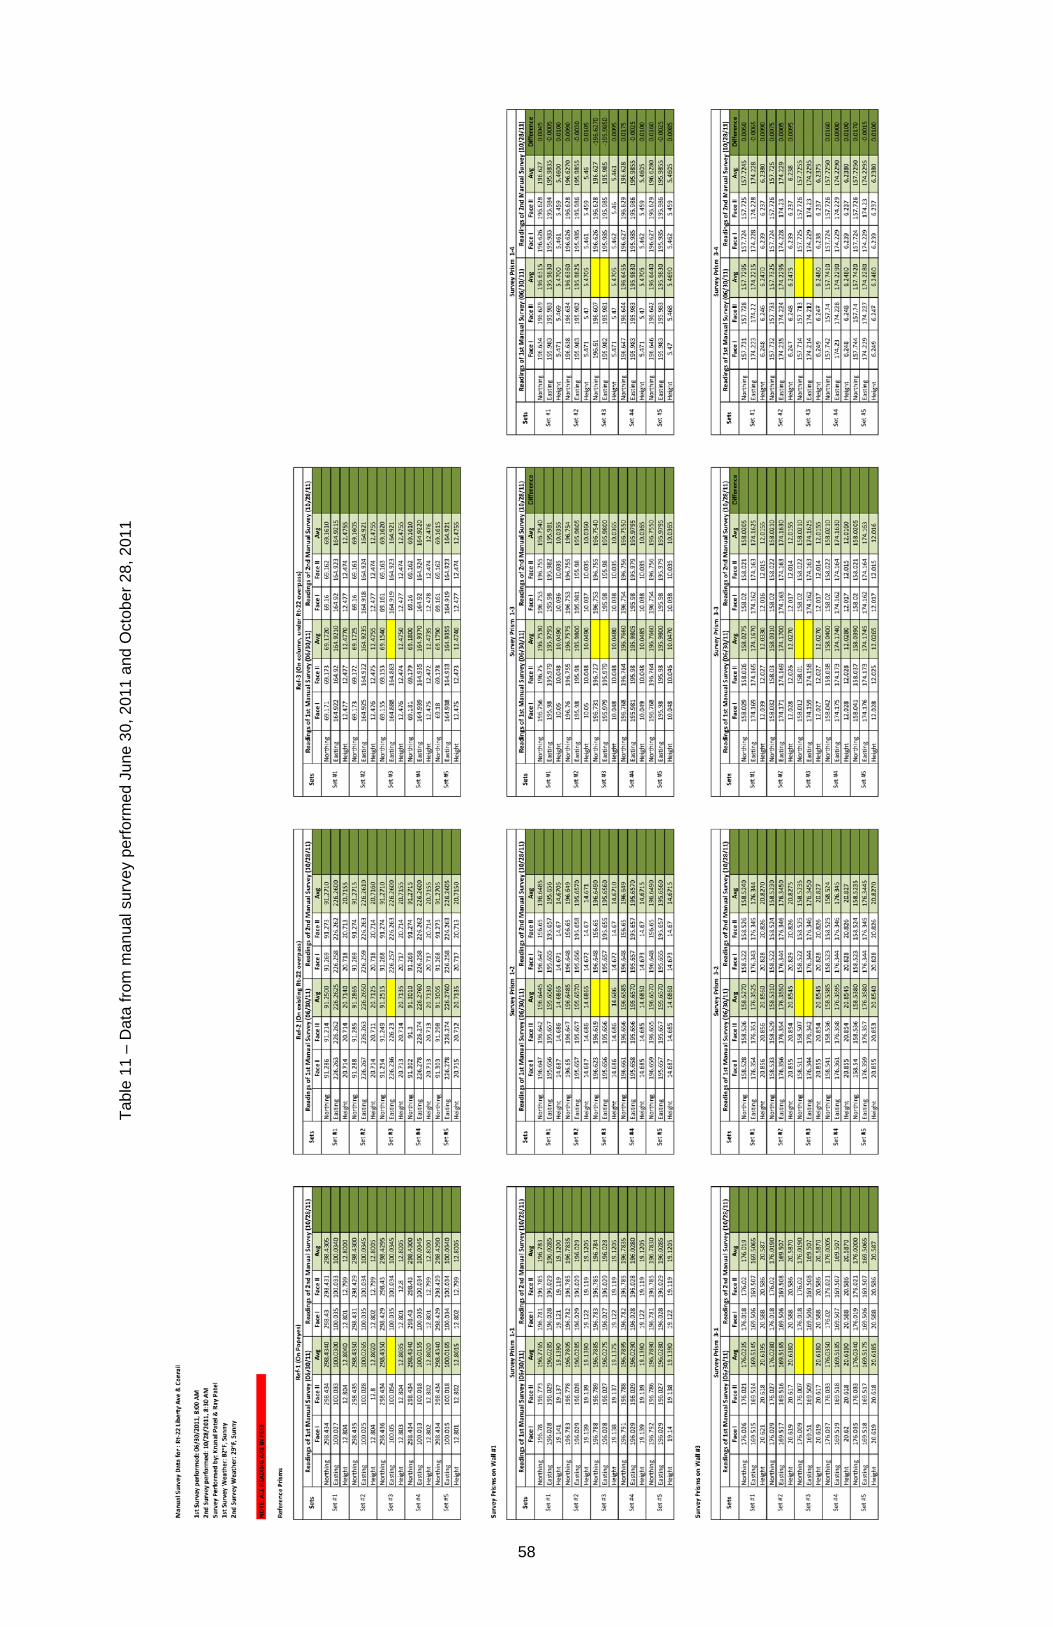
MSE walls (after FHWA RD 89-043 {Christopher et al., 1990}) Optical Prism Data Five sets of survey readings were taken by Geocomp on June 30, 2011 to establish the average and standard deviation for the northing, easting, and elevation for each optical prism. Another survey was performed October 28, 2011 to determine the changes in northing, easting, and elevation between the two dates (about four months). Inspection of the data which are included in Appendix F indicates that in almost all cases the final values of the northing and easting fall within the range between the minimum and maximum of the corresponding initial values indicating that the measured displacements in the north and east directions are within the range of accuracy of the initial survey data and hence could not be accurately evaluated. This, in addition to the fact that the deduced out of plane displacements of the wall at several prisms were toward the inside of the wall which is not practically possible, leads to the conclusion that the wall face displacements are too small to be accurately evaluated with the survey equipment. The changes in elevation data of the optical prisms indicate that the maximum measured vertical movement of all prisms for each wall is relatively small being equal to 0.22 inch for Wall 1 and 0.38 inch for Wall 3. The subsurface conditions encountered at the two walls generally consist of layers of predominantly coarse grained soils alternating with layers of predominantly fine grained soils. It is reasonable to assume that settlement occurring after wall construction would be due to possible compression with time of the fine grained soil layers.

11
FINITE ELEMENT ANALYSES As already mentioned, finite element analyses were performed to evaluate the wall behavior. The computer software Plaxis (2008) was used to conduct the analyses which were performed in stages to model the actual construction sequence in terms of placement of soil lifts, geogrid layers and facing panels, construction of the stub abutment and application of the bridge loads. Only the maximum tension in the geogrids can be obtained from limit equilibrium analyses such as those performed using the program MSEW v.3 while tension distribution as well as wall deformation can be estimated using the finite element method. It is beyond the scope of this report to present the results of the finite element analyses. However, it is worth mentioning that the geogrid tensile loads based on both limit equilibrium and finite element methods and those deduced from measured strains are less than the allowable design strength demonstrating that the geogrid load levels are within allowable limits. SUMMARY
1. Design of the MSE walls was performed according to the allowable stress design (ASD) method. There was some conservatism in design in that the calculated geogrid tension was less than the long-term design strength (LTDS) of the used geogrids divided by the global factor of safety of 1.5.
2. Geogrid tensions were determined using the quick load-extension tests (ASTM D6637) which are performed using a strain rate of 10% per minute. Hence, it can be postulated that the tension is overestimated since it does not consider the potential creep at the slow rate of loading during construction.
3. The geogrid tension deduced from the quick load-extension tests is less than the long-term design strength (LTDS) divided by the global factor of safety of 1.5, indicating that the geogrid load levels are currently within allowable limits. This is also the case based on the results of the finite element analyses.
4. The wall facing deformation is typical of MSE wall behavior based on comparison with published empirical data.
5. The overall behavior of the two instrumented walls does not indicate overstressing of the geogrid reinforcing elements or excessive facing deformation, which indicates stability of the walls during and after construction until the present time.
6. A survey of the optical prisms mounted on the facing of the two walls was performed after construction of the wall and four months later. The estimated displacements in the north and east directions were within the range of accuracy of the initial survey data and hence could not be evaluated. This, in addition to the fact that the deduced out of plane displacements of the wall at several prisms were toward the retained soil which is not practically possible, leads to the conclusion that the wall face displacements are too small to be accurately evaluated with the survey equipment. The maximum measured vertical movement of all prisms for each wall is relatively small being equal to 0.22 inch for Wall 1 and 0.38 inch for Wall 3. The settlement occurring after wall

12
construction may be attributed to compression with time of the fine grained soil layers.
REFERENCES
1. AASHTO Standard Specifications for Highway Bridges, 17th Edition, American Association of State Highway and Transportation Officials (2002).
2. ASTM Standard D6637-10, “Standard Test Method for Determining Tensile Properties of Geogrids by the Single or Multi-Rib Tensile Method,” ASTM International, West Conshohocken, PA. (2010).
3. AASHTO LRFD Bridge Design Specifications, 5th Edition, American Association of State Highway and Transportation Officials (2010).
4. FHWA Publication No. FHWA-NHI-10-024., “Design and Construction of Mechanically Stabilized Earth Walls and Reinforced Soil Slopes”, Federal Highway Administration, US Department of Transportation (2009).
13
APPENDIX A – TENSAR GEOGRID LOAD-EXTENSION CURVES
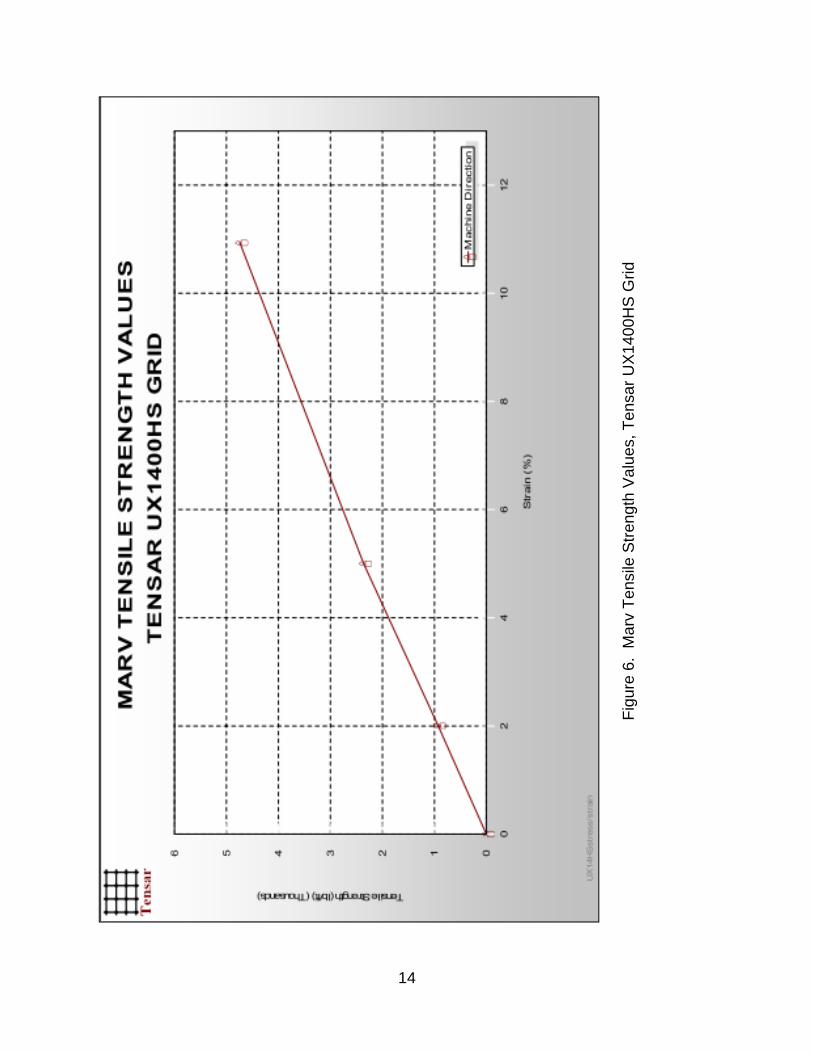
14
Figu
re 6
. M
arv
Tens
ile S
treng
th V
alue
s, T
ensa
r UX
1400
HS
Grid
15
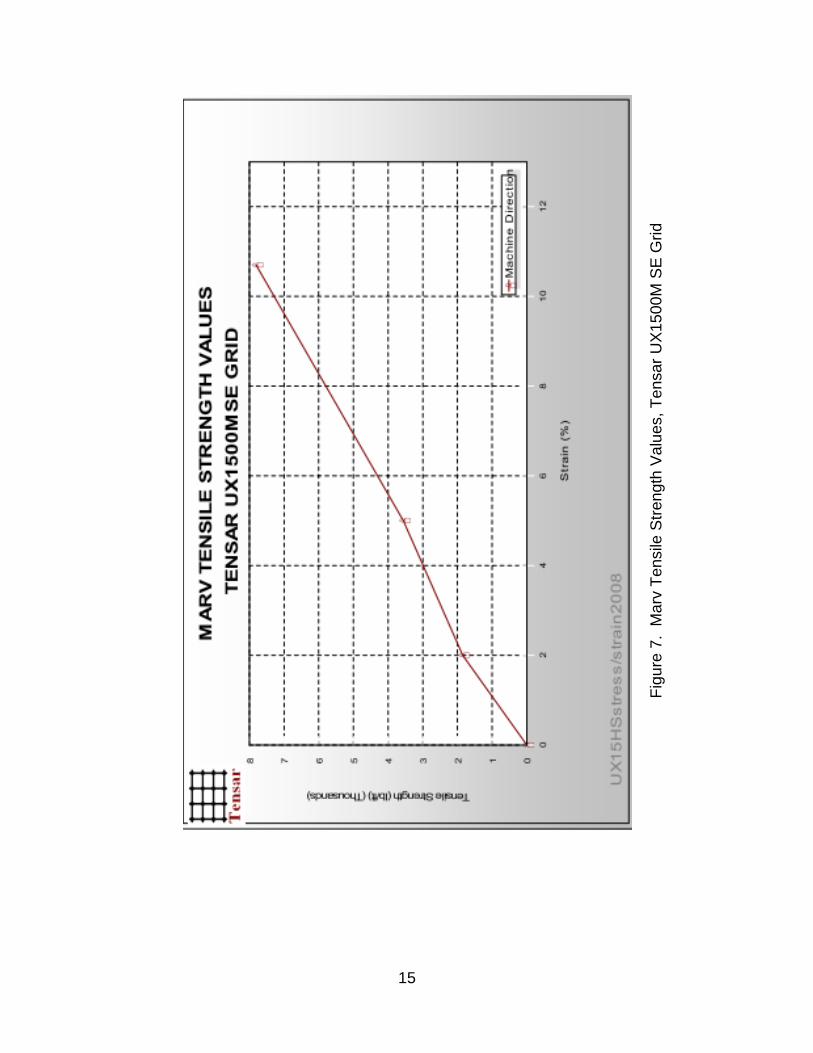
Figu
re 7
. M
arv
Tens
ile S
treng
th V
alue
s, T
ensa
r UX
1500
M S
E G
rid
16
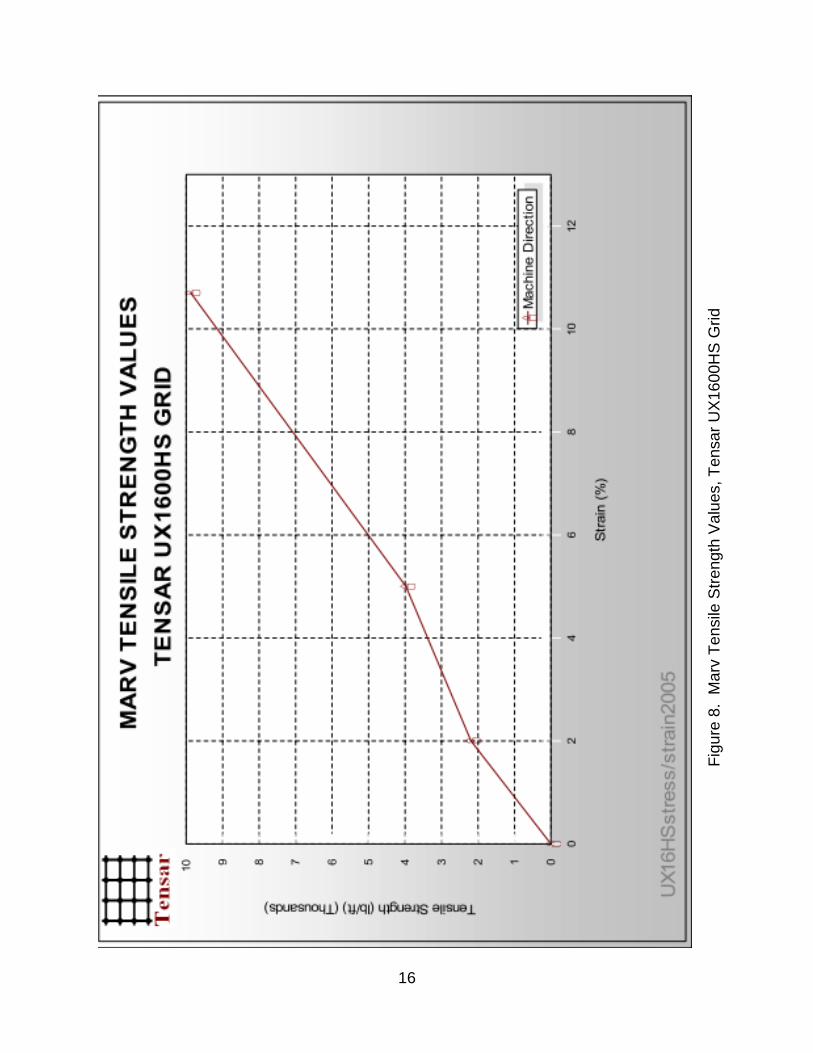
Figu
re 8
. M
arv
Tens
ile S
treng
th V
alue
s, T
ensa
r UX
1600
HS
Grid
17
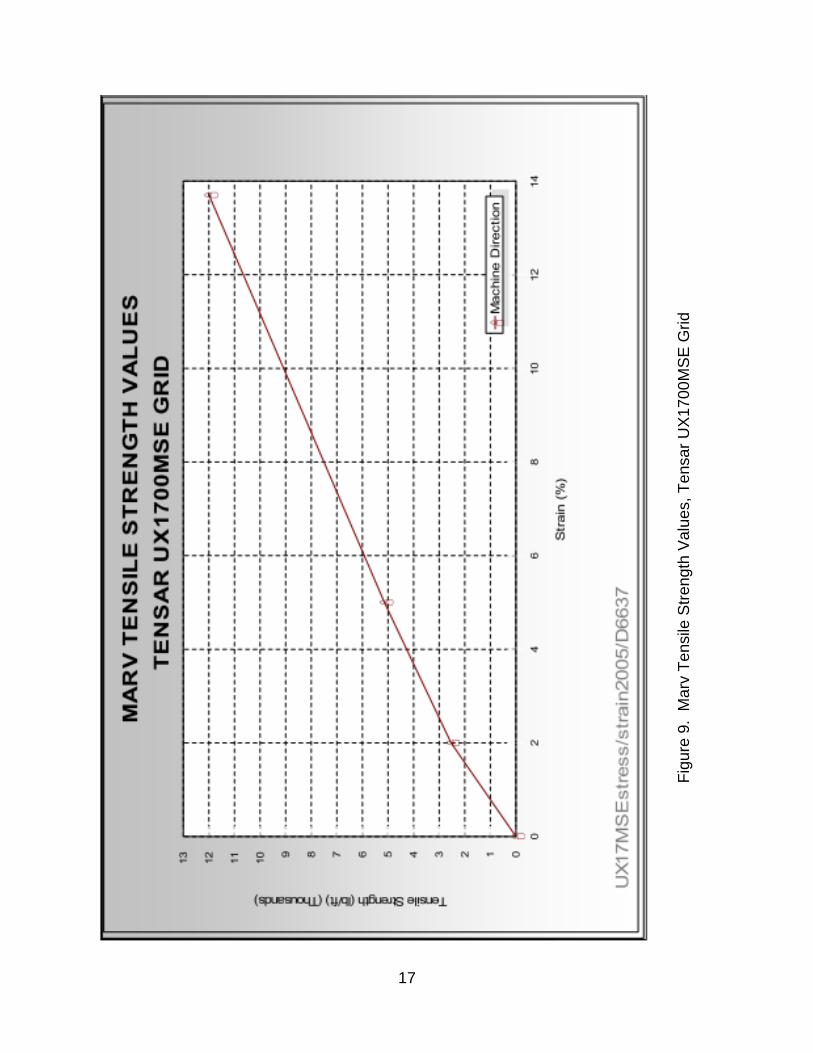
Figu
re 9
. M
arv
Tens
ile S
treng
th V
alue
s, T
ensa
r UX
1700
MS
E G
rid

18
APPENDIX B – STRAIN GAGE, TILTMETER, AND OPTICAL PRISM SELECTED LOCATIONS

19
Figu
re 1
0. S
ectio
n A
– M
SE
Wal
l 1

20
Figu
re 1
1. D
etai
l 1 –
Ele
vatio
n M
SE
Wal
l 1

21
Figu
re 1
2. S
ectio
n B
– M
SE
Wal
l 3
22
Figu
re 1
3. D
etai
l 2 –
Ele
vatio
n M
SE
Wal
l 3
23
Figure 14. Optical Prism Locations at Wall 1
24
Figure 15. Optical Prism Locations at Wall 3

25
APPENDIX C – STRAIN GAGE INSTALLATION LOGS

26
Figure 16. Microstrain over time for Wall 1 Geogrid C
27
Figure 17. Microstrain over time for Wall 3 Geogrid C
28
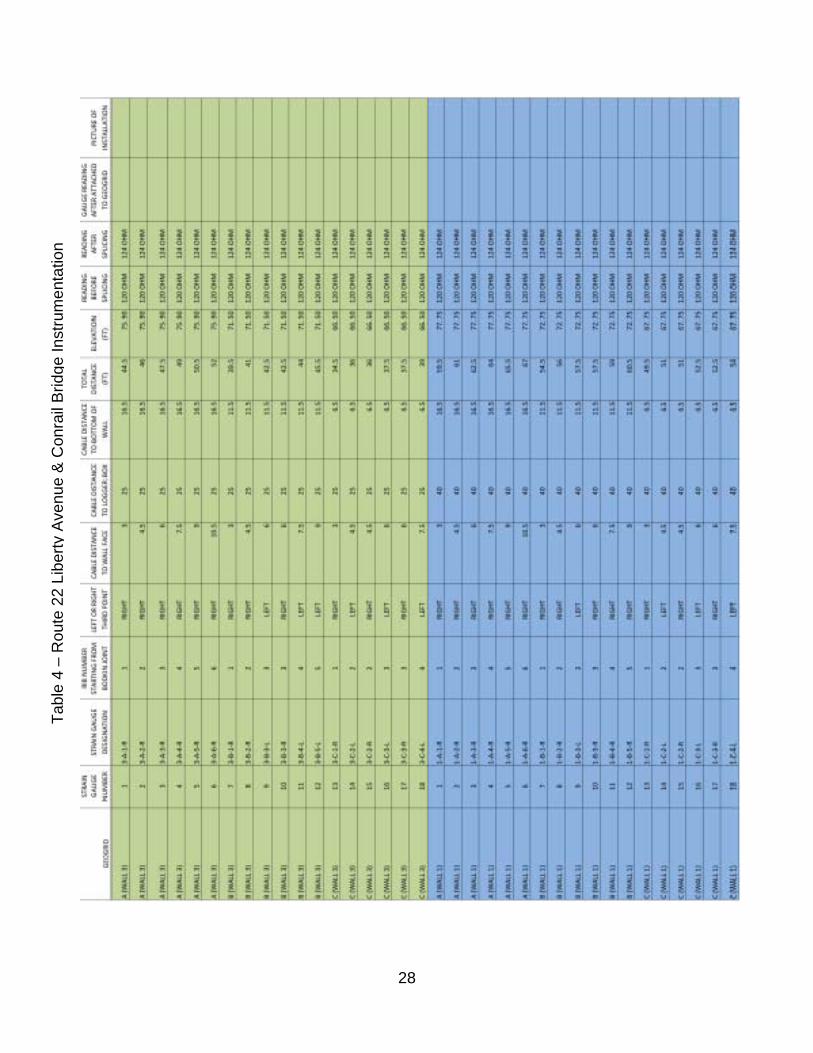
Tabl
e 4
– R
oute
22
Libe
rty A
venu
e &
Con
rail
Brid
ge In
stru
men
tatio
n
29
Table 5 – Installation Log for Wall 3, Layer A, Gage Readings

30
Table 6 – Installation Log for Wall 3, Layer B, Gage Readings
31
Table 7 – Installation Log for Wall 3, Layer C, Gage Readings
32
Table 8 – Installation Log for Wall 1, Layer A, Gage Readings
33
Table 9 – Installation Log for Wall 1, Layer B, Gage Readings
34
Table 10 – Installation Log for Wall 1, Layer C, Gage Readings

35
APPENDIX D – TILTMETER INSTALLATION LOGS
36
Figu
re 1
8. I
nsta
llatio
n Lo
g fo
r Tilt
met
er 1
-1 a
nd 1
-2
37
Figu
re 1
9. I
nsta
llatio
n Lo
g fo
r Tilt
met
er 1
-1 a
nd 1
-2

38
APPENDIX E – CONSTRUCTION PHOTOS
39
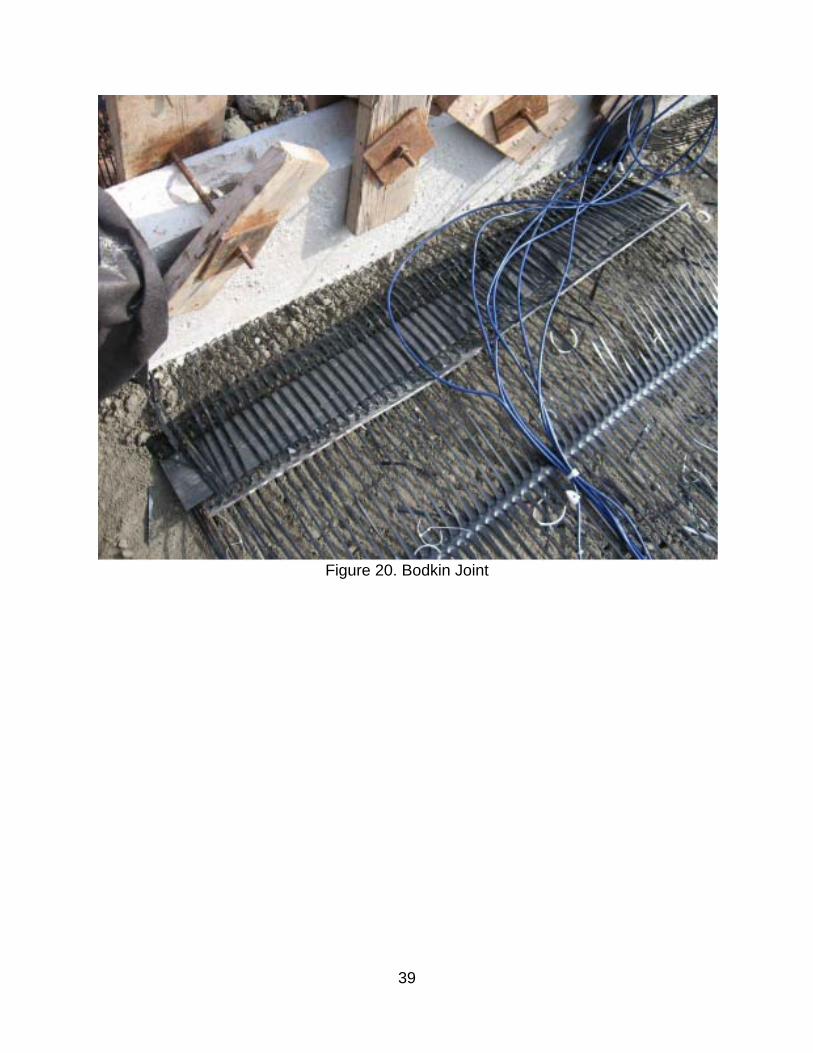
Figure 20. Bodkin Joint
40
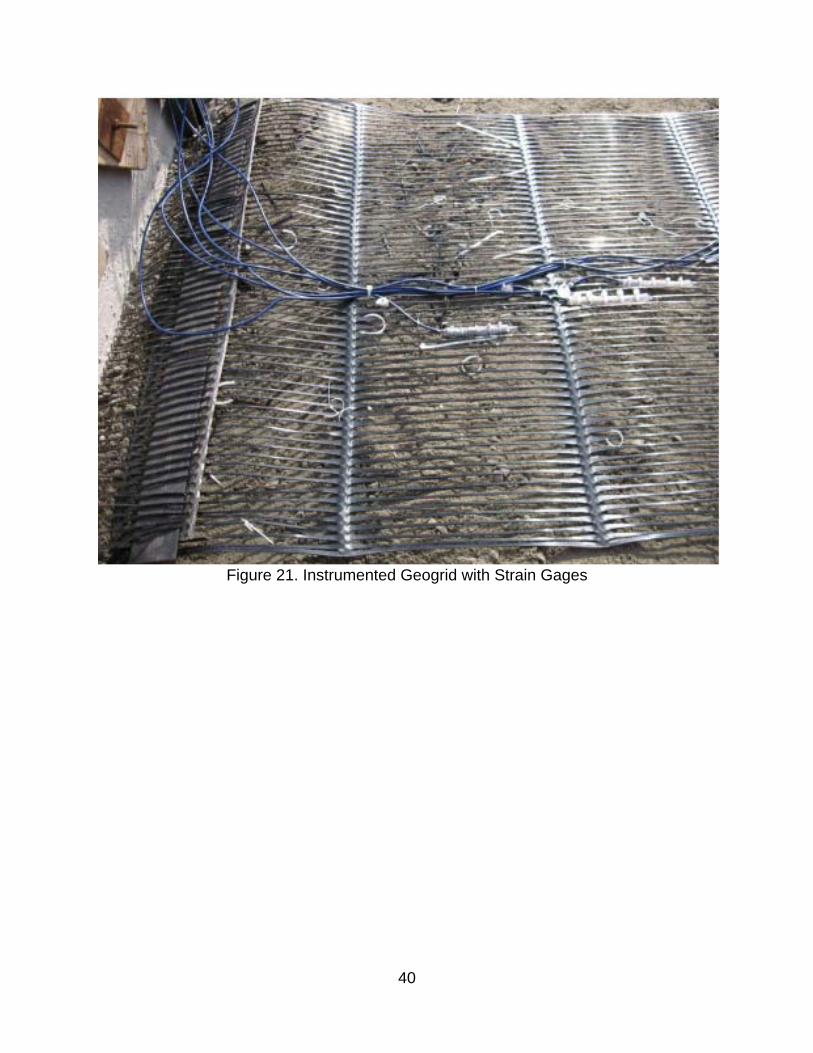
Figure 21. Instrumented Geogrid with Strain Gages
41
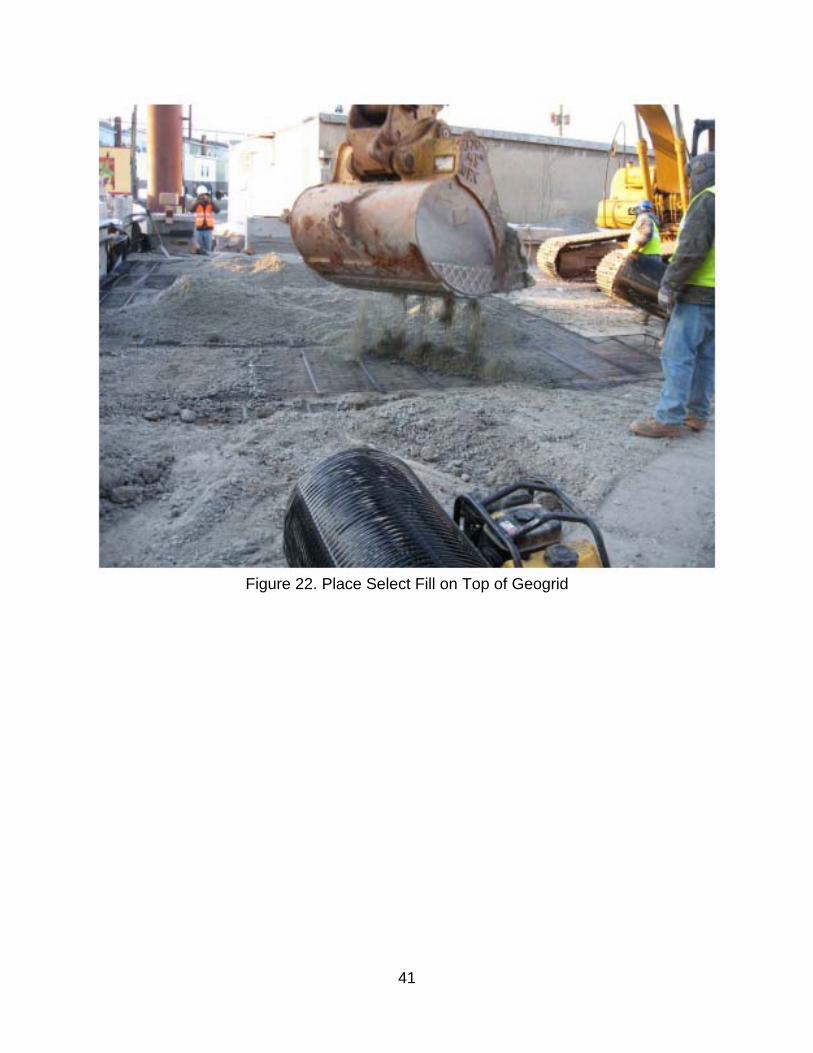
Figure 22. Place Select Fill on Top of Geogrid
42
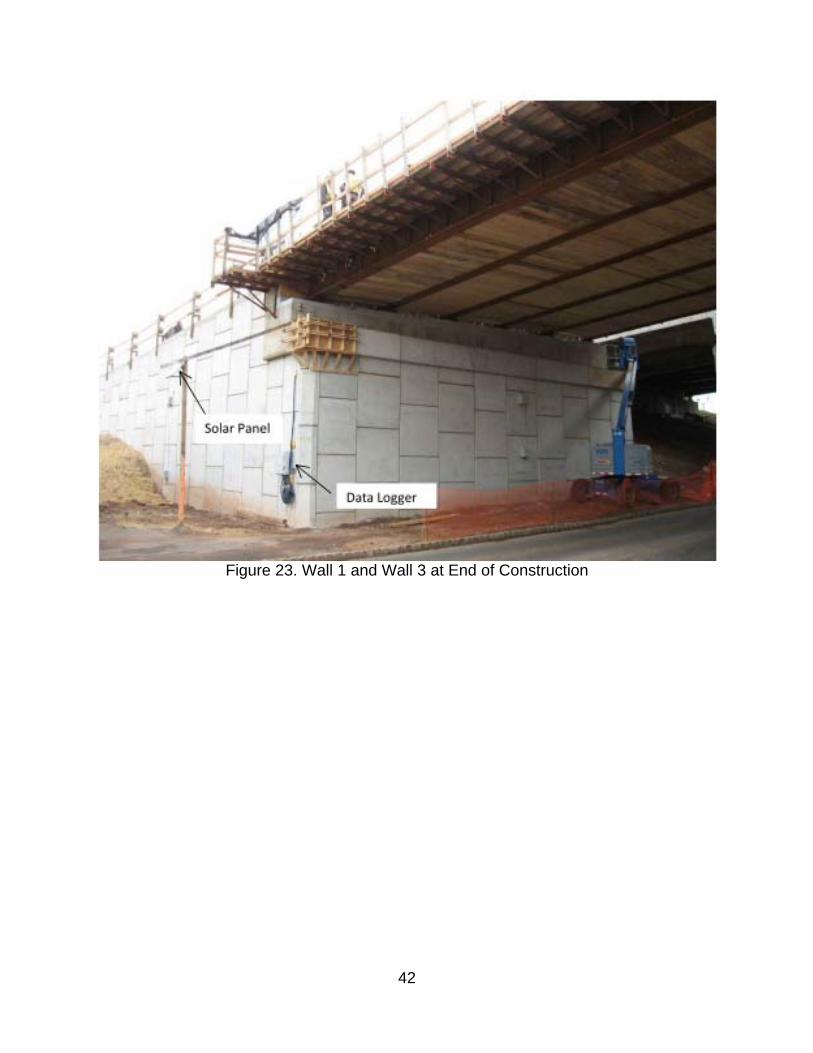
Figure 23. Wall 1 and Wall 3 at End of Construction

43
APPENDIX F – INSTRUMENTATION MONITORING DATA SUBMITTED BY GEOCOMP

44
45
Figure 24. Profile View of Wall 1
46
Figure 25. Microstrain over time for Wall 1 Geogrid A
47
Figure 26. Microstrain over time for Wall 1 Geogrid B
48
Figure 27. Microstrain over time for Wall 1Geogrid C

49
Figure 28. Profile view of Wall 3

50
Figure 29. Microstrain over time for Wall 3 Geogrid A
51
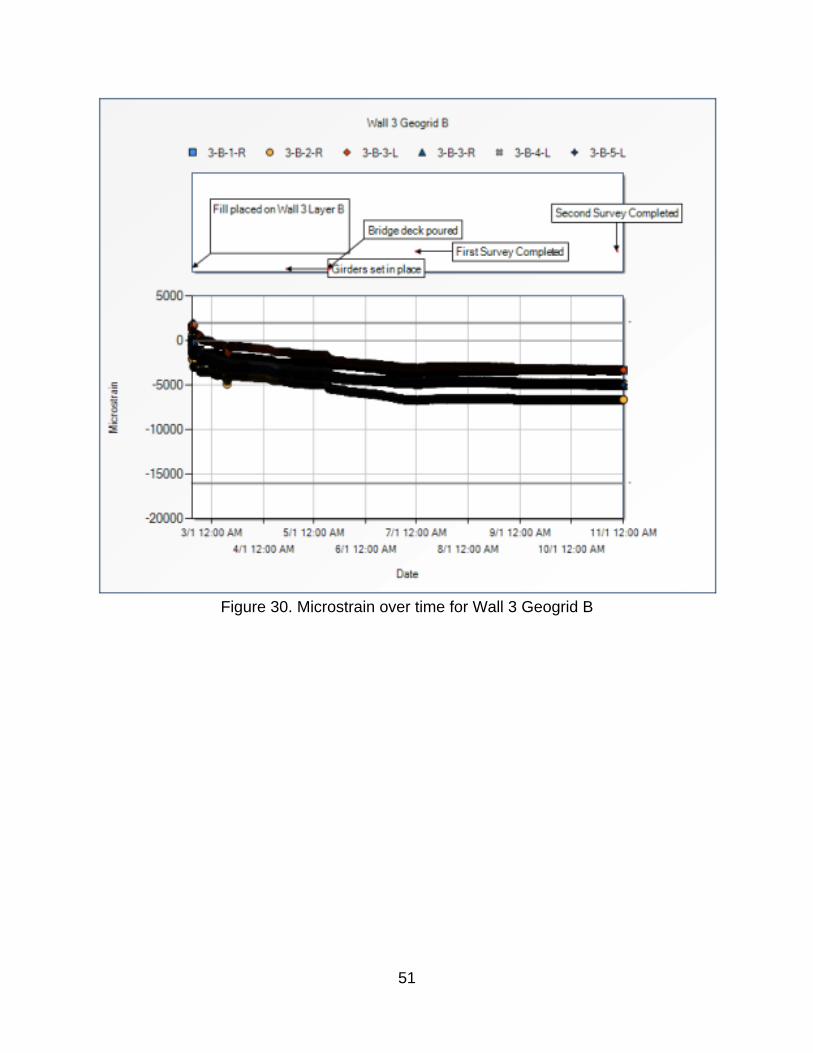
Figure 30. Microstrain over time for Wall 3 Geogrid B

52
Figure 31. Microstrain over time for Wall 3 Geogrid B
53
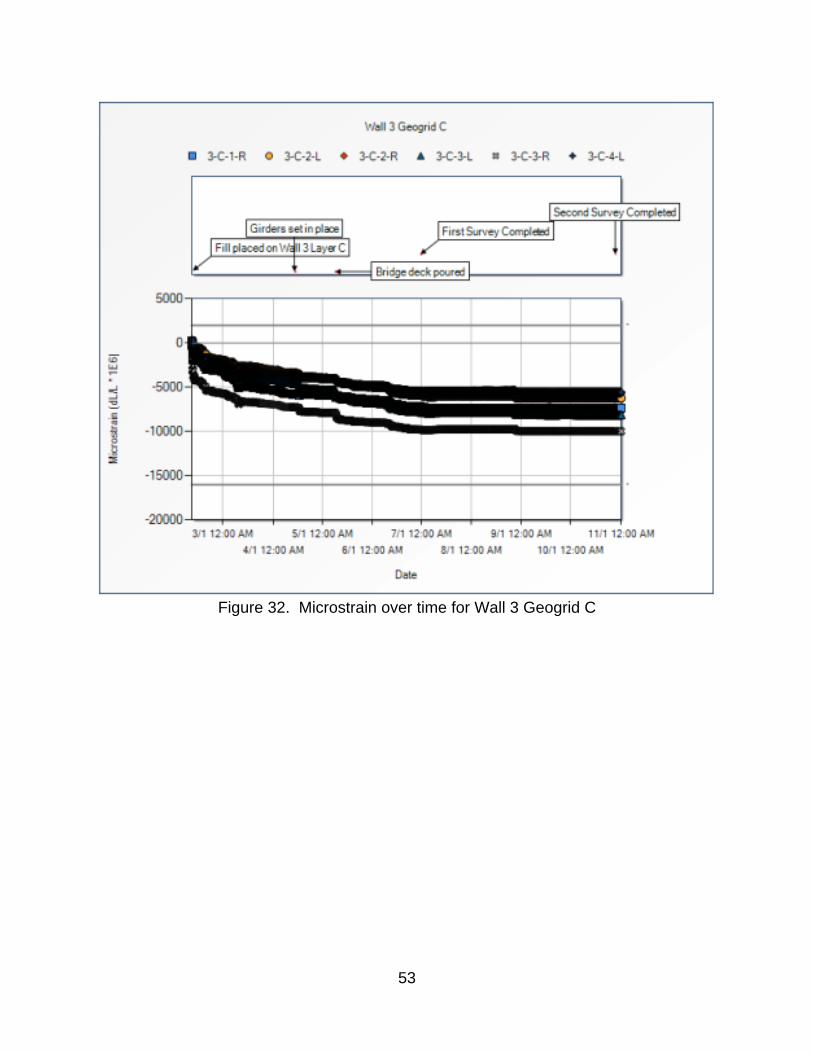
Figure 32. Microstrain over time for Wall 3 Geogrid C
54
Figure 33. Tilt over time for Wall 1
55
Figure 34. Tilt over time for Wall 3
56
Figure 35. Wall 1 Survey Point Locations

57
Figure 36. Wall 3 Survey Point Locations
58
Tabl
e 11
– D
ata
from
man
ual s
urve
y pe
rform
ed J
une
30, 2
011
and
Oct
ober
28,
201
1

59
Tabl
e 12
– S
umm
ary
tabl
es w
ith m
easu
red
disp
lace
men
ts o
f all
surv
ey p
oint
s fro
m J
une
30, 2
011
to O
ctob
er 2
8, 2
011
man
ual s
urve
ys