royal philips to be published here soon · 2017. 1. 6. · q2 quarterly results 2011 ±...
TRANSCRIPT

October 21st, 2013
Royal Philips Third Quarter 2013
Information booklet
To be published here soon:
(please refresh the page)
Royal Philips ElectronicsQ2 Quarterly Results 2011 – Presentation
July 18, 2011
Important information Forward-looking statements This document and the related oral presentation, including responses to questions following the presentation, contain certain forward-looking statements with respect to the financial condition, results of operations and business of Philips and certain of the plans and objectives of Philips with respect to these items. Examples of forward-looking statements include statements made about our strategy, estimates of sales growth, future EBITA and future developments in our organic business. By their nature, these statements involve risk and uncertainty because they relate to future events and circumstances and there are many factors that could cause actual results and developments to differ materially from those expressed or implied by these statements. These factors include, but are not limited to, domestic and global economic and business conditions, developments within the euro zone, the successful implementation of our strategy and our ability to realize the benefits of this strategy, our ability to develop and market new products, changes in legislation, legal claims, changes in exchange and interest rates, changes in tax rates, pension costs and actuarial assumptions, raw materials and employee costs, our ability to identify and complete successful acquisitions and to integrate those acquisitions into our business, our ability to successfully exit certain businesses or restructure our operations, the rate of technological changes, political, economic and other developments in countries where Philips operates, industry consolidation and competition. As a result, Philips’ actual future results may differ materially from the plans, goals and expectations set forth in such forward-looking statements. For a discussion of factors that could cause future results to differ from such forward-looking statements, see the Risk management chapter included in our Annual Report 2012 and the “Risk and uncertainties” section in our semi-annual financial report for the six months ended July 1, 2013.
Third-party market share data Statements regarding market share, including those regarding Philips’ competitive position, contained in this document are based on outside sources such as specialized research institutes, industry and dealer panels in combination with management estimates. Where information is not yet available to Philips, those statements may also be based on estimates and projections prepared by outside sources or management. Rankings are based on sales unless otherwise stated.
Use of non-GAAP Information In presenting and discussing the Philips Group financial position, operating results and cash flows, management uses certain non-GAAP financial measures. These non-GAAP financial measures should not be viewed in isolation as alternatives to the equivalent IFRS measures and should be used in conjunction with the most directly comparable IFRS measures. A reconciliation of such measures to the most directly comparable IFRS measures is contained in our Annual Report 2012. Further information on non-GAAP measures can be found in our Annual Report 2012.
Use of fair-value measurements In presenting the Philips Group’s financial position, fair values are used for the measurement of various items in accordance with the applicable accounting standards. These fair values are based on market prices, where available, and are obtained from sources that are deemed to be reliable. Readers are cautioned that these values are subject to changes over time and are only valid at the balance sheet date. When quoted prices do not exist, we estimated the fair values using appropriate valuation models, and when observable market data are not available, we used unobservable inputs. They require management to make significant assumptions with respect to future developments, which are inherently uncertain and may therefore deviate from actual developments. Critical assumptions used are disclosed in our 2012 financial statements. Independent valuations may have been obtained to support management’s determination of fair values. All amounts in millions of euro’s unless otherwise stated; data included are unaudited. Financial reporting is in accordance with the accounting policies as stated in the Annual Report 2012, unless otherwise stated.

1. Management update
2. Group results Q3 2013
3. Accelerate! Change and performance
4. Philips Business System and Path-to-Value
5. Group and sector overview
Agenda

Improved earnings in all sectors; growth geographies drive sales increase
• Comparable sales increased by 3% year-on-year to reach EUR 5.6 billion
• Comparable sales growth was 9% in Consumer Lifestyle and 3% in Lighting
• Healthcare comparable sales were flat, equipment order intake declined by 2%
• Comparable sales in growth geographies up 10%
• Inventories as a % of sales improved by 0.4 percentage points to 16.5%
• ROIC excl. the CRT fine2 improved to 10.7%, from 7.2% in Q3 2012
• Free Cash Flow was an inflow of EUR 117 million compared to an inflow of EUR
410 million in Q3 2012
Management update Q3 2013: Group
• Total gross overhead cost savings ahead of plan, EUR 856 million to date
• Net income was EUR 281 million, up by EUR 176 million compared to Q3 2012
Sales & order intake
EBITA & Adjusted EBITA1
Asset management
& ROIC
Cost savings & Net Income
4
1 Adjusted EBITA in Q3 2013 excludes restructuring and other charges of EUR 72 million 2 European Commission fine related to Cathode-Ray Tubes, a business divested by Philips in 2011. Philips has appealed the decision. Charges were taken in Q4 2012
Note - Prior-period financials revised for discontinued operations, the adoption of IAS19R and for restatements included in the Annual Report 2012 (please refer to the Annual Report
section 12.10 “Significant Accounting Policies”)
• EBITA amounted to EUR 562 million, 10.0% of sales and included a loss of EUR
31 million caused by an increase in the discount rate related to a settlement of
the lump sum offering to former employees enrolled in our US pension plan. Q3
2012 EBITA was 6.3%
• Adjusted EBITA improved by 33% to EUR 634 million, 11.3% of sales, from 8.2%
in Q3 2012, driven by gross margin and cost improvements in all sectors
• New share buyback program of EUR 1.5 billion starts on October 21st 2013.
Program to be completed in two to three years Others

Sales
• Comparable sales were in line with Q3 2012
• Customer Services increased by mid-single-digit, Patient Care & Clinical
Informatics and Home Healthcare Solutions grew by low-single-digit, while
Imaging Systems sales showed a mid-single-digit decline
• EBITA increased to 14.6% of sales, from 12.5% in Q3 2012
• Adjusted EBITA was14.6%, compared to 12.6% in Q3 2012. The 200 bps
improvement was due to higher gross margins and overhead cost reductions
EBITA & Adjusted EBITA1
Net Operating Capital (NOC)
Operational earnings improve by 200 bps, despite flat top line
Management update Q3 2013: Healthcare
5
• Currency comparable, NOC decreased by EUR 189 million to EUR 7.5 billion
• Inventories as a % of sales improved by 1.2 percentage points, with
improvements seen across all businesses
1 Adjusted EBITA in Q3 2013 excludes restructuring and acquisition-related charges of EUR 1 million
Note - Prior-period financials revised for discontinued operations, the adoption of IAS19R and for restatements included in the Annual Report 2012 (please refer to the Annual Report
section 12.10 “Significant Accounting Policies”)
Order intake (OIT)
• Currency-comparable equipment order intake declined by 2%. China and India
increased by double-digits
• The launch of EPIQ impacted the OIT in July and August, and Q3 2012 had
large and multi-year deals, excluding which OIT grew by low-single-digit
• Imaging Systems equipment orders grew by low-single-digit, Patient Care &
Clinical Informatics declined by 7%
• Compared to Q3 2012, the number of employees decreased by 659, mainly as a
result of reductions in North America and Europe Others

Sales • Comparable sales grew by 9% compared to Q3 2012
• Strong double-digit growth was seen at Health & Wellness. Domestic Appliances
recorded high-single-digit growth and Personal Care grew by mid-single-digit
• The number of employees decreased by 799 year-on-year, due to the seasonal
outflow of temporary industrial personnel, mainly in the Domestic Appliances
business
High-single-digit growth; Operational earnings improve by 300 bps
Management update Q3 2013: Consumer Lifestyle
Net Operating Capital (NOC)
6
Other
• Currency comparable, NOC decreased by EUR 200 million year-on-year, largely
driven by lower working capital requirements
1 Adjusted EBITA in Q3 2013 excludes restructuring and acquisition-related charges of EUR 5 million
Note - Prior-period financials revised for discontinued operations, the adoption of IAS19R and for restatements included in the Annual Report 2012 (please refer to the Annual Report
section 12.10 “Significant Accounting Policies”)
• EBITA was EUR 116 million, or 10.6% of sales, up from 7.4% in Q3 2012
• Adjusted EBITA increased to 11.1%, from 8.1% in Q3 2012. The improvement
was driven by operating leverage from higher sales and better gross margins
across all businesses
• Stranded costs from discontinued operations decreased from EUR 16 million
last year to EUR 7 million in Q3 2013
EBITA & Adjusted EBITA1

Sales
• Comparable sales were 3% above last year
• Lumileds and Automotive grew by double-digits, Light Sources & Electronics
achieved low-single-digit growth. Professional Lighting Solutions and
Consumer Luminaires sales declined by low-single-digit
• LED-based sales grew 33% compared to Q3 2012 and now represent 30% of
Lighting sales
Net Operating Capital (NOC)
• Inventories as a % of sales improved by 0.2 percentage points year-on-year
• Currency comparable, NOC decreased by EUR 156 million to EUR 4.7 billion,
driven by an increase in provisions and lower fixed assets
Operational earnings improve by 390 bps
Management update Q3 2013: Lighting
7 1 Adjusted EBITA in Q3 2013 excludes restructuring and acquisition-related charges of EUR 36 million
Note - Prior-period financials revised for discontinued operations, the adoption of IAS19R and for restatements included in the Annual Report 2012 (please refer to the Annual Report
section 12.10 “Significant Accounting Policies”)
• The number of employees has decreased by 3,876 compared to Q3 2012
mainly due to the rationalization of the industrial footprint Others
EBITA & Adjusted EBITA1
• EBITA amounted to EUR 177 million, or 8.5% of sales, from 1.5% in Q3 2012
• Adjusted EBITA increased to 10.2% of sales compared to 6.3% in Q3 2012,
driven by higher gross margins and cost reductions

8
North America
• Group comparable sales declined by 2% as high-single-digit growth in Consumer
Lifestyle was offset by low-single-digit declines in Healthcare and Lighting
• Healthcare comparable equipment order intake declined by 2%, due to lower
orders in the Ultrasound business, in anticipation of the new EPIQ range.
Excluding Ultrasound, order intake grew by low-single-digit
• Group comparable sales declined by 1%. Healthcare and Consumer Lifestyle
sales were flat, while Lighting had a small decline
• Healthcare comparable equipment order intake declined by 7% mainly due to
large and multi-year deals in the Netherlands and UK in Q3 2012. Excluding
these deals order intake grew by mid-single-digit
Europe
Growth geographies increase by double-digits
Management update Q3 2013: By Geography
1 Growth geographies are all geographies excluding USA, Canada, Western Europe, Australia, New Zealand, South Korea, Japan and Israel
Note - Prior-period financials revised for discontinued operations, the adoption of IAS19R and for restatements included in the Annual Report 2012 (please refer to the Annual Report
section 12.10 “Significant Accounting Policies”)
Growth
Geographies1
• Group comparable sales grew by 10%, driven by double-digit growth in
Consumer Lifestyle and Lighting. Healthcare sales grew by low-single-digit
• China and Middle East & Turkey sales recorded double-digit growth
• Healthcare comparable equipment order intake declined by low-single-digit,
mainly due to Russia & Central Asia, while China and India grew double-digits

1. Management update
2. Group results Q3 2013
3. Accelerate! Change and performance
4. Philips Business System and Path-to-Value
5. Group and sector overview
Agenda
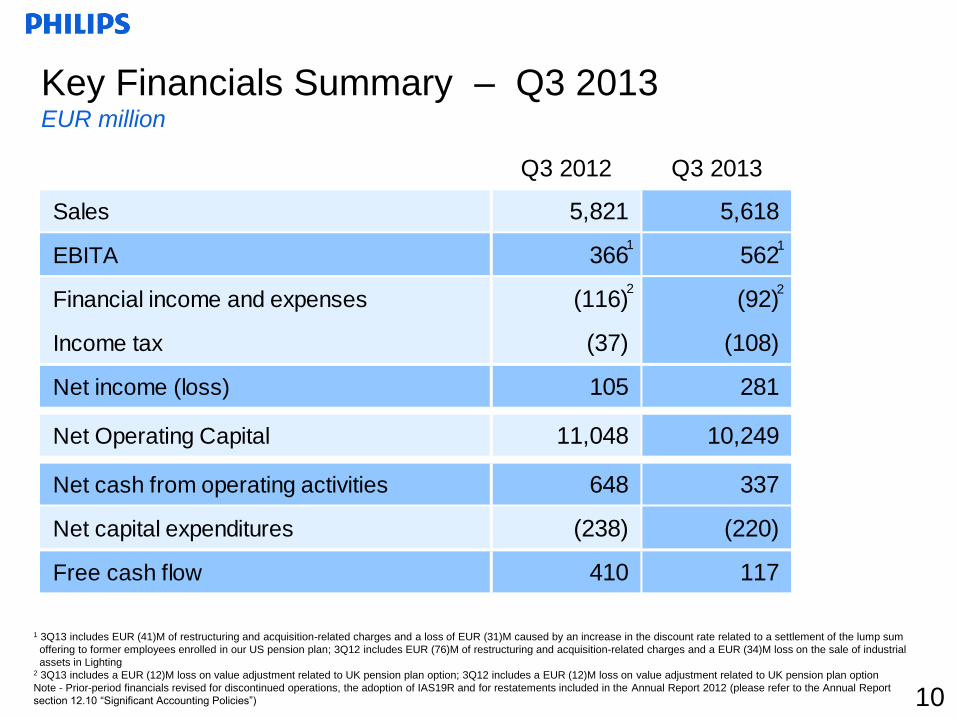
Q3 2012 Q3 2013
Sales 5,821 5,618
EBITA 366 562
Financial income and expenses (116) (92)
Income tax (37) (108)
Net income (loss) 105 281
Net Operating Capital 11,048 10,249
Net cash from operating activities 648 337
Net capital expenditures (238) (220)
Free cash flow 410 117
Key Financials Summary – Q3 2013 EUR million
1 1
2
1 3Q13 includes EUR (41)M of restructuring and acquisition-related charges and a loss of EUR (31)M caused by an increase in the discount rate related to a settlement of the lump sum
offering to former employees enrolled in our US pension plan; 3Q12 includes EUR (76)M of restructuring and acquisition-related charges and a EUR (34)M loss on the sale of industrial
assets in Lighting 2 3Q13 includes a EUR (12)M loss on value adjustment related to UK pension plan option; 3Q12 includes a EUR (12)M loss on value adjustment related to UK pension plan option
Note - Prior-period financials revised for discontinued operations, the adoption of IAS19R and for restatements included in the Annual Report 2012 (please refer to the Annual Report
section 12.10 “Significant Accounting Policies”) 10
2

Sales by sector – Q3 2013 EUR million
Note - Prior-period financials revised for discontinued operations, the adoption of IAS19R and for restatements included in the Annual Report 2012 (please refer to the Annual Report
section 12.10 “Significant Accounting Policies”) 11
Q3 2012 Q3 2013 % nom % comp
Healthcare 2,443 2,258 (8) 0
Consumer Lifestyle 1,051 1,091 4 9
Lighting 2,139 2,084 (3) 3
Innovation, Group & Services 188 185 (2) (7)
Philips Group 5,821 5,618 (3) 3

Q3 2012 Q3 2013 % nom % comp
Western Europe 1,402 1,382 (1) (1)
North America 1,852 1,710 (8) (2)
Other mature geographies 524 434 (17) (1)
Growth geographies1 2,043 2,092 2 10
Philips Group 5,821 5,618 (3) 3
Sales by geography – Q3 2013 EUR million
1 Growth geographies are all geographies excluding USA, Canada, Western Europe, Australia, New Zealand, South Korea, Japan and Israel
Note - Prior-period financials revised for discontinued operations, the adoption of IAS19R and for restatements included in the Annual Report 2012 (please refer to the Annual Report
section 12.10 “Significant Accounting Policies”) 12

8 12 4 6 7 10 8 7 3 9 7 5 9 7 2 5 7 8 5 6 7 10 4 6 4 10 4 5
(1)
10 0 1 0 13 2 3 0
9
3 3
-5
0
5
10
15
2011 2012 2013 2011 2012 2013 2011 2012 2013 2011 2012 2013
Sales growth development Trend Q2 2011 - Q3 2013
19 13 5 10 19 22 9 13 5 14 21 13 27 10 7 11 22 18 7 14 14 17 11 13 19 18 5 12
(2)
19 4 4 10 20 11 12
3
15 12
10
-5
5
15
25
2011 2012 2013 2011 2012 2013 2011 2012 2013 2011 2012 2013
Global comparable sales growth (% change)
Healthcare Consumer Lifestyle Lighting Group
Healthcare Consumer Lifestyle Lighting Group
Comparable sales growth in growth geographies1 (% change)
in %
in %
13 1 Growth geographies are all geographies excluding USA, Canada, Western Europe, Australia, New Zealand, South Korea, Japan and Israel
Note - Prior-period financials revised for discontinued operations, the adoption of IAS19R and for restatements included in the Annual Report 2012 (please refer to the Annual Report
section 12.10 “Significant Accounting Policies”)

Growth geographies – Q3 ‘13 and last twelve months Sales in growth geographies1
25%
45% 48%
Q3 2013
Last twelve months
Healthcare Consumer Lifestyle Lighting Philips Group
Mature
63%
Growth
37%
25%
43% 47% Mature
64%
Growth
36%
14 1 Growth geographies are all geographies excluding USA, Canada, Western Europe, Australia, New Zealand, South Korea, Japan and Israel
Note - Prior-period financials revised for discontinued operations, the adoption of IAS19R and for restatements included in the Annual Report 2012 (please refer to the Annual Report
section 12.10 “Significant Accounting Policies”)

Healthcare1 305 12.5% 329 14.6%
Consumer Lifestyle2 78 7.4% 116 10.6%
Lighting3 32 1.5% 177 8.5%
Innovation, Group & Services4 (49) - (60) -
Philips Group 366 6.3% 562 10.0%
Q3 2012 Q3 2013
EBITA by sector – Q3 2013 EUR million
15
1 3Q13 includes EUR (1)M of restructuring and acquisition-related charges; 3Q12 includes EUR (3)M of charges 2 3Q13 includes EUR (5)M of restructuring and acquisition-related charges; 3Q12 includes EUR (7)M of charges 3 3Q13 includes EUR (36)M of restructuring and acquisition-related charges; 3Q12 includes EUR (68)M of charges and a EUR (34)M loss on the sale of industrial assets 4 3Q13 includes a net release of EUR 1M of restructuring provisions and a loss of EUR (31)M caused by an increase in the discount rate related to a settlement of the lump sum
offering to former employees enrolled in our US pension plan; 3Q12 includes a net release of EUR 2M of restructuring provisions
Note - Prior-period financials revised for discontinued operations, the adoption of IAS19R and for restatements included in the Annual Report 2012 (please refer to the Annual Report
section 12.10 “Significant Accounting Policies”)

Healthcare1 308 12.6% 330 14.6%
Consumer Lifestyle2 85 8.1% 121 11.1%
Lighting3 134 6.3% 213 10.2%
Innovation, Group & Services4 (51) - (30) -
Philips Group 476 8.2% 634 11.3%
Q3 2012 Q3 2013
Adjusted EBITA by sector – Q3 2013 EUR million
16
1 3Q13 excludes EUR (1)M of restructuring and acquisition-related charges; 3Q12 excludes EUR (3)M of charges 2 3Q13 excludes EUR (5)M of restructuring and acquisition-related charges; 3Q12 excludes EUR (7)M of charges 3 3Q13 excludes EUR (36)M of restructuring and acquisition-related charges; 3Q12 excludes EUR (68)M of charges and a EUR (34)M loss on the sale of industrial assets 4 3Q13 excludes a net release of EUR 1M of restructuring provisions and a loss of EUR (31)M caused by an increase in the discount rate related to a settlement of the lump sum
offering to former employees enrolled in our US pension plan; 3Q12 excludes a net release of EUR 2M of restructuring provisions
Note - Prior-period financials revised for discontinued operations, the adoption of IAS19R and for restatements included in the Annual Report 2012 (please refer to the Annual Report
section 12.10 “Significant Accounting Policies”)
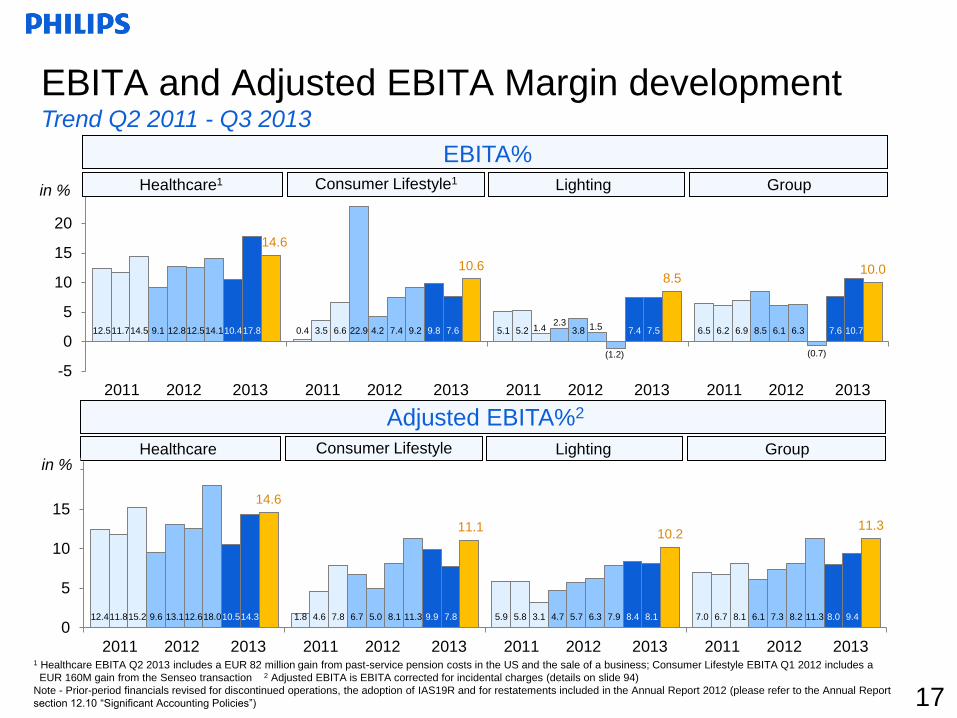
EBITA and Adjusted EBITA Margin development Trend Q2 2011 - Q3 2013
12.4 1.8 5.9 7.0 11.8 4.6 5.8 6.7 15.2 7.8 3.1 8.1 9.6 6.7 4.7 6.1 13.1 5.0 5.7 7.3 12.6 8.1 6.3 8.2 18.0 11.3 7.9 11.3 10.5 9.9 8.4 8.0 14.3 7.8 8.1 9.4
14.6
11.1 10.2
11.3
0
5
10
15
20
2011 2012 2013 2011 2012 2013 2011 2012 2013 2011 2012 2013
12.5 0.4 5.1 6.5 11.7 3.5 5.2 6.2 14.5 6.6 1.4 6.9 9.1 22.9 2.3
8.5 12.8 4.2 3.8 6.1 12.5 7.4 1.5 6.3 14.1 9.2
(1.2) (0.7)
10.4 9.8 7.4 7.6 17.8 7.6 7.5 10.7
14.6
10.6 8.5
10.0
-5
0
5
10
15
20
25
2011 2012 2013 2011 2012 2013 2011 2012 2013 2011 2012 2013
Healthcare Consumer Lifestyle Lighting Group
Adjusted EBITA%2
in %
17
Healthcare1 Consumer Lifestyle1 Lighting Group
EBITA%
in %
1 Healthcare EBITA Q2 2013 includes a EUR 82 million gain from past-service pension costs in the US and the sale of a business; Consumer Lifestyle EBITA Q1 2012 includes a
EUR 160M gain from the Senseo transaction 2 Adjusted EBITA is EBITA corrected for incidental charges (details on slide 94)
Note - Prior-period financials revised for discontinued operations, the adoption of IAS19R and for restatements included in the Annual Report 2012 (please refer to the Annual Report
section 12.10 “Significant Accounting Policies”)

EBITA and Adjusted EBITA Margin development Rolling last 12 months
12.8 7.0 5.0 7.5 13.6 8.2 6.2 8.4 13.9 8.8 7.1 8.8 14.2 9.4 7.7 9.3
14.7
10.1 8.7
10.1
0
5
10
15
20
3Q12 4Q12 1Q13 2Q13 3Q13 3Q12 4Q12 1Q13 2Q13 3Q13 3Q12 4Q12 1Q13 2Q13 3Q13 3Q12 4Q12 1Q13 2Q13 3Q13
12.4 9.9 2.2 6.9 12.3 10.6 1.5
4.7 12.6 7.8 2.7 4.5 13.8 8.5 3.6 5.6
14.3
9.3
5.4 6.5
0
5
10
15
20
3Q12 4Q12 1Q13 2Q13 3Q13 3Q12 4Q12 1Q13 2Q13 3Q13 3Q12 4Q12 1Q13 2Q13 3Q13 3Q12 4Q12 1Q13 2Q13 3Q13
Healthcare Consumer Lifestyle Lighting Group
EBITA%: Rolling LTM to end of quarter shown
1 Adjusted EBITA is EBITA corrected for incidental charges (details on slide 94)
Note - Prior-period financials revised for discontinued operations, the adoption of IAS19R and for restatements included in the Annual Report 2012 (please refer to the Annual Report
section 12.10 “Significant Accounting Policies”)
Healthcare Consumer Lifestyle Lighting Group
Adjusted EBITA%1: Rolling LTM to end of quarter shown
in %
in %
18
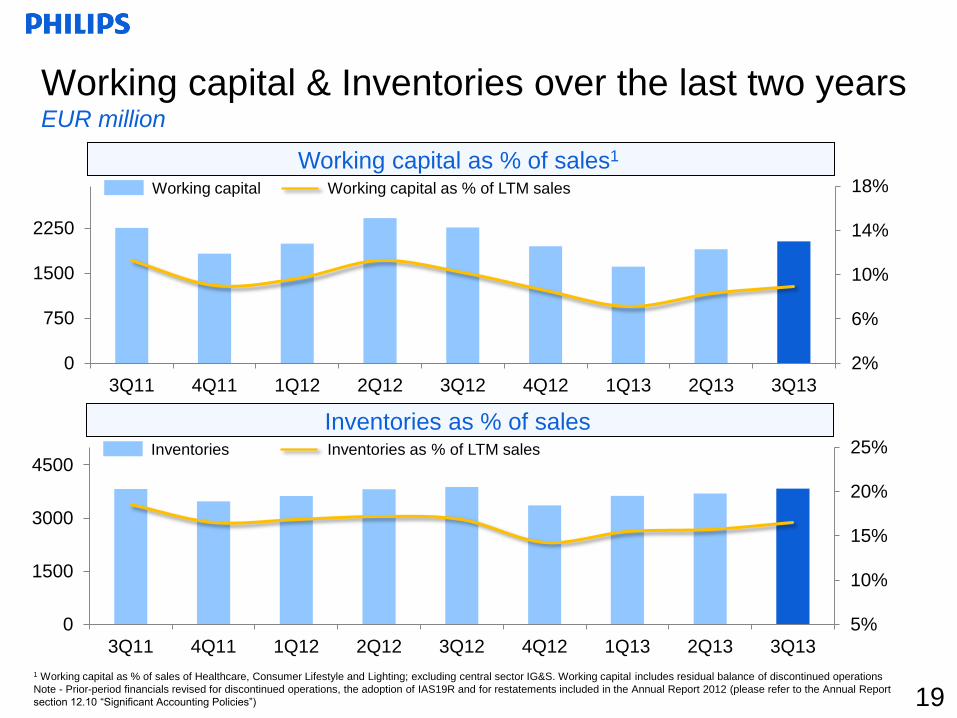
5%
10%
15%
20%
25%
0
1500
3000
4500
3Q11 4Q11 1Q12 2Q12 3Q12 4Q12 1Q13 2Q13 3Q13
Inventories Inventories as % of LTM sales
1 Working capital as % of sales of Healthcare, Consumer Lifestyle and Lighting; excluding central sector IG&S. Working capital includes residual balance of discontinued operations
Note - Prior-period financials revised for discontinued operations, the adoption of IAS19R and for restatements included in the Annual Report 2012 (please refer to the Annual Report
section 12.10 “Significant Accounting Policies”)
Working capital & Inventories over the last two years EUR million
Inventories as % of sales
Working capital Working capital as % of LTM sales
Working capital as % of sales1
2%
6%
10%
14%
18%
0
750
1500
2250
3Q11 4Q11 1Q12 2Q12 3Q12 4Q12 1Q13 2Q13 3Q13
19

Q3 2012 Q3 2013
Net income from continuing operations 95 270
Fixed assets depreciation, amortization, and impairments 346 330
Net gain (loss) on sale of assets 33 (9)
Changes in working capital, of which: 139 (357)
- changes in receivables and other current assets (206) (428)
- changes in inventories (157) (265)
- changes in accounts payable, accrued and other liabilities 502 336
Changes in non-current receivables, other assets and other liabilities (62) 60
Increase (decrease) in provisions 51 (76)
Others 46 119
Net cash flow from operating activities 648 337
Purchase of intangible assets/ Expenditures on development assets (97) (97)
Capital expenditures on property, plant and equipment (144) (137)
Proceeds from disposals of property, plant and equipment 3 14
Net capital expenditures (238) (220)
Free Cash Flow 410 117
Free Cash Flow – Q3 2013 EUR million
Note - Prior-period financials revised for discontinued operations, the adoption of IAS19R and for restatements included in the Annual Report 2012 (please refer to the Annual Report
section 12.10 “Significant Accounting Policies”) 20

Development of Return on Invested Capital (ROIC)
Notes:
EBIAT are earnings before interest after tax
Philips calculates ROIC % as: EBIAT/ NOC
Quarterly ROIC % is based on LTM EBIAT and average NOC over the last 5 quarters
Reported tax used to calculate EBIAT
• Excluding the European Commission
fine on CRT1, ROIC improved to
10.7% in Q3 2013, from 9.2% in Q2
2013 and from 7.2% in Q3 2012
mainly due to:
- Improved earnings in all sectors
- Lower fixed assets and lower
average Net Operating Capital
• ROIC in Q1 2012 was impacted by
impairment charges of 2011.
Excluding these charges, ROIC was
6.6%
• Discount rate is 9.0%
21 1 CRT=Cathode-Ray Tubes, a business divested by Philips in 2001. Philips has appealed the decision. Charges were taken in Q4 2012.
Note - Prior-period financials revised for discontinued operations, the adoption of IAS19R and for restatements included in the Annual Report 2012 (please refer to the Annual Report
section 12.10 “Significant Accounting Policies”)
ROIC Discount rate
ROIC excl. the European Commission fine on CRT1

Philips' debt has a long maturity profile
Debt maturity profile as of September 2013 Amounts in EUR millions
Characteristics of long-term debt
• Maturities up to 2042
• Average tenor of long-term
debt is 12.5 years
• No financial covenants
In January 2013 Philips extended
the maturity of its EUR 1.8 billion
standby facility to February 2018
22 1 Short term debt consists mainly of local credit facilities that are being rolled forward on a continuous basis 2 In March 2012 Philips issued USD 1,000M 10 years at 3.75% and USD 500M 30 years at 5%. On Apr 10th 2012, Philips early redeemed USD 500M originally maturing in March 2013
Long-term debt maturity < 12 months
Long –term debt 2
Short-term debt 1
Unutilized standby & other committed facilities
0
500
1,000
1,500
2,000
2,500
3,000
2013 2014 2017 2018 2019 2020 2021 2022 2025 2026 2038 2042

0.14 0.18 0.18
0.23 0.25
0.30
0.36 0.36 0.36 0.36 0.40
0.44
0.60
0.70 0.70 0.70
0.75 0.75 0.75
1995 1996 1997 1998 1999 2000 2001 2002 2003 2004 2005 2006 2007 2008 2009 2010 2011 2012 2013
A history of sustainable dividend growth EUR cents per share
“We are committed to a stable dividend policy with a 40%
to 50% pay-out of continuing net income.”
23
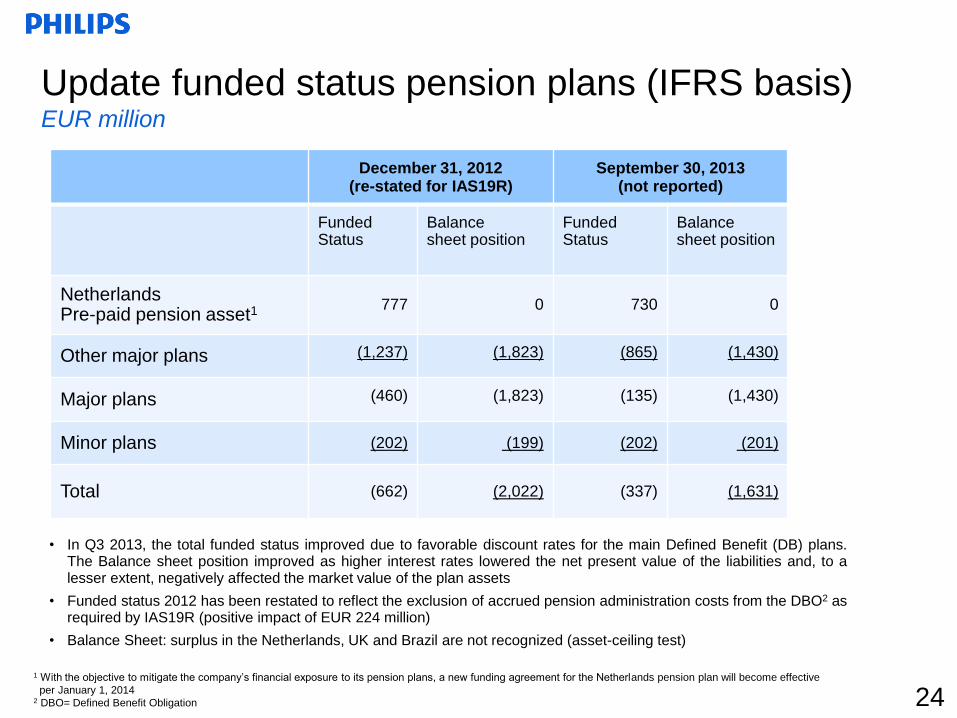
• In Q3 2013, the total funded status improved due to favorable discount rates for the main Defined Benefit (DB) plans. The Balance sheet position improved as higher interest rates lowered the net present value of the liabilities and, to a lesser extent, negatively affected the market value of the plan assets
• Funded status 2012 has been restated to reflect the exclusion of accrued pension administration costs from the DBO2 as required by IAS19R (positive impact of EUR 224 million)
• Balance Sheet: surplus in the Netherlands, UK and Brazil are not recognized (asset-ceiling test)
Update funded status pension plans (IFRS basis) EUR million
1 With the objective to mitigate the company’s financial exposure to its pension plans, a new funding agreement for the Netherlands pension plan will become effective
per January 1, 2014 2 DBO= Defined Benefit Obligation 24
December 31, 2012 (re-stated for IAS19R)
September 30, 2013 (not reported)
Funded Status
Balance sheet position
Funded Status
Balance sheet position
Netherlands Pre-paid pension asset1 777 0 730 0
Other major plans (1,237) (1,823) (865) (1,430)
Major plans (460) (1,823) (135) (1,430)
Minor plans (202) (199) (202) (201)
Total (662) (2,022) (337) (1,631)

Disciplined Capital Use
• Invest in high ROIC organic growth opportunities and selected value creating bolt-on
acquisitions
• Maintain our A3/A- rating
• We are committed to a stable dividend policy with a 40% to 50% pay-out of continuing net
income
• We will drive higher capital efficiency and cash flow yields through improved working
capital turns and CAPEX discipline
• We will exercise stringent discipline and return criteria (including ROIC hurdles) in our
end-to-end acquisition process in line with the nature of the transaction
• Additionally, capital will be used to mitigate risk and return capital to shareholders over
time
25

Jan-2011 Preethi Domestic Appliances Becoming a leading kitchen appliances company in India
Jul-2011 Povos Domestic Appliances Expanding product portfolio in China and continue to
build business creation capabilities in growth geographies
Jan-2011 Optimum Professional Luminaires Expand portfolio with customized energy-efficient lighting
solutions
Jun-2011 Indal Professional Luminaires Strengthen leading position in professional lighting
within Europe
Jan-2011 medSage Home Healthcare Strengthen portfolio by becoming a leading provider
of patient interaction and management applications
Mar-2011 Dameca Patient Care and Clinical Informatics Expand portfolio with integrated, advanced anesthesia
care solutions
Jun-2011 AllParts Medical Customer Services Expand capabilities in imaging equipment services,
strengthening Philips’ Multi-Vendor Services business
Jun-2011 Sectra Imaging Systems Expand Women’s Healthcare portfolio with a unique
digital mammography solution in terms of radiation dose
Acquisitions at a glance
Note - Dates refer to announcement date of acquisition
Healthcare
Consumer Lifestyle
Lighting
26
1. Management update
2. Group results Q3 2013
3. Accelerate! Change and performance
4. Philips Business System and Path-to-Value
5. Group and sector overview
Agenda

• Increased seniority of market teams; markets are now led by empowered entrepreneurs
• Increase local relevance of product portfolio to gain market share
• Focused Business-to-Government sales channel development to drive growth
• Increase Employee Engagement in markets by 300 bps
Customer Centricity
• Granular plans to increase number of BMC1’s in which we are an outright leader
• Increase performance adherence to plan per BMC1 > 80%
• Execute on strategic workforce plan for growth markets
• Targeted investment step-ups to gain market leadership
Resource to Win
End2End Execution2
• Introduced new behaviors to drive new ways of working
• Personal transformation workshops started to enable culture change
• Quarterly pulse check to check for effectiveness of the above
• Incentive and appraisal system changed to align with new culture and mid-term targets
Growth and Performance
Culture
• Simplify the organization and reduce overhead and support costs by EUR 1.5 billion
• Implement the Philips Business System in the organization
• Performance Management for BMC1’s implemented
• Implement collaborative P&L between businesses & markets with clear accountability
Operating Model2
Accelerate! change and performance program to
unlock full potential faster
Supported by strong change and program management office to ensure execution
Dark blue indicates quarter over quarter improvement
28 1 Business Market Combination 2 Redefined for the 2016 targets
• Productivity gains of 100 bps margin impact to be achieved by 2016
− Transform customer value chains to 4 Lean business models, enabled by effective IT
− Reduce Cost of Non Quality by 30%, Accelerate innovation time to market by av. 40%
• EUR 1 billion via Design for Excellence (DfX) over the period 2014-2016 • Inventory reduction target of 1% to 1.5% of sales per year for 2012 & 2013; Increase
customer service >95%

Accelerate! is changing the way we do business
Reducing lead time: UK
To address Amazon’s need to react to
shopper demand more quickly, cross
functional teams from Philips UK and
Amazon supply chain analyzed the
End2End order fulfillment process. This
customer centric approach reduced
vendor lead times to Amazon by ~35%.
Replicating this success, we are
collaboratively working with Argos,
another top customer, to drastically
reduce their vendor lead time.
Lean order processing: Japan
By mapping and harmonizing its
Market to Order processes through
Lean methodology, Philips Healthcare
Japan has improved service levels to
customers. The time for processing
orders improved by 50%, resulting in
faster response time, with 95% of
orders being processed within 8 hours.
End2End transformation: LED China
Through our End2End transformation
program, we identified and drove
improvements along the entire LED
value chain in China. This resulted in a
broad range of competitively priced
façade lighting solutions for the mid-tier
market segment in China, with more
than 40% reduction in time to market
for new product introductions and a
significant increase in on-time delivery.
29 29
Customer centric innovation: EPIQ Ultrasound
Cooperating closely with radiologists, echo-
cardiographers, and gynecologists Philips
developed EPIQ, a new era in advanced
Ultrasound. EPIQ eases traditional
compromises in Ultrasound imaging while
improving clinical confidence. It combines
high image quality with a new user
interface, facilitating better workflow and
patient throughput. EPIQ pioneers
‘Anatomical Intelligence’ leading to faster
and better reproducible Ultrasound exams.

Cost reduction program targeting overhead & indirect
costs will bring EUR 1.5 billion in savings by 2015
Cost reduction scope
45
3
7
-93
• Taking out overhead and support cost
– All overheads, layers and support
functions: IT, Finance, HR, Real
Estate, Management, etc
– Indirect business functions not
directly involved in the customer
value chain
– Single added value layer (no
duplication) and reduce complexity
• Increased savings based on 2013
baseline
• Focus on sustainable structural
savings instead of “variable” costs
Business functions indirect
costs and overheads
(Purchasing, Supply Chain, R&D,
Service, Marketing etc)
Sales, Marketing
Manufacturing & Supply Chain
R&D / Innovation, services
Company wide Overhead
and Support functions
(IT, Finance, HR, Real Estate,
management layers, etc)
~35%
~65%
Core customer value chain
Global business
leadership
Success in
local markets
30
Clear design principles
30

865
3,385
895
495 350
9,100
EUR 1.5 billion cost reduction program Program started in Q3 2011, expected to be completed by 2015
Approximately 66% of the targeted
headcount reduction completed by Q3
2013
Plan Actuals
5,990
31
Q3 2013
Q2 2013
Q1 2013
2012
2011
1 “Cumulative gross savings” has been changed to “Gross savings” as of Q2 2013 and historical figures have been restated where necessary
Note - The above figures include results related to the Audio, Video, Multimedia and Accessories business of :
Total savings of EUR 46M, annual restructuring costs in 2012 of EUR 11M and EUR 3M in 2013, investments of EUR 1M in 2013 and a headcount reduction of 99 employees
The plan for 2014 includes gross savings for the Audio, Video, Multimedia and Accessories business of EUR 57M and a headcount reduction of 99 employees
Annual restructuring costs and investments
EUR million 2011 2012 1Q13 2Q13 3Q13 2013 2014 2015
Actual Actual Actual Actual Actual Plan Plan Plan
Restructuring (37) (249) (13) (7) (26) (65) (100) (100)
Investments (37) (128) (29) (39) (31) (140) (160) (185)
TOTAL (74) (377) (42) (46) (57) (205) (260) (285)
Gross savings1
EUR million 2011 2012 YTD 2013 Total Total Total Total
Actual Actual Actual Actual 2013 2014 2015
(A) (B) (C) (A+B+C) Plan Plan Plan
TOTAL 25 446 385 856 1000 1,250 1500

Overhauling our business model architecture
32
• All Philips businesses to adopt one of
four standardized business models
• Investments being made to
standardize processes, data, and
new IT backbone
• A single planning, performance and
reward cycle across Philips
• Investing to create a culture for such
a major change
▪ Standard Products
▪ Owner: Pieter Nota
▪ Solutions
▪ Owner: Eric Rondolat
▪ Services
▪ Owner: Deborah DiSanzo
▪ Software
▪ Owner: Deborah DiSanzo
From 70+
business models
To 4 End2End
business models

Applying DfX* in the product creation process
DfX effectiveness pilot for a new product
• End2End approach to product creation, with one
integrated team of procurement, supply chain,
R&D, marketing, finance and the supplier upfront
to drive breakthrough cost savings through:
• Value engineering
• Re-design the purchasing value chain
• Leveraging global spend
• Early successes show that significant cost
savings can be achieved in mature products, i.e.
products being manufactured over 5 years, as
well as new product introductions
• Currently building a funnel of opportunities
targeting additional cumulative savings of EUR 1
billion over the period 2014 to 2016
*Design for X; X = cost, quality, manufacturing etc.
Existing plan DfX plan
Baseline
Q3 2012
DfX
Baseline
Q4 2012
DfX effectiveness pilot for a mature product
DfX
33

1. Management update
2. Group results Q3 2013
3. Accelerate! Change and performance
4. Philips Business System and Path-to-Value
5. Group and sector overview
Agenda

We are implementing the Philips Business System Our repeatable system to unlock and deliver value
The Philips Business System enables us to:
• Manage our portfolio with granular value
creation plans for every business
• Leverage our differentiating Capabilities,
Assets and Positions to drive global scale
and local relevance
• Be a learning organization that delivers with
speed and excellence to our customers
• Live a growth and performance culture
• Deliver increasing value in a repeatable
manner
35

Mega trends create great opportunities for profitable
growth
1 Growth geographies are all geographies excluding USA, Canada, Western Europe, Australia, New Zealand, South Korea, Japan and Israel
Sources: World health organization, Agriculture and Agri-food Canada, OECD observer, and Philips Lighting global market study
Mega Trends
• Around 65% of deaths globally are due to
chronic and non-communicable diseases
• World’s population of people 60 years+ doubled
since 1980; forecast to reach 2 billion by 2050
• Growing and aging population with
more chronic diseases
• Growing demand for integral
value-based healthcare solutions
• Urbanization leading to 3 billion more people in
cities by 2050
• LED to be 45-50% of the market by 2016, as
inefficient technologies are being phased out
• The world needs more light and
energy efficient lighting
• Digitalization driving demand for
integrated lighting solutions
• Growth geographies1 with growing
middle class
• Rising health & well-being
consciousness
• The global middle class is expected to increase
from 1.8 billion in 2009 to 4.9 billion by 2030
• Aging population, high obesity rates, and a
raised awareness of un-healthy foods
Sizeable Opportunities
36

Our business domains play right into these
megatrends
• Growing and aging population with
more chronic diseases
• Growing demand for integral
value-based healthcare solutions
• Growth geographies1 with growing
middle class
• Rising health & well-being
consciousness
• The world needs more light and
energy efficient lighting
• Digitalization driving demand for
integrated lighting solutions
Our Business Domains
Personal health & well-being
appliances and services
Light sources
Lighting applications, systems
and services
Patient care for hospital and
home
Clinical Informatics & consulting
services
Hea
lth
ca
re
Lig
hti
ng
Imaging systems for diagnostics
and therapy
Mega Trends
Co
ns
um
er
Lif
es
tyle
37 1 Growth geographies are all geographies excluding USA, Canada, Western Europe, Australia, New Zealand, South Korea, Japan and Israel

Imaging Systems for
diagnostics and therapy
Each of our ~40 businesses has a granular value
creation roadmap towards 2016 targets and beyond Our Businesses Our value creation levers
• Radiology modalities & applications
• Ultrasound Imaging
• Image guided interventional therapy
• Male Grooming, Beauty
• Oral Healthcare, Mother & Childcare
• Kitchen Appliances, Garment Care, Coffee
• Conventional lamps and drivers
• LED lamps, drivers and modules
• Lumileds, Automotive, OLED
• Professional Lighting Systems and
Controls
• Consumer Luminaires
• Acute and therapeutic care products
• Sleep & respiratory care
• Hospital and home patient monitoring
• Clinical informatics applications
• Healthcare consulting services
Our Business domains
Personal health &
well-being appliances and
services
Light sources
Lighting applications,
systems and services
Patient care for hospital and
home
Clinical Informatics &
consulting services
• Lean out & address
under-performance issues
• Speed up innovation
• End2End business model
redesign
• Exploit Philips’ global footprint
for geographical adjacencies
(spottiness)
• Strong focus on growth
geographies1
• Fill out logical product
adjacencies
• Emerging businesses fitting our
CAPs
Hea
lth
ca
re
Lig
hti
ng
O
the
r
IP licensing
Emerging businesses
• IP and Brand licensing
• Various
2
1 Growth geographies are all geographies excluding USA, Canada, Western Europe, Australia, New Zealand, South Korea, Japan and Israel 2 Capabilities, Assets and Positions
Co
ns
um
er
Lif
es
tyle
38

We made significant portfolio changes Resulting in a better growth platform with higher profit potential
39
Healthcare Lighting Consumer Lifestyle Group Acquisition Divestment
Television
Audio, Video, Multimedia and Accessories
Speech processing
Discus
Povos (China)
Preethi (India)
1st Jan 2011
Raytel
Profile Pharma
Lighting manufacturing sites
Indal
Sept '13 last twelve
months
34% 43%
30%
37%
36%
20%
34%
Group Sales Mix
Assembléon

We have strong leadership1 positions in many
markets across the globe
40
Global
Cardiovascular
X-ray
Global
Ultrasound
Global
Patient
Monitoring
Global
Image-Guided
interventions
Global
Lamps
Global
Male Electric
Shaving
Healthcare
Lighting
Consumer
Lifestyle
Global
Sleep Therapy
Systems
Global
Garment Care
Global
Rechargeable
Toothbrushes
Regional
Kitchen
Appliances
Regional
Electric Hair
Care
Global
LED Lamps
Global
Automotive
Lighting
Global
Professional
Luminaires
Global
High Power LEDs
Global
Cardiovascular
X-ray
1 Global or Regional #1 or #2 position in the market

Our differentiating Capabilities, Assets and Positions
Philips Group Portfolio
Deep Market Insights
Technology
Innovation
Global Footprint
The Philips Brand
Our People
Supported by a strong balance sheet
• Technology,
know-how and
strong IP positions
(59,000 registered
patents)
• World’s 40th most
valuable brand
2013 compared to
the 65th in 2004
• Brand value
reached a record
level to close to
USD 10 billion
• Loyal customer
base in 100+
countries
• 36% of group
revenues from
growth
geographies2
• Employee
Engagement Index3
exceeds high
performance
benchmark value
of 70%
• Culturally diverse
top-200 leadership
team
• Global market
leader in Lighting
• Top 3 Healthcare
player
• Leadership
positions1 in over
half of Group
revenues
1 Global #1 position in the market 2 Growth geographies are all geographies excluding USA, Canada, Western Europe, Australia, New Zealand, South Korea, Japan and Israel 3 Based on annual Philips’ Employee Engagement Survey 41
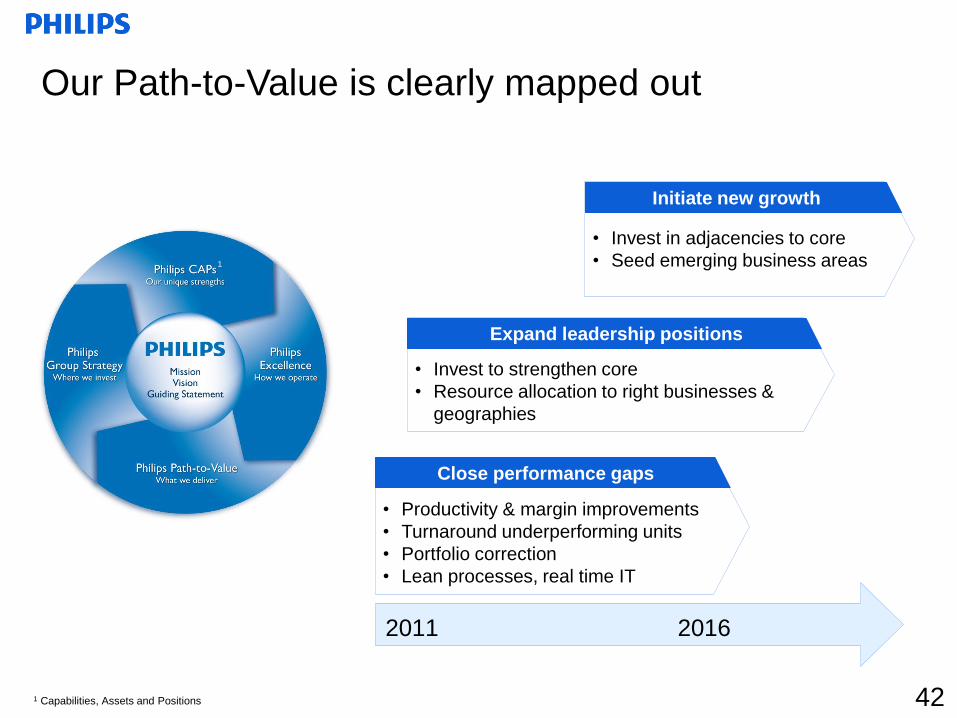
Our Path-to-Value is clearly mapped out
Close performance gaps
• Productivity & margin improvements
• Turnaround underperforming units
• Portfolio correction
• Lean processes, real time IT
Expand leadership positions
• Invest to strengthen core
• Resource allocation to right businesses &
geographies
2011 2016
Initiate new growth
• Invest in adjacencies to core
• Seed emerging business areas
1 Capabilities, Assets and Positions
1
42

Financial targets 2013
Sales growth CAGR1 4 - 6%
Group Reported2 EBITA 10 - 12%
- Healthcare businesses 15 - 17%
- Consumer Lifestyle businesses3 8 - 10%
- Lighting businesses 8 - 10%
Group ROIC 12 - 14%
Our Path-to-Value
43
ROIC (%)
4
6
8
2
8 12 14 18
Co
mp
ara
ble
sa
les g
row
th (
%)
Performance
Box 2013
Philips Mid-Term Performance Box
2011
2016
2020
1 Assuming real GDP growth of 3-4% 2 Including restructuring and acquisition-related charges 3 Excluding unrelated licenses 4 Excluding M&A impact
Financial targets 2016
Sales growth CAGR1 4 - 6%
Group Reported2 EBITA 11 - 12%
- Healthcare businesses 16 - 17%
- Consumer Lifestyle businesses 11 - 13%
- Lighting businesses 9 - 11%
Group ROIC4 >14%
2013
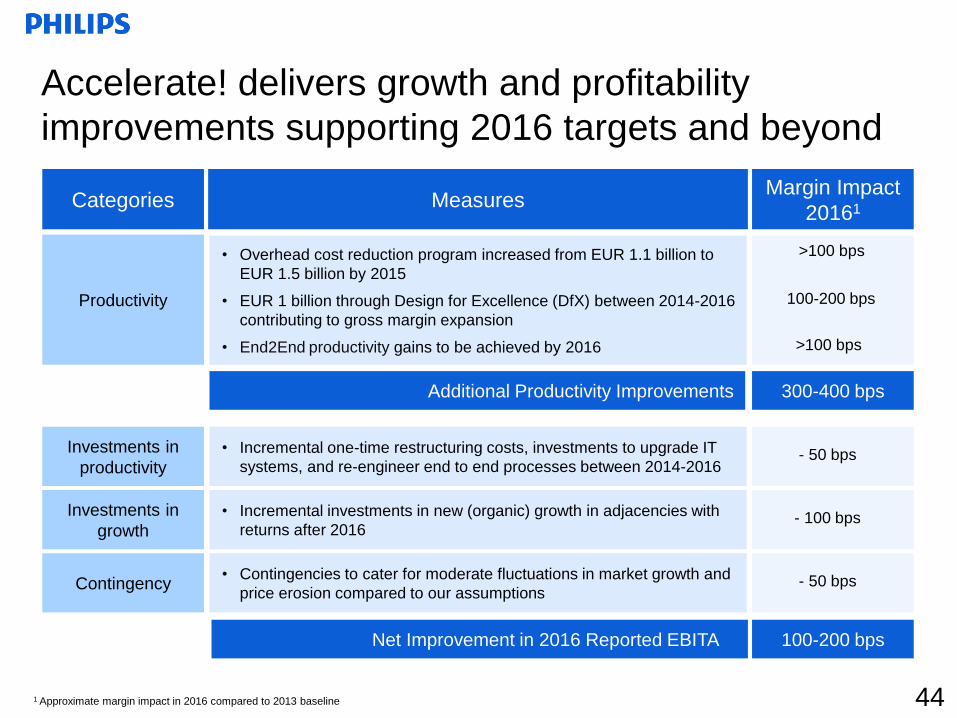
Accelerate! delivers growth and profitability
improvements supporting 2016 targets and beyond
Net Improvement in 2016 Reported EBITA 100-200 bps
1 Approximate margin impact in 2016 compared to 2013 baseline
Categories Measures Margin Impact
20161
Productivity
• Overhead cost reduction program increased from EUR 1.1 billion to
EUR 1.5 billion by 2015
• EUR 1 billion through Design for Excellence (DfX) between 2014-2016
contributing to gross margin expansion
• End2End productivity gains to be achieved by 2016
>100 bps
100-200 bps
>100 bps
Additional Productivity Improvements 300-400 bps
Investments in
productivity
• Incremental one-time restructuring costs, investments to upgrade IT
systems, and re-engineer end to end processes between 2014-2016
Investments in
growth
• Incremental investments in new (organic) growth in adjacencies with
returns after 2016
- 100 bps
- 50 bps
Contingency • Contingencies to cater for moderate fluctuations in market growth and
price erosion compared to our assumptions
- 50 bps
44

The Accelerate! journey will continue…
2013
Valu
e
ROIC
2011
Gro
wth
ROIC
Laying the foundation
to improve
performance
Transform Philips
through Accelerate!
Gro
wth
2012
Accelerating
performance
improvement G
row
th
ROIC
Focus 2014 – 2016
Continued implementation of the PBS2
• Complete Culture change
• Deliver on business & market strategies
• Improve performance to drive higher growth and
improved returns
• Initiate new growth (organic/ bolt-on M&A)
• Increased overhead cost reduction program to
EUR 1.5 billion
• Realize End2End productivity gains and apply
Lean to all end to end processes supported by
new IT systems
• Deliver EUR 1 billion savings in CoGS3 through
DfX4
• New share buy-back program of EUR 1.5 billion
1 Business Market Combination 2 Philips Business System 3 Cost of Goods Sold 4 Design for X; X = cost, quality, manufacturing, etc.
2011 – 2013
Accelerating performance improvement
• Executive Committee and leadership
strengthened
• Investments in growth stepped-up
• BMC1 performance management implemented
• EUR 1.1 billion cost reduction program on track
• Operating margins & Inventory management
improved
• Television and Audio, Video, Multimedia &
Accessories addressed
• EUR 2 billion Share buy-back completed
• Culture change gaining strong traction
• Philips Business System being implemented
45

1. Management update
2. Group results Q3 2013
3. Accelerate! Change and performance
4. Philips Business System and Path-to-Value
5. Group and sector overview
Agenda

We are a global diversified technology company
We manage a dynamic portfolio of ~40 businesses serving attractive markets of
Healthcare, Personal health & well-being and Lighting
More than 1/3 of the revenue
from growth geographies1
€23.5 billion sales in 2012
enabled by the 114,000+
people employed
€1.8 billion annual
investments in innovation
and ~59,000 patents
Market reach in over 100
countries across the world
More than 1/4 of revenues
from recurring revenue
streams
Over 50% of the portfolio
has global leadership
positions
47 1 Growth geographies are all geographies excluding USA, Canada, Western Europe, Australia, New Zealand, South Korea, Japan and Israel

Mission
Vision
• To make the world healthier and more sustainable through innovation
• To improve the lives of 3 billion people a year by 2025
• To offer the best place to work for people who share our passion
• To deliver superior value for our customers and shareholders
• Improving people’s lives through meaningful innovation
We have created a clear direction for the company
Guiding
Statement
• Manage a dynamic portfolio of technology businesses which we build to
global leadership performance
• We create value through our ability to innovate with local relevance and
global scale, leveraging our capabilities and deep customer insights
• The Philips Business System enables us to deliver superior results as an
agile, Lean, and learning organization
Brand
Promise • We deliver innovation that matters to you
48

Philips: A strong diversified industrial group leading
in health and well-being
Philips
Businesses1, 2 Geographies1
Healthcare Consumer
Lifestyle
Lighting North
America
Other Mature
Geographies
31% 8% 36%
Growth
Geographies3
43%
€23.5 Billion
Sales in 2012.
Portfolio consists of
~70% B2B
businesses
114,000+ People employed
worldwide in over 100
countries
20% 37%
Since 1891 Headquarters in
Amsterdam, the
Netherlands
8% of sales invested
in R&D in 2012
59,000 patent rights,
35,000 trademark rights,
81,000 design rights
Western
Europe
25%
$9.8 Billion
Brand value in 2013
1 Based on last twelve months sales September 2013 2 Excluding Central sector (IG&S) 3 Growth geographies are all geographies excluding USA, Canada, Western Europe, Australia, New Zealand, South Korea, Japan and Israel
Note - Prior-period financials revised for discontinued operations, the adoption of IAS19R and for restatements included in the Annual Report 2012 (please refer to the Annual Report
section 12.10 “Significant Accounting Policies”) 49

Executive Committee
Frans van Houten
CEO
Deborah DiSanzo
CEO Healthcare
Ron H. Wirahadiraksa
CFO
Ronald de Jong
Chief Market Leader
Patrick Kung
CEO Greater China
Jim Andrew
Chief Strategy & Innovation
Officer
Eric Rondolat
CEO Lighting
Carole Wainaina
Chief HR Officer
Eric Coutinho
Chief Legal Officer
Pieter Nota
CEO Consumer Lifestyle
50

Sustainability as a driver for growth
Success of EcoVision Green Products represented around 47%1 of sales in
2012, up from 40%1 in 2011 driven by investments in
Green Innovation.
EcoVision targets for 2015
• 50% of sales from Green Products
• EUR 2 billion Green Innovation investments
• To improve the lives of 2 billion people
• To improve the energy efficiency of our overall
portfolio by 50%
• To double the amount of recycled materials in our
products as well as to double the collection and
recycling of Philips products
Recent accomplishments
• Philips was recognized as a leader in the
Carbon Disclosure Project for the third
consecutive year on both performance and
disclosure
• Philips signed a partnership agreement with
the Ellen MacArthur Foundation to leverage
the benefits of the Circular Economy
• Philips has been recognized in Interbrand’s
annual ranking of the top 50 Best Global
Green Brands, moving up eight places to the
23rd position
• Philips has been recognized Energy Star
partner of the year by the US Environmental
Protection Agency for our outstanding
contribution to environmental protection
through energy efficiency
• Philips has been ranked number 7 on the
annual list of ‘Global 100 Most Sustainable
Corporations in the World’ issued by
Corporate Knights – up 6 places from last
year
51 1 Excluding the Audio, Video, Multimedia and Accessories business

Our focused health and well-being portfolio:
Healthcare, Consumer Lifestyle and Lighting Last twelve months
Net Operating Capital Sales
100% = EUR 22.6B1 100% = EUR 13.4B1 100% = EUR 2.6B1, 2
Adjusted EBITA
Healthcare
Consumer
Lifestyle
Lighting
Healthcare Consumer
Lifestyle
Lighting
18%
28%
54% 43%
37%
20%
56%
9%
35%
Consumer
Lifestyle
Lighting Healthcare
1 Excluding Central sector (IG&S) 2 EBITA adjustments based on the following gains/ charges: for Healthcare EUR (35)M, Consumer Lifestyle EUR (38)M and Lighting EUR (275)M
Note - Prior-period financials revised for discontinued operations, the adoption of IAS19R and for restatements included in the Annual Report 2012 (please refer to the Annual Report
section 12.10 “Significant Accounting Policies”) 52

Philips Healthcare Guiding Statement
53
We are dedicated to creating the future of health care and saving lives.
We develop innovative solutions across the continuum of care in partnership
with clinicians and our customers to improve patient outcomes, provide better
value and expand access to care.

Healthcare What we do. Where we are.
Philips Healthcare
Businesses1
Imaging
Systems
Home
Healthcare
Solutions
Patient Care
& Clinical
Informatics
Customer
Services
37%
€10.0 Billion sales
in 2012
37,000+ People employed
worldwide in 100 countries
15% 22% 26%
450+ Products & services
offered in over 100 countries
8% of sales invested in R&D
in 2012
54
Geographies1
North
America
Other Mature
Geographies
43% 12% 25%
Growth
Geographies2
Western
Europe
20%
1 Based on last twelve months sales September 2013 2 Growth geographies are all geographies excluding USA, Canada, Western Europe, Australia, New Zealand, South Korea, Japan and Israel
Note - Prior-period financials revised for discontinued operations, the adoption of IAS19R and for restatements included in the Annual Report 2012 (please refer to the Annual Report
section 12.10 “Significant Accounting Policies”)
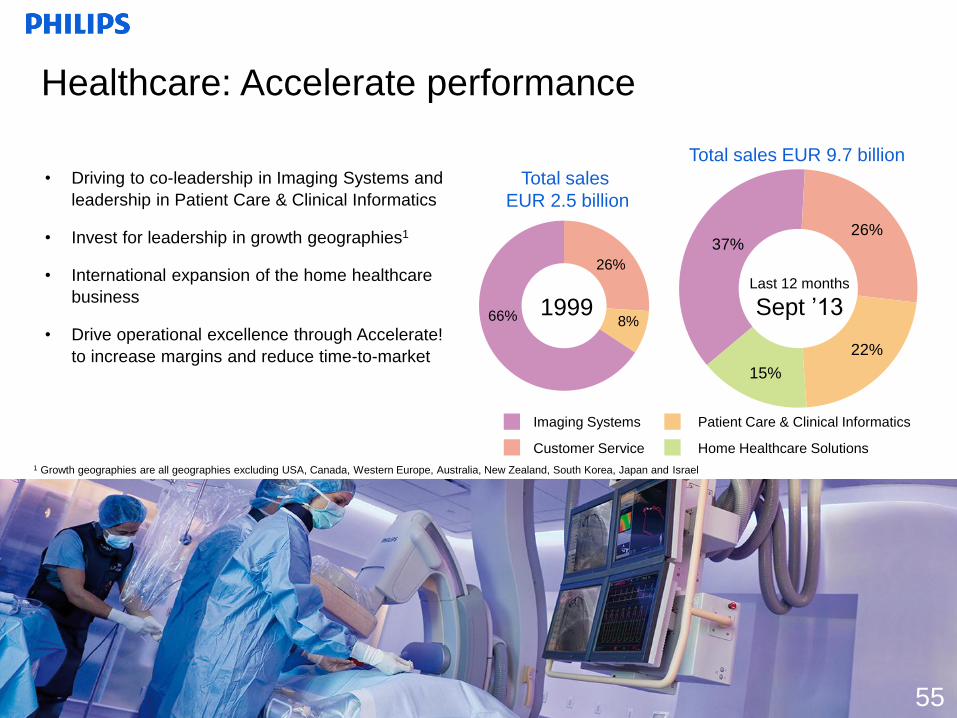
15%
22%
26% 37%
1999 66%
26%
8%
Imaging Systems
Customer Service
Total sales
EUR 2.5 billion
Total sales EUR 9.7 billion
Healthcare: Accelerate performance
Patient Care & Clinical Informatics
Home Healthcare Solutions
• Driving to co-leadership in Imaging Systems and
leadership in Patient Care & Clinical Informatics
• Invest for leadership in growth geographies1
• International expansion of the home healthcare
business
• Drive operational excellence through Accelerate!
to increase margins and reduce time-to-market
Last 12 months
Sept ’13
55
1 Growth geographies are all geographies excluding USA, Canada, Western Europe, Australia, New Zealand, South Korea, Japan and Israel

36 million
21 million
Health care industry dynamics will drive demand
56
Sharp rise in incidence of chronic disease
and non-communicable lifestyle diseases
Globally, 36 million of the 57 million
deaths are due to chronic and non-
communicable disease
Approximately 80% of non-communicable
disease deaths—29 million—occur in
growth geographies1
An aging population
World’s population of people 60 years+
has doubled since 1980 and is forecast to
reach 2 billion by 2050
Access to care and clinician shortage
Recognized as one of the main obstacles
to delivery of effective health services
1 Growth geographies are all geographies excluding USA, Canada, Western Europe, Australia, New Zealand, South Korea, Japan and Israel
Source: World Health Organization data and statistics http://www.who.int/gho/ncd/mortality_morbidity/en/index.html, http://www.who.int/features/factfiles/ageing/en/index.html, and
http://www.who.int/workforcealliance/media/qa/01/en/
World population age 60+ (Millions)
Causes of death globally (2008)
Deaths from
all other
causes
Deaths from chronic
and non-communicable
diseases
80% occur in
growth geographies
0
500
1000
1500
2000
1980 2010 2050 (Est.)

0
1,000
2,000
3,000
4,000
5,000
6,000
7,000
8,000
9,000
10,000
1999 2000 2001 2002 2003 2004 2005 2006 2007 2008 2009 2010 2011 2012Economic Downturn
USD
millions
4% -3% 9% 22% 3% 13% 10% 7% -7% -3% -11% 5% 2% 0%
Economic Downturn
Out of Hospital Imaging Growth DRA
Market Growth
BBA Increases Outpatient Technical Charges
Stark II Rules
Limit Physician Ownership
in Outpatient Imaging
DRA announced Utilization,
physician fee schedule
Outpatient Imaging
Paid 2.5% higher
Bond crisis
CMS P4P Reduces
Reimbursement for
80% of Hospitals
Balanced
Budget Act 2
Imaging Systems
incl. Ultrasound
Patient Care and Clinical Informatics
Signing Healthcare
Reform
Health care historical market development North America Market Size/ Growth and Impacts
Philips current
expectation for
the US Imaging
Systems
market for
2013-2015 is
low-single-digit
growth
57 Fiscal cliff,
Budget ceiling
ACA Supreme Court;
Elections
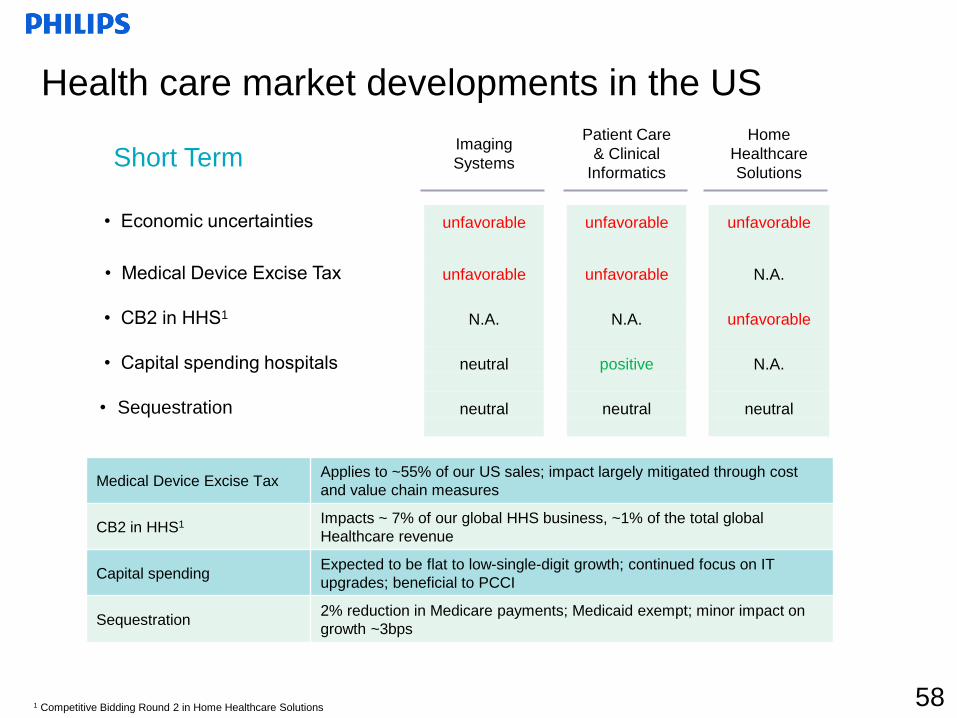
Imaging
Systems
Patient Care
& Clinical
Informatics
Home
Healthcare
Solutions
• Economic uncertainties unfavorable unfavorable unfavorable
• Medical Device Excise Tax unfavorable unfavorable N.A.
• CB2 in HHS1 N.A. N.A. unfavorable
• Capital spending hospitals neutral positive N.A.
• Sequestration neutral neutral neutral
Health care market developments in the US
Short Term
Medical Device Excise Tax Applies to ~55% of our US sales; impact largely mitigated through cost
and value chain measures
CB2 in HHS1 Impacts ~ 7% of our global HHS business, ~1% of the total global
Healthcare revenue
Capital spending Expected to be flat to low-single-digit growth; continued focus on IT
upgrades; beneficial to PCCI
Sequestration 2% reduction in Medicare payments; Medicaid exempt; minor impact on
growth ~3bps
1 Competitive Bidding Round 2 in Home Healthcare Solutions 58
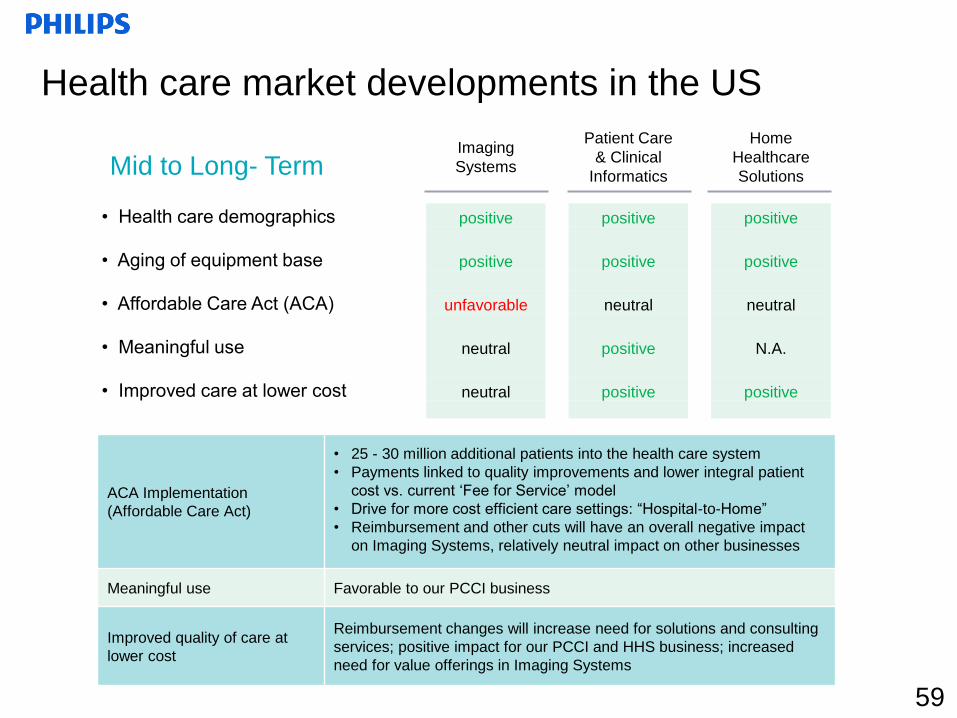
Imaging
Systems
Patient Care
& Clinical
Informatics
Home
Healthcare
Solutions
• Health care demographics positive positive positive
• Aging of equipment base positive positive positive
• Affordable Care Act (ACA) unfavorable neutral neutral
• Meaningful use neutral positive N.A.
• Improved care at lower cost neutral positive positive
Health care market developments in the US
59
Mid to Long- Term
ACA Implementation
(Affordable Care Act)
• 25 - 30 million additional patients into the health care system
• Payments linked to quality improvements and lower integral patient
cost vs. current ‘Fee for Service’ model
• Drive for more cost efficient care settings: “Hospital-to-Home”
• Reimbursement and other cuts will have an overall negative impact
on Imaging Systems, relatively neutral impact on other businesses
Meaningful use Favorable to our PCCI business
Improved quality of care at
lower cost
Reimbursement changes will increase need for solutions and consulting
services; positive impact for our PCCI and HHS business; increased
need for value offerings in Imaging Systems

Sales Comp. Sales Growth Adjusted EBITA%1
Working capital Working capital as % of LTM sales
1 Adjusted EBITA is EBITA corrected for incidental charges (details on slide 94)
Note - Prior-period financials revised for discontinued operations, the adoption of IAS19R and for restatements included in the Annual Report 2012 (please refer to the Annual Report
section 12.10 “Significant Accounting Policies”)
-10%
0%
10%
20%
30%
0
1,000
2,000
3,000
3Q11 4Q11 1Q12 2Q12 3Q12 4Q12 1Q13 2Q13 3Q13
Healthcare: Financials over the last two years EUR million
Sales, Comparable sales growth and Adjusted EBITA%
Working capital as % of sales
8%
12%
16%
0
400
800
1,200
3Q11 4Q11 1Q12 2Q12 3Q12 4Q12 1Q13 2Q13 3Q13
60

Healthcare: Q3 2013 Sector analysis EUR million
Growth
25%
26%
44%
5%
• Currency-comparable equipment orders declined 2% y-o-y. Patient Care & Clinical Informatics recorded a 7% decline, while Imaging Systems showed low-single-digit growth. Equipment order intake in growth geographies showed a low-single-digit decline, mainly due to Russia & Central Asia, while China and India recorded double-digit growth. NA equipment order intake showed a low-single-digit decline. Western Europe recorded a 7% decline as Q3 2012 included large and multi-year deals in the Netherlands and UK.
• Healthcare comp. sales remained flat y-o-y. Customer Services achieved mid-single-digit growth, while Home Healthcare Solutions and Patient Care & Clinical Informatics showed low-single-digit growth. Imaging Systems recorded a mid-single-digit decline. From a regional perspective, comparable sales in growth geographies increased by 3% year-on-year, with strong growth in China, Central & Eastern Europe and Latin America, partly offset by declines in Russia, Central Asia, Middle East and Turkey. Western Europe remained in line with Q3 2012, while North America declined by 2% and other mature geographies recorded low-single-digit growth.
• EBITA was EUR 329 million, or 14.6% of sales, compared to EUR 305 million, or 12.5% of sales, in Q3 2012. Excluding restructuring and acquisition-related charges, EBITA amounted to EUR 330 million, or 14.6% of sales, compared to EUR 308 million, or 12.6% of sales, in Q3 2012. The 2.0 percentage points increase was due to improved gross margins and overhead cost reductions.
• Net operating capital, excluding a negative currency translation effect of EUR 547 million, decreased by EUR 189 million to EUR 7.5 billion. This decrease was largely driven by lower fixed assets. Inventories as a percentage of sales improved by 1.2 percentage points year-on-year, driven by reductions in all businesses. Compared to Q3 2012, the number of employees decreased by 659, mainly as a result of reductions in North America and Europe.
Financial performance Key figures
Sales per region Growth Geographies1
25%
EMEA
Asia
Pacific
North
America
Latin
America
Mature Q3 2013
61
3Q12 2Q13 3Q13
Sales 2,443 2,362 2,258
% sales growth comp. 7 0 0
EBITA 305 420 329
EBITA as % of sales 12.5 17.8 14.6
EBIT 255 379 283
EBIT as % of sales 10.4 16.0 12.5
NOC 8,261 7,684 7,525
Employees (FTEs) 38,228 37,270 37,569
1 Growth geographies are all geographies excluding USA, Canada, Western Europe, Australia, New Zealand, South Korea, Japan and Israel
Note - Prior-period financials revised for discontinued operations, the adoption of IAS19R and for restatements included in the Annual Report 2012 (please refer to the Annual Report
section 12.10 “Significant Accounting Policies”)

-30%
-20%
-10%
0%
10%
20%
30%
Q1 Q2 Q3 Q4 Q1 Q2 Q3 Q4 Q1 Q2 Q3
World Western Europe North America Rest of the World
2012
Currency adjusted order intake only relates to the Imaging Systems and Patient Care &
Clinical Informatics businesses
Healthcare: Equipment order intake
2011
62
2013
Quarterly currency adjusted equipment order intake1
1 For comparability purposes, prior-period equipment order intake has been restated where necessary

Healthcare: Equipment order book
Indexed Equipment Order Book Development
Quarter end equipment order book is a leading
indicator for ~45% of sales the following quarters
~15%
~45%
~40% Home
Healthcare +
Customer
Services sales
Equipment book
and bill sales
Equipment sales
from order book -
Leading indicator
of future sales
Typical profile of equipment order
book conversion to sales
> 1
year
~30% ~40%
Q+1 Q+2
to 4
~30%
63
70
80
90
100
110
120
130
Q1 Q2 Q3 Q4 Q1 Q2 Q3 Q4 Q1 Q2 Q3
2011 2012 2013
• Approximately 70% of the
current order book results in
sales within next 12 months

We deliver innovative Personal Health and Well-being appliances and services.
We leverage deep consumer insights and smart technology.
We are committed to deliver the best customer experience and be the preferred
brand where we compete.
In combination with our global scale, local market relevance and superior
execution, this enables us to create long term value.
Philips Consumer Lifestyle Guiding Statement
64

Consumer Lifestyle What we do. Where we are.
€4.3 Billion sales
in 2012
16,000+ People employed
worldwide
6% of sales invested
in R&D in 2012 1 Based on last twelve months sales September 2013 2 Other category (1%) is omitted from this overview 3 Growth geographies are all geographies excluding USA, Canada, Western Europe, Australia, New Zealand, South Korea, Japan and Israel
Note - Prior-period financials revised for discontinued operations, the adoption of IAS19R and for restatements included in the Annual Report 2012 (please refer to the Annual Report
section 12.10 “Significant Accounting Policies”)
36% of green product
sales in 2012
65
Businesses1, 2 Geographies1
Personal
Care
Health &
Wellness
Domestic
Appliances
North
America
Other Mature
Geographies
17% 7% 47%
Growth
Geographies3
33% 20% 46%
Western
Europe
29%
Philips Consumer Lifestyle

8% 2000
Total sales
EUR 11.3 billion1
Total sales EUR 4.6 billion
Consumer Lifestyle: delivering strong growth and
improving profitability
10%
1%
51%
29%
46%
20%
33%
Domestic Appliances
Personal Care
1%
1%
Health & Wellness
Consumer Electronics ex. TV
66
Last 12 months
Sept ’13
• Renewed portfolio further focusing on Personal
Health and Well-being
• Strengthening core businesses through locally
relevant innovations, global platforms and
addressing geographical white spots
• Expanding to new business adjacencies in the
domain of Personal Health and Well-being
Television
Others 1 DAP and Mainstream part of Consumer Electronics in 2000 only

4% 1%
36%
23%
17%
46%
7%
20%
13%
33%
Consumer Lifestyle Sales Mix
After significant portfolio rationalization we are
further focusing on Personal Health and Well-being We see strong growth in the Consumer
Lifestyle portfolio
Personal Care Health & Wellness Domestic Appliances
Lifestyle Entertainment Others
FY 2010 Sept '13 last twelve months
2010 2009
Mid-
single-digit
growth
Low-
single-digit
decline
Double-digit
growth
2011
Double-digit
growth
Last 12 months
Sept ‘13
67 Television

-10%
-5%
0%
5%
-400
-200
0
200
3Q11 4Q11 1Q12 2Q12 3Q12 4Q12 1Q13 2Q13 3Q13
Sales Comp. Sales Growth Adjusted EBITA%1
Working capital Working capital as % of LTM sales
0%
5%
10%
15%
0
500
1,000
1,500
3Q11 4Q11 1Q12 2Q12 3Q12 4Q12 1Q13 2Q13 3Q13
Consumer Lifestyle: Financials over the last two years EUR million
Sales, Comparable sales growth and Adjusted EBITA%
Working capital as % of sales2
68
1 Adjusted EBITA is EBITA corrected for incidental charges (details on slide 94) 2 Working capital includes residual balance of discontinued operations
Note - Prior-period financials revised for discontinued operations, the adoption of IAS19R and for restatements included in the Annual Report 2012 (please refer to the Annual Report
section 12.10 “Significant Accounting Policies”)

We are further building our leadership positions in
these categories
1 Based on top 10 BMC’s (Business Market Combination) sell-in volumes corrected for average shaver lifetime 2 Global or Regional #1 or #2 position 3 Growth geographies are all geographies excluding USA, Canada, Western Europe, Australia, New Zealand, South Korea, Japan and Israel
Source: GfK, Nielsen, YTD and MAT June 2013
• Leadership positions2 in Hair Care in growth geographies3
• Continuing to strengthen #1 position in Intense Pulsed Light (IPL) hair
removal in Europe
• VisaPure cleansing brush successfully launched in 15 markets
Oral
Healthcare
• Enhancing geographic growth with strong market share increase
outside US
• Converting more manual users to electric, entering manual aisle with
PowerUp battery in the US
• Launching new FlexCare Platinum, high consumer ratings
Mother &
Childcare
• Natural range launched globally, with significant profitability
improvement
• Strengthening geographic footprint with strong growth in key markets
such as China
• #1 Market position in many markets
Male
Grooming
• 40% of SensoTouch and AquaTouch users recruited from blade, in
total recruited 5% new shaving users this year1
• Increasing our share in the total Male Grooming market (including
blade), strengthening our leading position
• Further strengthening leadership in China; expanding into
lower tier cities Personal Care
Beauty
Health & Wellness
69

Domestic Appliances
Garment
Care
• Double-digit growth in the first three quarters of 2013 driven by strong
innovation
• Acquisitions and local product creation drive a significant increase of
new product offers
• Leadership in key markets strengthened through local relevance
• Optimal Temp innovation (non-thermostat iron) confirms global
leadership in steam generators
• Locally relevant innovations like steamers drive leadership in China
and expand portfolio globally
• Revamped full automatic Espresso portfolio and strong product
pipeline enables us to win in the espresso domain
• Regaining espresso market share in the #1 espresso market, DACH1
• Ready to work with new owners of D.E. Master Blenders 1753, further
building the Senseo business
• Created an alliance with Tchibo for our Saeco brand in espresso
capsules
Coffee
Kitchen
Appliances
We are further building our leadership positions in
these categories
1 Germany, Austria, Switzerland
Source: GfK, Nielsen, YTD and MAT June 2013 70

37%
40%
16%
7%
Consumer Lifestyle: Q3 2013 Sector analysis EUR million
Growth
• Consumer Lifestyle comparable sales increased by 9%. Strong
double-digit comparable sales growth was seen at Health &
Wellness, while Domestic Appliances showed high-single-digit
growth and Personal Care recorded mid-single-digit growth. From
a regional perspective, Consumer Lifestyle achieved a strong
double-digit comparable sales increase in growth geographies and
mid-single-digit growth in mature geographies. North America
showed high-single-digit growth, while Western Europe remained
in line with Q3 2012.
• EBITA amounted to EUR 116 million, or 10.6% of sales, an
increase of EUR 38 million and 3.2 percentage points compared to
Q3 2012. Excluding restructuring and acquisition-related charges,
EBITA was EUR 121 million, or 11.1% of sales, compared to EUR
85 million, or 8.1% of sales, in Q3 2012. The improvement of 3.0
percentage points was largely attributable to operating leverage
from higher sales and improved gross margins across all
businesses.
• EBITA included EUR 7 million of net costs formerly reported in
discontinued businesses (Q3 2012 included EUR 9 million related
to the Audio, Video, Multimedia and Accessories business and
EUR 7 million related to the Television business).
• Net operating capital, excluding a negative currency translation
effect of EUR 79 million, decreased by EUR 200 million year-on-
year. The decrease was largely driven by lower working capital.
The number of employees decreased by 799 year-on-year, as a
result of the seasonal outflow of temporary industrial personnel,
mainly in the Domestic Appliances business in the Asian region.
Key figures Financial performance
48%
EMEA
Asia
Pacific
North
America
Latin
America
Mature
Sales per region Growth Geographies1
Q3 2013
71
3Q12 2Q13 3Q13
Sales 1,051 1,083 1,091
% sales growth comp. 10 13 9
EBITA 78 82 116
EBITA as % of sales 7.4 7.6 10.6
EBIT 63 69 102
EBIT as % of sales 6.0 6.4 9.3
NOC 1,443 1,182 1,164
Employees (FTEs) 17,125 16,414 16,326
1 Growth geographies are all geographies excluding USA, Canada, Western Europe, Australia, New Zealand, South Korea, Japan and Israel
Note - Prior-period financials revised for discontinued operations, the adoption of IAS19R and for restatements included in the Annual Report 2012 (please refer to the Annual Report
section 12.10 “Significant Accounting Policies”)

We are improving people’s lives with light by delivering unique value and energy
efficient solutions to consumers and professional customers, every day,
everywhere.
We are using deep customer insights and technological innovations, coupled with
our trusted brand and global leadership positions, to lead the digital lighting
revolution.
Philips Lighting Guiding Statement
72

Lighting What we do. Where we are.
Philips Lighting
Businesses1
Light
Sources &
Electronics
Professional
Lighting
Solutions
Lumileds Automotive
52% 28% 5% 10%
73
Geographies1
North
America
Other Mature
Geographies
24% 5% 43%
Growth
Geographies2
Western
Europe
28%
€8.4 Billion sales
in 2012
47,000+ People employed
worldwide in 60 countries
5% of sales invested
in R&D in 2012
80,000+ Products & services
offered in 2012
Consumer
Luminaires
5%
1 Based on last twelve months sales September 2013 2 Growth geographies are all geographies excluding USA, Canada, Western Europe, Australia, New Zealand, South Korea, Japan and Israel
Note - Prior-period financials revised for discontinued operations, the adoption of IAS19R and for restatements included in the Annual Report 2012 (please refer to the Annual Report
section 12.10 “Significant Accounting Policies”)
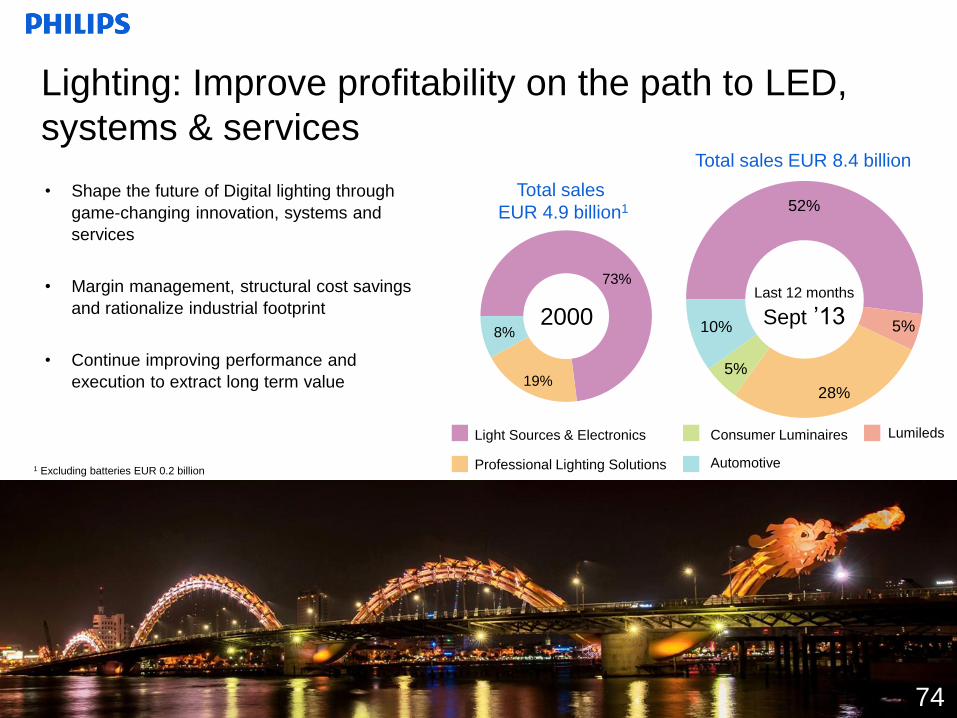
Light Sources & Electronics
Professional Lighting Solutions
• Shape the future of Digital lighting through
game-changing innovation, systems and
services
• Margin management, structural cost savings
and rationalize industrial footprint
• Continue improving performance and
execution to extract long term value
Total sales
EUR 4.9 billion1
Total sales EUR 8.4 billion
Lighting: Improve profitability on the path to LED,
systems & services
8%
73%
19%
10%
52%
5%
5%
28%
2000
1 Excluding batteries EUR 0.2 billion
Consumer Luminaires
Automotive
Lumileds
74
Last 12 months
Sept ’13

Philips Lighting
Customer Segments1
27% 13% 20% 8% 13% 2% 4% 3% 10%
Retail Entertainment Healthcare Automotive Homes Offices Outdoor Industry Hospitality
We increase our focus towards the people we serve Further strengthening our global leadership in Lighting
1 Indicative split based on last twelve months September 2013
Note - Prior-period financials revised for discontinued operations, the adoption of IAS19R and for restatements included in the Annual Report 2012 (please refer to the Annual Report
section 12.10 “Significant Accounting Policies”) 75
• ~ 75% of Lighting sales is B2B
• ~ 25% of the Lighting portfolio is LED lighting

Working capital Working capital as % of LTM sales
Sales Comp. Sales Growth Adjusted EBITA%1
-5%
0%
5%
10%
15%
20%
-500
500
1,500
2,500
3Q11 4Q11 1Q12 2Q12 3Q12 4Q12 1Q13 2Q13 3Q13
Sales, Comparable sales growth and Adjusted EBITA%
Working capital as % of sales
8%
12%
16%
20%
0
400
800
1,200
3Q11 4Q11 1Q12 2Q12 3Q12 4Q12 1Q13 2Q13 3Q13
Lighting: Financials over the last two years EUR million
76 1 Adjusted EBITA is EBITA corrected for incidental charges (details on slide 94)
Note - Prior-period financials revised for discontinued operations, the adoption of IAS19R and for restatements included in the Annual Report 2012 (please refer to the Annual Report
section 12.10 “Significant Accounting Policies”)

35%
35%
23%
7%
Growth
• Comparable sales were 3% higher year-on-year, led by double-
digit growth at Lumileds and Automotive. Light Sources &
Electronics achieved low-single-digit growth, while Professional
Lighting Solutions and Consumer Luminaires recorded a low-
single-digit decline. From a regional perspective, comparable sales
showed a double-digit increase in growth geographies (10%
increase in comparable sales excluding OEM Lumileds sales),
which was partially offset by a mid-single-digit decrease in mature
geographies. LED-based sales grew 33% compared to Q3 2012,
and now represent 30% of total Lighting sales.
• EBITA amounted to EUR 177 million, compared to EUR 32 million
in Q3 2012. Earnings in Q3 2013 were impacted by restructuring
and acquisition-related charges of EUR 36 million (Q3 2012: EUR
102 million, including a EUR 34 million loss on the sale of industrial
assets). The year-on-year EBITA increase was driven by higher
gross margins and improvements in the cost structure.
• EBITA, excluding restructuring and acquisition-related charges and
other losses, was EUR 213 million, or 10.2% of sales (Q3 2012:
EUR 134 million, or 6.3% of sales). Light Sources & Electronics,
Professional Lighting Solutions and Lumileds were the main
contributors to the operational improvement.
• Net operating capital, excluding a negative currency translation
effect of EUR 227 million, decreased by EUR 156 million year-on-
year. The decrease was largely driven by provisions and lower
fixed assets. Inventories as a percentage of sales improved by 0.2
percentage points year-on-year. Compared to Q3 2012, the
number of employees decreased by 3,876, mainly due to the
rationalization of the industrial footprint.
Financial performance Key figures
45%
EMEA
Asia
Pacific
North
America
Latin
America
Mature
Lighting: Q3 2013 Sector analysis EUR million
Sales per region Growth Geographies1
Q3 2013
77
3Q12 2Q13 3Q13
Sales 2,139 2,048 2,084
% sales growth comp. 4 2 3
EBITA 32 153 177
EBITA as % of sales 1.5 7.5 8.5
EBIT (14) 115 140
EBIT as % of sales (0.7) 5.6 6.7
NOC 5,051 4,732 4,668
Employees (FTEs) 51,751 49,148 47,875
1 Growth geographies are all geographies excluding USA, Canada, Western Europe, Australia, New Zealand, South Korea, Japan and Israel
Note - Prior-period financials revised for discontinued operations, the adoption of IAS19R and for restatements included in the Annual Report 2012 (please refer to the Annual Report
section 12.10 “Significant Accounting Policies”)

The lighting market is fundamentally attractive with
expected growth of 4-6% CAGR until 2016
78
2012 2016
Conventional Lighting LED Lighting
EUR 70-80 billion
1 Source: Philips Lighting global market study 2013. Excluding Automotive Lighting and LED components market
Global lighting product-related market forecast¹:
• Overall global product-related lighting market
offers sustainable long-term growth, driven by 3
majors trends:
– The world needs more light
– The world needs more energy-efficient light
– The world needs more digital light
• Conventional lighting is contracting by mid-single-
digit CAGR (2012-2016)
• LED penetration progressing fast at +34% CAGR
(2012-2016)
• Added value of systems and services delivering
significantly higher margin profile and additional
opportunity to current product-related market
45-50%
4-6%
2012- 2016 CAGR
2012-2016 CAGR: +34%
The lighting market is growing steadily with
an attractive profit pool which will drive
value creation
We are pushing the boundaries of lighting by
driving innovative systems and services
Conventional lighting LED lighting

15
18
24
33
64
100
Competitor 5
Competitor 4
Competitor 3
Competitor 2
Competitor 1
Philips Lighting
Indexed sales of Philips Lighting and Top 5 competitors¹ Market share per Business Group by Region
as per Q2 2013²
# 1 # 2 or 3 Not in top 3
We are the global leader in lighting
1 Sales for competitors based on latest fiscal year 2 Source: customer panels, industry associations and internal analysis 3 Excluding Japan 4 #1 position globally as nearest competitors play only on specific regions 5 Excluding Interior Lighting
We are the largest lighting company
in the world …
… with market leadership positions across
all categories and regions
Our market share in LED is higher than in
conventional We are #1 in sold LED lighting globally
Europe North
America
Latin
America
Asia/
Pacific3 Total
Light Sources &
Electronics
Consumer Luminaires4 Professional Lighting
Solutions Lumileds
(High Power LEDs)
Automotive5
Overall Lighting
OEM Businesses
79

We continue to be in the best position to capture
value in the conventional market…
Global Conventional Light sources installed base¹
In units x Bn
1 Source: Philips Lighting global market study 2013 2 SKUs = Stock Keeping Units 3 Growth geographies are all geographies excluding USA, Canada, Western Europe, Australia, New Zealand, South Korea, Japan and Israel
0,9%
Mature geographies
Growth geographies
2016 2012
Conventional market will remain
sizeable for many years…
• Conventional market has a significant installed
base and growing demand from growth
geographies3
• Conventional market will represent around 50%
of total lighting market revenue by 2016 2013
-46%
2015
-29%
Latest view 2011 Plan
Pro-actively rationalizing our industrial footprint
faster than sales reduction
2009
Rationalizing our product portfolio by reducing
number of SKUs in our conventional business
# of conventional SKUs2 in portfolio
0
10
20
2009 2010 2011 2012 2013 plan
80
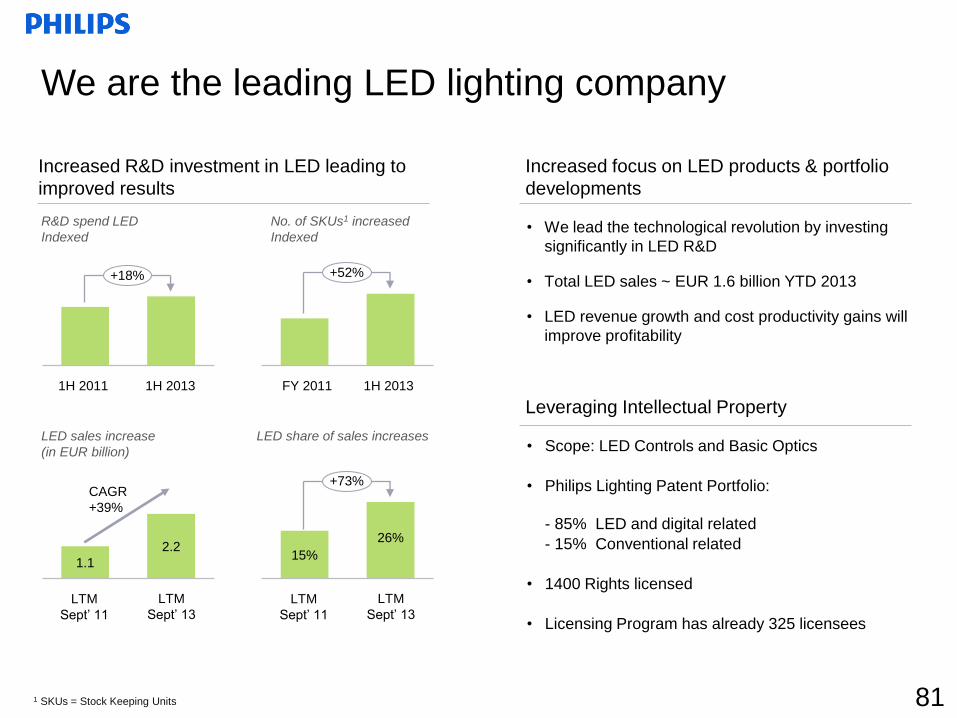
We are the leading LED lighting company
81
+18%
1.1
2.2
+52%
1H 2013 FY 2011
R&D spend LED
Indexed
No. of SKUs1 increased
Indexed
LED sales increase
(in EUR billion)
15%
26%
+73%
LTM
Sept’ 11
LED share of sales increases
CAGR
+39%
Increased R&D investment in LED leading to
improved results
Increased focus on LED products & portfolio
developments
• We lead the technological revolution by investing
significantly in LED R&D
• Total LED sales ~ EUR 1.6 billion YTD 2013
• LED revenue growth and cost productivity gains will
improve profitability
• Scope: LED Controls and Basic Optics
• Philips Lighting Patent Portfolio:
- 85% LED and digital related
- 15% Conventional related
• 1400 Rights licensed
• Licensing Program has already 325 licensees
Leveraging Intellectual Property
LTM
Sept’ 13
LTM
Sept’ 11
LTM
Sept’ 13
1H 2011 1H 2013
1 SKUs = Stock Keeping Units
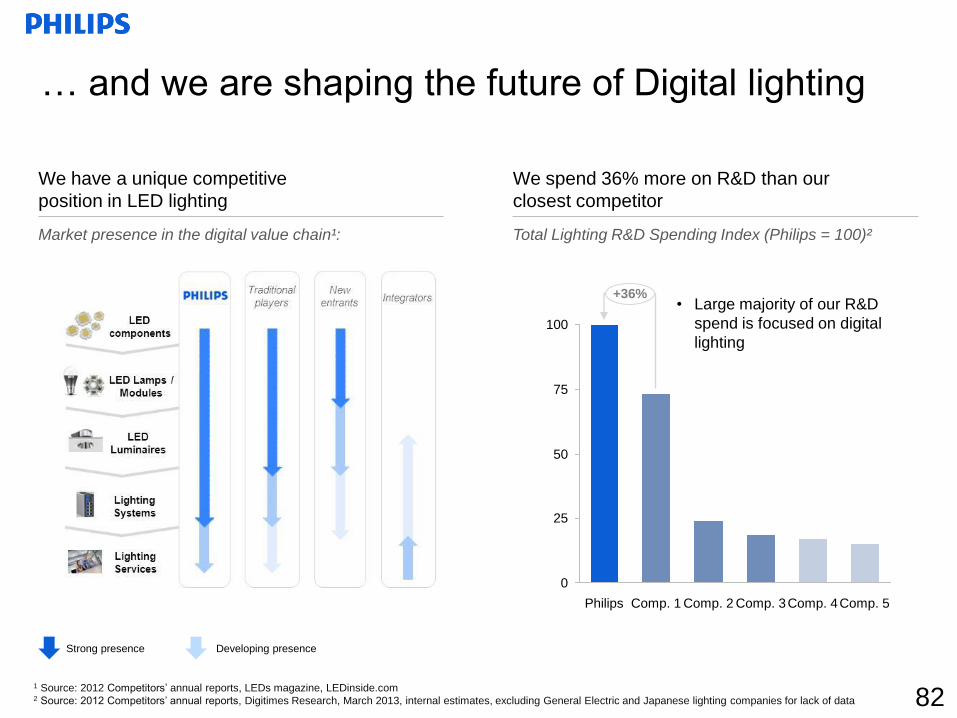
100
75
50
25
0
+36%
Comp. 5 Comp. 4 Comp. 3 Comp. 2 Comp. 1 Philips
Market presence in the digital value chain¹: Total Lighting R&D Spending Index (Philips = 100)²
1 Source: 2012 Competitors’ annual reports, LEDs magazine, LEDinside.com 2 Source: 2012 Competitors’ annual reports, Digitimes Research, March 2013, internal estimates, excluding General Electric and Japanese lighting companies for lack of data
… and we are shaping the future of Digital lighting
Strong presence Developing presence
We have a unique competitive
position in LED lighting
We spend 36% more on R&D than our
closest competitor
• Large majority of our R&D
spend is focused on digital
lighting
82

-5
0
5
10
15
Q1 Q2 Q3 Q4
Weakness in non-residential construction markets in
mature geographies dampens growth
Philips
Lighting New Build
Replace-
ment Total
Residential 12% 13% 25%
Commercial 26% 22% 48%
Other1 19% 8% 27%
Total 57% 43% 100%
Q1
2011
Total Lighting
Light Sources & Electronics and other businesses
Prof. Lighting Solutions and Consumer Luminaires
Around 20% of Philips Lighting sales driven by
New Build in Western Europe & North America
(WE&NA) Comparable sales growth % 2011-2013
New Build WE&NA ROW Total
Residential 6% 6% 12%
Commercial 13% 13% 26%
Total 19% 19% 38%
2012
Q2
83
Q3 Q4
1 Others = Automotive and Outdoor
Q1
2013
Q2 Q3

Office Outdoor Home Entertainment
Healthcare Hospitality
Industry Retail
Application / Luminaires Lighting Electronics Lamps
Home
Consumer Professional
Biggest segments Total market size in 20121: EUR 60-65 billion
Office
Outdoor
1 General illumination (excludes Automotive)
Source: Philips Lighting global market study 2012
Home, Office, and Outdoor are the biggest segments
Professional is the largest channel
84

Innovation, Group & Services
Group Innovation Philips Group Innovation encompasses Group Funded Research and Innovation,
Design and Emerging Businesses
IP Royalties Royalty/licensing activities related to the IP on products no longer sold by the sectors
Group and Regional Costs Group headquarters and country & regional overheads
Accelerate! investments Investments to support the transformation of Philips
Pensions Pension and other postretirement benefit costs mostly related to former Philips’
employees
Service Units and Other Global service units; Shared service centers; Corporate Investments, stranded costs
of TV and the Audio, Video, Multimedia and Accessories business, and other
incidentals related to the legal liabilities of the Group
85
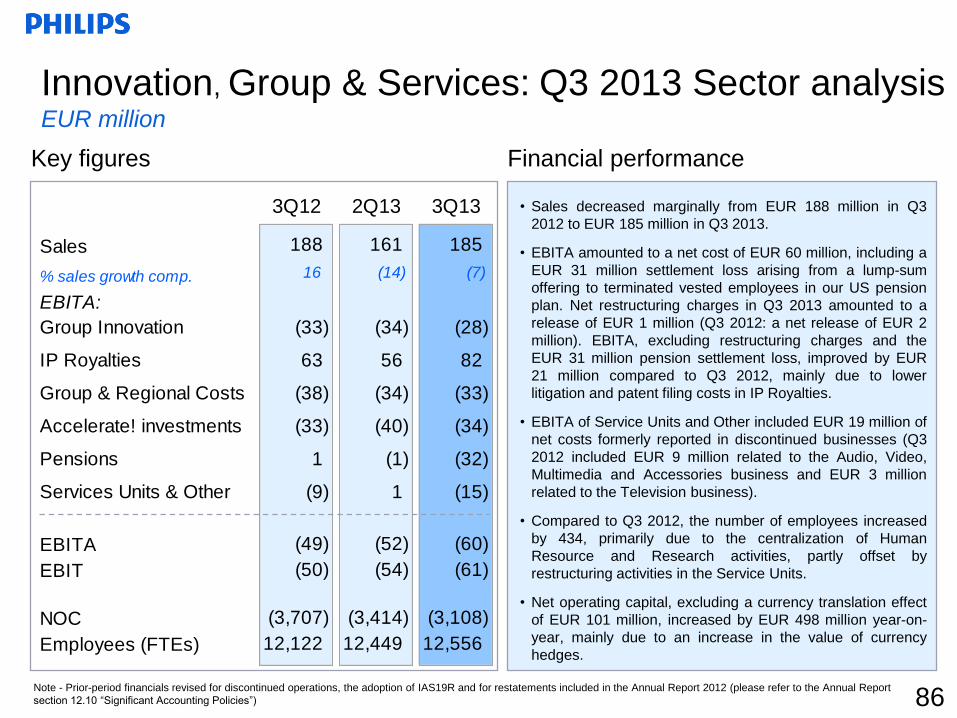
3Q12 2Q13 3Q13
Sales 188 161 185
% sales growth comp. 16 (14) (7)
EBITA:
Group Innovation (33) (34) (28)
IP Royalties 63 56 82
Group & Regional Costs (38) (34) (33)
Accelerate! investments (33) (40) (34)
Pensions 1 (1) (32)
Services Units & Other (9) 1 (15)
EBITA (49) (52) (60)
EBIT (50) (54) (61)
NOC (3,707) (3,414) (3,108)
Employees (FTEs) 12,122 12,449 12,556
Innovation, Group & Services: Q3 2013 Sector analysis EUR million
Financial performance Key figures
• Sales decreased marginally from EUR 188 million in Q3
2012 to EUR 185 million in Q3 2013.
• EBITA amounted to a net cost of EUR 60 million, including a
EUR 31 million settlement loss arising from a lump-sum
offering to terminated vested employees in our US pension
plan. Net restructuring charges in Q3 2013 amounted to a
release of EUR 1 million (Q3 2012: a net release of EUR 2
million). EBITA, excluding restructuring charges and the
EUR 31 million pension settlement loss, improved by EUR
21 million compared to Q3 2012, mainly due to lower
litigation and patent filing costs in IP Royalties.
• EBITA of Service Units and Other included EUR 19 million of
net costs formerly reported in discontinued businesses (Q3
2012 included EUR 9 million related to the Audio, Video,
Multimedia and Accessories business and EUR 3 million
related to the Television business).
• Compared to Q3 2012, the number of employees increased
by 434, primarily due to the centralization of Human
Resource and Research activities, partly offset by
restructuring activities in the Service Units.
• Net operating capital, excluding a currency translation effect
of EUR 101 million, increased by EUR 498 million year-on-
year, mainly due to an increase in the value of currency
hedges.
86 Note - Prior-period financials revised for discontinued operations, the adoption of IAS19R and for restatements included in the Annual Report 2012 (please refer to the Annual Report
section 12.10 “Significant Accounting Policies”)

Appendix

Publication and AGM dates 20141
January 28 Fourth quarterly and annual results 2013
February 25 Annual Report 2013
April 22 First quarterly results 2014
May 1 Annual General Meeting of Shareholders 2014
July 21 Second quarterly and semi-annual results 2014
October 20 Third quarterly results 2014
88 1 Subject to final confirmation
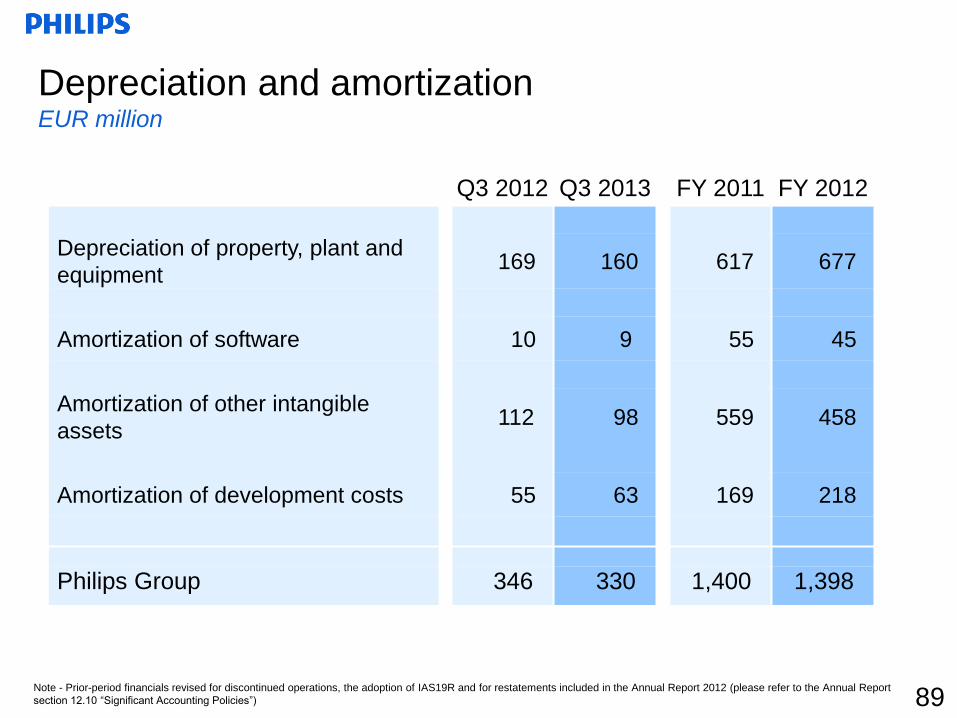
Q3 2012 Q3 2013 FY 2011 FY 2012
Depreciation of property, plant and
equipment 169 160 617 677
Amortization of software 10 9 55 45
Amortization of other intangible
assets 112 98 559 458
Amortization of development costs 55 63 169 218
Philips Group 346 330 1,400 1,398
Depreciation and amortization EUR million
89 Note - Prior-period financials revised for discontinued operations, the adoption of IAS19R and for restatements included in the Annual Report 2012 (please refer to the Annual Report
section 12.10 “Significant Accounting Policies”)
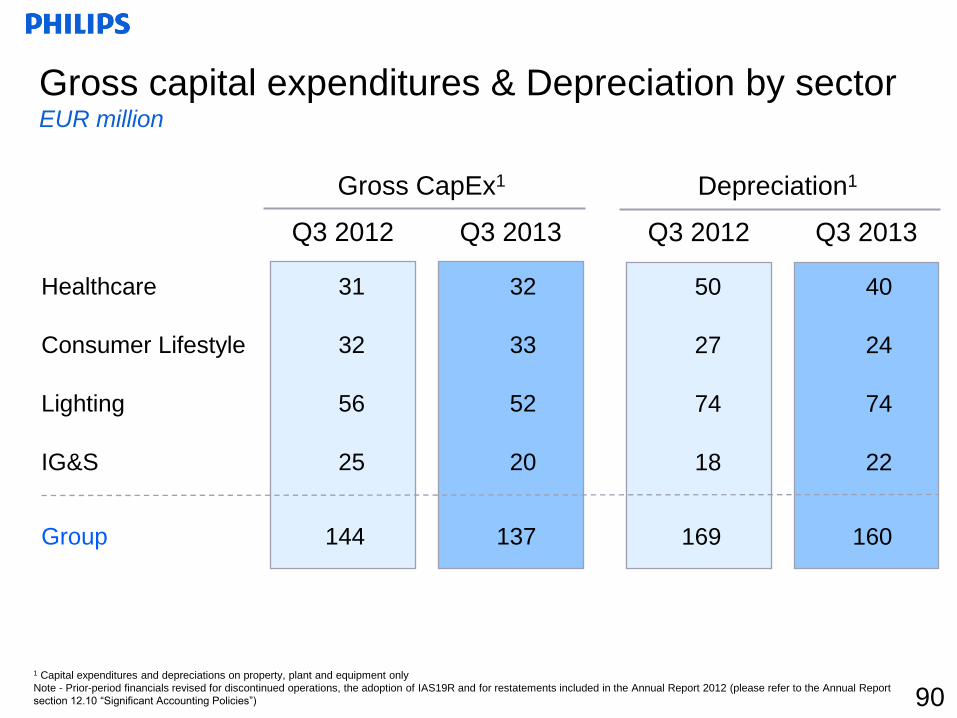
Gross capital expenditures & Depreciation by sector EUR million
Q3 2013 Q3 2012
31
32
56
25
144
32
33
52
20
137
Healthcare
Consumer Lifestyle
Lighting
IG&S
Group
Gross CapEx1
Q3 2013 Q3 2012
50
27
74
18
169
40
24
74
22
160
Depreciation1
90 1 Capital expenditures and depreciations on property, plant and equipment only
Note - Prior-period financials revised for discontinued operations, the adoption of IAS19R and for restatements included in the Annual Report 2012 (please refer to the Annual Report
section 12.10 “Significant Accounting Policies”)

Gross capital expenditures & Depreciation by sector EUR million
2012 2011
135
128
290
108
661
Healthcare
Consumer Lifestyle
Lighting
IG&S
Group
Gross CapEx1
2012 2011
200
104
298
75
677
Depreciation1
153
130
279
78
640
186
91
262
78
617
91 1 Capital expenditures and depreciations on property, plant and equipment only
Note - Prior-period financials revised for discontinued operations, the adoption of IAS19R and for restatements included in the Annual Report 2012 (please refer to the Annual Report
section 12.10 “Significant Accounting Policies”)

Development cost capitalization & amortization by
sector EUR million
Q3 2013 Q3 2012
64
8
16
-
88
64
9
15
7
95
Healthcare
Consumer Lifestyle
Lighting
IG&S
Group
Capitalization
Q3 2013 Q3 2012
33
8
14
-
55
39
7
17
-
63
Amortization
92 Note - Prior-period financials revised for discontinued operations, the adoption of IAS19R and for restatements included in the Annual Report 2012 (please refer to the Annual Report
section 12.10 “Significant Accounting Policies”)

Development cost capitalization & amortization by
sector EUR million
2012 2011
183
37
59
3
282
246
37
66
14
363
Healthcare
Consumer Lifestyle
Lighting
IG&S
Group
Capitalization
2012 2011
105
32
32
-
169
128
39
51
-
218
Amortization
93 Note - Prior-period financials revised for discontinued operations, the adoption of IAS19R and for restatements included in the Annual Report 2012 (please refer to the Annual Report
section 12.10 “Significant Accounting Policies”)
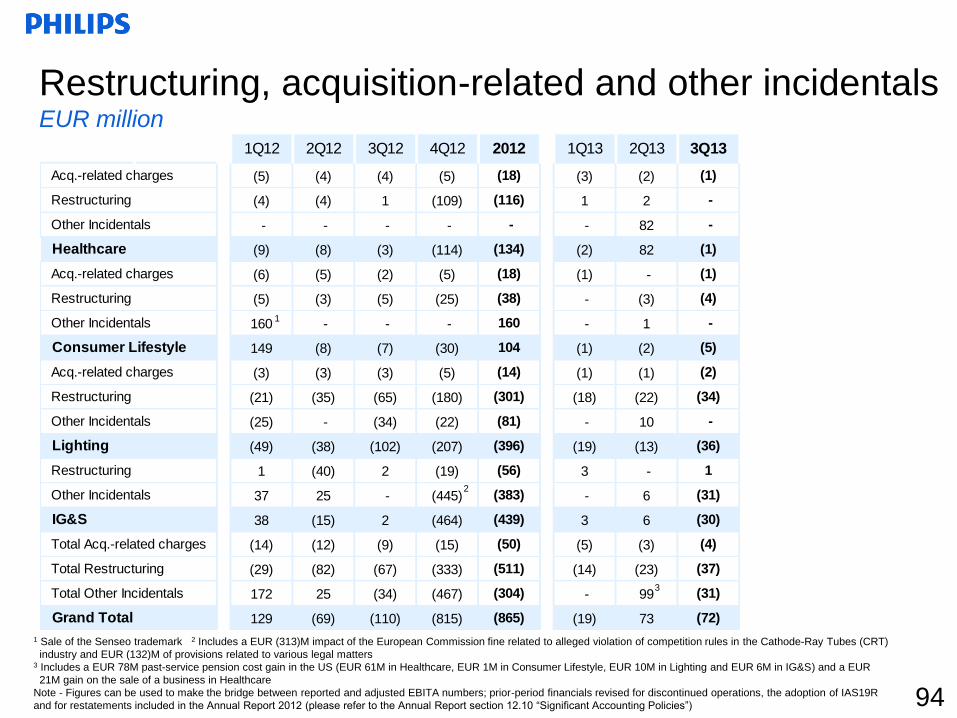
1Q12 2Q12 3Q12 4Q12 2012 1Q13 2Q13 3Q13
(5) (4) (4) (5) (18) (3) (2) (1)
(4) (4) 1 (109) (116) 1 2 -
- - - - - - 82 -
(9) (8) (3) (114) (134) (2) 82 (1)
(6) (5) (2) (5) (18) (1) - (1)
(5) (3) (5) (25) (38) - (3) (4)
160 - - - 160 - 1 -
149 (8) (7) (30) 104 (1) (2) (5)
(3) (3) (3) (5) (14) (1) (1) (2)
(21) (35) (65) (180) (301) (18) (22) (34)
(25) - (34) (22) (81) - 10 -
(49) (38) (102) (207) (396) (19) (13) (36)
1 (40) 2 (19) (56) 3 - 1
37 25 - (445) (383) - 6 (31)
38 (15) 2 (464) (439) 3 6 (30)
(14) (12) (9) (15) (50) (5) (3) (4)
(29) (82) (67) (333) (511) (14) (23) (37)
172 25 (34) (467) (304) - 99 (31)
129 (69) (110) (815) (865) (19) 73 (72)
Other Incidentals
Acq.-related charges
Restructuring
Healthcare
Acq.-related charges
Restructuring
Other Incidentals
Grand Total
Consumer Lifestyle
Acq.-related charges
Restructuring
Other Incidentals
Lighting
Restructuring
Other Incidentals
IG&S
Total Acq.-related charges
Total Restructuring
Total Other Incidentals
Restructuring, acquisition-related and other incidentals EUR million
1 Sale of the Senseo trademark 2 Includes a EUR (313)M impact of the European Commission fine related to alleged violation of competition rules in the Cathode-Ray Tubes (CRT)
industry and EUR (132)M of provisions related to various legal matters 3 Includes a EUR 78M past-service pension cost gain in the US (EUR 61M in Healthcare, EUR 1M in Consumer Lifestyle, EUR 10M in Lighting and EUR 6M in IG&S) and a EUR
21M gain on the sale of a business in Healthcare
Note - Figures can be used to make the bridge between reported and adjusted EBITA numbers; prior-period financials revised for discontinued operations, the adoption of IAS19R
and for restatements included in the Annual Report 2012 (please refer to the Annual Report section 12.10 “Significant Accounting Policies”) 94
1
2
3
