rrcso~v - ciat-library.ciat.cgiar.org
TRANSCRIPT

rrcso~v &'jo;~
COLECClON HfS10RKA
KING'S COLLEGE LONDON UNIVERSITV
TECHNIQUES FOR MANAGING ENVIRONMENT AL CHANGE AT THE EARTH'S SURFACE
UNICA::J DE nO.:MACION y DUCUMENfACION
3 f AGO. 2004
r ASSESSING THE IMPACT OF DEFORESTATION ON SLOPE 1/ STABILlTV WITHIN THE OVEJAS WATERSHED
CAUCA - COLOMBIA \
/eq -::t~
APRIL 1998

Sessional Card 97/A00876
CONTENTS
TABLES 2
1. INTRODUCTION 3
2.0BJECTIVE 4
3. AREA DESCRIPTION 5
4. GEOLOGY 6
5. GEOMORPHOLOGY 7
6. MAPPING METHODS. 8
7. SLOPE STABILlTY ANALYSIS 14
8. DISCUSSION 20
9. COMPLEMENTARY ANALYSES 21
10. CONCLUSIONS 25
11. BIBLlOGRAPHY 26

Sessional Card 97/A00876
FIGURES
Figure 1. Location of Ovejas Watershed and study area in the box ..... ........ .. ...... .. ........... .. .... 5
Figure 2. Process of stability analysis.... ........ .... .. .. ........ .. .. ....... .. ...... .... ... .. ................ .. 9
Figure 3. Digital Elevation Model. (Ieft) ..... ..... .. .... ...... . .. ....... .. ................. ...... .... 10
Figure 4. Detail ofTopographic Index. (right) .... ......... ... .. .. ........ ....... .... .... ........ ...... ......... .. .. 10
Figure 5. Aspect derived from the DEM ........ ....... ....... .... . . ......... ..................... ........ . .. 11
Figure 6. Slope distribution in Ovejas watershed area. . .... 11
Figure 7. Soil water table after normalisation ...... .. .. .. ............ .. .................... . .... .. 12
Figure 7a. Detail of Water table distribution .................. .. .. ... .... ......... ....... .. .... .... ..... ...... .... 12
Figure 8. Roads in the study area .. ........ ...... ... .... .. ....... ....... ........ ....... ... .. ... ....... ........ ... ..... .... 13
Figure 9. Soil depth (cms.) in Ovejas Area watershed. .................... ...... .. .. ... 13
Figure 10 . Planar failure in infinite slopes (after Graham, 1984) .......... ...... .... ... . .... ....... ... 16
Figure 11 . Variation in factor of safety against different slope .... .... .. ..... .... ........ ....... ... .... ...... 16
Figure 12. FaS before deforestation ....... .. .. ........................................... ...... . . . ...... .... ... 18
Figure 13. FaS after deforestation ....................... .. ............. ..... ......... ..... ..... . ....... .. .... .. .. . 18
Figure 14. Risk areas incorporated after deforestation .. ...... .. ........ .. 19
Figure 15. Changes in FaS after deforestation . ...... . .......... ....... .. ..... .. .................... .... .... .. 20
Figure 16. Pressure Head (Ieft) and Volumetric water conten (right) in the grass scenario ... 22
Figure 17. Pressure head (Ieft) and Volumetric water content (right) in forest scenano ......... 22
Figure 18. Framework of Bishop's method landslide analysis ..... ....... .... ............. .. .. .. .............. 23
Figure 19. Slip surfaces for two different FaS .................. ..... ........ .... .. .... .. .................. .......... . 23
Figure 20. Slip surface sections representing the forces involved in the profile ... ..... .......... .... 24
TABLES
Table 1. Values of minimum overall safety factors (after Selby, 1993) .................. ... .. .. .. .. .... . 15
Table 2. Parameters values used in the safety factor analyses. . .. .. ...... ....... ................. 17
Table 3. Comparison of FaS areas between two scenarios: before and after deforestation .. 17
2

Sessional Card 97/A00876
1. INTRODUCTION
"Soil mass movemenls are major landform shaping processes in mounlainous and sleep lerrain Ihroughoul Ihe world. Only when landslides cause dealh or injury, or damage slruclures or settlemenls do Ihey receive widespread attenlion. The frequenl associalion of slope failure wilh residenlial developmenl, engineering earthworks and certain land managemenl practices is nol coincidenlal. Condilions conlrolling slope slabilily may be in a lenuous equilibrium, which can be easily upsel by human aclivilies. Many major landslides, however, resull from infrequenl meleorological or seismic evenls Ihal induce unslable condilions on olherwise slable slopes or accelerale movemenl on unslable slopes" (Sidle, 1986).
A good example of faclors acling logelher is Ihe Paez avalanche, which occurred in June of 1994 in Ihe Cauca region (Colombia) where indigenous people were Ihe primary inhabilanls. An earthquake of 6.3 on Ihe Richler scale released a series of debris slides and flooding of Ihe Paez and Moras rivers. The magnilude of that evenl was reported world-wide scale (Annex 1). Geological and lopographical characlerislics, deforeslalion and land managemenl practice encouraged Ihe occurrence of more Ihan 1000 landslides of differenl magnilude in less Ihan five minules. This region is considered socio-economically marginal, far from slale services and forced lo clear Ihe moist foresl lo plant heroin and olher illicil crops. (Slrong, 1995). The area considered in Ihe currenl sludy is localed al 80 kms. of Ihe Paez region and il has similar characlerislics.
"The occurrence of debris slides is greatly affected by foresl cutting. The primal causes of debris slides on a vegelaled slope are Ihe increase of soil deplh, pore pressure in Ihe surface soil layer and Ihe effecl of Iree rools. The latter affecls Ihe soil slrenglh 1 in Iwo ways, Ihal is, Ihe decrease of soil slrenglh by biological (Iree rools) wealhering and Ihe increase of soil slrenglh by Iree rool nelworks". (Gray & Megahan, 1981; Tsukamoto & Kusakabe, 1984 ciled by Tsukamolo, 1987).
The presenl sludy compiles Ihe basic informalion available lo Ihe Ovejas walershed area in Cauca - Colombia lo assess Ihe impacl of hypolhelical deforeslalion on slope slabilily and to idenlify Ihe areas presenling higher risks of landslide occurrence. Some of Ihe paramelers required lo calculale Ihe faclor of safely are incorporaled inlo a GIS framework and displayed in maps lo locale Ihe risk areas.
1 "The term slrength is used in three senses in the earth sciences: (1) it may be used lor the ability 01 material to resist delormation by compressive, tensile or shear stress; (2) it may be used lar the ability 01 a rack or soil to resist abrasion; and (3) it may be used to indicate the resistance 01 loose or unconsolidated mineral grains being transported by a fluid".(Selby, 1993)
3

Sessional Card 97/A00876
2. OBJECTIVE
The objective of the present study is to assess the impact of deforestation on slope stability in the area of Ovejas watershed, located in Cauca - Colombia. The emphasis is on the identification of unstable areas befo re and after hypothetical deforestation, and the impact of road routes on instability.
4

Sessional Card 97/A00876
3. AREA DESCRIPTION
The Ovejas watershed is situated in Southwest Colombia in the Department Cauca and comprises an area of 106.000 hectares (Figure 1). The terrain is mountainous, characterised by deep gullies and steep slopes (up to 75%). Elevations range from 1000 to 3800 m.a.s.1. The climate is humid and the high rain intensities combined with the steep slope form a serious risk for soil erosiono About 15 % of the area is covered by fores!. The Pan-American Highway which crosses the area, provides good access throughout the year to the middle zone, while the dirt roads in the higher and lower zones prohibit good access during Ihe wel months.
Inhabilants belonging to differenl elhnic groups (meslizos and I ndigenous groups like Paez and Guambianos) live in Ihe administralive watershed, mainly small subsistent farmers with an average of 2 heclares of cultivated land. The main crops cultivated are coffee, beans, tomatoes and bananas.
The mean annual rainfall is 2000 mm with a pronounced dry period in July and August (70 and 80 mm respectively) . The mean monlhly temperature varies little during the year, bul differs considerably from place lo place, depending on the altitude. The mean monthly temperatures reported vary from 13 Oc (2650 m.a.s.i.) to 21°C (1200 m.a.s.I.).
N
t
Colombia
Figure 1. Localion of Ovejas Walershed and sludy area in Ihe box.
5

Sessional Card 97/A00876
4. GEOLOGY
GEMCO (1977) cited by CVC, made a study of age, composition and tectonic activity of different geological groups in the area. Unfortunately, there are no reference maps to guide in the location of each of the identified groups. Here is a brief description of the main geological groups in the area.
Caja marca Group: Pre-Cretaceous, extends from north to south in the east margin to the town of Silvia and another strip north near the town of Caldono. Esquistos carbonites and quartz, gneiss quartz-feldspar composes the first. The second by quartz, esquistos carbonites alternated with esquistos micaceous. There is a fault in the contact between these two strips and with the surrounding volcanic rocks. The geology is not related with the pedogenesis of this area beca use the entire area was covered with volcanic ashes.
Doleritic group: Cretaceous, located in the north, composed mainly of feldspars, piroxens and chlorites.
Cauca group: Tertiary, sand stone, doleryte consolidated , andesites and quartz.
Volcanic rocks group: Tertiary rock is sparsely distributed, filling the irregularities of the land.
Popayan formation: Volcanic origin, located in the south-west of the area; composed of andesites, conglomerates and agglomerates of andesites stones.
The soils are from volcanic origin (Oxic Dystropept and Typic Dystrandept) and are considered to be of low fertility due to low effective cation exchange and base saturation.
6

Sessional Card 97/A00876
5. GEOMORPHOLOGY
The information available on geomorphology is inciuded in the CVC report but it is not very extensive (CVC, 1976). The key characteristics are summarised here:
The area can be divided in to three parts: The upper zone (>3000 m.a.s.I.), the Middle (2000 - 3000 m.a.s.I.) and the Lower (>2000 m.a.s.I.). Each one of these zones has its own geomorphologic units, characteristics, materials and climale. Annex 2 shows an extract of their characteristics. In terms of Ihe environmental qualily of Ihe landscape, Ihe CVC report stales:
"the highest zone is very deteriorated, because of disordered human intervenlion, deforestalion of protective vegetation is encouraging landslides and erosion processes".
The Middle zone has the major concentration of agricultural and cattle activity but is in a better condition. Overgrazing appears to be Ihe major problem in Ihis area.
The lower zone have the highest grade of erosion because of overuse in agriculture and the heavy rain intensity on bare soil befo re the crop season.
A common pattern in all areas is Ihat the erosion processes are associaled with the construction of roads.
7

Sessional Card 97/A00876
6. MAPPING METHODS.
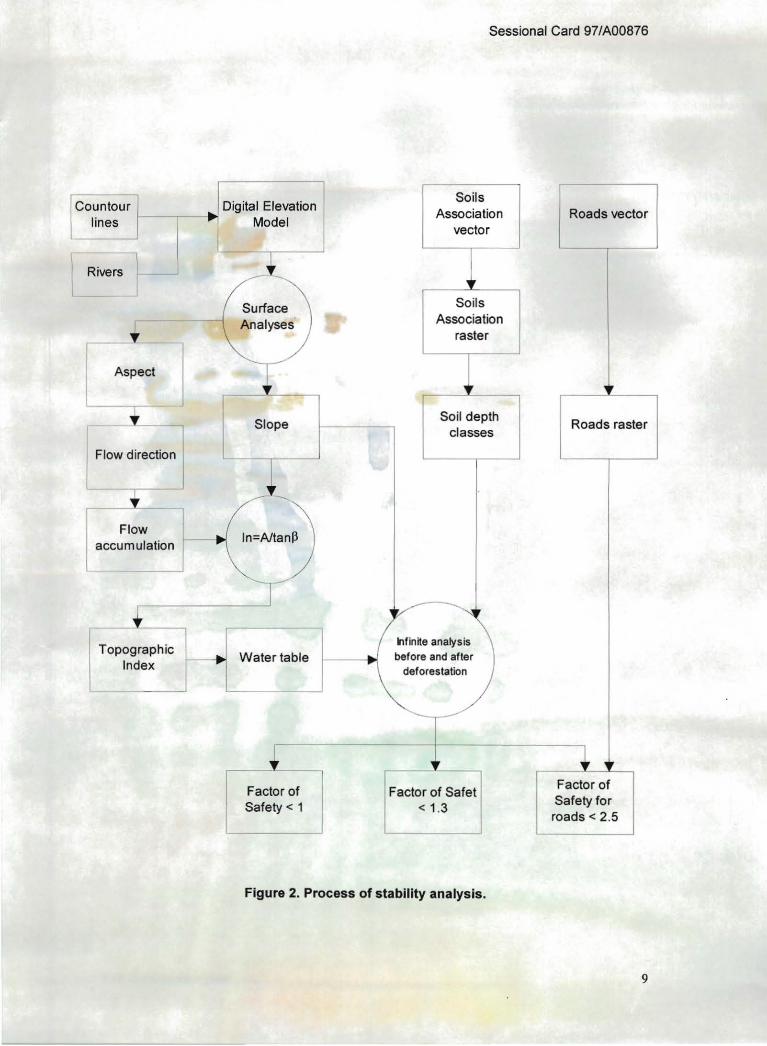
Figure 2 shows the process of mapping the Factor of Safety in the two scenarios mentioned. Eighteen sheet maps of scale 1:25.000 produced by IGAC between 1967 and 1992 containing contour lines, roads and rivers and covering ±70% of the watershed were selected. The maps were digitised using ARC/INFO software (ESRI, 1995) by the GIS unit of the International Centre for Tropical Agriculture CIA T. A digital elevation model (DEM) was built fer each sheet map using the contour lines in the Grid module with a resolution of 25 meters per pixel. River vectors were used to enforce the relief. The partial DEM's were joined to obtain a 22.5 by 30 km DEM (67.706.4 has). Figure 3 shows the final version of the DEM.
Hartshorne (1997) presents an evaluation of the influence of digital terrain models in the calculation of Factor of Safety (FOS). He did not find a clear relation between DEM resolution and FOS but suggests using surface texture indices to complement ground truth data. These indices can provide information on the variability and roughness of the terrain models. Carrara (1995) shows with different examples, that uncertainty and errors depend on the quality of the source maps, the accuracy of digitised contour lines and on the algorithms employed for interpolating elevation values or calculating morphometric parameters.
Following the surface module in Grid Module, slope, aspect and watershed delineation coverages were produced. At the same time, the DEM was used to calculate the topographic index, In=Ac/tanJ3 (Beven, 1996) (Figure 4). The water table depth was then calculated afler normalising the distribution of the topographic index (Figure 7). The local water table can be calculated from the topographic index at each point by the expression:
1 ra z . =--ln---, f I'o tan/3
Where Z¡ is the depth of water table, r the effective recharge rate (not considered here), a the pixel area, To the local saturated transmissivity (homogeneous tor the whole area with value 1), J3 the slope angle (in radians for use in GIS systems) and f a constant parameter.
Figure 5 shows the aspect of the area, Figure 6 shows the slope distribution derived from the DEM and Figure 7a details the water table in the study area. Figure 8 shows the map of roads considered to assign a higher safety factor. A 1 :50.000 map of soil associations (CVC, 1979) was analyses to extract information about soil depth required in the calculation of the safety factor and a map is presented in Figure 9.
Field observations have not been done yet because of limitations imposed by accessibility, time and resources available.
8
Sessional Card 97/A00876
Co Soils
untour _ .. Digital Elevation Association Roads vector
lines • Model vector
Rivers 1 t Surface Soils
Association ----l Analyses raster T
l Aspect 1 i._ Soil depth
Roads raster Slope classes l Flow direction
~ G
... Flow
-.. In=AltanP accumulation
1 .. V ~
~finíte analysis [ "",,,,"" Water table before and after Index deforestatkJn
+ + Factor 01 Salet
Factor 01 Factor 01 Salety lor Salety < 1 < 1.3 roads < 2.5
Figure 2. Process of stabillty analysis.
9

:~
i
Ovejas watershed area - OEM model ---
10 -
,-
...... ~
Figure 3. Digital Elevation Modelo (Ieft)
Figure 4. Detail ofTopographic Index. (right)
o 1000 ·1200
O 1200·1400
O 1400·1600 ,O 1600 · 1800
O 1800·2000 O 2000-2200 b 2200·2400
O 24oo·2S00
O 2SOO ·2800 O 2800 ·3000
ED 3000·3200
"'''CD'O'' Meters
7.300.00
Sessional Card 97/A00876
Topographle Index dlstrlbution (elasseS)
CD Melers Gt~ ~Q~~
- - 1,216_67
• • • • • • • • • • •
1 2 3 4 5 6 7 8 9
10 11 12 13 14 15 16 17
18 18 20 21 22 23 24
10

Sessional Card 97/A00876
Slope dlstribution in Ovejas Area watershed 16000
14000
12000
10000
'" " 8000 :I:
6000
4000
2000
O
· G'~([) "." Meters
7,300.00
Figure 5. Aspect derived from the DEM
Figure 6. Slope distribution in Ovejas watershed area.
JI

son Water Table
Topographlc Index cia ••
(') '" .... '" :: (') '" ,... ~ ~ ~
0.0
.0.5 .'
_ -1 .0
E ¡ ·1.5
-! -2 .0
i -2 .5
-3.0
-3.5
Figure 7. Soil water tabla atter normalisation.
Figure 7a. Detail of Water table distribution.
'" ~ (') ~ '" '"
.
Sessional Card 97/A00876
Water table dlstrlbutlon (cm) u,," .... • • . ~ j~ .~;: O - \ . ... . __ ,1'!A._1 D
"f:'-t.;<.,.( .- h ' "... . O .-, ~ ...... .... .. , L-..iI
....,.:: , .•
"."(I) "~ .. Meters
1,216.67
13 15 ;7 19 21 23 25 26 28 30 32 34 36 38 40 42
12

' -J R)C_a~~_,~:~~r~~ ~e,~_1~!~'~~!:'r~~' ,/. ; /' 1
0;;~~¡~*);~~j~,~~~~~ l ' ' " -V\ "~', '.,( r; ,.:, ;.! p)<~,'\<'~'··-": I
t'····i~·:é1:::t'~f~~t:~~ ~ ..
;~ .. ,"'t.) ; - I " ';'.: t ' .. . \ " ', I .. ! .
t ,\. ,:.'; i , ~_._----- .... -:' . .....:..- - 1--;'~-:-;
-r- i. I V'
¡ , : I ¡ ''(:. J
;'~ . ~''''': ::~·',,·,.,I: > ~· ·~t'-<.f{ ·:.~·<~~.' t -·· , .... \~~. >.. \. J I 1 ~ " "
¡~, . i -1 :;1 ~· i
.1 ' 1 ' ,t
;¡ ';'1
"1 . :~ " " ;:.... .
;;i::c\~pt)=~<>t~\:\<::¿, ':1-;,:t~~~:\ ;i:,·~ ~ Gr1dW~(Iol"
Meters
7,300.00
Figure 8, Roads in the study area
Figure 9, Soil depth (cms,) in Ovejas Area watershed,
Soll depth in OVejas Area Walershed
Sessional Card 97/ A00876
12 37 50 75 125 150
G' • . (1).Q., Meters
7,300.00
l3

Sessional Card 97/A00876
7. SLOPE STABILlTY ANALYSIS
"The stability of a slope against failure is assessed by the safety factor or the ratio of resistance to force. Mass movement will only occur when the disturbing forces become greater than the resistance of the slope-forming materials" (Brunsden, 1979). It is expressed as:
F (factor of safety) = sum of resisting forces I sum of driving forces
'Where the forces promoting stability are exactly equal to the forces promoting instability F = 1; where F < 1 the slope is in a condition for failure; where F > 1 the slope is likely to be stable. There is no such thing as absolute stability, only an increasing probability of stability as the value of F becomes larger. Most natural hillslopes upon which landslides can occur have F values between about 1 and 1.3, but such estimates depend upon an accurate knowledge of all the forces involved and for practieal purpose design engineers always adopt very eonservative estimates of stability. (Table 1). It can be seen that the greatest uncertainties are usually assoeiated with soil water, espeeially with its loeal variability of soil pressure and seepage."(Selby, 1993).
"Three main types of analyses are: (1) planar slip surfaee (infinite slope) analyses; (2) eircular slip surfaee analyses and (3) noncireular slip surfaee (other than planar) analyses" (Sidle, 1985). The first was used here to the extended area and the seeond to a typieal cut-road profile.
Figure 10 shows simplified approximation to planar failure in infinite slope surfaees and it ean be explained as follows: "If a typieal slice of depth z and width b, bounded by the vertieal lines IJ and KL, is isolated for attention, then from eonsideration of the equilibrium of the sliee must be equal, opposite and eollinear. From a eonsideration of the equilibrium of the slice by a vertical resolution of forees, the vertieal force aeross the base of the sliee must equal the weight W. This ean be resolved into its normal and tangential eomponents P and T respeetively. For a slice of unit thiekness in the strike direction:
W= ybz; P = ybzeos 1), ; T = ybzsin 1),
Since the length of the slide surfaee JK is bsec 1)" the average normal and shear stresses produeed by P and Tare:
t = yzsin¡3cosl3
In natural hillsides with steady state seepage parallel to the slope, and the groundwater level at distance mz above the slide surfaee, the porewater pressure u is ywmzcos213, and therefore:
FOS = [e' + (y - myw) zeos2fJ tan lÚ 1 I y z cosfJ sin fJ
14

Sessional Card 97/A00876
Where: e' = cohesion (kPa) rp = friction angle (degrees) y = unit weight soil (kN/m3
)
Yw = unit weight water (kN/m3)
m = water table/soil thickness (m) z = soil thickness (m) j3= slope angle (degrees)"(Graham, 1984)
Where there is no continuous water table with flow parallel to the soil surface, an alternative form of analyses must be used. The piezometric height (h) is used and is calculated by:
FOS = [c'lyz + (cos2 j3 -{Ywh I yz)) tan rp 1 I cosj3sin j3
Solution to the stability equation against changes in slope is shown in Figure 8. The model shows be very sensitive to changes in values of e' , m and Z. Changes in the FOS against changes in values of j3 , rp and y were insensitive. The value of m may be reduced improving soil drainage. C' may be modified only by increasing apparent cohesion through a denser plant root nelwork.
Factor of safety with values greater than 1, 1.3 and 2.5 were calculated with the grid maps of slope, soil depth and water table. IDRISI software was used for this purpose. Images are presented in Figures 12 and 13 for Iwo scenarios: befo re and after deforestation respectively. In the deforested scenario, cohesion was assumed to be 5kPa. Area changes when hypothetical deforestation occurs are presented in Table 3 and are illustrated in Figure 13. Grid lines have been included for geographical reference. The parameter values used in the analysis are listed in Table 2.
Table 1. Values of minimum overall safety factors (atter Selby, 1993).
Failure type Item Shearing Earthworks
Earth-retaining structure Foundation structures
Seepage Uplift, heave, slides Piping
F 1.3to1.5 1.5 to 2.0 2 to 3 1.5 to 2.5 3 to 5
15

Sessional Card 97/A00876
Iz
P
W
SUDE SURFACE
SLOPE B
POREWATER PRESSURE u = Yw.mzCOS2 B
W= 1bz P =.,t=os B T =1bzsin B
Figure 10 . Planar failure in infinite slopes (after Graham, 1984)
Factor of Safety against slope 18
16 • 14 I
12
'" 10
o .. 8
6
4
2
o o 10 20 30 40 SO 60
Slope angle Y = 28.183x'{)·93
Figure 11. Variation in factor of safety against dlfferent slope.
16

Sessional Card 97/A00876
Table 2. Parameters values used in the safety factor analyses.
Total Area Parameters Total Area (assuming Along
deforestation) Roads e' - cohesion (kPa) 10 5 10
<j> = friction angle (degrees) 20 20 20
Y = unit weight soil (kN/m3) 16 16 16
Yw = unit weight water (kN/m3) 9.8 9.8 9.8
m = water table/soil thickness Water table Watertable Watertable (m) map map map
z = soil thickness (m) Depth soil Depth soil map Depth soil map map
J3 = slope angle (degrees) Slope map Slope map Slope map
Table 3. Comparison of FOS areas between two scenarios: befo re and after deforestation.
Before Deforestation After Deforestation FOS Class Area (Ha) % Area (Ha) <1 616 1.0 11000 1 -1.3 4876 7.2 5494 <2.5 along roads 712 1.0 976 Stable area 61502 90.8 50236 Total 67706 100 67706
% 16.3 8.1 1.4
74.2 100
17
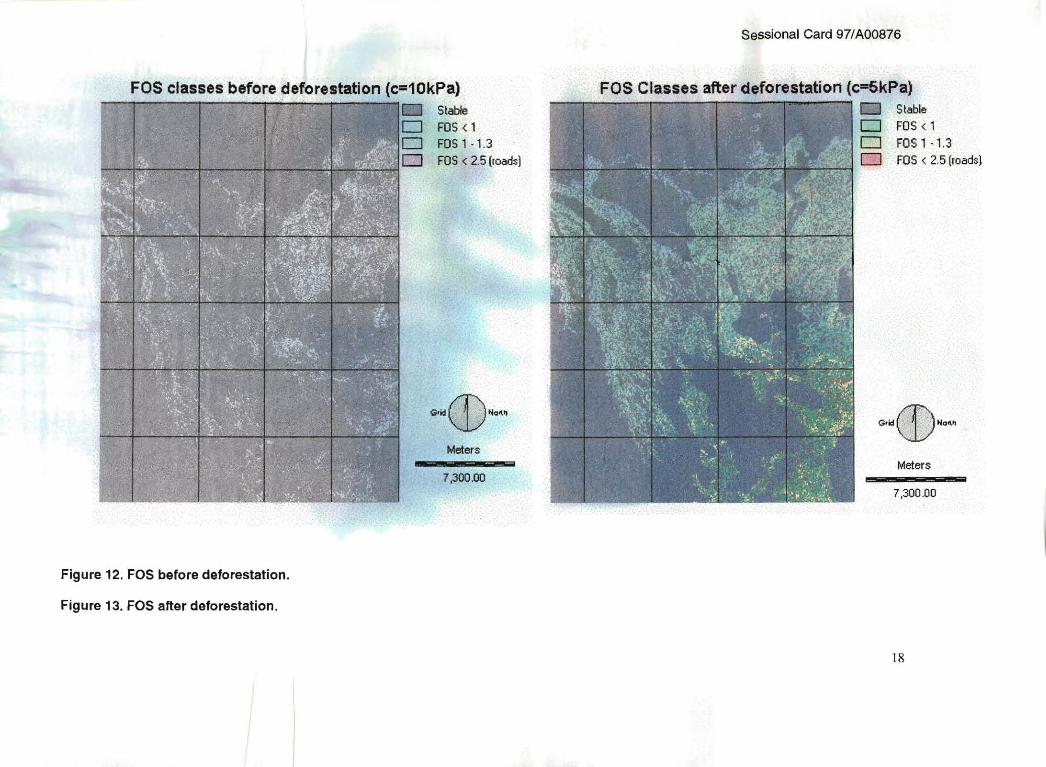
FOS classes before deforestation (c=10kPa) ;r o %~¡ ~ . ", Jhit .. . I !f ) I ¡;ap.L ami Stable
Figure 12. FOS before deforestation.
Figure 13. FOS alter deforestation.
FOS < 1 FOS 1 · l .3 FOS < 2.5 (.oad.)
"'~C])"~., Meters
7,300.00
Sessional Card 97/A00876
FOS Classes after deforestation (c=6kPa) ... ,. U b~ ;;: ,1}lS iQa Stable
D FO S < 1 D FOS 1·1 .3
"~;¡:, j D FOS < 2 5 (.oads)
G'~(]) "." Meters
7 .300.00
18

Sessional Card 97/A00876
"'"(]).o .. Meters
7,300.00
Figure 14. Risk areas incorporated after deforestation.
19

Sessional Card 97/A00876
8. DISCUSSION
In general, the study area is characterised by steep slopes as shown in Figure 6.The Ovejas River divides this area in Iwo different parts. In the West, the middle zone is characterised by a dissected landscape and short length slopes. In the East, the base of the central line of the Colombian Andes is characterised by long slopes and altitude ranges belween 1800 and 3000 m.a.s.l. The landscape in this area is more extensive compared to the western zone. It is also less homogeneous with soil depth of more than 1 m. 80th features make this area more susceptible to landslides, as is shown in Figure 12.
The Analysis shows that when the C' is reduced, after total deforestation, the area susceptible to landslides increased by 11 .000 ha. Figure 15 illustrate that the areas with FaS < 2.5 and belween 1 -1 .3 increased proportionately less than unstable area (with FaS < 1).
Changes in FOS areas after deforestation
12000 '.-_____________ --,
10000 '1-_ -1
8000 1-- -1
~ 6000
4000 -1-_ -1
2000 1-- -1
< 1 1 . 1.3 <2.5 along roads
Figure 15. Changes in FOS after deforestation.
20

Sessional Card 97/A00876
9. COMPLEMENTARY ANALYSES
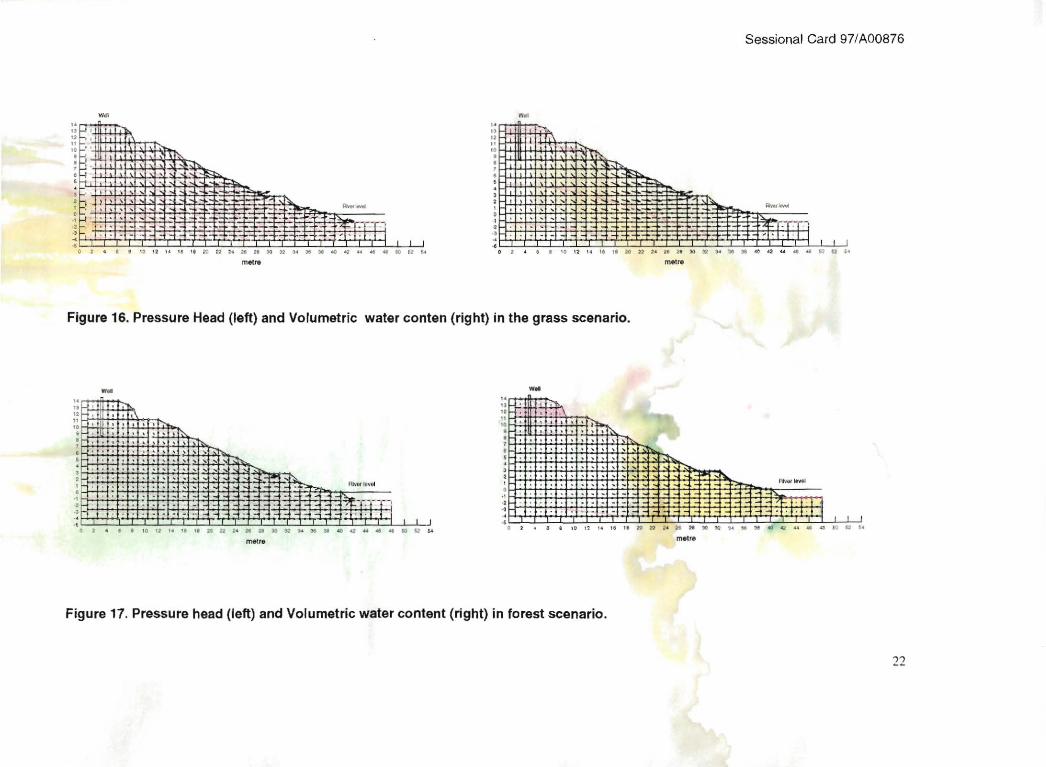
A complementary analysis was carried out on a hillside profile using the SEEP and SLOPE simulation models. They give (between other things), the different FOS according to the different profile characteristics and the slip surface under specific circumstances. Major simplifications were assumed here and the use of this was considered more an exercise to know the capabilities of this tool in the landslide assessment process rather than its application to the current case.
Figures 16 and 17 represents the pressure head and volumetric water content of an hypothetical profile under two scenarios of land use cover: (a) forest and (b) grass. (Steady state modelo So me difference can be evidenced between the two scenarios. Runoff will occur easily in the grass scenario comparing with fores!.
Figure 18 shows the framework of landslide analysis according to the Bishop's method and Figure 19 two slip surfaces for two different slip surfaces. The details of a grass slip section are represented in Figure 20 with the correspondent infonmation table.
In developing this exercise, it was evident that high quality of information is required. It is necessary too to make clear explanations of the model outputs. This method requires extensive understanding before it is to be used as a tool of management for the present scheme.
21
Sessional Card 97/A00876
• · •
w.
...... 'í.-r.-r .- '
o t • I • '0 ! ~ ,. •• " ~ ~ 2. • ~ ~ n ~ ~ • ~ <' ~ • ~ ~ » ~
m~"
" " " " " • • ,
.,
.,
w.
", ......
O ~ • •• ,Q '2" ,,\l ilG nt. aH:JO :I:! :.o ,.,. OO 4t .... ,.
.- ,
.. .. $O U ..
Figure 16. Pressure Head (Ieft) and Volumetric water conten (right) in the grass scenario.
" " " " •
., • • ., .,
w.
'1: , , ' ' -t-
. ,
, , . , . ,t, ~ L • •
....... ---_._--,
• • . 0 12 \. " !I ~ n ~ ,. • » :12 ~ ~ ,. ti) • ... .. .. • u ~
m<Mr.
w. " ., " " " • • , • I H . I ~ I ~ I ~ t • I ~ I _' I ~ I " - 1 :--1 ,,1 :-.'
., ., ., ., • •
~.-
• i • • ~'1'. '."XI:tlI: 1< "alO:I2,.. ... 'O .... .... !.OR$<
melle
Figure 17. Pressure head (Ieft) and Volumetric water content (right) in forestscenario.
22

•
e = .
= • = ¡ =.11
" , "
, ." . --- 1-~
""':h4 :H-1 AH-;
: • •
/ " -
• ,
- -
__ .-LLL_J --w¡
ojo, o •
o o
o o
o o o o /
o//; o~
., f /

Slice 2 Weight 46.246 Base Shear Force 30.98 Base Normal Force 40.418 Left Side Normal Force 9.1791 Right Side Normal Force 7.2217 Factor of Safety 1.199 Phi Angle 30 C (Strenglh) 10 C (Force) 30.805 Pore Water Pressure 9.5678 Pore Water Force 29.474 Pore Air Pressure O Pore Air Force O Slice Width 1.429 Mid-Heighl 1.9201 Base Length3.0805 Base Angle 62.362
~;ce 1 - B;shop U~ixxI
.. ,.. ~Il
7.11'17 -'\
~",/\~~
"" 1 Ske 12 - ¡¡¡,oop U,ti<>d
... ~ -~ / ' ''9
'''~
Figure 20. Slip surface sections representing the torces involved in the profile.
Sessional Card 97/A00876
f~(II',¡~tr l:~
e ",.!;i:i: " Pore '/ioI~ PrmJrc 9.56J8
(<<\01' lA 501ft)': 1.199 A; ,*~
C:~'fII9IIo}: la POIe wru.- ~fe: 11.145
24

Sessional Card 97/A00876
10. CONCLUSIONS
The method used here is simple and relatively fast and can be applied wherever digitised maps of soils and contour lines are available extending the use of many GIS databases.
Some assumptions considered in Ihe presenl analysis musl be laken inlo accounl befo re reaching a conclusion. The soil deplh, one of the mosl important factors in the slabilily analysis, is based on a soil general sludy wilh a resolulion of 1 :50000. A sample of no more Ihan 30 protiles was Ihe base of Ihal sludy. II makes new field observalions necessary lo adjusl Ihe currenl resulls. The inforrnalion used lo generale Ihe slope and waler lable was of 1 :25000 scale resolution. Nevertheless, Ihe delail is slill coarse for more specific calculations, e.g. quanlilative eslimale of Ihe amount of landslide debris or expecled landslide size and lenglh.
Users of Ihis report musl be aware Ihal allhough Ihis informalion provides subslanlial detail, il still has an inherenl level of inaccuracy. The assessmenl report is based on delailed secondary dala but limiled field observalions. Sub-surface and bedrock condilions are poorly known and could only be inferred from very limiled bibliographic references. Terrain slabilily inlerprelalions, sile prescriplions and miligalive recommendalions, under Ihese constrainls depend highly on Ihe local condilions and antecedenl landslides.
Future studies musl include observalions of visible nalural landslides in Ihe area or downslope stratigraphic evidence.
25

Sessional Card 97/A00876
11. BIBLlOGRAPHY
Beven, K, lamb, P, Quinn, R, Romanowicz, R and Freer, J. 1996 TOPMODEl. In Computer Models of Watershed Hydrology, Ed. Singh, V.P. Water Resources Publications.
Carrara, Alberto. 1995 Gis·Based Techniques For Mapping landslide Hazard CNR-CIOC, Bologna. IIdeis158.deis.unibo.iVgis/chaptO.htm
C.v.C. 1979 Estudio general de suelos de la parte alta de las cuencas de los rios Piendamo, Cajibio y Ovejas. - Departamento del Cauca. IGAC - Division Agrologica.
Graham, J. 1984. Slope Instability. Edited by Brunsden, D. and Prior, D.B. John Wiley and Sonso
Hartshorne, J. 1997. Assesing the influence of digital terrain model characteristics on tropical slope stability analysis. Innovation in GIS 4. Edited by Zarine Kemp. Taylor and Francis.
Ministry of Forests Act 1995 Hazard Assessment Keys for Evaluating Site Sensitivity to Soil Degrading Processes - Guidebook Forest Practices Code of British Columbia Act.
Selby, M.J. 1993. Hillslopes materials and Processes. Oxford University Press.
Sidle, R.C., Pearce, A.J. and O'loughlin. C.l. 1986 Hillslope Stability and land Use. American Geophysical Union - Water Resources Monograph 11 140p
Strong, Simon 1995 White Wash - Pablo Escobar and the Cocaine wars. MacMillan.
Tsukamoto, Y. and Minematsu, H. 1987. Evaluation of the effect of deforestation on slope stability and its application to watershed management. In Proceedings of the Vancouver Symposium, August 1987; Publ. No. 167, 181-189.
26

Sessional Card 97/A00876
Annex 1.
Ca/ambian earthquake emergency
SAIIC ([email protected]) Mon, 20Jun 199410:51:00PDT
EMERGENCYSUPPORTNEEDED Paez People Homeless, Injured, Orphaned, in Northern Colombia
Eighteen Indigenous communities disappeared beneath tons of mud and rack after a massive earthquake registering 6.3 on the Richter scale struck northern Colombia's remote Cauca region which is inhabited primarily by Indigenous people. The quake struck on June 6, with its epicentre close to the town of Torbio, releasing a series of debris slides and flooding of the Paez and Moras rivers. The list of dead, disappeared and injured grows daily. Indigenous organisations report that govemment aid to the survivors has been s/ow and total/y insufficient, and that many injured have not received treatment and that paople are dying from infection. Official calculations acknowledge 857 deaths and close to 15,000 injured, but there is no precise information on the number of victims or the conditions of the survivors. A leader of the Vitaco Indigenous reserve site of a major avalanche, claimed that at least half of the 4,000 indigenous inhabitants of this laca lit y had been buried. The National System for Prevention and Attention to Disasters announced that "given the magnitude af the quake' aftershocks, new rockslides could fal/ from the Nevado del Huila {mountains] which could cause increases in the Paez river's levels. " In turn this could result in the flooding of more communities. On the 9 of June, the affected communities were again panicked by tremors with intensities varying from 4. O to 4.8 on the Richter scale. Emergency aid provided by Colombians and international organisations has been essential in saving hundreds of unprotected indigenous people's lives. However, the Natianallndigenous Organisation of Colombia (ON/C) cal/s for individuals and agencies to take into account, nat only the immediate situation, but also the communities future. Of particular concern has been a campaign, promoted by portions of the national press, for the adoption of indigenous children by people outside the region. This is an attack on the autonomy for which indigenous communities have struggled for years. Additiona/ly, ON/C is concerned with the process of resettling those who have been displaced from their land, stating, "Iand isn't just a material element, but the essence of their cultures". Its recovery has cost many lives, as we/l as much pain and suffering. Now, the displaced people find themselves set back to step one. Delimitation of new indigenous reserves is urgently needed. lis a/so critical to urge governments who are supplying aid that these funds be channel/ed through indigenous organisations in a way that establishes a true nelwork of solidarity with the affected communities. The Colombian government has been slow to recognise Indigenous organisations jurisdiction within the disaster area.
ONIC's Executive Committee and the Regional Indigenous Council of Cauca (CRIC) is urgently international aid and solidarity. In order to send information regarding the possibilities for support in this state of emergency communicates with CRIC at Fax: 928-233893.
27

Annex 2.
Geomorphology Description of Ovejas watershed area.
Upper zone (>3000 m.a.s.l.)
GEOMORPHOLOGIC UNIT
Colluvial valleys and glacio-fluvial deposits in very wet ·Paramos'.
Wet and very wet Hillslopes.
LOCATION
Highest hill zones.
East hillslopes 01 the central line 01 Colombian Andes.
Footslopes in wet and very Fall laces 01 the hills. wet 'Paramos'.
Flat inter-mountain areas 01 Highest areas in the cold and wet micro-climate. Northeasl zone.
RELlEF
Flatness concave and abrupt watercourses.
Sharp and abrupt slopes in different angles.
Undulated and very undulated landscape with short and irregular slopes.
Undulated surfaces lo lightly inclined.
COMPOSITION
Organic maller accumulation and volcanic ashes.
Volcanic andesites racks covered by volcanic ashes.
Volcanic origin o
Bedrock 01 igneous and metamorphic materials.
Sessional Card 97/A00876
DRAINAGE
Low dense dendritic networl<.
Low dense dendritic network ..
EROSIVE PROCE
Fluvial and ge erosiono
Creep slopes. solifl and sheet erosiono
28
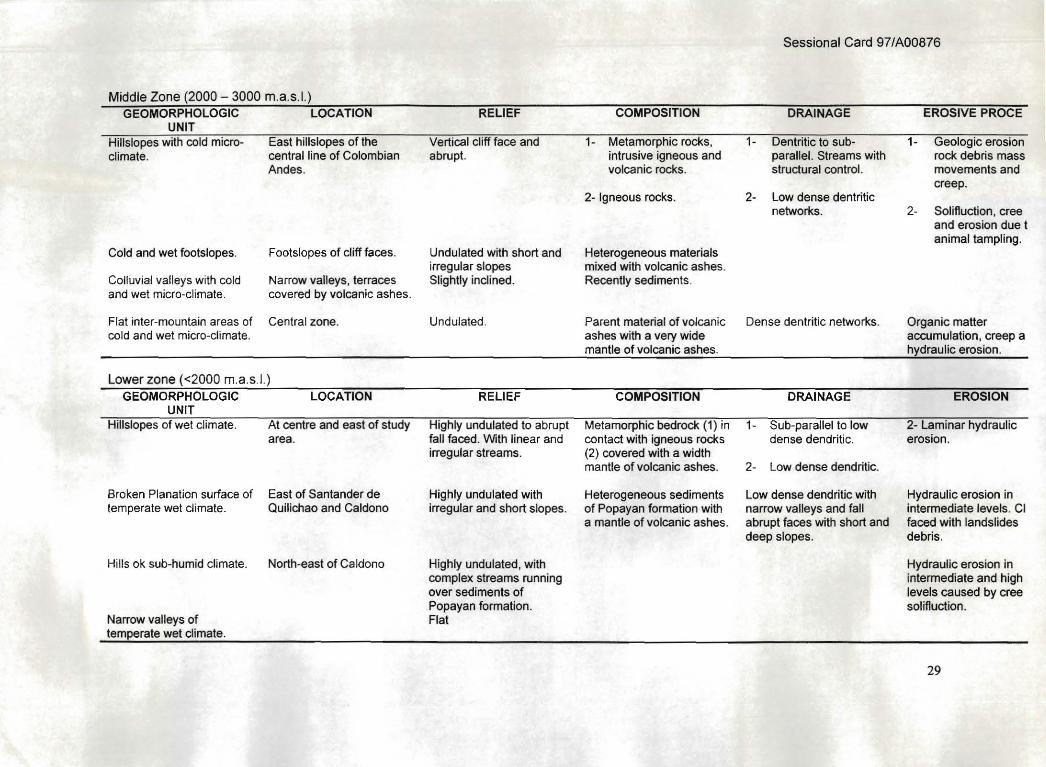
Middle Zone (2000 - 3000 m.a.s.l.) GEOMORPHOLOGIC LOCATION
UNIT Hillslopes with cold microclimate.
Cold and wet lootslopes.
Colluvial valleys with cold and wet micro-climate.
East hillslopes 01 the central line 01 Colombian Andes.
Footslopes 01 clil! laces.
Narrow valleys, terraces covered by volcanic ashes.
Flat inter-mountain areas of Central zone. cold and wet micro-climate.
Lower zone «2000 m.a.s.l.) GEOMORPHOLOGIC
UNIT HiIIslopes 01 wel climate.
Broken Planalion surface 01 lemperale wel climale.
LOCATION
At centre and easl 01 sludy area .
Easl 01 Santander de Quilichao and Caldono
Hills ok sub-hum id climate. North-east 01 Caldono
Narrow valleys 01 lemperale wel climate.
RELIEF
Vertical clil! lace and abrupt.
Undulated with short and irregular slopes Slightly inclined.
Undulated.
RELIEF
Highly undulaled lo abrupl lall laced. Wilh linear and irregular streams.
Highly undulaled with irregular and short slopes.
Highly undulated, with complex slreams running over sedimenls 01 Popayan lorrnation. Flat
Sessional Card 97/A00876
COMPOSITION
1- Metamorphic rocks, intrusive igneous and volcanic rocks.
2- Igneous rocks.
Heterogeneous material s mixed with volcanic ashes. Recently sediments .
DRAINAGE
1- Dentritic to subparallel. Streams with struclural control.
2- Low dense dentritic networks.
Parent material 01 volcanic Dense dentritic networks. ashes with a very wide mantle 01 volcanic ashes.
COMPOSITION
Metamorphic bedrock (1) in contact with igneous rocks (2) covered with a width mantle 01 volcanic ashes.
Heterogeneous sediments 01 Popayan torrnation with a mantle 01 volcanic ashes.
DRAINAGE
1- Sub-parallello low dense dendritic.
2- Low dense dendritic.
Low dense dendritic with narrow valleys and tall abrupt laces with short and deep slopes.
EROSIVE PROCE
1- Geologic erosion rock debris mass movements and creep.
2- SOlifluclion, cree and erosion due t animal tampling .
Organic matter accumulation, creep a hydraulic erosiono
EROSION
2- Laminar hydraulic erosiono
Hydraulic erosion in interrnediate levels. CI laced with landslides debris.
Hydraulic erosion in interrnediate and high levels caused by cree solifluclion.
29