rsa insurance group plc solvency and financial condition ...€¦ · | rsa insurance group plc |...
TRANSCRIPT

RSA Insurance Group plc
Solvency and Financial Condition Report
(SFCR)
2016
| RSA Insurance Group plc | Solvency and Financial Condition Report 2016
- 2 -
Contents
Introduction ................................................................................................................................................................. 3
Summary ...................................................................................................................................................................... 4
A. Business and Performance ................................................................................................................................... 8 A.1 Business .................................................................................................................................................... 8 A.2 Underwriting performance ....................................................................................................................... 16 A.3 Investment performance.......................................................................................................................... 27 A.4 Performance of other activities ................................................................................................................ 31 A.5 Any other information .............................................................................................................................. 34
B. System of Governance ........................................................................................................................................ 35 B.1 General information on the system of governance ................................................................................. 35 B.2 Fit and proper requirements .................................................................................................................... 41 B.3 Risk management system including the Own Risk and Solvency Assessment (ORSA) ........................ 43 B.4 Internal control system ............................................................................................................................ 48 B.5 Internal audit function .............................................................................................................................. 50 B.6 Actuarial function ..................................................................................................................................... 52 B.7 Outsourcing ............................................................................................................................................. 53 B.8 Any other information .............................................................................................................................. 54
C. Risk Profile............................................................................................................................................................ 55 C.1 Underwriting risk ..................................................................................................................................... 55 C.2 Market risk ............................................................................................................................................... 60 C.3 Credit risk ................................................................................................................................................ 63 C.4 Liquidity risk ............................................................................................................................................ 68 C.5 Operational risk ....................................................................................................................................... 71 C.6 Other material risks ................................................................................................................................. 76 C.7 Any other information .............................................................................................................................. 79
D. Valuation for Solvency Purposes ....................................................................................................................... 81 D.1 Assets...................................................................................................................................................... 81 D.2 Technical provisions ................................................................................................................................ 98 D.3 Other liabilities ....................................................................................................................................... 103 D.4 Alternative methods for valuation .......................................................................................................... 110 D.5 Any other information ............................................................................................................................ 112
E. Capital Management .......................................................................................................................................... 113 E.1 Own Funds ............................................................................................................................................ 113 E.2 Solvency Capital Requirement and Minimum Group Consolidated Capital Requirement .................... 125 E.3 Use of the duration-based equity risk sub-module in the calculation of the SCR ................................. 130 E.4 Differences between the Standard Formula and any Internal Model used ........................................... 131 E.5 Non-compliance with the MCR and non-compliance with the SCR ...................................................... 135 E.6 Any other information ............................................................................................................................ 136
Appendix 1. Group Subsidiaries, Associates and Branches
Appendix 2. Royal & Sun Alliance Insurance plc Solo SFCR Sections
Appendix 3. Royal & Sun Alliance Reinsurance Limited Solo SFCR Sections
Appendix 4. The Marine Insurance Company Limited Solo SFCR Sections
Appendix 5. Directors’ Statements in respect of the SFCR
Appendix 6. KPMG Audit Report
Appendix 7. Abbreviations and Terms used in this Report
Appendix 8. Quantitative Reporting Templates (QRTs)
| RSA Insurance Group plc | Solvency and Financial Condition Report 2016
- 3 -
RSA Insurance Group plc is a public limited company incorporated in England and Wales. The company, through its subsidiaries (together referred to in this report as “the Group” or “RSA”) provides personal and commercial insurance products to its global customer base, principally in the UK, Ireland, Middle East (together forming the “UK & International” operating segment), Scandinavia and Canada.
This document sets out the solvency and financial condition of the Group as at 31 December 2016, as required by Solvency II Regulations.
Those regulations prescribe the structure of this document and indicate the nature of the information that must be reported under a series of headings and sub-headings. Where information is not applicable to the Group, for completeness the report still contains the heading, but with an appropriate note.
Figures for the Group represent the consolidated position of the Group’s ultimate parent company, RSA Insurance Group plc, and all worldwide subsidiaries.
This Group Solvency and Financial Condition Report (SFCR) also covers information on the solvency and financial condition of three of the Group’s UK regulated insurance and reinsurance subsidiaries that are themselves subject to Solvency II. Therefore separate sub-headings for the Group and the three subsidiaries are used throughout this report. In addition, further information on the three subsidiaries is set out in Appendices 2, 3 and 4 to this report.
The three UK subsidiaries are:
• Royal & Sun Alliance Insurance plc (RSAI);
• Royal & Sun Alliance Reinsurance Limited (RSA Re); and
• The Marine Insurance Company Limited (MIC).
RSAI, RSA Re and MIC are legal entities meeting all relevant regulatory and governance requirements and their individual risk profile and capital requirements are monitored to ensure ongoing regulatory compliance. However, the Group does not manage each entity as an individual business and does not set individual business strategies. In light of this, it is important for the reader to understand that the focus of the Group SFCR is the activities of the RSA Group as a whole.
The Group’s other UK regulated insurance subsidiary, British Aviation Insurance Company Limited, is managed separately and is responsible for preparing and submitting its own SFCR.
This document makes reference to the Group’s 2016 Annual Report and Accounts which can be accessed from the Group’s website at https://www.rsagroup.com/investors/reports/annual-report-2016/. Information in the Annual Report and Accounts is prepared according to statutory accounting rules and the management accounting practices of the Group; whereas information in this Group SFCR is governed by Solvency II rules. Important differences include valuation methodologies for assets, technical provisions and other liabilities, definitions of asset and liability categories, definitions of underwriting lines of business and the presentation of certain information by geographic region versus legal entity. Therefore the numbers, including financial, in this Group SFCR will not always correspond to the numbers in the Annual Report and Accounts.
The Group has four non-UK insurance subsidiaries that are subject to Solvency II and these companies publish their own SFCRs:
• Codan Forsikring A/S;
• Forsikringsselskabet Privatsikring A/S;
• Holmia Livforsakring AB; and
• RSA Insurance Ireland DAC.
As a primarily general insurance business, the Group does not place any reliance on transitional measures for technical provisions as referred to in Articles 308c and 308d of Directive 2009/138/EC, or on measures such as the matching adjustment and the volatility adjustment as referred to in Articles 77b and 77d respectively of Directive 2009/138/EC. Consequently there will be no information regarding these measures in this report. The only Solvency II transitional measure that is applied is with respect to the Group’s debt arrangements as referred to in Article 308b(9) of Directive 2009/138/EC.

| RSA Insurance Group plc | Solvency and Financial Condition Report 2016
- 4 -
The Group is a strong and focused international insurer. It has complementary leadership positions in the major general insurance markets of the UK, Scandinavia and Canada. It has valuable franchise strength and balance between commercial and personal customers and across product lines across these three regions.
The Group started a strategic restructuring and turnaround programme three years ago. Since then the Group has accomplished more than was originally targeted:
• The Group is now focused on its core three regions having completed the sale of its Latin American and Russian businesses in 2016. Evidence is mounting that the concentration of management focus and resource onto the Group’s core businesses will be a key enabler of future performance gains. In total 20 divestments have been made to achieve this focus raising £1.2bn.
• The Group’s balance sheet is transformed. Credit ratings are restored; regulatory capital and related capital ratios are at the upper end of the Group’s target ranges.
• Performance is transformed. 2016 saw record underwriting profits of £380m compared to a like-for-like 2013 profit of £1m. Underlying return on tangible equity of 14.2% in 2016 is now in the upper part of the 12-15% target range originally set. Dividends are restored and growing.
The quality of the foundations laid during this period, underpinned by the franchise strengths of the Group’s 300-year history, gave the Group confidence at the start of 2016 to lay out new ambitions for the future. The Group now aspires to move its performance levels towards best-in-class for its markets, for customers and shareholders. 2016 performance, delivering a record combined operating ratio (COR) for the Group of 94.2% provides an encouraging down payment on this aspiration.
Business performance
Underwriting result
Underwriting profits rose 73% to a record £380m. This represents a combined ratio of 94.2%, also a record for the Group. Reserve margins were strengthened to 5.5% (2015: 5%), building some additional cushion against future challenges. The current year underwriting profits were a record £271m, up 110%.
Investment result
The investment result was £298m (2015: £322m, or £335m at constant foreign exchange rates) with investment income of £369m (2015: £403m). Investment income is down 8% on the prior year, primarily reflecting the impact of the Latin American disposal and the continued low bond yield environment but this is partly offset by the benefit from the weakening of Sterling. The average book yield across the Group’s major bond portfolios was down slightly to 2.5% (2015: 2.8%).
Regional overview
Each region hit or exceeded its operating plan targets. Scandinavia supplied 47% of operating profits with a COR of 86.2%. The UK recorded its first significant underwriting profit in a decade (£123m). Canada also did well (94.9% COR), despite natural catastrophes in the region.
In Ireland, despite dramatic improvement to breakeven on current year operating profit, further prior year reserve strengthening was required, taking the Irish COR to 116.2%.
Operating Profit
The Group’s operating profit was £655m, up 25% (2015: £523m): Scandinavia £311m; Canada £140m; UK £259m.
The Group had a non-capital charge of £204m for disposal of legacy liabilities (see the Capital Position section below) and other non-operating charges of £261m (approximately 90% of which were non-capital in nature). The post tax statutory profit was £20m, reflecting these non-capital accounting charges (2015: £244m which included the benefit from disposal gains).

| RSA Insurance Group plc | Solvency and Financial Condition Report 2016
- 5 -
Further Details
For further details of the Group’s business and performance, see Section A of the report.
Capital Position
Solvency II position Requirement
(SCR) £bn
Eligible Own Funds
£bn
Surplus
£bn
Coverage
%
31 December 2016 1.8 2.9 1.1 158
The Group’s Coverage Ratio (its eligible own funds divided by its Solvency Capital Requirement (SCR) rose 15 percentage points to 158% (taking account of the proposed final dividend) which is very near the top of the Group’s target range of 130% to 160%.
The key drivers of the 15-point increase in the coverage ratio were:
• Funds from the Group’s profits;
• Completion of the Latin American and Russian disposals;
• Reduction in SCR due to pension de-risking and improved performance;
• Reduction due to restructuring costs and other non-operating charges;
• Reduction due to 2016 interim and proposed final dividends;
• Reduction due to decrease in value of bonds as they approach maturity (pull-to-par); and
• Market movements accounted for a small reduction (mainly due to narrower credit spreads in the bond market), but partly offset by the effect of the weaker pound on the Group’s non-UK profits and assets.
In February 2017, the Group signed contracts to dispose of £834m of UK legacy insurance liabilities (net undiscounted best estimate reserves) to Enstar Group Limited (“Enstar”).
The transaction initially takes the form of a reinsurance agreement, effective from 31 December 2016, which effectively removes these liabilities from the Group’s balance sheet, to be followed by completion of a subsequent legal transfer of the business. The agreement covers all related claims, net of reinsurance, payable on or after 31 December 2016.
The transaction improves the Group SCR coverage ratio by 18 percentage points to 176% and the minimum consolidated group SCR (MSCR) coverage ratio by 34 percentage points to 177%. A modest additional benefit is expected on completion of the legal transfer of the business.
This transaction was completed after 31 December 2016 and as such is not reflected in the tables provided in this report nor the associated Quantitative Reporting Templates (QRTs) in Appendix 8.
See Section E of the report for further details regarding the Group’s capital position, capital requirements and own funds items.

| RSA Insurance Group plc | Solvency and Financial Condition Report 2016
- 6 -
Risk profile
A summary of the changes to the risk profile over the year represented by the percentage that each risk driver contributes to the Group’s SCR is shown below (the 2016 chart excludes the legacy liabilities sold to Enstar in February 2017).
Note that:
• The SCR reduction is driven by pension de-risking and improved performance;
• The underwriting risk driver (U/W) has reduced due to improved underwriting performance;
• The Group has maintained a stable reinsurance programme with no significant changes from the previous year;
• The legacy risk was well diversified - therefore following disposal its share of risk is shared across the other risk drivers;
• The Group’s legacy business disposal in February 2017 reduces the Group’s liability profile in terms of duration.
On 27 February 2017 the UK Lord Chancellor announced a change to the discount rate for calculating personal injury damages awards in the UK. Given the nature of the Group’s international business and the range of products written, the impact of the change on the Group’s 31 December 2016 balance sheet and capital ratios is not material.
The Group has been actively monitoring the impact of the UK European Union (EU) referendum result and the potential impact on its business. The vast majority of business written within the non-UK countries of the EU is written by subsidiaries domiciled in these countries. Plans are being evaluated for creating an appropriate structure for the remaining business written through branches of the Group’s main UK entity, RSAI.
See Section C of the report for further details regarding the Group’s risk profile.

| RSA Insurance Group plc | Solvency and Financial Condition Report 2016
- 7 -
Capital activity
On 12 July 2016 the Group completed the retirement of £200m (nominal value) of subordinated debt (Tier 2 notes with 9.4% coupon).
Since year end, the Group has further improved the quality of its capital mix and reduced the cost of debt by undertaking the following debt refinancing activity:
• On 27 March 2017 the Group successfully issued Restricted Tier 1 subordinated debt capital, comprising a 2,500m Swedish Krona tranche and a Danish Krone 650m tranche with pricing of 5.25% and 4.85% above local interbank rates respectively (total issuance of c£300m with a blended coupon of c.4.7%).
• On 31 March 2017 the Group completed the retirement of subordinated debt totalling £592m (nominal value) comprising £245m Tier 2 (notes with 9.4% coupon) and £347m Restricted Tier 1 (notes with 6.7% coupon).
The net impact of the above debt actions is to reduce the Group SCR coverage ratio to 167% (including the benefit of the UK legacy disposal noted earlier). The above debt actions are not material to the MSCR coverage.
A final proposed dividend of 11p/share (£112m) is included within the year-end Group capital positions and will bring the total dividend for 2016 to 16p (up 52% on 2015), representing a 41% pay out of the underlying earnings per share.
Governance
The Group maintains a stable system of governance and has not experienced any material changes in how the business has been operated over the course of 2016. More detail is provided in Section B.

| RSA Insurance Group plc | Solvency and Financial Condition Report 2016
- 8 -
This section of the report provides information about the business and performance of the Group, RSAI, RSA Re and MIC, covering in particular the performance from underwriting and investment activities. Background information on the business of RSAI, RSA Re and MIC can be found in Appendices 2, 3 and 4 respectively.
Performance figures in Section A have been prepared in accordance with the same accounting standard used for each entity’s statutory financial statements. These are: International Financial Reporting Standards (IFRS) as endorsed by the EU for the Group; and United Kingdom Generally Accepted Accounting Practice (UK GAAP) for RSAI, RSA Re and MIC.
A.1 Business
A.1.1 Company Name & Legal Form
RSA Insurance Group plc is a public limited company incorporated in England and Wales. It is the ultimate parent company of the Group.
The three specific UK subsidiaries covered by this SFCR are:
• Royal & Sun Alliance Insurance plc (RSAI), a public limited company incorporated in England and Wales;
• Royal & Sun Alliance Reinsurance Limited (RSA Re), a private limited company incorporated in England and Wales; and
• The Marine Insurance Company Limited (MIC), a private limited company incorporated in England and Wales.
A.1.2 Supervisory Authority
The Prudential Regulation Authority (PRA) is the authority responsible for prudential supervision of the UK insurance and reinsurance undertakings and the Group. The contact details of the PRA are as follows:
20 Moorgate London EC2R 6DA
Telephone: +44 (0)20 3461 7019
Website: http://www.bankofengland.co.uk/pra/Pages/default.aspx
A.1.3 External Auditor
The external auditor of RSA Insurance Group plc, RSAI, RSA Re and MIC is:
KPMG LLP 15 Canada Square Canary Wharf London E14 5HQ
Telephone: 020 7311 1000

| RSA Insurance Group plc | Solvency and Financial Condition Report 2016
- 9 -
A.1.4 Holders of Qualifying Holdings
RSA Insurance Group plc
The following information shows the qualifying holdings (10% or above) as disclosed to the company in accordance with the Disclosure and Transparency Rules as at 31 December 2016. There are no shareholder agreements in place with the company that may restrict the transfer of securities or voting rights.
Number of % Total ordinary shares voting rights Nature of Holding
Cevian Capital II GP Limited 133,068,287 13.12% ordinary shares, indirect and contracts for difference
Royal & Sun Alliance Insurance plc
The sole shareholder is Royal Insurance Holdings Limited.
Royal & Sun Alliance Reinsurance Limited
The sole shareholder is Royal & Sun Alliance Insurance plc.
The Marine Insurance Company Limited
The sole shareholder is Royal & Sun Alliance Insurance plc.
A.1.5 Position within the Group Legal Structure
RSA Insurance Group plc
This is the ultimate parent company of the Group and is listed on the London Stock Exchange.
Royal & Sun Alliance Insurance plc
The Company's immediate parent company is Royal Insurance Holdings Limited, a company incorporated in England and Wales. The Company's ultimate parent and controlling party is RSA Insurance Group plc, which is registered in England and Wales.
Royal & Sun Alliance Reinsurance Limited
The Company’s immediate parent company is Royal & Sun Alliance Insurance plc, a company incorporated in the England and Wales. The Company’s ultimate parent company and controlling party is RSA Insurance Group plc, which is registered in England and Wales.
The Marine Insurance Company Limited
The Company’s immediate parent company is Royal & Sun Alliance Insurance plc, a company incorporated in the England and Wales. The Company’s ultimate parent company and controlling party is RSA Insurance Group plc, which is registered in England and Wales.

| RSA Insurance Group plc | Solvency and Financial Condition Report 2016
- 10 -
A.1.5.1 Group Structure
See Section A.1.7 for the simplified Group Structure, Appendix 1 for a list of all subsidiaries, associates and branches and Appendix 8, QRT S.32.01.22 (Undertakings in the scope of the group) for further details of each subsidiary and associate.
See Section B.1 for details of the Group’s governance structure.
Organisational structure
Since 2014 the Group has been organised into operating segments on the basis of core and non-core businesses, following a strategic re-focusing and subsequent disposal programme that materially completed in 2016.
The Group has operating segments in the established mature markets of Scandinavia, Canada, and UK & International (which comprises the UK, Ireland and the Middle East), with each operating segment managed by a member of the Group Executive Committee who is directly accountable to the Group Chief Executive Officer and the Board of Directors (who are combined to be the chief operating decision maker).
The UK is the Group’s country of domicile and one of its principal markets.
The UK & International segment was formed at the end of 2016 and includes the Group’s operations in the UK, Ireland and the Middle East.

| RSA Insurance Group plc | Solvency and Financial Condition Report 2016
- 11 -
A.1.6 Material Related Undertakings
See Appendix 1 for a list of all subsidiaries and associates of the Group and RSAI (including % ownership) and a list of all branches of each subsidiary, including RSAI, RSA Re and MIC. RSA Re and MIC have no subsidiaries.
Material related undertakings of the Group and RSAI are listed below (no branches are material) – all are companies limited by shares:
Country Name
Bahrain Royal & Sun Alliance Insurance (Middle East) BSC (c) Canada Ascentus Insurance Ltd. Canada Canadian Northern Shield Insurance Company Canada Quebec Assurance Company Canada Roins Financial Services Limited Canada Roins Holding Limited Canada Royal & Sun Alliance Insurance Company of Canada Canada The Johnson Corporation Canada Unifund Assurance Company Canada Western Assurance Company Denmark Codan A/S Denmark Codan Forsikring A/S Denmark Forsikringsselskabet Privatsikring A/S Guernsey Insurance Corporation of the Channel Islands Limited Ireland RSA Insurance Ireland DAC Isle of Man Tower Insurance Company Limited Oman Al Ahlia Insurance Company SAOC Saudi Arabia Al Alamiya for Cooperative Insurance Company Sweden Holmia Livforsakring AB United Kingdom British Aviation Insurance Company Limited United Kingdom Royal & Sun Alliance Insurance plc United Kingdom Royal & Sun Alliance Reinsurance Limited United Kingdom Royal International Insurance Holdings Limited United Kingdom RSA Accident Repairs Limited United Kingdom RSA Finance United Kingdom RSA Overseas (Netherlands) B.V. United Kingdom RSA Overseas Holdings (UK) Limited United Kingdom RSA Overseas Holdings B.V. United Kingdom Sun Alliance and London Insurance plc United Kingdom Sun Alliance Finance B.V. United Kingdom Sun Alliance Insurance Overseas Limited United Kingdom The Globe Insurance Company Limited United Kingdom The Marine Insurance Company Limited United Kingdom Royal Insurance Holdings Limited

| RSA Insurance Group plc | Solvency and Financial Condition Report 2016
- 12 -
A.1.7 Simplified Group Structure
The Group is organised into regional operating segments with businesses in Scandinavia, Canada, UK, Ireland and the Middle East.
A.1.8 Business Lines and Geographical Areas
The Group’s material lines of business and material geographical areas where it has carried out business during the year are detailed in the table below:
The Group RSAI RSA Re MIC
Geographic regions Scandinavia
Canada UK & International
Line of businesses – non-life
Medical expense Income protection Motor vehicle liability Other motor Marine, Aviation and Transport Fire and damage to property General Liability

| RSA Insurance Group plc | Solvency and Financial Condition Report 2016
- 13 -
A.1.9 Significant Events
The Group and Royal & Sun Alliance Insurance plc
From ‘Turnaround’ towards ‘Outperformance’
The Group started a strategic restructuring and turnaround programme three years ago. Since then the Group has accomplished more than was originally targeted:
• The Group is now focused on its core three regions having completed the sale of its Latin American and Russian businesses in 2016. Evidence is mounting that the concentration of management focus and resource onto the Group’s core businesses will be a key enabler of future performance gains. In total 20 divestments have been made to achieve this focus raising £1.2bn.
• The Group’s balance sheet is transformed. Credit ratings are restored; regulatory capital and related capital ratios are at the upper end of the Group’s target ranges.
• Performance is transformed. 2016 saw record underwriting profits of £380m compared to a like-for-like 2013 profit of £1m. Underlying return on tangible equity of 14.2% in 2016 is now in the upper part of the 12-15% target range originally set. Dividends are restored and growing.
The quality of the foundations laid during this period, underpinned by the franchise strengths of the Group’s 300 year history, gave the Group confidence at the start of 2016 to lay out new ambitions for the future. The Group now aspires to move its performance levels towards best-in-class for its markets, for customers and shareholders. 2016 performance, delivering a record COR for the Group of 94.2% provides an encouraging down payment on this aspiration.
Strategy & Focus
The Group is a strong and focused international insurer. The Group has complementary leadership positions in the major general insurance markets of the UK, Scandinavia and Canada. The Group has valuable franchise strength and balance across these regions, between commercial and personal customers and across product lines.
The history, dynamics and structure of the Group’s markets show that focused regional market leaders can both successfully sustain customer appeal (market position) and achieve superior shareholder performance. This is the course the Group has set out upon.
External Conditions
The general insurance markets the Group operates in are relatively mature, consolidated and stable. Attractive performance is possible despite slow growth, economic and competitive challenges. It requires intense operational focus within a disciplined strategic framework.
Financial markets are also important for all insurers. Low interest rates hurt. But they force a greater concentration on the core business of underwriting which can yield significant improvements. 2016 is the first year for the Group where underwriting profits have grown to exceed investment income, a trend the Group expects to continue.
2016 was a year of volatile financial markets, testing both capital resilience and profits. Bond yields at year end were below those of a year ago in the Group’s major markets. Credit spreads were narrower (hurting UK pension accounting). But conversely, a significant Brexit induced weakening of Sterling since June helps the Group, as c.70% of its operating profit is earned outside the UK.
2016 Actions
Strategic Focus: The Group’s 3 year 'focus' programme was completed with the sale of businesses in Latin America and Russia which closed in 2016. Evidence is mounting that the concentration of management focus and resource onto the Group’s core businesses will be a key enabler of future performance gains.
Financial Strength: the Group’s ‘A’ grade credit ratings are strong and stable. The Group’s Solvency II capital ratio has been improved from 143% (2015) to 158% at the end of 2016 (target range 130-160%), despite retirement of £200m of high cost

| RSA Insurance Group plc | Solvency and Financial Condition Report 2016
- 14 -
subordinated debt. Risk reduction in the Group’s UK pension scheme assets has also been successfully completed. And 2016 saw testing financial and insurance event volatility which the Group withstood well. Since year end the Group’s disposal of UK Legacy liabilities has given it an important boost to capital and enabled it to improve capital quality still further.
Business Improvement: the Group’s goal is to systematically and determinedly hunt down performance improvement opportunities across the business. The Group has taken its performance from below that of competitors in 2013 and prior, to 'in the pack'. All efforts are now concentrated on moving towards 'best in class' ambitions. The plan is substantially the same across the Group’s businesses. Focus on improving service to customers, on underwriting and on costs.
Across the Group, the many customer initiatives have sustained retention rates and above average satisfaction measures. Core premiums were up in 2016 but on lower policy volumes. The Group is determined to compete on quality, with competitive but profitable pricing. The Group will not chase unprofitable growth. However, there are encouraging signs that continuing underwriting and service capability improvements will restore modest volume growth and the Group hopes to deliver good evidence of that in 2017.
The Group’s most important performance lever is its underwriting judgement. Across the Group portfolio disciplines, skills enhancement, data and model improvement and indemnity initiatives are producing strong benefits. Attritional loss ratios for the Core Group improved 1.4 points on 2015 and are 4 points better than those of 2013. The Group targets further improvement still.
Cost efficiency is the other crucial performance ingredient. The Group has achieved c.£290m of gross annual savings (vs original 2016 target of >£180m). The Group believes it can raise its savings target for the third time and now expect to deliver over £400m p.a. by 2018. Headcount has reduced 19% since 2013 in the Group’s core businesses as its people have become more productive. The Group expects to enhance their productivity further with continued business re-engineering, enabled by technology and infrastructure renewal programmes covering digitisation, robotics, infrastructure replacement and software upgrades which continue successfully in each region.
Royal & Sun Alliance Reinsurance Limited
Nothing to report.
The Marine Insurance Company Limited
Nothing to report.
A.1.10 Group Operations & Transactions within the Group
See Section D.5.1 for information on the scope and method of group consolidation.
Significant intra-group transactions include;
Dividends
During the 2016 financial year:
• Sun Alliance Insurance UK Limited (a UK subsidiary) paid a dividend of £519.5m to Sun Alliance and London Insurance plc (a UK subsidiary);
• Codan Forsikring A/S (a Danish subsidiary) paid a dividend of £285.4m to Codan A/S (a Danish subsidiary);
• Codan A/S paid a dividend of £269.2m to RSA Overseas Holdings B.V (a Dutch subsidiary);
• RSA Overseas Holdings B.V. paid a dividend of £247.3m to RSA Overseas (Netherlands) B.V. (a Dutch subsidiary);
• RSA Overseas (Netherlands) B.V. paid a dividend of £247.3m to The Globe Insurance Company Limited (a UK subsidiary);
• The Globe Insurance Company Limited paid a dividend of £247.3m to Royal International Insurance Holdings Limited (a UK subsidiary);

| RSA Insurance Group plc | Solvency and Financial Condition Report 2016
- 15 -
• Royal International Insurance Holdings Limited paid a dividend of £247.3m to Royal & Sun Alliance Insurance plc;
• Royal & Sun Alliance Insurance plc paid a dividend of £718.9m to Royal Insurance Holdings Limited; and
• Royal Insurance Holdings Limited paid a dividend of £378.5m to RSA Insurance Group plc.
Dividends are paid when voted for by a company’s shareholders.
Intercompany loans
A number of statutory entities within the Group have entered into intercompany loan agreements as part of the Group’s cash management strategy or for other general corporate purposes.
Derivatives
Royal & Sun Alliance Insurance plc entered into significant derivative transactions with RSA Overseas Holdings BV and Codan A/S during the 2016 financial year. Derivatives entered into are for the purpose of reducing foreign exchange risk in net investments in certain overseas subsidiaries.
Reinsurance Excess of Loss and Quota share treaties
Royal & Sun Alliance Reinsurance Limited provides a reinsurance function for the international insurance activities of the Group offices.
Royal & Sun Alliance Insurance plc has provided capital support to RSA Insurance Ireland DAC via an Adverse Development Cover for reserves existing up to end-2014 and a Quota Share for 2015 business onwards. The Adverse Development Cover has an attachment point of €400m and a limit of €325m for a premium of €250m, with pricing support provided by Aon.
Expense Reimbursement
Royal & Sun Alliance Insurance plc reimbursed RSA Accident Repairs Limited £199m for motor claim expenses incurred during the period.

| RSA Insurance Group plc | Solvency and Financial Condition Report 2016
- 16 -
A.2 Underwriting performance
Core premium income was up 6%, but adjusting for foreign exchange and price changes, volumes were modestly down. Premium income was in line with RSA’s plan on that basis. Underwriting profits, the key test of performance, rose 73% to a record £380m. This represents a combined ratio of 94.2%, also a record for RSA. Reserve margins were strengthened to 5.5% (2015: 5%), building some additional cushion against future challenges. Underlying quality of results was excellent. Current year underwriting profits were a record £271m, up 110%, despite volatile weather/large loss items being 0.3 points higher than 2015 at Core Group level. Particularly pleasing was the spread of performance. Each region hit or exceeded its operating plan targets.
The Group
Management Report - Segmental Income Statement Management Basis – 12 months ended 31 December 2016
Scandinavia Canada UK &
International Central
functions Core Total 'non-
core' Group FY
2016 £m £m £m £m £m £m £m
Net Written Premiums 1,721 1,443 3,081 36 6,281 127 6,408
Net Earned Premiums 1,735 1,454 3,173 (22) 6,340 188 6,528
Net Incurred Claims (1,181) (948) (1,998) 18 (4,109) (106) (4,215)
Commissions (60) (191) (636) - (887) (54) (941)
Operating expenses (255) (241) (451) (5) (952) (40) (992)
Underwriting result 239 74 88 (9) 392 (12) 380
Investment income 98 71 161 - 330 39 369
Investment expenses (3) (2) (7) - (12) - (12)
Unwind of discount (23) (3) (5) - (31) (28) (59)
Investment result 72 66 149 - 287 11 298
Central expenses - - - (23) (23) - (23)
Operating result 311 140 237 (32) 656 (1) 655
Interest (99)
Adjustment for Legacy sale (204)
Other non-operating charges (261)
Profit before tax 91
Tax (71)
Profit after tax 20
Underlying profit before tax 556
Loss ratio (%) 68.0 65.2 63.0 - 64.8 - 64.6
Weather loss ratio 0.4 5.7 2.7 - 2.6 - 2.5
Large loss ratio 5.0 6.4 12.1 - 9.2 - 8.9
Current year attritional loss ratio 64.2 57.8 49.0 - 55.2 - 55.2
Prior year effect on loss ratio (1.6) (4.7) (0.8) - (2.2) - (2.0)
Commission ratio (%) 3.4 13.1 20.0 - 14.0 - 14.4
Expense ratio (%) 14.8 16.6 14.2 - 15.0 - 15.2
Combined ratio (%) 86.2 94.9 97.2 - 93.8 - 94.2

| RSA Insurance Group plc | Solvency and Financial Condition Report 2016
- 17 -
Underwriting Result
Group underwriting profit of £380m, up 73% year-on-year (2015: £220m, or £232m at constant fx) and comprised £392m from core operations.
Total UW result Current Year UW Prior Year UW
£m £m £m
Scandinavia 239 213 26 Canada 74 6 68 UK & international 88 82 6
Of which: UK 123 72 51 Group Re (9) (28) 19 Total Core 392 273 119
Non-core & discontinued (12) (2) (10) Total Group 380 271 109
Current year profit of £271m (2015: £129m):
• The Core Group attritional loss ratio was 55.2% which showed a 1.4 point improvement from 2015. There were good improvements across all key regions with Canada 2.5 points better (although c.1 point of the improvement is due to better ‘attritional’ weather in 2016 v 2015), UK 1.8 points better and Scandinavia 0.3 points better. RSA targets further improvements still.
• Total Group weather costs were £166m or 2.5% of net earned premiums (2015: £219m; 3.1%). Core Group weather costs were £165m representing a weather loss ratio of 2.6% (2015: £194m or 3.2%; five year average: 3.1%).
• Included within this are net claims costs of £42m for the Alberta wildfires in May, £33m for the UK & European floods in June, and £26m for Hurricane Matthew in October.
• Total Group large losses were £583m or 8.9% of net earned premiums (2015: £556m; 7.9%). Core Group large losses were £582m or 9.2% of premiums (2015: £508m or 8.3%), which was marginally above the five year average of 8.5%. Lower than trend levels in Scandinavia and UK were more than offset by more elevated levels in Canada and Ireland.
Prior year profit was £109m, with prior year development providing a 2.0 point benefit to the Group combined ratio. This included positive development from the UK, Canada, and Scandinavia and negative results in Ireland.
Pleasingly, current year underwriting results in Ireland improved to a small profit from a £29m loss in 2015, on the back of strong pricing action, attritional loss ratio improvement and expense reduction. However, Irish prior year reserves required further strengthening of £50m, principally for accident years 2014/15 where trend data was hard to identify due to the remediation actions RSA has had to take post 2013. RSA targets a return to profitability overall in Ireland in 2017.
The Group assessment of the margin in reserves for the Group (the difference between actuarial indication and the booked reserves in the financial statements) is 5.5% of booked claims reserves (2015: 5.0%).
Underwriting operating expenses
The overall Group underwriting expense ratio improved 0.5 points to 15.2% in 2016 and at a Core Group level was 0.5 points better. There were improvements of 1.6 points in Scandinavia and 0.2 points in Canada, whilst the UK ratio was 0.3 points higher. RSA expects continued improvements in the expense ratio over the coming years.
Commissions
The Group commission ratio in 2016 of 14.4% was down from 15.9% in 2015, driven mainly by the disposal of Latin America which carried a higher commission ratio. The Core Group commission ratio 14.0% was down 0.3 points (2015: 14.3%). RSA expects the Core Group’s commission ratio to be broadly stable in 2017.

| RSA Insurance Group plc | Solvency and Financial Condition Report 2016
- 18 -
Scandinavia (Management Basis)
Net Written Premium Underwriting Result
£m £m
Split by country
Sweden 990 174
Denmark 588 63
Norway 143 2 Total Scandinavia 1,721 239 Split by class
Household 336 46
Personal Motor 332 92
Personal Accident & Other 313 37 Total Scandinavia Personal 981 175 Property 295 12
Liability 151 32
Commercial Motor 202 14
Marine & Other 92 6 Total Scandinavia Commercial 740 64
Total Scandinavia 1,721 239
Operating Ratios Claims Commission Op Expenses Combined
% % % %
Household 86.2
Personal Motor 72.2
Personal Accident & Other 88.1 Total Scandinavia Personal 66.9 2.9 12.2 82.0 Property 96.2
Liability 76.0
Commercial Motor 93.3
Marine & Other 94.3 Total Scandinavia Commercial 69.5 4.1 18.0 91.6
Total Scandinavia 68.0 3.4 14.8 86.2 Of which: 5yr ave Weather loss ratio 0.4 1.4 Large loss ratio 5.0 5.6 Current year attritional loss ratio 64.2 Prior year effect on loss ratio (1.6)

| RSA Insurance Group plc | Solvency and Financial Condition Report 2016
- 19 -
In 2016 Scandinavia delivered a 130% increase in underwriting profits (at constant fx) driven by strong current year profitability, with record current year profits in Sweden.
The Group has also made good progress with its customer agenda. In Denmark the Group has seen positive development in customer ‘trust’ scores, and increased engagement with lower ‘trust’ score customers to gain fresh insights. RSA has ranked second for Small Medium Enterprise customer satisfaction in Denmark, and first for overall customer satisfaction in Norway. Retention rates across the region have remained steady at almost 80%.
Net written premiums of £1,721m were up 7% but down 4% on a constant exchange rate basis (2015: £1,606m as reported), with volumes down 7% and rate up 3%.
Excluding the impact of the transfer of the Marine portfolio to the UK and the non-repeat of two large multi-year deals (as previously flagged at H1 2016), underlying Scandinavian premiums were down 1% (Personal up 1% underlying; Commercial down 3% underlying), reflecting slow market conditions overall.
The underwriting result was £239m (2015: £94m as reported) with a strong current year profit of £213m.
Canada (Management Basis)
Net Written Premium Underwriting Result
£m £m
Household 445 57
Personal Motor 549 34 Total Canada Personal 994 91
Property 194 (34)
Liability 102 4
Commercial Motor 102 4
Marine & Other 51 9 Total Canada Commercial 449 (17)
Total Canada 1,443 74
Operating Ratios Claims Commission Op Expenses Combined
% % % %
Household 87.4
Personal Motor 93.6 Total Canada Personal 64.0 11.0 16.0 91.0 Property 117.4
Liability 96.0
Commercial Motor 96.2
Marine & Other 83.8 Total Canada Commercial 67.9 18.0 17.9 103.8
Total Canada 65.2 13.1 16.6 94.9 Of which: 5yr ave Weather loss ratio 5.7 4.3 Large loss ratio 6.4 3.6 Current year attritional loss ratio 57.8 Prior year effect on loss ratio (4.7)

| RSA Insurance Group plc | Solvency and Financial Condition Report 2016
- 20 -
RSA has had a strong and resilient year in Canada, absorbing its share of losses from Fort McMurray, the largest natural catastrophe in Canadian history, yet still delivering an underwriting profit of £74m and COR of 94.9%.
RSA has been working hard to enhance its Customer offering. In Johnson its service and sales metrics have been outperforming benchmarks. In its broker distributed businesses, faster response times and new digital tools are being offered with promising early results. Customer retention rates have improved by 2pts year-on-year to 84%.
Net written premiums of £1,443m were up 6% but down 3% at constant exchange rate (2015: £1,360m as reported), with volumes down 4% and rate increases of 1%.
The portfolio actions of the last two years are now complete. However, conditions remain competitive, particularly in the Commercial Broker channel. The Group’s priority continues to be on sustained underwriting discipline. Personal premiums were down 4%, driven by rate reductions in Personal Motor and lower volumes. Premium reduction trends have been gradually moderating and Q4 2016 saw flat premiums overall.
The underwriting profit for the year of £74m (£116m in 2015) was in line with expectations, even after absorbing the impact of the Fort McMurray wildfire losses in May where the reinsurance programme limited exposure to a net claims cost of £42m.
UK (Management Basis)
Net Written Premium Underwriting Result
£m £m
Household 555 48
Personal Motor 235 (2)
Pet 278 2 Total UK Personal 1,068 48
Property 642 77
Liability 300 (11)
Commercial Motor 262 (22)
Marine & Other 316 31 Total UK Commercial 1,520 75
Total UK 2,588 123

| RSA Insurance Group plc | Solvency and Financial Condition Report 2016
- 21 -
Operating Ratios Claims Commission Op Expenses Combined
% % % %
Household 91.7
Personal Motor 101
Pet 99.4 Total UK Personal 57.8 21.2 16.7 95.7 Property 88.2
Liability 103.7
Commercial Motor 107.4
Marine & Other 90.5 Total UK Commercial 61.8 21.1 12.3 95.2
Total UK 60.2 21.2 14.0 95.4 Of which: 5yr ave Weather loss ratio 3.2 3.6 Large loss ratio 13.2 13.6 Current year attritional loss ratio 46.3 Prior year effect on loss ratio (2.5)
The UK delivered the best underwriting result in over a decade at £123m and a COR of 95.4%. Continued delivery from its performance improvement programme has driven this strong result against a competitive landscape.
Customer satisfaction metrics remain strong with further improvements delivered from 2015. Of note MORE TH>N Net Promoter Scores increased by 39% from 2015 and Motability Net Promoter Scores remained at market leading levels of +80. The creation of two new trading divisions in Commercial Lines is enabling RSA to serve customers better and compete more effectively.
Premiums were down 1% overall which included the impact of portfolio remediation in personal broker motor and delegated business.
UK Personal net written premiums contracted by 6% following the exit of Broker Motor during 2016. The growth of RSA’s highly successful Telematics proposition continues at pace with 90% growth from 2015 and helped deliver underlying 15% growth in Personal Motor. Underlying shrinkage (excluding the exited business) was 1% driven by remediation of the Delegated Authority Home portfolio offsetting strong growth in Personal Motor enabled by Telematics performance.
UK Commercial net written premiums grew by 2% following the transfer of Scandinavian Marine portfolio during 2016. Excluding this transfer UK Commercial net written premium growth was flat to 2015.
The UK underwriting result of £123m was underpinned by improving attritional loss ratios (1.8 points better) demonstrating the continuing underwriting discipline across the business.

| RSA Insurance Group plc | Solvency and Financial Condition Report 2016
- 22 -
Ireland (Management Basis)
Net Written Premium Underwriting Result
£m £m
Personal 185 (14)
Commercial 121 (35) Total Ireland 306 (49)
Operating Ratios Claims Commission Op Expenses Combined
% % % %
Personal 107.6
Commercial 130.1 Total Ireland 91.6 12.2 12.4 116.2 Of which: 5yr ave Weather loss ratio - 4.3 Large loss ratio 9.5 3.8 Current year attritional loss ratio 66.2 Prior year effect on loss ratio 15.9
In Ireland, while the headline underwriting loss of £49m is disappointing, the current year underwriting result has returned to profit with an improvement of £30m year on year. Full year premiums of £306m were up 6% at constant foreign exchange versus 2015 with significant rate being carried during 2016.
The underwriting loss of £49m comprises a £1m current year profit (2015: £29m loss) and a £50m prior year loss (2015: £6m loss). The current year improvement reflects an attritional loss ratio of 66.2% which was 8 points better than last year, significant rate increases, and further cost reductions.
The prior year loss is predominantly in the Republic of Ireland Commercial and Motor portfolios where a combination of higher than expected claims and the distortion of reserving patterns following the events of 2013 have resulted in further strengthening of reserves during 2016. These issues have been amplified by a challenging Irish market, characterised by high claims inflation and increasing litigation mitigated by a very hard rating environment.
Just over £30m of the development relates to three classes: Motor, Liability and Small Medium Enterprise where RSA has put through significant price increases in 2016 ahead of its plans, with further increases planned for 2017. Much of the remainder of the adverse development relates to business RSA has now exited.

| RSA Insurance Group plc | Solvency and Financial Condition Report 2016
- 23 -
Middle East (Management Basis)
Net Written Premium Underwriting Result
£m £m
Personal 111 5
Commercial 76 9 Total Middle East 187 14
Operating Ratios Claims Commission Op Expenses Combined
% % % %
Personal 95.7
Commercial 88.2 Total Middle East 56.8 16.6 19.4 92.8 Of which: 5yr ave Weather loss ratio 1.0 0.4 Large loss ratio 1.3 1.3 Current year attritional loss ratio 57.2 Prior year effect on loss ratio (2.7)
The Middle East region delivered a sub-96% COR for the 5th consecutive year, against a backdrop of a sustained economic downturn and tough trading conditions.
Premiums of £187m were down 8% at constant foreign exchange as a result of the challenging trading conditions resulting from the macroeconomic difficulties and portfolio action taken in the Kingdom of Saudi Arabia.
The underwriting result of £14m is £6m better than 2015 and the COR improved by 2.6 points to 92.8%. Underwriting actions have been taken across the portfolios which have delivered 4.7 point improvement in the attritional loss ratio to 57.2% (2015: 61.9%).
Underwriting Performance by Solvency II Line of Business
The above explains the management result on a Regional level and by analyst class of business, which is how the Group is managed. Although there is no direct mapping between analyst class and SII line of business, at a high level these classes can be aligned to Solvency II line of business to discuss material items in the result.
The financial year management result by Solvency II line of business is shown below:
Net Written Premium Underwriting Result £m £m
Non-life Fire and other damage to property 2,603 192 Motor vehicle liability 1,069 57 Other Motor 823 63 Marine, aviation and transport 391 36 Income protection 320 31 General liability 567 5 Medical expense 432 10 Total material lines of business 6,205 394
Non-material 203 (14) Total 6,408 380
The segmentation of the underwriting result as shown above is a Group level reflection of the products RSA sells and the way it runs the business.

| RSA Insurance Group plc | Solvency and Financial Condition Report 2016
- 24 -
The Solvency II line of business view takes the same result but splits it along a regulatory risk lines.
Consequently, the Commercial and Personal distinction is lost as these channels are combined, whilst some other lines are disaggregated further as different types of risk may be included within one product.
Household and Commercial Property are combined to form Fire and Other Damage to Property. Performance, therefore broadly mirrors that of those books in each region, benefitting from improved attritional performance and relatively benign weather and large losses although there have been notable impacts from the Alberta Wildfires and UK and European flooding in June.
Personal & Commercial Motor in all regions are combined and then split into Motor Vehicle Liability and Other Motor (damage). The results mirror the market conditions for these channels in each of the Group’s core markets, with Scandinavian Personal being the main driver of the strong results, supported by Canadian motor, whilst UK performance reflects more challenging market conditions.
UK Marine is the key contributor of the Marine, Aviation and Transport line, whereas Scandinavian Personal Accident drives the Income Protection result
General liability is largely from the Group’s Commercial Liability portfolio and some elements of Commercial Property.
Medical expense is largely the UK Pet book.

| RSA Insurance Group plc | Solvency and Financial Condition Report 2016
- 25 -
Royal & Sun Alliance Insurance plc
RSAI is the largest operating company of the Group. The Company, its subsidiaries and overseas branches transact the majority of the Group’s business. RSAI itself transacts the greater part of its business in the UK where it is a leading commercial lines insurer and a top five personal lines insurer via direct and affinity lines business.
£m
Net Written Premiums 2,761 Net Earned Premiums 2,838
Net Incurred Claims (1,779)
Commissions (603)
Operating expenses (396) Underwriting result 60 Investment income 422
Investment expenses (4)
Unwind of discount (29) Investment result 389 Operating result 449 Interest (129)
Loss on disposals (197)
Other non-operating charges (138)
Change in claims equalisation reserve 338 Profit before tax 323 Tax (2) Profit after tax 321
Net Written Premium Underwriting Result £m £m
Non-life Fire and other damage to property 1,164 91 Marine, aviation and transport 321 26 Medical expense 279 1 Motor vehicle liability 398 (15) Other Motor 214 1 General liability 337 (18) Total material lines of business 2,713 86
Non-material 48 (26) Total 2,761 60
RSAI’s operations are materially driven by the UK & International’s results and are affected by factors not reflected in divisional numbers such as intra-group reinsurance (see Section A.1.10). The directors of RSAI manage the operations on a divisional basis as described in the Annual Report & Accounts of the Group. For this reason, RSAI’s directors believe that analysis using key performance indicators for the UK business in aggregate is relevant to RSAI. Refer to the Group’s assessment of FY2016 performance (Section A2).

| RSA Insurance Group plc | Solvency and Financial Condition Report 2016
- 26 -
Royal & Sun Alliance Reinsurance Limited
RSA Re’s activities are focused on the internal reinsurance program and Global Network business. 100% of the gross premiums are retroceded although in a few instances a 2% reinsurance commission is added. RSA Re has nil retention in respect of risk. Management of the treaties has been outsourced to RSAI. As such, RSA Re’s underwriting performance of £714k is deemed not to be material.
The Marine Insurance Company Limited
MIC is the Group vehicle for the writing of specialty insurance business, including marine, transport and engineering and renewable energy United States surplus line risks. With effect from 1 January 2012, MIC entered into an excess of loss agreement and a quotashare arrangement with RSAI under which the insurance risk of MIC’s business is transferred to RSAI. The excess of loss reinsurance covers business written pre-2012, while the 100% quotashare arrangement has applied to business written since the beginning of 2012. The risks arising from these arrangements are discussed in Appendix 4 section C. MIC receives a commission of 36.5% in relation to the quota share arrangement which is determined by reference to the gross written premium of the business. As such, the underwriting result of MIC is in line with gross written premium and is generally immaterial. See Appendix 4 for further discussion.
Net Written Premium Underwriting Result £'000 £'000
Non-life Marine, aviation and transport - 810 Fire and other damage to property - 2,451 General liability - (701) Total material lines of business - 2,560
Non-material - - Total - 2,560

| RSA Insurance Group plc | Solvency and Financial Condition Report 2016
- 27 -
A.3 Investment performance
The information in this section of the report is taken from the Group, RSAI, RSA Re and MIC Annual Reports and Accounts. For further information on the Group’s investments and investment performance, see the Group Annual Report and Accounts, page 24 (Chief Financial Officer’s Review – Investment result) and page 65 (Group Investment Committee Report).
A.3.1 Income and Expenses by Class
Asset classes shown in this Section follow the definitions used in the Group’s and subsidiaries’ financial statements which may differ from the definitions used in Section D (Valuation for Solvency Purposes) of this report.
The Group
A summary of the gross investment income, net realised and net unrealised gains/(losses) included in the income statement is given below:
Investment income
Net realised gains/(losses)
Net unrealised gains/(losses) Impairments
Total investment
return
£m £m £m £m £m
Investment property 23 - (4) - 19 Equity securities
Available for sale 24 12 - (2) 34 At fair value through the profit and loss account 4 2 - - 6 Debt securities
Available for sale 289 14 - - 303 At fair value through the profit and loss account - - (9) - (9)
Other loans and receivables: Loans secured by mortgages 2 - - - 2 Other loans - - - 10 10 Short term investments 1 - - - 1
Deposits, cash and cash equivalents
7
-
-
-
7
Derivatives 5 - (31) - (26) Continuing operations 355 28 (44) 8 347 Discontinued operations 14 2 - - 16 Total net investment return 369 30 (44) 8 363
A summary of the investment management expenses by asset class is given below: 2016
£m
Investment property (2) Equity securities (1) Debt securities (9) Total investment management expenses (12)

| RSA Insurance Group plc | Solvency and Financial Condition Report 2016
- 28 -
Royal & Sun Alliance Insurance plc
A summary of the gross investment income, net realised and net unrealised gains/(losses) included in the income statement is given below:
Investment income
Net realised gains/(losses)
Net unrealised gains/(losses)
Total investment return
£m £m £m £m
Investment property 23 - (4) 19 Equity securities
Available for sale 9 3 - 12 At fair value through the profit and loss account - (1) - (1) Debt securities
Available for sale 124 6 - 130 At fair value through the profit and loss account - - - - Other investments
Other loans 8 - - 8 Deposits, cash at bank and in hand 1 - - 1 Derivatives 2 - 1 3 Continuing Operations 167 8 (3) 172 Discontinued Operations 1 - - 1 Total net investment return 168 8 (3) 173 Dividends from subsidiary undertakings 291 - - 291
459 8 (3) 464
A summary of the investment management expenses by asset class is given below:
£m
Investment property (1) Equity securities (1) Debt securities (2) Total investment management expenses (4)
Royal & Sun Alliance Reinsurance Limited
£'000
Income from cash at bank and in hand 109 Investment income from debt & fixed income securities 55 Investment Management Expenses -
164
The Marine Insurance Company Limited
£'000
Income from available for sale investments 1,452 Investment management expenses (Debt securities) (5)
1,447

| RSA Insurance Group plc | Solvency and Financial Condition Report 2016
- 29 -
A.3.2 Gains and Losses Recognised in Equity
The Group
Unrealised gains and losses recognised in other comprehensive income for available for sale assets are as follows:
Net unrealised gains/(losses)
Net realised (gains)/losses transferred to income
statement Impairments transferred to
income statement
Net movement recognised in other comprehensive
income
£m £m £m £m
Equity securities 21 (13) 2 10 Debt securities 169 (11) - 158 Other 10 - (10) - Total continuing operations 200 (24) (8) 168 Discontinued operations 5 (1) - 4 Total 205 (25) (8) 172
Royal & Sun Alliance Insurance plc
Unrealised gains and losses recognised in other comprehensive income for available for sale assets are as follows:
Net unrealised gains/(losses)
Net realised (gains)/losses transferred to profit and loss
account
Net movement recognised in other comprehensive
income
£m £m £m
Equity securities 10 3 13 Debt securities 153 (1) 152 Subsidiary and associate undertakings 752 3 755 Other - - - Total continuing operations 915 5 920 Discontinued Operations - - - Total 915 5 920
Royal & Sun Alliance Reinsurance Limited
Unrealised losses on other financial instruments classified as available for sale net of tax are as follows:
£'000
Debt securities and other fixed income securities (176)
The Marine Insurance Company Limited
Unrealised losses on other financial instruments classified as available for sale net of tax are as follows:
£'000
Debt securities and other fixed income securities (266)

| RSA Insurance Group plc | Solvency and Financial Condition Report 2016
- 30 -
A.3.3 Investments in Securitisation
The Group
The Group invests in securitised investments whereby the credit risk associated with an exposure or pool of exposures is tranched and the payments associated with this investment are dependent on the performance of the exposure or pool of exposures and the subordination of tranches determines the distribution of losses during the ongoing life of the investment. These investments are created by and managed by external specialist investment managers. The use of these products allows the Group to broaden the diversification of its investment portfolio in a cost-efficient manner.
The Group’s exposure to structured entities at 31 December 2016 is summarised in the table below:
Exposure
Class of Investments Nature of the underlying investments of the vehicle £m
Collateralised debt obligations Structured debt security backed by bonds 203
Royal & Sun Alliance Insurance plc
The company invests in securitised investments. These investments are issued by entities created by and managed by external specialist investment managers.
The company exposure to securitised investments at 31 December 2016 is summarised in the table below:
Exposure
Class of Investments Nature of the underlying investments of the vehicle £m
Collateralised debt obligations Structured debt security backed by bonds 203
Royal & Sun Alliance Reinsurance Limited
The company has no exposure to securitised investments.
The Marine Insurance Company Limited
The company has no exposure to securitised investments.

| RSA Insurance Group plc | Solvency and Financial Condition Report 2016
- 31 -
A.4 Performance of other activities
A.4.1 Other Material Income & Expenses
The Group
An analysis of the Group’s other material income and expenses for the year ended 31 December 2016 is detailed below:
Other Operating Income
£m
Administration fees income 39 Instalment policy fee income 17 Introductory commissions 27 Service income 14 Other fees 41 Foreign exchange gain 32 Total other operating income relating to continuing operations 170
Other Operating Expenses
£m
Administration and other expenses 30 Investment expenses and charges 12 Amortisation of intangible assets 16 Pension administration expenses 4 Solvency II costs 7 Reorganisation costs 160 Continuing operations 229 Discontinued operations 7 Total other operating expenses 236
Finance Costs
£m
Interest expense on loan capital 97 Premium on debt buy back 1 39 Other loan interest 2 Total finance costs relating to continuing operations 138
1. On 7 July 2016, the Group bought back £200m of its holding of 9.375% Lower Tier 2 guaranteed subordinated step-up notes on which a premium was paid of £39m for early redemption.

| RSA Insurance Group plc | Solvency and Financial Condition Report 2016
- 32 -
Employee Expenses
Staff costs for all employees comprise:
£m
Wages and salaries 621 Social security costs 85 Pension costs 82 Share based payments to directors and employees 16 Total staff costs 804
Royal & Sun Alliance Insurance plc
Employee expenses
Staff costs for all employees comprise:
£m
Wages and salaries 245 Social security costs 26 Other pension costs 34 Total staff costs 305
Royal & Sun Alliance Reinsurance Limited
The Company did not employ anyone during the period. All administrative duties are performed by employees of Royal & Sun Alliance Insurance plc at no cost to the Company.
The Marine Insurance Company Limited
The Company did not employ anyone during the period. All administrative duties are performed by employees of Royal & Sun Alliance Insurance plc at a cost to the Company of £1,155,000.

| RSA Insurance Group plc | Solvency and Financial Condition Report 2016
- 33 -
A.4.2 Operating and Finance Leasing Arrangements
The Group
The Group leases various outlets and offices under non-cancellable operating lease agreements. The leases have varying terms, escalation clauses and renewal rights. Payments made under operating leases are charged on a straight-line basis over the term of the lease.
The operating lease payments recognised as an expense during the year are £54m. The Group has no significant lease agreements that include contingent rent.
Operating lease commitments where the Group is the lessee
The future aggregate minimum lease payments under non-cancellable operating leases are as follows:
Land and buildings Other
£m £m
One year or less 44 1 Between one and five years 138 2 After five years 144 -
326 3 Recoveries under sub tenancies (5) - Total 321 3
Operating lease commitments where the Group is the lessor
The future aggregate minimum lease receipts under non-cancellable operating leases are as follows:
Land and buildings
£m
One year or less 22 Between one and five years 74 After five years 62 Total 158
Finance leases
The Group has no material finance leases.

| RSA Insurance Group plc | Solvency and Financial Condition Report 2016
- 34 -
Royal & Sun Alliance Insurance plc
The company leases various outlets and offices under non-cancellable operating lease agreements. The leases have varying terms, escalation clauses and renewal rights.
Operating lease commitments where the Company is the lessee
The future aggregate minimum lease payments under non-cancellable operating leases are as follows:
Land and buildings Other
£m £m
One year or less 14 - Between one and five years 43 1 After five years 57 -
114 1 Recoveries under sub tenancies (4) - Total 110 1
Operating lease commitments where the Company is the lessor
The future aggregate minimum lease receipts under non-cancellable operating leases are as follows:
Land and buildings
£m
One year or less 22 Between one and five years 74 After five years 62 Total 158
Finance leases
The company has no material finance leases.
Royal & Sun Alliance Reinsurance Limited
The company has no material operating or finance leases.
The Marine Insurance Company Limited
The company has no material operating or finance leases.
A.5 Any other information
Nothing to report.

| RSA Insurance Group plc | Solvency and Financial Condition Report 2016
- 35 -
This Section of the report describes the Group’s governance, including details of its board structure and its risk management and internal control systems. It also provides information on the role of the internal audit and actuarial functions.
Governance information specific to RSAI, RSA Re and MIC can be found in Appendices 2, 3 and 4 respectively.
B.1 General information on the system of governance
B.1.1 Board Structure
The Group’s business is overseen by a single Board of Directors. A minimum of fifty percent of the Board, excluding the Chairman, are Non-Executive Directors. All Non-Executive Directors have been determined by the Board to be independent. The Chairman meets regularly with the Non-Executive Directors both individually and collectively without the Executive Directors being present.
The Board of Directors may exercise all the powers of the Group subject to the Articles of Association, relevant laws, and any directions as may be given by shareholder resolution at a general meeting. The Directors may delegate any of their powers or discretions to committees except those matters specifically reserved for the whole Board in the Schedule of Matters Reserved for the Board.
The Board promotes high standards of corporate governance and conduct throughout the Group and has a solid governance framework in place. The Chairman is responsible for leading the annual review of the effectiveness of the Board.
The Board is accountable to stakeholders for the creation and delivery of strong sustainable performance and the creation of long term shareholder value. The Board meets frequently and is responsible for organising and directing the affairs of the Group in a manner that will promote the success of the company and is consistent with good corporate governance practice, ensuring that in carrying out its duties the company and the Group meet legal and regulatory requirements. The specific duties of the Board are clearly set out as a formal schedule of matters reserved to the Board, which can only be amended by the Board itself and which is reviewed annually. The Group’s Articles of Association can be found on the Group’s website at www.rsagroup.com/articles.
Directors have access to the services and advice of the Group Chief Legal Officer and Company Secretary and in addition may take independent professional advice at the expense of the company in furtherance of their duties.
The Board sets annual objectives for the business in line with the current Group strategy and monitors the achievement of the company’s objectives through regular reports which include updates from the Group Chief Executive and the Group Chief Financial Officer on all material business matters.
In addition to the schedule of matters reserved for the Board, each of its committees has written terms of reference defining its role and the authority delegated to it. A summary of the matters reserved for the Board and the terms of reference for each Board committee are reviewed frequently.
The main Board and executive committees and the relationships between them are shown below.

| RSA Insurance Group plc | Solvency and Financial Condition Report 2016
- 36 -
Reports describing the roles, responsibilities and activities of each board level committee can be found in the Group’s Annual Report and Accounts 2016 on pages 65 to 78.
B.1.2 Independent Key Governance Functions
The diagram below of the Group executive management structure shows the senior management and the day to day reporting lines of those functions which the Board has determined to be the Key Governance Functions.
The Group Audit Committee is responsible for the oversight of the effectiveness of the systems of internal control and financial and regulatory risk management systems, and for monitoring the effectiveness and objectivity of the internal audit function. This
*
Group Audit
Committee
BoardRisk
Committee
Group Investment Committee
GroupRemuneration
Committee
Board
GroupNomination & Governance
Committee
Group Reinsurance
Credit Committee
GroupExecutive
Committee
InvestmentCommittee
GroupAsset Management
Committee
Group Risk, Investments &
Treasury Committee
UK & International Risk & Control
Committee
CodanAudit
Committee
CanadaAudit
Committee
IrelandAudit
Committee
Control & Governance
Advisory Committee
GCC Risk Committee
ScandinavianRisk Committee
Chief Executive Officer
Board level committees
Management committeeRegional committees
GroupReservingCommittee
CanadaRisk Committee
Internal Model GovernanceCommittee
Balance Sheet Committee
Solvency IISteering
Committee
Capital ManagementCommittee
Key
UK & InternationalRisk & Control
Committee

| RSA Insurance Group plc | Solvency and Financial Condition Report 2016
- 37 -
includes overseeing the relationships between the risk, compliance and internal audit functions for alignment and overlap to ensure they are coordinated and operating effectively to avoid duplication. In addition, the Group Head of the Compliance and Actuarial Functions and the Group Chief Auditor have a right to meet at least annually with the Group Audit Committee without the Executive Directors or Management being present. The Group Board Risk Committee (BRC) advises the Board on risk management issues, recommends the Group framework of risk limits and risk appetite to the Board for approval and oversees Group’s the risk management arrangements. The Committee ensures that the material risks facing the Group have been identified and that appropriate arrangements are in place to manage and mitigate those risks effectively. The Group Chief Risk Officer has a similar right to meet annually with the Group BRC. In addition, the Group Chief Risk Officer has access to the Committee Chairman and, where necessary, the Chairman of the Board.
Those working in the Key Governance Functions in the EEA entities are subject to the provisions of the Fit & Proper policy (described in Section B2. below) which requires them to have the necessary skills, knowledge and experience to fulfil their position. This is assessed both on initial appointment and through annual performance appraisals.
B.1.3 Changes in SoG
There have been no major changes to the Group’s system of governance during 2016. The main change has been to the internal control system, where the Policy Implementation Self-Assessment process has been replaced with a Policy Compliance Monitoring process.
In 2016, the Group completed disposals of its businesses in Latin America and Russia. The reporting line for the Middle East businesses was moved into the UK and Western Europe business unit. The unit was subsequently renamed “UK & International”.
B.1.4 Principles of Remuneration Policy
The Group ensures that it has appropriate remuneration arrangements through the adoption of a remuneration policy. This policy outlines the Group’s overall approach to remuneration, and also the governance framework for making remuneration decisions.
The policy is designed to support the business strategy by appropriately rewarding performance and promoting sound and effective risk management, compliance with external regulatory requirements and alignment to the long-term interests of the company and its shareholders.
The policy establishes over-arching principles and standards to guide local remuneration decision-making, which is aligned to local market norms and regulations. These principles are based around alignment to long-term company success, pay-for-performance and risk alignment. A total reward approach is used to support talent attraction and retention, such that the reward framework includes both fixed remuneration elements (reflecting an employee’s professional experience and responsibility, and can include elements such as base salary, benefits and pension), and variable remuneration elements (which can be awarded to eligible employees, reflecting performance).
The policy establishes specific remuneration provisions for jobholders whose professional activities have a material impact on the risk profile, or have accountability for Key Governance Functions. These provisions are intended to promote effective risk management and include:
• the balancing of fixed and variable remuneration to enable a fully flexible approach to incentives (including the possibility of paying no variable remuneration);
• the design of incentive plans to encourage performance within the Group’s risk appetite, including the consideration of material risk factors in incentive award decisions, the operation of deferral and malus adjustment and the operation of clawback provisions for Executive Directors and Executive Committee members, and customised arrangements for those accountable for Key Governance Functions to preserve the independence of their roles; and
• arrangements to avoid reward for failure in termination payments, and to exclude personal hedging strategy usage.
Governance measures aimed at avoiding conflicts of interest are incorporated.
The policy is reviewed regularly, to ensure that it complies with the principles of good risk management and reward governance, taking into account regulatory requirements and the nature of the business.

| RSA Insurance Group plc | Solvency and Financial Condition Report 2016
- 38 -
B.1.5 Variable Remuneration Performance Criteria
Incentive plans encourage performance in line with the business strategy and within the Group’s risk appetite, and take into account material risk factors and the company’s ability to maintain an adequate capital base.
Incentive plan performance measures:
• reflect the Group’s priority to create shareholder value through sustained growth and profitability, based on its risk profiles. Measures can include for example, profit, underwriting performance, capital, strategic and shareholder value measures; and personal objectives.
• are quantified on an ‘underlying’ basis where appropriate, to provide an undistorted view of business performance and avoid the creation of adverse incentives.
For jobholders whose professional activities have a material impact on the Group’s risk profile, a number of mechanisms are included to ensure remuneration does not encourage excessive risk taking:
• Total performance-related variable remuneration is based on a combination of the assessment of the performance of the individual, the business unit concerned and the overall result of the company or Group;
• Targets take account of the Group’s operating plan which is set with reference to the risk appetite with input from the Risk function;
• Incentive award funding is subject to risk adjustment for exposure to current and future risks, taking into account the company risk profile and cost of capital. An adjustment can take place prior to the payment of Annual Bonus awards, and prior to the vesting of long-term incentive award cycles;
• Individual performance assessments take account of financial and non-financial criteria, and are based on consideration of what is delivered and also how goals are achieved; and
• A portion of variable remuneration is subject to deferral to ensure it is aligned with longer-term risk management. The percentage that is deferred, the type of deferred award(s) and the length of the deferral period are determined by taking into account regulatory requirements, the level of the jobholder and the business context.
The Group has provisions to apply malus adjustment and clawback. For variable remuneration awards issued in 2014 onwards, the Group Remuneration Committee has the ability to reduce or forfeit awards that have yet to be paid or vest in the case of shares, to delay the payment or vesting date, or to amend another form of award or benefit which has yet to be received (malus adjustment). For cash bonuses awarded for 2015 performance onwards, and long-term incentive awards granted from 2015 onwards, the Committee may also recover sums already paid to Executive Directors and Executive Committee members if it considers it appropriate to do so (clawback). This can be applied during a two-year period after receipt (in the case of cash bonuses) or vesting (in the case of long-term incentives). The circumstances in which malus adjustment and clawback may apply are set out in the Directors’ Remuneration Report.
Variable remuneration arrangements for those accountable for Key Governance Functions are designed to be independent from the performance of the operational units and areas submitted to their control.
The performance criteria used in Executive Directors’ incentive plans are set out in the Directors’ Remuneration Report on pages 76 to 101 of the 2016 Annual Report and Accounts.
In addition to its short- and long-term incentive plans, the Group operates all-employee share plans (Sharesave and Sharebuild) in a number of countries. Participation is voluntary and available to all qualifying employees. Sharesave is an HMRC tax-advantaged Save as You Earn scheme under which options are not subject to performance conditions, but service conditions apply. Sharebuild is an HMRC tax-advantaged Share Incentive Plan. Shares are not subject to performance conditions, but the Matching Shares are subject to service conditions.
B.1.6 Supplementary Pensions / Early Retirement
No supplementary pensions are operated for the members of the administrative, management or supervisory body and other key function holders. The Group’s defined benefit pension plans are closed to all new entrants, but some employees have historic benefits built up, which in accordance with the current policies, and the Scheme rules, can be paid early without reduction in certain circumstances. This does not apply to Executive Directors or other members of the Group Board who do not have historic defined benefit pension benefits.

| RSA Insurance Group plc | Solvency and Financial Condition Report 2016
- 39 -
B.1.7 Shareholder/Board Transactions
The Group
The only transactions with shareholders who were not members of key management (the Group Executive Committee, Executive Directors and Non-Executive Directors) were the payment of dividends.
Key Management Transactions
The following transactions were carried out with key management:
£m
Salaries and other short term employee benefits 7 Bonus awards 5 Pension benefits 1 Share based awards 4 Total 17
Key management personnel comprise members of the Group Executive Committee, Executive Directors, and Non-Executive Directors.
Included in salaries and other short term employee benefits and bonus awards is c£5m paid in respect of Directors. These amounts exclude the value of share options granted to Directors and gains made on the exercise of such options, Group contributions paid in respect of pension schemes and cash or other assets received or receivable under long term incentive schemes. The total value of the Directors' remuneration (including values for these excluded items) and other details are disclosed in the Directors’ Remuneration Report (on pages 76 to 101 of the 2016 Annual Report and Accounts)
A number of the Directors, other key managers, their close families and entities under their control have general insurance policies with subsidiary companies of the Group. Such policies are available at discounted rates to all employees including Executive Directors.
Dividends
The final dividend to equity holders is recognised as a liability when approved at the Annual General Meeting. The Group may be subject to restrictions on the amount of dividends that can be paid to shareholders as a result of regulatory requirements. However, based on the information currently available, the Group does not believe that such restrictions materially limit the ability to meet obligations or pay dividends. At the Annual General Meeting on 5 May 2017, a final dividend in respect of the year ended 31 December 2016 of 11p per ordinary share amounting to a total dividend of £112m was approved. This dividend will be paid and accounted for in shareholders’ equity as an appropriation of retained earnings in the year ending 31 December 2017. See Section E.1.5 for the corresponding Own Funds impact.
pence £m
Ordinary dividend: Final paid in respect of prior year 7 71 Interim paid in respect of current year 5 51
12 122 Preference dividend 9
131

| RSA Insurance Group plc | Solvency and Financial Condition Report 2016
- 40 -
Royal & Sun Alliance Insurance plc
Key Management Transactions
The aggregate emoluments of the directors, including amounts received from subsidiaries, were as follows:
£m
Salaries and bonuses 5 Allowances, benefits and other awards 1 Total 6
During 2016, retirement benefits accrued under defined benefit schemes for one director. During 2016, contributions of £32,102 were made to Group defined contribution schemes during the year in respect of four directors.
During 2016, one director exercised share options and eight directors had share awards vesting under long term incentive schemes in respect of ordinary shares of the Company' ultimate parent company.
Dividends
£m
Interim dividends of 14.79p per ordinary share were paid during the year 719 The directors do not recommend payment of a final dividend in respect of the year ended 31 December 2016
Royal & Sun Alliance Reinsurance Limited
There are no material transactions to report.
The Marine Insurance Company Limited
There are no material transactions to report.

| RSA Insurance Group plc | Solvency and Financial Condition Report 2016
- 41 -
B.2 Fit and proper requirements
B.2.1 Specific Fit & Proper requirements
The Fitness and Propriety Policy provides a single framework across the Group’s EEA operations for assessment of fitness and propriety of all employees with additional requirements for both new and on-going appointees in the Key Governance Functions and the Executive Management, and for Directors. Any individual employed by a non-regulated entity or a regulated entity outside of the EEA who is deemed to occupy a position in a RSA EEA regulated entity for which notification is required must be regarded as being employed by that EU regulated legal entity for the purposes of the policy. Group Regulatory Compliance works with the local Regulatory Compliance teams (where applicable) to ensure the consistent implementation of this policy across the relevant Group entities.
The Group Fitness and Propriety Policy applies to Directors and all employees of EEA regulated reinsurance / insurance entities with a higher level of requirements for those employees who are deemed to be:
• Individuals who are effectively running and overseeing the business (whether they are directly employed by that business or not)
• Key Governance Function holders within an insurance legal entity
• Those working in the Key Governance Functions.
All other employees must be assessed on their skills and knowledge, expertise, and personal integrity prior to commencement, with a re-assessment annually through appraisals.
The Board believes that it has the appropriate balance of skills, experience and knowledge to enable it and its committees to discharge their duties and responsibilities effectively. The Board considers the skills, experience, independence and knowledge already represented when making decisions on new appointments. One of the key responsibilities of the Group Governance and Nomination Committee is to keep under review Board membership and succession planning to ensure that the balance remains appropriate.
The Fitness and Propriety Policy does not apply to non-EEA entities as they are not subject to Solvency II. These entities are subject to their own fit and proper requirements as mandated by the relevant local regulatory authorities.
B.2.2 Assessment Process
The Policy outlines the minimum requirements to assess and ensure fitness and propriety, including the governance over roles and responsibilities to ensure compliance. Responsibility for complying with local regulatory rules and requirements rests with the Board of each legal entity.
Fit requirements
The assessment of whether someone is fit must also include an assessment of the person’s professional and formal qualifications, knowledge and relevant experience within the insurance sector, other financial sectors or other businesses and shall take into account the respective duties allocated to that person, and, where appropriate, the insurance, financial, accounting, actuarial and management skills of the person.
This must include an assessment of the person’s
• Honesty, integrity and reputation
• Competence and capability, and
• Financial soundness.

| RSA Insurance Group plc | Solvency and Financial Condition Report 2016
- 42 -
Proper Requirements
When assessing whether a person is ‘proper’, the following is considered:
• Relevant criminal offences include any offence under the laws governing banking, financial, securities, and insurance activity.
• Laws on money laundering, market manipulation, or insider dealing.
• Criminal offences under legislation relating to companies, bankruptcy, insolvency or consumer protection.
The following diagram outlines the process for determining fitness and propriety for new appointments. The Fitness and Propriety Policy also requires continued assessment of both fitness and propriety post appointment.
Business must ensure on-
boarding and continual training
Business decides whether an applicant
is in scope of the F&P policy and
follows documented procedure
Prior to appointment complete Fit requirements
Prior to appointment
complete Proper requirements
Designation of person within Business with
overall responsibility of outsource
functionPrior to
appointment complete Fit requirements
Prior to appointment
complete Proper requirements
Business must ensure that the
local supervisory authority is notified in a timely manner
Business must ensure communication with the local supervisory
authority in regards to fit and proper is
accurate and complete
Inte
rnal
app
oint
men
tO
utso
urce
/ E
xter
nal
appo
intm
ent

| RSA Insurance Group plc | Solvency and Financial Condition Report 2016
- 43 -
B.3 Risk management system including the Own Risk and Solvency Assessment (ORSA)
B.3.1 Description of the Risk Management System
The Three Lines of Defence
The Group has a comprehensive risk management system which includes a full range of risk policies, procedures, measuring, reporting and monitoring techniques, and a series of stress tests and scenario analysis to ensure that the risk exposures that arise from operating the Group’s businesses are managed appropriately.
The risk management system is underpinned by the Three Lines of Defence model (see Section B.3.2). The Group Board are responsible for ensuring the effectiveness of the Group’s risk management system; for setting the Group’s overall risk strategy and risk appetite (including Group level risk limits and tolerances); and for approving the main risk management strategies and policies.
Risk Appetite and Strategy
The Group Board is responsible for setting the business strategy which is used to inform the risk strategy statement. The risk strategy statement, which is prepared by Group Risk and approved by the Board, describes the Group’s overall strategy and objectives for managing risks based on a set of key principles.
The Risk Appetite is set annually by the Board. It establishes the appetite for risk by risk category plus high level risk limits and tolerances, and drills down into more detailed risk statements. These are expressed through associated Key Risk Indicators with associated risk limits and risk tolerances.
Risk Management Cycle
The risk management cycle describes the process used to set, identify, measure, manage, monitor and report on risk impacting each business.
Risk Identification (new and emerging risk)
Risks are identified through a range of activities that include policy and control design; stakeholder scenario workshops (attended by internal and external subject matter experts); risk mapping, and an analysis of risk incidents including a root cause analysis. The identified risks, including emerging risks, are recorded in the business function’s risk reports and risk profile matrix which records the likelihood of occurrence, the expected residual loss impact, and whether the residual risk is within risk appetite or if not, whether there is an appropriate action plan.
Risk Measurement
Once risks have been identified the business must update its risk profile.
Significant risks are periodically reviewed for potential inclusion in the Internal Model, which is the primary tool for measuring risk
Managing, Monitoring and Reporting Risk
All significant residual risks are assessed and monitored to determine if the risk is within Risk Appetite, and if not whether there is a plan with an owner to bring within appetite within a reasonable timeframe.

| RSA Insurance Group plc | Solvency and Financial Condition Report 2016
- 44 -
Action owners must track all action plans to ensure risk is brought within appetite within planned timeframe and report progress at least quarterly.
Risk reporting at the aggregate Group level is to the BRC and the Group executive level committees.
Outputs of the internal model are used by the BRC as an integral part of its decision making on matters from setting the risk appetite and adjusting investment exposure and hedges to reinsurance strategy, insurance portfolio risk assessment, or key strategic decisions such as disposals.
B.3.2 Implementation and Integration
The Group has established a consistent group-wide approach to the implementation of the System of Governance with the Risk Management System, internal control system and risk policies developed at Group and cascaded to the regions with overall Group oversight to ensure consistency.
The application of the Three Lines of Defence and its interaction with the Internal Control System is shown below.
B.3.2.1 RSA Internal Model Governance & Assurance
The Group received approval from the PRA to use its internal model to calculate the SCR in December 2015. This approval also applies to:
• UK Insurance Entities: RSAI, MIC, RSA Re
• Danish Insurance Entities: Codan Forsikring A/S and Forsikringsselskabet Privatsikring A/S
Entity RiskCommittees
Regional Risk Committees
Entity CEOs
Regional CEOs
Group Internal Audit
Line 1 Line 2 Line 3
Board Risk Committee
Group CEO
Group Board
Group Audit Committee
Risk Compliance
Group Actuarial
ORSA
Risk Strategy & Appetite
Risk Management System(“RMS”) Stress &
Scenario Testing
Risk Events
Risk Profiles
Internal Model
Emerging Risks
Internal Model
Governance
RMS oversight
Policy Ownership & Management Policy Oversight
Design, Implement &
Operate Controls
Control Validation Control Assurance
Evaluate and Audit
effectiveness and adequacy
of:RMS; ICS;
Validation; Oversight; Assurance
Management
Internal ControlSystem (“ICS”)
Regional & Country ControlCommittees

| RSA Insurance Group plc | Solvency and Financial Condition Report 2016
- 45 -
As well as being used to calculate the SCR, the model is also used for calculating RSA’s own internal views of capital requirements at a Group, regional and entity level. Further, the model is used to allocate capital to individual lines of business and to help assess reinsurance purchase.
The model has a common governance and assurance framework which oversees how the model is run, updated and results reported.
The structure of the Group Governance Framework is shown in the following table:
Responsibility Body/Function Activity
Held accountable but delegates Internal Model oversight responsibility to the Board Risk Committee (BRC)
Board Monitors BRC activity and receives sufficient information to oversee the model and understand the output
Ensures model oversight is of appropriate design, operation, risk coverage and compliance
BRC
Reviews and challenges Internal Model Governance Committee activity, including regular reporting of internal model changes, results of model runs and associated sensitivities, as well as monitors the ongoing appropriateness of the internal model through receiving the Internal Model Validation Report
Ensures operation within regulatory requirements and co-ordinates internal and regulatory economic capital processes Internal Model Governance
Committee
Receives and challenges results of the internal model runs, identifies the need for and assesses changes to the internal model including updates to calibrations and structure. Reviews validation findings and undertakes programme of model improvement including enhancing uses of the model
Undertakes programme of independent validation and reports results to BRC (with debate at Internal Model Governance Committee)
Risk Function (Assurance Provider)
Performs, validation activity, identifies and monitors observations including closure. Reviews and challenges the outputs of the model including estimated capital positions and forecasts
A similar structure operates for each of the entities approved to use the internal model.
The Internal Model Governance Committee is responsible for providing overall direction and drive for the governance of the internal model in addition to acting as the coordinating body for the internal and regulatory economic capital process. It regularly provides updates to the BRC.
The Internal Model Governance Committee ensures that RSA’s model change policy is adhered to and remains compliant with regulation; that Data Quality and Assurance processes are in place; and that Independent model validation is performed.
B.3.2.2 Internal Model Governance Changes in the Year
There were no material changes to the internal model governance during the reporting period.

| RSA Insurance Group plc | Solvency and Financial Condition Report 2016
- 46 -
B.3.2.3 Internal Model Validation
The Solvency II Directive (Article 124) requires firms to establish independent validation processes to ensure that the Internal Model is properly designed, developed, tested, documented, implemented and used appropriately.
Validation is seen as a regular process, the primary goal of which is to provide the Board with assurance that:
• The internal model is fit for purpose
• The internal model achieves its objectives as defined by the business
Validation assesses the key assumptions and outputs of the model and involves a number of tools and activities such as Stress and Scenario Testing, P&L attribution and Use Test validation.
Each year, the validation team reports the results of the internal model validation undertaken to the BRC and outlines recommended actions and timescales for remediation to occur.
B.3.3 ORSA
B.3.3.1 ORSA Process
The ORSA process is a continuous process that takes input throughout the year, to assess how the risks of the business change over time and the consequential impact on the solvency needs and strategy of the business. During the year, the Board and BRC consider a range of activities and a final report is presented to the BRC and the Board in June or July each year. This summarises papers and associated decisions taken during the period and highlights key areas of action needed over the forthcoming year.
B.3.3.2 ORSA Review and Approval
Papers are presented to the Group and EEA insurance entity Boards throughout the year dealing with individual elements of the ORSA.
The ORSA report is presented annually to management, the BRC and the relevant Board.
B.3.3.3 Own Solvency Needs
As part of the ORSA process, the Group looks at the capital it needs using various bases including:
• Solvency II SCR
• Economic Requirement (including looking at risk to ultimate)
• Rating Agency
Using these measures, it is then able to assess in aggregate its Own Solvency needs and corresponding capital available. The internal model is used for the calculation of the SCR and internal economic measures and is calibrated based upon the risk exposures of the Group.
In addition, when setting the risk appetite, various levels of buffer to cover potential operating shocks are allowed for. Finally as part of the Operational Plan and ORSA processes, the capital position of the Group is projected over the period of the operating plan to ensure that the Group will have sufficient capital to meet its needs.
B.3.4 Group Consistency
The Group has established a consistent group-wide approach to the implementation of the System of Governance with the Risk Management System, Internal Control System and risk policies developed at Group and cascaded to the regions and insurance subsidiaries, with overall Group oversight to ensure consistency.

| RSA Insurance Group plc | Solvency and Financial Condition Report 2016
- 47 -
The Group operates under a common framework through which risk management and control is embedded. Each business within the Group is required to follow consistent processes - using a common language - to identify, measure, manage, monitor and report its risks, in line with a consistent and comprehensive set of policies.
Policies set out risk assessment standards and risk appetite together with detailed procedures including minimum requirements and internal controls and details of controls testing. Each policy is assigned a Group Managing Owner with responsibility for ensuring that the policy is embedded across the Group through regional / local owners.
Risk policies are linked to risk appetite and define the Group’s material risk categories, i.e.:
• Insurance Risk
• Credit Risk
• Market Risk
• Liquidity Risk
• Operational Risk (including Strategic and Reputational Risk)
• Pension Risk
These policies set out how the business should identify, measure, manage, monitor and report material risks. They all require localisation and implementation by all businesses and formal adoption by all the Group’s EEA insurance entity Boards.
B.3.5 Use of Single Group ORSA
Having received approval from the PRA in April 2016, a single ORSA report will be produced for the Group and its UK regulated entities.

| RSA Insurance Group plc | Solvency and Financial Condition Report 2016
- 48 -
B.4 Internal control system
B.4.1 Description of the Internal Control System
The Group has put in place an effective internal control system which contains administrative and accounting procedures, an internal control framework, with appropriate validation, assurance and reporting arrangements at all levels of the Group, a delegated authority framework, and a compliance framework. The internal control system is underpinned by the Three Lines of Defence model.
The internal control system comprises three key elements:
• Internal control framework, whereby policies establish standard controls, which are implemented and operated by the business; supplemented by objective 1st Line validation and independent 2nd Line assurance processes. The internal control framework includes financial controllership which is subject to assurance through the Financial Control Framework.
• Delegated authority framework, whereby authority is cascaded down from the Board to the business.
• Regulatory compliance framework sets out the standard control processes to minimise and/or prevent the risk of material loss, reputational damage or liability arising from the failure to comply with regulatory requirements. Ultimate responsibility for compliance with the relevant rules and regulations rests with the Board, the executive and the senior management in each business. Advice, challenge, and interpretation is provided to these bodies by the Regulatory Compliance function.
Internal control framework
The internal control framework is designed to identify and mitigate, rather than eliminate, the potential risk of failure to achieve business objectives and can only provide reasonable and not absolute assurance against material financial misstatement or loss.
Group policies cover all material risk types to which the Group is exposed and set out both minimum requirements and standard control sets for business activities, including delegated activities, which allows the Group to achieve its objectives including effectiveness and efficiency of operations, reliability of financial reporting, and compliance with applicable laws and regulations.
Policies also establish control validation activities (1st Line checks) which ensure controls are designed and operating effectively and assurance activities (2nd Line) which examine and oversee business control validation activities to provide additional independent comfort that objectives are being achieved and adequate controls are in place and working effectively.
Adherence to the control sets and the progress and findings of assurance and validation activity are reviewed by regional Risk and Control Committees, which have been established with similar terms of reference in all regions. Key issues identified in the committee meetings are escalated to local entity boards or audit committees, and the Group Audit Committee through six-monthly Integrated Assurance Reports. Relevant trends and risks will also be notified to the BRC as appropriate.
Delegated Authority Framework
The Delegated Authority Framework specifies how executive authority is delegated from the Board to the Group Chief Executive Officer, and onwards to senior management within the Group. The Group Chief Executive Officer and senior executives across the Group receive an executive licence setting out their specific limits of authority in terms of entering into financial, underwriting, claims and other business commitments. Each executive is responsible for ensuring a similar process of delegation is in place within his or her area of responsibility.
Effective management of Delegated Authority enables the business to:
• Ensure that all employees execute their responsibilities within a clearly defined set of limits and subject to specified terms and conditions appropriate to their role, competence, experience and technical capability so as to mitigate the risk of the Group being exposed/committed to material financial, operational, legal, reputational and/or regulatory risk and/or loss

| RSA Insurance Group plc | Solvency and Financial Condition Report 2016
- 49 -
• Ensure consistency is applied over separate policies that have been written covering operational and technical matters
• Ensure that the risks associated with managing and delegating authorities are mitigated through the use of appropriate preventative and detective controls and remain within Risk Appetite, and
• Ensure compliance with relevant regulatory and statutory requirements.
The Delegated Authority Framework is applied across the Group’s businesses where individuals must operate and/or authorise within limits delegated by the Group Chief Executive Officer, his direct reports and/or governing bodies, and ensures consistency between each of the operating subsidiaries within the Group. The powers of the Board, and the extent to which these powers may be delegated or must be retained are set out in detail in the Matters Reserved for the Board or Terms of Reference for the Board Committees.
Regulatory Compliance Framework
The Regulatory Compliance Framework and policy is owned by the Compliance Function. Its purpose is to safeguard the Group, its customers, reputation and assets by creating a compliant culture, complying with regulatory requirements, and identifying and mitigating regulatory risk.
The Regulatory Compliance Framework has been developed to deliver assurance around the Group’s compliance culture to both internal and external stakeholders. It consists of a compliance policy and related processes and tools. Together they define the minimum standards and controls to be applied in order to identify and mitigate the risk of regulatory breaches and censure.
Each business is responsible for implementing controls to comply with local regulatory requirements and ensuring these controls remain effective with ultimate responsibility resting with its Board, executive and senior management.
Legal control processes provide oversight of data protection, competition law, financial crime and other legal risk. Human Resources control processes primarily provide oversight of whistleblowing and people risk.
B.4.2. Compliance Function
The Group Regulatory Compliance Policy requires all RSA Group businesses to have either a Compliance department or a person responsible for compliance. In 2016, the Group and UK compliance functions were combined to create the Group & UK Regulatory Compliance function (herein the Function).
The purpose of the Function is to ensure that Group Corporate Centre and the UK businesses meet the relevant UK regulatory requirements. It uses a range of tools to do this which are similar to those used by the non-UK country and regional Regulatory Compliance teams. They are an influencer in ensuring strong regulatory compliance culture and ensure mechanisms are in place to identify, report and resolve issues to avoid or minimise business impact and 'surprises‘.
In respect to its group-level activities, the Function provides leadership, oversight, challenge and support to the regional & country regulatory compliance teams to ensure resources and processes serve the business need to meet regulatory requirements effectively.
The Function establishes, implements and maintains an annual Compliance Plan for the Group and UK respectively setting out the compliance work to be undertaken in the upcoming year. The Group and UK plans are presented to the Group Audit Committee and RSAI Board for approval respectively. Regular updates on progress and material changes are provided to the Group Audit Committee.

| RSA Insurance Group plc | Solvency and Financial Condition Report 2016
- 50 -
B.5 Internal audit function
B.5.1 Implementation
The primary purpose of the Group Internal Audit (GIA) function is “to keep RSA safe and improving”. Specifically, it helps the Board and Executive Management to protect the assets, reputation and sustainability of the Group.
GIA does this by assessing whether all significant risks are identified and appropriately reported by management and the second line of defence to the Board and Executive Management; assessing whether they are adequately controlled; and by challenging Executive Management to improve the effectiveness of governance, risk management and internal controls.
GIA is an independent and objective function reporting to the Board. The Group Chief Auditor is a member of the Group Executive Committee and has a primary reporting line to the Chairman of the Audit Committee, with a secondary line to the Group’s Chief Executive Officer. Regional Chief Auditors report directly to the Group Chief Auditor, while recognising local regulation.
GIA’s scope of activities is unrestricted and its audit universe extends to all legal entities, joint-ventures and other business partnerships, outsourcing and reinsurance arrangements. Its scope includes first line control validation, second line control assurance and the system of governance as set out under Solvency II. Whilst it is not the role of GIA to second guess any decisions made by the Board, its scope does include information presented to the Board.
On a semi-annual basis the Group Chief Auditor will submit a six monthly rolling risk based audit plan (i.e. detailed plan for the upcoming six months, together with an outlook for the subsequent six months), including emerging and systemic risks to the Group Audit Committee for review and approval. The six monthly rolling audit plan is developed based on GIA’s independent risk assessment and a prioritisation of the audit universe, considering inputs from Executives, Senior Management and the Group Audit Committee, and GIA’s assessment of various “planning lenses” which include fraud risk and culture.
GIA coverage of the audit universe should be based on the principles of a three year rolling coverage in which it shall aim to cover all inherent high risks twice and all inherent medium risks once. Any high or medium risk areas not covered within the three year time period shall be made transparent to the Group Audit Committee.
The Group Chief Auditor will review and adjust the plan, as necessary, in response to changes in the Group’s business, risks, operations, programs, systems, and controls. Any material changes from the GIA plan will be communicated through quarterly reporting to the Group Audit Committee for approval. When necessary, GIA may conduct audit engagements which are not included in the audit plan, these may be carried out without notice.
In addition to the six monthly rolling audit plan that is reviewed and approved by the Group Audit Committee, the Group Chief Auditor ensures that the function has a multi-year outlook in line with the Group’s strategic and operational plan.
The Group Audit Committee is responsible for approval of GIA’s plan and budget, and reviews and confirms annually that GIA is staffed appropriately and operating effectively. Compliance of audits with the professional standards is monitored within GIA through an independent quality assurance process, outsourced to Deloitte and operated on a continuous basis. The function is governed by an Internal Audit Charter which sets out the function’s role, mandate and authority, and includes independence and objectivity criteria.
B.5.2 Independence and Objectivity
GIA must be independent from management at all times in order to be effective in delivering on its purpose and mandate. Internal Auditors have no operational responsibility or authority over any business activities, day-to-day risk management or control activities. Audit activity will remain free from interference by any element in the organisation, including matters of audit selection, scope, procedures, frequency, timing, or report content to permit maintenance of a necessary independent and objective mind-set.
Internal Auditors are expected to remain independent and objective in all assignments and do nothing that might prejudice or be perceived as prejudicing independence and objectivity. Impairments to independence and objectivity may include, but are not limited to:

| RSA Insurance Group plc | Solvency and Financial Condition Report 2016
- 51 -
• auditing business areas for which an individual previously worked or was previously responsible (auditors must refrain for a period of at least 12 months); and
• auditing an area where an individual has a close relationship with one of its staff (e.g. partner, family member).
If independence or objectivity is impaired in fact or appearance, the details of the impairment must be disclosed immediately to the Group Chief Auditor, who will determine whether the Group Audit Committee will need to be informed.
The Group Chief Auditor reports, at least annually, to the Group Audit Committee on the independence of the Function and its staff. This is supported by a formal assessment of independence and objectivity for long serving staff, together with an independence self-certification signed by all members of GIA staff.

| RSA Insurance Group plc | Solvency and Financial Condition Report 2016
- 52 -
B.6 Actuarial function
The Actuarial Function coordinates the calculation of technical provisions. It provides assurance that the actuarial information to set technical provisions uses appropriate methods, models, and assumptions and it assesses the appropriateness, completeness and accuracy of the underlying data. It also confirms the adequacy of the Solvency II technical provisions and informs areas where experience is different and how this has influenced methods, models and assumptions. The Actuarial Function also provides an opinion on the underwriting policy and the adequacy of reinsurance arrangements. It contributes to the effective implementation of the risk management system.
The Group Actuarial Function holder has independent access to the Group Audit Committee and is also the function holder for RSAI and RSA Re. On an annual basis, the Group Actuarial Function produces Actuarial Function Reports summarising the key conclusions of the Actuarial Function’s work covering the Group, RSAI and RSA Re. Reports covering MIC are produced by the MIC Actuarial Function holder (the UK Actuarial Director). The entity level reports are presented to the Boards of the individual entities. The Group level reports are presented to the Group Audit Committee and/or the BRC.

| RSA Insurance Group plc | Solvency and Financial Condition Report 2016
- 53 -
B.7 Outsourcing
B.7.1 Policy and Key Activities
The Group’s approach to outsourcing is based on a central framework with local adoption and responsibility. The framework is set out in the Group’s Third Party Contracts Policy (which also covers intra-group outsourcing), which is adopted by the RSA local entity boards and rolled out locally. Additional Group policies place further controls on specific types of outsourced contract such as the Technical Delegated Authority Framework which covers external underwriting and claims delegated authorities.
The Third Party Contracts Policy provides a Group wide definition of critical and important activities and functions to ensure consistency of approach. The policy sets out the provisions to be followed in relation to all outsourcing, with additional controls being imposed on critical and important outsourcing. It additionally specifies the operational responsibility and establishes the provisions to be taken into consideration in supplier agreements.
The framework also establishes the necessary responsibilities, maintaining a proper separation of activity, so as to ensure correct local service control through Group Approved Local Supply Chain Processes and maintenance of oversight within the Group.
Service providers of activities designated as critical and important are generally located in the same jurisdiction as the relevant local RSA entity except in relation to the provision of centralised group services (email, calendar, and collaboration services) which are generally provided by RSAI.
The service types outsourced (in whole or in part) in one or more region include:
• IT Infrastructure services
• IT Application development / maintenance
• Loss adjusting
• Print and fulfilment
• Claims handling
• HR / Payroll
• Claims legal services
B.7.2 Intra-Group Outsourcing Arrangements
The Group enters into outsourcing contracts and distribution arrangements with third parties in the normal course of its business and is reliant upon those third parties being willing and able to perform their obligations in accordance with the terms and conditions of the contracts.
RSA local entities also enter into outsourcing agreements with other members of the Group in relation to the efficient provision of services across the Group. Regardless of whether an internal or third party outsourcing arrangement has been entered into, ultimate responsibility for the outsourced activity and regulatory compliance lies with the local entity board.
Specific material intra-group arrangements include the provision by RSAI of the Internal Model framework and certain investment services (such as valuation) to other subsidiaries.

| RSA Insurance Group plc | Solvency and Financial Condition Report 2016
- 54 -
B.8 Any other information
B.8.1 Adequacy of System of Governance
The adequacy of the system of governance is formally considered by the Group Board annually. This process considers both changes and recommendations made during the year (including through Internal Audit, Risk and Compliance reporting) and any recommendations by the Group Corporate Centre departments based on their observations or regulatory change. Should it be deemed necessary, changes can also occur outside of this formal review.
B.8.2 Any other Material Information
Nothing to report.

| RSA Insurance Group plc | Solvency and Financial Condition Report 2016
- 55 -
The previous Section of the report (B. System of Governance) included information on the Group’s risk management system (see Section B.3). This Section of the report provides more detail on the risks faced, including how the Group measures and mitigates against them. The Group is exposed to the following main categories of risk:
• Insurance Risk
• Market Risk
• Credit Risk
• Liquidity Risk
• Operational Risk
• Pension Risk
The first five categories are described in Sections C.1 to C.5 respectively; since Pension Risk is not a separate category in the prescribed SFCR structure, it is addressed under the “C.6 Other material risks” heading. Insurance risk includes claims risk and reserving risk and these are all described under the prescribed heading “C.1 Underwriting risk”.
Section C.7 brings together information on the Group’s stress testing and sensitivity analysis across all categories of risk.
For quantification of the relative importance of each risk type to the Group, see Section E.2.2.
RSAI has adopted the Group risk management system, reflecting the close alignment between RSAI’s risk strategy and risk appetite and that of the Group. Since RSAI is virtually at the top of the Group structure, the risk profile of RSAI is considered to be identical to that of the Group, with the same risks being experienced either directly or via the valuation of its subsidiaries.
RSA Re and MIC have outsourced their risk management system to RSAI. Background information on the specific risks faced by RSA Re and MIC can be found in Appendices 3 and 4 respectively.
C.1 Underwriting risk
C.1.1 Introduction
Underwriting, Claims and Reinsurance risks
The Group manages these risks through its underwriting strategy, reinsurance arrangements and proactive claims handling.
The Group Risk Appetite statement sets the high level appetite for Insurance Risk.
Additionally, the Group has a centrally managed forum to examine Group underwriting and Claims issues, review and agree underwriting direction and set policy, frameworks and directives where appropriate.
The underwriting strategy aims to ensure that the underwritten risks are well diversified in terms of type and amount of risk, industry and geography.
The Group Underwriting Line of Business Risk Appetite statements set the context within which individual Portfolio strategy statements are developed, setting the appetite for the writing of individual risks.
Specific to the Group Risk Appetite, the Underwriting and Claims Policies define the controls implemented to manage the Group's limited appetite for:
• 'Special High Risks' including long term policies and lines of business where RSA lacks appropriate specialist expertise and Reinsurance support e.g. Aviation and Space

| RSA Insurance Group plc | Solvency and Financial Condition Report 2016
- 56 -
• Writing business in ‘High Risk Countries’ designated due to sanctions or presenting an unacceptable level of operational risk. The High Risk Country Committee periodically reviews and communicates ‘High Risks Countries’
Reserve risk
The Group establishes technical provisions for claims to account for the anticipated ultimate cost of all claims and relevant expenses for claims that have already occurred. The Group establishes technical provisions for both reported and unreported claims. Technical provisions estimates are based on known facts and on interpretation of circumstances including the Group’s experience with similar cases and historical claims payment trends. The Group also considers the development of claims payment trends, levels of unpaid claims, judicial decisions and economic conditions.
C.1.2 Measures Used to Assess Risk
Underwriting and Claims risk
The Group’s underwriting strategy and risk appetite are reviewed, challenged and approved by the Group Board annually.
Key risk indicators assess risk against the Board risk appetite and these are reported at the quarterly Regional Control and Risk Committees. Underwriting risk indicators include measures for exposure control, pricing, the control environment and licences.
Portfolio strategy is reviewed quarterly under the Portfolio Risk Management process (Insurance Risk Portfolio Classification). This enables ongoing, proactive management of the implementation of portfolio strategies together with facilitation of forward looking portfolio risk assessments against measured key risk indicators. Risks and issues are escalated to Regional Risk & Control Committees and the BRC.
Claims fall within the scope of Insurance Risk Portfolio Classification, but claims risks are also monitored separately to facilitate management within appetite. The scope of claims risk indicators covers financial control, technical claims handling quality, case reserving, fraud, and control of delegated authorities.
Scenario and Stress testing and Risk Profiling are undertaken within each Region and are reported through the Regional Risk & Control Committees and to the Group Board.
Accumulations for static exposures are modelled using the GAIA Exposure Data Management system to identify ‘Per Risk’ and Catastrophe risk concentrations and to inform scenario modelling and reinsurance purchase. The Exposure Management Working Group has formal oversight and reporting of the standards for data quality and the minimum requirements for identifying and controlling ‘Per Risk’ and Catastrophe risk concentrations.
The effectiveness of pricing tools and process is measured through the Pricing Capability Assessment Questionnaire to benchmark the capability against defined measures. The Pricing Capability Assessment Questionnaire defined measures include an assessment of the pricing components i.e. use of historical claims frequencies and severity averages, adjusted for inflation and modelled catastrophes trended forward to recognise anticipated changes in claims patterns and allowance in the pricing procedures for acquisition expenses, administration expenses, investment income, the cost of reinsurance, and for a profit loading that adequately covers the cost of capital.
Underwriting and Claims Validation Reviews are held periodically to test the effectiveness of the processes and controls in the risk management frameworks. Gaps in compliance with the controls require either a Remediation Plan, Risk Acceptance or Exception against the respective control(s) under the Group Risk Policy Management process. Group Underwriting and Claims monitor the progress of Remediation Plans and is the approver for Risk Acceptances and Exceptions. These are reported to the Group Audit Committee, with overdue items escalated to the Senior Claims Underwriting and Reinsurance Management forum.
Breaches of controls are escalated and reported, with material Risk Events escalated to Group Risk and BRC.

| RSA Insurance Group plc | Solvency and Financial Condition Report 2016
- 57 -
Reserve risk
The Group has a Group Reserving Committee chaired by the Group Chief Financial Officer and consisting of the Group Chief Executive Officer, Group Underwriting Director, Group Chief Actuary and Group Chief Risk Officer. A similar committee has been established in each of the Group’s major operating entities. The Group Reserving Committee monitors the decisions and judgements made by the business units as to the level of technical provisions to be held and recommends the level to the Group Chief Executive Officer and Chief Financial Officer. The Group Chief Executive Officer and Chief Financial Officer then determine the level of technical provisions to be recommended to the Group Audit Committee for final approval.
In forming its collective judgement, the Committee considers the following information:
• An actuarial indication of ultimate losses together with an assessment of risks and possible favourable or adverse developments that may not have been fully reflected in calculating these indications. At the end of 2016 these risks and developments include: the possibility of future legislative change having retrospective effect on open claims; changes in claims settlement procedures potentially leading to future claims payment patterns differing from historical experience; the possibility of new types of claim, such as disease claims, emerging from business written several years ago; general uncertainty in the claims environment; the emergence of latent exposures such as asbestos; the outcome of litigation on claims received; failure to recover reinsurance and unanticipated changes in claims inflation
• The views of internal peer reviewers of the reserves and of other parties including actuaries, legal counsel, risk directors, underwriters and claims managers
• How previous actuarial indications have developed.
C.1.3 Material Risks
Material risks identified during the reporting period include:
• Catastrophe Risk: Covers the risk that a single event or series of events of major magnitude usually over a short period, leads to a significant increase in actual claims compared to total expected claims. Losses can arise from either natural perils, for example hurricane, windstorm, flood and earthquake, or from man-made perils, for example industrial accident.
• Pricing Risk: The risk that portfolio pricing strategies, monitoring and rating are insufficient to generate sufficient returns in key portfolios to maintain profitability and pay claims.
• Reserving Risk: The risk that case reserves are insufficient, untimely or inaccurate leading to unforeseen adverse development. The risk that more claims are reported in future than anticipated. The risk that legislative changes have a retrospective effect on claim settlements.
• Underwriting Risk Selection: Covers the risk that claims arising on exposures after the valuation date are higher (or lower) than assumed in the pricing other than due to catastrophes. This can arise as the result of bad experience, third party interventions, ineffective portfolio management, poor pricing, poor risk selection or failure to underwrite effectively.
• Claims Management Risk: Financial losses through ineffective claims management processes, due to management information or process deficiencies (claims leakage).
There have been no material changes to the risks identified above through the reporting period.
C.1.4 Application of the Prudent Person Principle
The prudent person principle is not applicable to underwriting risk.
C.1.5 Material Risk Concentrations
As a multinational insurer, the Group has exposures all over the world. Material risk concentrations are identified through a robust process via the Group Underwriting Catastrophe Modelling Committee. The Group’s two peak Natural Catastrophe zones are Northern European windstorm and Canadian West Coast earthquake where the Group reinsures up to £1.55bn and C$3.3bn respectively.

| RSA Insurance Group plc | Solvency and Financial Condition Report 2016
- 58 -
Large individual risks, for example city centre shopping centres, are closely monitored via the risk management system. These are protected both by the Group Risk treaty and, in a multiple loss scenario, by the Group Catastrophe treaty.
C.1.6 Risk Mitigation
The Group operates a comprehensive risk management system and policy management framework. This system includes policies which govern key activities such as Underwriting, Claims, Reinsurance and the assessment of insurance risks. The policies introduce a system of mandatory controls frameworks which stipulate a system of minimum requirements and standard controls, and key risk indicators which are used to measure the effectiveness of these controls in mitigating risk. Each quarter, management are required to report on the operation and effectiveness of these controls to governance committees. Key risks are escalated to functional Risk Committees and to the BRC. Controls which are not considered effective are subject to remedial action and risk oversight.
The Underwriting and Claims governance and control framework spans a number of key activities, including (but not limited to):
• The Delegation of Technical Authority (Internal and External) including Licensing and Referrals
• Portfolio Strategy, Performance and Risk Management
• Pricing
• Accumulation and Exposure Management
• Multi-National Risks
• Risk Control / Inspection
• Underwriting and Claims File Review / Validation
• Claims Management Processes
• Case Reserving
The management and mitigation of credit risk for reinsurance are described in Section C.3.6 Risk Mitigation.
Reinsurance is a key tool used to mitigate the effect of catastrophe and underwriting risks. Reinsurance arrangements in place include treaty and facultative covers. The Group's treaty reinsurance is largely excess of loss in nature but also includes a small number of proportional covers. The effect of such reinsurance arrangements is that the Group should not suffer total net insurance losses beyond the Group’s risk appetite in any one year.
The Group is exposed to both multiple insured losses and losses arising out of a single occurrence, for example a natural peril event such as a hurricane, flood or earthquake.
The Group centrally purchases significant catastrophe cover, buying to a minimum return period of 1:200, higher if required by local regulators. All catastrophe reinsurance is placed with reinsurers with a Standard & Poor’s credit rating of A- or better. The Group Catastrophe Treaty protects all the Group entities: any locally placed covers will sit beneath the Group cover and will comply with the Group standard of counterparty and minimum reinstatement provisions.
The 2015 reinsurance programme included a Group Volatility Cover, designed to protect against aggregate losses (i.e. to reduce the company’s net exposure to multiple, moderate losses in excess of £10m) but was also available as a top-most layer on the Catastrophe reinsurance programme in years where the aggregate protection is not used. This cover was placed on a three year term, and in 2016 the cover was renegotiated to provide the same level of cover, but attaching at a slightly lower level to reflect the changes in the Group due to disposal of business in Asia and Latin America. The cover remains in place for 2017.

| RSA Insurance Group plc | Solvency and Financial Condition Report 2016
- 59 -
The Group remains primarily liable as the direct insurer on all risks reinsured, although the reinsurer is liable to the Group to the extent of the insurance risk ceded.
RSAI, RSA Re and MIC are all covered by the treaty and facultative protection described above.
C.1.7 Risk Sensitivity
See Section C.7 (Any other information) for information on stress testing and sensitivity analysis for all categories of material risk.
Group aggregate cover £150m xs £150min respect of qualifying losses
UK Cat Rest of World Cat
Marine Risk & Event
Property Risk
£20m retention
£75m retention
£50m retention(C$75m in
Canada/US)
Various layers providing cover up to:
• £1.55bn for UK/Europe
• C$3.3bn for Canada
• £400m all other territories
• C$400m for US/Caribbean
£50m retention
Various layers providing cover up to £400m
Various layers providing cover up to US $275m

| RSA Insurance Group plc | Solvency and Financial Condition Report 2016
- 60 -
C.2 Market risk
C.2.1 Introduction
The Group is exposed to market risk, which is the risk of potential losses from adverse movements in market prices including those of bonds, equities, property, exchange rates and derivatives as well as credit rating downgrade risk, credit spread risk, credit default risk and asset-liability matching risk.
C.2.2 Measures Used to Assess Risk
The Group assesses its market risk exposures through a number of factors including: exposure by asset class; credit rating of counterparties; asset liability mismatch due to divergence in duration and currency exposures; and concentration exposures. In addition stress and scenario analysis is undertaken to assess market risk exposures.
Exposures are controlled by the setting of investment limits and managing asset-liability matching in line with the Group’s risk appetite.
The Group Investment Committee, on behalf of the Group Board, is responsible for reviewing and approving the investment strategy for the Group’s investment portfolios. It provides approval for all major changes of the Group’s investment strategy. Importantly the Group Investment Committee also approves the terms of reference of the Group’s main operational investment committee, the Group Asset Management Committee. The Group Asset Management Committee reviews and approves any substantive changes to the balance of the Group’s funds within the strategy framework agreed by the Group Investment Committee. In addition, asset liability matching both by currency and duration is monitored and reported to the Group Asset Management Committee.
The BRC sets the Group’s risk appetite and issues investment risk limits to the Group Asset Management Committee.
This includes limits on asset class exposures, single counterparty exposures, aggregate bonds by credit rating, portfolio duration etc. These limits aim to keep exposures within the Group’s risk appetite whilst ensuring the portfolio is sufficiently diversified. Investment exposures relative to these limits are regularly monitored and reported.
A number of the Group’s property holdings are Group occupied and therefore are reported as Property, plant & equipment held for own use in the Solvency II balance sheet. The Group’s investments in investment property are recorded separately and these investments are held as part of an efficient portfolio management strategy.
Operational currency risk is managed within the Group’s individual operations by broadly matching assets and liabilities by currency.
Structural currency risk is managed at a Group level through currency forward and foreign exchange option contracts. In managing structural currency risk, the needs of the Group’s subsidiaries to maintain net assets in local currencies to satisfy local regulatory solvency and internal risk based capital requirements are taken into account. These assets should prove adequate to support local insurance activities irrespective of exchange rate movements. Consequently, this may affect the value of the consolidated shareholders’ equity expressed in Sterling.
There have been no material changes in exposure over the reporting period.
C.2.3 Material Risks
The Group is exposed to the following material Market risks:
Interest rate risk
The fair value of the Group’s portfolio of fixed income securities is inversely correlated to changes in market interest rates. Thus if interest rates fall, the fair value of the portfolio would tend to rise and vice versa.

| RSA Insurance Group plc | Solvency and Financial Condition Report 2016
- 61 -
In assessing this risk the Group will have reference to the interest rate exposures of its liabilities with risk being the difference between asset and liability exposures
Equity price risk
The Group’s portfolio of equity securities is subject to equity risk arising from changes in market price. Thus if the value of equities rise, so will the fair value of its portfolio and vice versa
Property price risk
The Group’s portfolio of properties is subject to property price risk arising from changes in the market value of properties. Thus if the value of property falls so will the fair value of the portfolio and vice versa.
Currency risk
The Group operates in a number of countries. Accordingly, its net assets are subject to foreign exchange rate movements. The Group’s primary foreign currency exposures are to the Danish Krone, Euro, Canadian Dollar and the Swedish Krona. If the value of Sterling strengthens then the value of non-Sterling net assets will decline when translated into Sterling and consolidated.
The Group incurs exposure to currency risk in two ways:
• Operational currency risk – by holding investments and other assets and by underwriting liabilities in currencies other than the currency of the primary environment in which the business units operate (non-functional currencies)
• Structural currency risk – by investing in overseas subsidiaries and operating an international insurance group.
There have been no material changes in the material market risks throughout the reporting period.
C.2.4 Application of the Prudent Person Principle
The Group applies both Market Risk & Liquidity Risk policies that set out the minimum requirements for the identification, measurement, monitoring and reporting of Market and Liquidity Risk for the Group’s investment portfolio. A set of key risk indicators in the form of an Investment Limits framework has been developed alongside the policy - the policy refers to this for investment risk management and reporting purposes.
In particular, the Prudent Person Principle requires each operation and the Group to exercise prudence in relation to the investment portfolio and to ensure assets are appropriate to the nature and duration of its liabilities (assets and liabilities management). It must also be able to show that it has appropriate systems and controls to hold and manage any such investments.
The Prudent Person Principle also requires a duty of care that must be applied for investments that are of non-routine nature, or that are not admitted to trading on a regulated financial market or to complex products such as derivatives or securitised instruments. The Group follows a high quality, low risk investment strategy with limited exposure to higher volatility investment classes such as equities, or to balance sheet foreign exchange volatility. Asset and liability duration is broadly matched, with limited flexibility for tactical asset management.
The Group’s portfolio focus is on high quality bonds and cash, with measured holdings in equities and property. At 31 December 2016, the Group held over 62% of its investment assets in government bonds and “AAA” rated non-government bonds, minimising any liquidity risk and enabling funds to be transferred when required. The credit rating of the bond portfolio of the Group is predominantly investment grade with 99% of bonds held rated BBB or higher at 31 December 2016.

| RSA Insurance Group plc | Solvency and Financial Condition Report 2016
- 62 -
C.2.5 Material Risk Concentrations
The Group’s investment portfolio consists predominantly of high quality, investment grade, fixed income assets broadly reflecting the duration of its underlying insurance liabilities. The fixed income assets are well diversified by sector and geography with 31% of the investments in the SII balance sheet comprising government securities (see Section D1.1 for a breakdown of investment assets).
C.2.6 Risk Mitigation
The Group maintains for its general insurance business a low risk, high quality portfolio with exposure concentrated in bonds and cash and only limited exposure to equity and property. Credit risk exposure is mitigated by the high quality nature of the portfolio with circa 99% investment grade and 72% rated AA or above. Counterparty concentration risk is limited through limits placed on single counterparties reflecting a number of criteria including the counterparties’ credit rating, industry and geography. The Group ensures that it maintains sufficient liquidity for its needs by having a minimum exposure to highly liquid assets such as cash, bonds rated AAA and government and government guaranteed bonds.
Interest rate risk is limited through the Group maintaining a strong match of its bond asset duration relative to its liabilities. The Group maintains a limit of its asset duration being within one year relative to the duration of its liabilities. Exposures are monitored by the Group Risk, Investments & Treasury Committee on a monthly basis and reported to the Group Asset Management Committee.
The Group also mitigates its exposure to currency risk through partial hedging of its surplus within its principal subsidiaries through a combination of foreign exchange forward and option contracts.
The Group may use derivative financial instruments for the purpose of reducing its exposure to adverse fluctuations in interest rates, foreign exchange rates, equity prices and long term inflation. The Group adopts a low risk approach with risk mitigated through use of tight risk limits and regular monitoring against this. The Group does not use derivatives to leverage its exposure to markets and does not hold or issue derivative financial instruments for speculative purposes. The policy on use of derivatives is approved by the BRC.
The Group invests in assets that are not regularly traded such as direct property and funds investing in loans and infrastructure. The management of these assets is primarily outsourced to third party fund managers and the underlying exposures are subject to regular independent valuations. In addition, a number of the Group’s committees including the Group Asset Management Committee review the exposures on a regular basis to ensure they remain within the Group’s Risk Appetite.
The Group risk mitigation techniques described above are applied where appropriate to RSAI, RSA Re and MIC.
Refer to the Risk Management System in Section B3 for a description of how the Group manages and monitors market risk.
C.2.7 Risk Sensitivity
See Section C.7 (Any other information) for information on stress testing and sensitivity analysis for all categories of material risk.

| RSA Insurance Group plc | Solvency and Financial Condition Report 2016
- 63 -
C.3 Credit risk
C.3.1 Introduction
Credit risk is defined as the risk of loss resulting from a counterparty failing to fulfil its contractual obligations to the Group or failing to do so in a timely manner. The Group is exposed to credit risk in respect of its reinsurance contracts; insurance operations (where counterparties include brokers, policy holders and suppliers); and investments (where counterparties include governments and corporate bond issuers).
C.3.2 Measures Used to Assess Risk
Credit risk arises any time Group funds are extended, committed, invested or otherwise exposed through actual and/or implied contractual agreements with counterparties whether reflected on or off balance sheet.
The BRC is responsible for ensuring that the Board approved Group credit risk appetite is not exceeded. This is done through the setting and imposition of Group policies, procedures and limits.
In defining its appetite for counterparty credit risk the Group looks at exposures at both an aggregate and business unit level distinguishing between credit risks incurred as a result of offsetting insurance risks or operating in the insurance market (e.g. reinsurance credit risks and risks to receiving premiums due from policyholders and intermediaries) and credit risks incurred for the purposes of generating a return (e.g. invested assets credit risk).
Limits are set at both a portfolio and counterparty level based on likelihood of default, derived from the rating of the counterparty, to ensure that the Group’s overall credit profile and specific concentrations are managed and controlled within risk appetite.
Financial assets are graded according to company standards. AAA is the highest possible rating. Investment grade financial assets are classified within the range of AAA to BBB ratings. For invested assets, restrictions are placed on each of the Group’s investment managers as to the level of exposure to various rating categories including unrated securities.
Local operations are responsible for assessing and monitoring the creditworthiness of their counterparties (e.g. policyholders, brokers, and third party suppliers). Reinsurer counterparty credit risk is set by Group Reinsurance. Local credit committees are responsible for ensuring these exposures are within the risk appetite of the local operations. Exposure monitoring and reporting is embedded throughout the organisation with aggregate credit positions reported and monitored at Group level.
C.3.3 Material Risks
The Group is mainly exposed to the following types of Credit Risk:
• Counterparty risk: defined to be the risk that a counterparty fails to fulfil its contractual obligations and/or fails to do so in a timely manner. This includes all types of counterparties such as Agents, Brokers, Reinsurers and other third parties.
• Credit Concentration risk: defined to be an uneven distribution of exposure to counterparties, single-name or related entity credit concentration, and/or in industry and/or services sectors and/or geographical regions.
• Credit Downgrade risk: defined to be the loss or gain from a change in a investment's credit rating agency rating and/or an analyst buy, sell, hold opinion.
• Credit spread risk: defined as the spread in returns between Treasury and/or Government securities and/or any non-Treasury security that are identical in all respects except for the quality of the credit rating of the non-Treasury security’s counterparty.
Each RSA business is required to establish appropriate processes in order to identify its outstanding debt and the aging of that debt.
Each RSA business is required to implement processes and procedures in order to collect its outstanding debt in a manner that is consistent with the credit terms provided.

| RSA Insurance Group plc | Solvency and Financial Condition Report 2016
- 64 -
In cases where collection is delayed or is not possible, each business is required to record a provision or write off of the debt according to local and Group Financial Reporting Standards.
Within the Group, the management of Credit Risk is divided into three key areas, which are governed by separate policies:
• Reinsurance
• Investments
• Insurance Operations
C.3.3.1 Reinsurance Credit Risk management
Reinsurance Credit Risk is defined as the credit risk arising from the purchase of all Group treaty reinsurance and at the local level for the purchase of treaty reinsurance and facultative reinsurance by underwriters in accordance with their licences.
C.3.3.2 Invested Assets Credit Risk, Credit downgrade and credit spread risk
Invested Assets Credit Risk is defined as the non-performance of contractual payment obligations on invested assets, and adverse changes in credit worthiness of invested assets including exposures to issuers or counterparties for bonds, equities, deposits and derivatives etc. Invested asset credit risk arises in all investment portfolios throughout the Group including treasury Smaller Operations. Credit Downgrade risk is defined to be the loss or gain from a change in an investment's credit rating agency’s rating and/or an analyst's buy, sell, hold opinion. Spread Risk is defined as the risk that arise from negative movement in price in a sector relative to the market resulting for example from the changes in the markets perceived view of the industry sector.
C.3.3.3 Credit Risk arising from Insurance Operations
Insurance Operations Credit Risk is defined as credit risk arising from carrying out daily insurance business operations. This includes loss of principal or financial reward resulting from a counterparty’s failure to pay or fulfil all or part of its contractual obligations. For example, if the Group trades with an insolvent broker there is a risk that the Group will not receive all the premiums due from that broker.
C.3.4 Application of the Prudent Person Principle
See Section C.2.4 for the application of the prudent person principle to credit risk arising from investments. The prudent person principle is not applicable to credit risk in relation to reinsurance and insurance operations.
C.3.5 Material Risk Concentrations
The Group is exposed to the following types of risk concentrations:
• Reinsurance Counterparties
• Investment Counterparties
• Off Balance Sheet Guarantees
C.3.5.1 Reinsurance Counterparties
The Group Reinsurance Credit Committee oversees the management of credit risk arising from the reinsurer failing to settle its liability to the Group. Group standards are set such that reinsurers that have a financial strength rating of less than ‘A-’ with Standard & Poor’s, or a comparable rating, are removed from the Group’s authorised list of approved reinsurers unless the Group’s internal review discovers exceptional circumstances in favour of the reinsurer. Collateral is taken, where appropriate, to mitigate exposures to acceptable levels.

| RSA Insurance Group plc | Solvency and Financial Condition Report 2016
- 65 -
The Group’s use of reinsurance is sufficiently diversified that it is not concentrated on a single reinsurer, or any single reinsurance contract. The Group regularly monitors its aggregate exposures by reinsurer group against predetermined reinsurer Group limits, in accordance with the methodology agreed by the BRC. The Group’s largest reinsurance exposures to active reinsurance groups are Munich Re, HDI, and Swiss Re. At 31 December 2016 the reinsurance asset recoverable from these groups does not exceed 2.4% of the Group’s total financial assets. Stress tests are performed by reinsurer counterparty and the limits are set such that in a catastrophic event, the exposure to a single reinsurer is estimated not to exceed 6.1% of the Group’s total financial assets.
C.3.5.2. Investment Credit Risk
For material investment risks, see Section C.2.5.
C.3.5.3 Off Balance Sheet Guarantees
The Group has exposure to certain off balance sheet guarantees issued under secured Letter of Credit facilities. The Group does not consider there to be any material risk concentration. As at 31 December 2016 no Letters of Credit had a value greater than £150m.
C.3.6 Risk Mitigation
The Group employs the following mitigating techniques and monitoring procedures in order to manage the different types of Credit Risk:
C.3.6.1 Reinsurance Credit Risk Management
Mitigation techniques
Group Corporate Centre
• Group Reinsurance Credit Committee – The Committee is responsible for the oversight of the Group’s reinsurance counterparty credit risk, managing exposures as described in Section C.3.5.1.
• Approved Reinsurance Counterparties - Group Reinsurance assess and approve all reinsurance counterparties. Group Reinsurance maintain information on all reinsurance counterparties used across the Group.
• Approved Reinsurance Counterparties meet Corporate Standards - Due diligence is performed, Group Reinsurance monitor and maintain the Approved Reinsurance Counterparties lists as part of an ongoing risk assessment of reinsurance counterparties. Where a reinsurance counterparty credit risk metric is approached or breached, risk response actions must be effected and reported to the Group Reinsurance Credit Committee.
• Appropriate Metrics - Group Reinsurance establish metrics which are appropriate for quantifying reinsurance counterparty credit risk across the Group.
Business unit requirements
• Contract initiation - Before entering into an outward reinsurance contract a business must ensure and document that it has followed all the requirements of the Reinsurance Policy, this policy and the requirements of the Group’s provisioning policy and reinsurer watch-list requirements, notifying Group Reinsurance of material recovery issues, or pending legal actions, so that the Group can ensure that the Group’s interests are not jeopardised.
• Exposure approval - Businesses must seek approval for reinsurance exposures outside the Group Reinsurance Credit policy and standards through the Group’s reinsurance appeals process.
• Risk Mitigation techniques - Where risk mitigation techniques, such as the acceptance of collateral, are used they should be well understood by the business and appropriate processes and procedures must be established to operate the mitigant. The use of off balance sheet guarantees or Letters of Credit are approved on an individual basis.

| RSA Insurance Group plc | Solvency and Financial Condition Report 2016
- 66 -
Monitoring Process
• Credit Risk Profile - Group Reinsurance review the reinsurance counterparty credit risk profile quarterly, and monitor reinsurance counterparty exposure against Maximum Probable Exposure limit quarterly.
• Breaches - Where a reinsurance counterparty credit risk metric is approached or breached, risk response actions are effected and reported to the Group Reinsurance Credit Committee.
• Ongoing information on counterparties - Group Reinsurance must maintain information on all reinsurance counterparties used across the Group.
• Quarterly Reporting - All business units must produce regular quarterly reinsurance counterparty credit risk reports covering their counterparties, and notify all known breaches of policy or appetite immediately.
C.3.6.2 Investment Credit Risk
Mitigation techniques
• See Section C.2.6.
Monitoring Process
• All operations review their investment exposure against limits delegated by the Group Asset Management Committee and report these to Group Corporate Centre on at least a monthly basis. Separately, external fund managers, used by the Operations, monitor their investment exposures against limits stipulated within their Investment Management Agreements. These limits are set by the Operations such that they are consistent with limits delegated to them by the Group Asset Management Committee. In addition, the Group Risk, Investments & Treasury Committee reviews exposures against the Group Asset Management Committee limits for the major operations as well as the BRC limits for the aggregate global position on a monthly basis and reports to the Group Asset Management Committee.
C.3.6.3 Insurance Operations Credit Risk
Mitigation techniques
• Credit Risk Committee - All businesses must have a Credit Risk committee, responsible for identifying, assessing, maintaining, monitoring and reporting on Insurance Operations Credit Risk exposures. The Balance Sheet Committee performs this function at a Group level.
• Debt Reconciliations - Outstanding balances from the general ledger have to be agreed to supporting documentation and overdue payments are chased.
• Completion of Due Diligence activities – Each business must confirm material facts about the counterparty by reviewing several elements such as Annual and Quarterly Financial information for the past three years, Financial Projections, Capital Structure, list of top ten suppliers and history of the past two fiscal years (including current year to date)
• Credit Terms are set for each counterparty - Each business must set credit terms prescribed by Group according to the nature and credit standing of each counterparty. These criteria and the acceptable credit terms are documented on the Insurance Operation Credit Risk policy.
• Procedures for Loans and Insurance of Mortgages – Each business must put in place procedures that govern the credit assessment of granting of loans to counterparties and the insurance of mortgages.
• Global Network Partners – The Group performs due diligence and credit risk assessments on Global Network Partners for all businesses.
Monitoring Process
All operations have to provide the following on a quarterly basis:
• Aged Debtors and Balances
• Breakdown of Debtors

| RSA Insurance Group plc | Solvency and Financial Condition Report 2016
- 67 -
• Top 20 Debtors, how much they owe, their credit rating (S&P ratings to be used with justification if an alternative is used), length of extended credit, whether they have exceeded their limit, if so action to recover or cancel relationship/business until 100% of the amount is received or at least amounts beyond 60 days
• Aged Debtors Variance Analysis (Budget vs Actuals)
• Major credit concentrations by counterparty, counterparty groups. or connected counterparties
• Key Performance Indicators – Debtor days (movement against prior quarter and prior year) Targets set by local regions
• Bad debt report providing exposure and estimated recovery by counterparty classified into appropriate buckets, e.g. days past due
C.3.7 Risk Sensitivity
See Section C.7 (Any other information) for information on stress testing and sensitivity analysis for all categories of material risk, including credit spread risk.
The Group is not exposed to any significant counterparty default credit risk sensitivity that is considered plausible. Historically, the Group has not had to write off any significant balances due to counterparty default. Therefore credit risk is not included in these tests.

| RSA Insurance Group plc | Solvency and Financial Condition Report 2016
- 68 -
C.4 Liquidity risk
C.4.1 Introduction
Liquidity risk refers to the risk of loss to the Group as a result of assets not being available in a form that can immediately be converted into cash or the securing of such assets at excessive cost (whether through borrowing or overdraft arrangements for example), and therefore the consequence of not being able to pay its obligations when due.
C.4.2 Measures Used to Assess Risk
The Group breaks down liquidity risk into three subcategories:
• Funding liquidity risk: the risk that the business may be unable to liquidate assets, secure funding and/or contingency funding arrangements, and/or of excessive and/or prohibitive clauses in such funding and/or contingency funding arrangements, and/or the withdrawal and/or curtailment of funding facilities
• Foreign currency liquidity risk: the risk that actual and/or potential future outflows in a particular currency are unable to be met from likely available inflows in that currency or purchased in the foreign exchange market
• Intra-day liquidity risk: the risk that liquidity requirements increase during the course of a business day due to delays in settlement proceeds being received and/or problems in the workings of banking or other settlement systems
Suitable monitoring processes are in place to assess all of the above including:
• Creation and maintenance of short-term cashflow forecasts, including by non-functional currency
• Regular dialogue with the Group’s operational bankers in each territory
• Use of liquidity Key Performance Indicators to measure the proportion of assets that can be liquidated within a specified time period of 20 working days
C.4.3 Material Risks
The Group considers that there are currently no material liquidity risks. Further, the Group considers there to be no material risks in the UK subsidiaries subject to separate regulatory reporting obligations.
There have been no material changes throughout the reporting period.
C.4.4 Application of the Prudent Person Principle
See Section C.2.4 for information on the Prudent Person Principle.

| RSA Insurance Group plc | Solvency and Financial Condition Report 2016
- 69 -
C.4.5 Material Risk Concentrations
The Group
The Group maintains a strong and liquid portfolio of cash and investment assets which are monitored by type and duration in order to match its liabilities. A minimum of 25% of assets is required to be highly liquid.
For more information see the Liquidity Risk table in Note 5 of the Group Annual Report and Accounts.
Royal & Sun Alliance Insurance plc
RSAI maintains a strong and liquid portfolio of cash and investment assets which are monitored by type and duration in order to match RSAI’s liabilities.
Royal & Sun Alliance Reinsurance Limited
Liquidity Risk Concentrations are considered immaterial.
The Marine Insurance Company Limited
Liquidity Risk Concentrations are considered immaterial.
C.4.6 Risk Mitigation
The Group minimises risk by operating a high quality, low risk investment strategy which matches a relatively short liability duration.
Each operation adheres to a liquidity policy (for entities outside the UK, of at least 25% of investment assets are to be held in cash, cash instruments, unencumbered “AAA” rated bonds and appropriate domestic government bonds) that ensures that adequate liquid resources are maintained at all times such that liabilities can be met as they fall due.
In addition, each operation produces a range of cashflow forecasts from short-term operational plans to 3 year forecasts in conjunction with the Group’s core planning processes.
Group Treasury maintain a contingency funding plan that considers access to a range of funding options and sources under normal and stressed scenarios.
C.4.7 Expected Profit in Future Premiums
The Expected Profit in Future Premiums (EPIFP) is the profit relating to existing contracts with premium due in the future but not yet received at the valuation date. The EPIFP has been calculated for each homogeneous risk group – loss-making policies have only been offset against profit-making policies within a homogeneous risk group.
At the valuation date the EPIFP was:
£m
The Group 179 RSAI 16 RSA Re - MIC -

| RSA Insurance Group plc | Solvency and Financial Condition Report 2016
- 70 -
C.4.8 Risk Sensitivity
See Section C.7 (Any other information) for information on stress testing and sensitivity analysis for all categories of material risk.
The Group does not currently consider liquidity risk as a material risk. This decision is reviewed on a regular basis.

| RSA Insurance Group plc | Solvency and Financial Condition Report 2016
- 71 -
C.5 Operational risk
C.5.1 Introduction
Operational risk is defined as the risk of loss resulting from inadequate or failed internal processes, people and systems, or from external events. Operational risks are inherent in the Group’s operations, and are typical of all enterprises.
C.5.2 Measures Used to Assess Risk
Operational risk exists in almost every aspect of business within RSA, and the effective management of operational risk plays a significant role in enabling the business to meet its strategic objectives.
The Risk Management Policy documents both the policy requirements for the identification, measurement, management, monitoring and reporting of operational risk, as well as setting out the processes and procedures for the effective operation of the risk management system. The risk management system sets out RSA’s approach to minimising and/or preventing the risk of material loss, reputational damage or liability arising from the failure to comply with risk requirements with a particular focus on operational risk.
In order to facilitate identification and control, the business breaks down operational risk into four sub-categories:
• Process risk: the risk of direct or indirect loss resulting from inadequate or failed internal processes
• Systems risk: the risk of direct or indirect loss resulting from inadequate or failed infrastructure of the organisation including network, hardware, software, communications and their interfaces
• People risk: the risk of direct or indirect loss resulting from the deliberate or unintentional actions of employees and/or management of the business or from their inaction
• External risk: the risk of direct or indirect loss resulting from events outside the business control or from events that impact on an external relationship
The Line 1 business functions, supported by the Regional and Group risk functions, ensure that new risks are identified, which can include risks created by changes to the business strategy, and are appropriately reflected in their Risk Profiles and Risk Appetite scorecards.
A number of information sources should be used to support identification processes. These include
• control assessments supported by testing such as validation and assurance activities;
• key risk indicators supporting the risk appetite framework;
• material business changes, including transformational activity;
• emerging risk assessments; and
• external incidents and internal incidents, which are supported by root cause analyses where appropriate.
Once material risks have been identified the business function must update its risk profile by including the risk net of mitigation, i.e. the residual risk (the risk of an event occurring which would crystallise a loss assuming existing controls and other mitigating actions are effective), and recorded on a standard 5x5 Probability and Impact Matrix. The assessment of impact is made using both quantitative financial measures and qualitative reputational scales with consideration to potential impacts that could be incurred should the risk arise. Probability assessments run from Very High (more likely than not to happen) to Very Low (less than once in 200 years) and are made with reference to the probability of a scenario arising that would result in these impacts being incurred. Assessments are made by the Line 1 risk owner supported (and challenged) by the risk function.
The business function assesses all residual risks to determine if the risk is within risk appetite, and if not whether there is a plan with an owner to bring the risk within appetite within a reasonable timeframe.
Risk profiles, risk appetite scorecards and where applicable action plans are reviewed and challenged by the risk functions and at appropriate Risk Committees.

| RSA Insurance Group plc | Solvency and Financial Condition Report 2016
- 72 -
An annual sense check compares the operational risk capital scenario assessments to the operational risks included on the risk profiles to ensure consistency and completeness of the risks assessed and the assessments themselves.
There have been no material changes over the reporting period.
C.5.3 Material Risks
The Group
The material risks that the Group is exposed to are as follows:
Risk Description
Programme Transformation Change
A major project critical to strategic business objectives is running behind schedule and/or incurring additional unbudgeted costs.
Additional strain placed on business by key Business as Usual staff being enrolled on projects, resulting in work backlogs, untimely turnaround/response times, staff stress, pressure from increased workloads
Legal / Legislative Non-Compliance
The firm incorrectly interprets law or legislation and/or erroneously excludes crucial terms and conditions (from non-insurance policy contracts) leading to minor sanctions, negative reputational consequences and/or change in business practices/decisions.
Firm fails to comply with changes in legislation, laws, supervisory directives, market directives, accounting practices, taxation requirements, or other requirements issued by relevant authorities within prescribed time.
Receipt of bribes / inducements to secure business / opportunities, acting in a way considered anti-competitive.
Inappropriate Underwriting Failure (of the firm or management) to exercise appropriate levels of oversight on sales practices being adopted by individuals or related entities authorised to represent the firm or distribute its products and services directly to the market.
Theft or Corruption of Data An external party attacks the firm's IT systems with the purpose of defrauding the firm, theft or corruption of data, destroying systems, etc.
A firm loses or discloses customer records / personal details as a result of staff negligence or loss of mobile media devices.
Inaccurate or incomplete data entry / processing from End User Computer Application
A failure to correctly input, manipulate data/ systems or in the transaction process has resulted in a significant reserving, or other, error.
Information communicated to reserving and claims teams is inaccurate, inadequate, poor quality or untimely, leading to inappropriate reserve projections and incorrect pricing decisions being made.
Regulatory Breach Regulatory breaches or failures that cause detriment to customers, clients or significant trading partners, including incorrect licensing or permissions.
Inadequate sanctions systems, processes or failed sanction controls.
| RSA Insurance Group plc | Solvency and Financial Condition Report 2016
- 73 -
Risk Description
Business Interruption A disaster recovery event causing damage or disruption to business operations, assets, utilities and third parties, including natural disaster, war, riots, terrorism, explosion, vandalism, social unrest, fire, etc.
Systems (software or hardware) failure resulting in staff being unable to use critical systems to work.
Third Party Management A failure to manage, monitor and assess third parties, included outsourcing arrangements, can result in poor performance or service issues impacting the customer and resulting in error / breaches. In the worst cases this can lead to business interruption, regulatory or legislative fines, financial loss or reputational damage.
Royal & Sun Alliance Insurance plc
RSAI is exposed to the all the risks described above for the Group.
Royal & Sun Alliance Reinsurance Limited
RSA Re is exposed to the following risks as described above for the Group.
• Legal / Legislative Non-Compliance
• Regulatory Breach
• Third Party Management; this is particularly key to RSA Re due to the Global Network and the associated reliance on external third parties.
The Marine Insurance Company Limited
MIC is exposed to the following risks as described above for the Group.
• Legal / Legislative Non-Compliance
• Inappropriate Underwriting
• Regulatory Breach
C.5.4 Application of the Prudent Person Principle
The prudent person principle is not applicable to Operational Risk.
C.5.5 Material Risk Concentrations
Whilst there are many inter-dependencies between Operational Risks there are no material risk concentrations, in part a consequence of the regional businesses operating independently of each other.
C.5.6 Risk Mitigation
The operational risk management strategy is achieved through the following:
• the Risk Management Policy and supporting Business Control Policies
• the Operational Risk Process and Procedures

| RSA Insurance Group plc | Solvency and Financial Condition Report 2016
- 74 -
• the risk appetite and/or risk limits and tolerance levels
The Risk Management Policy is supported by a number of Tier Two policies that detail a standard set of controls. The effective operation of the controls, control validation and assurance outlined in this and other policies is important to mitigate the risk of override at all levels, including that of management. Policies are developed to provide a consistent set of controls so that risks remain within risk appetite.
There is a two-tier system consisting of Risk Policies in Tier 1 and Business Control Policies in Tier 2. This is detailed in the Risk Management System detailed in the System of Governance.
• Assurance that the business is complying with both Risk Policies and Business Control Policies is managed through control validation and assurance procedures which assess the effectiveness of the standard controls.
• Policies are subject to an annual review, led by the Line 1 owner and supported by the risk function. Any change is subject to review, challenge and agreement from the Control Governance Advisory Committee, which is a group-wide committee with authority for policy management delegated down from the BRC.
• Policy owners must ensure that the Minimum Requirements defined in the policies are in place across business functions to meet the requirements of the policy.
• Requests for variation, risk acceptance and/or remediation plans agreed must follow the Policy Management Lifecycle.
The business manages risks on an ongoing basis in line with risk appetite. The business clearly documents the management and/or mitigation of the risk exposure through risk avoidance, risk reduction, risk transfer or risk acceptance. Where the risk exposure is judged to be unacceptable relative to risk appetite, actions must be taken to mitigate and/or manage the risk.
In managing and/or mitigating risk, the following four areas are considered.
• Risk Avoidance, defined as not engaging in the activity that gives rise to the risk exposure. This may include a change in the scope of activities that present the risk exposure
• Risk Reduction, defined as a reduction in the probability and/or impact of the risk exposure. This would be achieved by either:
o Implementing new or enhancing existing controls
o Transferring the business activity, for example to an outsourced provider
• Risk Transfer, defined as the movement of the risk exposure to another party who is more willing to bear the impact, for example through an insurance arrangement. Risk Transfer must be assessed and referenced to the risk appetite, the type of risk, the scale of the potential impact and/or costs and exclusions
• Risk Acceptance, defined as an agreement by the business to retain and manage the risk exposure, for example where no mitigation is available to mitigate the risk or the cost of mitigation is deemed to be excessive in relation to the risk mitigation benefit
Action plans are developed by the functional business teams where needed to bring risks back within appetite, with action plans being reviewed and challenged at Risk Committees. Action plans include assigned owners, actions to be followed and delivery dates.
The business functions, supported by the regional risk teams, will:
• review the reports presented to the regional control committees and consider if any of the control weaknesses reported need to be reflected as residual risks out of appetite on the risk profiles reported to the quarterly regional risk committee;
• review the risk incident reports to assess trends and highlight any potential breaches of operational risk appetite;
• consider the impact of any major strategic or structural change within the organization or the business environment on the risk profiles; and
• consider the impact of any emerging risk reviews, scenario tests or other deep dives on the risk profiles.
The business maintains and reports operational risks assessments in the Risk Profile to evidence regular monitoring and reporting against risk appetite. As a minimum, risk reporting provides sufficient data to:
• inform risk exposure by key risks and control indicators;
• describe the impacts, including regulatory breaches, non-compliance with policies and overdue audit actions;

| RSA Insurance Group plc | Solvency and Financial Condition Report 2016
- 75 -
• monitor action plans that include improvements to the control environment;
• identify systemic operational risks;
• identify emerging risks; and
• monitor and report material operational risk losses and near misses.
C.5.7 Risk Sensitivity
See Section C.7 (Any other information) for information on stress testing and sensitivity analysis for all categories of material risk.
The Group and Royal & Sun Alliance Insurance plc
For 2016 there was an operational risk included in the stress test covering major system / operational failure impacting affinity partnerships. The analysis considered the Group’s key affinity partners and the effect of deteriorating relations on premiums following a major business disruption affecting policy holders. The test concluded there would be minimal impact on capital as a consequence of the stress.
Royal & Sun Alliance Reinsurance Limited and The Marine Insurance Company Limited
As there are limited residual risks within these companies, the impact of operational risk is minimal and a detailed sensitivity analysis has not been deemed necessary.

| RSA Insurance Group plc | Solvency and Financial Condition Report 2016
- 76 -
C.6 Other material risks
C.6.1 Other Material Risks Faced
The Group and Royal & Sun Alliance Insurance plc
In addition to the risks covered above, the Group and RSAI are exposed to the risks arising from the Group’s defined benefit pension schemes. See Section C.6.2.
Royal & Sun Alliance Reinsurance Limited and The Marine Insurance Company Limited
There are no other material risks to report. RSA Re and MIC are not exposed to pension risk.
C.6.2 Pension Risk
C.6.2.1 Introduction
Pension risk covers the risk that the Group’s defined benefit pension schemes pose to the Group due to the financial position of the schemes deteriorating resulting in an adverse impact on the capital strength of the Group and / or an increase in the required level of deficit funding payable to the schemes.
The Group operates a number of defined benefit pension schemes with total assets and liabilities each of around £8bn. The majority of the assets and liabilities (around 95%) relate to two major defined benefit schemes located in the UK.
The UK defined benefit schemes were effectively closed to new entrants in 2002 and thus the majority of liabilities in the UK schemes relate to past employees of the Group. From 31 March 2017, the two largest defined benefit schemes in the UK will be closed to future accrual meaning there is no further build-up of defined benefit pensions by the Group’s employees in the UK.
C.6.2.2 Measures Used to Assess Risk
The Group analyses the financial position of its defined benefit pension schemes on a number of different liability measures including:
• International Accounting Standard (IAS) 19 Accounting Measure – benefit payments are projected using best estimate assumptions and then discounted using UK AA corporate bond yields
• Funding Measure – liabilities are valued using prudent assumptions in line with local regulatory requirements for determining cash contribution requirements and reflecting actual agreed investment strategy
• Wind-up / ‘Buy-out’ Measure – The position of the schemes if the schemes were wound up and all liabilities were bought out with an independent third party insurer
The Group uses a range of deterministic and stochastic approaches to understand the key risks associated with each measure as described below
C.6.2.3 Material Risks
Risks to the financial position of the schemes can largely be categorised as market risks (for example assets not performing as well as expected) or demographic risks (for example, members living longer than expected)

| RSA Insurance Group plc | Solvency and Financial Condition Report 2016
- 77 -
Exposures to market risks depend significantly on the measure being used to assess the value of liabilities but broadly breakdown as follows:
• Equity / Property risk – all measures are exposed to falls in the value of equity, property and other risk assets held by the schemes
• Interest rate and Inflation risk – all schemes have significant exposure to interest rates and inflation in both assets and liabilities. The net exposure of each scheme will depend significantly on which liability measure is being analysed. For example, the UK schemes’ are broadly matched against movements in interest rates and inflation on an IAS 19 measure of liabilities but significant exposure remains on the wind-up measure
• Credit spreads – the IAS 19 measure has a particular exposure to credit spreads given the use of AA bond yields to discount the value of liabilities.
The IFRS value of scheme assets and the scheme obligations are shown in the tables in Section D.3.3 (Liabilities for employee benefits including defined benefit plan assets).
C.6.2.4 Application of the Prudent Person Principle
The assets of the UK pension schemes are held under trust and investment strategy is ultimately controlled by the Trustees of each scheme after consultation with the Group. Therefore the prudent person principle in respect of these exposures does not apply in relation to the Group’s risk profile.
The Group operates a number of defined benefit pension schemes in Canada, with total assets of around £365m. Whilst responsibility for safe custody of the pension schemes’ assets may be delegated to a corporate trustee, Royal & Sun Alliance Insurance Company of Canada, a subsidiary of the Group, is responsible for overall management of the defined benefit pension schemes, including management of the assets. This responsibility is delegated to various Board and Management Committees as well as external investment advisers, who provide regular reporting against risk and return objectives.
Investment of the Canadian pension schemes’ assets must be carried out in accordance with various constraints set out in the schemes’ Statement of Investment Policies and Procedures document: including market, credit and liquidity policies, and investment objectives set with regard to the schemes’ liabilities. In particular, the Group has implemented a “de-risking” investment strategy in respect of the largest Canadian defined benefit pension scheme (with around 70% of total assets) to reduce its holding in equity-type investments over time. The remainder of the assets are / will be held in bond-type investment classes, which provide a stable stream of cashflows that match liability benefit payments. This strategy is expected to reduce funding volatility, through better matching of assets and liabilities. In addition to Group policy, the Canadian regulatory regime is particularly prescriptive and provides further safeguarding in respect of ensuring adherence to the prudent person principle.
The Group is not exposed to any material pension risk in Scandinavia.
C.6.2.5 Material Risk Concentrations
The schemes hold a well diversified portfolio of assets with extensive controls in place over the size of any single counterparty exposure.
As detailed below, the schemes’ largest counterparty exposures are to the UK government who are counterparty to or guarantee the schemes’ holding of gilts and Network Rail bonds:
Name of external counterparty Country of the exposure External rating Value of the
exposure (£m) Currency
UK Government UK AA (S&P) 5,157 GBP
In addition, the schemes closely monitor the counterparty exposure within their portfolios of swaps and repo arrangements, although these are collateralised on a daily basis and hence the value of exposure is limited to the impact of any daily movement. All other counterparty exposures are well diversified and not considered to be material in the context of the schemes’ overall level of assets.

| RSA Insurance Group plc | Solvency and Financial Condition Report 2016
- 78 -
C.6.2.6 Risk Mitigation
The Group and the Trustees of the schemes work together to reduce the risks identified above through agreement of investment policy.
The schemes have taken significant steps over recent years to substantially de-risk from return seeking assets such as equities into bonds and other asset classes that produce a stable stream of cashflows that match liabilities. Market conditions and funding levels are also monitored dynamically on an ongoing basis to identify opportunities for further de-risking.
In addition, the schemes have significant hedging programmes in place including the use of interest rate, inflation rate and longevity swaps to mitigate the risk of market movements adversely impacting the financial position of the schemes. For example, the UK schemes entered into arrangements in 2009 that effectively removed all market and demographic risk associated with around 55% of the liabilities relating to pensions in payment at that time.
Both the Group and the Trustees with the support of their investment advisers regularly review the performance of the schemes’ assets against pre agreed benchmarks to ensure that the schemes’ assets are performing in line with expectations. In addition, stress and scenario testing is regularly carried out to understand current exposures.
C.6.2.7 Risk Sensitivity
See Section C.7 (Any other information) for information on stress testing and sensitivity analysis for all categories of material risk.

| RSA Insurance Group plc | Solvency and Financial Condition Report 2016
- 79 -
C.7 Any other information
The only other material information relating to the Risk Profile of the Group, RSAI, RSA Re and MIC relates to stress and scenario testing and risk sensitivity.
Stress and Scenario Testing
Once a year, the Group performs a stress and scenario testing exercise aiming at quantifying the impact on own funds of several scenarios, including a reverse stress test, agreed with senior management and the BRC. The exercise is led by the risk function with input from other functions.
The impact on the Solvency II surplus is quantified where possible.
The scenarios and process to be followed for quantifying their impacts are reviewed and approved by the Stress and Scenario Testing Committee. The results must be approved by the BRC.
All entities must perform their own stress and scenario testing exercise on an annual basis following a governance similar to the Group, and provide the results to the Group Chief Risk Officer.
In addition, the Group performs a range of sensitivity tests to assess how capital surplus will respond under Solvency II and the Group’s ORSA measures. Additional tests are also performed to assess the responsiveness of the Internal Model SCR to different assumptions.
The stress testing and sensitivity testing activities cover all material risk classes to which the Group has an exposure.
A selection of key sensitivities are published externally alongside the results, and in the Group Annual Report and Accounts. These are reproduced here. Key points are:
• Greatest sensitivities are to equities and credit, via pension impacts.
• Reduction in capital volatility achieved through de-risking actions.
Solvency II Coverage Ratio Sensitivity
As at 31 December 2016 the Group’s coverage ratio is 158%. The following table shows the change in value of the coverage ratio due to different hypothetical market changes and a catastrophe.
% Change to Coverage
Ratio
% Change to Coverage
Ratio
Including pensions
Excluding pensions
Interest rates: +1% non-parallel shift 6% - Interest rates: -1% non-parallel shift (7%) (2%) Equities: -15% (8%) (1%) Foreign exchange: GBP +10% vs all currencies (4%) (4%) Cat loss of £75m net of reinsurance (4%) (4%) Credit spreads: +0.25% parallel shift 9% (4%) Credit spreads: -0.25% parallel shift (13%) 4%
Notes:
Sensitivities exclude second order impacts from the application of Tier 1 eligibility rules.
Sensitivities have been considered in isolation. Should sensitivities impact in combination there may be some natural offsets between them, or second-order compounding effects.

| RSA Insurance Group plc | Solvency and Financial Condition Report 2016
- 80 -
UK Pension Scheme Assets and Liabilities - Market Sensitivity
As at 31 December 2016 the Group’s two main UK pension schemes have a deficit of £137m (£8,184m assets and £8,321m liabilities) on an IAS 19 basis, gross of tax. The following table shows the broad change in value of the assets and liabilities due to different hypothetical market changes.
Assets Liabilities
£bn £bn
Interest rates1: -1% 1.7 1.8 Inflation1: +1% 1.1 1.0 Equities2: -15% (0.1) - ‘AA’ Credit spreads: -0.25% 0.1 0.4
1 Actual net sensitivity to changes in interest rates and breakeven inflation will vary depending on size and direction of stress and is also highly dependent on the level of credit spreads at any point in time. 2 Includes 15% reduction in equities and 10% reduction in all other "growth" assets.
UK Pension Scheme Defined Benefit Obligations - Assumption Sensitivity
Sensitivities for the defined benefit obligations of the two main UK schemes are shown below (net of tax):
Changes in assumption £m
Discount rate Increase by 0.25% (310) RPI / CPI 1 Increase by 0.25% 195 Mortality long term rate Increase by 0.25% 104 Mortality assumption 2 Reduce by 12% 274
1 The impact shown is for the appropriate increase in the revaluation of deferred pensions and the increases to pensions in payment resulting from the specified increase in Retail Price Index (RPI) and Consumer Price Index (CPI). 2 Reducing the mortality assumption by 12% is the equivalent of increasing the life expectancy of a male aged 60 years by 1 year.
Shareholder Equity – Sensitivity to Exchange Rates
Changes arising from the retranslation of foreign subsidiaries’ net asset positions from their primary currencies into Sterling are taken through the foreign currency translation reserve and so consequently these movements in exchange rates have no impact on profit. The table below illustrates the impact of a hypothetical 10% change in Danish Krone/Euro, Canadian Dollar or Swedish Krona exchange rates on shareholders’ equity when retranslating into sterling.
10% strengthening in Pounds Sterling against Danish
Krone/Euro
10% weakening in
Pounds Sterling against Danish
Krone/ Euro
10% strengthening in Pounds Sterling
against Canadian Dollar
10% weakening in
Pounds Sterling against
Canadian Dollar
10% strengthening in Pounds Sterling against Swedish
Krona
10% weakening in
Pounds Sterling against Swedish
Krona £m £m £m £m £m £m
Movement in shareholders' equity at 31 December 2016 (25) 31 (43) 53 (21) 26

| RSA Insurance Group plc | Solvency and Financial Condition Report 2016
- 81 -
This Section of the report sets out the value of the assets (D.1), technical provisions (D.2) and other liabilities (D.3) of the Group, RSAI, RSA Re and MIC. Assets, technical provisions and other liabilities are broken down into material classes and lines of business as required by Solvency II. Two sets of values are presented:
• Figures prepared in accordance with Solvency II rules and guidance; and
• Figures prepared in accordance with the accounting standard used for each entity’s statutory financial statements: IFRS as endorsed by the EU for the Group; and UK GAAP for RSAI, RSA Re and MIC. However, there are no differences in valuation principles between IFRS and UK GAAP (Financial Reporting Standard (FRS) 101), so all basis of preparation descriptions referring to IFRS apply equally to RSAI, RSA Re and MIC.
A description of the differences between the Solvency II basis of preparation and the statutory accounts basis is provided.
It is important to note that all statutory accounts values presented in the tables below have been presented according to Solvency II rules, thereby enabling a simpler, like-for-like comparison between the two sets of numbers.
Section D.4 sets out details of assets and liabilities from D.1 and D.3 that have been valued using alternative valuation methods in accordance with Article 10(5) of the Solvency II Delegated Act (Solvency II Delegated Regulation 2015/35 (as amended)).
Section D is subject to external audit. However, in Section D.2 the text and numbers relating to Risk Margin are excluded from the scope of external audit as these numbers are derived from the Solvency Capital Requirement calculation. See Appendix 6 for further details of the scope of the external audit.
D.1 Assets
D.1.1 Balance Sheet Assets
The assets as per the Solvency II balance sheet at the valuation date are as follows:

| RSA Insurance Group plc | Solvency and Financial Condition Report 2016
- 82 -
The Group
Solvency II
value
Statutory accounts
value Difference
£m £m £m
Goodwill, deferred acquisitions costs and intangible assets - 1,252 (1,252) Deferred tax assets 278 261 17 Pension benefit surplus 70 70 - Property, plant & equipment held for own use 34 92 (58) Investments (other than assets held for index-linked and unit-linked contracts) 14,125 14,253 (128)
Property (other than for own use) 333 333 - Holdings in related undertakings, including participations 88 216 (128) Equities 329 329 - Bonds 11,976 11,976 -
Government Bonds 4,416 4,416 - Corporate Bonds 6,780 6,780 - Collateralised securities 780 780 -
Collective Investments Undertakings 894 894 - Derivatives 56 56 - Deposits other than cash equivalents 449 449 -
Loans and mortgages 138 138 - Reinsurance recoverables 1,512 2,348 (836) Insurance and reinsurance receivables 1,336 2,816 (1,480) Cash and cash equivalents 426 426 - Any other assets, not elsewhere shown 158 226 (68) Total assets 18,077 21,882 (3,805)
Royal & Sun Alliance Insurance plc
Solvency II
value
Statutory accounts
value Difference
£m £m £m
Goodwill, deferred acquisitions costs and intangible assets - 521 (521) Deferred tax assets 215 215 - Pension benefit surplus 55 55 - Property, plant & equipment held for own use 33 68 (35) Investments (other than assets held for index-linked and unit-linked contracts) 15,468 18,871 (3,403)
Property (other than for own use) 333 333 - Holdings in related undertakings, including participations 9,791 13,194 (3,403) Equities 3 3 - Bonds 4,669 4,669 -
Government Bonds 1,349 1,349 - Corporate Bonds 3,113 3,113 - Collateralised securities 207 207 -
Collective Investments Undertakings 494 494 - Derivatives 66 66 - Deposits other than cash equivalents 112 112 -
Loans and mortgages 245 245 - Reinsurance recoverables 999 1,738 (739) Insurance and reinsurance receivables 860 1,716 (856) Cash and cash equivalents 66 66 - Any other assets, not elsewhere shown 838 887 (49) Total assets 18,779 24,382 (5,603)

| RSA Insurance Group plc | Solvency and Financial Condition Report 2016
- 83 -
Royal & Sun Alliance Reinsurance Limited
Solvency II
value
Statutory accounts
value Difference
£'000 £'000 £'000
Investments (other than assets held for index-linked and unit-linked contracts) 44,231 44,231 - Bonds 18,327 18,327 -
Government Bonds 14,771 14,771 - Corporate Bonds 3,556 3,556 -
Collective Investments Undertakings 25,904 25,904 - Reinsurance recoverables 351,410 397,202 (45,792) Insurance and reinsurance receivables 47,953 47,953 - Cash and cash equivalents 2,532 2,532 - Any other assets, not elsewhere shown 107,299 107,299 - Total assets 553,425 599,217 (45,792)
The Marine Insurance Company Limited
Solvency II
value
Statutory accounts
value Difference
£'000 £'000 £'000
Investments (other than assets held for index-linked and unit-linked contracts) 80,870 80,870 - Bonds 80,870 80,870 -
Government Bonds 44,211 44,211 - Corporate Bonds 36,659 36,659 -
Loans and mortgages 16,689 16,689 - Reinsurance recoverables 117,824 118,645 (821) Insurance and reinsurance receivables 10,318 13,081 (2,763) Cash and cash equivalents 15,455 15,455 - Any other assets, not elsewhere shown 44,298 44,298 - Total assets 285,454 289,038 (3,584)
| RSA Insurance Group plc | Solvency and Financial Condition Report 2016
- 84 -
D.1.2 Valuation of assets
The assets of the Group are valued in accordance with Article 75 of the Solvency II Directive, related articles of the Delegated Act, i.e. Solvency II Delegated Regulation 2015/35 (as amended) and the guidelines issued by EIOPA on the valuation of assets and liabilities other than technical provisions.
The next few pages describe, for each material class of assets, the bases, methods and main assumptions used in valuing those assets for Solvency II purposes and an explanation of any material differences from the bases, methods and main assumptions used for valuing those assets in the financial statements.
Overview
SII requires assets and liabilities to be valued on a basis that reflects their fair value (described as ‘economic valuation’) with the exception that liabilities should not be adjusted to take account of changes in an insurer’s own credit standing.
The Group’s financial information is prepared using IFRS recognition and measurement bases, meaning the valuation of assets and liabilities for SII purposes begins with the IFRS values and adjusts these for specific differences in valuation between SII and IFRS. The adjustments made are classified into two broad categories:
• Reclassifications of the IFRS balance sheet items into the appropriate Solvency II categories.
• Revaluation adjustments for areas where the IFRS valuation techniques are not considered to be consistent with SII requirements.
There are no differences in valuation principles between IFRS and UK GAAP (FRS 101), so the items below apply equally to UK regulated entities.
For further details of the accounting policies adopted for the purposes of preparing statutory accounts, see the accounting policies section of the financial statements of the relevant entity/Group.
Abbreviation Meaning
DA Delegated Act, i.e. Solvency II Delegated Regulation 2015/35 (as amended)
QRT LOG Guidance as extracted from Solvency II Implementing Technical Standard on reporting – Regulation 2015/2450 (as amended) and Solvency II Implementing Technical Standard on public disclosure – Regulation 2015/2452
GL Valuation EIOPA-BoS-15/113 EN Final Report on Guidelines on recognition and valuation of assets and liabilities other than technical provisions
Goodwill
SII Guidance SII Reference Valuation Methods and Assumptions
Goodwill should be valued at nil DA Art 12(1) Goodwill is reported as an asset in the IFRS balance sheet however should be valued at nil for SII reporting. Any goodwill reported for IFRS purposes is eliminated in the SII balance sheet, with corresponding adjustments to deferred taxes and non-controlling interests.

| RSA Insurance Group plc | Solvency and Financial Condition Report 2016
- 85 -
Deferred acquisition costs
SII Guidance SII Reference Valuation Methods and Assumptions
Acquisition costs relating to contracts in force at the balance sheet date which are carried forward from one reporting period to subsequent reporting periods, relating to the unexpired periods of risks. In relation to life business, acquisition costs are deferred when it is probable that they will be recovered.
There are no deferred acquisition costs under Solvency II as all acquisition costs not incurred by the reporting date are included in the calculation of technical provisions.
Balance sheet QRT LOG (S.02.01)
Deferred acquisition costs reported are on the IFRS balance sheet and comprise the direct and indirect costs of obtaining and processing new insurance business, which are recognised as deferred acquisition costs and are deducted from the provision for unearned premiums.
Deferred acquisition costs are fully eliminated in the SII balance sheet.
Intangible assets
SII Guidance SII Reference Valuation Methods and Assumptions
Intangible assets are ascribed a value only where they can be sold separately and the insurer can demonstrate that there are quoted prices in an active market for the same or similar assets, in which case the asset shall be valued in accordance with the valuation hierarchy.
DA Art 12(2) There are a number of intangible assets recorded on the Group’s IFRS balance sheet, including renewal rights, customer lists, brands, software development costs, intangible assets arising from acquired claims provisions and other acquired identifiable non-monetary assets without physical form. Intangible assets are amortised over their estimated useful lives and are subject to impairment test whenever indicators of impairment exist.
The Group’s intangible assets are not deemed to be capable of being sold separately and certainly do not have quoted prices on an active market (nor do such prices exist for similar assets); they are therefore are valued at nil in the SII balance sheet, with corresponding adjustments to deferred taxes and non-controlling interests.

| RSA Insurance Group plc | Solvency and Financial Condition Report 2016
- 86 -
Deferred tax assets and liabilities
SII Guidance SII Reference Valuation Methods and Assumptions
Insurers should recognise and value deferred tax balances in relation to all assets and liabilities that are recognised for solvency or tax purposes.
Deferred tax balances (other than in respect of the carry forward of unused tax credits and unused tax losses) shall be determined by reference to the Solvency II balance sheet.
Only a positive value shall be ascribed to deferred tax assets where it is probable that future taxable profits will lead to the realisation of that deferred tax asset. This assessment should take into account any time limits that apply to the carry forward of unused tax losses or credits.
EIOPA’s Final Report on Guidelines on recognition and valuation of assets and liabilities other than technical provisions indicates that the measurement principles of IAS 12 (as applied to the temporary difference between Solvency II values and the tax values) are consistent with Solvency II’s requirements. A corollary of this is that, consistent with IAS 12, deferred tax balances shall not be discounted.
DA Art 15
GL Valuation (Final Report) – Table
The valuation method for deferred tax balances is the same under IFRS and SII. Deferred tax is provided in full using the liability method on temporary differences arising between the tax bases of assets and liabilities and the carrying amounts on the SII balance sheet.
However, if the deferred tax arises from initial recognition of an asset or liability in a transaction other than a business combination that, at the time of the transaction, affects neither accounting, nor taxable profit or loss, it is not accounted for in the IFRS balance sheet and so will not be accounted for in the SII balance sheet.
Deferred tax is determined using tax rates (and laws) that have been enacted or substantively enacted by the end of the reporting period and are expected to apply when the related deferred tax asset is realised or the related deferred tax liability is settled.
Deferred tax assets are recognised to the extent that it is probable that future taxable profits will be available against which unused tax losses and temporary differences can be utilised.
In preparation of the SII balance sheet there are a number of adjustments to move from an IFRS to SII valuation basis. These adjustments are considered (other than deferred tax assets from carry-forward credits and losses) in assessing the temporary differences upon which the deferred taxes are derived. The key valuation adjustments which impact the estimates of deferred taxes for SII purposes are:
• elimination of goodwill and intangible assets
• adjustments to technical provisions valuation
• recognition of contingent liabilities
• revaluation of plant and equipment (for own use).
See Section D.1.3 for more information on deferred tax.

| RSA Insurance Group plc | Solvency and Financial Condition Report 2016
- 87 -
Pension benefit surplus and deficits
SII Guidance SII Reference Valuation Methods and Assumptions
The requirements of IAS 19 are considered to be consistent with Solvency II’s requirements.
In practice, IAS 19 requires pensions obligations to be calculated on a best estimate liability (with no risk margin) discounted at a corporate bond rate. This is likely to lead to a lower valuation that would result from applying a model based on the Solvency II valuation principles for insurance liabilities (such as deferred annuities) which, under Solvency II, would be discounted at a risk-free rate and would include a risk margin.
GL Valuation (Final Report) - Table
Pension schemes are treated in the same way under both IFRS and SII.
Contributions to defined contribution pension schemes are charged in the period in which the employment services qualifying for the benefit are provided.
The value of the net defined benefit liability (asset) recognised in the SII balance sheet for each individual post retirement scheme is calculated as follows:
• The present value of defined benefit obligation of the scheme at the end of the reporting period
• Less the fair value at the end of the reporting period of the scheme assets out of which the obligations are to be settled directly.
The present value of defined benefit obligations and the present value of additional benefits accruing during the period are calculated using the Projected Unit Credit Method.
The calculation of the present value of accrued benefits includes an actuarial assumption of future interest rates, which is used to discount the expected ultimate cost of providing the benefits. The discount rate is determined at the end of each reporting period by reference to current market yields on high quality corporate bonds identified to match the currency and estimated term of the obligations. For those individual schemes in deficit, the resulting net liabilities are recognised in the statement of financial position in provisions.
For those individual schemes in surplus, an asset is recognised in the statement of financial position in other debtors and other assets to the extent that the Group can realise an economic benefit, in the form of a refund or a reduction in future contributions, at some point during the life of the scheme or when the scheme liabilities are settled.
The amounts charged (or credited where relevant) relating to post retirement benefits in respect of defined benefit schemes are as follows:
• The current service cost • The past service costs and gains or losses on
settlements • Net interest on the net defined benefit liability
(asset) • Administration costs of operating the pension
schemes.

| RSA Insurance Group plc | Solvency and Financial Condition Report 2016
- 88 -
SII Guidance SII Reference Valuation Methods and Assumptions
Re-measurements of the net defined benefit liability (asset) comprise actuarial gains and losses and the return on plan assets (excluding amounts included in net interest on the net defined benefit liability (asset)). Actuarial gains and losses arise from changes to actuarial assumptions when revaluing future benefits and from actual experience in respect of scheme liabilities.
Property, plant and equipment
SII Guidance SII Reference Valuation Methods and Assumptions
Property, plant and equipment shall not be valued at cost less depreciation and impairment.
EIOPA’s Final Report on Guidelines on recognition and valuation of assets and liabilities other than technical provisions indicates that the revaluation model in IAS 16 should be applied (even where the alternative cost model is used for accounting purposes). This model requires that valuations shall be made ‘with sufficient regularity to ensure that the carrying amount does not differ materially from that which would be determined using fair value’.
GL Valuation (Final Report) - Table
Property and equipment comprise Group occupied land and buildings, fixtures, fittings and equipment (including computer hardware and motor vehicles). Group occupied property (land and buildings) is stated at fair value and other property and equipment is stated at depreciated cost for IFRS reporting.
Group occupied property is valued on a fair value basis (as per IFRS reporting) on the SII balance sheet. For reasons of practicality, all other property and equipment is not revalued for SII reporting and is therefore valued at nil on the SII balance sheet.
Property other than for own use
SII Guidance SII Reference Valuation Methods and Assumptions
EIOPA’s Final Report on Guidelines on recognition and valuation of assets and liabilities other than technical provisions indicates that investment property should be valued using the fair value model in IAS 40 (even where the alternative cost model is used for accounting purposes).
GL Valuation (Final Report) - Table
Investment property, comprising freehold and leasehold land and buildings is recorded at fair value for IFRS reporting and this basis is also used for the SII balance sheet.
Investment properties are valued using discounted cash flow models which takes into account the net present value of cash flows to be generated from the properties. The cash flow streams reflect the current rent (the gross rent) payable to lease expiry, at which point it is assumed that each unit will be re–let at its estimated rental value.
Allowances have been made for voids and rent free periods where applicable. The appropriate rent to be capitalised is selected on the basis of the location of the building, its quality, tenant credit quality and lease terms amongst other factors.
These cash flows are discounted at an appropriate rate

| RSA Insurance Group plc | Solvency and Financial Condition Report 2016
- 89 -
of interest to determine their present value.
Participations and related undertakings (subsidiaries, associates and joint ventures)
SII Guidance SII Reference Valuation Methods and Assumptions
Investments in related undertakings (subsidiaries, associates and joint ventures) shall be valued using the following hierarchy:
(i) Valued based on quoted prices in active markets where such prices are available.
(ii) Where quoted prices in active markets not available, valuation will be on an ‘adjusted equity method’ where the value of the investment is determined as the insurer’s share of the related undertaking’s net assets (based on Solvency II valuation of underlying net assets or, for related undertakings other than insurers where this is not practicable, based on IFRS with the deduction of goodwill and intangibles that would be valued at nil under Solvency II rules).
(iii) For related undertakings other than subsidiaries, where quoted prices in active markets not available and where it is not possible to apply an adjusted equity method, an alternative valuation method (e.g. mark to model) may be used.
Investments in related undertakings that are either excluded from the scope of group supervision due to legal impediments in third countries on the transfer of information of otherwise deducted from group own funds due to the non-availability of the necessary information shall be valued at nil.
DA Art 13
DA Art 335
A “participation” is a Solvency II term for a holding (direct or indirect) of at least 20% of the voting rights or capital of another undertaking. It can therefore be a subsidiary, an associate or a joint venture. Included here are investments in the debt issued by subsidiaries (although this is not applicable to the entities in the Group), as well as equity investments.
Solo balance sheet
Investments in directly owned subsidiaries and associates are accounted for as available for sale financial assets for IFRS reporting, which are valued at fair value.
For SII reporting, investments in participations that do not have quoted market prices (none of them are quoted) are valued using the “adjusted equity method”, i.e. as a share of that participation's excess of assets over liabilities, as valued under SII rules (especially if an insurer). This means that the balance sheet of that participation needs to be adjusted to Solvency II rules before the share of net assets in the investment may be valued (bottom-up approach). If the participation is not an insurance or reinsurance company, the same method as above is to be adopted or, if that is not possible, the equity method in IFRS (with any goodwill and inadmissible intangible assets valued at nil) may be adopted instead. This applies irrespective of whether the participation is in a net assets or net liability position.
Group balance sheet
In the Group balance sheet, investments in participations that are either non-controlled insurance or reinsurance companies, or neither insurance/reinsurance companies nor insurance holding companies, are valued using the adjusted equity method. If the participation is not an insurance or reinsurance company, the same method as above is to be adopted or, if that is not possible, the equity method in IFRS (with any goodwill and inadmissible intangible assets valued at nil) may be adopted instead. This applies irrespective of whether the participation is in a net assets or net liability position.

| RSA Insurance Group plc | Solvency and Financial Condition Report 2016
- 90 -
Financial assets
SII Guidance SII Reference Valuation Methods and Assumptions
Financial assets shall not be valued at cost or amortised cost.
EIOPA’s Final Report on Guidelines on recognition and valuation of assets and liabilities other than technical provisions indicates that all financial assets shall be measured at fair value. Whilst reinsurance recoverables in respect of unsettled claims are subject to the rules regarding technical provisions, payments due in relation to settled insurance claims should not be measured under those rules and so would fall to be treated as financial assets. Only future premiums which fall due after the valuation date are subject to the rules regarding technical provisions; therefore any premium debts due would fall to be treated as financial assets although EIOPA has previously indicated that the risk of non-payment by the policyholder can be ignored if that will result in waiving the insurance cover.
DA Art 10
DA Art 16
Financial assets are valued at fair value for both IFRS and SII balance sheet valuation purposes. The methods and assumptions used by the Group in estimating the fair value of financial assets are:
• Bonds: fair values are generally based upon quoted market prices. Where market prices are not readily available, fair values are estimated using either values obtained from quoted market prices of comparable securities or estimated by discounting expected future cash flows using a current market rate applicable to the yield, credit quality and maturity of the investment. For SII reporting accrued interest is added to the relevant instruments and reclassified into the various SII balance sheet categories.
• Equity securities: fair values are based upon quoted market prices. For SII reporting the equity securities are reclassified into the various SII balance sheet categories.
• Derivatives: fair values are generally based upon quoted market prices. Positive values are reported as assets and negative values reported as liabilities in the SII balance sheet.
• Collective investment schemes: quoted market prices are used where available; else, funds are valued using data from third-party administrators or, in the case of loan funds, fund manager data. All funds are reviewed regularly for signs of underlying impairment. As such, it is considered that all values approximate to fair values.
• Cash and deposits, loans and mortgages, receivables and other assets: carrying amounts approximate to fair values as these are generally short term balances. For SII reporting, except for cash in hand, accrued interest is added to the relevant instruments and balances are reclassified into the various categories as per SII definitions. For prepayments, the approach is to start with the IFRS balance and make adjustments to derecognise any prepaid expenses for which the rights attached are not transferable to a willing third party. Premium debtors and recoveries falling due for payment after the balance sheet date are reclassified from receivables to the premium provision within technical provisions. See Section D.2 for more details.
Reinsurance recoverables
The sub-categories in the Solvency II balance sheet of reinsurers’ share of technical provisions mirror those of

| RSA Insurance Group plc | Solvency and Financial Condition Report 2016
- 91 -
SII Guidance SII Reference Valuation Methods and Assumptions
the gross balances and the same mapping of Solvency II lines of business is to be used. See Section D.2 for more details.
Assets held for sale
SII Guidance SII Reference Valuation Methods and Assumptions
Solvency II has no concept of assets held for sale but only makes reference to the valuation technique that would be used for these assets as follows:
Insurance and reinsurance undertakings shall not apply valuation models that value at the lower of the carrying amount and fair value less costs to sell.
DA Art 16
GL Valuation (Final Report) - Table
Assets held for sale are measured at the lower of carrying amount and fair value less costs to sell and are classified separately from other assets in the statement of financial position for IFRS reporting.
For SII reporting assets classified as held for sale in the IFRS balance sheet are reclassified into their underlying appropriate asset categories as per SII requirements. No valuation adjustments are made in the IFRS accounts when reclassifying to held-for-sale, so these values are used for SII valuation (see relevant sections above regarding valuation approach).
In line with EIOPA guidelines, any remeasurement of disposal groups to fair value less costs to sell as required under IFRS 5 is not recognised in the SII balance sheet. Any such IFRS remeasurement is to be considered as an indicator of fair value but does not, by itself, indicate that SII values require any adjustment.

| RSA Insurance Group plc | Solvency and Financial Condition Report 2016
- 92 -
D.1.3 Analysis of Deferred Tax
The Group
An analysis of Deferred Tax is detailed below:
Deferred Tax Asset Liability
£m £m
Deferred tax assets/liabilities 278 17 Less: Classified as held for sale - - Net deferred tax position at 31 December net of held for sale 278 17
The following are the major deferred tax assets and liabilities recognised by the Group:
£m
Net unrealised gains on investments (54) Claims equalisation and other catastrophe reserves - Capital expenditure 71 Intangibles capitalised 3 Tax losses and unused tax credits 190 Other deferred tax reliefs 10 Retirement benefit obligations 46 Provisions and other temporary differences 24 Technical Provisions (29) Net deferred tax position at 31 December 261 Less: Net assets classified as held for sale - Net deferred tax position at 31 December net of held for sale 261
At the end of the reporting period, the Group's continuing operations have unused tax losses of £1,581m for which no deferred tax asset is recognised. None of these losses will expire between 2017 and 2025. The unused tax losses include £1,146m capital losses for which it is unlikely that a deferred tax asset would be recognised as most UK capital gains are exempt from tax. In addition, the Group has deductible temporary differences of £644m for which no deferred tax asset has been recognised.
Of the Group’s net deferred tax assets of £261m, the majority (£212m) reside in the UK. The utilisation of the Group’s net deferred tax assets is largely dependent on the availability of future taxable profits. The evidence for the future taxable profits is a forecast consistent with the three year operational plans prepared by the relevant businesses, which are subject to internal review and challenge by senior management and the Board. Recognition of deferred tax by the UK group of companies for IFRS purposes is also subject to discussion and challenge by the Group Audit Committee and Group auditors. Where relevant, the forecast includes extrapolations of the operational plans using assumptions consistent with those used in the plans.
The Group has recognised deferred tax assets of £53m arising from Solvency II adjustments to tangible and intangible fixed assets (including goodwill), technical provisions and other balance sheet items. No deferred tax has been recognised in respect of £826m of Solvency II adjustments in the UK and Ireland as there is insufficient certainty that adequate future profits will be available.
Within the net deferred tax assets of £261m, net deferred tax assets of £207m arise in tax jurisdictions in which the Group has suffered a loss in either the current or preceding period. Of these net deferred tax assets, £15m relate to deferred tax assets recognised on actual tax losses suffered in the period of £119m. The assets have been recognised on the basis that future taxable profits will be available against which these deferred tax assets can be utilised. The evidence for the future taxable profits is explained above.

| RSA Insurance Group plc | Solvency and Financial Condition Report 2016
- 93 -
Deferred tax in the UK is based on a rate of 17%, compared with a rate of 18% as at 31 December 2015. This change in rate reduced the value of the Group's net deferred tax assets as at 1 January 2016 by £6m.
The closing procedure for providing Solvency II deferred tax figures for the Group utilises a walkthrough bridge from the figures reported on an IFRS basis in the Group Report & Accounts. A tax analysis is performed of valuation adjustments made to the statutory accounts balances in arriving at the Solvency II balance sheet. Where these adjustments give rise to a temporary difference under IAS12, a deferred tax asset or liability is recognised in accordance with IFRS principles and Solvency II guidance.
Royal & Sun Alliance Insurance plc
An analysis of Deferred Tax is detailed below:
Deferred Tax Asset Liability
£m £m
Deferred tax assets/liabilities 215 - The following are the major deferred tax assets and liabilities recognised by RSAI:
2016
£m
Net unrealised gains on investments (52) Claims equalisation and other catastrophe reserves - Capital expenditure 72 Tax losses and unused tax credits 166 Other deferred tax reliefs 10 Retirement benefit obligations 24 Provisions and other temporary differences (5) Net deferred tax position at 31 December 215 Less: Net assets classified as held for sale - Net deferred tax position at 31 December net of held for sale 215
At the end of the reporting period, the Company has unused tax losses of £1,260m for which no deferred tax asset is being recognised. These losses can be carried forward indefinitely. The unused tax losses include £1,115m capital losses for which it is unlikely that a deferred tax asset would be recognised as most UK capital gains are exempt from tax. In addition, the Company has deductible temporary differences of £467m for which no deferred tax has been recognised.
The utilisation of the Company’s net deferred tax assets of £215m is largely dependent on the availability of future taxable profits. The evidence for the future taxable profits is a forecast consistent with the three year operational plans prepared by the relevant businesses, which are subject to internal review and challenge by senior management and the Board. Additional assurance is also obtained from the recognition of deferred tax, by the UK group of companies for IFRS purposes, being subject to discussion and challenge by the Group Audit Committee and Group auditors. Where relevant, the forecast includes extrapolations of the operational plans using assumptions consistent with those used in the plans.
No deferred tax has been recognised in respect of £706m of Solvency II adjustments (in respect of various balance sheet items including technical provisions, tangible fixed assets, prepayments and subordinated debt instruments) as there is insufficient certainty that adequate future profits will be available.
The net deferred tax assets of £215m arise in tax jurisdictions in which the Company has suffered a loss in either the current or preceding period. Of these net deferred tax assets, £15m relate to deferred tax assets recognised on actual tax losses suffered in the period of £88m. The assets have been recognised on the basis that future taxable profits will be available against which these deferred tax assets can be utilised. The evidence for the future taxable profits is explained above.

| RSA Insurance Group plc | Solvency and Financial Condition Report 2016
- 94 -
Deferred tax in the UK is based on a rate of 17%, compared with a rate of 18% as at 31 December 2015. This change in rate reduced the value of the Company's net deferred tax assets as at 1 January 2016 by £6m.
The closing procedure for providing Solvency II deferred tax figures for the Company utilises a walkthrough bridge from the figures reported on an FRS 101 basis in the Company’s Report & Accounts. A tax analysis is performed of valuation adjustments made to the statutory accounts balances in arriving at the Solvency II balance sheet. Where these adjustments give rise to a temporary difference under IAS12, a deferred tax asset or liability is recognised in accordance with IFRS principles and Solvency II guidance.
Royal & Sun Alliance Reinsurance Limited
An analysis of Deferred Tax is detailed below:
Deferred Tax Asset Liability
£'000 £'000
Deferred tax assets/liabilities - - The following are the major deferred tax assets and liabilities recognised by RSA Re:
2016
£'000
Capital expenditure - Tax losses and unused tax credits - Technical Provisions - Net deferred tax position at 31 December -
No deferred tax has been recognised in respect of £4,646,000 of Solvency II valuation adjustments (in respect of technical provisions) as there is insufficient certainty that adequate future profits will be available.
Deferred tax in the UK is based on a rate of 17%, compared with a rate of 18% as at 31 December 2015. This change in rate reduced the value of the Company's net deferred tax assets as at 1 January 2016 by £152.
The closing procedure for providing Solvency II deferred tax figures for the Company utilises a walkthrough bridge from the figures reported on an FRS 101 basis in the Company’s Report & Accounts. A tax analysis is performed of valuation adjustments made to the statutory accounts balances in arriving at the Solvency II balance sheet. Where these adjustments give rise to a temporary difference under IAS12, a deferred tax asset or liability is recognised in accordance with IFRS principles and Solvency II guidance.

| RSA Insurance Group plc | Solvency and Financial Condition Report 2016
- 95 -
The Marine Insurance Company Limited
An analysis of Deferred Tax is detailed below:
Deferred Tax Asset Liability
£'000 £'000
Deferred tax assets/liabilities - - The following are the major deferred tax assets and liabilities recognised by MIC:
2016
£'000
Technical Provisions - Net deferred tax position at 31 December -
No deferred tax has been recognised in respect of £1,596,000 of Solvency II valuation adjustments (in respect of technical provisions) as there is insufficient certainty that adequate future profits will be available.
Deferred tax in the UK is based on a rate of 17%, compared with a rate of 18% as at 31 December 2015. This change in rate had no effect on the value of the Company's net deferred tax assets as at 1 January 2016.
The closing procedure for providing Solvency II deferred tax figures for the Company utilises a walkthrough bridge from the figures reported on an FRS 101 basis in the Company’s Report & Accounts. A tax analysis is performed of valuation adjustments made to the statutory accounts balances in arriving at the Solvency II balance sheet. Where these adjustments give rise to a temporary difference under IAS12, a deferred tax asset or liability is recognised in accordance with IFRS principles and Solvency II guidance.

| RSA Insurance Group plc | Solvency and Financial Condition Report 2016
- 96 -
D.1.4 Estimation techniques, risks, and uncertainties relating to Assets and Liabilities
The preparation of the Solvency II balance sheet requires the Group and its regulated entities to exercise judgements in the use of estimates and assumptions in a number of key areas. The most significant of these are as follows:
Recognition and valuation of deferred tax assets
Deferred tax assets have been recognised on the basis that future taxable profits will be available against which these deferred tax assets can be utilised. The evidence for the future taxable profits is a forecast consistent with the three year operational plans prepared by the relevant businesses, which are subject to internal review and challenge by senior management and the Board. Recognition of deferred tax by the UK group of companies for IFRS purposes is also subject to discussion and challenge by the Group Audit Committee and Group auditors. Where relevant, the forecast includes extrapolations of the operational plans using assumptions consistent with those used in the plans.
Pension scheme surplus and deficits
The Group and Royal & Sun Alliance Insurance plc
Independent actuaries calculate the value of the defined benefit obligations by applying the projected unit credit method. The future expected cash outflows (calculated based on assumptions that include inflation and mortality) are discounted to present value, using a discount rate determined at the end of each reporting period by reference to current market yields on high quality corporate bonds (‘AA’ rated) identified to match the currency and estimated term of the obligations.
The actuarial valuation involves making assumptions about discount rates, future salary increases, future inflation, the employees’ age upon termination and retirement, mortality rates, future pension increases, disability incidence and health and dental care cost trends.
If actuarial experience differs from the assumptions used, the expected obligation could increase or decrease in future years. Due to the complexity of the valuation and its long-term nature, the defined benefit obligation is highly sensitive to changes in the assumptions. Assumptions are reviewed at each reporting date. As such, the valuation of the liability is highly sensitive to changes in bond rates and will also be impacted by changes in equity markets.
Royal & Sun Alliance Reinsurance Limited and The Marine Insurance Company Limited
These companies have no retirement benefit obligations.
Financial assets and liabilities
Fair value is used to value a number of assets and represents market value at the reporting date.
Cash and cash equivalents, loans and receivables
For cash, loans and receivables, commercial paper, other assets, liabilities and accruals, their carrying amounts are considered to be as approximate fair values on the basis that these are short term assets.
Group occupied property and investment property
The Group and Royal & Sun Alliance Insurance plc
Group occupied properties are valued on a vacant possession basis using third-party valuers. Investment properties are valued, at least annually, at their highest and best use.
The fair value of property has been determined by external, independent valuers, having appropriate recognised professional qualifications and recent experience in the location and category of the property being valued.

| RSA Insurance Group plc | Solvency and Financial Condition Report 2016
- 97 -
The valuations of buildings with vacant possession are based on the comparative method of valuation with reference to sales of other vacant buildings. Fair value is then determined based on the locational qualities and physical building characteristics (principally condition, size, specification and layout) as appropriate.
Investment properties are valued using discounted cashflow models which take into account the net present value of cashflows to be generated from the properties. The cashflow streams reflect the current rent (the gross rent) payable to lease expiry, at which point it is assumed that each unit will be re-let at its estimated rental value. Allowances have been made for voids and rent free periods where applicable. The appropriate rent to be capitalised is selected on the basis of the location of the building, its quality, tenant credit quality and lease terms amongst other factors.
These cashflows are discounted at an appropriate rate of interest to determine their present value.
In both cases the estimated fair value would increase/(decrease) if:
• The estimated rental value is higher/(lower)
• Void periods were shorter/(longer)
• The occupancy rate were higher/(lower)
• Rent free periods were shorter/(longer)
• The discount rates were lower/(higher).
Royal & Sun Alliance Reinsurance Limited and The Marine Insurance Company Limited
These companies own no property.
Derivative financial instruments
The Group and Royal & Sun Alliance Insurance plc
Derivative financial instruments are financial contracts whose fair value is determined on a market basis by reference to underlying interest rate, foreign exchange rate, equity or commodity instrument or indices.
Royal & Sun Alliance Reinsurance Limited and The Marine Insurance Company Limited
These companies have no derivative instruments.
Subordinated debt
The Group and Royal & Sun Alliance Insurance plc
The fair value measurement of the Group’s loan capital instruments, with the exception of the subordinated guaranteed US$ bonds, are based on pricing obtained from a range of financial intermediaries who base their valuations on recent transactions of the Group’s loan capital instruments and other observable market inputs such as applicable risk free rate and appropriate credit risk spreads.
The fair value measurement of the subordinated guaranteed US$ bonds is also obtained from an indicative valuation based on the applicable risk free rate and appropriate credit risk spread.
Royal & Sun Alliance Reinsurance Limited and The Marine Insurance Company Limited
These companies have no subordinated debt.
D.1.5 Group and Subsidiary Valuation Differences
There is no material difference between the bases, methods and main assumptions used at Group level for the valuation for solvency purposes of the Group’s assets and those used by any of its subsidiaries for the valuation for solvency purposes of its assets.

| RSA Insurance Group plc | Solvency and Financial Condition Report 2016
- 98 -
D.2 Technical provisions
D.2.1 Valuation and Comparison of IFRS to SII
Technical provisions are valued using the methods and assumptions described in Section D.2.2.
The main differences between Solvency II technical provisions and the IFRS equivalent are:
• Inclusion of a margin above best estimate in IFRS. Solvency II technical provisions include a risk margin calculated on a different basis.
• Differences in discounting. In Solvency II all technical provision cashflows are discounted using the EIOPA yield curve. In IFRS only some lines of business are discounted and these are discounted using a different discount rate.
• Inclusion of an allowance for Events Not In Data (ENIDs) in Solvency II, covering estimates of low frequency events that are not captured in historical data sets.
• Solvency II technical provisions are net of future premium cashflows where premium income due in the future is covered within the bound contract terms and conditions.
• For future exposures, Solvency II considers only the best estimate of liability cashflows and not an unearned premium reserve (as is covered in IFRS). As a result, profit relating to future exposures (after allowance for ENIDs) will come through as a difference in the liability valuation.
• Within Solvency II, an allowance for reinsurer default is calculated, this is relatively small for most RSA entities, however, some entities are fully reinsured within the Group and as such this allowance for default contributes materially to the net technical provisions.
The following tables quantify the differences in the Solvency II Net Technical Provisions and the equivalent IFRS provisions (net of deferred acquisition costs) for each material Solvency II Line of Business. Each table is followed by notes explaining how the different valuation approaches set out above contribute to the differences observed for each Line of Business.
The Group
SII Technical Provisions Statutory Best Risk Accounts Estimate Margin Value Difference Notes
£m £m £m £m
Direct Business and Accepted Proportional Reinsurance
Medical Expense 189 7 197 (1) Income Protection 884 62 996 (50) (1 & 2) Workers Compensation 260 19 280 (1) Motor vehicle Liability 2,844 172 3,133 (117) (1 & 3) Other Motor 201 19 468 (248) (1) Marine, aviation and Transport 448 15 583 (120) (1 & 4) Fire and Other Damage to Property 1,801 67 2,065 (197) (1) General Liability 2,728 262 2,548 442 (5)
Other Non-Life Direct and Accepted Reinsurance Lines 96 14 106 4 Life & Health Insurance Lines (including Annuities Stemming from Non-Life) 799 91 706 184 (6)
TOTAL 10,250 728 11,082 (104)

| RSA Insurance Group plc | Solvency and Financial Condition Report 2016
- 99 -
Notes
(1) Allowance for future premium within Solvency II technical provisions is a significant difference impacting multiple lines of business. These are Income Protection, Motor Vehicle Liability, Other Motor, Marine Aviation & Transport, Fire & Other Damage to Property.
Other drivers of the differences are:
(2) Income Protection: A further significant driver of the £50m lower Solvency II technical provisions is the margin held on an IFRS basis.
(3) Motor Vehicle Liability: Further significant drivers of the £117m lower Solvency II technical provisions are the difference in margin between IFRS and Solvency II, changes in discounting and ENIDs.
(4) Marine, Aviation & Transport: A further significant driver of the £120m lower Solvency II technical provisions is profitability within the statutory unearned premium reserve.
(5) General Liability: The main driver of the £442m higher Solvency II technical provisions is the risk margin. Allowance for ENIDs drives the remaining difference.
(6) Life & Health Insurance Lines: These are mostly technical provisions relating to non-life annuities and the difference of £184m is driven by the risk margin. Further differences are driven by different discounting assumptions between the two bases.
Royal & Sun Alliance Insurance plc
SII Technical Provisions Statutory Best Risk Accounts Estimate Margin Value Difference Note
£m £m £m £m
Direct Business and Accepted Proportional Reinsurance
Medical Expense 130 1 130 1 Motor vehicle Liability 1,022 79 962 139 (1) Other Motor 21 1 109 (87) (2) Marine, aviation and Transport 391 10 507 (106) (3) Fire and Other Damage to Property 841 13 826 28 General Liability 1,873 211 1,662 422 (4)
Other Direct and Accepted Proportional Reinsurance Lines 40 1 41 - Other Accepted Non-Proportional Reinsurance Lines 250 11 277 (16) (5) Life & Health Insurance Lines (including Annuities Stemming from Non-Life) 128 47 126 49 (6)
TOTAL 4,696 374 4,640 430
Notes
(1) Motor Vehicle Liability: The main driver of the £139m higher Solvency II technical provisions is the risk margin. This is further increased by the impact of different discounting assumptions and allowance for ENIDs.
(2) Other Motor: The main driver of the £87m lower Solvency II technical provisions is future premium income. This is further increased by profitability within the IFRS Unearned Premium Reserve.
(3) Marine, Aviation & Transport: The main driver of the £106m lower Solvency II technical provisions is future premium income. A second driver is the release of profitability within the IFRS Unearned Premium Reserve.
(4) General Liability: The main driver of the £422m higher Solvency II technical provisions is the risk margin. Allowance for ENIDs drives the remaining difference after risk margin has been deducted.

| RSA Insurance Group plc | Solvency and Financial Condition Report 2016
- 100 -
(5) Other Accepted Non-Proportional Reinsurance Lines: These predominantly relate to internal reinsurance structures and the driver of the £16m difference is the IFRS margin held.
(6) Life & Health Insurance Lines: These are mostly technical provisions relating to non-life annuities and the difference of £49m is almost entirely risk margin.
Royal & Sun Alliance Reinsurance Limited
RSA Re is a net nil entity in which the gross provisions are fully reinsured within the Group. For this reason the statutory account values are small and the differences seen between the net Solvency II technical provisions and the FRS 101 reserves are due to the allowance for reinsurance default within the technical provisions and the associated risk margin.
SII Technical Provisions Statutory Best Risk Accounts Estimate Margin Value Difference
£'000 £'000 £'000 £'000
Direct Business and Accepted Proportional Reinsurance
Marine, aviation and Transport (1,284) 831 - (453) Fire and Other Damage to Property 1,929 346 - 2,275 General Liability 1,232 597 - 1,829
Accepted Non-Proportional Reinsurance
Non-Proportional Casualty RI 254 34 - 288 Non-Proportional Marine, Aviation and Transport RI 79 75 - 154 Non-Proportional Property RI 287 211 - 498
Other Lines of Business 26 29 - 55 TOTAL 2,523 2,123 - 4,646
The Marine Insurance Company Limited
MIC is a net nil entity in which the gross provisions are fully reinsured within the Group. For this reason the statutory account values are small and the differences seen between the net Solvency II technical provisions and the FRS 101 reserves are due to the allowance for reinsurance default within the technical provisions and the associated risk margin.
SII Technical Provisions Statutory Best Risk Accounts Estimate Margin Value Difference
£'000 £'000 £'000 £'000
Direct Business and Accepted Proportional Reinsurance
Marine, aviation and Transport 97 102 1 198 Fire and Other Damage to Property 205 21 3 223 General Liability 887 283 26 1,144
Other Lines of Business - - - - TOTAL 1,189 406 30 1,565

| RSA Insurance Group plc | Solvency and Financial Condition Report 2016
- 101 -
D.2.2 Basis of preparation of technical provisions
Under Solvency II, the technical provisions are made up of:
Claims provision + Premium provision + Risk margin
The claims provision is the discounted best estimate of all future cash flows (claim payments, expenses and future premiums) relating to claim events prior to the valuation date.
The premium provision is the discounted best estimate of all future cash flows (claim payments, expenses and future premiums due) relating to future exposure arising from policies that the Group has written, or bound but not incepted, at the valuation date.
The risk margin is calculated as per the Solvency II directive as the cost of capital required to hold future SCRs over the life of the Technical Provisions as they run off.
The valuation of the best estimate for claims provisions and for premium provisions are carried out separately. Claims and premium provisions are calculated both gross of outwards reinsurance and for outwards reinsurance. The risk margin is only calculated net of reinsurance.
D.2.2.1 Bases, methods and assumptions used for valuation
The claims provision comprises the estimated cost of claims incurred but not paid at the end of the reporting period. The provisions are calculated by valuing future cash flows including claims payments, related expenses, salvage and subrogation recoveries and reinsurance transactions. The provision is determined using the best information available of claims settlement patterns, forecast inflation and estimated claims settlement amounts.
Future claims cash flows include an allowance for ENIDs.
The premium provision comprises estimated cost of future claims and associated expenses for unearned business on a best estimate basis, offset by future premiums due. The cash flows also include profit commissions and the costs of policy administration.
All expenses that would be incurred in running-off the existing business, including a share of the relevant overhead expenses are taken into account. This share is assessed on the basis that the Group continues to write new business. The expense provision includes items such as investment expenses that would not be covered under the IFRS basis.
Future claims cash flows are generally determined by considering how past claims payments have materialised, with separate explicit cash flows determined for gross of reinsurance and net of reinsurance. The provisions for claims relating to annuities arising from general insurance business in the UK and Scandinavia are also determined using recognised actuarial methods.
Cash flows are discounted for the time value of money using yield curves prescribed by EIOPA.
The risk margin is calculated by determining the present value of the cost of holding the SCR necessary to support the company’s insurance obligations over their lifetime. This approach is intended to reflect the costs incurred by a notional (re)insurer, the Reference Undertaking, of holding the capital to accept a transfer of liabilities.
D.2.2.2 Significant Simplified Methods
For the Premium Provision, under the legal obligation basis of Solvency II, all existing bound contracts are to be valued, whether the contracts have incepted or not. This includes future premium and claims cash flows for policies not yet incepted by the valuation date, but already forming part of contractual obligations (Bound But Not Incepted business). The Group does not value bound but unincepted contracts unless onerous or material.
For the Risk Margin, the future SCRs of the Reference Undertaking are estimated by considering the remaining claims at each future valuation date. As claims run off, a higher proportion of long tail, eg liability, claims remain which require a proportionally higher level of capital to support them. The method used reflects the proportionally increasing levels of capital required in the future.

| RSA Insurance Group plc | Solvency and Financial Condition Report 2016
- 102 -
D.2.3 Uncertainties and Contingencies
There is an inherent uncertainty in estimating claims provisions at the end of the reporting period for the eventual outcome of outstanding notified claims as well as estimating the number and value of claims that are still to be notified. In particular, the estimation of the provisions for the ultimate costs of claims for asbestos and environmental pollution is subject to a range of uncertainties that is generally greater than those encountered for other classes of business due to the slow emergence and longer settlement period for these claims.
Other uncertainties include the possibility of future legislative change having retrospective effect on open claims; changes in claims settlement procedures potentially leading to future claims payment patterns differing from historical experience; the possibility of new types of claim, such as disease claims, emerging from business written several years ago; general uncertainty in the claims environment; the emergence of latent exposures such as asbestos; the outcome of litigation on claims received; failure to recover reinsurance and unanticipated changes in claims inflation .
There is also increased uncertainty in premium provisions as ultimate claims costs need to be estimated for future events. The ultimate level of future claims costs are partially mitigated by reinsurance.
D.2.4 Use of Adjustments and Transitionals
In valuing the Group’s technical provisions, none of the following have been applied:
• the Matching Adjustment referred to in Article 77b of Directive 2009/138/EC;
• the Volatility Adjustment referred to in Article 77d of Directive 2009/138/EC;
• the transitional risk-free interest rate-term structure referred to in Article 308c of Directive 2009/138/EC
• the transitional deduction referred to in Article 308d of Directive 2009/138/EC
D.2.5 Recoverables from Reinsurance Contracts and SPVs
The Group
The Group enters into reinsurance contracts, mostly excess of loss protection for individual risks or from claims following catastrophe events. The Group also reinsures some business on a quota share basis. At any balance sheet date the Group will expect to recover under these treaties. See Section C.1.10 (Underwriting Risk – Risk Mitigation Techniques) for further details of the Group’s reinsurance contracts and Section D.1.1 (Balance Sheet Assets) for the reinsurance recoverables amounts.
Royal & Sun Alliance Reinsurance Limited
Net Technical Provisions are minimal as the business is reinsured in its entirety, largely to other Group entities. The remaining provisions relate to reinsurance counterparty default, reflecting the possibility of non-recovery of reinsurance payments due.
D.2.6 Changes in Assumptions
Changes in assumptions are not applicable for this reporting period as permitted by Article 303 of the Delegated Act (Solvency II Delegated Regulation 2015/35 (as amended)).
D.2.7 Group and Subsidiary Valuation Differences
There are no material differences between the Technical Provisions held for the Group and those held for the equivalent liabilities in its subsidiaries.

| RSA Insurance Group plc | Solvency and Financial Condition Report 2016
- 103 -
D.3 Other liabilities
D.3.1 Other Balance Sheet Liabilities
The Group
Solvency II
value
Statutory accounts
value Difference
£m £m £m
Provisions other than technical provisions 98 315 (217) Pension benefit obligations 289 289 - Deferred tax liabilities 17 54 (37) Derivatives 167 167 - Insurance and reinsurance payables 310 957 (647) Payables (trade, not insurance) 249 252 (3) Subordinated liabilities 1,137 1,068 69 Any other liabilities, not elsewhere shown 858 856 2
Royal & Sun Alliance Insurance plc
Solvency II
value
Statutory accounts
value Difference
£m £m £m
Provisions other than technical provisions 53 270 (217) Pension benefit obligations 195 195 - Derivatives 171 171 - Financial liabilities other than debts owed to credit institutions 5,697 5,694 3 Insurance and reinsurance payables 233 879 (646) Payables (trade, not insurance) 2,682 2,682 - Subordinated liabilities 416 370 46 Any other liabilities, not elsewhere shown 380 380 -

| RSA Insurance Group plc | Solvency and Financial Condition Report 2016
- 104 -
Royal & Sun Alliance Reinsurance Limited
Solvency II
value
Statutory accounts
value Difference
£'000 £'000 £'000
Insurance & intermediaries payables 2,914 2,914 - Reinsurance payables 27,981 27,981 - Payables (trade, not insurance) 80,374 80,374 - Any other liabilities, not elsewhere shown 1,102 1,102 -
The Marine Insurance Company Limited
Solvency II
value
Statutory accounts
value Difference
£'000 £'000 £'000
Provisions other than technical provisions 192 192 - Deposits from reinsurers 82,918 82,917 1 Insurance & intermediaries payables 1,995 1,995 - Reinsurance payables 1,616 1,616 - Payables (trade, not insurance) 33,969 36,245 (2,276) Any other liabilities, not elsewhere shown 702 702 -

| RSA Insurance Group plc | Solvency and Financial Condition Report 2016
- 105 -
D.3.2. Valuation of other liabilities
The liabilities of the Group are valued in accordance with Article 75 of the Solvency II Directive, related articles of the Delegated Act, i.e. Solvency II Delegated Regulation 2015/35 (as amended) and the guidelines issued by EIOPA on the valuation of assets and liabilities other than technical provision.
The next few pages describe, for each material class of liabilities (other than technical provisions), the bases, methods and main assumptions used in valuing those liabilities for Solvency II purposes and an explanation of any material differences from the bases, methods and main assumptions used for valuing those liabilities in the financial statements.
See Section D.1.2 for an overview.
Financial liabilities
SII Guidance SII Reference Valuation Methods and Assumptions
Insurance and reinsurance undertakings shall value financial liabilities, as referred to in international accounting standards adopted by the Commission in accordance with Regulation (EC) No 1606/2002, in accordance with Article 9 of this Regulation upon initial recognition. There shall be no subsequent adjustment to take account of the change in own credit standing of the insurance or reinsurance undertaking after initial recognition
DA Art 14(1) Financial liabilities are valued at fair value for both IFRS and SII balance sheet valuation purposes. The methods and assumptions used by the Group in estimating the fair value of financial liabilities are:
• Loans payable and subordinated debt: fair values are determined by reference to quoted market prices or estimated using discounted cash flow calculations based upon prevailing market rates.
• For borrowings that carry a variable rate of interest (other than subordinated debt), carrying values approximate to fair values.
• Other liabilities and accruals: carrying amounts approximate to fair values as they are short term liabilities.
Upon subsequent measurement of financial liabilities, any changes in own credit risk are not reflected in the fair value.
Under IFRS, debtors and payables relating to future premiums are included within insurance and reinsurance debtors and payables; however, under SII future premiums are included within Solvency II technical provisions as future cashflows.
As per the principle of correspondence, the only insurance business to be recognised as ceded is bound business, i.e. business recognised within gross technical provisions. Reinsurance payables are adjusted for amounts that do not meet this criterion, unless the cost is sunk, in which case it must be recognised in full.
See Section D.1.4 for details of the fair valuation of subordinated debt.
Lease liabilities
See Section A.4.2 for information on leases. No adjustments have been made to the IFRS valuation of lease liabilities.

| RSA Insurance Group plc | Solvency and Financial Condition Report 2016
- 106 -
Contingent liabilities
SII Guidance SII Reference Valuation Methods and Assumptions
Insurers should recognise all material contingencies as liabilities. Contingent liabilities are material if information about the current or potential size or nature of those liabilities could influence the decision-making or judgement of the intended user of that information (including supervisors).
Such liabilities should be valued at the expected present value of future cash flows required to settle the contingent liability, discounted at the basic risk-free interest rate term structure.
DA Art 11
DA Art 14(2)
Material contingent liabilities are recorded on the SII balance sheet and are valued at the expected present value of future cash flows to settle the obligation liability over the lifetime of that contingent liability, using the relevant risk-free interest rate term structure. This basically means multiplying a possible outcome by its probability and discounting the result using the risk-free interest rate.
This applies to non-insurance risks only, as insurance risks are already captured by the best estimate component of technical provisions.
Contingent liabilities acquired in a business combination are valued on a basis consistent with that used for IFRS reporting.
Accounting provisions
SII Guidance SII Reference Valuation Methods and Assumptions
EIOPA’s Final Report on Guidelines on recognition and valuation of assets and liabilities other than technical provisions indicates that, in accordance with the principles in IAS 37, provisions are recognised where there is a present obligation as a result of a past event which will probably give rise to an outflow of resources and which can be measured reliably. Provisions are valued at a best estimate of the expenditure required to settle the present obligation at the balance sheet date.
DA Art 9
GL Valuation (Final Report) - Table
Provisions are valued in the same way under both IFRS and SII.
Provisions are recognised when there is a present legal or constructive obligation as a result of past events, it is more likely than not that an outflow of resources will be required to settle the obligation and the amount can be reliably estimated. Where there are a number of similar obligations, the likelihood that an outflow will be required in settlement is determined by considering the class of obligations as a whole. A provision is recognised even if the likelihood of an outflow with respect to any one item included in the same class of obligations may be small.
Current taxes and liabilities (included in Other Liabilities)
SII Guidance SII Reference Valuation Methods and Assumptions
Current tax assets and liabilities should be valued at the amount expected to be recovered or paid in accordance with the provisions of IAS 12.
GL Valuation (Final Report) - Table
The valuation method for current tax assets and liabilities is the same under IFRS and SII.
See Section D.1.4 for details of estimation techniques, risks, and uncertainties relating to assets and liabilities; Section D.1.2 for an explanation of the bases, methods and assumptions used for the valuation of deferred tax assets and liabilities; and Section D.1.3 for deferred tax analysis.

| RSA Insurance Group plc | Solvency and Financial Condition Report 2016
- 107 -
D.3.3 Liabilities for employee benefits including defined benefit plan assets
The Group
Defined contribution pension schemes
Costs of £51m were recognised in respect of defined contribution schemes by the Group. The Group’s Swedish subsidiaries are part of a multi-employer defined benefit scheme along with other financial institutions in Sweden. As it is not possible to determine the assets and liabilities in respect of any one employer under this scheme, it is included in the SFCR as a defined contribution scheme. Contributions of £8m were paid to this scheme during 2016 and are included in the costs shown above. The expected contributions in 2017 are £8m. Total estimated contributions to the scheme from all employers in 2016 were £62m. The latest information regarding the funding of this scheme is taken from the interim report for the first half of 2016, when the scheme funding rate was 111%.
Defined benefit pension schemes and other post-retirement benefits
The major defined benefit pension schemes are located in the UK. The assets of these schemes are mainly held in separate trustee administered funds. The UK defined benefit schemes were effectively closed to new entrants in 2002.
The Group also operates defined benefit schemes in other countries. The most significant of these schemes are in Canada and Ireland.
The Group provides post-retirement healthcare benefits to certain current and retired Canadian employees. The benefits are not prefunded. Life insurance benefits, which provide varying levels of coverage, are provided at no cost to retirees. Healthcare benefits, which also provide varying levels of coverage, require retiree contributions in certain instances and benefits are generally payable for life.
The value of all scheme assets and all scheme obligations are as follows:
UK Other Total
£m £m £m
Present value of funded obligations 8,314 460 8,774 Present value of unfunded obligations 7 112 119 Present value of obligations 8,321 572 8,893
Equities 597 167 764 Government debt 5,157 132 5,289 Non government debt 3,151 125 3,276 Derivatives 808 - 808 Other (including infrastructure, commodities, hedge funds, loans) - 27 27 Securities with quoted market price in an active market 9,713 451 10,164 Property 164 - 164 Cash 55 6 61 Other (including infrastructure, commodities, hedge funds, loans) 484 - 484 Other investments 703 6 709 Value of asset and longevity swaps (2,232) - (2,232) Total assets in the schemes 8,184 457 8,641 Total surplus/(deficit) (137) (115) (252)
Defined benefit pension schemes (137) (59) (196) Other post retirement benefits - (56) (56)
Schemes in surplus 58 12 70 Schemes in deficit (195) (127) (322)

| RSA Insurance Group plc | Solvency and Financial Condition Report 2016
- 108 -
Exposure shown in the previous table is of the UK and Other pension schemes and not the geographical disposition of the underlying investments.
The UK pension schemes do not hold any of the Group’s own transferable financial instruments as plan assets, and no property held by the schemes is occupied by the Group.
Royal & Sun Alliance Insurance plc
Defined contribution pension schemes
Costs of £13m were recognised in respect of defined contribution schemes by the Company.
Defined benefit pension schemes and other post-retirement benefits
The major defined benefit pension schemes are located in the UK. The assets of these schemes are mainly held in separate trustee administered funds. The UK defined benefit schemes were effectively closed to new entrants in 2002.
The value of scheme assets / defined benefit liability that is included at 31 December 2016 in the financial statements are as follows:
Total
£m
Present value of funded obligations 8,304 Present value of unfunded obligations 7 Present value of obligations 8,311
Equities 594 Government debt 5,157 Non government debt 3,150 Derivatives 808 Other (including infrastructure, commodities, hedge funds, loans) - Securities with quoted market price in an active market 9,709 Property 164 Cash 53 Other (including infrastructure, commodities, hedge funds, loans) 478 Other investments 695 Value of asset and longevity swaps (2,232) Total assets in the schemes 8,172 Total surplus/(deficit) (139)
Defined benefit pension schemes (139) Other post retirement benefits -
Schemes in surplus 56 Schemes in deficit (195)
Royal & Sun Alliance Reinsurance Limited
Nothing to report.
| RSA Insurance Group plc | Solvency and Financial Condition Report 2016
- 109 -
The Marine Insurance Company Limited
Nothing to report.
D.3.4 Group and Subsidiary Valuation Differences
There is no material difference between the bases, methods and main assumptions used at Group level for the valuation for solvency purposes of the Group’s other liabilities and those used by any of its subsidiaries for the valuation for solvency purposes of its other liabilities.

| RSA Insurance Group plc | Solvency and Financial Condition Report 2016
- 110 -
D.4 Alternative methods for valuation
The Group
Assets and liabilities valued using alternative valuation methods include property, certain debt and equity securities, collective investment schemes and derivatives.
Most of these instruments are given this classification because the markets on which they trade are not considered to be sufficiently active to qualify as active for the purpose of this disclosure. Despite this, the valuation of these assets is still based on quoted prices available from an exchange, dealer, broker, pricing service or other third party and as such these prices are considered reliable indicators of the fair value of the instruments.
Instruments disclosed as valued under alternative valuation methods for which quoted market prices are not available are valued using observable inputs as far as possible. These instruments are generally illiquid and include property and illiquid credit instruments. As such they are rarely traded, but experience from disposals when they do occur suggests that the valuation methods used are reasonably reliable in estimating the fair value of the instruments.
There is no difference between the bases, methods and assumptions used when valuing these instruments for SII purposes and those used for IFRS reporting. See Section D.1.4 for a description of the valuation techniques used and how they are assessed.
See Note 26 of the Group Annual Report & Accounts for further details of the valuation methods and assumptions used when valuing such instruments.
Royal & Sun Alliance Insurance plc
Assets and liabilities valued using alternative valuation methods are the same as for the Group, but with the exclusion of property.
There is no difference between the bases, methods and assumptions used when valuing these instruments for SII purposes and those used for UK GAAP reporting. See Section D.1.4 for a description of the valuation techniques used and how they are assessed.
As assets for this entity are managed and valued in the same way as for the Group, see Note 26 of the Group Annual Report & Accounts for further details of the valuation methods and assumptions used when valuing such instruments.
Royal & Sun Alliance Reinsurance Limited
Assets and liabilities valued using alternative valuation methods include certain debt securities and collective investment schemes.
There is no difference between the bases, methods and assumptions used when valuing these instruments for SII purposes and those used for UK GAAP reporting. See Section D.1.4 for a description of the valuation techniques used and how they are assessed.
As assets for this entity are managed and valued in the same way as for the Group, see Note 26 of the Group Annual Report & Accounts for further details of the valuation methods and assumptions used when valuing such instruments.
The Marine Insurance Company Limited
Assets and liabilities valued using alternative valuation methods include certain debt and equity securities.
There is no difference between the bases, methods and assumptions used when valuing these instruments for SII purposes and those used for UK GAAP reporting. See Section D.1.4 for a description of the valuation techniques used and how they are assessed.

| RSA Insurance Group plc | Solvency and Financial Condition Report 2016
- 111 -
As assets for this entity are managed and valued in the same way as for the Group, see Note 26 of the Group Annual Report & Accounts for further details of the valuation methods and assumptions used when valuing such instruments.

| RSA Insurance Group plc | Solvency and Financial Condition Report 2016
- 112 -
D.5 Any other information
D.5.1 Group Consolidation Scope and Method
There are no material differences between the scope of the Group for the consolidated financial statements and the scope for the consolidated data determined in accordance with Article 335 of the Delegated Act (Solvency II Delegated Regulation 2015/35 (as amended)).
Method 1 (the accounting consolidation method) has been adopted.
All material transactions between entities in the scope of the Group (as per QRT S.32.01.22 in Appendix 8) have been eliminated upon Group consolidation.

| RSA Insurance Group plc | Solvency and Financial Condition Report 2016
- 113 -
This Section of the report describes how the Group manages Own Funds in terms of:
• Information on the objectives, policies and processes employed by the Group for managing its Own Funds;
• The amount of the Group’s SCR and MSCR and each solo entity’s SCR and Minimum Capital Requirement (MCR), including any non-compliance with those measures; and
• The scope of the Internal Model used by the Group for its SCR calculation.
The risk profile of RSAI is considered to be identical to that of the Group, given RSAI’s position in the Group structure, and therefore the modelled SCR of the Group and RSAI is the same.
Section E.1 is subject to external audit. However, the SCR, SCR Surplus, SCR Coverage, MSCR, MSCR Surplus, and MSCR Coverage numbers at the bottom of the tables in Section E.1.3 are excluded from the scope of external audit as these numbers are derived from the Solvency Capital Requirement calculation. See Appendix 6 for further details of the scope of the external audit.
E.1 Own Funds
E.1.1 Objectives, Policies, Processes and Material Changes
RSA Capital Management - Policies and processes for managing Own Funds
The primary objective of the Capital Management function is to ensure that the business has sufficient capital to meet its obligations. This is achieved by optimising the balance between return and risk, whilst maintaining economic and regulatory capital in accordance with risk appetite.
Group Capital’s role and responsibility is to govern, monitor and oversee capital resources across the Group ensuring that these are within the risk appetite of the Group and meet appropriate regulatory/accounting rules and guidelines. This includes the calculation, estimation and forecasting of capital resources and capital requirements such as Solvency II Available and Eligible Own Funds.
The Group manages capital and solvency through a governance framework including methodology validation, monitoring and reporting processes, in support of the Group ORSA process.
Business Planning
RSA operates a three-year time horizon for business planning. Plans are reviewed and debated at executive level and approved by the Board.
Material changes over the reporting period
No material changes to the objectives, policies or processes for managing Own Funds were made over the period.
E.1.1.1 Method Used for Calculating Group Solvency
RSA adopts the accounting consolidation method (Method 1) to calculate Group Solvency.
Group supervision is at the level of RSA Insurance Group plc (“the Group”). No subgroup reporting is performed as full group supervision is expected to be at the ultimate EEA parent level.

| RSA Insurance Group plc | Solvency and Financial Condition Report 2016
- 114 -
Section E.2.9 summarises the Group SCR by constituent, as derived using Method 1.
E.1.2 Structure, Amount and Quality of Own Funds
Classification and eligibility of capital
RSA’s Own Funds are classified per Solvency II requirements as follows:
Solvency II Tier Capital Item
Tier 1 Paid in ordinary share capital, and the related share premium
Reconciliation reserve
Tier 1 Restricted Paid in preference shares, and the related share premium account
Paid in subordinated liabilities that exhibit characteristics listed in Article 71 of Commission Delegated Regulation (EU) 2015/35 (as amended) supplementing Directive 2009/138/EC (“the Delegated Act”)
Tier 2 Subordinated liabilities that exhibit characteristics listed in Article 73 of the Delegated Act
Tier 3 Net deferred tax assets
For Solvency II purposes, loan capital and preference shares are valued without taking into account changes to the issuer’s own credit standing (i.e. the Solvency II value) and classified into prescribed tiers of capital.
RSA makes use of transitional arrangements for debt instruments issued prior to Solvency II implementation. Basic Own Funds items in issue at 18 January 2015 that satisfied the requirements to be treated as capital resources under the Solvency I Directive are eligible for classification as Tier 1 Restricted or Tier 2 Basic Own Funds for a period of 10 years from 18 January 2015, being the date of entry into force of the Delegated Act. RSA has received legal opinions verifying the compliance of these instruments as follows:
• Subordinated guaranteed perpetual bond (“the 2006 debt instrument”) classified as Innovative Tier 1 for Solvency I purposes satisfies the requirements of the criteria of 2.2.29 R (5) and 2.2.31 R of the FCA / PRA General Prudential sourcebook (GENPRU) and is classified as Tier 1 Restricted under Solvency II;
• Preference shares classified as Upper Tier 2 for Solvency I purposes satisfy the requirements of GENPRU 2 Annex I and the provisions of 2.2.159 R to 2.2.181 R of GENPRU and are classified as Tier 1 Restricted under Solvency II;
• Subordinated guaranteed perpetual bonds (“the 2014 debt instrument”) and subordinate guaranteed dated notes (“the 2009 debt instrument”) classified as Lower Tier 2 for Solvency I purposes satisfy the requirements of rules 2.2.159 R (1) to (7) and (9) of GENPRU and are classified as Tier 2 instruments under Solvency II.
Tier 1 Own Funds includes the Solvency II reconciliation reserve, the key elements of which are as follows:
• Excess of assets over liabilities as presented in the Solvency II balance sheet;
• A deduction for foreseeable dividends and distributions in relation to 2016 interim and final payments;
• A deduction for amounts already included in Basic Own Funds, including ordinary share capital, share premium account and minority interests.
Further information in relation to the derivation of the Group’s consolidated Own Funds is provided in Section D.5.1.

| RSA Insurance Group plc | Solvency and Financial Condition Report 2016
- 115 -
Capital composition
The Group’s capital structure by tier as at 31 December 2016 is as per the table below. The capital compositions of the standalone UK entities, RSAI, RSA Re and MIC are also provided.
The Group
2016
£m
Tier 1 Unrestricted Equity capital (including Share Premium) 2,100 Reconciliation reserve (548) 1,552 Tier 1 Restricted Preference shares 163
2006 debt instrument 381 544 Tier 2 2014 debt instrument 402
2009 debt instrument 346 748 Tier 3 Net Deferred Tax Assets 278
Total Available Own Funds 3,122
Royal & Sun Alliance Insurance plc
2016
£m
Tier 1 Unrestricted Equity capital (including Share Premium) 3,456 Reconciliation reserve (1,501) 1,955 Tier 1 Restricted Subordinated liabilities 381
381 Tier 2 Subordinated liabilities 748
748 Tier 3 Net Deferred Tax Assets 215
Total Available Own Funds 3,299

| RSA Insurance Group plc | Solvency and Financial Condition Report 2016
- 116 -
Royal & Sun Alliance Reinsurance Limited
2016 £'000
Tier 1 Unrestricted Equity capital 70,000 Reconciliation reserve 14,998 84,998 Tier 1 Restricted -
Tier 2 -
Tier 3 -
Total Available Own Funds 84,998
The Marine Insurance Company Limited
2016 £'000
Tier 1 Unrestricted Equity capital (including Share Premium) 22,334 Reconciliation reserve 22,309 44,643 Tier 1 Restricted -
Tier 2 -
Tier 3 -
Total Available Own Funds 44,643
Group Tier 1 movements
Core Tier 1 Own Funds increased to £2,100m in the period, driven by an increase in underlying capital generation and benefit from the Latin America and Russian disposals completed in the period, offset by restructuring/other non-operating charges, pension movements reflecting narrowing AA corporate bond spreads and pull-to-par movement on unrealised bonds.
Foreseeable dividends accrued at the end of the year amounted to £112m.
The reconciliation reserve at the end of the reporting period was £(549)m.
Group Tier 1 Restricted movements
Tier 1 Restricted Own Funds increased to £544m in the period, driven by an increase in the fair value of the preference shares. The Tier 1 Restricted subordinated debt reduced to £381m.
Group Tier 2 movements
Tier 2 Own Funds reduced to £748m in the period, driven by the retirement of £200m (nominal value) of subordinated debt (the target instrument was the £500m subordinated notes with 9.4% coupon). The fair value of subordinated notes with 5.1% coupon increased to £402m.

| RSA Insurance Group plc | Solvency and Financial Condition Report 2016
- 117 -
Group Tier 3 movements
Deferred tax assets with a value of £278m were included in the Solvency II balance sheet at the end of the period.
Loan capital characteristics
The table below summarises key characteristics of the Group’s debt instruments that are subject to transitional arrangements. Preference shares are not guaranteed by RSAI and so appear in Tier 1 Basic Own Funds for the purposes of the RSAI calculations. Similarly, RSAI’s total Tier 2 subordinated debt is practically equal to the Group’s issued debt. However, to adhere to the PRA’s request (PRA Supervisory Statement SS8/14) regarding the use of guarantees between the Group and RSAI, QRT S.23.01 must reconcile to subordinated debt as per the RSAI statutory balance sheet. As such, an element of RSAI’s subordinated debt appears as Share Premium in the QRT.
Neither RSA Re nor MIC includes any subordinated liabilities in its Basic Own Funds.
Preference shares 2006 debt instrument 2009 debt instrument 2014 debt instrument
Issuer The Group The Group The Group The Group Guarantor N/A RSAI RSAI RSAI Date issued 13/10/1993 12/05/2006 20/05/2009 10/10/2014 Maturity Irredeemable Perpetual 20/05/2039 10/10/2045 First call N/A 12/07/2017 20/05/2019 10/10/2025 Amount at issue £125,000,000 £375,000,000 £500,000,000 £400,000,000 Current outstanding £125,000,000 £375,000,000 £300,000,000 £400,000,000 Currency GBP GBP GBP GBP Coupon 7.875% 6.701% 9.375% 5.125% Frequency Semi-annual Annual Annual Annual
Call frequency N/A Each coupon date after reset date Every 5 years Annual
Reset date N/A 12/07/2017 20/05/2019 10/10/2025
Reset rate N/A 3m LIBOR + 2.51% 8.475% plus benchmark Gilt yield
3.852% plus benchmark Gilt yield
Solvency II Tier Restricted Tier 1 Restricted Tier 1 Tier 2 Tier 2

| RSA Insurance Group plc | Solvency and Financial Condition Report 2016
- 118 -
E.1.3 Eligible Own Funds to Cover the SCR
Basic Own Funds to Eligible Own Funds
Solvency II requires that Basic Own Funds are first considered against availability rules, and then subjected to eligibility criteria based on both the SCR and capital structure. Eligible Own Funds are considered available to cover the SCR. Basic Own Funds to Eligible Own Funds reconciliations for the Group and UK entities are shown below:
The Group
Basic Own
Funds Availability restrictions
Available Own Funds
Eligibility restrictions
Eligible Own Funds
Eligibility Capacity
£m £m £m £m £m £m Eligibility rule
Tier 1 1,678 (126) 1,552 - 1,552 Tier 1 (R) 544 - 544 (156) 388 388 20% of total Tier 1
Tier 2 748 - 748 148 896 896 Tier 2 + Tier 3 up to
50% of SCR Tier 3 278 - 278 (278) -
Total 3,248 (126) 3,122 (286) 2,836 SCR 1,793 Surplus 1,042 SCR Coverage 158%
Royal & Sun Alliance Insurance plc
Basic Own
Funds Availability restrictions
Available Own Funds
Eligibility restrictions
Eligible Own Funds
Eligibility Capacity
£m £m £m £m £m £m Eligibility rule
Tier 1 1,955 - 1,955 - 1,955 Tier 1 (R) 381 - 381 - 381 489 20% of total Tier 1
Tier 2 748 - 748 - 748 897 Tier 2 + Tier 3 up to
50% of SCR Tier 3 215 - 215 (66) 149
Total 3,299 - 3,299 (66) 3,233 SCR 1,793 Surplus 1,439 SCR Coverage 180%

| RSA Insurance Group plc | Solvency and Financial Condition Report 2016
- 119 -
Royal & Sun Alliance Reinsurance Limited
Basic Own
Funds Availability restrictions
Available Own Funds
Eligibility restrictions
Eligible Own Funds
Eligibility Capacity
£'000 £'000 £'000 £'000 £'000 £'000 Eligibility rule
Tier 1 84,998 - 84,998 - 84,998 Tier 1 (R) - - - - - 17,000 20% of total Tier 1
Tier 2 - - - - - 4,104 Tier 2 + Tier 3 up to
50% of SCR Tier 3 - - - - -
Total 84,998 - 84,998 - 84,998 SCR 8,208 Surplus 76,790 SCR Coverage 1036%
The Marine Insurance Company Limited
Basic Own
Funds Availability restrictions
Available Own Funds
Eligibility restrictions
Eligible Own Funds
Eligibility Capacity
£'000 £'000 £'000 £'000 £'000 £'000 Eligibility rule
Tier 1 44,643 - 44,643 - 44,643 Tier 1 (R) - - - - - 8,929 20% of total Tier 1
Tier 2 - - - - - 9,859 Tier 2 + Tier 3 up to
50% of SCR Tier 3 - - - - -
Total 44,643 - 44,643 - 44,643 SCR 19,719 Surplus 24,924 SCR Coverage 226%
Total available Own Funds to meet the SCR
Under Solvency II availability provisions, capital in one entity which is deemed not wholly available to the wider Group can be included up to that entity’s share of the Group SCR, where the entity in question is a related insurance or reinsurance undertaking, third-country insurance or reinsurance undertaking, insurance holding company or mixed financial holding company. The effect of this requirement is that it is necessary to restrict funds representing:
• Minority interests, except to the extent that those funds back the minority interest’s share of the Group SCR, the excluded amount being £126m.
No capital is deemed to be non-available within RSAI, RSA Re or MIC’s Own Funds.
Total eligible Own Funds to meet the SCR
The Delegated Act requires that limits are imposed upon the eligible amounts of Restricted Tier 1, Tier 2 and Tier 3 capital, according to the calculation of the SCR:
• Eligible Tier 1 items shall be at least 50% of the SCR;
• Eligible Tier 3 items shall be no more than 15% of the SCR;
• The sum of eligible Tier 2 and eligible Tier 3 items shall be no more than 50% of the SCR;

| RSA Insurance Group plc | Solvency and Financial Condition Report 2016
- 120 -
• The sum of paid in preference shares (and the related share premium account) and paid in subordinated liabilities classified as Tier 1 shall represent no more than 20% of the total amount of Tier 1 items. Items exceeding this limit are reclassified to Tier 2.
E.1.4 Eligible Own Funds to Cover the MSCR
Solvency II requires that Basic Own Funds are first considered against availability rules, and then subjected to eligibility criteria based on both the MSCR and capital structure. Eligible Own Funds are considered available to cover the MSCR. Basic Own Funds to Eligible Own Funds reconciliations for the Group and UK entities are shown below:
The Group
Basic Own
Funds Availability restrictions
Available Own Funds
Eligibility restrictions
Eligible Own Funds
Eligibility Capacity
£m £m £m £m £m £m Eligibility rule
Tier 1 1,678 (126) 1,552 - 1,552 Tier 1 (R) 544 - 544 (156) 388 388 20% of total Tier 1
Tier 2 748 - 748 (432) 316 316 20% of MSCR Tier 3 278 - 278 (278) - Not eligible
Total 3,248 (126) 3,122 (866) 2,256
MSCR 1,580 Surplus 676 MSCR Coverage 143%
Royal & Sun Alliance Insurance plc
Basic Own
Funds Availability restrictions
Available Own Funds
Eligibility restrictions
Eligible Own Funds
Eligibility Capacity
£m £m £m £m £m £m Eligibility rule
Tier 1 1,955 - 1,955 - 1,955 Tier 1 (R) 381 - 381 - 381 489 20% of total Tier 1
Tier 2 748 - 748 (605) 143 143 20% of MCR Tier 3 215 - 215 (215) - Not eligible
Total 3,299 - 3,299 (820) 2,479
MCR 713 Surplus 1,766 MCR Coverage 348%

| RSA Insurance Group plc | Solvency and Financial Condition Report 2016
- 121 -
Royal & Sun Alliance Reinsurance Limited
Basic Own Funds
Availability restrictions
Available Own Funds
Eligibility restrictions
Eligible Own Funds
Eligibility Capacity
£'000 £'000 £'000 £'000 £'000 £'000 Eligibility rule
Tier 1 84,998 - 84,998 - 84,998 Tier 1 (R) - - - - - 17,000 20% of total Tier 1
Tier 2 - - - - - 546 20% of MCR Tier 3 - - - - - Not eligible
Total 84,998 - 84,998 - 84,998
MCR 2,732 Surplus 82,266 MCR Coverage 3111%
The Marine Insurance Company Limited
Basic Own
Funds Availability restrictions
Available Own Funds
Eligibility restrictions
Eligible Own Funds
Eligibility Capacity
£'000 £'000 £'000 £'000 £'000 £'000 Eligibility rule
Tier 1 44,643 - 44,643 - 44,643 Tier 1 (R) - - - - - 8,929 20% of total Tier 1
Tier 2 - - - - - 986 20% of MCR Tier 3 - - - - - Not eligible
Total 44,643 - 44,643 - 44,643
MCR 4,930 Surplus 39,713 MCR Coverage 906%
Total available Own Funds to meet the MSCR
As described in section E.1.3 above.
Total eligible Own Funds to meet the MSCR
The Delegated Act requires that limits are imposed upon the eligible amounts of Restricted Tier 1, Tier 2 and Tier 3 capital, according to the calculation of the MSCR and solo entity MCR:
• Eligible Tier 1 items shall be at least 80% of the MSCR/MCR;
• Eligible Tier 2 items shall be no more than 20% of the MSCR/MCR;
• The sum of paid in preference shares (and the related share premium account) and paid in subordinated liabilities classified as Tier 1 shall represent no more than 20% of the total amount of Tier 1 items. Items exceeding this limit are reclassified to Tier 2.
• Tier 3 items are ineligible to cover the MSCR/MCR.

| RSA Insurance Group plc | Solvency and Financial Condition Report 2016
- 122 -
E.1.5 Differences between Equity and Net Assets
Comparison between IFRS/FRS 101 net equity and Solvency II Basic Own Funds
Published IFRS/FRS 101 net equity and Basic Own Funds (excess of assets over liabilities as calculated for solvency purposes) are compared in the following tables for the Group and the standalone UK regulated entities. Explanations for differences are provided in Sections D.1.2, D.2.2 and D.3.2:
The Group
2016
£m
IFRS Net Equity Capital 3,847 IFRS Loan Capital 1,068
IFRS Total Capital 4,915
SII Equity Capital 2,119 SII Loan Capital 1,129
SII Basic Own Funds 3,248
Royal & Sun Alliance Insurance plc
2016 £m
FRS 101 Net Equity Capital 2,853 FRS 101 Loan Capital 370
FRS 101 Total Capital 3,223
SII Equity Capital 2,170 SII Loan Capital 1,129
SII Basic Own Funds 3,299

| RSA Insurance Group plc | Solvency and Financial Condition Report 2016
- 123 -
Royal & Sun Alliance Reinsurance Limited
2016 £'000
FRS 101 Net Equity Capital 89,644 FRS 101 Loan Capital -
FRS 101 Total Capital 89,644
SII Equity Capital 84,998 SII Loan Capital -
SII Basic Own Funds 84,998
The Marine Insurance Company Limited
2016 £'000
FRS 101 Net Equity Capital 46,696 FRS 101 Loan Capital -
FRS 101 Total Capital 46,696
SII Equity Capital 44,643 SII Loan Capital -
SII Basic Own Funds 44,643
Foreseeable dividends, distributions and charges
An adjustment is made for “reasonably foreseeable” dividends (i.e. expected dividend payments arising from the 2016 financial year). At the 2016 year-end, a final dividend of £112m is to be proposed at the Annual General Meeting and so is deducted in arriving at Group Basic Own Funds.
Other deductions made in arriving at Group Basic Own funds total £231m.
E.1.6 Transitional Arrangements
See Section E.1.2 for a description of the nature and amount of Own Funds items subject to transitional arrangements.
E.1.7 Ancillary Own Funds
One Ancillary Own Funds (AOF) item exists within the Group. During 2016, an AOF structure was approved permitting a maximum of €90m of nil-paid uncalled share capital. The AOF counts as Tier 2 capital in RSAI Ireland’s Solo solvency

| RSA Insurance Group plc | Solvency and Financial Condition Report 2016
- 124 -
calculations only, subject to eligibility rules; however, it does not count towards covering the latter entity’s MCR. The AOF item is not considered for Group solvency purposes.
E.1.8 Deductions and Restrictions
See Sections E1.3 and E1.4 for a description of the nature and amount of restrictions on Own Funds.
E.1.9 Group Fungibility and Transferability
Availability of Group capital to meet Solvency II Group SCR
Under Solvency II, as part of their assessment of group solvency, groups must make an assessment of whether any their entities are reliant upon capital held in another entity to cover their capital requirements. Where this is the case it must assess whether the capital in the other entity could in practice be made available.
The Group deems its capital to be fully fungible and there to be no restriction at a Group level.
In such circumstances where capital is needed from a subsidiary to support a legal entity elsewhere in the Group, it will be repatriated in the form of dividends and where this is not practicable, a sale of the subsidiary will be considered.

| RSA Insurance Group plc | Solvency and Financial Condition Report 2016
- 125 -
E.2 Solvency Capital Requirement and Minimum Group Consolidated Capital Requirement
E.2.1 SCRs and MSCR/MCRs
At the 2016 year-end, the SCRs and MSCR/MCRs of the Group and UK regulated entities were as follows:
SCR MCR/MSCR
£m £m
The Group 1,793 1,580 RSAI 1,793 713 RSA Re 8 3 MIC 20 5
E.2.2 SCR Split by Risk
The Group’s Internal Model received approval for use from the PRA on 5 December 2015. An analysis of the Internal Model SCRs of the Group and the UK regulated entities by risk category is provided in section E.2.8.
E.2.3 Standard Formula Simplifications
Standard Formula simplifications are not applicable as an Internal Model is used.
E.2.4 Standard Formula Undertaking Specific Parameters
Standard Formula Undertaking Specific Parameters are not applicable as an Internal Model is used.
E.2.5 Capital add-on and Undertaking Specific Parameters Non-Disclosure
No capital add-ons were in place during the reporting period. Undertaking Specific Parameters are not applicable as an Internal Model is used.
E.2.6 Capital add-on and Undertaking Specific Parameters Impact
No capital add-ons were in place during the reporting period. Undertaking Specific Parameters are not applicable as an Internal Model is used.
E.2.7 MSCR Calculation Inputs
See Section E.2.11 for the composition of this measure.
During 2016 and 2017, Codan Forsikring A/S and Forsikringsselskabet Privatsikring A/S are required to use the Standard Formula for their MCRs which feed into the MSCR, although their SCRs are based on the approved Internal Model.

| RSA Insurance Group plc | Solvency and Financial Condition Report 2016
- 126 -
E.2.8 Movements in the SCR and MSCR
Group/RSAI SCR
The table below summarises the Group/RSAI SCR at the 2016 year-end by risk category and prior to the disposal of the Group’s legacy business. The contribution of each risk driver is split between the modelled mean impact (the “Expectation”) and the difference between the 1 in 200 and mean impact (the “Movement from expectation”). The total contribution of each risk driver (prior to diversification) is represented by the sum of the Expectation and Movement from Expectation.
Expectation Movt from
expectation Risk Driver £m £m
Underwriting (493) 585 Catastrophe 216 297 Reserve (30) 545 Market & credit (48) 563 Currency (3) 99 Pension 29 775 Legacy (5) 433 Operational - 301 Other 358 (67)
less: diversification (1,762)
SCR 1,793
The Group/RSAI SCR reduced to £1,793m during 2016. Material movements in the SCR over the period are:
• Improvement in profitability in Operational Plan due to improvement in CY underwriting result and reduction in central expenses and reorganisation costs; and
• Pension risk reduction due to significant pension scheme asset de-risking in the period.
Movements in other UK regulated entities’ SCRs
The tables below summarise the RSA Re and MIC SCRs by risk category. There were no material movements in either SCR over the period.
Royal & Sun Alliance Reinsurance Limited
Expectation Movt from
expectation Risk Driver £'000 £'000
Market & credit (33) 395 Currency (384) 3,723 Operational - 4,830 Other 173 (173)
less: diversification (323)
SCR 8,208

| RSA Insurance Group plc | Solvency and Financial Condition Report 2016
- 127 -
The Marine Insurance Company Limited
Expectation Movt from
expectation Risk Driver £'000 £'000
Underwriting - 417 Market & credit (789) 279 Currency (1,699) 18,818 Operational - 2,811 Other 965 (965)
less: diversification (118)
SCR 19,719
Movements in the MSCR
The tables below summarises the MSCR by Group entity. Movements in the MSCR during 2016 are due to the disposal of Latin American entities, offset by increases in Canadian Minimum Capital Test requirements and Scandinavian Standard Formula MCRs.
2016
£m
Royal & Sun Alliance Insurance plc 713 Codan Forsikring A/S 372 Forsikringsselskabet Privatsikring A/S 8 Holmia Livforsakring AB 7 RSA Insurance Ireland DAC 28 The Marine Insurance Company Limited 5 Royal & Sun Alliance Reinsurance Limited 3 Insurance Corporation of the Channel Islands Limited 5 Tower Insurance Company Limited 2 British Aviation Insurance Company Limited 2 Canadian insurance entities 363 Other non-EEA 72
Total of Solo MCRs 1,580

| RSA Insurance Group plc | Solvency and Financial Condition Report 2016
- 128 -
E.2.9 Consolidated Group SCR Constituents
The accounting consolidation method has been chosen (Method 1) by RSA. As such, group supervision will be done at the Group holding company level and no subgroup level reporting will be done as full group supervision is expected to be done at the ultimate EEA parent level.
Described in the table below are the insurance and reinsurance undertakings within the Group that are included in the calculation of the Group Solvency:
SCR
(Including Op Risk)
£m
Fully consolidated insurance or reinsurance undertakings (incl. third country insurance undertakings, insurance holding companies, mixed financial holding companies and ancillary services undertakings)
1,793
Fully consolidated special purpose vehicles - Proportionally consolidated insurance or reinsurance undertakings (incl. third country insurance undertakings, insurance holding companies, mixed financial holding companies and ancillary services undertakings)
-
Other subsidiaries (not listed above) consolidated on an adjusted equity basis -
All other related undertakings (not listed above) - Total 1,793
E.2.10 Group Diversification Effects
All of the risks above are derived from the simulations making up the SCR calculation. However, in any simulation, there may be good or bad outcomes from each individual risk. Thus, when the confidence level for each risk is taken separately and then totalled, the result is a higher value than the SCR. The measured difference is the inherent diversification between modelled risks.
The measured diversification has reduced. The primary causes of this are the reductions in catastrophe risk and market risk.
At the 2016 year end, the internal model calculated a diversification benefit between the risk drivers shown of £1,762m. It is important to note, however, that the quantification of diversification within the model depends critically upon the choice of risk category and the level of granularity required.

| RSA Insurance Group plc | Solvency and Financial Condition Report 2016
- 129 -
E.2.11 Minimum Consolidated Group SCR
The calculation of the solo MCRs for the MSCR is shown in the table below:
Linear MCR pre-corridor Corridor - 25% Corridor - 45%
MCR (per MSCR)
£m £m £m £m
Royal & Sun Alliance Insurance plc (United Kingdom) 713 448 807 713 Codan Forsikring A/S (Denmark) 417 207 372 372 Forsikringsselskabet Privatsikring A/S (Denmark) 9 4 8 8 Holmia Livforsakring AB (Sweden) 7 4 7 7 RSA Insurance Ireland DAC (Republic of Ireland) 28 25 45 28 The Marine Insurance Company Limited (United Kingdom) - 5 9 5 Royal & Sun Alliance Reinsurance Limited (United Kingdom) - 2 4 3 Insurance Corporation of the Channel Islands Limited 5 n/a n/a 5 Tower Insurance Company Limited 2 n/a n/a 2 British Aviation Insurance Company Limited 2 n/a n/a 2 Canadian insurance entities 363 n/a n/a 363 Other non-EEA 72 n/a n/a 72
MSCR 1,580
E.2.12 Undertakings in Scope of the Internal Model
Information on all undertakings in the scope of the Group Internal Model SCR is included in QRT S.32.01.22.

| RSA Insurance Group plc | Solvency and Financial Condition Report 2016
- 130 -
E.3 Use of the duration-based equity risk sub-module in the calculation of the SCR
The duration-based equity risk sub-module is not used.

| RSA Insurance Group plc | Solvency and Financial Condition Report 2016
- 131 -
E.4 Differences between the Standard Formula and any Internal Model used
E.4.1 Internal Model Purposes
The Internal Model helps ensure that the Group operates effectively and within regulatory requirements on a continuous basis. The model outputs provide the capital information used in: the calculations of Economic Capital and the SCR; the ORSA; reporting and disclosure; and other business applications.
The Group’s risk profile differs significantly from that assumed by the Standard Formula making the latter unsuitable to measure the Group’s SCR.
E.4.2 Internal Model Scope
Scope (by Business Unit)
All of the Group’s business units are included in the scope of the internal model.
Scope (by Risk Type)
The Internal Model SCR is split into the following sub-modules:
• Underwriting Risk
• Catastrophe Risk
• Reserve Risk
• Market
• Credit Risk
• Currency Risk
• Pension Risk
• Operational Risk
• Other Drivers
E.4.3 Partial Internal Model Integration
A full Internal Model is used so there is no Partial Internal Model integration into the Standard Formula.
E.4.4 Internal Model Calculation Methods
Overview of Model Methodology
The Group employs an Internal Model to determine its SCR capital requirements at both a Group and UK regulated entity level. The SCRs assume that one year of new business is written as a going concern and calculates the movement in Basic Own Funds over one year.
A model run consists of 25,000 simulations, each representing a different possible outcome of the future cash flows and balance sheets. For each projected balance sheet, the difference between the opening available net assets and the present value of

| RSA Insurance Group plc | Solvency and Financial Condition Report 2016
- 132 -
projected net assets represents the capital required to meet the outflows and value movements in the period up to that projected balance sheet.
Operational risk is modelled separately and the resulting capital requirement added to that produced by the main model run to arrive at the overall assessment of capital required.
E.4.5 Differences in Methodologies and Assumptions
Differences in Standard Formula and Internal Model structure
The Group’s Internal Model is structured in a different way to the Standard Formula. The Internal Model is a fully integrated capital model where variables interact to create a distribution of outcomes.
Unlike the Standard Formula where different risk types are considered on a standalone basis and explicit correlations applied to them, the Internal Model makes no attempt to isolate risk types and model them separately. Instead, it stimulates future cash flows to perform annual valuation of each item on the balance sheet. This ensures that items that impact more than one risk type are automatically captured within the model. As a result, a large part of the dependency structure within the Internal Model is implicit dependency. Explicit correlations are only applied to certain parts of the Internal Model where the Group believes implicit dependency may not be sufficient to explain the overall correlation.
In addition, there are many expected cash flows that the Standard Formula SCR ignores, such as loan and other group costs. This is because the Standard Formula was designed from a solo entity perspective and does not capture the complexities of a Group.
Explanation by risk module used in Internal Model and Standard Formula
Insurance Risk – Underwriting, Reserving and Catastrophe
The Internal Model splits insurance risk into three categories:
• Underwriting
• Reserving
• Catastrophe
Non-life, health and life risks are all considered jointly within each category (although non-life is the material component).
The Standard Formula splits non-life risks and non-life like health risks into three separate categories:
• Premium and Reserve
• Catastrophe
• Lapse (immaterial for RSA as a non-life insurer)
In broad terms, Standard Formula Premium and Reserve risk for non-life and health can be compared to Internal Model Underwriting and Reserve risk (although the Standard Formula combines the two).
Catastrophe risk can similarly be compared.
This approach is crude as it ignores the fundamentally different approach to diversification between the two methods.
Life risks are immaterial at a Group and RSAI level for both the Internal Model and Standard Formula, given the nature of the Group’s operations.

| RSA Insurance Group plc | Solvency and Financial Condition Report 2016
- 133 -
Market and Currency Risk
Market Risk is lower under the Internal Model than the Standard Formula. The Standard Formula uses pre-determined charges, whereas the Internal Model uses projected returns on RSA’s assets based on a range of economic simulations, which leads to a more appropriate reflection of RSA’s risk profile.
Counterparty Risk
Counterparty Risk is lower under the Internal Model than the Standard Formula. The Internal Model will simulate defaults based on S&P credit ratings and RSA’s own Reinsurance data for Cash and Reinsurance exposures. Policyholder, intermediary and other asset defaults are modelled based on historic default data, which is lower than that implied by the Standard Formula 15% and 90% default rates.
Operational risk and other items
Operational Risk is lower under the Internal Model than the Standard Formula. The Internal Model uses scenarios that are designed using expert judgement from subject matter experts using RSA’s real experience and third party data. As a result, the Internal Model is more closely aligned to real world experience than a function of reserves.
Risks not covered by the Standard Formula but covered by the Internal Model
The Standard Formula is by its very nature and design a standardised calculation method and is therefore not tailored to the individual risk profile of RSA. For example, the Standard Formula does not capture:
• Credit spread volatility and longevity risk associated with the Group’s pension schemes;
• Contagion risk arising from common processes, systems or people across the Group; and
• Claims inflation risk arising from changes in legislative, global economic and political environment.
E.4.6 Risk Measure and Time Period
The Internal Model SCR represents the capital required to ensure that the firm will have sufficient amount of eligible capital resources to be able to meet its obligations when the business encounters adverse conditions, subject to a confidence level of 99.5% over a one-year period and assuming the business remains a going concern.
E.4.7 Data Nature and Appropriateness
There are many data sources used in the Internal Model. For example:
• Balance Sheet data
• Detailed asset data
• Best estimate reserves and reserving triangles by class of business
• Historical loss ratios by class of business
• Historical Large losses by class of business
• Operational Plan
• Exposure data for Catastrophe Modelling
• Economic data for Economic Scenario Generator
• Operational risk loss scenario assessments
Each data item used by the Internal Model is assessed in an annual data quality assessment exercise to establish whether the data is accurate, appropriate and complete.

| RSA Insurance Group plc | Solvency and Financial Condition Report 2016
- 134 -
E.4.8 Solo and Group Level Differences
All solo entities (with the exception of Holmia Livforsakring AB and RSA Insurance Ireland DAC who use the Standard Formula) and the Group use the same Internal Model. There are no differences between the model used at the individual solo entity level and the model used to calculate the Group SCR.

| RSA Insurance Group plc | Solvency and Financial Condition Report 2016
- 135 -
E.5 Non-compliance with the MCR and non-compliance with the SCR
The Group has been fully compliant with the Group SCR and maintained a surplus on the MSCR during the reporting period.
RSAI, MIC and RSA Re have been fully compliant with their SCRs and the MCRs during the reporting period.

| RSA Insurance Group plc | Solvency and Financial Condition Report 2016
- 136 -
E.6 Any other information
Nothing to report.

| RSA Insurance Group plc | Solvency and Financial Condition Report 2016
Appendix 1 - 1 -
Subsidiaries and Associates as at 31 December 2016
The proportion of voting power held equals the proportion of ownership interest unless indicated.
Subsidiary or Associate Country Class of shares held % held
Royal & Sun Alliance Insurance (Middle East) BSC (c) Bahrain Ordinary 50 Royal & Sun Alliance Insurance plc - Escritório de Representação no Brasil Ltda. Brazil Ordinary 100
3342484 Canada Limited Canada Common 100 8301140 Canada Limited Canada Common 100 8301140 Canada Limited 3 Canada Preferred 100 Ascentus Insurance Ltd. Canada Common 100 Canadian Northern Shield Insurance Company Canada Common 100 Coast Underwriters Limited 3 Canada Class 1 Preferred Unlimited 100 Coast Underwriters Limited 3 Canada Class 2 Preferred Unlimited 100 Coast Underwriters Limited Canada Class A 85.42 Coast Underwriters Limited 3 Canada Class B1 100 Johnson Inc. Canada Series A Common 100 Johnson Inc. Canada Series B Common 100 Johnson, L. Inc. Canada Class A Common 100 Johnson, L. Inc. Canada Class B Common 100 MRM Solutions Limited 5 Canada Class A Common 100 MRM Solutions Limited 3, 5 Canada Class B Common 100 Quebec Assurance Company Canada Common 100
Reilly & Wickens Brokers Ltd. 2 Canada Class A Voting Shares Unlimited 9.99
Reilly & Wickens Brokers Ltd. 2, 3 Canada Class B Non-Voting Shares Unlimited 32.51
Roins Financial Services Limited Canada Common 100 Roins Financial Services Limited 3 Canada Preference 100 Roins Holding Limited Canada Common 100 Royal & Sun Alliance Insurance Company of Canada 3 Canada Class A Preferred 100 Royal & Sun Alliance Insurance Company of Canada Canada Common 99.996 RSA Travel Insurance Inc. Canada Common 100 Shaw Sabey & Associates Ltd. 2 Canada Common Unlimited 25 The Johnson Corporation Canada Common 100 Unifund Assurance Company Canada Common 100 Unifund Assurance Company 3 Canada Preferred 100 Unifund Claims Inc. Canada Common 100 Western Assurance Company Canada Common 100 Besigtelses Kontoret af 1914 A/S Denmark Ordinary 100 Codan A/S Denmark Ordinary 100 Codan Ejendomme II A/S Denmark Ordinary 100 Codan Forsikring A/S Denmark Ordinary 100 Forsikringsselskabet Privatsikring A/S Denmark Ordinary 100

| RSA Insurance Group plc | Solvency and Financial Condition Report 2016
Appendix 1 - 2 -
Subsidiary or Associate Country Class of shares held % held
Insurance Corporation of the Channel Islands Limited Guernsey Ordinary 100 Insurance Corporation Service Company Limited Guernsey Ordinary 100 Royal & Sun Alliance IT Solutions (India) Private Limited India Ordinary 100 RSA Actuarial Services (India) Private Limited India Ordinary 100 123 Money Limited 3 Ireland B1 Ordinary 100 123 Money Limited 3 Ireland B2 Ordinary 100 123 Money Limited 3 Ireland B3 Ordinary 100 123 Money Limited 3 Ireland B4 Ordinary 100 123 Money Limited 3 Ireland B5 Ordinary 100 123 Money Limited 3 Ireland C Ordinary 100 123 Money Limited Ireland Ordinary 100 Benchmark Underwriting Limited Ireland Ordinary 100 EGI Holdings Limited Ireland Ordinary 100 Europa General Underwriters Limited Ireland Ordinary 100 Royal & Sun Alliance (Ireland) Limited Ireland Ordinary 100 RSA Insurance Ireland DAC Ireland Ordinary 100 RSA Overseas (No.3) Limited Ireland Ordinary 100 RSA Overseas Holdings (No 1) Unlimited Company Ireland Common 100 RSA Overseas Holdings (No. 2) Unlimited Company Ireland Common 100 RSA Reinsurance Ireland Limited Ireland Ordinary 100 Sertus Underwriting Limited Ireland Ordinary 100 The Patriotic Limited Ireland Ordinary 100 Royal Insurance Service Company (Isle of Man) Limited Isle of Man Ordinary 100 RSA Isle of Man No.1 Limited Isle of Man Ordinary 100 RSA Manx Holdings Limited Isle of Man Ordinary 100 Tower Insurance Company Limited Isle of Man Ordinary 100 URICA Capital Limited 2 Jersey Participating 49.95 RSA Overseas Holdings (Luxembourg) (No 1) SARL Luxembourg Ordinary 100 GDII - Global Direct Insurance Investments V.O.F. Netherlands Partnership Interest 100 IDIP Direct Insurance B.V. Netherlands Ordinary 100 Intouch Insurance Group B.V. Netherlands Ordinary 100 Royal & SunAlliance Benelux Holdings N.V. Netherlands Ordinary 100 Royal Insurance Global B.V. Netherlands Ordinary 100 RSA Overseas (Netherlands) B.V. Netherlands Ordinary 100 RSA Overseas Holdings B.V. Netherlands Ordinary 100 Sun Alliance Finance B.V. Netherlands Ordinary 100 NIS Norway AS Norway Ordinary 100 Al Ahlia Insurance Company SAOC 6 Oman Ordinary 70
GDII - Rus L.L.C. Russian Federation Ordinary 100
Al Alamiya for Cooperative Insurance Company 6 Saudi Arabia Ordinary 50.07 Survey Association Pte. Ltd. Singapore Ordinary 100 CAB Group AB 2 Sweden Ordinary 27.27 Holmia Livforsakring AB Sweden Ordinary 100 NIS Sweden I AB Sweden Ordinary 100 Acrecrest Limited United Kingdom Ordinary 100 Alliance Assurance Company Limited United Kingdom Ordinary 100 Bradford Insurance Trustee Limited United Kingdom Ordinary 100 British and Foreign Marine Insurance Company Limited United Kingdom Ordinary 100 British Aviation Insurance Company Limited United Kingdom Ordinary 57.1 Caunce O'Hara & Company Limited 2 United Kingdom Ordinary 39 Centrium Management Company Limited 2 United Kingdom Ordinary 31.45

| RSA Insurance Group plc | Solvency and Financial Condition Report 2016
Appendix 1 - 3 -
Subsidiary or Associate Country Class of shares held % held
Century Insurance Company Limited United Kingdom Ordinary 100 Codan Finance Limited United Kingdom Ordinary 100 Coverselect Limited United Kingdom Ordinary 100 Eurotempest Limited 2 United Kingdom Ordinary 33.33 Fyfe Group Limited United Kingdom Ordinary 100 Liability Insurance Solutions Limited United Kingdom Ordinary 100 Liverpool Marine and General Insurance Company Limited United Kingdom Ordinary 100 London Guarantee & Reinsurance Company Limited United Kingdom Ordinary 100 Magian Underwriting Agency (1998) Limited United Kingdom Ordinary 100 Martello Professional Risks Limited United Kingdom Ordinary 100 Motor Trade Solutions Limited United Kingdom Ordinary 100 National Vulcan Engineering Insurance Group Limited United Kingdom Ordinary 100 Noble Marine (Insurance Brokers) Limited United Kingdom Ordinary 100 Noble Marine (Underwriting Agencies) Limited United Kingdom Ordinary 100 Non-Destructive Testers Limited United Kingdom Ordinary 100 Oak Underwriting plc United Kingdom Ordinary 100 Polaris U.K. Limited 2 United Kingdom Ordinary 25.38 Professional Indemnity Direct Limited United Kingdom Ordinary 100 Punchbowl Park Management Limited 2, 4 United Kingdom Ordinary 65.09 R&SA Global Network Limited United Kingdom Ordinary 64 R&SA Marketing Services plc United Kingdom Ordinary 100 Road Runner Motor Trade Limited United Kingdom Ordinary 100 Royal & Sun Alliance Insurance (Global) Limited United Kingdom Ordinary 100 Royal & Sun Alliance Insurance plc United Kingdom Class A Ordinary 100 Royal & Sun Alliance Insurance plc 3 United Kingdom Class B Ordinary 100 Royal & Sun Alliance Pension Trustee Limited United Kingdom Ordinary 100 Royal & Sun Alliance Property Services Limited United Kingdom Ordinary 100 Royal & Sun Alliance Reinsurance Limited United Kingdom Ordinary 100 Royal Insurance (U.K.) Limited United Kingdom Ordinary 100 Royal Insurance Holdings Limited 1 United Kingdom Ordinary 100 Royal Insurance Operational Services (U.K.) Limited United Kingdom Deferred Ordinary 100 Royal Insurance Operational Services (U.K.) Limited United Kingdom Ordinary 100 Royal International Insurance Holdings Limited United Kingdom £1.00 Ordinary 100 Royal International Insurance Holdings Limited United Kingdom US$1.00 Ordinary 100 Roysun Limited United Kingdom Ordinary 100 RSA Accident Repairs Limited United Kingdom Ordinary 100 RSA Claims Management Limited United Kingdom Ordinary 100 RSA CRS (US) Limited United Kingdom Ordinary 100 RSA E-Holdings Limited United Kingdom Ordinary 100 RSA Engineering Limited 1 United Kingdom Ordinary 100 RSA Finance United Kingdom Ordinary 100 RSA Law Limited United Kingdom Ordinary A 90 RSA Northern Ireland Insurance Limited United Kingdom Ordinary 100 RSA Overseas Holdings (UK) Limited United Kingdom Ordinary 100 Sal Pension Fund Limited 1 United Kingdom Ordinary 99.99 Saturn Professional Risks Limited United Kingdom Ordinary 100 Sun Alliance and London Insurance plc United Kingdom Ordinary 100 Sun Alliance Fund Management Limited 1 United Kingdom Ordinary 100 Sun Alliance Insurance International Limited United Kingdom Ordinary 100 Sun Alliance Insurance Overseas Limited United Kingdom Ordinary 100 Sun Alliance Insurance UK Limited United Kingdom Ordinary 100 Sun Alliance Management Services Limited United Kingdom Ordinary 100

| RSA Insurance Group plc | Solvency and Financial Condition Report 2016
Appendix 1 - 4 -
Subsidiary or Associate Country Class of shares held % held
Sun Alliance Mortgage Company Limited 1 United Kingdom Ordinary 100 Sun Insurance Office Limited United Kingdom Ordinary 100 Swinchan Holdings Limited 1 United Kingdom Ordinary 100 The Globe Insurance Company Limited United Kingdom Ordinary 100 The London Assurance United Kingdom Ordinary 100 The Marine Insurance Company Limited United Kingdom Ordinary 100 The Northern Maritime Insurance Company Limited United Kingdom Ordinary 100 The Sea Insurance Company Limited United Kingdom Ordinary 100 The Union Marine and General Insurance Company Limited United Kingdom Ordinary 100 The Westminster Fire Office Limited United Kingdom Ordinary 100 Westgate Properties Limited United Kingdom Ordinary 100 Royal & Sun Alliance Insurance Agency Inc. United States Common 100
Notes
1. Directly owned by the parent company RSA Insurance Group plc.
2. Indicates that the holding represents an Investment or is an Associate of the Group.
3. Indicates ownership of non-voting shares.
4. There is no subsidiary where the Group holds less than 50% of the voting rights and there are no entities where the Group holds more than 50% of the voting rights which are not subsidiaries unless indicated.
5. The percentage held relates to the actual percentage of the share capital held and not the effective percentage held (85.42%)
6. In relation to Al Ahlia Insurance Company SAOC, and Al Alamiya for Cooperative Insurance Company, the percentage held relates to the actual percentage of the share capital held and not the effective percentage held (which is 35.00% and 25.04% respectively).
General notes
• All of the subsidiaries listed are wholly owned within the Group and included in the consolidated accounts.
• No subsidiary holds a disclosable interest in the shares of RSA Insurance Group plc.

| RSA Insurance Group plc | Solvency and Financial Condition Report 2016
Appendix 1 - 5 -
Branches as at 31 December 2016
Company Country of Branch
National Vulcan Engineering Insurance Group Limited Italy Royal & Sun Alliance Insurance plc Argentina
Australia Belgium China Dubai France Germany Greece Ireland Italy Netherlands Norway Pakistan Spain The Marine Insurance Company Limited Greece
Italy Royal & Sun Alliance Insurance (Global) Limited Australia
Royal & Sun Alliance Reinsurance Limited Argentina
Royal Insurance (U.K.) Limited Ireland
Sun Alliance and London Insurance plc Cyprus
Royal International Insurance Holdings Limited Cyprus
Greece Italy Sun Insurance Office Limited Germany
Greece Italy The Sea Insurance Company Limited Italy
Royal & Sun Alliance Insurance (Middle East) BSC (c) Abu Dhabi
Dubai Sharjah Codan Forskring A/S Norway
Sweden United States The London Assurance Greece

| RSA Insurance Group plc | Solvency and Financial Condition Report 2016
Appendix 2 - 1 -
Summary
RSAI is the main insurance company in the Group and is the primary holding company of the Group’s entire insurance business.
The Group SFCR meets the regulatory requirement for public disclosure in respect of RSAI, RSA Re and MIC. As mentioned in the introduction in the main body of the report, RSAI, RSA Re and MIC are legal entities meeting all regulatory and governance requirements and their individual risk profile and capital requirements are monitored to ensure ongoing regulatory compliance. However, the Group does not manage each entity as an individual business and does not set individual business strategies. In light of this, it is important for the reader to understand that the focus of the Group SFCR is the activities of the RSA Group as a whole.

| RSA Insurance Group plc | Solvency and Financial Condition Report 2016
Appendix 2 - 2 -
A. Business and Performance
RSAI is the largest operating company of the Group. The Company, its subsidiaries and overseas branches transact the majority of the Group’s business. RSAI itself transacts the greater part of its business in the UK where it is a leading commercial lines insurer and a top-five personal lines insurer via direct and affinity lines business.
The Company offers a full suite of commercial lines products across Property, Liability, Motor and Marine, distributing predominantly via insurance brokers. RSAI’s personal lines business principally provides Household, Motor and Pet insurance through brokers and affinity programmes as well as through MORE TH>N, its direct brand.
As a company registered in England and Wales, RSAI must comply with the provisions of the Companies Act 2006. RSAI is also subject to financial regulation and is licensed by the PRA as an insurer. Its directors are FCA / PRA approved persons. The main insurance regulations covering RSAI are the FCA handbook and the PRA rulebook, including the body of European law, regulation and guidelines known as Solvency II, which became effective on 1 January 2016.
Further Information
Further information on RSAI’s business and performance is contained in Section A within the main body of the report.

| RSA Insurance Group plc | Solvency and Financial Condition Report 2016
Appendix 2 - 3 -
B. System of Governance
B.1 General information on the system of governance
Group Board v RSAI Board
Authority for determining the RSA Group strategy and business model, as adopted by RSAI, resides firmly with the RSA Group Board. This explains why there are currently no committees of the RSAI Board and no independent Non-Executive Directors on the RSAI Board.
These points are reflected in the RSA Group and RSAI’s system of governance arrangements, which are designed to leverage the synergies between the two Boards, ensure clarity of Director responsibilities and avoid duplication of activities. In particular, those arrangements shape the composition of the RSAI Board and the roles and responsibilities of the RSAI Directors and Group Corporate Centre and UK Executive Teams. They are also the rationale for RSAI adopting the Group Internal Control and Risk Management Systems in supporting its corporate governance framework.
The Delegated Authority Framework
The Delegated Authority Framework sets out how the Group Board’s authority is delegated to the Group Chief Executive Officer, and then further delegated to the officers of the business. (This framework also underpins the use of Executive Licences). The scope of the Delegated Authority Framework reaches all RSA businesses, and means that all individuals operate within a set of limits and powers delegated by the Group Chief Executive Officer, his direct reports and/or governing bodies. This process ensures consistency between each of the subsidiaries within the Group.
The powers of the RSAI Board, and the extent to which these powers may be delegated or must be retained, are set out in detail in the Board's Terms of Reference.
Corporate Governance Framework
The purpose of the Corporate Governance Framework is to specify how RSAI meets its legislative and regulatory governance requirements, enabling effective and efficient decision making by the Board. It ensures that both Directors and employees act under a chain of authority and powers which stretches back to the RSA shareholders as ultimate owners of RSAI. It provides the framework which supports the realisation of its business strategy; supports its long term success and safeguards compliance with applicable laws and regulations.
The Board is accountable to stakeholders for the creation and delivery of strong sustainable performance and the creation of long term shareholder value. It meets frequently and is responsible for organising and directing the affairs of the Company in a manner that will promote the success of RSAI and is consistent with good corporate governance practice, ensuring that in carrying out its duties the Company meets legal and regulatory requirements.
The RSAI Board
The Board of Directors oversees the business of the Company and exercises fiduciary responsibility and governance oversight in relation to the subsidiaries. It may exercise all the powers of the Company subject to the Articles of Association, the Board’s Terms of Reference, relevant law and any directions as may be given by its shareholder, Royal Insurance Holdings Limited, in general meetings by ordinary shareholder resolution. The Board Terms of Reference sets out matters that are reserved for the Board and those matters that are above the delegated authority, which must be referred to its ultimate shareholder for approval (RSA Insurance Group plc). The Board ensures that authority is obtained from a management authority perspective as well as a legal entity basis.
All Directors of RSAI are senior executives of the Company. Directors have access to the services and advice of the Group Chief Legal Officer and Company Secretary, the Internal Audit Function, the Compliance Function, the Risk Function, and the

| RSA Insurance Group plc | Solvency and Financial Condition Report 2016
Appendix 2 - 4 -
Actuarial Function. In addition Directors may take independent professional advice at RSAI’s expense in furtherance of their duties.
Effectiveness of the Board
The Board has implemented an effectiveness review process which is undertaken annually to ensure that the Board is operating effectively.
Changes during 2016
In 2016, the Group completed the disposal of its businesses in Latin America and Russia, which were all subsidiaries of RSAI. The reporting line for the Middle East businesses was moved into the UK and Western Europe business unit, which was renamed UK & International.
Key Governance Functions
None of RSAI’s Key Governance Functions have been outsourced. The RSAI Board’s Terms of Reference explicitly note the right of the Heads of the Key Governance Functions to have direct access to the Board at all times and for a private meeting with the Directors at least annually.
Remuneration
The Company has adopted the Group remuneration framework which covers both fixed and variable pay (including incentive payments) for its employees. Remuneration aligns to general principles and standards set by the Group. These are contained in the Group Remuneration Policy (effective from 1 January 2016).
RSAI’s Directors receive no remuneration in their capacity as Directors. The Group Remuneration Committee sets the remuneration of RSA Group senior executives. It approves the Group Remuneration Policy and any incentive scheme for those under its review and also any scheme across the Group which involves the issuance of shares to employees.
B.2 Fit and proper requirements
Fit and proper requirements are applied at Group level. This ensures that Group Board members that exercise significant influence over RSAI and Group Executives that are also RSAI Directors are fit and proper.
See Section B.2 within the main body of the report for details of the Group’s fit and proper requirements.
B.3 Risk management system including the own risk and solvency assessment
RSAI has adopted the Group Risk Management System, reflecting the close alignment between the Company’s risk strategy and risk appetite with that of the Group. See Section B.3 within the main body of the report for details of the Group’s Risk Management System.
B.4 Internal control system
RSAI has adopted the Group Internal Control System. See Section B.4 within the main body of the report for details of the Group’s internal control system.

| RSA Insurance Group plc | Solvency and Financial Condition Report 2016
Appendix 2 - 5 -
B.5 Internal audit function
See Section B.5 within the main body of the report for details of the Group’s internal audit function.
This approach is applied to the plans for RSAI. GIA provides both its audit plans and quarterly updates on progress against plans, the outcomes of its work and progress against issues to the RSAI Board.
B.6 Actuarial function
The Group Actuarial Function holder is also the Actuarial Function Holder for RSAI and has independent access to the RSAI Board. From 2017, the Group Actuarial Function will produce annual Actuarial Function Reports summarising the key conclusions of the Actuarial Function’s work covering RSAI.
See Section B.6 within the main body of the report for details of the Group’s actuarial function.
B.7 Outsourcing
RSAI enters into outsourcing contracts and distribution arrangements with third parties in the normal course of its business and is reliant upon those third parties being willing and able to perform their obligations in accordance with the terms and conditions of the contracts.
Certain of RSAI’s subsidiaries have also entered into outsourcing agreements with it in relation to the efficient provision of services across the Group.
RSAI’s board reviews the provisions of all major external outsourcing contracts.
B.8 Any other information
Nothing to report.

| RSA Insurance Group plc | Solvency and Financial Condition Report 2016
Appendix 2 - 6 -
C. Risk Profile
RSAI has adopted the Group Risk Management System, reflecting the close alignment between the Company’s risk strategy and risk appetite with that of the Group.
Information on RSAI’s risk profile is contained in Section C within the main body of the report which sets out the Group’s risk profile and highlights where RSAI solo information differs from that of the Group.
D. Valuation for Solvency Purposes
Information on the valuation for solvency purposes is contained in Section D within the main body of the report, which separates out RSAI solo information where appropriate.
E. Capital Management
Information on capital management is contained in Section E within the main body of the report which separates out RSAI solo information where appropriate.

| RSA Insurance Group plc | Solvency and Financial Condition Report 2016
Appendix 3 - 1 -
Summary
The principal activity of RSA Re is to provide a settlement function for the insurance activities carried out by the Group’s offices and Global partners.
The Group SFCR meets the regulatory requirement for public disclosure in respect of RSAI, RSA Re and MIC. As mentioned in the introduction in the main body of the report, RSAI, RSA Re and MIC are legal entities meeting all regulatory and governance requirements and their individual risk profile and capital requirements are monitored to ensure ongoing regulatory compliance. However, the Group does not manage each entity as an individual business and does not set individual business strategies. In light of this, it is important for the reader to understand that the focus of the Group SFCR is the activities of the RSA Group as a whole.

| RSA Insurance Group plc | Solvency and Financial Condition Report 2016
Appendix 3 - 2 -
A. Business and Performance
General Structure
RSA Re is the legal entity through which the following Group activities are undertaken:
• business written by the Global Network
• intra-group reinsurance treaties
Global Network
The Company provides a reinsurance function for the international insurance activities of the Group offices and the Global Network partners (Strategic Network Partners), selected insurers that work with RSA. The Company also provides local coverage for those parts of the world where RSA does not have approval to write business.
The Global Network facilitates the fronting of risks by the Group entities through servicing offices (RSA entities or external Strategic Network Partners) via licences to operate in the relevant territory. As of July 2015, the Global Network covered 150 territories worldwide though 34 producing offices. The Strategic Network Partners pay a fee to use the network. Membership of the Global Network enables the external partners to offer wider coverage to their clients. Most of the business written relates to global insurance programmes for multinational entities. The Global Network Team undertake relationship management and business development, with the Central Accounting Unit, a dedicated team based in Liverpool undertaking reconciliation of intragroup insurance/reinsurance activity; financial reporting for RSA Re, and efficient cash flow.
RSA Re acts as the reinsurer between the producing office (the legal entity which ultimately holds the risk, predominantly RSAI) and the servicing office (the legal entity which fronts the risk). 100% of the gross premiums are retroceded although in a few instances a 2% reinsurance commission is added. RSA Re has a net nil retention in respect of risk. Management of the treaties has been outsourced to RSAI (Central Accounting Unit and Group Reinsurance).
Intra-group Reinsurance
The intra-group reinsurance principally comprises the Internal Reinsurance Vehicle, a mechanism whereby insurance risk is ceded between RSAI branches and subsidiaries to RSAI by using RSA Re. RSA Re has a 100% retrocession agreement moving all of the ceded premium from the Company to RSAI. (RSA Re keeps a 2% fronting fee.) This activity is conducted by Group Reinsurance and all cessions into the Internal Reinsurance Vehicle overseen by the Retained Reinsurance Committee, a body established by the Group Chief Executive Officer under the terms of his Executive Licence.
RSA Re only provides reinsurance protection for claims relating to pre-sale policies. Reinsurance is on a loss occurring basis.
RSA Re has no direct employees; all services necessary for the above activity being provided by RSAI under a Master Services Agreement and an Internal Model Agreement.
Business Strategy
RSA Re has adopted the Group business strategy which is to be focused, stronger and better. This translates to:
• Focused – exploiting leadership positions, focusing on areas where the Group can compete and win
• Stronger – building a balanced, diversified and well capitalised business
• Better - building a business based on operational excellence and open and transparent communication

| RSA Insurance Group plc | Solvency and Financial Condition Report 2016
Appendix 3 - 3 -
Further Information
Further information on RSA Re’s business and performance is contained within Section A in the main body of the report.

| RSA Insurance Group plc | Solvency and Financial Condition Report 2016
Appendix 3 - 4 -
B. System of Governance
B.1 General information on the system of governance
The purpose of the Corporate Governance Framework is to specify how RSA Re meets its legislative and regulatory governance requirements, enabling effective and efficient decision making by the Board.
The Board is accountable to stakeholders for the creation and delivery of strong sustainable performance and the creation of long term shareholder value. The Board meets frequently and is responsible for organising and directing the affairs of the Company in a manner that will promote the success of the Company and is consistent with good corporate governance practice, ensuring that in carrying out its duties the Company and the Group meet legal and regulatory requirements. As a company registered in England and Wales, the Company must comply with the provisions of the Companies Act 2006.
The Board of Directors may exercise all the powers of the company subject to the Articles of Association, the Board’s Terms of Reference, relevant laws, and any directions as may be given by its shareholder, RSAI, in general meetings by shareholder resolution. The Directors of the Company are all senior employees of RSAI. In their capacity as Directors of RSA Re they have access to the services and advice of the Group Chief Legal Officer and Company Secretary, the Internal Audit Function, the Compliance Function, the Risk Function, and the Actuarial Function. In addition Directors may take independent professional advice at the expense of RSA Re in furtherance of their duties.
The Board’s Terms of Reference set out matters which are reserved for the Company’s Board and those matters which are above the delegated authority which must be referred to the shareholder for approval.
There is a standing agenda of items, the contents of which are continually refreshed. All decisions are documented by Group Secretariat. The Board reviews RSA Re’s financial performance through regular reports, including quarterly capital up-dates and a quarterly presentation on actual performance against plan and a previous financial year comparison. The Board’s Terms of Reference require approval of the outsourcing of the Key Governance Functions and critical functions and important activities at least annually, and the Board’s review of the performance of these outsourcing arrangements. The RSA Re Board reviews renewals of the internal reinsurance treaties at least annually.
Effectiveness of the Board
The Board has implemented an effectiveness review process which will be carried out on an annual basis to ensure that the Board is operating effectively.
Changes during 2016
There have been no major changes to RSA Re’s system of governance during 2016.
Key Governance Functions
All of the Key Governance Functions have been outsourced to RSAI. The Board’s Terms of Reference require the Key Governance Functions to be adequately resourced.
The Board’s Terms of Reference explicitly note the right of the Heads of the Key Governance Functions to have direct access to the Board at all times and for a private meeting with the Directors at least annually.
Remuneration
The Company has adopted the Group remuneration framework and aligns to general principles and standards set by the Group. These are contained in the Group Remuneration Policy (effective from 1 January 2016).

| RSA Insurance Group plc | Solvency and Financial Condition Report 2016
Appendix 3 - 5 -
RSA Re’s Directors receive no remuneration for their services as directors of this Company. They receive remuneration for their services to the Group as a whole.
B.2 Fit and proper requirements
The Group Fitness and Propriety Policy provides a single framework across the Group’s EEA operations for assessment of fitness and propriety of both new and on-going appointees in the Key Governance Functions, the Executive Management, and the Directors. RSAI, the service provider, applies the Group Fitness and Propriety Policy, which has been written to comply with the requirements of Solvency II.
See Section B.2 within the main body of the report for details of the Group fit and proper requirements.
B.3 Risk management system including the own risk and solvency assessment
RSA Re has outsourced its risk management system to RSAI, which has adopted the Group risk management system. See Section B.3 within the main body of the report for details of the Group’s Risk Management System.
B.4 Internal control system
RSA Re has outsourced its internal control system to RSAI, which has adopted the Group Internal Control System. See Section B.4 within the main body of the report for details of the Group’s internal control system.
B.5 Internal audit function
See Section B.5 within the main body of the report for details of the Group’s internal audit function.
This approach is applied to the plans for RSA Re. GIA provides both its audit plans and quarterly updates on progress against plans, the outcomes of its work and progress against issues to the RSA Re Board.
B.6 Actuarial function
RSA Re operates within the same risk appetite and operational control environments as RSAI. Much of the scope of the Actuarial Function is hence covered by RSAI and the Group’s Actuarial Function documentation.
See Section B.6 within the main body of the report for details of the Group’s actuarial function.
B.7 Outsourcing
RSA Re has no employees and has outsourced all of its operations to its immediate parent company, RSAI. RSAI provides all services to RSA Re, including the Key Governance Functions and activities deemed critical and important.
B.8 Any other information
Nothing to report.
| RSA Insurance Group plc | Solvency and Financial Condition Report 2016
Appendix 3 - 6 -
C. Risk Profile
RSA Re has outsourced its risk management system to RSAI, which has adopted the Group risk management system.
Material issues are escalated to the RSA Re Board by the Group and UK & International Risk Functions. The risks are a combination of the relevant Group risks and additional material risks specific to RSA Re (e.g. Global Network). In this way, the RSA Re Board is able to oversee and control the activities of its business.
The remainder of this Section outlines the key risks applicable to RSA Re’s business. Other risks, for example, investment risk, are managed by RSAI in its capacity as the service provider. For full risk profile details, see Section C in the main body of the report which sets out the Group’s risk profile and highlights where RSA Re solo information is different from that of the Group.
Credit Risk
RSA Re is exposed to credit risk in respect of other group companies and Global Network Partners. This risk is integrated within and managed together with the other principal risks of the Group.
RSA Re has a credit risk insurance policy with RSAI which is assessed annually and protects it against loss of reinsurance recoverables due to reinsurer insolvency.
Debtor credit risk is managed through tight credit control by the Central Accounting Unit of the Strategic Network Partners, with only 2.5% of accounts going beyond RSA Re’s standard 60 days payment terms.
Operational Risk
The Master Services Agreement mitigates most of the operational risks. However, RSA Re is exposed to regulatory risk in respect of changes in its operating environment (which it cannot mitigate) or breaches of regulation / failure to renew licences. The latter is controlled through a combination of Group Corporate Centre functions and procedures plus a centrally managed licensing register being held by the Network team. Licence renewal dates are diarised.

| RSA Insurance Group plc | Solvency and Financial Condition Report 2016
Appendix 3 - 7 -
D. Valuation for Solvency Purposes
Information on the valuation for solvency purposes is contained in Section D within the main body of the report, which separates out RSA Re solo information where appropriate.
E. Capital Management
Information on capital management, which is carried out at the Group level, is contained in Section E within the main body of the report.

| RSA Insurance Group plc | Solvency and Financial Condition Report 2016
Appendix 4 - 1 -
Summary
The principal activity of MIC is the writing of direct marine, aviation, transport and renewable energy insurance business in the United States.
With effect from 1 January 2012, MIC transferred all its insurance risk to RSAI under a quota share reinsurance agreement. Under this agreement, MIC receives a reinsurance commission which is determined by reference to written premium.
The Group SFCR meets the regulatory requirement for public disclosure in respect of RSAI, RSA Re and MIC. As mentioned in the introduction in the main body of the report, RSAI, RSA Re and MIC are legal entities meeting all regulatory and governance requirements and their individual risk profile and capital requirements are monitored to ensure ongoing regulatory compliance. However, the Group does not manage each entity as an individual business and does not set individual business strategies. In light of this, it is important for the reader to understand that the focus of the Group SFCR is the activities of the RSA Group as a whole.

| RSA Insurance Group plc | Solvency and Financial Condition Report 2016
Appendix 4 - 2 -
A. Business and Performance
MIC is the Group vehicle for the writing of specialty insurance business, including marine, transport and engineering and renewable energy United States surplus line risks. The Company is registered with the United States National Association of Insurance Commissioners as an eligible surplus lines alien insurer in the forty-nine States where such registration is required. The registration is renewed annually following authorisation by the MIC Board. The actual underwriting is done by London based personnel. In those States where certain classes of non-admitted business such as marine are exempt from the surplus lines regulations the business is written by RSAI. MIC is also subject to financial regulation and is authorised and supervised by the PRA and FCA. The main insurance regulation covering MIC is the PRA handbook, including the body of European law, regulation, and guidelines known as Solvency II, which became effective on 1 January 2016.
Having sold its interest in Global Aerospace Underwriting Managers Limited, RSA withdrew from the global Aerospace pool, effective from 31 December 2003. As part of this transaction, MIC agreed to provide fronting services to other Global Aerospace pool members. This arrangement ceased effective 31 December 2008 and so exposure relates only to business in run off.
With effect from 1 January 2012, MIC entered into an excess of loss agreement and a quota share arrangement with RSAI under which the insurance risk of MIC’s business is transferred to RSAI. The excess of loss reinsurance covers business written pre-2012, while the 100% quota share arrangement has applied to business written since the beginning of 2012. The risks arising from these arrangements are discussed below. MIC receives a commission of 36.5% in relation to the quota share arrangement which is determined by reference to the gross written premium of the business.
MIC has no direct employees; all services necessary for the above activity being provided by RSAI under a Master Services Agreement and an Internal Model Services Agreement.
Business Strategy
MIC has adopted the Group business strategy which is to be focused, stronger and better. This translates to:
• Focused – exploiting leadership positions, focusing on areas where the Group can compete and win
• Stronger – building a balanced, diversified and well capitalised business
• Better - building a business based on operational excellence and open and transparent communication
Further Information
Further information on MIC’s business and performance is contained within Section A in the main body of the report.

| RSA Insurance Group plc | Solvency and Financial Condition Report 2016
Appendix 4 - 3 -
B. System of Governance
B.1 General information on the system of governance
The purpose of the Corporate Governance Framework is to specify how MIC meets its legislative and regulatory governance requirements, enabling effective and efficient decision making by the Board.
The Board is accountable to stakeholders for the creation and delivery of strong sustainable performance and the creation of long term shareholder value. The Board meets frequently and is responsible for organising and directing the affairs of the Company in a manner that will promote the success of the Company and is consistent with good corporate governance practice, ensuring that in carrying out its duties the Company and the Group meet legal and regulatory requirements. As a company registered in England and Wales, the Company must comply with the provisions of the Companies Act 2006.
The Board of Directors may exercise all the powers of the company subject to the Articles of Association, the Board’s Terms of Reference, relevant laws, and any directions as may be given by its shareholder, RSAI, in general meetings by shareholder resolution. The Directors of the Company are all senior employees of RSAI. In their capacity as Directors of MIC they have access to the services and advice of the Group Chief Legal Officer and Company Secretary, the Internal Audit Function, the Compliance Function, the Risk Function, and the Actuarial Function. In addition Directors may take independent professional advice at the expense of MIC in furtherance of their duties.
The Board’s Terms of Reference set out matters which are reserved for the Company’s Board and those matters which are above the delegated authority which must be referred to the shareholder for approval.
There is a standing agenda of items, the contents of which are continually refreshed. All decisions are documented by Group Secretariat. The Board reviews MIC’s financial performance through regular reports, including quarterly capital updates and a quarterly presentation on actual performance against plan and a previous financial year comparison. The Board’s Terms of Reference require approval of the outsourcing of the Key Governance Functions and critical functions and important activities at least annually, and the Board’s review of the performance of these outsourcing arrangements.
Effectiveness of the Board
The Board has implemented an effectiveness review process which is undertaken annually to ensure that the Board is operating effectively.
Changes in the Last Twelve Months
There have been no major changes to MIC’s System of Governance in the last twelve months.
Key Governance Functions
All of the Key Governance Functions have been outsourced to RSAI. The Board’s Terms of Reference require the Key Governance Functions to be adequately resourced.
The Board’s Terms of Reference explicitly note the right of the Heads of the Key Governance Functions to have direct access to the Board at all times and for a private meeting with the Directors at least annually.
Remuneration
The Company has adopted the Group remuneration framework and aligns to general principles and standards set by the Group. These are contained in the Group Remuneration Policy (effective from 1 January 2016).
MIC’s Directors receive no remuneration for their services as directors of this Company. They receive remuneration for their services to the Group as a whole.

| RSA Insurance Group plc | Solvency and Financial Condition Report 2016
Appendix 4 - 4 -
B.2 Fit and proper requirements
The Group Fitness and Propriety Policy provides a single framework across the Group’s EEA operations for assessment of fitness and propriety of both new and on-going appointees in the Key Governance Functions, the Executive Management, and the Directors. RSAI, the service provider, applies the Group Fitness and Propriety Policy, which has been written to comply with the requirements of Solvency II.
See Section B.2 within the main body of the report for details of the Group’s fit and proper requirements.
B.3 Risk management system including the own risk and solvency assessment
MIC has outsourced its risk management system to RSAI, which has adopted the Group risk management system. See Section B.3 within the main body of the report for details of the Group’s Risk Management System.
B.4 Internal control system
MIC has outsourced its internal control system to RSAI, which has adopted the Group Internal Control System. See Section B.4 within the main body of the report for details of the Group’s internal control system.
B.5 Internal audit function
See Section B.5 within the main body of the report for details of the Group’s internal audit function.
This approach is applied to the plans for MIC. GIA provides both its audit plans and quarterly updates on progress against plans, the outcomes of its work and progress against issues to the MIC Board.
B.6 Actuarial function
MIC operates within the same risk appetite and operational control environments as RSAI. Much of the scope of the Actuarial Function is hence covered by RSAI and the Group Actuarial Function documentation.
See Section B.6 within the main body of the report for details of the Group’s actuarial function.
B.7 Outsourcing
MIC has no employees and has outsourced all of its operations to its immediate parent company, RSAI. RSAI provides all services to MIC, including the Key Governance Functions and activities deemed critical and important.
B.8 Any other information
Nothing to report.

| RSA Insurance Group plc | Solvency and Financial Condition Report 2016
Appendix 4 - 5 -
C. Risk Profile
MIC has outsourced its risk management system to RSAI, which has adopted the Group risk management system.
Material issues are escalated to the MIC Board by the Group Corporate Centre and UK & International Risk Committees. This information is a combination of data from the UK risk profile and more granular Commercial and Marine risk profiles. The risks are a combination of the relevant Group risks and additional material risks specific to MIC. In this way, the MIC Board is able to oversee and control the activities of its business.
The remainder of this Section outlines the key risks applicable to MIC’s business. Other risks, for example, investment risk, are managed by RSAI in its capacity as the service provider. For full risk profile details, see Section C in the main body of the report, which sets out the Group’s risk profile and highlights where MIC solo information is different from that of the Group.
Underwriting Risk
The principal underwriting risks relate to inadequate pricing; insufficient reserves, and larger than expected claims are mitigated by the 100% quota share agreement with respect to business written after 1 January 2012, and the excess of loss reinsurance with respect to pre-2012 business which transfers the crystallisation risk onto RSAI. This gives rise to a credit risk in respect of RSAI, as discussed below.
The excess of loss policy covers all direct expenses and costs relating to a claim net of any recoveries. It continues in effect until all liabilities in relation to polices written to incepted prior to 1 January 2012 are extinguished. However MIC can terminate the excess of loss reinsurance in the event that RSAI’s credit rating falls below an A-rating. As all underwriting risk is reinsured back to RSAI under the aggregate excess of loss reinsurance and quota share agreement, and operational loss is negated by the outsourcing contract, the greatest potential for a material loss is the crystallisation of the credit risk exposure to RSAI.
Credit Risk
The principal risk to MIC is its credit risk exposure to RSAI, and in the event of the failure of RSAI, the negation of the reinsurance protection and ceded insurance. The risk of the excess of loss policy is mitigated by MIC holding the premium for the reinsurance policy in a funds withheld account and netting off sums owed by RSAI under the excess of loss policy against it. The Board pays close attention to the creditworthiness of RSAI and has the option not to extend the quota share agreement.
Operational Risk
The Master Services Agreement combined with the quota share arrangement and excess of loss reinsurance mitigate most of the operational risks. However, MIC is exposed to regulatory risk in respect of changes in its operating environment (which it cannot mitigate) or breaches of regulation / failure to renew licences. The latter is controlled through a combination of Group Corporate Centre functions. The risk of failing to maintain sufficient regulatory capital or meet United States trust fund requirements is controlled through careful monitoring and reporting to the MIC Board.

| RSA Insurance Group plc | Solvency and Financial Condition Report 2016
Appendix 4 - 6 -
D. Valuation for Solvency Purposes
Information on the valuation for solvency purposes is contained in Section D within the main body of the report, which separates out MIC solo information where appropriate.
E. Capital Management
Information on capital management, which is carried out at the Group level, is contained in Section E within the main body of the report.

| RSA Insurance Group plc | Solvency and Financial Condition Report 2016
Appendix 5 - 1 -
RSA Insurance Group plc
The directors are responsible for ensuring that the Group SFCR has been properly prepared in all material respects in accordance with the PRA Rules and the Solvency II Regulations.
The directors are satisfied that:
• throughout the financial year in question, the Group has complied in all material respects with the requirements of thePRA Rules and the Solvency II Regulations as applicable at the level of the Group; and
• it is reasonable to believe that the Group has continued so to comply subsequently and will continue so to comply infuture.
By order of the Board,
Scott Egan
Group Chief Financial Officer
Royal & Sun Alliance Insurance plc, Royal & Sun Alliance Reinsurance Limited and The Marine Insurance Company Limited
The directors are responsible for ensuring that the relevant content of the SFCR has been properly prepared in all material respects in accordance with the PRA Rules and the Solvency II Regulations.
The directors are satisfied that:
• throughout the financial year in question, the insurers have complied in all material respects with the requirements ofthe PRA Rules and the Solvency II Regulations as to the insurer; and
• it is reasonable to believe that the insurers have continued so to comply subsequently and will continue so to complyin future.
By order of the Board,
Scott Egan
Director

| RSA Insurance Group plc | Solvency and Financial Condition Report 2016
Appendix 6 - 1 -
Report of the external independent auditor to the Directors of RSA Insurance Group plc (‘the Group’), Royal & Sun Alliance Insurance plc (“RSAI”), Royal & Sun Alliance Reinsurance Limited (“RSA Re”) and The Marine Insurance Company Limited (“MIC”) pursuant to Rule 4.1 (2) of the External Audit Chapter of the PRA Rulebook applicable to Solvency II firms
Except as stated below, we have audited the following documents prepared by the Group, RSAI, RSA Re and MIC as at 31 December 2016:
• The ‘Valuation for solvency purposes’ and ‘Capital Management’ sections of the Solvency and Financial ConditionReport as at 31 December 2016 (‘the Narrative Disclosures subject to audit’); and
• Group templates S.02.01.02, S.23.01.22, S.32.01.22 for the Group and Solo templates S.02.01.02, S.12.01.02,S.17.01.02, S.23.01.01, S.28.01.01 for RSAI, RSA Re and MIC (‘the Templates subject to audit’).
The Narrative Disclosures subject to audit and the Templates subject to audit are collectively referred to as the ‘Relevant Elements of the Solvency and Financial Condition Report’.
We are not required to audit, nor have we audited, and as a consequence do not express an opinion on the Other Information which comprises:
• information contained within the Relevant Elements of the Solvency and Financial Condition Report set out aboutabove which are, or derive from the Solvency Capital Requirement, as identified in the Annex to this audit report;
• The ‘Business and performance’, ‘System of governance’ and ‘Risk profile’ sections of the Solvency and FinancialCondition Report;
• information relating to 31 December 2015 voluntarily disclosed by the Group in the ‘Valuation for solvency purposes’and ‘Capital management’ sections of the Solvency and Financial Condition Report;
• Group templates S.05.01.02, S.05.02.01, S.25.02.22, S.25.03.22
• Company templates S.05.01.02, S.05.02.01, S.17.01.02 S.19.01.21, S.25.01.21, S.25.02.21, S.25.03.21,S.28.02.01for RSAI, RSA Re and MIC;
• the written acknowledgement by the Directors of their responsibilities, including for the preparation of the Solvencyand Financial Condition Report (‘the Responsibility Statement’);
• Information which pertains to an undertaking that is not a Solvency II undertaking and has been prepared inaccordance with PRA rules other than those implementing the Solvency II Directive or in accordance with an EUinstrument other than the Solvency II regulations (‘the sectoral information’).
To the extent the information subject to audit in the Relevant Elements of the Solvency and Financial Condition Report includes amounts that are totals, sub-totals or calculations derived from the Other Information, we have relied without verification on the Other Information.

| RSA Insurance Group plc | Solvency and Financial Condition Report 2016
Appendix 6 - 2 -
Respective responsibilities of directors and auditor
As explained more fully in the Responsibility Statement, the Directors are responsible for the preparation of the Solvency and Financial Condition Report in accordance with the financial reporting provisions of the PRA rules and Solvency II regulations, as modified by the Solvency II approval dated 5 December 2015 issued under the Solvency II Regulations 2015 and Solvency II waivers dated 20 April 2016 issued under Section 138A of the Financial Services and Markets Act 2000.
The Directors are also responsible for such internal control as they determine is necessary to enable the preparation of a Solvency and Financial Condition Report that is free from material misstatement, whether due to fraud or error.
Our responsibility is to audit, and express an opinion on, the Relevant Elements of the Solvency and Financial Condition Report in accordance with applicable law and International Standards on Auditing (UK and Ireland) together with ISA (UK) 800 and ISA (UK) 805. Those standards require us to comply with the Auditing Practices Board’s Ethical Standards for Auditors.
Scope of the audit of the Relevant Elements of the Solvency and Financial Condition Report
A description of the scope of an audit is provided on the Financial Reporting Council’s website at www.frc.org.uk/auditscopeukprivate.
Opinion on the Relevant Elements of the Solvency and Financial Condition Report
In our opinion, the information subject to audit in the Relevant Elements of the Solvency and Financial Condition Report of the Group, RSAI, RSA Re and MIC as at 31st December 2016 is prepared, in all material respects, in accordance with the financial reporting provisions of the PRA Rules and Solvency II regulations on which they are based, as modified by relevant supervisory modifications, and as supplemented by supervisory approvals and determinations.
Emphasis of Matter - Basis of Accounting
We draw attention to the ‘Valuation for solvency purposes’ and ‘Capital Management’ sections of the Solvency and Financial Condition Report, which describe the basis of accounting. The Solvency and Financial Condition Report is prepared in compliance with the financial reporting provisions of the PRA Rules and Solvency II regulations, and therefore in accordance with a special purpose financial reporting framework. The Solvency and Financial Condition Report is required to be published, and intended users include but are not limited to the Prudential Regulation Authority. As a result, the Solvency and Financial Condition Report may not be suitable for another purpose. Our opinion is not modified in respect of this matter.
Other Matter
The Group, RSAI, RSA Re and MIC have authority to calculate the Group and Solo Solvency Capital Requirements using an internal model ("the Model") approved by the Prudential Regulation Authority in accordance with the Solvency II Regulations. In forming our opinion (and in accordance with PRA Rules), we are not required to audit the inputs to, design of, operating effectiveness of and outputs from the Model, or whether the Model is being applied in accordance with the application or approval order obtained by RSAI, RSA Re and MIC.
Opinion on other matter prescribed by the PRA Rulebook
In our opinion, in accordance with Rule 4.2 of the External Audit Chapter of the PRA Rulebook, the sectoral information has been properly compiled in accordance with the PRA rules and EU instruments relating to that undertaking from information provided by members of the group and the relevant insurance group undertaking.

| RSA Insurance Group plc | Solvency and Financial Condition Report 2016
Appendix 6 - 3 -
Matters on which we are required to report by exception
In accordance with Rule 4.1 (3) of the External Audit Chapter of the PRA Rulebook for Solvency II firms we are also required to consider whether the Other Information is materially inconsistent with our knowledge obtained in the audit of the Group, RSAI, RSA Re and MIC statutory financial statements. If, based on the work we have performed, we conclude that there is a material misstatement of this other information, we are required to report that fact.
We have nothing to report in this regard.
The purpose of our audit work and to whom we owe our responsibilities
This report of the external auditor is made solely to the directors of the Group, RSAI, RSA Re and MIC, as their governing bodies, in accordance with the requirement in Rule 4.1(2) of the External Audit Part of the PRA Rulebook and the terms of our engagement. We acknowledge that the directors are required to submit the report to the PRA, to enable the PRA to verify that an auditor’s report has been commissioned by the directors and issued in accordance with the requirement set out in Rule 4.1(2) of the External Audit Part of the PRA Rulebook and to facilitate the discharge by the PRA of its regulatory functions in respect of the company, conferred on the PRA by or under the Financial Services and Markets Act 2000.
Our audit has been undertaken so that we might state to the directors those matters we are required to state to them in an auditor’s report issued pursuant to Rule 4.1(2) and for no other purpose. To the fullest extent permitted by law, we do not accept or assume responsibility to anyone other than the Group, RSAI, RSA Re and MIC through their governing bodies, for our audit, for this report, or for the opinions we have formed.
KPMG LLPChartered Accountants15 Canada Square London E14 5GL 24 May 2017
The maintenance and integrity of the Group's websites is the responsibility of the directors; the work carried out by the auditors does not involve consideration of these matters and, accordingly, the auditors accept no responsibility for any changes that may have occurred to the Solvency and Financial Condition Report since it was initially presented on the website.
Legislation in the United Kingdom governing the preparation and dissemination of Solvency and Financial Condition Reports may differ from legislation in other jurisdictions.

| RSA Insurance Group plc | Solvency and Financial Condition Report 2016
Appendix 6 - 4 -
Annex – relevant elements of the Group SFCR that are not subject to audit
The relevant elements of the Group Solvency and Financial Condition Report that are not subject to audit comprise:
• The following elements of Group template S.02.01.02- Row R0550: Technical provisions - non-life (excluding health) - risk margin- Row R0590: Technical provisions - health (similar to non-life) - risk margin- Row R0640: Technical provisions - health (similar to life) - risk margin- Row R0680: Technical provisions - life (excluding health and index-linked and unit-linked) - risk margin- Row R0720: Technical provisions - Index-linked and unit-linked - risk margin
• The following elements of Group template S.23.01.22- Row R0020: Non-available called but not paid in ordinary share capital at group level- Row R0060: Non-available subordinated mutual member accounts at group level- Row R0080: Non-available surplus at group level- Row R0100: Non-available preference shares at group level- Row R0120: Non-available share premium account related to preference shares at group level- Row R0150: Non-available subordinated liabilities at group level- Row R0170: The amount equal to the value of net deferred tax assets not available at the group level- Row R0190: Non-available own funds related to other own funds items approved by supervisory authority- Row R0210: Non-available minority interests at group level- Row R0380: Non-available ancillary own funds at group level- Rows R0410 to R0440 – Own funds of other financial sectors- Row R0680: Group SCR- Row R0740: Adjustment for restricted own fund items in respect of matching adjustment portfolios and ring fenced
funds - Row R0750: Other non available own funds
• The following elements of template S.02.01.02 for RSAI, RSA Re and MIC- Row R0550: Technical provisions - non-life (excluding health) - risk margin- Row R0590: Technical provisions - health (similar to non-life) - risk margin- Row R0640: Technical provisions - health (similar to life) - risk margin- Row R0680: Technical provisions - life (excluding health and index-linked and unit-linked) - risk margin- Row R0720: Technical provisions - Index-linked and unit-linked - risk margin
• The following elements of template S.12.01.02 for RSAI- Row R0100: Technical provisions calculated as a sum of BE and RM - Risk margin- Rows R0110 to R0130 – Amount of transitional measure on technical provisions
• The following elements of template S.17.01.02 for RSAI, RSA Re and MIC- Row R0280: Technical provisions calculated as a sum of BE and RM - Risk margin- Rows R0290 to R0310 – Amount of transitional measure on technical provisions
• The following elements of template S.23.01.01 for RSAI, RSA Re and MIC- Row R0580: SCR- Row R0740: Adjustment for restricted own fund items in respect of matching adjustment portfolios and ring fenced
funds
• The following elements of template S.28.02.01 for RSAI, RSA Re and MIC- Row R0310: SCR
• Elements of the Narrative Disclosures related to SCR in sections D&E are not subject to audit as highlighted at thebeginning of those sections.

| RSA Insurance Group plc | Solvency and Financial Condition Report 2016
Appendix 7 - 1 -
Abbreviation Description
BRC Board Risk Committee
COR Combined Operating Ratio
EEA European Economic Area
EIOPA European Insurance and Occupational Pensions Authority
ENIDs Events Not In Data
EU European Union
FCA Financial Conduct Authority
FRS Financial Reporting Standard
GIA Group Internal Audit
IAS International Accounting Standards
IFRS International Financial Reporting Standards
LIBOR London InterBank Offered Rate
MCR Minimum Capital Requirement
MSCR Minimum consolidated group Solvency Capital Requirement
ORSA Own Risk and Solvency Assessment
PRA Prudential Regulation Authority
QRT Quantitative Reporting Template
SCR Solvency Capital Requirement
SFCR Solvency and Financial Condition Report
SII Solvency II
SLT Similar to Life Techniques
UK GAAP United Kingdom Generally Accepted Accounting Practice
The terms financial statement, statement of financial position, income statement, profit and loss account and other comprehensive income used in this report refer to information presented in the Annual Reports and Accounts for the Group, RSAI, RSA Re and MIC. This has been prepared according to IFRS accounting standards for the Group and UK GAAP accounting standards for RSAI, RSA Re and MIC. Refer to the relevant Annual Report and Accounts for details.

| RSA Insurance Group plc | Solvency and Financial Condition Report 2016
Appendix 8 - 1 -
This Appendix contains the following QRTs:
Entity QRT Reference QRT Name
Group S.02.01.02 Group Balance sheet Group S.05.01.02 Group Premiums, claims and expenses by line of business Group S.05.02.01 Group Premiums, claims & expenses by country Group S.23.01.22 Group Own funds Group S.25.03.22 Solvency Capital Requirement - for groups on Full Internal Models Group S.32.01.22 Undertakings in the scope of the group RSAI S.02.01.02 Balance sheet RSAI S.05.01.02 Premiums, claims and expenses by line of business RSAI S.05.02.01 Premiums, claims & expenses by country RSAI S.12.01.02 Life and Health SLT Technical Provisions RSAI S.17.01.02 Non-life Technical Provisions RSAI S.19.01.21 Non-life Insurance Claims Information RSAI S.23.01.01 Own funds RSAI S.25.03.21 Solvency Capital Requirement - for undertakings on Full Internal Models RSAI S.28.01.01 Minimum Capital Requirement - Only life or only non-life insurance or reinsurance activity RSA Re S.02.01.02 Balance sheet RSA Re S.05.01.02 Premiums, claims and expenses by line of business RSA Re S.05.02.01 Premiums, claims & expenses by country RSA Re S.17.01.02 Non-life Technical Provisions RSA Re S.19.01.21 Non-life Insurance Claims Information RSA Re S.23.01.01 Own funds RSA Re S.25.03.21 Solvency Capital Requirement - for undertakings on Full Internal Models RSA Re S.28.01.01 Minimum Capital Requirement - Only life or only non-life insurance or reinsurance activity MIC S.02.01.02 Balance sheet MIC S.05.01.02 Premiums, claims and expenses by line of business MIC S.05.02.01 Premiums, claims & expenses by country MIC S.17.01.02 Non-life Technical Provisions MIC S.19.01.21 Non-life Insurance Claims Information MIC S.23.01.01 Own funds MIC S.25.03.21 Solvency Capital Requirement - for undertakings on Full Internal Models MIC S.28.01.01 Minimum Capital Requirement - Only life or only non-life insurance or reinsurance activity
There is nothing to report for the Group for QRT S.22.01.22 (Impact of long term guarantees and transitional measures).
There is nothing to report for RSAI, RSA Re or MIC for QRT S.22.01.21 (Impact of long term guarantees and transitional measures) .
There is nothing to report for RSA Re or MIC for QRT S.12.01.02 (Life and Health SLT Technical Provisions).
All monetary amounts are shown in thousands of pounds (£000’s) in all QRTs.

| RSA Insurance Group plc | Solvency and Financial Condition Report 2016
Appendix 8 - 2 -
RSA Insurance Group plcS.02.01.02Balance sheet
Solvency II value
Solvency II value
Assets C0010 Liabilities C0010£'000 £'000
Intangible assets R0030 - Technical provisions – non-life R0510 11,522,581Deferred tax assets R0040 278,030 Technical provisions – non-life (excluding health) R0520 10,080,332Pension benefit surplus R0050 69,868 TP calculated as a whole R0530 -Property, plant & equipment held for own use R0060 34,346 Best Estimate R0540 9,531,673Investments (other than assets held for index-linked and unit-linked contracts) R0070 14,125,313 Risk margin R0550 548,659
Property (other than for own use) R0080 333,354 Technical provisions - health (similar to non-life) R0560 1,442,249Holdings in related undertakings, including participations R0090 87,994 TP calculated as a whole R0570 -Equities R0100 329,546 Best Estimate R0580 1,354,118
Equities - listed R0110 323,121 Risk margin R0590 88,131Equities - unlisted R0120 6,425 Technical provisions - life (excluding index-linked and unit-linked) R0600 966,779
Bonds R0130 11,976,252 Technical provisions - health (similar to life) R0610 212,947Government Bonds R0140 4,416,018 TP calculated as a whole R0620 -Corporate Bonds R0150 6,780,143 Best Estimate R0630 200,511Structured notes R0160 - Risk margin R0640 12,436Collateralised securities R0170 780,091 Technical provisions – life (excluding health and index-linked and unit-linked) R0650 753,832
Collective Investments Undertakings R0180 893,663 TP calculated as a whole R0660 -Derivatives R0190 55,668 Best Estimate R0670 674,962Deposits other than cash equivalents R0200 448,836 Risk margin R0680 78,870Other investments R0210 - Technical provisions – index-linked and unit-linked R0690 -
Assets held for index-linked and unit-linked contracts R0220 - TP calculated as a whole R0700 -Loans and mortgages R0230 137,982 Best Estimate R0710 -
Loans on policies R0240 - Risk margin R0720 - Loans and mortgages to individuals R0250 2,998 Contingent liabilities R0740 1,880 Other loans and mortgages R0260 134,984 Provisions other than technical provisions R0750 98,088Reinsurance recoverables from: R0270 1,511,721 Pension benefit obligations R0760 289,208
Non-life and health similar to non-life R0280 1,435,109 Deposits from reinsurers R0770 67,292Non-life excluding health R0290 1,412,247 Deferred tax liabilities R0780 16,629Health similar to non-life R0300 22,862 Derivatives R0790 166,996
Life and health similar to life, excluding health and index-linked and unit-linked R0310 76,612 Debts owed to credit institutions R0800 249,193Health similar to life R0320 - Financial liabilities other than debts owed to credit institutions R0810 -Life excluding health and index-linked and unit-linked R0330 76,612 Insurance & intermediaries payables R0820 148,758
Life index-linked and unit-linked R0340 - Reinsurance payables R0830 161,356Deposits to cedants R0350 464 Payables (trade, not insurance) R0840 248,626Insurance and intermediaries receivables R0360 1,238,288 Subordinated liabilities R0850 1,137,129Reinsurance receivables R0370 98,261 Subordinated liabilities not in BOF R0860 8,332Receivables (trade, not insurance) R0380 94,242 Subordinated liabilities in BOF R0870 1,128,797Own shares (held directly) R0390 507 Any other liabilities, not elsewhere shown R0880 539,645Amounts due in respect of own fund items or initial fund called up but not yet paid in R0400 - Total liabilities R0900 15,614,160Cash and cash equivalents R0410 426,283 Excess of assets over liabilities R1000 2,462,871Any other assets, not elsewhere shown R0420 61,726Total assets R0500 18,077,031

| RSA Insurance Group plc | Solvency and Financial Condition Report 2016
Appendix 8 - 3 -
RSA Insurance Group plcS.05.01.02Premiums, claims and expenses by line of business
Medical expense
insurance
Income protection insurance
Workers' compensation
insurance
Motor vehicle liability
insurance
Other motor insurance
Marine, aviation and transport insurance
Fire and other damage to property insurance
General liability insurance
Credit and suretyship insurance
C0010 C0020 C0030 C0040 C0050 C0060 C0070 C0080 C0090
£'000 £'000 £'000 £'000 £'000 £'000 £'000 £'000 £'000Premiums written Gross - Direct Business R0110 445,783 320,844 64,760 1,428,134 932,322 401,161 2,918,875 602,987 2,986 Gross - Proportional reinsurance accepted R0120 - - - 172 74 63,250 122,234 22,699 - Gross - Non-proportional reinsurance accepted R0130 Reinsurers' share R0140 14,069 998 42 359,747 109,039 73,425 437,770 58,469 884 Net R0200 431,714 319,846 64,718 1,068,559 823,357 390,986 2,603,339 567,217 2,102Premiums earned Gross - Direct Business R0210 449,457 318,370 65,102 1,441,099 927,376 465,252 3,018,066 595,656 3,262 Gross - Proportional reinsurance accepted R0220 - 6 - 157 58 34,603 129,203 23,162 - Gross - Non-proportional reinsurance accepted R0230 Reinsurers' share R0240 20,574 1,495 62 340,041 97,774 79,960 470,506 71,721 973 Net R0300 428,883 316,881 65,040 1,101,215 829,660 419,895 2,676,763 547,097 2,289Claims incurred Gross - Direct Business R0310 270,692 224,163 44,108 923,910 591,173 293,963 1,792,406 322,896 (132) Gross - Proportional reinsurance accepted R0320 - - - (35) (20) 33,001 88,335 (23,275) - Gross - Non-proportional reinsurance accepted R0330 Reinsurers' share R0340 15,653 16 163 229,165 91,326 95,774 484,173 (128) (79) Net R0400 255,039 224,147 43,945 694,710 499,827 231,190 1,396,568 299,749 (53)Changes in other technical provisions Gross - Direct Business R0410 - - - - - - - - - Gross - Proportional reinsurance accepted R0420 - - - - - - - - - Gross - Non- proportional reinsurance accepted R0430 Reinsurers'share R0440 - - - - - - - - - Net R0500 - - - - - - - - -Expenses incurred R0550 165,468 72,244 17,439 405,942 294,060 154,127 1,153,078 254,397 708Other expenses R1200Total expenses R1300
Line of Business for: non-life insurance and reinsurance obligations (direct business and accepted proportional reinsurance)

| RSA Insurance Group plc | Solvency and Financial Condition Report 2016
Appendix 8 - 4 -
RSA Insurance Group plcS.05.01.02Premiums, claims and expenses by line of business
Legal expenses insurance
Assistance Miscellaneous financial loss Health Casualty Marine, aviation,
transport Property
C0100 C0110 C0120 C0130 C0140 C0150 C0160 C0200
£'000 £'000 £'000 £'000 £'000 £'000 £'000 £'000Premiums written Gross - Direct Business R0110 8,358 48,178 83,894 7,258,282 Gross - Proportional reinsurance accepted R0120 - - 5 208,434 Gross - Non-proportional reinsurance accepted R0130 14 - (243) (9,402) (9,631) Reinsurers' share R0140 - 81 13,175 - - 324 (32) 1,067,991 Net R0200 8,358 48,097 70,724 14 - (567) (9,370) 6,389,094Premiums earned Gross - Direct Business R0210 8,368 46,904 85,864 7,424,776 Gross - Proportional reinsurance accepted R0220 - - 8 187,197 Gross - Non-proportional reinsurance accepted R0230 15 - (247) (6,406) (6,638) Reinsurers' share R0240 - 99 13,429 - - 301 (1,040) 1,095,895 Net R0300 8,368 46,805 72,443 15 - (548) (5,366) 6,509,440Claims incurred Gross - Direct Business R0310 2,491 29,056 37,906 4,532,632 Gross - Proportional reinsurance accepted R0320 - - (5) 98,001 Gross - Non-proportional reinsurance accepted R0330 19 7,687 (123) (602) 6,981 Reinsurers' share R0340 - 9 6,844 (90) 201 95 (3,003) 920,119 Net R0400 2,491 29,047 31,057 109 7,486 (218) 2,401 3,717,495Changes in other technical provisions Gross - Direct Business R0410 - - - - Gross - Proportional reinsurance accepted R0420 - - - - Gross - Non- proportional reinsurance accepted R0430 - - - - - Reinsurers'share R0440 - - - - - - - - Net R0500 - - - - - - - -Expenses incurred R0550 662 18,707 28,934 - 18 (13) 322 2,566,093Other expenses R1200 240,310Total expenses R1300 2,806,403
Line of Business for: non-life insurance and reinsurance obligations (direct business and accepted proportional
reinsurance)
Line of business for:accepted non-proportional reinsurance
Total

| RSA Insurance Group plc | Solvency and Financial Condition Report 2016
Appendix 8 - 5 -
RSA Insurance Group plcS.05.01.02Premiums, claims and expenses by line of business
Total
Health insurance
Insurance with profit
participation
Index-linked and unit-
linked insurance
Other life insurance
Annuities stemming from
non-life insurance
contracts and relating to health
insurance obligations
Annuities stemming from non-life
insurance contracts and relating to
insurance obligations other than health
insurance obligations
Health reinsurance Life reinsurance
C0210 C0220 C0230 C0240 C0250 C0260 C0270 C0280 C0300£'000 £'000 £'000 £'000 £'000 £'000 £'000 £'000 £'000
Premiums written Gross R1410 - - - 18,915 - - - - 18,915 Reinsurers' share R1420 - - - 9 - - - - 9 Net R1500 - - - 18,906 - - - - 18,906Premiums earned Gross R1510 - - - 18,575 - - - - 18,575 Reinsurers' share R1520 - - - 15 - - - - 15 Net R1600 - - - 18,560 - - - - 18,560Claims incurred Gross R1610 - - - 10,603 4,089 31,295 - - 45,987 Reinsurers' share R1620 - - - (5) - 8,466 - - 8,461 Net R1700 - - - 10,608 4,089 22,829 - - 37,526Changes in other technical provisions Gross R1710 - - - - - - - - - Reinsurers' share R1720 - - - - - - - - - Net R1800 - - - - - - - - -Expenses incurred R1900 - - - 3,973 (11) 53 - - 4,015Other expenses R2500 19,763Total expenses R2600 23,778
Line of Business for: life insurance obligations Life reinsurance obligations

| RSA Insurance Group plc | Solvency and Financial Condition Report 2016
Appendix 8 - 6 -
RSA Insurance Group plcS.05.02.01Premiums, claims and expenses by country
Home Country
Total Top 5 and home country
C0010 C0020 C0030 C0040 C0050 C0060 C0070R0010 CA SE DK IE AE
C0080 C0090 C0100 C0110 C0120 C0130 C0140£'000 £'000 £'000 £'000 £'000 £'000 £'000
Premiums written Gross - Direct Business R0110 2,818,983 1,543,793 986,936 573,304 291,125 178,105 6,392,246 Gross - Proportional reinsurance accepted R0120 26,478 93 (284) (324) - 1,307 27,270 Gross - Non-proportional reinsurance accepted R0130 - - - - - - - Reinsurers' share R0140 587,168 122,404 13,155 25,905 20,993 56,761 826,386 Net R0200 2,258,293 1,421,482 973,497 547,075 270,132 122,651 5,593,130Premiums earned Gross - Direct Business R0210 2,921,178 1,551,074 976,280 579,543 289,919 195,805 6,513,798 Gross - Proportional reinsurance accepted R0220 2,411 99 (663) 431 - 1,364 3,642 Gross - Non-proportional reinsurance accepted R0230 - - 154 - - - 154 Reinsurers' share R0240 585,181 128,838 19,850 29,254 22,886 82,365 868,373 Net R0300 2,338,408 1,422,335 955,921 550,720 267,033 114,804 5,649,221Claims incurred Gross - Direct Business R0310 1,724,762 930,919 594,260 350,666 218,354 112,670 3,931,631 Gross - Proportional reinsurance accepted R0320 (24,152) 756 - (8,329) - 725 (31,000) Gross - Non-proportional reinsurance accepted R0330 (672) 6,697 (6,806) 1,117 344 - 680 Reinsurers' share R0340 402,553 176,108 (5,563) 15,495 (15,343) 51,912 625,162 Net R0400 1,297,385 762,264 593,017 327,959 234,041 61,483 3,276,149Changes in other technical provisions Gross - Direct Business R0410 - - - - - - - Gross - Proportional reinsurance accepted R0420 - - - - - - - Gross - Non- proportional reinsurance accepted R0430 - - - - - - - Reinsurers'share R0440 - - - - - - - Net R0500 - - - - - - -Expenses incurred R0550 1,088,070 637,215 225,857 185,195 100,345 49,542 2,286,224Other expenses R1200 241,473Total expenses R1300 2,527,697
Top 5 countries (by amount of gross premiums written) - non-life obligations

| RSA Insurance Group plc | Solvency and Financial Condition Report 2016
Appendix 8 - 7 -
RSA Insurance Group plcS.05.02.01Premiums, claims and expenses by country
Home Country
Total Top 5 and home country
C0150 C0160 C0170 C0180 C0190 C0200 C0210R1400 CA SE DK IE AE
C0220 C0230 C0240 C0250 C0260 C0270 C0280£'000 £'000 £'000 £'000 £'000 £'000 £'000
Premiums written Gross R1410 - - 13,656 (14) - - 13,642 Reinsurers' share R1420 - - 9 - - - 9 Net R1500 - - 13,647 (14) - - 13,633Premiums earned Gross R1510 - - 12,951 (9) - - 12,942 Reinsurers' share R1520 - - 15 - - - 15 Net R1600 - - 12,936 (9) - - 12,927Claims incurred Gross R1610 33,660 - 3,557 4,147 - - 41,364 Reinsurers' share R1620 6,799 - - - - - 6,799 Net R1700 26,861 - 3,557 4,147 - - 34,565Changes in other technical provisions Gross R1710 - - - - - - - Reinsurers' share R1720 - - - - - - - Net R1800 - - - - - - -Expenses incurred R1900 - - 2,559 9 - - 2,568Other expenses R2500 19,384Total expenses R2600 21,952
Top 5 countries (by amount of gross premiums written) - life obligations
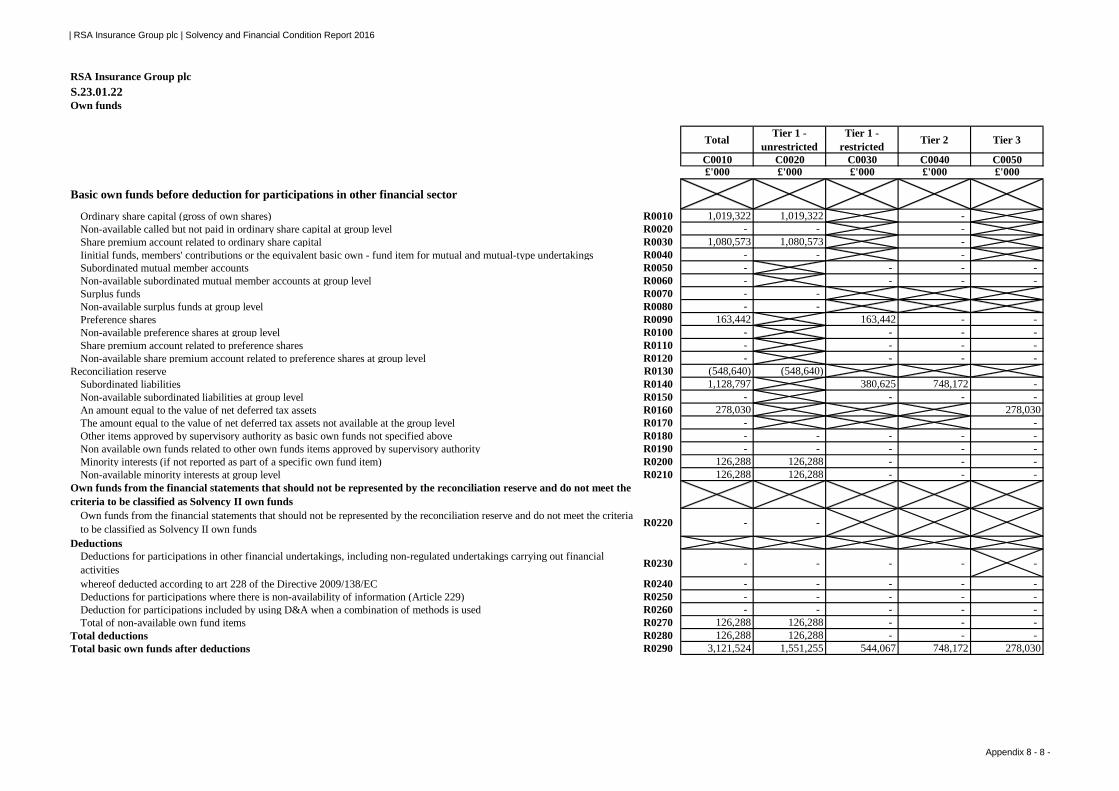
| RSA Insurance Group plc | Solvency and Financial Condition Report 2016
Appendix 8 - 8 -
RSA Insurance Group plcS.23.01.22Own funds
Total Tier 1 - unrestricted
Tier 1 - restricted Tier 2 Tier 3
C0010 C0020 C0030 C0040 C0050£'000 £'000 £'000 £'000 £'000
Basic own funds before deduction for participations in other financial sector
Ordinary share capital (gross of own shares) R0010 1,019,322 1,019,322 -Non-available called but not paid in ordinary share capital at group level R0020 - - -Share premium account related to ordinary share capital R0030 1,080,573 1,080,573 -Iinitial funds, members' contributions or the equivalent basic own - fund item for mutual and mutual-type undertakings R0040 - - -Subordinated mutual member accounts R0050 - - - -Non-available subordinated mutual member accounts at group level R0060 - - - -Surplus funds R0070 - -Non-available surplus funds at group level R0080 - -Preference shares R0090 163,442 163,442 - -Non-available preference shares at group level R0100 - - - -Share premium account related to preference shares R0110 - - - -Non-available share premium account related to preference shares at group level R0120 - - - -
Reconciliation reserve R0130 (548,640) (548,640)Subordinated liabilities R0140 1,128,797 380,625 748,172 -Non-available subordinated liabilities at group level R0150 - - - -An amount equal to the value of net deferred tax assets R0160 278,030 278,030The amount equal to the value of net deferred tax assets not available at the group level R0170 - -Other items approved by supervisory authority as basic own funds not specified above R0180 - - - - -Non available own funds related to other own funds items approved by supervisory authority R0190 - - - - -Minority interests (if not reported as part of a specific own fund item) R0200 126,288 126,288 - - -Non-available minority interests at group level R0210 126,288 126,288 - - -
Own funds from the financial statements that should not be represented by the reconciliation reserve and do not meet the criteria to be classified as Solvency II own funds
Own funds from the financial statements that should not be represented by the reconciliation reserve and do not meet the criteria to be classified as Solvency II own funds R0220 - -
DeductionsDeductions for participations in other financial undertakings, including non-regulated undertakings carrying out financial activities R0230 - - - - -
whereof deducted according to art 228 of the Directive 2009/138/EC R0240 - - - - -Deductions for participations where there is non-availability of information (Article 229) R0250 - - - - -Deduction for participations included by using D&A when a combination of methods is used R0260 - - - - -Total of non-available own fund items R0270 126,288 126,288 - - -
Total deductions R0280 126,288 126,288 - - -Total basic own funds after deductions R0290 3,121,524 1,551,255 544,067 748,172 278,030

| RSA Insurance Group plc | Solvency and Financial Condition Report 2016
Appendix 8 - 9 -
RSA Insurance Group plcS.23.01.22Own funds
Total Tier 1 - unrestricted
Tier 1 - restricted Tier 2 Tier 3
C0010 C0020 C0030 C0040 C0050£'000 £'000 £'000 £'000 £'000
Ancillary own fundsUnpaid and uncalled ordinary share capital callable on demand R0300 - -Unpaid and uncalled initial funds, members' contributions or the equivalent basic own fund item for mutual and mutual - type undertakings, callable on demand R0310 - -
Unpaid and uncalled preference shares callable on demand R0320 - - -Letters of credit and guarantees other than under Article 96(2) of the Directive 2009/138/EC R0350 -Letters of credit and guarantees under Article 96(2) of the Directive 2009/138/EC R0340 - -
- - - - -Supplementary members calls under first subparagraph of Article 96(3) of the Directive 2009/138/EC R0360 - -Supplementary members calls - other than under first subparagraph of Article 96(3) of the Directive 2009/138/EC R0370 - - -Non available ancillary own funds at group level R0380 - - -Other ancillary own funds R0390 - - -
Total ancillary own funds R0400 - - -Own funds of other financial sectorsReconciliation reserve R0410 - - - -
Institutions for occupational retirement provision R0420 - - - - -Non regulated entities carrying out financial activities R0430 - - - -Total own funds of other financial sectors R0440 - - - -
Own funds when using the D&A, exclusively or in combination of method 1Own funds aggregated when using the D&A and combination of method R0450 - - - - -Own funds aggregated when using the D&A and a combination of method net of IGT R0460 - - - - -
Total available own funds to meet the consolidated group SCR (excluding own funds from other financial sector and from the undertakings included via D&A ) R0520 3,121,524 1,551,255 544,067 748,172 278,030
Total available own funds to meet the minimum consolidated group SCR R0530 2,843,494 1,551,255 544,067 748,172Total eligible own funds to meet the consolidated group SCR (excluding own funds from other financial sector and from the undertakings included via D&A ) R0560 2,835,795 1,551,255 387,814 896,726 -
Total eligible own funds to meet the minimum consolidated group SCR R0570 2,255,015 1,551,255 387,814 315,946Minimum consolidated group SCR R0610 1,579,731Ratio of Eligible own funds to Minimum Consolidated Group SCR R0650 142.75%

| RSA Insurance Group plc | Solvency and Financial Condition Report 2016
Appendix 8 - 10 -
RSA Insurance Group plcS.23.01.22Own funds
Total Tier 1 - unrestricted
Tier 1 - restricted Tier 2 Tier 3
C0010 C0020 C0030 C0040 C0050£'000 £'000 £'000 £'000 £'000
Total eligible own funds to meet the group SCR (including own funds from other financial sector and from the undertakings included via D&A ) R0660 2,835,795 1,551,255 387,814 896,726 -
Group SCR R0680 1,793,452Ratio of Eligible own funds to group SCR including other financial sectors and the undertakings included via D&A R0690 158.12%
C0060£'000
Reconciliation reserveExcess of assets over liabilities R0700 2,462,871Own shares (included as assets on the balance sheet) R0710 507Forseeable dividends, distributions and charges R0720 343,349Other basic own fund items R0730 2,667,655Adjustment for restricted own fund items in respect of matching adjustment portfolios and ring fenced funds R0740 -Other non available own funds R0750 -
Reconciliation reserve before deduction for participations in other financial sector R0760 (548,640)Expected profitsExpected profits included in future premiums (EPIFP) - Life business R0770 408 408Expected profits included in future premiums (EPIFP) - Non- life business R0780 178,154 178,154Total EPIFP R0790 178,562 178,562

| RSA Insurance Group plc | Solvency and Financial Condition Report 2016
Appendix 8 - 11 -
RSA Insurance Group plcS.25.03.22Solvency Capital Requirement - for groups on Full Internal Models
Unique number of component Components descriptionCalculation of the Solvency Capital
RequirementC0010 C0020 C0030
£'00010000A Market and credit risk combined (excluding currency risk) - Expectation (47,909)10000B Market and credit risk combined (excluding currency risk) - Movement from Expectation 562,68310900A Market Risk: Group Currency Risk - Expectation (3,248)10900B Market Risk: Group Currency Risk - Movement from Expectation 99,39450150A Total underwriting risk - Expectation (493,203)50150B Total underwriting risk - Movement from Expectation 584,63050310A Catastrophe Risk - Expectation 216,30150310B Catastrophe Risk - Movement from Expectation 297,0745021IA Legacy risk - Expectation (4,774)5021IB Legacy risk - Movement from Expectation 432,55850210A Total reserve risk - Expectation (30,015)50210B Total reserve risk - Movement from Expectation 545,43070100B Operational risk - Movement from Expectation 301,00080100A Other risks (excluding pension risk) - Expectation 358,36480100B Other risks (excluding pension risk) - Movement from Expectation (67,153)80110A Other risks: Pension Risk - Expectation 29,23480110B Other risks: Pension Risk - Movement from Expectation 774,937
Calculation of Solvency Capital Requirement C0100£'000
Total undiversified components R0110 3,555,303Diversification R0060 (1,761,851)Capital requirement for business operated in accordance with Art. 4 of Directive 2003/41/EC R0160 -Solvency capital requirement excluding capital add-on R0200 1,793,452Capital add-ons already set R0210 -Solvency capital requirement R0220 1,793,452Other information on SCRAmount/estimate of the overall loss-absorbing capacity of technical provisions R0300 -Amount/estimate of the overall loss-absorbing capacity ot deferred taxes R0310 -Total amount of Notional Solvency Capital Requirements for remaining part R0410 -Total amount of Notional Solvency Capital Requirements for ring fenced funds (other than those related to business operated in accordance with Art. 4 of Directive 2003/41/EC (transitional)) R0420 -
Total amount of Notional Solvency Capital Requirement for matching adjustment portfolios R0430 -Diversification effects due to RFF nSCR aggregation for article 304 R0440 -Minimum consolidated group solvency capital requirement R0470 1,579,731

| RSA Insurance Group plc | Solvency and Financial Condition Report 2016
Appendix 8 - 12 -
RSA Insurance Group plcS.25.03.22Solvency Capital Requirement - for groups on Full Internal Models
C0100£'000
Information on other entitiesCapital requirement for other financial sectors (Non-insurance capital requirements) R0500 -Capital requirement for other financial sectors (Non-insurance capital requirements) - Credit institutions, investment firms and financial institutions, alternative investment funds managers, UCITS management companies
R0510 -
Capital requirement for other financial sectors (Non-insurance capital requirements) - Institutions for occupational retirement provisions R0520 -
Capital requirement for other financial sectors (Non-insurance capital requirements) - Capital requirement for non- regulated entities carrying out financial activities R0530 -
Capital requirement for non-controlled participation requirements R0540 -Capital requirement for residual undertakings R0550 -

| RSA Insurance Group plc | Solvency and Financial Condition Report 2016
Appendix 8 - 13 -
RSA Insurance Group plcS.32.01.22Undertakings in the scope of the group
Group solvency calculation
Country Identification code of the undertaking
Type of code of the ID of the undertaking
Legal name of the undertaking
Type of undertaking Legal form Category (mutual/non
mutual)Supervisory Authority % capital share
% used for the establishment of
consolidated accounts
% voting rights Other criteria Level of
influence
Proportional share used for group solvency
calculation
YES/NODate of
decision if art. 214 is applied
Method used and under method 1, treatment of the
undertaking
C0010 C0020 C0030 C0040 C0050 C0060 C0070 C0080 C0180 C0190 C0200 C0210 C0220 C0230 C0240 C0250 C0260
IE 635400JKBNF9HWETAC12 LEI 123 Money Limited Other Company limited by shares or by guarantee or unlimited Non-mutual 100.00% 100.00% 100.00% Dominant 100.00% Included in the
scopeMethod 1: Adjusted equity
method
CA 21380027VJ2CNURW2869 LEI 3342484 Canada Limited Other Company limited by shares or by guarantee or unlimited Non-mutual 100.00% 100.00% 100.00% Dominant 100.00% Included in the
scopeMethod 1: Adjusted equity
method
CA 2138001MSYC6DJSD6442 LEI 8301140 CANADA LIMITED Other Company limited by shares or by guarantee or unlimited Non-mutual 100.00% 100.00% 100.00% Dominant 100.00% Included in the
scopeMethod 1: Adjusted equity
method
GB 2138007KGUIA8Y1VU969 LEI Acrecrest Limited Other Company limited by shares or by guarantee or unlimited Non-mutual 100.00% 100.00% 100.00% Dominant 100.00% Included in the
scopeMethod 1: Adjusted equity
method
OM 213800FI2PSFQ4ZDBU69 LEI Al Ahlia Insurance Company SAOC
Non life insurance undertaking
Company limited by shares or by guarantee or unlimited Non-mutual Capital Market
Authority 35.00% 100.00% 35.00%
Control via intermediate parent undertaking
Dominant 100.00% Included in the scope
Method 1: Full consolidation
SA 21380029FNRUTGXSMV81 LEI Al Alamiya for Cooperative Insurance Company
Non life insurance undertaking
Company limited by shares or by guarantee or unlimited Non-mutual Saudi Arabian
Monetary Agency 25.04% 100.00% 25.04%
Control via intermediate parent undertaking
Dominant 100.00% Included in the scope
Method 1: Full consolidation
GB 2138001L7RT95YMKO572 LEI Alliance Assurance Company Limited Other Company limited by shares or by
guarantee or unlimited Non-mutual 100.00% 100.00% 100.00% Dominant 100.00% Included in the scope
Method 1: Adjusted equity method
CA 213800J3CJPWXEB8PF90 LEI Ascentus Insurance Ltd. Non life insurance undertaking
Company limited by shares or by guarantee or unlimited Non-mutual
Office of the Superintendent of Financial Institutions
100.00% 100.00% 100.00% Dominant 100.00% Included in the scope
Method 1: Full consolidation
IE 6354002QMLYRFBNBZO30 LEI Benchmark Underwriting Limited Other Company limited by shares or by guarantee or unlimited Non-mutual 100.00% 100.00% 100.00% Dominant 100.00% Included in the
scopeMethod 1: Adjusted equity
method
DK 213800ACUB4LYPEUH474 LEI Besigtelses Kontoret af 1914 A/S Other Company limited by shares or by guarantee or unlimited Non-mutual 100.00% 100.00% 100.00% Dominant 100.00% Included in the
scopeMethod 1: Adjusted equity
method
GB 213800IXA2TPBTGS4L69 LEI Bradford Insurance Trustee Limited Other Company limited by shares or by
guarantee or unlimited Non-mutual 100.00% 100.00% 100.00% Dominant 100.00% Included in the scope
Method 1: Adjusted equity method
GB 213800QZM3MBMZ1GIN34 LEI British and Foreign Marine Insurance Company Limited Other Company limited by shares or by
guarantee or unlimited Non-mutual 100.00% 100.00% 100.00% Dominant 100.00% Included in the scope
Method 1: Adjusted equity method
GB 213800CQKGMK29WMID58 LEI British Aviation Insurance Company Limited
Non life insurance undertaking
Company limited by shares or by guarantee or unlimited Non-mutual Prudential
Regulation Authority 57.10% 100.00% 57.10% Dominant 100.00% Included in the scope
Method 1: Full consolidation
CA 213800DAGAT2GMIPHL60 LEI Canadian Northern Shield Insurance Company
Non life insurance undertaking
Company limited by shares or by guarantee or unlimited Non-mutual
Office of the Superintendent of Financial Institutions
100.00% 100.00% 100.00% Dominant 100.00% Included in the scope
Method 1: Full consolidation
GB 213800ANK59AYB612F23GB10045 Specific code Caunce O'Hara & Company Limited Other Company limited by shares or by
guarantee or unlimited Non-mutual 39.00% 39.00% 39.00% Significant 39.00% Included in the scope
Method 1: Adjusted equity method
GB 213800ANK59AYB612F23GB10046 Specific code Centrium Management Company Limited Other Company limited by shares or by
guarantee or unlimited Non-mutual 31.45% 31.45% 31.45% Significant 31.45% Included in the scope
Method 1: Adjusted equity method
GB 2138001CUXLA4C59RF03 LEI Century Insurance Company Limited Other Company limited by shares or by
guarantee or unlimited Non-mutual 100.00% 100.00% 100.00% Dominant 100.00% Included in the scope
Method 1: Adjusted equity method
CA 213800SPA9KTDI831S12 LEI Coast Underwriters Limited Other Company limited by shares or by guarantee or unlimited Non-mutual 85.42% 100.00% 85.42% Dominant 100.00% Included in the
scopeMethod 1: Adjusted equity
method
DK 2138007T7FYS937PZZ67 LEI Codan A/S
Insurance holding company as defined in Article 212(1) (f) of Directive 2009/138/EC
Company limited by shares or by guarantee or unlimited Non-mutual 100.00% 100.00% 100.00% Dominant 100.00% Included in the
scopeMethod 1: Full consolidation
DK 2138006IITXK6KROK550 LEI Codan Ejendomme II A/S Other Company limited by shares or by guarantee or unlimited Non-mutual 100.00% 100.00% 100.00% Dominant 100.00% Included in the
scopeMethod 1: Adjusted equity
method
GB 213800IUBDCL4IOIH917 LEI Codan Finance LimitedCredit institution, investment firm and financial institution
Company limited by shares or by guarantee or unlimited Non-mutual 100.00% 100.00% 100.00% Dominant 100.00% Included in the
scope Method 1: Sectoral rules
DK 213800UE8HIN1CBHT615 LEI Codan Forsikring A/S Non life insurance undertaking
Company limited by shares or by guarantee or unlimited Non-mutual Finanstilsynet 100.00% 100.00% 100.00% Dominant 100.00% Included in the
scopeMethod 1: Full consolidation
GB 213800X1SSEEUD5I7L58 LEI Coverselect Limited Other Company limited by shares or by guarantee or unlimited Non-mutual 100.00% 100.00% 100.00% Dominant 100.00% Included in the
scopeMethod 1: Adjusted equity
method
IE 2138005VMCTKTHZC5990 LEI EGI Holdings Limited Other Company limited by shares or by guarantee or unlimited Non-mutual 100.00% 100.00% 100.00% Dominant 100.00% Included in the
scopeMethod 1: Adjusted equity
method
IE 635400LKGXVQZCZXEY42 LEI Europa General Underwriters Limited Other Company limited by shares or by
guarantee or unlimited Non-mutual 100.00% 100.00% 100.00% Dominant 100.00% Included in the scope
Method 1: Adjusted equity method
GB 213800ANK59AYB612F23GB10058 Specific code Eurotempest Limited Other Company limited by shares or by guarantee or unlimited Non-mutual 33.33% 33.33% 33.33% Significant 33.33% Included in the
scopeMethod 1: Adjusted equity
method
DK 213800EKN2D9ACM88N66 LEI Forsikringsselskabet Privatsikring A/S
Non life insurance undertaking
Company limited by shares or by guarantee or unlimited Non-mutual Finanstilsynet 100.00% 100.00% 100.00% Dominant 100.00% Included in the
scopeMethod 1: Full consolidation
GB 2138007Y3YVVE7Z1SF57 LEI Fyfe Group Limited Other Company limited by shares or by guarantee or unlimited Non-mutual 100.00% 100.00% 100.00% Dominant 100.00% Included in the
scopeMethod 1: Adjusted equity
method
Criteria of influence Inclusion in the scope of group supervision

| RSA Insurance Group plc | Solvency and Financial Condition Report 2016
Appendix 8 - 14 -
RSA Insurance Group plcS.32.01.22Undertakings in the scope of the group
Group solvency calculation
Country Identification code of the undertaking
Type of code of the ID of the undertaking
Legal name of the undertaking
Type of undertaking Legal form Category (mutual/non
mutual)Supervisory Authority % capital share
% used for the establishment of
consolidated accounts
% voting rights Other criteria Level of
influence
Proportional share used for group solvency
calculation
YES/NODate of
decision if art. 214 is applied
Method used and under method 1, treatment of the
undertaking
C0010 C0020 C0030 C0040 C0050 C0060 C0070 C0080 C0180 C0190 C0200 C0210 C0220 C0230 C0240 C0250 C0260
Criteria of influence Inclusion in the scope of group supervision
NL 213800FI5ZZ5G9OTW105 LEI GDII - Global Direct Insurance Investments V.O.F. Other Company limited by shares or by
guarantee or unlimited Non-mutual 100.00% 100.00% 100.00% Dominant 100.00% Included in the scope
Method 1: Adjusted equity method
RU 213800KI2V5HCNSPHG81 LEI GDII - Rus L.L.C. Other Company limited by shares or by guarantee or unlimited Non-mutual 100.00% 100.00% 100.00% Dominant 100.00% Included in the
scopeMethod 1: Adjusted equity
method
SE 213800KK4S2KUGIZZF60 LEI Holmia Livforsakring AB Life insurance undertaking
Company limited by shares or by guarantee or unlimited Non-mutual Finansinspektionen 100.00% 100.00% 100.00% Dominant 100.00% Included in the
scopeMethod 1: Full consolidation
GB 2138002JCYMLUO559480 LEI IDIP Direct Insurance B.V. Other Company limited by shares or by guarantee or unlimited Non-mutual 100.00% 100.00% 100.00% Dominant 100.00% Included in the
scopeMethod 1: Adjusted equity
method
GG 213800GEYZIFG43S8671 LEI Insurance Corporation of the Channel Islands Limited
Non life insurance undertaking
Company limited by shares or by guarantee or unlimited Non-mutual
Guernsey Financial Services Commission / Jersey Financial Services Commission
100.00% 100.00% 100.00% Dominant 100.00% Included in the scope
Method 1: Full consolidation
GG 213800UBK38YDFB2WZ49 LEI Insurance Corporation Service Company Limited Other Company limited by shares or by
guarantee or unlimited Non-mutual 100.00% 100.00% 100.00% Dominant 100.00% Included in the scope
Method 1: Adjusted equity method
GB 213800XUUQZ6KEFHFH86 LEI Intouch Insurance Group B.V. Other Company limited by shares or by guarantee or unlimited Non-mutual 100.00% 100.00% 100.00% Dominant 100.00% Included in the
scopeMethod 1: Adjusted equity
method
CA 213800TEFY7GI5YR5P86 LEI Johnson, L. Inc. Other Company limited by shares or by guarantee or unlimited Non-mutual 100.00% 100.00% 100.00% Dominant 100.00% Included in the
scopeMethod 1: Adjusted equity
method
CA 21380042J8ALND55O995 LEI Johnson Inc. Other Company limited by shares or by guarantee or unlimited Non-mutual 100.00% 100.00% 100.00% Dominant 100.00% Included in the
scopeMethod 1: Adjusted equity
method
GB 213800Q9L6ZFV5FMQT37 LEI Liability Insurance Solutions Limited Other Company limited by shares or by
guarantee or unlimited Non-mutual 100.00% 100.00% 100.00% Dominant 100.00% Included in the scope
Method 1: Adjusted equity method
GB 213800ONM798JLO3YY10 LEI Liverpool Marine and General Insurance Company Limited Other Company limited by shares or by
guarantee or unlimited Non-mutual 100.00% 100.00% 100.00% Dominant 100.00% Included in the scope
Method 1: Adjusted equity method
GB 213800SQ56E8X6RYYY35 LEI London Guarantee & Reinsurance Company Limited Other Company limited by shares or by
guarantee or unlimited Non-mutual 100.00% 100.00% 100.00% Dominant 100.00% Included in the scope
Method 1: Adjusted equity method
GB 213800QQKMJ4H21H3N50 LEI Magian Underwriting Agency (1998) Limited Other Company limited by shares or by
guarantee or unlimited Non-mutual 100.00% 100.00% 100.00% Dominant 100.00% Included in the scope
Method 1: Adjusted equity method
GB 213800X2AYQBOJ699N57 LEI Martello Professional Risks Limited Other Company limited by shares or by
guarantee or unlimited Non-mutual 100.00% 100.00% 100.00% Dominant 100.00% Included in the scope
Method 1: Adjusted equity method
GB 213800H8R4WQ793T4H76 LEI Motor Trade Solutions Limited Other Company limited by shares or by guarantee or unlimited Non-mutual 100.00% 100.00% 100.00% Dominant 100.00% Included in the
scopeMethod 1: Adjusted equity
method
CA 2138001NWJJAVDSDI284 LEI MRM Solutions Limited Other Company limited by shares or by guarantee or unlimited Non-mutual 85.42% 100.00% 85.42% Dominant 100.00% Included in the
scopeMethod 1: Adjusted equity
method
GB 213800XGL4IMC52Y1Z52 LEI National Vulcan Engineering Insurance Group Limited Other Company limited by shares or by
guarantee or unlimited Non-mutual 100.00% 100.00% 100.00% Dominant 100.00% Included in the scope
Method 1: Adjusted equity method
LU 213800OWIT92MSIDXF47 LEI RSA Overseas Holdings (Luxembourg) (No 1) SARL Other Company limited by shares or by
guarantee or unlimited Non-mutual 100.00% 100.00% 100.00% Dominant 100.00% Included in the scope
Method 1: Adjusted equity method
NO 213800PI97OTWRVX6O82 LEI NIS Norway AS Other Company limited by shares or by guarantee or unlimited Non-mutual 100.00% 100.00% 100.00% Dominant 100.00% Included in the
scopeMethod 1: Adjusted equity
method
SE 213800SDYN8W818VSG91 LEI NIS Sweden I AB Other Company limited by shares or by guarantee or unlimited Non-mutual 100.00% 100.00% 100.00% Dominant 100.00% Included in the
scopeMethod 1: Adjusted equity
method
GB 213800ZE92UDG3S4ZU46 LEI Noble Marine (Insurance Brokers) Limited Other Company limited by shares or by
guarantee or unlimited Non-mutual 100.00% 100.00% 100.00% Dominant 100.00% Included in the scope
Method 1: Adjusted equity method
GB 213800QZC3OW1OHKWN33 LEI Noble Marine (Underwriting Agencies) Limited Other Company limited by shares or by
guarantee or unlimited Non-mutual 100.00% 100.00% 100.00% Dominant 100.00% Included in the scope
Method 1: Adjusted equity method
GB 21380093NMZ67LWQUP95 LEI Non-Destructive Testers Limited Other Company limited by shares or by guarantee or unlimited Non-mutual 100.00% 100.00% 100.00% Dominant 100.00% Included in the
scopeMethod 1: Adjusted equity
method
GB 213800WQEO42QRA89A23 LEI Oak Underwriting plc Other Company limited by shares or by guarantee or unlimited Non-mutual 100.00% 100.00% 100.00% Dominant 100.00% Included in the
scopeMethod 1: Adjusted equity
method
GB 213800ANK59AYB612F23GB10023 Specific code Polaris U.K. Limited Other Company limited by shares or by guarantee or unlimited Non-mutual 25.38% 25.38% 25.38% Significant 25.38% Included in the
scopeMethod 1: Adjusted equity
method
GB 2138007CITM82ECL5H21 LEI Professional Indemnity Direct Limited Other Company limited by shares or by
guarantee or unlimited Non-mutual 100.00% 100.00% 100.00% Dominant 100.00% Included in the scope
Method 1: Adjusted equity method
GB 213800ANK59AYB612F23GB10093 Specific code Punchbowl Park Management Limited Other Company limited by shares or by
guarantee or unlimited Non-mutual 65.09% 100.00% 65.09% Dominant 100.00% Included in the scope
Method 1: Adjusted equity method
CA 213800LETW8YVVIKA925 LEI Quebec Assurance Company Non life insurance undertaking
Company limited by shares or by guarantee or unlimited Non-mutual
Office of the Superintendent of Financial Institutions
100.00% 100.00% 100.00% Dominant 100.00% Included in the scope
Method 1: Full consolidation
GB 213800UFWO1FMYFVJ852 LEI R&SA Global Network Limited Other Company limited by shares or by guarantee or unlimited Non-mutual 64.00% 100.00% 64.00% Dominant 100.00% Included in the
scopeMethod 1: Adjusted equity
method
GB 213800HZNB54V174TQ06 LEI R&SA Marketing Services plc Other Company limited by shares or by guarantee or unlimited Non-mutual 100.00% 100.00% 100.00% Dominant 100.00% Included in the
scopeMethod 1: Adjusted equity
method
GB 213800XOPYKARH7TEG94 LEI Road Runner Motor Trade Limited Other Company limited by shares or by
guarantee or unlimited Non-mutual 100.00% 100.00% 100.00% Dominant 100.00% Included in the scope
Method 1: Adjusted equity method

| RSA Insurance Group plc | Solvency and Financial Condition Report 2016
Appendix 8 - 15 -
RSA Insurance Group plcS.32.01.22Undertakings in the scope of the group
Group solvency calculation
Country Identification code of the undertaking
Type of code of the ID of the undertaking
Legal name of the undertaking
Type of undertaking Legal form Category (mutual/non
mutual)Supervisory Authority % capital share
% used for the establishment of
consolidated accounts
% voting rights Other criteria Level of
influence
Proportional share used for group solvency
calculation
YES/NODate of
decision if art. 214 is applied
Method used and under method 1, treatment of the
undertaking
C0010 C0020 C0030 C0040 C0050 C0060 C0070 C0080 C0180 C0190 C0200 C0210 C0220 C0230 C0240 C0250 C0260
Criteria of influence Inclusion in the scope of group supervision
CA 213800TQHQKOE28LBE41 LEI Roins Financial Services Limited
Insurance holding company as defined in Article 212(1) (f) of Directive 2009/138/EC
Company limited by shares or by guarantee or unlimited Non-mutual 100.00% 100.00% 100.00% Dominant 100.00% Included in the
scopeMethod 1: Full consolidation
CA 213800WTNFVQSB5Q9Y36 LEI Roins Holding Limited
Insurance holding company as defined in Article 212(1) (f) of Directive 2009/138/EC
Company limited by shares or by guarantee or unlimited Non-mutual 100.00% 100.00% 100.00% Dominant 100.00% Included in the
scopeMethod 1: Full consolidation
IE 6354006EAT6TRTBUVF28 LEI Royal & Sun Alliance (Ireland) Limited Other Company limited by shares or by
guarantee or unlimited Non-mutual 100.00% 100.00% 100.00% Dominant 100.00% Included in the scope
Method 1: Adjusted equity method
GB 213800ID98Y7D8MI1X68 LEI Royal & Sun Alliance Insurance (Global) Limited Other Company limited by shares or by
guarantee or unlimited Non-mutual 100.00% 100.00% 100.00% Dominant 100.00% Included in the scope
Method 1: Adjusted equity method
BH 213800E6WDT9WF4OXL64 LEI Royal & Sun Alliance Insurance (Middle East) BSC (c)
Non life insurance undertaking
Company limited by shares or by guarantee or unlimited Non-mutual Central Bank of
Bahrain 50.00% 100.00% 50.00% Dominant 100.00% Included in the scope
Method 1: Full consolidation
CA 213800QV4791A63PRX56 LEI Royal & Sun Alliance Insurance Company of Canada
Non life insurance undertaking
Company limited by shares or by guarantee or unlimited Non-mutual
Office of the Superintendent of Financial Institutions
100.00% 100.00% 100.00% Dominant 100.00% Included in the scope
Method 1: Full consolidation
GB 213800ANK59AYB612F23 LEI Royal & Sun Alliance Insurance plc
Non life insurance undertaking
Company limited by shares or by guarantee or unlimited Non-mutual Prudential
Regulation Authority 100.00% 100.00% 100.00% Dominant 100.00% Included in the scope
Method 1: Full consolidation
BR 213800ANK59AYB612F23BR10110 Specific codeRoyal & Sun Alliance Insurance PLC - Escritório de Representação no Brasil Ltda.
Other Company limited by shares or by guarantee or unlimited Non-mutual 100.00% 100.00% 100.00% Dominant 100.00% Included in the
scopeMethod 1: Adjusted equity
method
IN 213800ANK59AYB612F23IN10184 Specific code Royal & Sun Alliance IT Solutions (India) Private Limited Other Company limited by shares or by
guarantee or unlimited Non-mutual 100.00% 100.00% 100.00% Dominant 100.00% Included in the scope
Method 1: Adjusted equity method
GB 213800YCQ2NTZBWKFB71 LEI Royal & Sun Alliance Pension Trustee Limited Other Company limited by shares or by
guarantee or unlimited Non-mutual 100.00% 100.00% 100.00% Dominant 100.00% Included in the scope
Method 1: Adjusted equity method
GB 2138001DUHCXRJZKBA57 LEI Royal & Sun Alliance Property Services Limited Other Company limited by shares or by
guarantee or unlimited Non-mutual 100.00% 100.00% 100.00% Dominant 100.00% Included in the scope
Method 1: Adjusted equity method
GB 213800TWB86O896DND08 LEI Royal & Sun Alliance Reinsurance Limited
Non life insurance undertaking
Company limited by shares or by guarantee or unlimited Non-mutual Prudential
Regulation Authority 100.00% 100.00% 100.00% Dominant 100.00% Included in the scope
Method 1: Full consolidation
GB 213800FAL75DJ6CVR886 LEI Royal Insurance (U.K.) Limited Other Company limited by shares or by guarantee or unlimited Non-mutual 100.00% 100.00% 100.00% Dominant 100.00% Included in the
scopeMethod 1: Adjusted equity
method
NL 2138003TXNY2FXNMIL04 LEI Royal Insurance Global B.V. Other Company limited by shares or by guarantee or unlimited Non-mutual 100.00% 100.00% 100.00% Dominant 100.00% Included in the
scopeMethod 1: Adjusted equity
method
GB 213800O2J533CEGVK687 LEI Royal Insurance Operational Services (U.K.) Limited Other Company limited by shares or by
guarantee or unlimited Non-mutual 100.00% 100.00% 100.00% Dominant 100.00% Included in the scope
Method 1: Adjusted equity method
IM 213800GQHZOG5CX23H28IM10001 Specific code Royal Insurance Service Company (Isle of Man) Limited Other Company limited by shares or by
guarantee or unlimited Non-mutual 100.00% 100.00% 100.00% Dominant 100.00% Included in the scope
Method 1: Adjusted equity method
GB 213800DXUS819BNLJN46 LEI Royal International Insurance Holdings Limited
Insurance holding company as defined in Article 212(1) (f) of Directive 2009/138/EC
Company limited by shares or by guarantee or unlimited Non-mutual 100.00% 100.00% 100.00% Dominant 100.00% Included in the
scopeMethod 1: Full consolidation
GB 213800EQGGJALB1LMV41 LEI Roysun Limited Other Company limited by shares or by guarantee or unlimited Non-mutual 100.00% 100.00% 100.00% Dominant 100.00% Included in the
scopeMethod 1: Adjusted equity
method
GB 213800K98IYF86NOVO18 LEI RSA Accident Repairs Limited Other Company limited by shares or by guarantee or unlimited Non-mutual 100.00% 100.00% 100.00% Dominant 100.00% Included in the
scopeMethod 1: Adjusted equity
method
IN 213800RZ51278S7GQ681 LEI RSA Actuarial Services (India) Private Limited Other Company limited by shares or by
guarantee or unlimited Non-mutual 100.00% 100.00% 100.00% Dominant 100.00% Included in the scope
Method 1: Adjusted equity method
GB 2138009XXALQYA1Z8145 LEI RSA Claims Management Limited Other Company limited by shares or by
guarantee or unlimited Non-mutual 100.00% 100.00% 100.00% Dominant 100.00% Included in the scope
Method 1: Adjusted equity method
GB 213800C91B4MH9RGTY91 LEI RSA CRS (US) Limited Other Company limited by shares or by guarantee or unlimited Non-mutual 100.00% 100.00% 100.00% Dominant 100.00% Included in the
scopeMethod 1: Adjusted equity
method
GB 2138001X5H9COPXQZD68 LEI RSA E-Holdings Limited Other Company limited by shares or by guarantee or unlimited Non-mutual 100.00% 100.00% 100.00% Dominant 100.00% Included in the
scopeMethod 1: Adjusted equity
method
GB 213800ICT7DORQ6YIK68 LEI RSA Engineering Limited Other Company limited by shares or by guarantee or unlimited Non-mutual 100.00% 100.00% 100.00% Dominant 100.00% Included in the
scopeMethod 1: Adjusted equity
method
GB 21380027C4I45O77BS20 LEI RSA FinanceCredit institution, investment firm and financial institution
Company limited by shares or by guarantee or unlimited Non-mutual 100.00% 100.00% 100.00% Dominant 100.00% Included in the
scope Method 1: Sectoral rules

| RSA Insurance Group plc | Solvency and Financial Condition Report 2016
Appendix 8 - 16 -
RSA Insurance Group plcS.32.01.22Undertakings in the scope of the group
Group solvency calculation
Country Identification code of the undertaking
Type of code of the ID of the undertaking
Legal name of the undertaking
Type of undertaking Legal form Category (mutual/non
mutual)Supervisory Authority % capital share
% used for the establishment of
consolidated accounts
% voting rights Other criteria Level of
influence
Proportional share used for group solvency
calculation
YES/NODate of
decision if art. 214 is applied
Method used and under method 1, treatment of the
undertaking
C0010 C0020 C0030 C0040 C0050 C0060 C0070 C0080 C0180 C0190 C0200 C0210 C0220 C0230 C0240 C0250 C0260
Criteria of influence Inclusion in the scope of group supervision
GB 549300HOGQ7E0TY86138 LEI RSA Insurance Group plc
Insurance holding company as defined in Article 212(1) (f) of Directive 2009/138/EC
Company limited by shares or by guarantee or unlimited Non-mutual 0.00% Included in the
scope
IM 213800T7NQT6LNQZQ295 LEI RSA Isle of Man No.1 Limited Other Company limited by shares or by guarantee or unlimited Non-mutual 100.00% 100.00% 100.00% Dominant 100.00% Included in the
scopeMethod 1: Adjusted equity
method
GB 213800QUPYRC4MX7D553 LEI RSA Law Limited Other Company limited by shares or by guarantee or unlimited Non-mutual 90.00% 100.00% 90.00% Dominant 100.00% Included in the
scopeMethod 1: Adjusted equity
method
IM 213800K8T4ZNDYXH1C87 LEI RSA Manx Holdings Limited Other Company limited by shares or by guarantee or unlimited Non-mutual 100.00% 100.00% 100.00% Dominant 100.00% Included in the
scopeMethod 1: Adjusted equity
method
GB 2138004LEUAJPN7ZTL31 LEI RSA Northern Ireland Insurance Limited Other Company limited by shares or by
guarantee or unlimited Non-mutual 100.00% 100.00% 100.00% Dominant 100.00% Included in the scope
Method 1: Adjusted equity method
GB 213800RIF98KZ1HHHH93 LEI RSA Overseas (Netherlands) B.V.
Insurance holding company as defined in Article 212(1) (f) of Directive 2009/138/EC
Company limited by shares or by guarantee or unlimited Non-mutual 100.00% 100.00% 100.00% Dominant 100.00% Included in the
scopeMethod 1: Full consolidation
IE 213800OAC5B4XJHB5S94 LEI RSA Overseas (No.3) Limited Other Company limited by shares or by guarantee or unlimited Non-mutual 100.00% 100.00% 100.00% Dominant 100.00% Included in the
scopeMethod 1: Adjusted equity
method
GB 213800S6YZIUMNF14T28 LEI RSA Overseas Holdings (UK) Limited Other Company limited by shares or by
guarantee or unlimited Non-mutual 100.00% 100.00% 100.00% Dominant 100.00% Included in the scope
Method 1: Adjusted equity method
GB 213800OCAOG1IVQXR288 LEI RSA Overseas Holdings B.V.
Insurance holding company as defined in Article 212(1) (f) of Directive 2009/138/EC
Company limited by shares or by guarantee or unlimited Non-mutual 100.00% 100.00% 100.00% Dominant 100.00% Included in the
scopeMethod 1: Full consolidation
IE 213800ANK59AYB612F23IE10185 Specific code RSA Reinsurance Ireland Limited Other Company limited by shares or by guarantee or unlimited Non-mutual 100.00% 100.00% 100.00% Dominant 100.00% Included in the
scopeMethod 1: Adjusted equity
method
CA 213800EPQUDC86BANO68 LEI RSA Travel Insurance Inc. Other Company limited by shares or by guarantee or unlimited Non-mutual 100.00% 100.00% 100.00% Dominant 100.00% Included in the
scopeMethod 1: Adjusted equity
method
GB QG4SWA0CBQ35QVT5KU66 LEI Sal Pension Fund Limited Other Company limited by shares or by guarantee or unlimited Non-mutual 100.00% 100.00% 100.00% Dominant 100.00% Included in the
scopeMethod 1: Adjusted equity
method
GB 2138007ZJPWO8BA64N21 LEI Saturn Professional Risks Limited Other Company limited by shares or by
guarantee or unlimited Non-mutual 100.00% 100.00% 100.00% Dominant 100.00% Included in the scope
Method 1: Adjusted equity method
IE 635400BFCWZIQOMIJB05 LEI Sertus Underwriting Limited Other Company limited by shares or by guarantee or unlimited Non-mutual 100.00% 100.00% 100.00% Dominant 100.00% Included in the
scopeMethod 1: Adjusted equity
method
CA 213800OCAOG1IVQXR288CA10152 Specific code Shaw Sabey & Associates Ltd. Other Company limited by shares or by guarantee or unlimited Non-mutual 25.00% 25.00% 25.00% Significant 25.00% Included in the
scopeMethod 1: Adjusted equity
method
GB 21380021T4T3KTV7JV62 LEI Sun Alliance and London Insurance plc Other Company limited by shares or by
guarantee or unlimited Non-mutual 100.00% 100.00% 100.00% Dominant 100.00% Included in the scope
Method 1: Adjusted equity method
GB 213800JQ5TG68U2MY485 LEI Sun Alliance Finance B.V. Other Company limited by shares or by guarantee or unlimited Non-mutual 100.00% 100.00% 100.00% Dominant 100.00% Included in the
scopeMethod 1: Adjusted equity
method
GB 213800TG148HZ9EKJ435 LEI Sun Alliance Fund Management Limited Other Company limited by shares or by
guarantee or unlimited Non-mutual 100.00% 100.00% 100.00% Dominant 100.00% Included in the scope
Method 1: Adjusted equity method
GB 213800C61CNPND9NAW26 LEI Sun Alliance Insurance International Limited Other Company limited by shares or by
guarantee or unlimited Non-mutual 100.00% 100.00% 100.00% Dominant 100.00% Included in the scope
Method 1: Adjusted equity method
GB 213800YRS9W5SAZAPB68 LEI Sun Alliance Insurance Overseas Limited
Insurance holding company as defined in Article 212(1) (f) of Directive 2009/138/EC
Company limited by shares or by guarantee or unlimited Non-mutual 100.00% 100.00% 100.00% Dominant 100.00% Included in the
scopeMethod 1: Full consolidation
GB 213800S5ET6BFQP7H105 LEI Sun Alliance Insurance UK Limited Other Company limited by shares or by
guarantee or unlimited Non-mutual 100.00% 100.00% 100.00% Dominant 100.00% Included in the scope
Method 1: Adjusted equity method
GB 2138006WWNZTR9B5AH06 LEI Sun Alliance Management Services Limited Other Company limited by shares or by
guarantee or unlimited Non-mutual 100.00% 100.00% 100.00% Dominant 100.00% Included in the scope
Method 1: Adjusted equity method
GB 213800R663W5CDREOC48 LEI Sun Alliance Mortgage Company Limited Other Company limited by shares or by
guarantee or unlimited Non-mutual 100.00% 100.00% 100.00% Dominant 100.00% Included in the scope
Method 1: Adjusted equity method
GB 213800D6JMQCD3O7VJ98 LEI Sun Insurance Office Limited Other Company limited by shares or by guarantee or unlimited Non-mutual 100.00% 100.00% 100.00% Dominant 100.00% Included in the
scopeMethod 1: Adjusted equity
method
GB 2138003G6KJRUPENR720 LEI Swinchan Holdings Limited Other Company limited by shares or by guarantee or unlimited Non-mutual 100.00% 100.00% 100.00% Dominant 100.00% Included in the
scopeMethod 1: Adjusted equity
method
GB 213800XEBBP59GJ7RB65 LEI The Globe Insurance Company Limited
Insurance holding company as defined in Article 212(1) (f) of Directive 2009/138/EC
Company limited by shares or by guarantee or unlimited Non-mutual 100.00% 100.00% 100.00% Dominant 100.00% Included in the
scopeMethod 1: Full consolidation

| RSA Insurance Group plc | Solvency and Financial Condition Report 2016
Appendix 8 - 17 -
RSA Insurance Group plcS.32.01.22Undertakings in the scope of the group
Group solvency calculation
Country Identification code of the undertaking
Type of code of the ID of the undertaking
Legal name of the undertaking
Type of undertaking Legal form Category (mutual/non
mutual)Supervisory Authority % capital share
% used for the establishment of
consolidated accounts
% voting rights Other criteria Level of
influence
Proportional share used for group solvency
calculation
YES/NODate of
decision if art. 214 is applied
Method used and under method 1, treatment of the
undertaking
C0010 C0020 C0030 C0040 C0050 C0060 C0070 C0080 C0180 C0190 C0200 C0210 C0220 C0230 C0240 C0250 C0260
Criteria of influence Inclusion in the scope of group supervision
CA 213800IYHRGE5GBDH474 LEI The Johnson Corporation
Insurance holding company as defined in Article 212(1) (f) of Directive 2009/138/EC
Company limited by shares or by guarantee or unlimited Non-mutual 100.00% 100.00% 100.00% Dominant 100.00% Included in the
scopeMethod 1: Full consolidation
GB 21380051JKPJ1VT3RG38 LEI The London Assurance Other Company limited by shares or by guarantee or unlimited Non-mutual 100.00% 100.00% 100.00% Dominant 100.00% Included in the
scopeMethod 1: Adjusted equity
method
GB 213800ZPIJG2HWOKGX70 LEI The Marine Insurance Company Limited
Non life insurance undertaking
Company limited by shares or by guarantee or unlimited Non-mutual Prudential
Regulation Authority 100.00% 100.00% 100.00% Dominant 100.00% Included in the scope
Method 1: Full consolidation
GB 213800S943MCC6XZOV22 LEI The Northern Maritime Insurance Company Limited Other Company limited by shares or by
guarantee or unlimited Non-mutual 100.00% 100.00% 100.00% Dominant 100.00% Included in the scope
Method 1: Adjusted equity method
IE 63540021CITSCXSOTW93 LEI The Patriotic Limited Other Company limited by shares or by guarantee or unlimited Non-mutual 100.00% 100.00% 100.00% Dominant 100.00% Included in the
scopeMethod 1: Adjusted equity
method
GB 213800AW6RS4V8AGNX91 LEI The Sea Insurance Company Limited Other Company limited by shares or by
guarantee or unlimited Non-mutual 100.00% 100.00% 100.00% Dominant 100.00% Included in the scope
Method 1: Adjusted equity method
GB 213800RZB7URRDE28L02 LEI The Union Marine and General Insurance Company Limited Other Company limited by shares or by
guarantee or unlimited Non-mutual 100.00% 100.00% 100.00% Dominant 100.00% Included in the scope
Method 1: Adjusted equity method
GB 213800AVK4U7RMM5ZJ93 LEI The Westminster Fire Office Limited Other Company limited by shares or by
guarantee or unlimited Non-mutual 100.00% 100.00% 100.00% Dominant 100.00% Included in the scope
Method 1: Adjusted equity method
IM 213800GQHZOG5CX23H28 LEI Tower Insurance Company Limited
Non life insurance undertaking
Company limited by shares or by guarantee or unlimited Non-mutual
Financial Supervision Commission
100.00% 100.00% 100.00% Dominant 100.00% Included in the scope
Method 1: Full consolidation
CA 213800T1UY5ARE6W1415 LEI Unifund Assurance Company Non life insurance undertaking
Company limited by shares or by guarantee or unlimited Non-mutual
Office of the Superintendent of Financial Institutions
100.00% 100.00% 100.00% Dominant 100.00% Included in the scope
Method 1: Full consolidation
CA 213800MSYL26PPUZFM76 LEI Unifund Claims Inc. Other Company limited by shares or by guarantee or unlimited Non-mutual 100.00% 100.00% 100.00% Dominant 100.00% Included in the
scopeMethod 1: Adjusted equity
method
CA 213800GDYSIB132IA957 LEI Western Assurance Company Non life insurance undertaking
Company limited by shares or by guarantee or unlimited Non-mutual
Office of the Superintendent of Financial Institutions
100.00% 100.00% 100.00% Dominant 100.00% Included in the scope
Method 1: Full consolidation
GB 213800K4XGW6XFT9ZC81 LEI Westgate Properties Limited Other Company limited by shares or by guarantee or unlimited Non-mutual 100.00% 100.00% 100.00% Dominant 100.00% Included in the
scopeMethod 1: Adjusted equity
method
SE 213800UE8HIN1CBHT615SE10002 Specific code CAB Group AB Other Company limited by shares or by guarantee or unlimited Non-mutual 27.30% 27.30% 27.30% Significant 27.30% Included in the
scopeMethod 1: Adjusted equity
method
JE 213800ANK59AYB612F23JE20000 Specific code Urica Capital LimitedCredit institution, investment firm and financial institution
Company limited by shares or by guarantee or unlimited Non-mutual 49.95% 49.95% 49.95% Significant 49.95% Included in the
scope Method 1: Sectoral rules
CA 213800WTNFVQSB5Q9Y36CA10186 Specific code Reilly & Wickens Brokers Ltd. Other Company limited by shares or by
guarantee or unlimited Non-mutual 21.25% 21.25% 9.99% Significant 21.25% Included in the scope
Method 1: Adjusted equity method
US 213800XEBBP59GJ7RB65US10106 Specific Code Royal & Sun Alliance Insurance Agency Inc. Other Company limited by shares or by
guarantee or unlimited Non-mutual 100.00% 100.00% 100.00% Dominant 100.00% Included in the scope
Method 1: Adjusted equity method
IE 635400PUDJ8XTX9SFW67 LEI RSA Insurance Ireland DAC Non life insurance undertaking
Company limited by shares or by guarantee or unlimited Non-mutual Central Bank of
Ireland 100.00% 100.00% 100.00% Dominant 100.00% Included in the scope
Method 1: Full consolidation
IE 213800SOY368PRPH9818 LEI RSA Overseas Holdings (No. 2) Unlimited Company Other Company limited by shares or by
guarantee or unlimited Non-mutual 100.00% 100.00% 100.00% Dominant 100.00% Included in the scope
Method 1: Adjusted equity method
IE 2138007UK3VNVV5JQW88 LEI RSA Overseas Holdings (No 1) Unlimited Company Other Company limited by shares or by
guarantee or unlimited Non-mutual 100.00% 100.00% 100.00% Dominant 100.00% Included in the scope
Method 1: Adjusted equity method
GB 213800W9SQFQCULBU447 LEI Royal & SunAlliance Benelux Holdings N.V. Other Company limited by shares or by
guarantee or unlimited Non-mutual 100.00% 100.00% 100.00% Dominant 100.00% Included in the scope
Method 1: Adjusted equity method
SG 213800U5OQIKIKVAFJ23 LEI Survey Association Pte. Ltd. Other Company limited by shares or by guarantee or unlimited Non-mutual 100.00% 100.00% 100.00% Dominant 100.00% Included in the
scopeMethod 1: Adjusted equity
method
GB 213800MOAG1P5WPBYN70 LEI Royal Insurance Holdings Limited
Insurance holding company as defined in Article 212(1) (f) of Directive 2009/138/EC
Company limited by shares or by guarantee or unlimited Non-mutual 100.00% 100.00% 100.00% Dominant 100.00% Included in the
scopeMethod 1: Full consolidation

| RSA Insurance Group plc | Solvency and Financial Condition Report 2016
Appendix 8 - 18 -
Royal & Sun Alliance Insurance plcS.02.01.02Balance sheet
Solvency II value
Solvency II value
Assets C0010 Liabilities C0010£'000 £'000
Intangible assets R0030 - Technical provisions – non-life R0510 5,821,468Deferred tax assets R0040 214,858 Technical provisions – non-life (excluding health) R0520 5,688,824Pension benefit surplus R0050 55,441 TP calculated as a whole R0530 -Property, plant & equipment held for own use R0060 32,714 Best Estimate R0540 5,363,058Investments (other than assets held for index-linked and unit-linked contracts) R0070 15,468,367 Risk margin R0550 325,766
Property (other than for own use) R0080 332,945 Technical provisions - health (similar to non-life) R0560 132,644Holdings in related undertakings, including participations R0090 9,791,024 TP calculated as a whole R0570 -Equities R0100 3,123 Best Estimate R0580 131,214
Equities - listed R0110 1,206 Risk margin R0590 1,430Equities - unlisted R0120 1,917 Technical provisions - life (excluding index-linked and unit-linked) R0600 248,058
Bonds R0130 4,668,944 Technical provisions - health (similar to life) R0610 182Government Bonds R0140 1,348,973 TP calculated as a whole R0620 -Corporate Bonds R0150 3,113,200 Best Estimate R0630 180Structured notes R0160 - Risk margin R0640 2Collateralised securities R0170 206,771 Technical provisions – life (excluding health and index-linked and unit-linked) R0650 247,876
Collective Investments Undertakings R0180 494,335 TP calculated as a whole R0660 -Derivatives R0190 66,207 Best Estimate R0670 200,612Deposits other than cash equivalents R0200 111,789 Risk margin R0680 47,264Other investments R0210 - Technical provisions – index-linked and unit-linked R0690 -
Assets held for index-linked and unit-linked contracts R0220 - TP calculated as a whole R0700 -Loans and mortgages R0230 244,986 Best Estimate R0710 -
Loans on policies R0240 - Risk margin R0720 - Loans and mortgages to individuals R0250 2,998 Contingent liabilities R0740 - Other loans and mortgages R0260 241,988 Provisions other than technical provisions R0750 52,697Reinsurance recoverables from: R0270 999,425 Pension benefit obligations R0760 194,929
Non-life and health similar to non-life R0280 925,938 Deposits from reinsurers R0770 164Non-life excluding health R0290 925,929 Deferred tax liabilities R0780 108Health similar to non-life R0300 9 Derivatives R0790 171,055
Life and health similar to life, excluding health and index-linked and unit-linked R0310 73,487 Debts owed to credit institutions R0800 96,003Health similar to life R0320 - Financial liabilities other than debts owed to credit institutions R0810 5,696,715Life excluding health and index-linked and unit-linked R0330 73,487 Insurance & intermediaries payables R0820 128,864
Life index-linked and unit-linked R0340 - Reinsurance payables R0830 103,588Deposits to cedants R0350 301,010 Payables (trade, not insurance) R0840 2,682,199Insurance and intermediaries receivables R0360 797,379 Subordinated liabilities R0850 415,972Reinsurance receivables R0370 63,034 Subordinated liabilities not in BOF R0860 -Receivables (trade, not insurance) R0380 520,369 Subordinated liabilities in BOF R0870 415,972Own shares (held directly) R0390 - Any other liabilities, not elsewhere shown R0880 284,376Amounts due in respect of own fund items or initial fund called up but not yet paid in R0400 - Total liabilities R0900 15,896,196Cash and cash equivalents R0410 65,565 Excess of assets over liabilities R1000 2,882,879Any other assets, not elsewhere shown R0420 15,927Total assets R0500 18,779,075

| RSA Insurance Group plc | Solvency and Financial Condition Report 2016
Appendix 8 - 19 -
Royal & Sun Alliance Insurance plcS.05.01.02Premiums, claims and expenses by line of business
Medical expense
insurance
Income protection insurance
Workers' compensation
insurance
Motor vehicle liability
insurance
Other motor insurance
Marine, aviation and transport insurance
Fire and other damage to property insurance
General liability insurance
Credit and suretyship insurance
C0010 C0020 C0030 C0040 C0050 C0060 C0070 C0080 C0090
£'000 £'000 £'000 £'000 £'000 £'000 £'000 £'000 £'000Premiums written Gross - Direct Business R0110 278,252 36 - 616,380 294,876 262,127 1,195,219 310,548 2,798 Gross - Proportional reinsurance accepted R0120 684 1,154 - 102,928 23,694 116,058 212,727 72,553 - Gross - Non-proportional reinsurance accepted R0130 Reinsurers' share R0140 - - - 321,626 105,022 57,484 243,654 46,632 884 Net R0200 278,936 1,190 - 397,682 213,548 320,701 1,164,292 336,469 1,914Premiums earned Gross - Direct Business R0210 276,299 36 - 613,491 293,411 318,523 1,238,116 312,520 3,074 Gross - Proportional reinsurance accepted R0220 684 1,154 - 102,886 23,676 79,497 239,069 74,305 - Gross - Non-proportional reinsurance accepted R0230 Reinsurers' share R0240 - - - 289,222 93,775 64,512 299,949 56,267 973 Net R0300 276,983 1,190 - 427,155 223,312 333,508 1,177,236 330,558 2,101Claims incurred Gross - Direct Business R0310 170,942 289 - 436,323 213,090 227,528 546,941 176,138 474 Gross - Proportional reinsurance accepted R0320 463 336 (506) 90,103 20,663 45,546 88,598 25,948 - Gross - Non-proportional reinsurance accepted R0330 Reinsurers' share R0340 2,000 - - 208,048 94,000 87,094 95,261 (13,293) (79) Net R0400 169,405 625 (506) 318,378 139,753 185,980 540,278 215,379 553Changes in other technical provisions Gross - Direct Business R0410 - - - - - - - - - Gross - Proportional reinsurance accepted R0420 - - - - - - - - - Gross - Non- proportional reinsurance accepted R0430 Reinsurers'share R0440 - - - - - - - - - Net R0500 - - - - - - - - -Expenses incurred R0550 107,241 268 - 152,543 95,200 121,218 571,881 141,311 686Other expenses R1200Total expenses R1300
Line of Business for: non-life insurance and reinsurance obligations (direct business and accepted proportional reinsurance)

| RSA Insurance Group plc | Solvency and Financial Condition Report 2016
Appendix 8 - 20 -
Royal & Sun Alliance Insurance plcS.05.01.02Premiums, claims and expenses by line of business
Legal expenses insurance
Assistance Miscellaneous financial loss Health Casualty Marine, aviation,
transport Property
C0100 C0110 C0120 C0130 C0140 C0150 C0160 C0200
£'000 £'000 £'000 £'000 £'000 £'000 £'000 £'000Premiums written Gross - Direct Business R0110 8,358 14,368 41,236 3,024,200 Gross - Proportional reinsurance accepted R0120 - 549 23 530,368 Gross - Non-proportional reinsurance accepted R0130 - - - (17,410) (17,410) Reinsurers' share R0140 - - 1,890 - - - (1,447) 775,746 Net R0200 8,358 14,917 39,369 - - - (15,963) 2,761,413Premiums earned Gross - Direct Business R0210 8,368 14,111 40,693 3,118,644 Gross - Proportional reinsurance accepted R0220 - 549 23 521,843 Gross - Non-proportional reinsurance accepted R0230 - - - 1,514 1,513 Reinsurers' share R0240 - - 1,908 - - - (2,607) 804,000 Net R0300 8,368 14,660 38,808 - - - 4,121 2,838,000Claims incurred Gross - Direct Business R0310 2,491 4,368 18,993 1,797,577 Gross - Proportional reinsurance accepted R0320 - 349 (22) 271,479 Gross - Non-proportional reinsurance accepted R0330 - 17,562 - 5,861 23,422 Reinsurers' share R0340 - - (274) - 201 - 4,696 477,653 Net R0400 2,491 4,717 19,245 - 17,361 - 1,165 1,614,824Changes in other technical provisions Gross - Direct Business R0410 - - - - Gross - Proportional reinsurance accepted R0420 - - - - Gross - Non- proportional reinsurance accepted R0430 - - - - - Reinsurers'share R0440 - - - - - - - - Net R0500 - - - - - - - -Expenses incurred R0550 662 8,058 14,216 - - - 105 1,213,389Other expenses R1200 (220,708)Total expenses R1300 992,681
Line of business for:accepted non-proportional reinsurance
Total
Line of Business for: non-life insurance and reinsurance obligations (direct business and accepted proportional reinsurance)

| RSA Insurance Group plc | Solvency and Financial Condition Report 2016
Appendix 8 - 21 -
Royal & Sun Alliance Insurance plcS.05.01.02Premiums, claims and expenses by line of business
Total
Health insurance
Insurance with profit
participation
Index-linked and unit-linked
insurance
Other life insurance
Annuities stemming from
non-life insurance contracts and
relating to health insurance
obligations
Annuities stemming from non-life insurance contracts and relating to
insurance obligations other than health
insurance obligations
Health reinsurance Life reinsurance
C0210 C0220 C0230 C0240 C0250 C0260 C0270 C0280 C0300£'000 £'000 £'000 £'000 £'000 £'000 £'000 £'000 £'000
Premiums written Gross R1410 - - - - - - - - - Reinsurers' share R1420 - - - - - - - - - Net R1500 - - - - - - - - -Premiums earned Gross R1510 - - - - - - - - - Reinsurers' share R1520 - - - - - - - - - Net R1600 - - - - - - - - -Claims incurred Gross R1610 - - - - 674 33,285 - - 33,959 Reinsurers' share R1620 - - - - - 8,354 - - 8,354 Net R1700 - - - - 674 24,931 - - 25,605Changes in other technical provisions Gross R1710 - - - - - - - - - Reinsurers' share R1720 - - - - - - - - - Net R1800 - - - - - - - - -Expenses incurred R1900 - - - - - - - - -Other expenses R2500 380Total expenses R2600 380
Life reinsurance obligationsLine of Business for: life insurance obligations

| RSA Insurance Group plc | Solvency and Financial Condition Report 2016
Appendix 8 - 22 -
Royal & Sun Alliance Insurance plcS.05.02.01Premiums, claims and expenses by country
Home CountryTotal Top 5 and home country
C0010 C0020 C0030 C0040 C0050 C0060 C0070R0010 IE FR ES
C0080 C0090 C0100 C0110 C0120 C0130 C0140£'000 £'000 £'000 £'000 £'000 £'000 £'000
Premiums written Gross - Direct Business R0110 2,760,013 8,554 82,580 66,440 - - 2,917,586 Gross - Proportional reinsurance accepted R0120 227,671 183,896 - 1,254 - - 412,821 Gross - Non-proportional reinsurance accepted R0130 - (642) - - - - (642) Reinsurers' share R0140 643,868 1,670 10,376 33,362 - - 689,275 Net R0200 2,343,816 190,138 72,204 34,332 - - 2,640,490Premiums earned Gross - Direct Business R0210 2,862,385 7,885 81,187 62,944 - - 3,014,400 Gross - Proportional reinsurance accepted R0220 196,293 183,896 - 1,309 - - 381,498 Gross - Non-proportional reinsurance accepted R0230 - 3,796 - - - - 3,796 Reinsurers' share R0240 636,718 3,276 13,186 35,171 - - 688,350 Net R0300 2,421,960 192,301 68,001 29,082 - - 2,711,344Claims incurred Gross - Direct Business R0310 1,685,190 3,584 34,183 33,541 - - 1,756,499 Gross - Proportional reinsurance accepted R0320 71,051 159,720 - 696 - - 231,467 Gross - Non-proportional reinsurance accepted R0330 - 17,360 - - - - 17,360 Reinsurers' share R0340 425,641 748 (259) 16,298 - - 442,429 Net R0400 1,330,600 179,916 34,442 17,939 - - 1,562,897Changes in other technical provisions Gross - Direct Business R0410 - - - - - - - Gross - Proportional reinsurance accepted R0420 - - - - - - - Gross - Non- proportional reinsurance accepted R0430 - - - - - - - Reinsurers'share R0440 - - - - - - - Net R0500 - - - - - - -Expenses incurred R0550 1,088,297 43,596 20,851 12,241 - - 1,164,985Other expenses R1200 (220,826)Total expenses R1300 944,160
Top 5 countries (by amount of gross premiums written) - non-life obligations

| RSA Insurance Group plc | Solvency and Financial Condition Report 2016
Appendix 8 - 23 -
Royal & Sun Alliance Insurance plcS.05.02.01Premiums, claims and expenses by country
Home CountryTotal Top 5 and home country
C0150 C0160 C0170 C0180 C0190 C0200 C0210R1400 IE FR ES
C0220 C0230 C0240 C0250 C0260 C0270 C0280£'000 £'000 £'000 £'000 £'000 £'000 £'000
Premiums written Gross R1410 - - - - - - - Reinsurers' share R1420 - - - - - - - Net R1500 - - - - - - -Premiums earned Gross R1510 - - - - - - - Reinsurers' share R1520 - - - - - - - Net R1600 - - - - - - -Claims incurred Gross R1610 33,285 - - - - - 33,285 Reinsurers' share R1620 8,354 - - - - - 8,354 Net R1700 24,931 - - - - - 24,931Changes in other technical provisions Gross R1710 - - - - - - - Reinsurers' share R1720 - - - - - - - Net R1800 - - - - - - -Expenses incurred R1900 - - - - - - -Other expenses R2500 -Total expenses R2600 -
Top 5 countries (by amount of gross premiums written) - life obligations

| RSA Insurance Group plc | Solvency and Financial Condition Report 2016
Appendix 8 - 24 -
Royal & Sun Alliance Insurance plcS.12.01.02Life and Health SLT Technical Provisions
Contracts without
options and guarantees
Contracts with options or guarantees
Contracts without
options and guarantees
Contracts with
options or guarantees
C0020 C0030 C0040 C0050 C0060 C0070 C0080 C0090 C0100 C0150£'000 £'000 £'000 £'000 £'000 £'000 £'000 £'000 £'000 £'000
Technical provisions calculated as a whole R0010 - - - - - -
Total Recoverables from reinsurance/SPV and Finite Re after the adjustment for expected losses due to counterparty default associated to TP as a whole
R0020 - - - - - -
Technical provisions calculated as a sum of BE and RMBest EstimateGross Best Estimate R0030 - - - 8 - 200,604 - 200,612Total Recoverables from reinsurance/SPV and Finite Re after the adjustment for expected losses due to counterparty default
R0080 - - - - - 73,487 - 73,487
Best estimate minus recoverables from reinsurance/SPV and Finite Re - total R0090 - - - 8 - 127,117 - 127,125
Risk Margin R0100 - - - 47,264 - 47,264Amount of the transitional on Technical Provisions
Technical Provisions calculated as a whole R0110 - - - - - -Best estimate R0120 - - - - - - - -Risk margin R0130 - - - - - -
Technical provisions - total R0200 - - 8 247,868 - 247,876
Total (Life other than
health insurance, incl. Unit-Linked)
Insurance with profit
participation
Index-linked and unit-linked insurance Other life insurance Annuities stemming from
non-life insurance contracts and
relating to insurance
obligation other than health insurance
obligations
Accepted reinsurance

| RSA Insurance Group plc | Solvency and Financial Condition Report 2016
Appendix 8 - 25 -
Royal & Sun Alliance Insurance plcS.12.01.02Life and Health SLT Technical Provisions
Contracts without options
and guarantees
Contracts with
options or guarantees
C0160 C0170 C0180 C0190 C0200 C0210£'000 £'000 £'000 £'000 £'000 £'000
Technical provisions calculated as a whole R0210 - - - -
Total Recoverables from reinsurance/SPV and Finite Re after the adjustment for expected losses due to counterparty default associated to TP as a whole
R0220 - - - -
Technical provisions calculated as a sum of BE and RMBest EstimateGross Best Estimate R0030 - - 180 - 180Total Recoverables from reinsurance/SPV and Finite Re after the adjustment for expected losses due to counterparty default
R0080 - - - - -
Best estimate minus recoverables from reinsurance/SPV and Finite Re - total R0090 - - 180 - 180
Risk Margin R0100 - 2 - 2Amount of the transitional on Technical Provisions
Technical Provisions calculated as a whole R0110 - - - -Best estimate R0120 - - - - -Risk margin R0130 - - - -
Technical provisions - total R0200 - 182 - 182
Health insurance (direct business) Annuities stemming
from non-life insurance
contracts and relating to
health insurance
obligations
Health reinsurance (reinsurance
accepted)
Total (Health
similar to life
insurance)

| RSA Insurance Group plc | Solvency and Financial Condition Report 2016
Appendix 8 - 26 -
Royal & Sun Alliance Insurance plcS.17.01.02Non-life Technical Provisions
Medical expense
insurance
Income protectioninsurance
Workers' compensation
insurance
Motor vehicle liability
insurance
Other motor insurance
Marine, aviation and
transport insurance
Fire and other damage to property insurance
General liability
insurance
Credit and suretyship insurance
C0020 C0030 C0040 C0050 C0060 C0070 C0080 C0090 C0100£'000 £'000 £'000 £'000 £'000 £'000 £'000 £'000 £'000
Technical provisions calculated as a whole R0010 - - - - - - - - -Total Recoverables from reinsurance/SPV and Finite Re after the adjustment for expected losses due to counterparty default associated to TP as a whole
R0050 - - - - - - - - -
Technical provisions calculated as a sum of BE and RM
Best estimatePremium provisionsGross R0060 100,908 563 234 128,993 38,838 41,599 358,471 108,461 316
Total recoverable from reinsurance/SPV and Finite Re after the adjustment for expected losses due to counterparty default R0140 - - - 4,870 (2,644) (11,756) (8,035) 17,040 -
Net Best Estimate of Premium Provisions R0150 100,908 563 234 124,123 41,482 53,355 366,506 91,421 316Claims provisionsGross R0160 29,037 472 - 1,252,802 (15,790) 420,436 718,189 2,019,111 5,492
Total recoverable from reinsurance/SPV and Finite Re after the adjustment for expected losses due to counterparty default R0240 9 - - 354,834 5,280 82,652 243,551 238,047 1,106
Net Best Estimate of Claims Provisions R0250 29,028 472 - 897,968 (21,070) 337,784 474,638 1,781,064 4,386Total Best estimate - gross R0260 129,945 1,035 234 1,381,795 23,048 462,035 1,076,660 2,127,572 5,808Total Best estimate - net R0270 129,936 1,035 234 1,022,091 20,412 391,139 841,144 1,872,485 4,702Risk margin R0280 1,406 22 2 78,730 1,026 9,794 13,083 211,494 102Amount of the transitional on Technical ProvisionsTechnical Provisions calculated as a whole R0290 - - - - - - - - -Best estimate R0300 - - - - - - - - -Risk margin R0310 - - - - - - - - -Technical provisions - totalTechnical provisions - total R0320 131,351 1,057 236 1,460,525 24,074 471,829 1,089,743 2,339,066 5,910Recoverable from reinsurance contract/SPV and Finite Re after the adjustment for expected losses due to counterparty default - total
R0330 9 - - 359,704 2,636 70,896 235,516 255,087 1,106
Technical provisions minus recoverables from reinsurance/SPV and Finite Re - total R0340 131,342 1,057 236 1,100,821 21,438 400,933 854,227 2,083,979 4,804
Direct business and accepted proportional reinsurance

| RSA Insurance Group plc | Solvency and Financial Condition Report 2016
Appendix 8 - 27 -
Royal & Sun Alliance Insurance plcS.17.01.02Non-life Technical Provisions
Legal expenses insurance Assistance Miscellaneous
financial loss
Non-proportional
health reinsurance
Non-proportional
casualty reinsurance
Non-proportional
marine, aviation and
transport reinsurance
Non-proportional
property reinsurance
C0110 C0120 C0130 C0140 C0150 C0160 C0170 C0180£'000 £'000 £'000 £'000 £'000 £'000 £'000 £'000
Technical provisions calculated as a whole R0010 - - - - - - - -Total Recoverables from reinsurance/SPV and Finite Re after the adjustment for expected losses due to counterparty default associated to TP as a whole
R0050 - - - - - - - -
Technical provisions calculated as a sum of BE and RM
Best estimatePremium provisionsGross R0060 3,309 2,953 10,544 - 7 - 9 795,205
Total recoverable from reinsurance/SPV and Finite Re after the adjustment for expected losses due to counterparty default R0140 131 52 90 - - - - (252)
Net Best Estimate of Premium Provisions R0150 3,178 2,901 10,454 - 7 - 9 795,457Claims provisionsGross R0160 2,309 855 15,954 - 250,200 - - 4,699,067
Total recoverable from reinsurance/SPV and Finite Re after the adjustment for expected losses due to counterparty default R0240 342 - 369 - - - - 926,190
Net Best Estimate of Claims Provisions R0250 1,967 855 15,585 - 250,200 - - 3,772,877Total Best estimate - gross R0260 5,618 3,808 26,498 - 250,207 - 9 5,494,272Total Best estimate - net R0270 5,145 3,756 26,039 - 250,207 - 9 4,568,334Risk margin R0280 148 41 596 - 10,752 - - 327,196Amount of the transitional on Technical ProvisionsTechnical Provisions calculated as a whole R0290 - - - - - - - -Best estimate R0300 - - - - - - - -Risk margin R0310 - - - - - - - -Technical provisions - totalTechnical provisions - total R0320 5,766 3,849 27,094 - 260,959 - 9 5,821,468Recoverable from reinsurance contract/SPV and Finite Re after the adjustment for expected losses due to counterparty default - total
R0330 473 52 459 - - - - 925,938
Technical provisions minus recoverables from reinsurance/SPV and Finite Re - total R0340 5,293 3,797 26,635 - 260,959 - 9 4,895,530
Accepted non-proportional reinsurance
Total Non-Life obligation
Direct business and accepted proportional reinsurance

| RSA Insurance Group plc | Solvency and Financial Condition Report 2016
Appendix 8 - 28 -
Royal & Sun Alliance Insurance plcS.19.01.21Non-life Insurance Claims Information
Total Non-Life Business
Z0010 Accident Year
Gross Claims Paid (non-cumulative)(absolute amount)
Year 0 1 2 3 4 5 6 7 8 9 10 & +C0010 C0020 C0030 C0040 C0050 C0060 C0070 C0080 C0090 C0100 C0110 C0170 C0180£'000 £'000 £'000 £'000 £'000 £'000 £'000 £'000 £'000 £'000 £'000 £'000 £'000
Prior R0100 105,172 R0100 105,172 105,172N-9 R0160 765,827 511,354 187,212 128,666 81,289 62,756 37,904 22,065 8,347 5,399 R0160 5,399 1,810,819N-8 R0170 773,747 532,727 167,934 124,385 107,431 59,751 32,925 16,725 7,600 R0170 7,600 1,823,225N-7 R0180 815,856 499,963 180,995 128,356 105,492 94,189 37,749 18,473 R0180 18,473 1,881,073N-6 R0190 917,108 658,894 173,454 141,056 110,605 53,676 24,092 R0190 24,092 2,078,885N-5 R0200 944,334 473,257 231,928 135,233 93,985 43,875 R0200 43,875 1,922,612N-4 R0210 1,022,025 631,994 223,273 108,411 67,225 R0210 67,225 2,052,928N-3 R0220 951,827 593,810 198,430 97,991 R0220 97,991 1,842,058N-2 R0230 940,003 586,798 164,534 R0230 164,534 1,691,335N-1 R0240 917,956 662,331 R0240 662,331 1,580,287N R0250 959,363 R0250 959,363 959,363
Total R0260 2,156,055 17,747,757Gross undiscounted Best Estimate Claims Provisions(absolute amount)
Year - 1 2 3 4 5 6 7 8 9 10 & +C0200 C0210 C0220 C0230 C0240 C0250 C0260 C0270 C0280 C0290 C0300 C0360£'000 £'000 £'000 £'000 £'000 £'000 £'000 £'000 £'000 £'000 £'000 £'000
Prior R0100 1,255,978 R0100 1,171,100N-9 R0160 - - - - - - - - - 18,851 R0160 18,482N-8 R0170 - - - - - - - - 39,352 R0170 37,089N-7 R0180 - - - - - - - 76,918 R0180 73,819N-6 R0190 - - - - - - 60,205 R0190 59,137N-5 R0200 - - - - - 119,608 R0200 116,362N-4 R0210 - - - - 222,732 R0210 215,971N-3 R0220 - - - 382,362 R0220 369,676N-2 R0230 - - 556,582 R0230 533,464N-1 R0240 - 946,474 R0240 914,384N R0250 1,251,866 R0250 1,189,583
Total R0260 4,699,067
Sum of years (cumulative)
Year end (discounted
Accident year / Underwriting year
Development year
Development year In Current year

| RSA Insurance Group plc | Solvency and Financial Condition Report 2016
Appendix 8 - 29 -
Royal & Sun Alliance Insurance plcS.23.01.01Own funds
Total Tier 1 - unrestricted
Tier 1 - restricted Tier 2 Tier 3
C0010 C0020 C0030 C0040 C0050£'000 £'000 £'000 £'000 £'000
Basic own funds before deduction for participations in other financial sector as foreseen in article 68 of Delegated Regulation (EU) 2015/35
Ordinary share capital (gross of own shares) R0010 1,214,953 1,214,953 -Share premium account related to ordinary share capital R0030 2,954,183 2,241,358 712,825Iinitial funds, members' contributions or the equivalent basic own - fund item for mutual and mutual-type undertakings R0040 - - -Subordinated mutual member accounts R0050 - - - -Surplus funds R0070 - -Preference shares R0090 - - - -Share premium account related to preference shares R0110 - - - -
Reconciliation reserve R0130 (1,501,115) (1,501,115)Subordinated liabilities R0140 415,972 380,625 35,347 -An amount equal to the value of net deferred tax assets R0160 214,858 214,858Other own fund items approved by the supervisory authority as basic own funds not specified above R0180 - - - - -
Own funds from the financial statements that should not be represented by the reconciliation reserve and do not meet the criteria to be classified as Solvency II own funds
Own funds from the financial statements that should not be represented by the reconciliation reserve and do not meet the criteria to be classified as Solvency II own funds R0220 -
DeductionsDeductions for participations in financial and credit institutions R0230 - - - -
Total basic own funds after deductions R0290 3,298,851 1,955,196 380,625 748,172 214,858

| RSA Insurance Group plc | Solvency and Financial Condition Report 2016
Appendix 8 - 30 -
Royal & Sun Alliance Insurance plcS.23.01.01Own funds
Total Tier 1 - unrestricted
Tier 1 - restricted Tier 2 Tier 3
C0010 C0020 C0030 C0040 C0050£'000 £'000 £'000 £'000 £'000
Ancillary own fundsUnpaid and uncalled ordinary share capital callable on demand R0300 - -Unpaid and uncalled initial funds, members' contributions or the equivalent basic own fund item for mutual and mutual - type undertakings, callable on demand R0310 - -
Unpaid and uncalled preference shares callable on demand R0320 - - -A legally binding commitment to subscribe and pay for subordinated liabilities on demand R0330 - - -Letters of credit and guarantees under Article 96(2) of the Directive 2009/138/EC R0340 - -Letters of credit and guarantees other than under Article 96(2) of the Directive 2009/138/EC R0350 - - -Supplementary members calls under first subparagraph of Article 96(3) of the Directive 2009/138/EC R0360 - -Supplementary members calls - other than under first subparagraph of Article 96(3) of the Directive 2009/138/EC R0370 - - -Other ancillary own funds R0390 - - -
Total ancillary own funds R0400 - - -Available and eligible own funds
Total available own funds to meet the SCR R0500 3,298,851 1,955,196 380,625 748,172 214,858Total available own funds to meet the MCR R0510 3,083,993 1,955,196 380,625 748,172Total eligible own funds to meet the SCR R0540 3,232,547 1,955,196 380,625 748,172 148,554Total eligible own funds to meet the MCR R0550 2,478,383 1,955,196 380,625 142,562
SCR R0580 1,793,452MCR R0600 712,812Ratio of Eligible own funds to SCR R0620 180.24%Ratio of Eligible own funds to MCR R0640 347.69%
C0060£'000
Reconciliation reserveExcess of assets over liabilities R0700 2,882,879Own shares (held directly and indirectly) R0710 -Foreseeable dividends, distributions and charges R0720 -Other basic own fund items R0730 4,383,994Adjustment for restricted own fund items in respect of matching adjustment portfolios and ring fenced funds R0740 -
Reconciliation reserve R0760 (1,501,115)Expected profits
Expected profits included in future premiums (EPIFP) - Life business R0770 -Expected profits included in future premiums (EPIFP) - Non- life business R0780 15,616
Total Expected profits included in future premiums (EPIFP) R0790 15,616

| RSA Insurance Group plc | Solvency and Financial Condition Report 2016
Appendix 8 - 31 -
Royal & Sun Alliance Insurance plcS.25.03.21Solvency Capital Requirement - for undertakings on Full Internal Models
Unique number of component Components descriptionCalculation of the Solvency Capital
RequirementC0010 C0020 C0030
£'00010000A Market and credit risk combined (excluding currency risk) - Expectation (47,909)10000B Market and credit risk combined (excluding currency risk) - Movement from Expectation 562,68310900A Market Risk: Group Currency Risk - Expectation (3,248)10900B Market Risk: Group Currency Risk - Movement from Expectation 99,39450150A Total underwriting risk - Expectation (493,203)50150B Total underwriting risk - Movement from Expectation 584,63050310A Catastrophe Risk - Expectation 216,30150310B Catastrophe Risk - Movement from Expectation 297,0745021IA Legacy risk - Expectation (4,774)5021IB Legacy risk - Movement from Expectation 432,55850210A Total reserve risk - Expectation (30,015)50210B Total reserve risk - Movement from Expectation 545,43070100B Operational risk - Movement from Expectation 301,00080100A Other risks (excluding pension risk) - Expectation 358,36480100B Other risks (excluding pension risk) - Movement from Expectation (67,153)80110A Other risks: Pension Risk - Expectation 29,23480110B Other risks: Pension Risk - Movement from Expectation 774,937
Calculation of Solvency Capital Requirement C0100£'000
Total undiversified components R0110 3,555,303Diversification R0060 (1,761,851)
Capital requirement for business operated in accordance with Art. 4 of Directive 2003/41/EC (transitional) R0160 -
Solvency capital requirement excluding capital add-on R0200 1,793,452Capital add-ons already set R0210 -Solvency capital requirement R0220 1,793,452Other information on SCRAmount/estimate of the overall loss-absorbing capacity of technical provisions R0300 -Amount/estimate of the overall loss-absorbing capacity ot deferred taxes R0310 -Total amount of Notional Solvency Capital Requirements for remaining part R0410 -Total amount of Notional Solvency Capital Requirements for ring fenced funds (other than those related to business operated in accordance with Art. 4 of Directive 2003/41/EC (transitional)) R0420 -
Total amount of Notional Solvency Capital Requirement for matching adjustment portfolios R0430 -Diversification effects due to RFF nSCR aggregation for article 304 R0440 -

| RSA Insurance Group plc | Solvency and Financial Condition Report 2016
Appendix 8 - 32 -
Royal & Sun Alliance Insurance plcS.28.01.01Minimum Capital Requirement - Only life or only non-life insurance or reinsurance activity
Linear formula component for non-life insurance and reinsurance obligations
C0010£'000
MCRNL Result R0010 710,138Net (of
reinsurance/SPV) best estimate and TP
calculated as a whole
Net (of reinsurance)
written premiums in the last 12
monthsC0020 C0030£'000 £'000
R0020 129,937 278,936Income protection insurance and proportional reinsurance R0030 1,035 1,190Workers' compensation insurance and proportional reinsurance R0040 234 -Motor vehicle liability insurance and proportional reinsurance R0050 1,022,091 397,682Other motor insurance and proportional reinsurance R0060 20,411 213,548Marine, aviation and transport insurance and proportional reinsurance R0070 391,138 320,701Fire and other damage to property insurance and proportional reinsurance R0080 841,145 1,164,292General liability insurance and proportional reinsurance R0090 1,872,485 336,469Credit and suretyship insurance and proportional reinsurance R0100 4,702 1,914Legal expenses insurance and proportional reinsurance R0110 5,145 8,358Assistance and proportional reinsurance R0120 3,756 14,917Miscellaneous financial loss insurance and proportional reinsurance R0130 26,039 39,369Non-proportional health reinsurance R0140 - -Non-proportional casualty reinsurance R0150 250,207 -Non-proportional marine, aviation and transport reinsurance R0160 - -Non-proportional property reinsurance R0170 9 -
Medical expense insurance and proportional reinsurance

| RSA Insurance Group plc | Solvency and Financial Condition Report 2016
Appendix 8 - 33 -
Royal & Sun Alliance Insurance plcS.28.01.01Minimum Capital Requirement - Only life or only non-life insurance or reinsurance activity
Linear formula component for life insurance and reinsurance obligationsC0040£'000
MCRL Result R0200 2,673Net (of
reinsurance/SPV) best estimate and TP
calculated as a whole
Net (of reinsurance/SPV) total capital at risk
C0050 C0060£'000 £'000
Obligations with profit participation - guaranteed benefits R0210 -Obligations with profit participation - future discretionary benefits R0220 -Index-linked and unit-linked insurance obligations R0230 -Other life (re)insurance and health (re)insurance obligations R0240 127,305Total capital at risk for all life (re)insurance obligations R0250 -
Overall MCR calculationC0070£'000
Linear MCR R0300 712,812SCR R0310 1,793,452MCR cap R0320 807,054MCR floor R0330 448,363Combined MCR R0340 712,812Absolute floor of the MCR R0350 2,732
Minimum Capital Requirement R0400 712,812

| RSA Insurance Group plc | Solvency and Financial Condition Report 2016
Appendix 8 - 34 -
Royal & Sun Alliance Reinsurance LimitedS.02.01.02Balance sheet
Solvency II value
Solvency II value
Assets C0010 Liabilities C0010£'000 £'000
Intangible assets R0030 - Technical provisions – non-life R0510 356,056Deferred tax assets R0040 - Technical provisions – non-life (excluding health) R0520 356,056Pension benefit surplus R0050 - TP calculated as a whole R0530 -Property, plant & equipment held for own use R0060 - Best Estimate R0540 353,934Investments (other than assets held for index-linked and unit-linked contracts) R0070 44,231 Risk margin R0550 2,122
Property (other than for own use) R0080 - Technical provisions - health (similar to non-life) R0560 -Holdings in related undertakings, including participations R0090 - TP calculated as a whole R0570 -Equities R0100 - Best Estimate R0580 -
Equities - listed R0110 - Risk margin R0590 -Equities - unlisted R0120 - Technical provisions - life (excluding index-linked and unit-linked) R0600 -
Bonds R0130 18,327 Technical provisions - health (similar to life) R0610 -Government Bonds R0140 14,771 TP calculated as a whole R0620 -Corporate Bonds R0150 3,556 Best Estimate R0630 -Structured notes R0160 - Risk margin R0640 -Collateralised securities R0170 - Technical provisions – life (excluding health and index-linked and unit-linked) R0650 -
Collective Investments Undertakings R0180 25,904 TP calculated as a whole R0660 -Derivatives R0190 - Best Estimate R0670 -Deposits other than cash equivalents R0200 - Risk margin R0680 -Other investments R0210 - Technical provisions – index-linked and unit-linked R0690 -
Assets held for index-linked and unit-linked contracts R0220 - TP calculated as a whole R0700 -Loans and mortgages R0230 - Best Estimate R0710 -
Loans on policies R0240 - Risk margin R0720 - Loans and mortgages to individuals R0250 - Contingent liabilities R0740 - Other loans and mortgages R0260 - Provisions other than technical provisions R0750 -Reinsurance recoverables from: R0270 351,410 Pension benefit obligations R0760 -
Non-life and health similar to non-life R0280 351,410 Deposits from reinsurers R0770 -Non-life excluding health R0290 351,410 Deferred tax liabilities R0780 -Health similar to non-life R0300 - Derivatives R0790 -
Life and health similar to life, excluding health and index-linked and unit-linked R0310 - Debts owed to credit institutions R0800 -Health similar to life R0320 - Financial liabilities other than debts owed to credit institutions R0810 -Life excluding health and index-linked and unit-linked R0330 - Insurance & intermediaries payables R0820 2,914
Life index-linked and unit-linked R0340 - Reinsurance payables R0830 27,981Deposits to cedants R0350 - Payables (trade, not insurance) R0840 80,374Insurance and intermediaries receivables R0360 36,328 Subordinated liabilities R0850 -Reinsurance receivables R0370 11,625 Subordinated liabilities not in BOF R0860 -Receivables (trade, not insurance) R0380 107,299 Subordinated liabilities in BOF R0870 -Own shares (held directly) R0390 - Any other liabilities, not elsewhere shown R0880 1,102Amounts due in respect of own fund items or initial fund called up but not yet paid in R0400 - Total liabilities R0900 468,427Cash and cash equivalents R0410 2,532 Excess of assets over liabilities R1000 84,998Any other assets, not elsewhere shown R0420 -Total assets R0500 553,425

| RSA Insurance Group plc | Solvency and Financial Condition Report 2016
Appendix 8 - 35 -
Royal & Sun Alliance Reinsurance LimitedS.05.01.02Premiums, claims and expenses by line of business
Medical expense
insurance
Income protection insurance
Workers' compensation
insurance
Motor vehicle liability
insurance
Other motor insurance
Marine, aviation and transport insurance
Fire and other damage to property insurance
General liability
insurance
Credit and suretyship insurance
C0010 C0020 C0030 C0040 C0050 C0060 C0070 C0080 C0090
£'000 £'000 £'000 £'000 £'000 £'000 £'000 £'000 £'000Premiums written Gross - Direct Business R0110 - - - - - - - - - Gross - Proportional reinsurance accepted R0120 - - - 358 154 21,509 165,620 32,519 - Gross - Non-proportional reinsurance accepted R0130 Reinsurers' share R0140 - - - 358 154 21,509 165,620 32,519 - Net R0200 - - - - - - - - -Premiums earned Gross - Direct Business R0210 - - - - - - - - - Gross - Proportional reinsurance accepted R0220 - - - 316 136 25,378 163,529 33,209 - Gross - Non-proportional reinsurance accepted R0230 Reinsurers' share R0240 - - - 316 136 25,378 163,529 33,209 - Net R0300 - - - - - - - - -Claims incurred Gross - Direct Business R0310 - - - - - - - - - Gross - Proportional reinsurance accepted R0320 - - - 70 30 14,677 101,641 3,545 - Gross - Non-proportional reinsurance accepted R0330 Reinsurers' share R0340 - - - 70 30 14,677 101,641 3,545 - Net R0400 - - - - - - - - -Changes in other technical provisions Gross - Direct Business R0410 - - - - - - - - - Gross - Proportional reinsurance accepted R0420 - - - - - - - - - Gross - Non- proportional reinsurance accepted R0430 Reinsurers'share R0440 - - - - - - - - - Net R0500 - - - - - - - - -Expenses incurred R0550 - - - - - - - - -Other expenses R1200Total expenses R1300
Line of Business for: non-life insurance and reinsurance obligations (direct business and accepted proportional reinsurance)

| RSA Insurance Group plc | Solvency and Financial Condition Report 2016
Appendix 8 - 36 -
Royal & Sun Alliance Reinsurance LimitedS.05.01.02Premiums, claims and expenses by line of business
Legal expenses insurance
Assistance Miscellaneous financial loss Health Casualty Marine, aviation,
transport Property
C0100 C0110 C0120 C0130 C0140 C0150 C0160 C0200
£'000 £'000 £'000 £'000 £'000 £'000 £'000 £'000Premiums written Gross - Direct Business R0110 - - - - Gross - Proportional reinsurance accepted R0120 - - - 220,160 Gross - Non-proportional reinsurance accepted R0130 - 11,376 3,573 13,476 28,426 Reinsurers' share R0140 - - - - 11,376 3,573 13,476 248,586 Net R0200 - - - - - - - -Premiums earned Gross - Direct Business R0210 - - - - Gross - Proportional reinsurance accepted R0220 - - - 222,568 Gross - Non-proportional reinsurance accepted R0230 - 11,376 3,569 14,438 29,383 Reinsurers' share R0240 - - - - 11,376 3,569 14,438 251,951 Net R0300 - - - - - - - -Claims incurred Gross - Direct Business R0310 - - - - Gross - Proportional reinsurance accepted R0320 - - - 119,963 Gross - Non-proportional reinsurance accepted R0330 - 7,637 11,359 14,500 33,495 Reinsurers' share R0340 - - - - 7,637 11,359 14,500 153,458 Net R0400 - - - - - - - -Changes in other technical provisions Gross - Direct Business R0410 - - - - Gross - Proportional reinsurance accepted R0420 - - - - Gross - Non- proportional reinsurance accepted R0430 - - - - - Reinsurers'share R0440 - - - - - - - - Net R0500 - - - - - - - -Expenses incurred R0550 - - - - (161) (264) (289) (714)Other expenses R1200 -Total expenses R1300 (714)
Line of business for:accepted non-proportional reinsurance
Total
Line of Business for: non-life insurance and reinsurance obligations (direct business and accepted proportional reinsurance)

| RSA Insurance Group plc | Solvency and Financial Condition Report 2016
Appendix 8 - 37 -
Royal & Sun Alliance Reinsurance LimitedS.05.01.02Premiums, claims and expenses by line of business
Total
Health insurance
Insurance with profit
participation
Index-linked and unit-linked
insurance
Other life insurance
Annuities stemming from
non-life insurance
contracts and relating to health
insurance obligations
Annuities stemming from non-life
insurance contracts and relating to
insurance obligations other than health
insurance obligations
Health reinsurance
Life reinsurance
C0210 C0220 C0230 C0240 C0250 C0260 C0270 C0280 C0300£'000 £'000 £'000 £'000 £'000 £'000 £'000 £'000 £'000
Premiums written Gross R1410 - - - - - - - - - Reinsurers' share R1420 - - - - - - - - - Net R1500 - - - - - - - - -Premiums earned Gross R1510 - - - - - - - - - Reinsurers' share R1520 - - - - - - - - - Net R1600 - - - - - - - - -Claims incurred Gross R1610 - - - - - - - - - Reinsurers' share R1620 - - - - - - - - - Net R1700 - - - - - - - - -Changes in other technical provisions Gross R1710 - - - - - - - - - Reinsurers' share R1720 - - - - - - - - - Net R1800 - - - - - - - - -Expenses incurred R1900 - - - - - - - - -Other expenses R2500 -Total expenses R2600 -
Life reinsurance obligationsLine of Business for: life insurance obligations

| RSA Insurance Group plc | Solvency and Financial Condition Report 2016
Appendix 8 - 38 -
Royal & Sun Alliance Reinsurance LimitedS.05.02.01Premiums, claims and expenses by country
Home CountryTotal Top 5 and home country
C0010 C0020 C0030 C0040 C0050 C0060 C0070R0010 US CA MX DE FR
C0080 C0090 C0100 C0110 C0120 C0130 C0140£'000 £'000 £'000 £'000 £'000 £'000 £'000
Premiums written Gross - Direct Business R0110 - - - - - - - Gross - Proportional reinsurance accepted R0120 12,997 54,930 7,391 18,929 11,389 8,449 114,085 Gross - Non-proportional reinsurance accepted R0130 12,359 - 12,934 (254) - - 25,039 Reinsurers' share R0140 25,356 54,930 20,325 18,675 11,389 8,449 139,124 Net R0200 - - - - - - -Premiums earned Gross - Direct Business R0210 - - - - - - - Gross - Proportional reinsurance accepted R0220 15,090 54,302 8,224 17,432 10,986 7,874 113,908 Gross - Non-proportional reinsurance accepted R0230 12,359 - 12,934 (259) - - 25,034 Reinsurers' share R0240 27,449 54,302 21,158 17,173 10,986 7,874 138,942 Net R0300 - - - - - - -Claims incurred Gross - Direct Business R0310 - - - - - - - Gross - Proportional reinsurance accepted R0320 6,740 4,801 3,126 19,658 2,118 (3,657) 32,786 Gross - Non-proportional reinsurance accepted R0330 17,762 - 12,093 (212) - - 29,643 Reinsurers' share R0340 24,502 4,801 15,219 19,446 2,118 (3,657) 62,429 Net R0400 - - - - - - -Changes in other technical provisions Gross - Direct Business R0410 - - - - - - - Gross - Proportional reinsurance accepted R0420 - - - - - - - Gross - Non- proportional reinsurance accepted R0430 - - - - - - - Reinsurers'share R0440 - - - - - - - Net R0500 - - - - - - -Expenses incurred R0550 (440) - (254) 4 - - (690)Other expenses R1200 -Total expenses R1300 (690)
Top 5 countries (by amount of gross premiums written) - non-life obligations

| RSA Insurance Group plc | Solvency and Financial Condition Report 2016
Appendix 8 - 39 -
Royal & Sun Alliance Reinsurance LimitedS.05.02.01Premiums, claims and expenses by country
Home CountryTotal Top 5 and home country
C0150 C0160 C0170 C0180 C0190 C0200 C0210R1400 US CA MX DE FR
C0220 C0230 C0240 C0250 C0260 C0270 C0280£'000 £'000 £'000 £'000 £'000 £'000 £'000
Premiums written Gross R1410 - - - - - - - Reinsurers' share R1420 - - - - - - - Net R1500 - - - - - - -Premiums earned Gross R1510 - - - - - - - Reinsurers' share R1520 - - - - - - - Net R1600 - - - - - - -Claims incurred Gross R1610 - - - - - - - Reinsurers' share R1620 - - - - - - - Net R1700 - - - - - - -Changes in other technical provisions Gross R1710 - - - - - - - Reinsurers' share R1720 - - - - - - - Net R1800 - - - - - - -Expenses incurred R1900 - - - - - - -Other expenses R2500 -Total expenses R2600 -
Top 5 countries (by amount of gross premiums written) - life obligations

| RSA Insurance Group plc | Solvency and Financial Condition Report 2016
Appendix 8 - 40 -
Royal & Sun Alliance Reinsurance LimitedS.17.01.02Non-life Technical Provisions
Medical expense
insurance
Income protectioninsurance
Workers' compensation
insurance
Motor vehicle liability
insurance
Other motor insurance
Marine, aviation and
transport insurance
Fire and other damage to property insurance
General liability
insurance
Credit and suretyship insurance
C0020 C0030 C0040 C0050 C0060 C0070 C0080 C0090 C0100£'000 £'000 £'000 £'000 £'000 £'000 £'000 £'000 £'000
Technical provisions calculated as a whole R0010 - - - - - - - - -Total Recoverables from reinsurance/SPV and Finite Re after the adjustment for expected losses due to counterparty default associated to TP as a whole
R0050 - - - - - - - - -
Technical provisions calculated as a sum of BE and RM
Best estimatePremium provisionsGross R0060 - - - 63 36 3,922 26,120 8,505 -
Total recoverable from reinsurance/SPV and Finite Re after the adjustment for expected losses due to counterparty default R0140 - - - 62 35 3,835 25,722 8,343 -
Net Best Estimate of Premium Provisions R0150 - - - 1 1 87 398 162 -Claims provisionsGross R0160 - - - 2,894 1,240 22,658 137,171 98,649 -
Total recoverable from reinsurance/SPV and Finite Re after the adjustment for expected losses due to counterparty default R0240 - - - 2,865 1,245 24,029 135,640 97,579 -
Net Best Estimate of Claims Provisions R0250 - - - 29 (5) (1,371) 1,531 1,070 -Total Best estimate - gross R0260 - - - 2,957 1,276 26,580 163,291 107,154 -Total Best estimate - net R0270 - - - 30 (4) (1,284) 1,929 1,232 -Risk margin R0280 - - - 22 7 831 346 597 -Amount of the transitional on Technical ProvisionsTechnical Provisions calculated as a whole R0290 - - - - - - - - -Best estimate R0300 - - - - - - - - -Risk margin R0310 - - - - - - - - -Technical provisions - totalTechnical provisions - total R0320 - - - 2,979 1,283 27,411 163,637 107,751 -Recoverable from reinsurance contract/SPV and Finite Re after the adjustment for expected losses due to counterparty default - total
R0330 - - - 2,927 1,280 27,864 161,362 105,922 -
Technical provisions minus recoverables from reinsurance/SPV and Finite Re - total R0340 - - - 52 3 (453) 2,275 1,829 -
Direct business and accepted proportional reinsurance

| RSA Insurance Group plc | Solvency and Financial Condition Report 2016
Appendix 8 - 41 -
Royal & Sun Alliance Reinsurance LimitedS.17.01.02Non-life Technical Provisions
Legal expenses insurance Assistance Miscellaneous
financial loss
Non-proportional
health reinsurance
Non-proportional
casualty reinsurance
Non-proportional
marine, aviation and
transport reinsurance
Non-proportional
property reinsurance
C0110 C0120 C0130 C0140 C0150 C0160 C0170 C0180£'000 £'000 £'000 £'000 £'000 £'000 £'000 £'000
Technical provisions calculated as a whole R0010 - - - - - - - -Total Recoverables from reinsurance/SPV and Finite Re after the adjustment for expected losses due to counterparty default associated to TP as a whole
R0050 - - - - - - - -
Technical provisions calculated as a sum of BE and RM
Best estimatePremium provisionsGross R0060 - - - - - - 639 39,285
Total recoverable from reinsurance/SPV and Finite Re after the adjustment for expected losses due to counterparty default R0140 - - - - (178) 50 667 38,536
Net Best Estimate of Premium Provisions R0150 - - - - 178 (50) (28) 749Claims provisionsGross R0160 - - - - 7,622 12,897 31,518 314,649
Total recoverable from reinsurance/SPV and Finite Re after the adjustment for expected losses due to counterparty default R0240 - - - - 7,546 12,768 31,202 312,874
Net Best Estimate of Claims Provisions R0250 - - - - 76 129 316 1,775Total Best estimate - gross R0260 - - - - 7,622 12,897 32,157 353,934Total Best estimate - net R0270 - - - - 254 79 288 2,524Risk margin R0280 - - - - 34 75 210 2,122Amount of the transitional on Technical ProvisionsTechnical Provisions calculated as a whole R0290 - - - - - - - -Best estimate R0300 - - - - - - - -Risk margin R0310 - - - - - - - -Technical provisions - totalTechnical provisions - total R0320 - - - - 7,656 12,972 32,367 356,056Recoverable from reinsurance contract/SPV and Finite Re after the adjustment for expected losses due to counterparty default - total
R0330 - - - - 7,368 12,818 31,869 351,410
Technical provisions minus recoverables from reinsurance/SPV and Finite Re - total R0340 - - - - 288 154 498 4,646
Accepted non-proportional reinsurance
Total Non-Life obligation
Direct business and accepted proportional reinsurance

| RSA Insurance Group plc | Solvency and Financial Condition Report 2016
Appendix 8 - 42 -
Royal & Sun Alliance Reinsurance LimitedS.19.01.21Non-life Insurance Claims Information
Total Non-Life Business
Z0010 Accident Year
Gross Claims Paid (non-cumulative)(absolute amount)
Year 0 1 2 3 4 5 6 7 8 9 10 & +C0010 C0020 C0030 C0040 C0050 C0060 C0070 C0080 C0090 C0100 C0110 C0170 C0180£'000 £'000 £'000 £'000 £'000 £'000 £'000 £'000 £'000 £'000 £'000 £'000 £'000
Prior R0100 1,500 R0100 1,500 1,500N-9 R0160 22,178 87,954 20,072 6,348 10,897 1,279 8,901 1,574 2,676 665 R0160 665 162,544N-8 R0170 37,132 92,312 25,139 6,390 3,810 9,237 3,899 3,902 1,056 R0170 1,056 182,877N-7 R0180 32,524 31,157 22,267 16,022 7,579 2,981 1,710 (1,764) R0180 (1,764) 112,476N-6 R0190 53,048 93,336 18,767 11,501 7,082 6,192 1,279 R0190 1,279 191,205N-5 R0200 60,700 78,300 41,831 7,612 2,364 1,207 R0200 1,207 192,014N-4 R0210 44,239 62,800 19,148 9,225 2,269 R0210 2,269 137,681N-3 R0220 32,828 48,438 24,450 5,142 R0220 5,142 110,858N-2 R0230 50,654 71,742 38,833 R0230 38,833 161,229N-1 R0240 22,085 60,162 R0240 60,162 82,247N R0250 28,448 R0250 28,448 28,448
Total R0260 138,797 1,363,079Gross undiscounted Best Estimate Claims Provisions(absolute amount)
Year 0 1 2 3 4 5 6 7 8 9 10 & +C0200 C0210 C0220 C0230 C0240 C0250 C0260 C0270 C0280 C0290 C0300 C0360£'000 £'000 £'000 £'000 £'000 £'000 £'000 £'000 £'000 £'000 £'000 £'000
Prior R0100 12,551 R0100 12,526N-9 R0160 - - - - - - - - - 5,863 R0160 5,858N-8 R0170 - - - - - - - - 8,344 R0170 8,302N-7 R0180 - - - - - - - 10,893 R0180 10,765N-6 R0190 - - - - - - 25,661 R0190 25,439N-5 R0200 - - - - - 7,832 R0200 7,765N-4 R0210 - - - - 20,996 R0210 20,823N-3 R0220 - - - 14,670 R0220 14,455N-2 R0230 - - 15,732 R0230 15,590N-1 R0240 - 109,114 R0240 106,779N R0250 87,185 R0250 86,347
Total R0260 314,649
Sum of years (cumulative)
Year end (discounted
Accident year / Underwriting year
Development year
Development year In Current year

| RSA Insurance Group plc | Solvency and Financial Condition Report 2016
Appendix 8 - 43 -
Royal & Sun Alliance Reinsurance LimitedS.23.01.01Own funds
Total Tier 1 - unrestricted Tier 1 - restricted Tier 2 Tier 3
C0010 C0020 C0030 C0040 C0050£'000 £'000 £'000 £'000 £'000
Basic own funds before deduction for participations in other financial sector as foreseen in article 68 of Delegated Regulation (EU) 2015/35
Ordinary share capital (gross of own shares) R0010 70,000 70,000 -Share premium account related to ordinary share capital R0030 - - -Iinitial funds, members' contributions or the equivalent basic own - fund item for mutual and mutual-type undertakings R0040 - - -Subordinated mutual member accounts R0050 - - - -Surplus funds R0070 - -Preference shares R0090 - - - -Share premium account related to preference shares R0110 - - - -
Reconciliation reserve R0130 14,998 14,998Subordinated liabilities R0140 - - - -An amount equal to the value of net deferred tax assets R0160 - -Other own fund items approved by the supervisory authority as basic own funds not specified above R0180 - - - - -
Own funds from the financial statements that should not be represented by the reconciliation reserve and do not meet the criteria to be classified as Solvency II own funds
Own funds from the financial statements that should not be represented by the reconciliation reserve and do not meet the criteria to be classified as Solvency II own funds R0220 -
DeductionsDeductions for participations in financial and credit institutions R0230 - - - -
Total basic own funds after deductions R0290 84,998 84,998 - - -

| RSA Insurance Group plc | Solvency and Financial Condition Report 2016
Appendix 8 - 44 -
Royal & Sun Alliance Reinsurance LimitedS.23.01.01Own funds
Total Tier 1 - unrestricted Tier 1 - restricted Tier 2 Tier 3
C0010 C0020 C0030 C0040 C0050£'000 £'000 £'000 £'000 £'000
Ancillary own fundsUnpaid and uncalled ordinary share capital callable on demand R0300 - -Unpaid and uncalled initial funds, members' contributions or the equivalent basic own fund item for mutual and mutual - type undertakings, callable on demand R0310 - -
Unpaid and uncalled preference shares callable on demand R0320 - - -A legally binding commitment to subscribe and pay for subordinated liabilities on demand R0330 - - -Letters of credit and guarantees under Article 96(2) of the Directive 2009/138/EC R0340 - -Letters of credit and guarantees other than under Article 96(2) of the Directive 2009/138/EC R0350 - - -Supplementary members calls under first subparagraph of Article 96(3) of the Directive 2009/138/EC R0360 - -Supplementary members calls - other than under first subparagraph of Article 96(3) of the Directive 2009/138/EC R0370 - - -Other ancillary own funds R0390 - - -
Total ancillary own funds R0400 - - -Available and eligible own funds
Total available own funds to meet the SCR R0500 84,998 84,998 - - -Total available own funds to meet the MCR R0510 84,998 84,998 - -Total eligible own funds to meet the SCR R0540 84,998 84,998 - - -Total eligible own funds to meet the MCR R0550 84,998 84,998 - -
SCR R0580 8,208MCR R0600 2,732Ratio of Eligible own funds to SCR R0620 1,035.58%Ratio of Eligible own funds to MCR R0640 3,111.46%
C0060£'000
Reconciliation reserveExcess of assets over liabilities R0700 84,998Own shares (held directly and indirectly) R0710 -Foreseeable dividends, distributions and charges R0720 -Other basic own fund items R0730 70,000Adjustment for restricted own fund items in respect of matching adjustment portfolios and ring fenced funds R0740 -
Reconciliation reserve R0760 14,998Expected profits
Expected profits included in future premiums (EPIFP) - Life business R0770 -Expected profits included in future premiums (EPIFP) - Non- life business R0780 -
Total Expected profits included in future premiums (EPIFP) R0790 -

| RSA Insurance Group plc | Solvency and Financial Condition Report 2016 Appendix 8 - 45 -
Royal & Sun Alliance Reinsurance LimitedS.25.03.21Solvency Capital Requirement - for undertakings on Full Internal Models
Unique number of component Components descriptionCalculation of the Solvency Capital
RequirementC0010 C0020 C0030
£'00010300A Market Risk: interest rate risk - Expectation (48)10300B Market Risk: interest rate risk - Movement from Expectation 8071071AA Market Risk: spread risk AAA - Expectation (7)1071AB Market Risk: spread risk AAA - Movement from Expectation 641071BA Market Risk: spread risk AA - Expectation (15)1071BB Market Risk: spread risk AA - Movement from Expectation 1741071CA Market Risk: spread risk A - Expectation (45)1071CB Market Risk: spread risk A - Movement from Expectation 46010900A Market Risk: Group Currency Risk - Expectation (384)10900B Market Risk: Group Currency Risk - Movement from Expectation 3,72319900I Diversification within Market (1,447)20100A Credit Risk - Expectation 8220100B Credit Risk - Movement from Expectation 33770100B Operational Risk - Movement from Expectation 4,83080140A Other Risks: Tax - Expectation 17380140B Other Risks: Tax - Movement from Expectation (173)
Calculation of Solvency Capital Requirement C0100£'000
Total undiversified components R0110 8,531Diversification R0060 (323)
Capital requirement for business operated in accordance with Art. 4 of Directive 2003/41/EC (transitional) R0160 -
Solvency capital requirement excluding capital add-on R0200 8,208Capital add-ons already set R0210 -Solvency capital requirement R0220 8,208Other information on SCRAmount/estimate of the overall loss-absorbing capacity of technical provisions R0300 -Amount/estimate of the overall loss-absorbing capacity ot deferred taxes R0310 -Total amount of Notional Solvency Capital Requirements for remaining part R0410 -Total amount of Notional Solvency Capital Requirements for ring fenced funds (other than those related to business operated in accordance with Art. 4 of Directive 2003/41/EC (transitional)) R0420 -
Total amount of Notional Solvency Capital Requirement for matching adjustment portfolios R0430 -Diversification effects due to RFF nSCR aggregation for article 304 R0440 -

| RSA Insurance Group plc | Solvency and Financial Condition Report 2016
Appendix 8 - 46 -
Royal & Sun Alliance Reinsurance LimitedS.28.01.01Minimum Capital Requirement - Only life or only non-life insurance or reinsurance activity
Linear formula component for non-life insurance and reinsurance obligations
C0010£'000
MCRNL Result R0010 423Net (of
reinsurance/SPV) best estimate and TP
calculated as a whole
Net (of reinsurance)
written premiums in the last 12
monthsC0020 C0030£'000 £'000
R0020 - -Income protection insurance and proportional reinsurance R0030 - -Workers' compensation insurance and proportional reinsurance R0040 - -Motor vehicle liability insurance and proportional reinsurance R0050 30 -Other motor insurance and proportional reinsurance R0060 - -Marine, aviation and transport insurance and proportional reinsurance R0070 - -Fire and other damage to property insurance and proportional reinsurance R0080 1,929 -General liability insurance and proportional reinsurance R0090 1,232 -Credit and suretyship insurance and proportional reinsurance R0100 - -Legal expenses insurance and proportional reinsurance R0110 - -Assistance and proportional reinsurance R0120 - -Miscellaneous financial loss insurance and proportional reinsurance R0130 - -Non-proportional health reinsurance R0140 - -Non-proportional casualty reinsurance R0150 254 -Non-proportional marine, aviation and transport reinsurance R0160 79 -Non-proportional property reinsurance R0170 287 -
Medical expense insurance and proportional reinsurance

| RSA Insurance Group plc | Solvency and Financial Condition Report 2016
Appendix 8 - 47 -
Royal & Sun Alliance Reinsurance LimitedS.28.01.01Minimum Capital Requirement - Only life or only non-life insurance or reinsurance activity
Linear formula component for life insurance and reinsurance obligationsC0040£'000
MCRL Result R0200 -Net (of
reinsurance/SPV) best estimate and TP
calculated as a whole
Net (of reinsurance/SPV) total capital at risk
C0050 C0060£'000 £'000
Obligations with profit participation - guaranteed benefits R0210 -Obligations with profit participation - future discretionary benefits R0220 -Index-linked and unit-linked insurance obligations R0230 -Other life (re)insurance and health (re)insurance obligations R0240 -Total capital at risk for all life (re)insurance obligations R0250 -
Overall MCR calculationC0070£'000
Linear MCR R0300 423SCR R0310 8,208MCR cap R0320 3,693MCR floor R0330 2,052Combined MCR R0340 2,052Absolute floor of the MCR R0350 2,732
Minimum Capital Requirement R0400 2,732

| RSA Insurance Group plc | Solvency and Financial Condition Report 2016
Appendix 8 - 48 -
The Marine Insurance Company LimitedS.02.01.02Balance sheet
Solvency II value
Solvency II value
Assets C0010 Liabilities C0010£'000 £'000
Intangible assets R0030 - Technical provisions – non-life R0510 119,419Deferred tax assets R0040 - Technical provisions – non-life (excluding health) R0520 119,419Pension benefit surplus R0050 - TP calculated as a whole R0530 -Property, plant & equipment held for own use R0060 - Best Estimate R0540 119,013Investments (other than assets held for index-linked and unit-linked contracts) R0070 80,870 Risk margin R0550 406
Property (other than for own use) R0080 - Technical provisions - health (similar to non-life) R0560 -Holdings in related undertakings, including participations R0090 - TP calculated as a whole R0570 -Equities R0100 - Best Estimate R0580 -
Equities - listed R0110 - Risk margin R0590 -Equities - unlisted R0120 - Technical provisions - life (excluding index-linked and unit-linked) R0600 -
Bonds R0130 80,870 Technical provisions - health (similar to life) R0610 -Government Bonds R0140 44,211 TP calculated as a whole R0620 -Corporate Bonds R0150 36,659 Best Estimate R0630 -Structured notes R0160 - Risk margin R0640 -Collateralised securities R0170 - Technical provisions – life (excluding health and index-linked and unit-linked) R0650 -
Collective Investments Undertakings R0180 - TP calculated as a whole R0660 -Derivatives R0190 - Best Estimate R0670 -Deposits other than cash equivalents R0200 - Risk margin R0680 -Other investments R0210 - Technical provisions – index-linked and unit-linked R0690 -
Assets held for index-linked and unit-linked contracts R0220 - TP calculated as a whole R0700 -Loans and mortgages R0230 16,689 Best Estimate R0710 -
Loans on policies R0240 - Risk margin R0720 - Loans and mortgages to individuals R0250 - Contingent liabilities R0740 - Other loans and mortgages R0260 16,689 Provisions other than technical provisions R0750 192Reinsurance recoverables from: R0270 117,824 Pension benefit obligations R0760 -
Non-life and health similar to non-life R0280 117,824 Deposits from reinsurers R0770 82,918Non-life excluding health R0290 117,824 Deferred tax liabilities R0780 -Health similar to non-life R0300 - Derivatives R0790 -
Life and health similar to life, excluding health and index-linked and unit-linked R0310 - Debts owed to credit institutions R0800 -Health similar to life R0320 - Financial liabilities other than debts owed to credit institutions R0810 -Life excluding health and index-linked and unit-linked R0330 - Insurance & intermediaries payables R0820 1,995
Life index-linked and unit-linked R0340 - Reinsurance payables R0830 1,616Deposits to cedants R0350 - Payables (trade, not insurance) R0840 33,969Insurance and intermediaries receivables R0360 8,125 Subordinated liabilities R0850 -Reinsurance receivables R0370 2,193 Subordinated liabilities not in BOF R0860 -Receivables (trade, not insurance) R0380 44,298 Subordinated liabilities in BOF R0870 -Own shares (held directly) R0390 - Any other liabilities, not elsewhere shown R0880 702Amounts due in respect of own fund items or initial fund called up but not yet paid in R0400 - Total liabilities R0900 240,811Cash and cash equivalents R0410 15,455 Excess of assets over liabilities R1000 44,643Any other assets, not elsewhere shown R0420 -Total assets R0500 285,454

| RSA Insurance Group plc | Solvency and Financial Condition Report 2016
Appendix 8 - 49 -
The Marine Insurance Company LimitedS.05.01.02Premiums, claims and expenses by line of business
Medical expense
insurance
Income protection insurance
Workers' compensation
insurance
Motor vehicle liability
insurance
Other motor insurance
Marine, aviation and transport insurance
Fire and other damage to property insurance
General liability
insurance
Credit and suretyship insurance
C0010 C0020 C0030 C0040 C0050 C0060 C0070 C0080 C0090
£'000 £'000 £'000 £'000 £'000 £'000 £'000 £'000 £'000Premiums written Gross - Direct Business R0110 - - - - - 12,871 19,290 - - Gross - Proportional reinsurance accepted R0120 - - - - - - - - - Gross - Non-proportional reinsurance accepted R0130 Reinsurers' share R0140 - - - - - 12,871 19,290 - - Net R0200 - - - - - - - - -Premiums earned Gross - Direct Business R0210 - - - - - 14,208 14,076 - - Gross - Proportional reinsurance accepted R0220 - - - - - - - - - Gross - Non-proportional reinsurance accepted R0230 Reinsurers' share R0240 - - - - - 14,208 14,076 - - Net R0300 - - - - - - - - -Claims incurred Gross - Direct Business R0310 - - - - - (520) 14,252 4,282 - Gross - Proportional reinsurance accepted R0320 - - - - - - - - - Gross - Non-proportional reinsurance accepted R0330 Reinsurers' share R0340 - - - - - (520) 14,252 4,282 - Net R0400 - - - - - - - - -Changes in other technical provisions Gross - Direct Business R0410 - - - - - - - - - Gross - Proportional reinsurance accepted R0420 - - - - - - - - - Gross - Non- proportional reinsurance accepted R0430 Reinsurers'share R0440 - - - - - - - - - Net R0500 - - - - - - - - -Expenses incurred R0550 - - - - - (740) (2,450) 703 -Other expenses R1200Total expenses R1300
Line of Business for: non-life insurance and reinsurance obligations (direct business and accepted proportional reinsurance)

| RSA Insurance Group plc | Solvency and Financial Condition Report 2016
Appendix 8 - 50 -
The Marine Insurance Company LimitedS.05.01.02Premiums, claims and expenses by line of business
Legal expenses insurance
Assistance Miscellaneous financial loss Health Casualty Marine, aviation,
transport Property
C0100 C0110 C0120 C0130 C0140 C0150 C0160 C0200
£'000 £'000 £'000 £'000 £'000 £'000 £'000 £'000Premiums written Gross - Direct Business R0110 - - - 32,161 Gross - Proportional reinsurance accepted R0120 - - - - Gross - Non-proportional reinsurance accepted R0130 - - - - - Reinsurers' share R0140 - - - - - - - 32,161 Net R0200 - - - - - - - -Premiums earned Gross - Direct Business R0210 - - - 28,284 Gross - Proportional reinsurance accepted R0220 - - - - Gross - Non-proportional reinsurance accepted R0230 - - - - - Reinsurers' share R0240 - - - - - - - 28,284 Net R0300 - - - - - - - -Claims incurred Gross - Direct Business R0310 - - - 18,014 Gross - Proportional reinsurance accepted R0320 - - - - Gross - Non-proportional reinsurance accepted R0330 - - - - - Reinsurers' share R0340 - - - - - - - 18,014 Net R0400 - - - - - - - -Changes in other technical provisions Gross - Direct Business R0410 - - - - Gross - Proportional reinsurance accepted R0420 - - - - Gross - Non- proportional reinsurance accepted R0430 - - - - - Reinsurers'share R0440 - - - - - - - - Net R0500 - - - - - - - -Expenses incurred R0550 - - - - - - - (2,487)Other expenses R1200 -Total expenses R1300 (2,487)
Line of business for:accepted non-proportional reinsurance
Total
Line of Business for: non-life insurance and reinsurance obligations (direct business and accepted proportional
reinsurance)

| RSA Insurance Group plc | Solvency and Financial Condition Report 2016
Appendix 8 - 51 -
The Marine Insurance Company LimitedS.05.01.02Premiums, claims and expenses by line of business
Total
Health insurance
Insurance with profit
participation
Index-linked and unit-linked
insurance
Other life insurance
Annuities stemming from
non-life insurance
contracts and relating to health
insurance obligations
Annuities stemming from non-life
insurance contracts and relating to
insurance obligations other than health
insurance obligations
Health reinsurance
Life reinsurance
C0210 C0220 C0230 C0240 C0250 C0260 C0270 C0280 C0300£'000 £'000 £'000 £'000 £'000 £'000 £'000 £'000 £'000
Premiums written Gross R1410 - - - - - - - - - Reinsurers' share R1420 - - - - - - - - - Net R1500 - - - - - - - - -Premiums earned Gross R1510 - - - - - - - - - Reinsurers' share R1520 - - - - - - - - - Net R1600 - - - - - - - - -Claims incurred Gross R1610 - - - - - - - - - Reinsurers' share R1620 - - - - - - - - - Net R1700 - - - - - - - - -Changes in other technical provisions Gross R1710 - - - - - - - - - Reinsurers' share R1720 - - - - - - - - - Net R1800 - - - - - - - - -Expenses incurred R1900 - - - - - - - - -Other expenses R2500 -Total expenses R2600 -
Life reinsurance obligationsLine of Business for: life insurance obligations
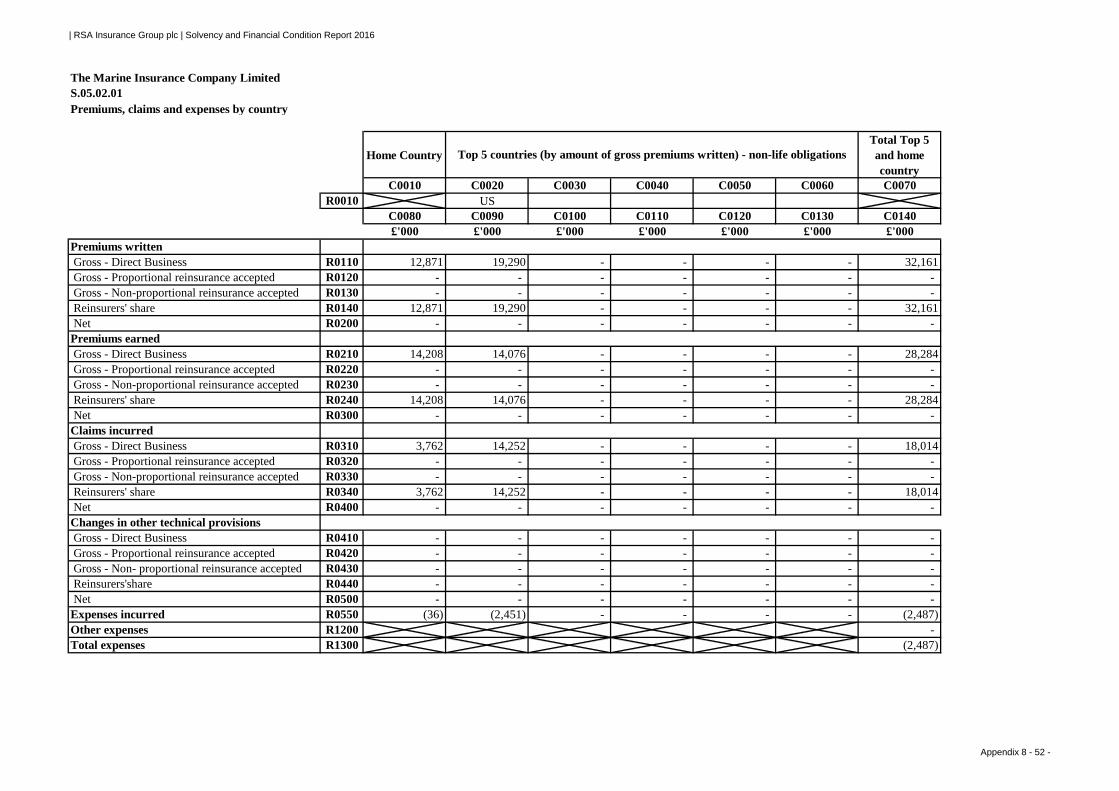
| RSA Insurance Group plc | Solvency and Financial Condition Report 2016
Appendix 8 - 52 -
The Marine Insurance Company LimitedS.05.02.01Premiums, claims and expenses by country
Home CountryTotal Top 5 and home country
C0010 C0020 C0030 C0040 C0050 C0060 C0070R0010 US
C0080 C0090 C0100 C0110 C0120 C0130 C0140£'000 £'000 £'000 £'000 £'000 £'000 £'000
Premiums written Gross - Direct Business R0110 12,871 19,290 - - - - 32,161 Gross - Proportional reinsurance accepted R0120 - - - - - - - Gross - Non-proportional reinsurance accepted R0130 - - - - - - - Reinsurers' share R0140 12,871 19,290 - - - - 32,161 Net R0200 - - - - - - -Premiums earned Gross - Direct Business R0210 14,208 14,076 - - - - 28,284 Gross - Proportional reinsurance accepted R0220 - - - - - - - Gross - Non-proportional reinsurance accepted R0230 - - - - - - - Reinsurers' share R0240 14,208 14,076 - - - - 28,284 Net R0300 - - - - - - -Claims incurred Gross - Direct Business R0310 3,762 14,252 - - - - 18,014 Gross - Proportional reinsurance accepted R0320 - - - - - - - Gross - Non-proportional reinsurance accepted R0330 - - - - - - - Reinsurers' share R0340 3,762 14,252 - - - - 18,014 Net R0400 - - - - - - -Changes in other technical provisions Gross - Direct Business R0410 - - - - - - - Gross - Proportional reinsurance accepted R0420 - - - - - - - Gross - Non- proportional reinsurance accepted R0430 - - - - - - - Reinsurers'share R0440 - - - - - - - Net R0500 - - - - - - -Expenses incurred R0550 (36) (2,451) - - - - (2,487)Other expenses R1200 -Total expenses R1300 (2,487)
Top 5 countries (by amount of gross premiums written) - non-life obligations

| RSA Insurance Group plc | Solvency and Financial Condition Report 2016
Appendix 8 - 53 -
The Marine Insurance Company LimitedS.05.02.01Premiums, claims and expenses by country
Home CountryTotal Top 5 and home country
C0150 C0160 C0170 C0180 C0190 C0200 C0210R1400 US
C0220 C0230 C0240 C0250 C0260 C0270 C0280£'000 £'000 £'000 £'000 £'000 £'000 £'000
Premiums written Gross R1410 - - - - - - - Reinsurers' share R1420 - - - - - - - Net R1500 - - - - - - -Premiums earned Gross R1510 - - - - - - - Reinsurers' share R1520 - - - - - - - Net R1600 - - - - - - -Claims incurred Gross R1610 - - - - - - - Reinsurers' share R1620 - - - - - - - Net R1700 - - - - - - -Changes in other technical provisions Gross R1710 - - - - - - - Reinsurers' share R1720 - - - - - - - Net R1800 - - - - - - -Expenses incurred R1900 - - - - - - -Other expenses R2500 -Total expenses R2600 -
Top 5 countries (by amount of gross premiums written) - life obligations

| RSA Insurance Group plc | Solvency and Financial Condition Report 2016
Appendix 8 - 54 -
The Marine Insurance Company LimitedS.17.01.02Non-life Technical Provisions
Medical expense
insurance
Income protectioninsurance
Workers' compensation
insurance
Motor vehicle liability
insurance
Other motor insurance
Marine, aviation and
transport insurance
Fire and other damage to property insurance
General liability
insurance
Credit and suretyship insurance
C0020 C0030 C0040 C0050 C0060 C0070 C0080 C0090 C0100£'000 £'000 £'000 £'000 £'000 £'000 £'000 £'000 £'000
Technical provisions calculated as a whole R0010 - - - - - - - - -Total Recoverables from reinsurance/SPV and Finite Re after the adjustment for expected losses due to counterparty default associated to TP as a whole
R0050 - - - - - - - - -
Technical provisions calculated as a sum of BE and RM
Best estimatePremium provisionsGross R0060 - - - - - 911 6,483 - -
Total recoverable from reinsurance/SPV and Finite Re after the adjustment for expected losses due to counterparty default R0140 - - - - - 902 6,418 - -
Net Best Estimate of Premium Provisions R0150 - - - - - 9 65 - -Claims provisionsGross R0160 - - - - - 8,834 14,076 88,709 -
Total recoverable from reinsurance/SPV and Finite Re after the adjustment for expected losses due to counterparty default R0240 - - - - - 8,746 13,936 87,822 -
Net Best Estimate of Claims Provisions R0250 - - - - - 88 140 887 -Total Best estimate - gross R0260 - - - - - 9,745 20,559 88,709 -Total Best estimate - net R0270 - - - - - 97 205 887 -Risk margin R0280 - - - - - 102 21 283 -Amount of the transitional on Technical ProvisionsTechnical Provisions calculated as a whole R0290 - - - - - - - - -Best estimate R0300 - - - - - - - - -Risk margin R0310 - - - - - - - - -Technical provisions - totalTechnical provisions - total R0320 - - - - - 9,847 20,580 88,992 -Recoverable from reinsurance contract/SPV and Finite Re after the adjustment for expected losses due to counterparty default - total
R0330 - - - - - 9,648 20,354 87,822 -
Technical provisions minus recoverables from reinsurance/SPV and Finite Re - total R0340 - - - - - 199 226 1,170 -
Direct business and accepted proportional reinsurance

| RSA Insurance Group plc | Solvency and Financial Condition Report 2016
Appendix 8 - 55 -
The Marine Insurance Company LimitedS.17.01.02Non-life Technical Provisions
Legal expenses insurance Assistance Miscellaneous
financial loss
Non-proportional
health reinsurance
Non-proportional
casualty reinsurance
Non-proportional
marine, aviation and
transport reinsurance
Non-proportional
property reinsurance
C0110 C0120 C0130 C0140 C0150 C0160 C0170 C0180£'000 £'000 £'000 £'000 £'000 £'000 £'000 £'000
Technical provisions calculated as a whole R0010 - - - - - - - -Total Recoverables from reinsurance/SPV and Finite Re after the adjustment for expected losses due to counterparty default associated to TP as a whole
R0050 - - - - - - - -
Technical provisions calculated as a sum of BE and RM
Best estimatePremium provisionsGross R0060 - - - - - - - 7,394
Total recoverable from reinsurance/SPV and Finite Re after the adjustment for expected losses due to counterparty default R0140 - - - - - - - 7,320
Net Best Estimate of Premium Provisions R0150 - - - - - - - 74Claims provisionsGross R0160 - - - - - - - 111,619
Total recoverable from reinsurance/SPV and Finite Re after the adjustment for expected losses due to counterparty default R0240 - - - - - - - 110,504
Net Best Estimate of Claims Provisions R0250 - - - - - - - 1,115Total Best estimate - gross R0260 - - - - - - - 119,013Total Best estimate - net R0270 - - - - - - - 1,189Risk margin R0280 - - - - - - - 406Amount of the transitional on Technical ProvisionsTechnical Provisions calculated as a whole R0290 - - - - - - - -Best estimate R0300 - - - - - - - -Risk margin R0310 - - - - - - - -Technical provisions - totalTechnical provisions - total R0320 - - - - - - - 119,419Recoverable from reinsurance contract/SPV and Finite Re after the adjustment for expected losses due to counterparty default - total
R0330 - - - - - - - 117,824
Technical provisions minus recoverables from reinsurance/SPV and Finite Re - total R0340 - - - - - - - 1,595
Accepted non-proportional reinsurance
Total Non-Life obligation
Direct business and accepted proportional reinsurance

| RSA Insurance Group plc | Solvency and Financial Condition Report 2016
Appendix 8 - 56 -
The Marine Insurance Company LimitedS.19.01.21Non-life Insurance Claims Information
Total Non-Life Business
Z0010 Accident Year
Gross Claims Paid (non-cumulative)(absolute amount)
Year 0 1 2 3 4 5 6 7 8 9 10 & +C0010 C0020 C0030 C0040 C0050 C0060 C0070 C0080 C0090 C0100 C0110 C0170 C0180£'000 £'000 £'000 £'000 £'000 £'000 £'000 £'000 £'000 £'000 £'000 £'000 £'000
Prior R0100 6,224 R0100 6,224 6,224N-9 R0160 2,026 2,673 192 49 95 145 82 15 - (157) R0160 (157) 5,120N-8 R0170 1,859 1,508 624 1,121 282 69 28 (62) 3 R0170 3 5,432N-7 R0180 930 3,100 898 263 1,704 4 (27) 1 R0180 1 6,873N-6 R0190 1,958 1,534 1,096 635 1,405 (479) - R0190 - 6,149N-5 R0200 1,276 4,944 4,776 624 568 (42) R0200 (42) 12,146N-4 R0210 6,982 6,902 3,990 170 28 R0210 28 18,072N-3 R0220 8,217 5,995 1,583 178 R0220 178 15,973N-2 R0230 5,839 2,187 1,200 R0230 1,200 9,226N-1 R0240 514 5,040 R0240 5,040 5,554N R0250 3,922 R0250 3,922 3,922
Total R0260 16,397 94,691Gross undiscounted Best Estimate Claims Provisions(absolute amount)
Year 0 1 2 3 4 5 6 7 8 9 10 & +C0200 C0210 C0220 C0230 C0240 C0250 C0260 C0270 C0280 C0290 C0300 C0360£'000 £'000 £'000 £'000 £'000 £'000 £'000 £'000 £'000 £'000 £'000 £'000
Prior R0100 98,094 R0100 88,708N-9 R0160 - - - - - - - - - 155 R0160 155N-8 R0170 - - - - - - - - 14 R0170 14N-7 R0180 - - - - - - - 6 R0180 5N-6 R0190 - - - - - - 12 R0190 10N-5 R0200 - - - - - 224 R0200 286N-4 R0210 - - - - 994 R0210 1,195N-3 R0220 - - - 420 R0220 388N-2 R0230 - - 222 R0230 94N-1 R0240 - 1,127 R0240 837N R0250 20,346 R0250 19,930
Total R0260 111,622
Sum of years (cumulative)
Year end (discounted
Accident year / Underwriting year
Development year
Development year In Current year

| RSA Insurance Group plc | Solvency and Financial Condition Report 2016
Appendix 8 - 57 -
The Marine Insurance Company LimitedS.23.01.01Own funds
Total Tier 1 - unrestricted Tier 1 - restricted Tier 2 Tier 3
C0010 C0020 C0030 C0040 C0050£'000 £'000 £'000 £'000 £'000
Basic own funds before deduction for participations in other financial sector as foreseen in article 68 of Delegated Regulation (EU) 2015/35
Ordinary share capital (gross of own shares) R0010 16,312 16,312 -Share premium account related to ordinary share capital R0030 6,022 6,022 -Iinitial funds, members' contributions or the equivalent basic own - fund item for mutual and mutual-type undertakings R0040 - - -Subordinated mutual member accounts R0050 - - - -Surplus funds R0070 - -Preference shares R0090 - - - -Share premium account related to preference shares R0110 - - - -
Reconciliation reserve R0130 22,309 22,309Subordinated liabilities R0140 - - - -An amount equal to the value of net deferred tax assets R0160 - -Other own fund items approved by the supervisory authority as basic own funds not specified above R0180 - - - - -
Own funds from the financial statements that should not be represented by the reconciliation reserve and do not meet the criteria to be classified as Solvency II own funds
Own funds from the financial statements that should not be represented by the reconciliation reserve and do not meet the criteria to be classified as Solvency II own funds R0220 -
DeductionsDeductions for participations in financial and credit institutions R0230 - - - -
Total basic own funds after deductions R0290 44,643 44,643 - - -

| RSA Insurance Group plc | Solvency and Financial Condition Report 2016
Appendix 8 - 58 -
The Marine Insurance Company LimitedS.23.01.01Own funds
Total Tier 1 - unrestricted Tier 1 - restricted Tier 2 Tier 3
C0010 C0020 C0030 C0040 C0050£'000 £'000 £'000 £'000 £'000
Ancillary own fundsUnpaid and uncalled ordinary share capital callable on demand R0300 - -Unpaid and uncalled initial funds, members' contributions or the equivalent basic own fund item for mutual and mutual - type undertakings, callable on demand R0310 - -
Unpaid and uncalled preference shares callable on demand R0320 - - -A legally binding commitment to subscribe and pay for subordinated liabilities on demand R0330 - - -Letters of credit and guarantees under Article 96(2) of the Directive 2009/138/EC R0340 - -Letters of credit and guarantees other than under Article 96(2) of the Directive 2009/138/EC R0350 - - -Supplementary members calls under first subparagraph of Article 96(3) of the Directive 2009/138/EC R0360 - -Supplementary members calls - other than under first subparagraph of Article 96(3) of the Directive 2009/138/EC R0370 - - -Other ancillary own funds R0390 - - -
Total ancillary own funds R0400 - - -Available and eligible own funds
Total available own funds to meet the SCR R0500 44,643 44,643 - - -Total available own funds to meet the MCR R0510 44,643 44,643 - -Total eligible own funds to meet the SCR R0540 44,643 44,643 - - -Total eligible own funds to meet the MCR R0550 44,643 44,643 - -
SCR R0580 19,719MCR R0600 4,930Ratio of Eligible own funds to SCR R0620 226.40%Ratio of Eligible own funds to MCR R0640 905.59%
C0060£'000
Reconciliation reserveExcess of assets over liabilities R0700 44,643Own shares (held directly and indirectly) R0710 -Foreseeable dividends, distributions and charges R0720 -Other basic own fund items R0730 22,334Adjustment for restricted own fund items in respect of matching adjustment portfolios and ring fenced funds R0740 -
Reconciliation reserve R0760 22,309Expected profits
Expected profits included in future premiums (EPIFP) - Life business R0770 -Expected profits included in future premiums (EPIFP) - Non- life business R0780 -
Total Expected profits included in future premiums (EPIFP) R0790 -

| RSA Insurance Group plc | Solvency and Financial Condition Report 2016
Appendix 8 - 59 -
The Marine Insurance Company LimitedS.25.03.21Solvency Capital Requirement - for undertakings on Full Internal Models
Unique number of component Components descriptionCalculation of the Solvency Capital
RequirementC0010 C0020 C0030
£'0005015ZB Other Underwriting Risk - Movement from Expectation 41710300A Market Risk: interest rate risk - Expectation (741)10300B Market Risk: interest rate risk - Movement from Expectation 3,3401071AA Market Risk: spread risk AAA - Expectation (3)1071AB Market Risk: spread risk AAA - Movement from Expectation 491071BA Market Risk: spread risk AA - Expectation (23)1071BB Market Risk: spread risk AA - Movement from Expectation 1,1821071CA Market Risk: spread risk A - Expectation (58)1071CB Market Risk: spread risk A - Movement from Expectation 2,8081071DA Market Risk: spread risk below A - Expectation (24)1071DB Market Risk: spread risk below A - Movement from Expectation 1,33610900A Market Risk: Group Currency Risk - Expectation (1,699)10900B Market Risk: Group Currency Risk - Movement from Expectation 18,81819900I Diversification within Market (8,376)20100A Credit Risk - Expectation 6120100B Credit Risk - Movement from Expectation (61)70100B Operational Risk - Movement from Expectation 2,81180140A Other Risks: Tax - Expectation 96580140B Other Risks: Tax - Movement from Expectation (965)
Calculation of Solvency Capital Requirement C0100£'000
Total undiversified components R0110 19,837Diversification R0060 (118)
Capital requirement for business operated in accordance with Art. 4 of Directive 2003/41/EC (transitional) R0160 -
Solvency capital requirement excluding capital add-on R0200 19,719Capital add-ons already set R0210 -Solvency capital requirement R0220 19,719Other information on SCRAmount/estimate of the overall loss-absorbing capacity of technical provisions R0300 -Amount/estimate of the overall loss-absorbing capacity ot deferred taxes R0310 -Total amount of Notional Solvency Capital Requirements for remaining part R0410 -Total amount of Notional Solvency Capital Requirements for ring fenced funds (other than those related to business operated in accordance with Art. 4 of Directive 2003/41/EC (transitional)) R0420 -
Total amount of Notional Solvency Capital Requirement for matching adjustment portfolios R0430 -Diversification effects due to RFF nSCR aggregation for article 304 R0440 -

| RSA Insurance Group plc | Solvency and Financial Condition Report 2016
Appendix 8 - 60 -
The Marine Insurance Company LimitedS.28.01.01Minimum Capital Requirement - Only life or only non-life insurance or reinsurance activity
Linear formula component for non-life insurance and reinsurance obligations
C0010£'000
MCRNL Result R0010 121Net (of
reinsurance/SPV) best estimate and TP
calculated as a whole
Net (of reinsurance)
written premiums in the last 12
monthsC0020 C0030£'000 £'000
R0020 - -Income protection insurance and proportional reinsurance R0030 - -Workers' compensation insurance and proportional reinsurance R0040 - -Motor vehicle liability insurance and proportional reinsurance R0050 - -Other motor insurance and proportional reinsurance R0060 - -Marine, aviation and transport insurance and proportional reinsurance R0070 97 -Fire and other damage to property insurance and proportional reinsurance R0080 205 -General liability insurance and proportional reinsurance R0090 887 -Credit and suretyship insurance and proportional reinsurance R0100 - -Legal expenses insurance and proportional reinsurance R0110 - -Assistance and proportional reinsurance R0120 - -Miscellaneous financial loss insurance and proportional reinsurance R0130 - -Non-proportional health reinsurance R0140 - -Non-proportional casualty reinsurance R0150 - -Non-proportional marine, aviation and transport reinsurance R0160 - -Non-proportional property reinsurance R0170 - -
Medical expense insurance and proportional reinsurance

| RSA Insurance Group plc | Solvency and Financial Condition Report 2016
Appendix 8 - 61 -
The Marine Insurance Company LimitedS.28.01.01Minimum Capital Requirement - Only life or only non-life insurance or reinsurance activity
Linear formula component for life insurance and reinsurance obligationsC0040£'000
MCRL Result R0200 - Net (of
reinsurance/SPV) best estimate and TP
calculated as a whole
Net (of reinsurance/SPV) total capital at risk
C0050 C0060£'000 £'000
Obligations with profit participation - guaranteed benefits R0210 -Obligations with profit participation - future discretionary benefits R0220 -Index-linked and unit-linked insurance obligations R0230 -Other life (re)insurance and health (re)insurance obligations R0240 -Total capital at risk for all life (re)insurance obligations R0250 -
Overall MCR calculationC0070£'000
Linear MCR R0300 121SCR R0310 19,719MCR cap R0320 8,873MCR floor R0330 4,930Combined MCR R0340 4,930Absolute floor of the MCR R0350 2,732
Minimum Capital Requirement R0400 4,930

www.rsagroup.com
RSA
An
nu
al Rep
ort an
d A
ccou
nts 20
16