rubber glove-20110104-getting a handle on 2011
TRANSCRIPT

Please read carefully the important disclosures at the end of this publication.
SECTOR UPDATE
4 January 2011
CIMB Research Report
OVERWEIGHT Maintained
Rubber Gloves
Getting a handle on 2011
MA
LA
YS
IA
Terence Wong CFA +60(3) 20849689 - [email protected]
\
• Maintain OVERWEIGHT. We reiterate our OVERWEIGHT weighting on the sector as cost and forex headwinds have brought down CY12 P/E to just 7.2x or 43% below the KLCI’s 12.7x P/E. This is despite the sector’s solid 3-year EPS CAGR of 16%, which is well supported by the 8-10% annual global demand growth. Also, demand is underpinned by structural trends such as improving hygiene standards in Asia and US healthcare reform. We expect the eventual moderation of latex prices to trigger a re-rating of the sector. Other potential catalysts are 1) increased outsourcing by MNCs, 2) the impact of price increases in the quarters ahead assuming no major adverse rubber or currency trends, and 3) takeover speculation surrounding small-cap glovemakers. We make no changes to our earnings numbers or target prices. All the glovemakers under coverage remain Outperforms, with Hartalega being the top pick.
• Strong reaction to headwinds in 2010. Cost and forex headwinds rocked the glove sector in 2010. On average, glove stocks are down 38.5% from their 52-week highs, ending the year 5.2% higher. The average 12-mth trailing P/E for the sector has fallen 17.6 multiple pts from their highs to 11.2x. The share price of the industry leader Top Glove ended the year 0.3% higher despite plummeting 31.6% from its 52-week high. Its 12-mth trailing P/E also took a dramatic turn for the worse, falling 6.2 multiple pts from its 52-week high to 14.2x.
• Nitrile advantage comes into play. Hartalega’s share price has weathered the storm best, down by just 6.1% from its 52-week high and closing the year 28.2% higher. Nitrile glovemakers are less affected by rising rubber prices as nitrile price has appreciated more gradually, thereby reducing the time lag between cost increases and pass-through. This is because unlike rubber, nitrile is not a traded commodity and is less affected by speculation. Although nitrile is a petroleum derivative, its price is not directly correlated to crude oil because its raw materials are by-products of the oil refinery cracking process and not a raw material per se.
• Growth prospects still bright. Despite cost and forex headwinds, the glove sector still offers investors a 3-year EPS CAGR of 16%, higher than the KLCI’s core EPS growth of 13.9% for 2011 and 13.2% for 2012. Demand growth for gloves is still robust and steady at 8-10% p.a. Due to its cost advantages and protein-free properties, nitrile glove demand is projected to grow above average at 15% p.a. between 2010 and 2015 to 74bn gloves. Although the recent reporting season was a letdown due to cost headwinds, we expect earnings in the quarters ahead to improve when rubber prices moderate and price revisions start to make an impact.
Sector comparisons
Target Core 3-yr EPS P/BV ROE Div
Bloomberg Price price Mkt cap P/E (x) CAGR (x) (%) yield (%)
ticker Recom. (Local) (Local) (US$ m) CY2011 CY2012 (%) CY2011 CY2011 CY2011
Adventa ADV MK O 2.40 3.14 120 9.5 7.8 8.3 1.2 14.6 4.2
Kossan KRI MK O 3.14 5.41
328 6.9 5.9 12.5 1.7 27.6 3.2
Hartalega HART MK O 5.35 8.43 635 9.4 8.3 18.4 3.2 38.9 3.7
Latexx LTX MK O 2.55 3.85 182 5.8 5.4 26.6 1.7 33.0 4.3
Supermax SUCB MK O 4.06 8.22 451 6.6 5.7 22.5 1.5 24.7 2.7
Top Glove TOPG MK O 5.05 7.27 1,019 11.7 10.1 9.7 2.3 21.2 3.7
Simple average
8.3 7.2 16.3 1.9 26.7 3.6
O = Outperform, N = Neutral, U = Underperform, TB = Trading Buy and TS = Trading Sell Source: Company, CIMB Research
For further information, kindly contact Yeoh Yung Juen at (603) 2084 9911 or [email protected]
[ 2 ]
3Q10 results roundup
Sector feels impact of latex and forex fluctuations
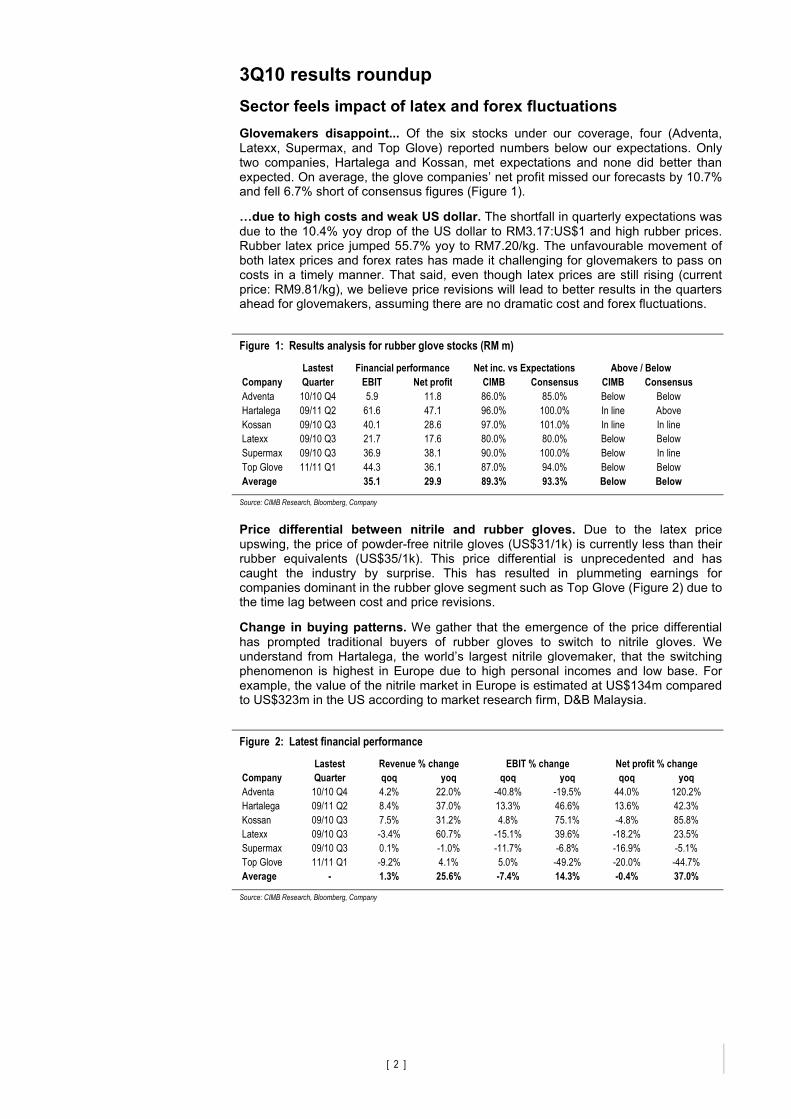
Glovemakers disappoint... Of the six stocks under our coverage, four (Adventa, Latexx, Supermax, and Top Glove) reported numbers below our expectations. Only two companies, Hartalega and Kossan, met expectations and none did better than expected. On average, the glove companies’ net profit missed our forecasts by 10.7% and fell 6.7% short of consensus figures (Figure 1).
…due to high costs and weak US dollar. The shortfall in quarterly expectations was due to the 10.4% yoy drop of the US dollar to RM3.17:US$1 and high rubber prices. Rubber latex price jumped 55.7% yoy to RM7.20/kg. The unfavourable movement of both latex prices and forex rates has made it challenging for glovemakers to pass on costs in a timely manner. That said, even though latex prices are still rising (current price: RM9.81/kg), we believe price revisions will lead to better results in the quarters ahead for glovemakers, assuming there are no dramatic cost and forex fluctuations.
Figure 1: Results analysis for rubber glove stocks (RM m)
Lastest
Company Quarter EBIT Net profit CIMB Consensus CIMB Consensus
Adventa 10/10 Q4 5.9 11.8 86.0% 85.0% Below Below
Hartalega 09/11 Q2 61.6 47.1 96.0% 100.0% In line Above
Kossan 09/10 Q3 40.1 28.6 97.0% 101.0% In line In line
Latexx 09/10 Q3 21.7 17.6 80.0% 80.0% Below Below
Supermax 09/10 Q3 36.9 38.1 90.0% 100.0% Below In line
Top Glove 11/11 Q1 44.3 36.1 87.0% 94.0% Below Below
Average 35.1 29.9 89.3% 93.3% Below Below
Net inc. vs Expectations Above / BelowFinancial performance
Source: CIMB Research, Bloomberg, Company
Price differential between nitrile and rubber gloves. Due to the latex price upswing, the price of powder-free nitrile gloves (US$31/1k) is currently less than their rubber equivalents (US$35/1k). This price differential is unprecedented and has caught the industry by surprise. This has resulted in plummeting earnings for companies dominant in the rubber glove segment such as Top Glove (Figure 2) due to the time lag between cost and price revisions.
Change in buying patterns. We gather that the emergence of the price differential has prompted traditional buyers of rubber gloves to switch to nitrile gloves. We understand from Hartalega, the world’s largest nitrile glovemaker, that the switching phenomenon is highest in Europe due to high personal incomes and low base. For example, the value of the nitrile market in Europe is estimated at US$134m compared to US$323m in the US according to market research firm, D&B Malaysia.
Figure 2: Latest financial performance
Lastest
Company Quarter qoq yoq qoq yoq qoq yoq
Adventa 10/10 Q4 4.2% 22.0% -40.8% -19.5% 44.0% 120.2%
Hartalega 09/11 Q2 8.4% 37.0% 13.3% 46.6% 13.6% 42.3%
Kossan 09/10 Q3 7.5% 31.2% 4.8% 75.1% -4.8% 85.8%
Latexx 09/10 Q3 -3.4% 60.7% -15.1% 39.6% -18.2% 23.5%
Supermax 09/10 Q3 0.1% -1.0% -11.7% -6.8% -16.9% -5.1%
Top Glove 11/11 Q1 -9.2% 4.1% 5.0% -49.2% -20.0% -44.7%
Average - 1.3% 25.6% -7.4% 14.3% -0.4% 37.0%
Net profit % changeRevenue % change EBIT % change
Source: CIMB Research, Bloomberg, Company

[ 3 ]
Figure 3: Natural rubber and RM/US$ trends
Lastest
Company Quarter NR (kg) RM/US$ qoq yoq qoq yoq
Adventa 10/10 Q4 7.42 3.15 14.6% 57.7% -2.2% -8.8%
Hartalega 09/11 Q2 7.17 3.16 3.9% 56.6% -4.6% -10.8%
Kossan 09/10 Q3 7.17 3.16 3.9% 56.6% -4.6% -10.8%
Latexx 09/10 Q3 7.17 3.16 3.9% 56.6% -4.6% -10.8%
Supermax 09/10 Q3 7.17 3.16 3.9% 56.6% -4.6% -10.8%
Top Glove 11/11 Q1 7.11 3.21 -2.8% 49.9% -3.4% -10.6%
Average 7.20 3.17 4.6% 55.7% -4.0% -10.4%
Current 9.81 3.06
Average during quarter RM/US$ forex chg %Rubber latex price chg %
Source: CIMB Research, Bloomberg, Company
Demand for gloves remains robust. Despite higher costs and a weak US dollar, glove companies recorded average revenue growth of 1.3% qoq and 25.6% yoy. In our view, this illustrates the industry’s ability to weather cost inflation and forex fluctuations by passing costs on. While cost pass-through will take time, this is only a temporary lag and has no impact on the industry’s long-term growth prospects. We gather from the management of some glove companies that overall medical glove demand remains robust at 8-10% p.a. Numbers vary slightly but the consensus view among the glovemakers is for annual demand growth of 15% for nitrile gloves and 10% for rubber gloves over the next five years.
Review of 2010
Headwinds emerge in 3Q10
Glovemakers start year with a bang... The stock prices of glovemakers started the year on a good note, rising 25% by 14 Jan. Share prices were driven by expectations of a good 1Q results season. Investors were not disappointed. During the quarter to March 2010, net profit for the glove sector rose by 112.4% yoy and 23% qoq on average.
… and soar until July. Through the middle of 2010, rubber prices remained stable, with rubber latex hovering between RM7.00/kg and RM7.50/kg after the seasonally low wintering period in March-April. The stable operating environment, coupled with strong H1N1 demand, drove the combined market cap of glove stocks 43% higher to RM11.7bn by 16 July.
Figure 4: Glove sector’s market cap (RM bn) and latex price (sen / kg) in 2010
7.5
8.0
8.5
9.0
9.5
10.0
10.5
11.0
11.5
12.0
Jan
Feb
Mar
Apr
May Jun
Jul
Aug
Sep Oct
Oct
Nov Dec
600
650
700
750
800
850
900
950
1,000
1,050Glov e Sector (LHS) Rubber Latex
Source: CIMB Research, Companies, Bloomberg

[ 4 ]
Headwinds emerge in Sep. Trouble started in the middle of July as supply fears sent rubber prices higher from RM7/kg to RM9/kg by Dec. (Figure 5). We note that in 2007-09, latex price had not spiked the way it has in 2010. In 2008, latex price fell in 4Q while in 2007 and 2009, prices were more stable. By Aug, some glovemakers in the low-end segment such as Top Glove were indicating that H1N1 demand was subsiding. The combination of higher costs and normalising demand caused a sell-off of glove stocks. By end-Sep, the combined market cap of the glovemakers was down 31% from their peak to RM8.1bn. The sector has since rebounded off its lows, finishing 2010 at RM8.7bn.
Figure 5: Latex’s four-year price cycle (sen / kg)
300
400
500
600
700
800
900
1,000
Jan
Feb
Mar
Apr
May Jun
Jul
Aug
Sep Oct
Nov Dec
2007 2008 2009 2010
Source: CIMB Research, Companies, Malaysian Rubber Board, Bloomberg
Top Glove loses market share... Over the course of 2010, the glove sector has seen its composition change as investor switched out of Top Glove and small caps to Hartalega, Supermax, and Kossan. Top Glove, the world leader in low-end rubber gloves, started 2010 with 37.4% of the sector’s market cap. At end-10, the company was still the world’s largest glove company but its representation in the sector had fallen 1.8% pts to 35.6%. Latexx, meanwhile, lost some of its lustre as high rubber prices made its protein-reducing technology less viable. We recognised this and dropped Latexx as a top pick after its 3Q10 results in Nov. Investors also switched out of Adventa as surgical gloves cannot use nitrile as a substitute for rubber latex.
...but others gain. Hartalega, the world’s largest nitrile glovemaker, increased its representation in the sector by 4.0% pts to 22.2% as the company’s efficient cost structure helped it weather soaring rubber prices (Figure 6). While Supermax (25%) has lower nitrile capacity than Hartalega (83%) and Kossan (38%), the company aims to raise nitrile to 35% of capacity in the quarters ahead. It has been aggressive in communicating this message and investors switched into the stock, helping to raise its representation in the sector by 0.7% pts to 16.1%. Kossan also raised its representation by 0.7% pts to 11.3%. The company is most diversified with sizeable nitrile and rubber capacity, which we believe will enable it to meet market demand.
Figure 6: Glove sector’s market cap composition (% of total market cap)
Glove sector composition – 4 Jan 2010 Glove sector composition – 31 Dec 2010
18.2%
2.2%
10.6%
7.8%2.9%15.4%
37.4%
5.6%
ADV CPG HART IRCB KRILTX RBRX SUCB TOPG
22.2%
1.1%
11.2%
6.5%2.0%16.1%
35.6%
4.4% 0.9%
ADV CPG HART IRCB KRILTX RBRX SUCB TOPG
`Source: Bloomberg, Shanghai Futures Exchange Source: Bloomberg, Tokyo Commodity Exchange

[ 5 ]
Figure 7: DuPont analysis of glove sector
Company Adventa Hartalega Kossan Latexx Supermax Top Glove
Latest quarter 10/10 Q4 09/11 Q2 09/10 Q3 09/10 Q3 09/10 Q3 11/11 Q1
(12 months to)
Tax burden 117.4 78.7 78.0 90.9 92.0 81.9
Interest burden 84.2 98.7 94.6 93.7 113.6 99.6
EBIT margin 10.8 33.3 15.0 18.4 19.4 12.6
Asset utilisation 0.9 1.3 1.4 1.4 0.9 1.6
Equity multiplier 1.9 1.4 1.9 1.8 1.6 1.3
ROE % 17.6 48.0 29.9 39.8 30.2 21.4
5 yr avg ROE % 13.7 46.8 24.2 37.5 27.8 25.8
ROA % 9.4 34.2 16.0 22.1 18.8 16.6
5 yr avg ROA % 7.3 32.6 12.3 20.0 15.6 19.0 Source: CIMB Research, Companies, Bloomberg
DuPont analysis illustrates nitrile advantage. At 48%, Hartalega’s ROE is the
highest in the sector, thanks largely to its 33.3% EBIT margin, which is the highest in the industry and 13.9% pts higher than its closest competitor, Supermax (Figure 7). Nitrile gives Hartalega a leg-up on the competition because at current prices nitrile can be 20-30% more cost efficient than rubber.
Glovemakers take time to execute bonus issues. In 2010, glovemakers took advantage of bullish investor appetite for glove stocks to execute bonus issues instead of cash dividends and other corporate exercises such as Careplus’s IPO on Bursa Malaysia’s ACE market (Figure 8).
Figure 8: Summary of corporate exercises in 2010
Corp. Date of Proceeds
Company Exercise Anncmnt Anncment 52wk High % 52wk (RM m) New shrs Total (ex)
Adventa - - - 4.35 - - - 152.8
Careplus IPO 6-Dec-10 0.23 0.45 51% 15.0 65.1 210.0
Hartalega Bonus 11-May-10 5.19 5.70 91% - 121.2 363.5
IRCB Rights 11-Nov-10 0.32 1.28 25% 71.0 355.2 592.0
Kossan Bonus 21-Apr-10 3.91 4.28 91% - 159.9 319.7
Latexx - - - 4.95 - - - 218.8
Rubberex Split 25-Jan-10 1.41 1.68 84% - 100.4 202.1
Supermax Bonus 3-Mar-10 4.92 6.60 75% - 67.9 340.1
Top Glove Bonus 26-Apr-10 6.50 7.38 88% - 309.2 618.4
Average - - - - 72% - - -
1 for 1 shares
1 into 2 shares
1 for 4 shares
-
-
Share capital (m)
0.23 / share
1 for 2 shares
-
Summary of
offer terms
0.20/shr ; 3 for 2
Tracking share prices (RM)
1 for 1 shares
Source: CIMB Research, Companies, Bloomberg
Bird flu scare towards year-end. While 2009 saw the outbreak of H1N1 during 2Q09, there was no major bird flu news in 2010 until the end of Nov. On 19 Nov, Hong Kong’s Department of Health diagnosed the first human case of bird flu (influenza A, H5N1) in seven years in a 59-year-old woman returning from mainland China. On 9 Dec, i.e. less than a month after the announcement, Hong Kong health officials lowered the country’s bird flu health warning, scaling down its avian influenza warning from “serious” to “alert” because no new cases had been reported.
Figure 9: 2010 relative performance of Big 4 glovemakers
-10%
0%
10%
20%
30%
40%
50%
60%
70%
80%
Jan
Feb
Mar
Apr
May
Jun
Jul
Aug
Sep
Oct
Nov
Dec
HART KRI SUCB TOPG
Source: CIMB Research, Companies, Bloomberg

[ 6 ]
Cardinal Health enters China. While China remains a lucrative market for glovemakers, some companies such as Top Glove and Hartalega have said that penetrating the local scene is challenging as most of the gloves used in China are made of vinyl plastic. However, we believe this could change. On 30 Nov, Cardinal Health (CAH US, NR) completed the acquisition of Zuellig Pharma China or Yong Yu. Yong Yu is China’s largest importer of healthcare supplies and has a distribution network to over 49,000 hospitals and clinics and more than 123,000 pharmacies in China. We believe the acquisition is positive for Malaysian glovemakers as it opens up the hard-to-penetrate Chinese market. Malaysian glovemakers’ sales exposure to Cardinal ranges from 2% to 12.5% of sales and should increase as Cardinal makes inroads into China through Yong Yu (see our 2 Dec note entitled Rubber Gloves – China access at hand).
Careplus raises RM15m in IPO. Although most of the large glovemakers in Malaysia are already listed, there are a few small glovemakers that remain private companies. On 6 Dec, one of them, Careplus Group Bhd, was listed on Bursa Malaysia’s ACE market. The company’s shares surged 17.4% on its debut and added RM56m market cap to the glove sector. The company is the smallest listed glovemaker with 420m pieces of gloves in annual glove capacity in Senawang, Negeri Sembilan. Currently, all its operating lines manufacture rubber gloves. However, the company is looking to increase capacity to 1.65bn pieces of gloves by 1Q13 when it installs new lines capable of producing nitrile gloves.
Yule Catto acquires Polymer Latexx. On 13 Dec, private equity firm TowerBrook Capital Partners sold PolymerLatex to Yule Catto & Co Plc for €443m. When the transaction is completed, Yule Catto will be the world’s largest supplier of nitrile. Yule Catto’s unit, Synthomer already has a 130,000 mt p.a. nitrile plant in Kluang, Johor and the acquisition will add PolymerLatex’s 10,000 mt p.a. nitrile latex plant in Pasir Gudang, Johor. While this consolidates the position of the world’s two largest nitrile latex suppliers, we do not believe there will be price fixing for nitrile latex as the industry is fragmented due to the presence of suppliers in China, Taiwan, South Korea, Japan, and even Russia.
Adventa’s takeover talk lifts the glove sector. As 2010 wound down, interest in the glove sector waned on the back of higher costs and lack of demand catalysts. However, on 23 Dec, glove stocks surged 11% on average after Bloomberg and local Malaysian press reported that a US private equity firm may be eyeing Adventa. The newspapers reported that the takeover price would be RM3.40 per share or 11x FY11 P/E. On that news, Adventa’s share price shot up 30% and hit limit up. The next day however, in response to a Bursa Malaysia query, Adventa poured cold water on the takeover talk, saying that it was not in any acquisition discussions with a US firm. However, the company left the possibility of a takeover open by adding that it has received expressions of interest on an exploratory basis.
Figure 10: 2010 relative performance of smaller glovemakers
-60%
-40%
-20%
0%
20%
40%
60%
80%
100%
120%
Jan
Feb
Mar
Apr
May
Jun
Jul
Aug
Sep
Oct
Nov
Dec
ADV CPG IRCB LTX RBRX
Source: CIMB Research, Companies, Bloomberg

Please read carefully the important disclosures at the end of this publication.
Key themes for 2011
The nitrile advantage
Shielded from high rubber prices. Nitrile glovemakers have been less affected by rising rubber prices as nitrile price has appreciated more gradually. For example, between May 2009 (when nitrile and rubber prices were both at RM6.72/kg, adjusted for total solid content or TSC) and Nov 2010, nitrile price increased by 54% to RM10.32/kg while rubber price jumped 119% to RM14.77/kg (Figure 11). We believe this is partly because unlike rubber, nitrile is not a traded commodity and is less affected by speculative trading. Also, while nitrile is a petroleum derivative, its price is not directly correlated to crude oil because its raw materials (butadiene and acrylonitrile) are by-products of the oil refinery cracking process. The gradual rise of nitrile enables glovemakers such as Hartalega to pass on costs more consistently, thereby reducing the time lag between costs and revenues.
Not just cheaper, but better too. From a product point of view, it is not difficult to see why glovemakers prefer nitrile to natural rubber 1) nitrile has better puncture, abrasion, oil and chemical resistance which enables glovemakers to earn a premium over comparable rubber gloves, 2) gloves can be made with lower wall thickness, helping manufacturers to optimise raw material costs, and 3) nitrile is free of protein and chemical accelerators, which shortens the manufacturing process and, in turn, lowers energy requirements. Nitrile glovemakers also benefit from purchasing nitrile in either US dollars or euros, which acts as a natural hedge against currency fluctuations.
Figure 11: NR (60% solid content) and nitrile (45% solid content ) prices (RM / kg)
5.00
6.00
7.00
8.00
9.00
10.00
11.00
12.00
13.00
14.00
15.00
Feb-07
Apr-07
Jun-07
Aug-07
Oct-07
Dec-07
Feb-08
Apr-08
Jun-08
Aug-08
Oct-08
Dec-08
Feb-09
Apr-09
Jun-09
Aug-09
Oct-09
Dec-09
Feb-10
Apr-10
Jun-10
Aug-10
Oct-10
Dec-10
NR latex price Nitrile latex price
Source: Bloomberg, Companies
Less is more. Current production costs for nitrile gloves can be 20-30% lower compared to rubber as their lighter weight and lower raw material prices offset their higher raw material requirements. Nitrile gloves, being thinner at 3.5g, require 20% more raw material content as fillers would tear the gloves. Despite the higher requirement, the overall production cost for nitrile is still lower compared to rubber (Figure 12).
Figure 12: Production costs – natural rubber versus nitrile (for illustration only)
Rubber
vs. NitrileAverage glove weight (kg) 5.00 3.50 -30% Nitrile gloves are usually lighter
Latex / nitrile content 73% 93% 20% Nitrile content is higher because of the
3.63 3.24 -11% chlorination process to remove powder
Total solid content 60% 44% Most common formulation used
Weight of latex / nitrile (kg) 6.04 7.36 22% by Malaysian glove manufacturers
Latex / nitrile price (RM/kg) 9.87 5.81 -41% Prices from Company and MRB for
rubber latex (60% TSC) and nitrile
Total production cost 59.63 42.75 -28% latex (45% TSC)
Comments and RemarksRubber latex Nitrile latex(For 1,000 gloves)
Note: MRB – Malaysian Rubber Board (31 Dec 2010)
Source: CIMB Research, Companies
[ 8 ]
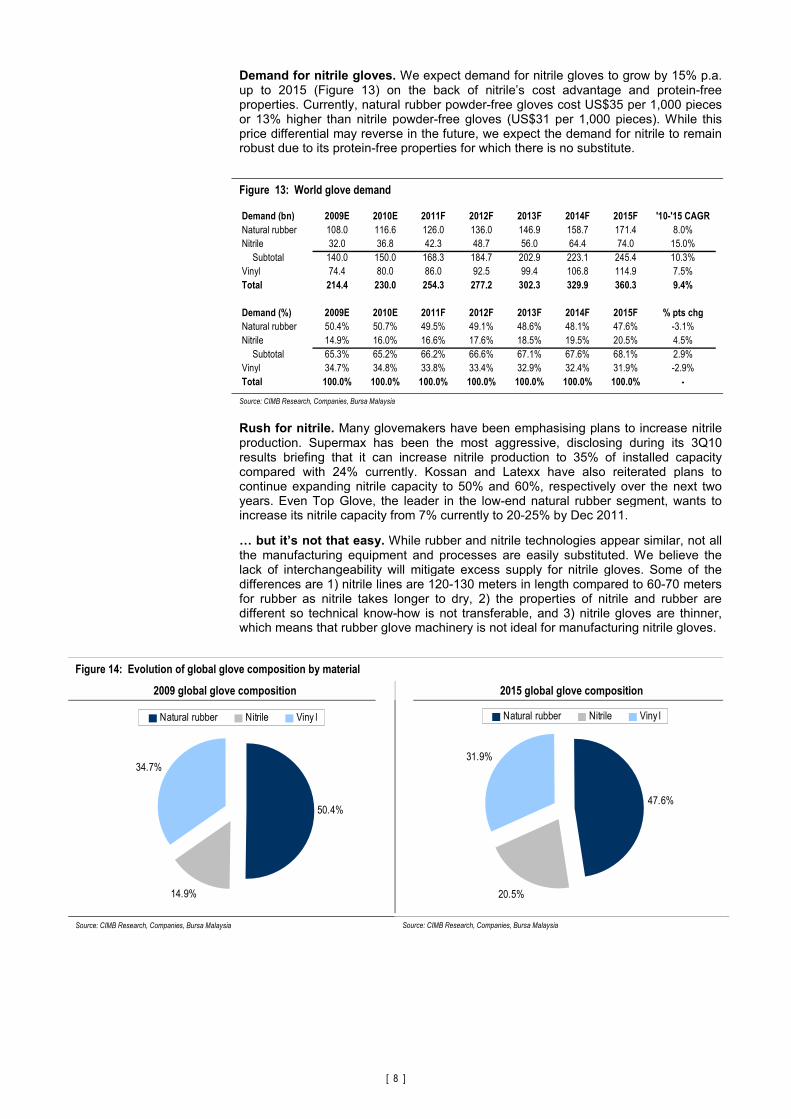
Demand for nitrile gloves. We expect demand for nitrile gloves to grow by 15% p.a.
up to 2015 (Figure 13) on the back of nitrile’s cost advantage and protein-free properties. Currently, natural rubber powder-free gloves cost US$35 per 1,000 pieces or 13% higher than nitrile powder-free gloves (US$31 per 1,000 pieces). While this price differential may reverse in the future, we expect the demand for nitrile to remain robust due to its protein-free properties for which there is no substitute.
Figure 13: World glove demand
Demand (bn) 2009E 2010E 2011F 2012F 2013F 2014F 2015F '10-'15 CAGR
Natural rubber 108.0 116.6 126.0 136.0 146.9 158.7 171.4 8.0%
Nitrile 32.0 36.8 42.3 48.7 56.0 64.4 74.0 15.0%
Subtotal 140.0 150.0 168.3 184.7 202.9 223.1 245.4 10.3%
Vinyl 74.4 80.0 86.0 92.5 99.4 106.8 114.9 7.5%
Total 214.4 230.0 254.3 277.2 302.3 329.9 360.3 9.4%
Demand (%) 2009E 2010E 2011F 2012F 2013F 2014F 2015F % pts chg
Natural rubber 50.4% 50.7% 49.5% 49.1% 48.6% 48.1% 47.6% -3.1%
Nitrile 14.9% 16.0% 16.6% 17.6% 18.5% 19.5% 20.5% 4.5%
Subtotal 65.3% 65.2% 66.2% 66.6% 67.1% 67.6% 68.1% 2.9%
Vinyl 34.7% 34.8% 33.8% 33.4% 32.9% 32.4% 31.9% -2.9%
Total 100.0% 100.0% 100.0% 100.0% 100.0% 100.0% 100.0% - Source: CIMB Research, Companies, Bursa Malaysia
Rush for nitrile. Many glovemakers have been emphasising plans to increase nitrile
production. Supermax has been the most aggressive, disclosing during its 3Q10 results briefing that it can increase nitrile production to 35% of installed capacity compared with 24% currently. Kossan and Latexx have also reiterated plans to continue expanding nitrile capacity to 50% and 60%, respectively over the next two years. Even Top Glove, the leader in the low-end natural rubber segment, wants to increase its nitrile capacity from 7% currently to 20-25% by Dec 2011.
… but it’s not that easy. While rubber and nitrile technologies appear similar, not all the manufacturing equipment and processes are easily substituted. We believe the lack of interchangeability will mitigate excess supply for nitrile gloves. Some of the differences are 1) nitrile lines are 120-130 meters in length compared to 60-70 meters for rubber as nitrile takes longer to dry, 2) the properties of nitrile and rubber are different so technical know-how is not transferable, and 3) nitrile gloves are thinner, which means that rubber glove machinery is not ideal for manufacturing nitrile gloves.
Figure 14: Evolution of global glove composition by material
2009 global glove composition 2015 global glove composition
50.4%
14.9%
34.7%
Natural rubber Nitrile Viny l
47.6%
20.5%
31.9%
Natural rubber Nitrile Viny l
Source: CIMB Research, Companies, Bursa Malaysia Source: CIMB Research, Companies, Bursa Malaysia

[ 9 ]
Handling the latex price upsurge
Supply from non-conventional sources. In 2011, we expect rubber prices to remain volatile until weather conditions normalise and regular tapping activity resumes. Data from the Association of Natural Rubber Producing Countries (ANRPC) suggest that there could be a rubber surplus of 100k-300k mt p.a. in 2011-13 due to additional supply from non-conventional sources. This development would be positive for the glove sector as 50-60% of production costs are latex-related. Potential non-conventional supply sources include 1) intensified tapping to catch the high price, 2) impact of high-yield and short-gestation clones, and 3) postponement of replanting.
Figure 15: Rubber stocks monitored in China and Japan (available in warehouse)
Total net rubber stocks in Shanghai (mt) Total net rubber stocks in Tokyo (mt)
-
25,000
50,000
75,000
100,000
125,000
150,000
Jan-10
Feb-10
Mar-10
Apr-10
May-10
Jun-10
Jul-10
Aug-10
Sep-10
Oct-10
Nov-10
Dec-10
-
750
1,500
2,250
3,000
3,750
4,500
5,250
6,000
Jan-10
Feb-10
Mar-10
Apr-10
May-10
Jun-10
Jul-10
Aug-10
Sep-10
Oct-10
Nov-10
Dec-10
Source: Bloomberg, Shanghai Futures Exchange Source: Bloomberg, Tokyo Commodity Exchange
#1 – Intensified tapping to catch high prices. During periods of high prices, it is
common for farmers to undertake short-term yield-enhancing measures to catch high prices and maximise profits. These include 1) using of latex stimulants, 2) using rain guards, and 3) harvesting before sunrise. According to Rubber Asia, tapping before sunrise can increase yields by 30%. This is due to lower field coagulum and better latex preservation from the cooler temperatures. Plantation companies using this method report that workers have reacted positively as labourers enhance tapping earnings and are free to work a second job.
# 2 – Impact of new clones. New plantings and yield profiles have been on a rising trend since 2003, indicating higher crop productivity, acreage and supply to come. While first-generation rubber clones take 6-7 years to reach maturity, new high-tech clones mature in 4½ years. In Malaysia, 50% of new plantings achieve maturity in 4½ years but agricultural authorities aim to increase this to 70% by 2015 and 100% by 2020. Also, research is being done to increase yields from 1,450kg per hectare p.a. to 1,750 kg per hectare p.a. by 2015 (+21%) and 2,000kg per hectare p.a. by 2010 (+38%). While these programmes will eventually increase rubber supply, we stress that they will materialise over the next few years and not make an immediate impact.
Figure 16: New plantings and higher yield clones could shift supply curve (‘000 mt / kg per ha)
-
100
200
300
400
500
600
2003 2004 2005 2006 2007 2008 2009 2010
1,150
1,200
1,250
1,300
1,350
1,400
1,450
1,500New Plantings Avg Yld
Source: Association of Natural Rubber Producing Countries website

[ 10 ]
# 3 – Postponement of replanting programmes. At RM9.81/kg of latex, we believe rubber plantation farmers can earn a cash profit of c RM8,595 per hectare p.a. after deducting processing, tapping and fertiliser costs (Figure 17). The numbers imply that farmers with 10 hectares can earn a profit of c RM85,950 p.a., which is a healthy level of earnings given that Malaysia’s average per capita income is only RM22,000 p.a. Also, most farmers live in rural villages where the cost of living is below average. With earnings 290% above the national average, we believe farmers will postpone replanting programmes to maintain monthly incomes.
Figure 17: Cash profits earned by rubber plantation farmers
Per annum (RM) Hectare Acre (1) % Costs
Cash revenues:-
Yield (kg / ha) 1,500 607 -
Latex price (RM / kg) 9.81 3.97 -
14,715 5,957 -
Cash costs:-
Latex processing -2,520 -1,020 41%
Labour for tapping -2,400 -972 39%
Fertilizer costs -1,200 -486 20%
-6,120 -2,478 100%
Cash profit (2) 8,595 3,480 -
Source: Association of Natural Rubber Producing Countries website
1. One hectare = 2.47 acres
2. Excludes tax, non cash items such as depreciation, and overheads
Access to China in 2011 and beyond?
Cardinal Health opens Chinese market for glovemakers. While China’s healthcare market is expected to increase from US$240bn (5% GDP) to US$600bn by 2021, glovemakers have had limited success penetrating the Chinese market because of its fragmented distribution network and low hygiene standards. Most gloves used in the Chinese healthcare sector are vinyl and Malaysian glovemakers manufacture rubber or nitrile gloves. We note that vinyl gloves are cheap, have low barrier protection and are not environmentally friendly. However, we believe this could change from 2011 onwards following Cardinal Health’s (CAH US, NR) recent acquisition of Zuellig Pharma China or Yong Yu as the company is known in China.
China access at hand. Yong Yu is China’s largest importer of healthcare supplies with a distribution network to over 49,000 hospitals and clinics and 123,000 pharmacies. We believe that Cardinal’s acquisition will provide access to the Chinese healthcare industry for Malaysian glovemakers that are already working with Cardinal. These glovemakers include Adventa, Kossan, Latexx and Top Glove, as illustrated in Figure 18.
Figure 18: Estimated percentage of sales from Cardinal and length of relationship (RM m)
Glovemaker Last FYE Revenue % of sales Value % Total Relationship
Adventa Bhd 10/2009 282.7 2.0% 5.7 3.1% 5.0yrs
Hartalega Holdings Bhd 03/2010 571.9 - - - -
Kossan Rubber Industries 12/2009 842.1 6.0% 50.5 28.0% 7.5yrs
Latexx Partners Bhd 12/2009 328.5 12.5% 41.1 22.8% 15.0yrs
Supermax Corp Bhd 12/2009 803.6 - - - -
Top Glove Corp Bhd 08/2010 2,079.4 4.0% 83.2 46.1% 10.0yrs
Rubber glove sector - 4,908.3 3.7% 180.4 100.0% 9.4yrs
Source: Companies, CIMB Research, Bloomberg
Established relationships would help secure new contracts. With well-established relationships with Cardinal averaging 9.4 years, the glove companies under our coverage are well-positioned to benefit from Cardinal’s acquisition of Yong Yu. In our view, MNC distributors such as Cardinal have a strong incentive to protect their brands and will, therefore, source from existing contract manufacturers rather than from an unknown cheap alternative. Also, signing up a new OEM partner is time-consuming, which makes switching prohibitive as it involves 1) facility downtime, 2) supply disruption, and 3) detailed financial audits.
[ 11 ]
Latexx the biggest winner. Latexx stands to benefit the most from Cardinal Health’s acquisition as it has the highest percentage of sales coming from Cardinal Health. Moreover, Latexx and Cardinal have a well-established relationship that dates back more than 15 years, long before Latexx was listed on Bursa Malaysia.
Industry consolidation
Tough conditions could lead to consolidation. The topic of industry consolidation is not new as Top Glove has indicated numerous times publicly that it is keen to use its RM346m cash pile for synergistic acquisitions. However, no transactions have materialised, which we believe is due to the wide gap in buyers’ and sellers’ valuation expectations. However, given the fast-rising latex price and excess capacity in the low-grade natural rubber powdered glove segment, valuation expectations could narrow and pave the way for consolidation.
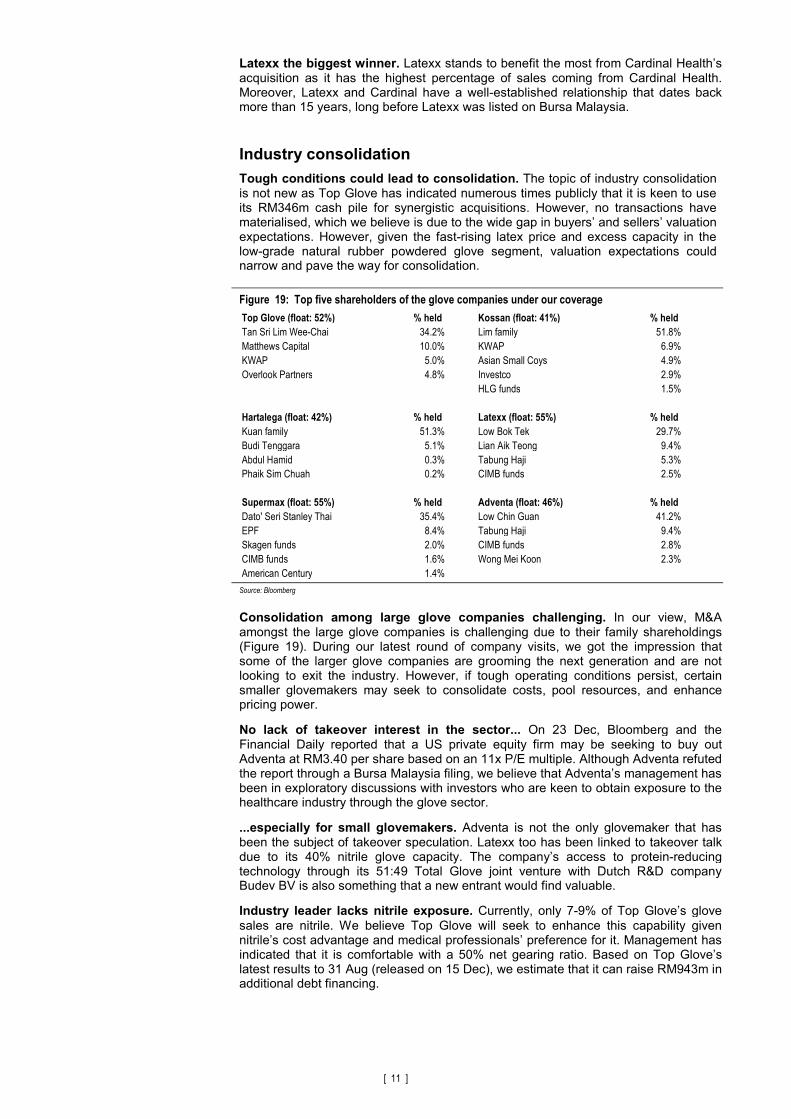
Figure 19: Top five shareholders of the glove companies under our coverage
Top Glove (float: 52%) % held Kossan (float: 41%) % held
Tan Sri Lim Wee-Chai 34.2% Lim family 51.8%
Matthews Capital 10.0% KWAP 6.9%
KWAP 5.0% Asian Small Coys 4.9%
Overlook Partners 4.8% Investco 2.9%
HLG funds 1.5%
Hartalega (float: 42%) % held Latexx (float: 55%) % held
Kuan family 51.3% Low Bok Tek 29.7%
Budi Tenggara 5.1% Lian Aik Teong 9.4%
Abdul Hamid 0.3% Tabung Haji 5.3%
Phaik Sim Chuah 0.2% CIMB funds 2.5%
Supermax (float: 55%) % held Adventa (float: 46%) % held
Dato' Seri Stanley Thai 35.4% Low Chin Guan 41.2%
EPF 8.4% Tabung Haji 9.4%
Skagen funds 2.0% CIMB funds 2.8%
CIMB funds 1.6% Wong Mei Koon 2.3%
American Century 1.4% Source: Bloomberg
Consolidation among large glove companies challenging. In our view, M&A amongst the large glove companies is challenging due to their family shareholdings (Figure 19). During our latest round of company visits, we got the impression that some of the larger glove companies are grooming the next generation and are not looking to exit the industry. However, if tough operating conditions persist, certain smaller glovemakers may seek to consolidate costs, pool resources, and enhance pricing power.
No lack of takeover interest in the sector... On 23 Dec, Bloomberg and the Financial Daily reported that a US private equity firm may be seeking to buy out Adventa at RM3.40 per share based on an 11x P/E multiple. Although Adventa refuted the report through a Bursa Malaysia filing, we believe that Adventa’s management has been in exploratory discussions with investors who are keen to obtain exposure to the healthcare industry through the glove sector.
...especially for small glovemakers. Adventa is not the only glovemaker that has been the subject of takeover speculation. Latexx too has been linked to takeover talk due to its 40% nitrile glove capacity. The company’s access to protein-reducing technology through its 51:49 Total Glove joint venture with Dutch R&D company Budev BV is also something that a new entrant would find valuable.
Industry leader lacks nitrile exposure. Currently, only 7-9% of Top Glove’s glove sales are nitrile. We believe Top Glove will seek to enhance this capability given nitrile’s cost advantage and medical professionals’ preference for it. Management has indicated that it is comfortable with a 50% net gearing ratio. Based on Top Glove’s latest results to 31 Aug (released on 15 Dec), we estimate that it can raise RM943m in additional debt financing.
[ 12 ]
Disease outbreaks would spur demand
Bird flu re-emerges in Japan and S Korea. While 2010 saw only one reported case of human bird flu (19 Nov in HK), the Shimane Prefecture in Tokyo culled 23,000 chickens on 1 Dec and South Korea slaughtered 100,000 birds on 31 Dec. In South Korea, officials also confirmed that swine flu infections have caused the death of one man.
Helping hand for medical glove demand. We expect health officials to remain cautious as bird flu is contagious and can be fatal to humans. An outbreak would be positive for rubber glove demand as Malaysia accounts for 65-70% of global supply. Utilisation rates are already healthy at 70-90% and if demand accelerates, delivery backlogs may lengthen from 2-3 months to five months, as was the case during 2009’s H1N1 pandemic. During this period, Top Glove reported utilisation rates of above 90%. Also, the higher demand and order backlog would enable glovemakers to raise average selling prices.
Actions speak louder than words. In our view, a severe case of bird flu would catalyse the modernisation of China’s healthcare sector. This would be positive for glove manufacturers as it would help to open up a market where currently, most hospitals use cheap vinyl gloves instead of the natural rubber or nitrile gloves used in more developed countries.
Top Glove is best positioned to benefit from disease outbreak. While a disease outbreak would be positive for the sector as a whole, we believe Top Glove stands to gain the most because 1) its 60-70% utilisation rate is the lowest in the sector, 2) 90% of Top Glove’s products are entry-level natural rubber gloves commonly used in hospitals and clinics, and 3) 10% of the company’s revenue comes from Asia where the latest human form of bird flu originated.
Key risks in 2011
Fast-rising rubber latex prices
With rubber and nitrile latex making up 55-60% of total production costs, managing the volatility of rubber prices is an important part of a glovemaker’s business strategy. While most of this cost can be passed on as the glovemakers use the previous month’s price when providing price quotations to customers, drastic and quick price changes can hurt margins because it lengthens the time lag between costs and price quotations.
Glovemakers mitigate unusual price fluctuations by re-pricing their glove products as frequently as possible. Some companies are doing this up to four times per month compared to once a month during periods of stable raw material prices. We note that because nitrile price has increased more gradually compared to rubber, glovemakers such as Hartalega have been able to weather higher costs better.
Foreign exchange rate volatility
On average, 95% of the glove industry’s sales are exported, with transactions priced in either US$ or €. In 2010, the US$ and € depreciated by 10.6% and 17.5% respectively, against the ringgit. This was a concern as it contributed to margin contraction. In 2011 however, we believe that forex volatility will be less of an issue for the glove sector.
We note that our house forecasts for the RM/US$ and RM/€ exchange rate are 3.05 and 4.33 respectively by end-2011. The numbers imply a further 0.5% depreciation of the US$ but a 6.2% appreciation of the € against the ringgit. As for nitrile glovemakers such as Hartalega, they are less exposed to currency fluctuations as nitrile is quoted in US$ and acts as a natural currency hedge.
Losing market share to China
While China is predominantly a vinyl market, it is not unthinkable that its glove industry could one day become a formidable force. China has access to low-cost, skilled labour and has a large healthcare market that is expected to be worth US$600bn in 2021.

[ 13 ]
However, we do not believe that Malaysian glovemakers should feel threatened. The Malaysian industry is well entrenched and, in our view, will continue to dominate the world glove industry due to 1) long-term business relationships, 2) efficient cost structures, and 3) technical expertise that is difficult to replicate.
Since the early 1990s, Malaysian glovemakers have consistently improved glove technology, enhancing line capacity by 260% from 5,000 pieces of gloves per hour to 18,000 pieces of gloves per hour. We also believe that Malaysia’s proximity to natural rubber domestically and in the region (Thailand and Indonesia) gives Malaysia an unmovable cost advantage as liquid latex is bulky, expensive to transport and can only be stored for about 12 months after being processed. We note that Thailand, Indonesia and Malaysia combined account for 90% of the world’s rubber supply.
Also, medical gloves that are exported to the US and Europe are subject to high safety and health standards. In our view, this further impedes competition from the low-cost gloves that are manufactured in China. We believe that international healthcare companies have an incentive to protect their brand and image by maintaining relationships with existing contract manufacturers as switching costs are high and switching is a time-consuming process involving facility downtime, supply disruption and thorough company audits.
Instead of US and European healthcare companies switching to a low-cost alternative in China, we believe that MNCs will outsource more glove production to their existing partners in Malaysia.
Valuation and recommendation
Top Glove commands premium valuation. Although Top Glove’s ROE of 21.4% is 9.8% pts lower than the sector average of 31.2%, the company’s 12-month trailing P/E of 13.8x is 3.9 multiple pts higher than the sector average of 9.9x. The numbers illustrate that Top Glove’s premium valuation is not purely driven by business fundamentals but is due to the stock’s superior liquidity and market size (Figure 20).
Liquidity holds the key to market appreciation. For example, Top Glove’s market cap of RM3.1bn is 2.2x the sector average of RM1.4bn. The company also commands a valuation premium because of its higher daily traded volume, which at RM6.1m is 31.1% higher than the sector’s average of RM4.7m. This comparison illustrates the importance of liquidity in valuing the glovemakers under our coverage and explains why even though Hartalega and other glove companies under our coverage have better business fundamentals than the industry leader, we value them at a discount to Top Glove’s target P/E.
Figure 20: Liquidity metrics of glovemakers under our coverage
TTM P/E P/E prem/disc. Market cap Foreign Hldg Free Float 5day ATV TTM PAT
Company (x) (%) (RM m) (%) (%) (RM '000) (RM m)
Adventa 10.0 -30% 366.7 8.0% 46.3 7,475.6 35.8
Hartalega 11.3 -20% 1,944.6 5.0% 42.4 2,833.7 172.2
Kossan 8.9 -37% 1,004.0 7.2% 41.4 2,535.8 112.9
Latexx 6.7 -53% 558.0 6.6% 55.4 2,112.8 77.2
Supermax 7.6 -46% 1,380.7 19.7% 55.9 6,918.6 179.6
Top Glove 14.2 0% 3,122.7 32.0% 44.9 6,116.7 216.1
Average 9.8 -31% 1,396.1 13.1% 47.7 4,665.5 132.3 Source: CIMB Research, Companies, Bloomberg
Strong reaction to cost and forex headwinds. Cost and forex headwinds rocked the glove sector in 2010. On average glove stocks are down 38.5% from their 52-week highs, ending the year 5.2% higher. The average 12-mth trailing P/E for the sector has fallen 17.6 multiple pts from their highs to 11.2x. The share price of the industry leader Top Glove ended the year 0.3% higher despite plummeting 31.6% from its 52-week high. Its 12-mth trailing P/E also took a dramatic turn for the worse, falling 6.2 multiple pts from its 52-week high to 14.2x (Figure 21).

[ 14 ]
Figure 21: Impact of high latex prices on glovemakers’ share prices and P/E multiples
Mkt Cap Capacity
Company (RMm) (bn pcs) Quarter NTA/sh P/NTA Current High % Chg Current High P/E Chg % Chg
Adventa 367 5.3 10/10 Q4 1.5 1.7 2.4 4.4 -44.8% 10.0 35.0 -25.0 -71%
Careplus 75 0.5 10/11 Q3 0.1 0.0 0.4 0.5 -21.1% 8.3 10.4 -2.1 -20%
Hartalega 1,945 8.8 09/11 Q2 1.2 5.5 5.4 5.7 -6.1% 11.3 16.0 -4.7 -30%
IRCB 157 2.2 10/11 Q3 0.3 2.5 0.3 1.3 -79.3% 22.5 110.1 -87.7 -80%
Kossan 1,004 12.5 09/10 Q3 1.3 2.8 3.1 4.3 -26.5% 8.9 19.4 -10.5 -54%
Latexx 558 8.0 09/10 Q3 1.1 3.4 2.6 5.0 -48.5% 6.7 18.1 -11.3 -63%
Rubberex 170 6.0 09/10 Q3 1.4 1.1 0.8 1.7 -50.0% 11.6 16.2 -4.6 -28%
Supermax 1,381 17.6 09/10 Q3 2.0 2.6 4.1 6.6 -38.5% 7.6 14.4 -6.7 -47%
Top Glove 3,123 33.0 11/11 Q1 1.9 2.9 5.1 7.4 -31.6% 14.2 20.4 -6.2 -30%
Average 975 10.4 - 1.2 2.5 2.7 4.1 -38.5% 11.2 28.9 -17.6 -47%
High 3,123 33.0 - 2.0 5.5 5.4 7.4 -6.1% 22.5 110.1 -2.1 -20%
Low 75 0.5 - 0.1 0.0 0.3 0.5 -79.3% 6.7 10.4 -87.7 -80%
52wk share price chg 52wk valuation chg: P/E (ttm)Stock's NTA valuation
Source: CIMB Research, Companies, Bloomberg
Sector trades at even more attractive valuations. After the fall in share prices, the
glove sector is trading at a CY12 P/E of just 6.8x, which is more than half of the 12.7x for the market. In our view, these valuations are undemanding given the sector’s 3-year EPS CAGR of 16.3% which is well-supported by the steady global demand growth of 8-10% p.a. Also, the sector’s earnings are backed by long-term structural trends such as 1) the modernisation of the healthcare sector in China and India, 2) increasing hygiene awareness in emerging countries, and 3) increased medical coverage for 32m uninsured Americans as part of the US healthcare reform bill.
Advantages of nitrile not well understood. In view of the nitrile advantages described above, we believe that companies with high nitrile exposure have 1) superior growth prospects, 2) higher security of cash flow, and 3) are better positioned to withstand protracted raw material price volatility. These advantages were not as apparent during previous economic cycles because earnings growth was capacity led. This, in our view, masked the inherent cost advantages of nitrile gloves. For example, during 2008-2009, we believe investors paid less attention to the threat of rising commodity prices including rubber because of the strong global demand generated by the H1N1 flu pandemic. If operating conditions stay bearish, we believe the market will begin to pay more attention to the nitrile glovemakers such as Hartalega.
Growth prospects still bright. Despite cost and forex headwinds, the glove sector still offers investors a 3-year EPS CAGR of 16%, higher than the KLCI’s core EPS growth of 13.9% for 2011 and 13.2% for 2012. Demand growth for gloves is still robust and steady at 8-10% p.a. Due to its cost advantages and protein-free properties, nitrile glove demand is projected to grow above the sector’s average at 15% p.a. in 2010-15 to 74bn gloves or 20.5% of total global demand (Figure 13 above).
Glovemaker’s strategies for 2011
Although industry bellwether Top Glove is cautious about demand in the low-end rubber glove segment, other big-cap companies such as Hartalega, Supermax and Kossan are still bullish on the glove sector. Hartalega specifically expects the market for nitrile gloves to expand by 15%, which is above the 8-10% industry average. While the small-cap companies (Adventa and Latexx) are also optimistic on the industry, we believe that Adventa’s shareholders would exit the sector if an attractive offer was on the table.
Adventa – This surgical glove specialist will focus on completing two projects 1) integrating the 1.3bn pieces of glove capacity that management commissioned during 4Q10 in Kota Bharu, Kelantan and 2) constructing its new 1.5bn nitrile glove plant in Kluang, Johor which is expected to be commissioned by 4Q10. We also believe that the company may restructure its operations in Uruguay, which have been set up to supply gloves to the Brazilian healthcare industry. In our view, substituting rubber with nitrile for surgical gloves would be more challenging as rubber is more elastic and is better suited for long and detailed surgical procedures. Potential re-rating catalysts include 1) higher OBM glove sales, 2) better product mix, and 3) takeover speculation.
Hartalega – The world’s largest nitrile glovemaker is optimistic about nitrile glove demand. Management expects it to rise 15% to 42.3bn pieces of gloves in 2011. Hartalega’s share of this market is c 20%, which suggests room for expansion. The company will spend 1Q11 integrating Plant 5 with its other factories in Bestari Jaya. This state-of-the-art plant has a line capacity of 35,000 pieces of gloves per hour, double the industry average. The company will also continue to refurbish old lines at

[ 15 ]
Plant 1 and 2, which were built in 1992 and 1997m respectively. Post refurbishment, we expect to see higher overall line speed and higher operational efficiency due to lower rejection rates and lower energy costs. This will add capacity of c. 1bn pieces of gloves even without a new plant. We also expect Hartalega to be aggressive in its public relations campaign against allegations of health and safety violations by the residents of Taman Suria, Bestari Jaya. We believe the following catalysts could trigger a re-rating of Hartalega’s share price, 1) better operating efficiency, 2) higher output from refurbished lines, and 3) higher ASPs from selling higher quality gloves.
Kossan – The company is optimistic on the glove industry. We expect it to expand its MNC client base in 2011. Specifically, we understand that Kossan’s management is in advanced discussions with a large Asian distributor for it to supply clean room gloves. Also, it is in talks with two of its existing MNC clients to add capacity. As at 30 Sep 2010, 43% of Kossan’s capacity was nitrile. Given the company’s aim to increase nitrile to 50% in the quarters ahead, we expect the company to be busy refurbishing and adding new nitrile lines in 2011. Potential re-rating catalysts for the stock include 1) new orders from Japanese and US OEM brands, 2) high utilisation rates, and 3) margin improvement from higher nitrile sales and productivity gains.
Latexx – In Mar 2010, Latexx signed a licensing agreement with Dutch R&D company Budev B.V. giving Latexx the exclusive rights to use Budev’s protein-reducing technology to produce low protein rubber gloves. This was supposed to be the company’s first OBM product. However, there have been no further developments on this matter and we believe Latexx has put this initiative on hold as rubber gloves are now more expensive than nitrile gloves, which are already protein-free. We expect renewed interest in this technology if rubber prices correct in 2011. Factors that could trigger a re-rating include 1) a better product mix, 2) demand for ultra-thin rubber gloves, and 3) resumption of its delayed capacity expansion programme.
Supermax – This Sungai Buloh-based company is optimistic about the glove industry as management expects the steady improvement of hygiene standards in Asia to lift demand for medical gloves. In 2011, we expect management to focus on 1) completing the refurbishment of its Sungai Buloh plant to manufacture surgical gloves, 2) finalising the low-tax regional distribution hub that management promised during its 3Q10 results briefing in Nov 10, 3) promoting its stock amongst US investors through the American Depositary Receipt programme that was completed on 20 Dec 2010, and 4) increasing nitrile capacity from 24% to 35% by refurnishing old lines, reconfiguring existing rubber lines and building new capacity. The stock could be catalysed by 1) higher nitrile glove sales, 2) refurbishment of the company’s Sungai Buloh plant for the manufacture of surgical gloves, and 3) tax savings from the company’s regional distribution hub in Malaysia.
Top Glove – The world’s largest glovemaker’s biggest challenge in 2011 will be remodelling its business strategies to weather fast-rising latex prices. Management remains cautious on demand for low-end rubber gloves in 2011 and has indicated that, demand in this segment has normalised after the H1N1 outbreak. Unless there are demand catalysts such as a severe disease outbreak or a restocking of inventories, we do not expect Top Glove’s utilisation rates to exceed its current 60-70%. The company has not detailed how it intends to revamp its business model. We believe more will be revealed at its annual general meeting on 11 Jan 2011. Nevertheless, management has indicated that it intends to increase nitrile capacity from 7-9% currently to 20% by end-2011. This will enable the company to enhance earnings through better margins. Potential re-rating catalysts include 1) distributors’ restocking of inventories, which have been whittled down to as low as a month, 2) diversification of its product mix, and 3) commissioning of its two nitrile glove factories with a capacity of 1.5bn pieces of gloves each in FY11.
Maintain OVERWEIGHT. Despite cost headwinds from fast escalating rubber latex prices and a weakening of the US dollar, we reiterate our OVERWEIGHT weighting on the rubber glove sector. We maintain our earnings numbers, make no changes to our target prices and continue to rate all the glovemakers under coverage as Outperforms. Potential re-rating catalysts for the sector include 1) the eventual moderation of rubber latex prices, 2) increased outsourcing by MNCs, 3) the positive impact of price increases, and 4) takeover speculation surrounding small-cap glovemakers.
Hartalega remains our top pick. While we believe Hartalega will outperform the sector in the quarters ahead as it is the largest nitrile producer, we retain our 13.05x target P/E valuation for the stock or a 10% discount to Top Glove’s 14.5x target P/E due to its poorer share liquidity. Hartalega has the lowest free float among the glovemakers under our coverage at 42.4% compared to the sector average of 48.7%. But we think

[ 16 ]
that the stock’s actual free float is closer to 20-30% as we believe the company’s top 10 shareholders are strategic investors. Should Hartalega’s liquidity and size improve in the quarters ahead, we would take the opportunity to revise our valuation basis and target price.

[ 17 ]
APPENDICES…

[ 18 ]
Figure 1: Rubber glove value chain
Source: CIMB Research, Companies
Notes:-
1.Original brands: Ansell, Kimberly Clark, S
upermax
2.Distributors: H
enry Schein, Medline, Microflex, Cardinal H
ealth,A
merisource Bergen, McK
esson, Broschdirect
OEM and OBM
Glovemakers
Direct
distribution
Indirect
distribution
End users
Intermediaries
Medical centres
C
Original brands(1)
Hospitals and Clinics
A B
Regional importers
F
Medical distributors
(2)
Trading houses
D E
Natural rubber
plantations and
cracking plants
Medical
Gloves
Clean room
Gloves
General
Gloves
Industrial
Gloves
Direct &
indirect
Intermediaries & End
Users
Retailers, S
upermarkets
Direct &
indirect
Intermediaries & End
Users
Chemical, autom
obile,
meat, construction
Direct &
indirect
Intermediaries & End
Users
Sem
iconductor &
chipmakers
F G H
Adventa, C
areplus,
Hartalega, K
ossan,
Latexx, R
ubberex,
Supermax, T
op Glove,
YTY Group
Riverstone
Rubberex
Rubberex

[ 19 ]
Figure 2: Location of major glovemakers
Source: CIMB Research, Companies’ annual reports
Kluang
Sitiawan:
Senawang:
Kota Bharu:
Klang:
Malacca:
Selangor (1)
Ipoh (2):
Notes:-1. Supermax (Sungai Buloh); Hartalega (Ijok); Top Glove (Banting); Riverstone (Bukit Beruntung)
2. Rubberex (Kampung Bercham); Supermax (Lahat, Kamunting); Latexx (Kamunting); Top Glove (Kampung Tasek); Riversone(Taiping)
KluangKluang
Sitiawan:Sitiawan:
Senawang:Senawang:
Kota Bharu:Kota Bharu:
Klang:Klang:
Malacca:Malacca:
Selangor (1)Selangor (1)
Ipoh (2):Ipoh (2):
Notes:-1. Supermax (Sungai Buloh); Hartalega (Ijok); Top Glove (Banting); Riverstone (Bukit Beruntung)
2. Rubberex (Kampung Bercham); Supermax (Lahat, Kamunting); Latexx (Kamunting); Top Glove (Kampung Tasek); Riversone(Taiping)

[ 20 ]
Figure 3: Geographical sales breakdown
Adventa Latexx
M. East, S.
Asia, 15%
S. America,
10%USA,
Canada,
30%
Europe, 35%
Asia Pacific,
10%
S. America,
4%
Msia, 2%Middle East,
1%
USA, 69%
Europe, 13%
Asia Pacific,
11%
Hartalega Supermax
Asia Pacific,
9%
Europe, 9%
USA, 77%
Msia, 1%
Others, 4%
Asia, 6%
Europe, 26%
USA,
Canada,
42%
S. America,
16%C. America,
4%
Africa, M.
East, 6%
Kossan Top Glove
Asia Pacific,
10%
Europe, 30%
USA,
Canada,
50%
Others, 2%
S. America,
4%Middle East,
4%
Asia, 9%
Middle East,
6%Other, 3%
Europe, 33%
USA, 29%
S. America,
20%
Source: CIMB Research (latest investor presentations), Companies
[ 21 ]
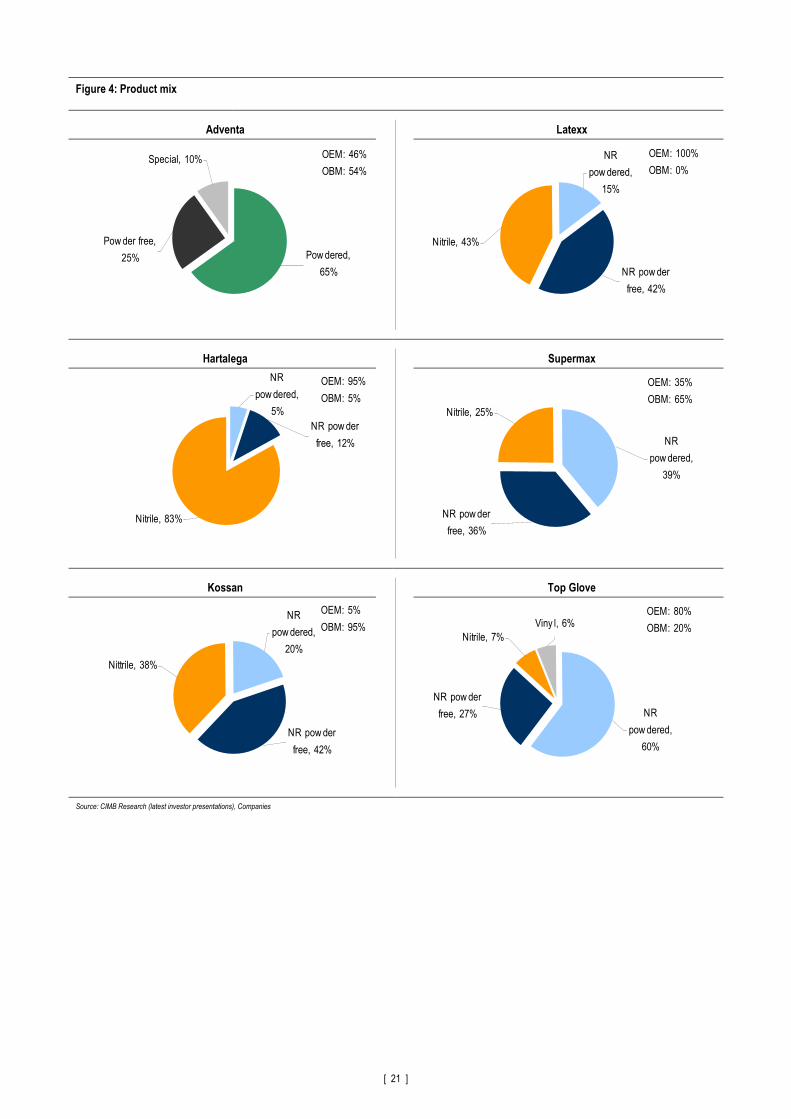
Figure 4: Product mix
Adventa Latexx
Hartalega Supermax
Kossan Top Glove
Source: CIMB Research (latest investor presentations), Companies
Nitrile, 43%
NR powder
free, 42%
NR
powdered,
15%
OEM: 100%
OBM: 0%
Viny l, 6%
NR
powdered,
60%
NR powder
free, 27%
Nitrile, 7%
OEM: 80%
OBM: 20%
Powdered,
65%
Powder free,
25%
Special, 10% OEM: 46%
OBM: 54%
NR
powdered,
5%
NR powder
free, 12%
Nitrile, 83%
OEM: 95%
OBM: 5%
NR
powdered,
39%
NR powder
free, 36%
Nitrile, 25%
OEM: 35%
OBM: 65%
Nittrile, 38%
NR powder
free, 42%
NR
powdered,
20%
OEM: 5%
OBM: 95%

[ 22 ]
Figure 5: Cost structure
Adventa Latexx
Information not available Chemical,
8%
Fuel, 9% Latex , 65%
Overheads,
8%
Packaging,
4%
Labour, 6%
Hartalega Supermax
Labour, 9%
Packaging,
4%
Overheads,
19%
Latex , 51%
Fuel, 8%
Chemical,
9%
Chemical,
9%
Fuel, 10%
Latex , 57%
Overheads,
7%Packaging,
8%
Labour, 9%
Kossan Top Glove
Labour, 9%
Packaging,
9%
Overheads,
8%
Latex , 56%
Fuel, 9%
Chemical,
9%
Labour, 8%
Packaging,
6%
Overheads,
11%
Latex , 59%
Fuel, 8%
Chemical,
8%
Source: CIMB Research (latest investor presentations), Companies

[ 23 ]
Figure 6: Shareholding structure
Adventa Latexx
Wong Mei
Koon, 2.3%
Low Chin
Guan, 41.2%
Tambung
Haji, 9.4%
CIMB funds,
2.8%
CIMB funds,
2.5%
Low Bok
Tek, 29.7%
Lian Aik
Teong, 9.4%
Tambung
Haji, 5.3%
Hartalega Supermax
Abdul Hamid,
0.3%Budi
Tenggara,
5.1%
Kuan family ,
51.3%
Phaik Sim
Chuah, 0.2%
CIMB funds,
1.6%American
Century ,
1.4%
Dato' Seri
Stanley Thai,
35.4%
EPF, 8.4%
Skagen
funds, 2.0%
Kossan Top Glove
Asian Small
Coy s, 4.9%
KWAP, 6.9%
Lim family ,
51.8%
HLG funds,
1.5%
Inv estco,
2.9%
KWAP, 5.0%
Matthews
Capital,
10.0%
Tan Sri Lim
Wee-Chai,
34.2%
Overlook
Partners,
4.8%
Source: CIMB Research, Companies
[ 24 ]
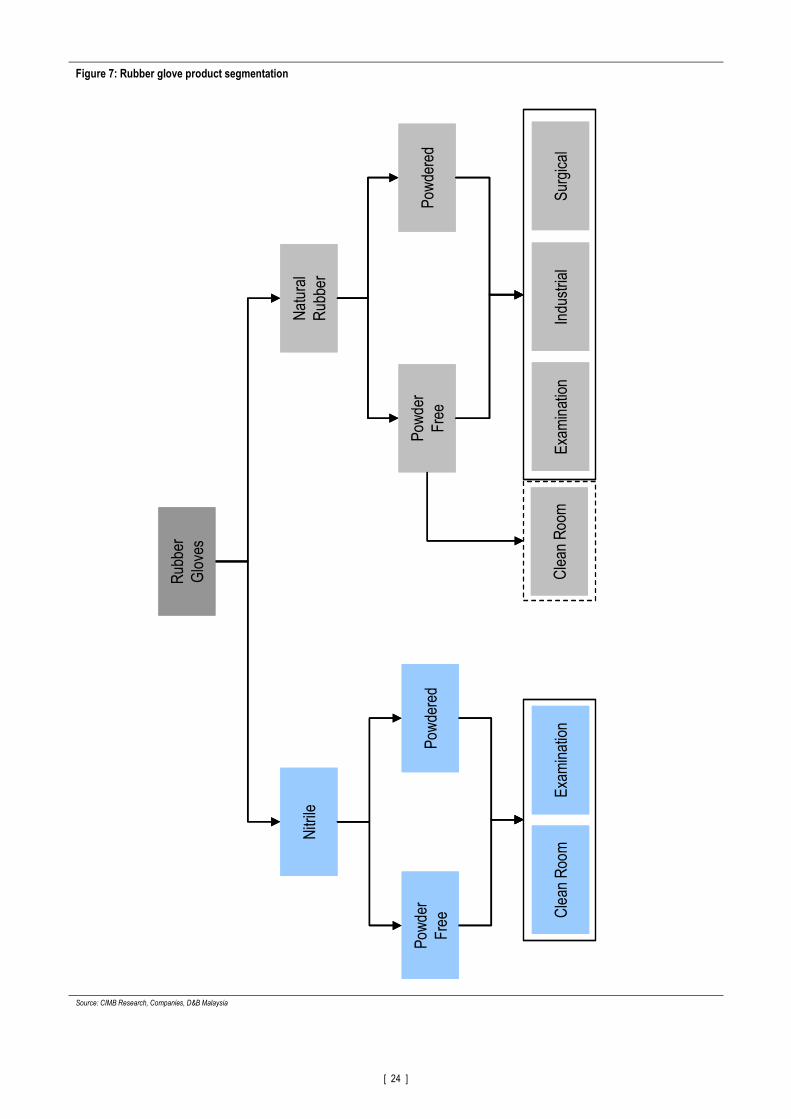
Figure 7: Rubber glove product segmentation
Source: CIMB Research, Companies, D&B Malaysia
Nitrile
Natural
Rubber
Rubber
Gloves
Pow
der
Free
Pow
dered
Examination
Industrial
Surgical
Pow
der
Free
Pow
dered
Clean Room
Examination
Clean Room
Nitrile
Natural
Rubber
Rubber
Gloves
Pow
der
Free
Pow
dered
Examination
Industrial
Surgical
Examination
Industrial
Surgical
Pow
der
Free
Pow
dered
Clean Room
Examination
Clean Room
Examination
Clean Room

[ 25 ]
DISCLAIMER
This report is not directed to, or intended for distribution to or use by, any person or entity who is a citizen or resident of or located in any locality, state, country or other jurisdiction where such distribution, publication, availability or use would be contrary to law or regulation.
By accepting this report, the recipient hereof represents and warrants that he is entitled to receive such report in accordance with the restrictions set forth below and agrees to be bound by the limitations contained herein (including the “Restrictions on Distributions” set out below). Any failure to comply with these limitations may constitute a violation of law. This publication is being supplied to you strictly on the basis that it will remain confidential. No part of this report may be (i) copied, photocopied, duplicated, stored or reproduced in any form by any means or (ii) redistributed or passed on, directly or indirectly, to any other person in whole or in part, for any purpose without the prior written consent of CIMB.
CIMB, its affiliates and related companies, their directors, associates, connected parties and/or employees may own or have positions in securities of the company(ies) covered in this research report or any securities related thereto and may from time to time add to or dispose of, or may be materially interested in, any such securities. Further, CIMB, its affiliates and its related companies do and seek to do business with the company(ies) covered in this research report and may from time to time act as market maker or have assumed an underwriting commitment in securities of such company(ies), may sell them to or buy them from customers on a principal basis and may also perform or seek to perform significant investment banking, advisory or underwriting services for or relating to such company(ies) as well as solicit such investment, advisory or other services from any entity mentioned in this report. The views expressed in this report accurately reflect the personal views of the analyst(s) about the subject securities or issuers and no part of the compensation of the analyst(s) was, is, or will be directly or indirectly related to the inclusion of specific recommendations(s) or view(s) in this report. CIMB prohibits the analyst(s) who prepared this research report from receiving any compensation, incentive or bonus based on specific investment banking transactions or for providing a specific recommendation for, or view of, a particular company. However, the analyst(s) may receive compensation that is based on his/their coverage of company(ies) in the performance of his/their duties or the performance of his/their recommendations and the research personnel involved in the preparation of this report may also participate in the solicitation of the businesses as described above. In reviewing this research report, an investor should be aware that any or all of the foregoing, among other things, may give rise to real or potential conflicts of interest. Additional information is, subject to the duties of confidentiality, available on request.
The term “CIMB” shall denote where applicable the relevant entity distributing the report in that particular jurisdiction where mentioned specifically below shall be a CIMB Group Sdn Bhd’s affiliates, subsidiaries and related companies.
(i) As of 3 January 2011, CIMB has a proprietary position in the following securities in this report:
(a) Supermax, Supermax CW, Top Glove, Top Glove CW.
(ii) As of 4 January 2011, the analyst, Terence Wong who prepared this report, has / have an interest in the securities in the following company or companies covered or recommended in this report:
(a) -.
The information contained in this research report is prepared from data believed to be correct and reliable at the time of issue of this report. This report does not purport to contain all the information that a prospective investor may require. CIMB or any of its affiliates does not make any guarantee, representation or warranty, express or implied, as to the adequacy, accuracy, completeness, reliability or fairness of any such information and opinion contained in this report and accordingly, neither CIMB nor any of its affiliates nor its related persons shall be liable in any manner whatsoever for any consequences (including but not limited to any direct, indirect or consequential losses, loss of profits and damages) of any reliance thereon or usage thereof.
This report is general in nature and has been prepared for information purposes only. It is intended for circulation amongst CIMB and its affiliates’ clients generally and does not have regard to the specific investment objectives, financial situation and the particular needs of any specific person who may receive this report. The information and opinions in this report are not and should not be construed or considered as an offer, recommendation or solicitation to buy or sell the subject securities, related investments or other financial instruments thereof.
Investors are advised to make their own independent evaluation of the information contained in this research report, consider their own individual investment objectives, financial situation and particular needs and consult their own professional and financial advisers as to the legal, business, financial, tax and other aspects before participating in any transaction in respect of the securities of company(ies) covered in this research report. The securities of such company(ies) may not be eligible for sale in all jurisdictions or to all categories of investors.
Australia: Despite anything in this report to the contrary, this research is provided in Australia by CIMB Research Pte. Ltd. (“CIMBR”) and CIMBR notifies each recipient and each recipient acknowledges that CIMBR is exempt from the requirement to hold an Australian financial services licence under the Corporations Act 2001 (Cwlth) in respect of financial services provided to the recipient. CIMBR is regulated by the Monetary Authority of Singapore under the laws of Singapore, which differ from Australian laws. This research is only available in Australia to persons who are “wholesale clients” (within the meaning of the Corporations Act 2001 (Cwlth)) and is supplied solely for the use of such wholesale clients and shall not be distributed or passed on to any other person. This research has been prepared without taking into account the objectives, financial situation or needs of the individual recipient.
France: Only qualified investors within the meaning of French law shall have access to this report. This report shall not be considered as an offer to subscribe to, or used in connection with, any offer for subscription or sale or marketing or direct or indirect distribution of financial instruments and it is not intended as a solicitation for the purchase of any financial instrument.
Hong Kong: This report is issued and distributed in Hong Kong by CIMB Securities (HK) Limited (“CHK”) which is licensed in Hong Kong by the Securities and Futures Commission for Type 1 (dealing in securities), Type 4 (advising on securities) and Type 6 (advising on corporate finance) activities. Any investors wishing to purchase or otherwise deal in the securities covered in this report should contact the Head of Sales at CIMB Securities (HK) Limited. The views and opinions in this research report are our own as of the date hereof and are subject to change. If the Financial Services and Markets Act of the United Kingdom or the rules of the Financial Services Authority apply to a recipient, our obligations owed to such recipient therein are unaffected. CHK has no obligation to update its opinion or the information in this research report.
This publication is strictly confidential and is for private circulation only to clients of CHK. This publication is being supplied to you strictly on the basis that it will remain confidential. No part of this material may be (i) copied, photocopied, duplicated, stored or reproduced in any form by any means or (ii) redistributed or passed on, directly or indirectly, to any other person in whole or in part, for any purpose without the prior written consent of CHK. Unless permitted to do so by the securities laws of Hong Kong, no person may issue or have in its possession for the purposes of issue, whether in Hong Kong or elsewhere, any advertisement, invitation or document relating to the securities covered in this report, which is directed at, or the contents of which are likely to be accessed or read by, the public in Hong Kong (except if permitted to do so under the securities laws of Hong Kong).
Indonesia: This report is issued and distributed by PT CIMB Securities Indonesia (“CIMBI”). The views and opinions in this research report are our own as of the date hereof and are subject to change. If the Financial Services and Markets Act of the United Kingdom or the rules of the Financial Services Authority apply to a recipient, our obligations owed to such recipient therein are unaffected. CIMBI has no obligation to update its opinion or the information in this research report.
This publication is strictly confidential and is for private circulation only to clients of CIMBI. This publication is being supplied to you strictly on the basis that it will remain confidential. No part of this material may be (i) copied, photocopied, duplicated, stored or reproduced in any form by any means or (ii) redistributed or passed on, directly or indirectly, to any other person in whole or in part, for any purpose without the prior written consent of CIMBI. Neither this report nor any copy hereof may be distributed in Indonesia or to any Indonesian citizens wherever they are domiciled or to Indonesia residents except in compliance with applicable Indonesian capital market laws and regulations.
Malaysia: This report is issued and distributed by CIMB Investment Bank Berhad (“CIMB”). The views and opinions in this research report are our own as of the date hereof and are subject to change. If the Financial Services and Markets Act of the United Kingdom or the rules of the Financial Services Authority apply to a recipient, our obligations owed to such recipient therein are unaffected. CIMB has no obligation to update its opinion or the information in this research report.
This publication is strictly confidential and is for private circulation only to clients of CIMB. This publication is being supplied to you strictly on the basis that it will remain confidential. No part of this material may be (i) copied, photocopied, duplicated, stored or reproduced in any form by any means or (ii) redistributed or passed on, directly or indirectly, to any other person in whole or in part, for any purpose without the prior written consent of CIMB.

[ 26 ]
New Zealand: In New Zealand, this report is for distribution only to persons whose principal business is the investment of money or who, in the course of, and for the purposes of their business, habitually invest money pursuant to Section 3(2)(a)(ii) of the Securities Act 1978.
Singapore: This report is issued and distributed by CIMB Research Pte Ltd (“CIMBR”). Recipients of this report are to contact CIMBR in Singapore in respect of any matters arising from, or in connection with, this report. The views and opinions in this research report are our own as of the date hereof and are subject to change. If the Financial Services and Markets Act of the United Kingdom or the rules of the Financial Services Authority apply to a recipient, our obligations owed to such recipient therein are unaffected. CIMBR has no obligation to update its opinion or the information in this research report.
This publication is strictly confidential and is for private circulation only. If the recipient of this research report is not an accredited investor, expert investor or institutional investor, CIMBR accepts legal responsibility for the contents of the report without any disclaimer limiting or otherwise curtailing such legal responsibility. This publication is being supplied to you strictly on the basis that it will remain confidential. No part of this material may be (i) copied, photocopied, duplicated, stored or reproduced in any form by any means or (ii) redistributed or passed on, directly or indirectly, to any other person in whole or in part, for any purpose without the prior written consent of CIMBR.
As of 3 January 2011 CIMB Research Pte Ltd does not have a proprietary position in the recommended securities in this report.
Sweden: This report contains only marketing information and has not been approved by the Swedish Financial Supervisory Authority. The distribution of this report is not an offer to sell to any person in Sweden or a solicitation to any person in Sweden to buy any instruments described herein and may not be forwarded to the public in Sweden.
Taiwan: This research report is not an offer or marketing of foreign securities in Taiwan. The securities as referred to in this research report have not been and will not be registered with the Financial Supervisory Commission of the Republic of China pursuant to relevant securities laws and regulations and may not be offered or sold within the Republic of China through a public offering or in circumstances which constitutes an offer within the meaning of the Securities and Exchange Law of the Republic of China that requires a registration or approval of the Financial Supervisory Commission of the Republic of China.
Thailand: This report is issued and distributed by CIMB Securities (Thailand) Company Limited (CIMBS). The views and opinions in this research report are our own as of the date hereof and are subject to change. If the Financial Services and Markets Act of the United Kingdom or the rules of the Financial Services Authority apply to a recipient, our obligations owed to such recipient therein are unaffected. CIMBS has no obligation to update its opinion or the information in this research report.
This publication is strictly confidential and is for private circulation only to clients of CIMBS. This publication is being supplied to you strictly on the basis that it will remain confidential. No part of this material may be (i) copied, photocopied, duplicated, stored or reproduced in any form by any means or (ii) redistributed or passed on, directly or indirectly, to any other person in whole or in part, for any purpose without the prior written consent of CIMBS.
United Arab Emirates: The distributor of this report has not been approved or licensed by the UAE Central Bank or any other relevant licensing authorities or governmental agencies in the United Arab Emirates. This report is strictly private and confidential and has not been reviewed by, deposited or registered with UAE Central Bank or any other licensing authority or governmental agencies in the United Arab Emirates. This report is being issued outside the United Arab Emirates to a limited number of institutional investors and must not be provided to any person other than the original recipient and may not be reproduced or used for any other purpose. Further, the information contained in this report is not intended to lead to the sale of investments under any subscription agreement or the conclusion of any other contract of whatsoever nature within the territory of the United Arab Emirates.
United Kingdom: This report is being distributed by CIMB Securities (UK) Limited only to, and is directed at selected persons on the basis that those persons are (a) persons falling within Article 19 of the Financial Services and Markets Act 2000 (Financial Promotions) Order 2005 (the “Order”) who have professional experience in investments of this type or (b) high net worth entities, and other persons to whom it may otherwise lawfully be communicated, falling within Article 49(1) of the Order, (all such persons together being referred to as “relevant persons”). A high net worth entity includes a body corporate which has (or is a member of a group which has) a called-up share capital or net assets of not less than (a) if it has (or is a subsidiary of an undertaking which has) more than 20 members, £500,000, (b) otherwise, £5 million, the trustee of a high value trust or an unincorporated association or partnership with assets of no less than £5 million. Directors, officers and employees of such entities are also included provided their responsibilities regarding those entities involve engaging in investment activity. Persons who do not have professional experience relating to investments should not rely on this document.
United States: This research report is distributed in the United States of America by CIMB Securities (USA) Inc, a U.S.-registered broker-dealer and a related company of CIMB Research Pte Ltd solely to persons who qualify as "Major U.S. Institutional Investors" as defined in Rule 15a-6 under the Securities and Exchange Act of 1934. This communication is only for Institutional Investors and investment professionals whose ordinary business activities involve investing in shares, bonds and associated securities and/or derivative securities and who have professional experience in such investments. Any person who is not an Institutional Investor must not rely on this communication. However, the delivery of this research report to any person in the United States of America shall not be deemed a recommendation to effect any transactions in the securities discussed herein or an endorsement of any opinion expressed herein. For further information or to place an order in any of the above-mentioned securities please contact a registered representative of CIMB Securities (USA) Inc.
Other jurisdictions: In any other jurisdictions, except if otherwise restricted by laws or regulations, this report is only for distribution to professional, institutional or sophisticated investors as defined in the laws and regulations of such jurisdictions.
RECOMMENDATION FRAMEWORK #1*
STOCK RECOMMENDATIONS SECTOR RECOMMENDATIONS
OUTPERFORM: The stock's total return is expected to exceed a relevant benchmark's total return by 5% or more over the next 12 months.
OVERWEIGHT: The industry, as defined by the analyst's coverage universe, is expected to outperform the relevant primary market index over the next 12 months.
NEUTRAL: The stock's total return is expected to be within +/-5% of a relevant benchmark's total return.
NEUTRAL: The industry, as defined by the analyst's coverage universe, is expected to perform in line with the relevant primary market index over the next 12 months.
UNDERPERFORM: The stock's total return is expected to be below a relevant benchmark's total return by 5% or more over the next 12 months.
UNDERWEIGHT: The industry, as defined by the analyst's coverage universe, is expected to underperform the relevant primary market index over the next 12 months.
TRADING BUY: The stock's total return is expected to exceed a relevant benchmark's total return by 5% or more over the next 3 months.
TRADING BUY: The industry, as defined by the analyst's coverage universe, is expected to outperform the relevant primary market index over the next 3 months.
TRADING SELL: The stock's total return is expected to be below a relevant benchmark's total return by 5% or more over the next 3 months.
TRADING SELL: The industry, as defined by the analyst's coverage universe, is expected to underperform the relevant primary market index over the next 3 months.
* This framework only applies to stocks listed on the Singapore Stock Exchange, Bursa Malaysia, Stock Exchange of Thailand and Jakarta Stock Exchange. Occasionally, it is permitted for the total expected returns to be temporarily outside the prescribed ranges due to extreme market volatility or other justifiable company or industry-specific reasons.
CIMB Research Pte Ltd (Co. Reg. No. 198701620M)

[ 27 ]
RECOMMENDATION FRAMEWORK #2 **
STOCK RECOMMENDATIONS SECTOR RECOMMENDATIONS
OUTPERFORM: Expected positive total returns of 15% or more over the next 12 months.
OVERWEIGHT: The industry, as defined by the analyst's coverage universe, has a high number of stocks that are expected to have total returns of +15% or better over the next 12 months.
NEUTRAL: Expected total returns of between -15% and +15% over the next 12 months.
NEUTRAL: The industry, as defined by the analyst's coverage universe, has either (i) an equal number of stocks that are expected to have total returns of +15% (or better) or -15% (or worse), or (ii) stocks that are predominantly expected to have total returns that will range from +15% to -15%; both over the next 12 months.
UNDERPERFORM: Expected negative total returns of 15% or more over the next 12 months.
UNDERWEIGHT: The industry, as defined by the analyst's coverage universe, has a high number of stocks that are expected to have total returns of -15% or worse over the next 12 months.
TRADING BUY: Expected positive total returns of 15% or more over the next 3 months.
TRADING BUY: The industry, as defined by the analyst's coverage universe, has a high number of stocks that are expected to have total returns of +15% or better over the next 3 months.
TRADING SELL: Expected negative total returns of 15% or more over the next 3 months.
TRADING SELL: The industry, as defined by the analyst's coverage universe, has a high number of stocks that are expected to have total returns of -15% or worse over the next 3 months.
** This framework only applies to stocks listed on the Hong Kong Stock Exchange and China listings on the Singapore Stock Exchange. Occasionally, it is permitted for the total expected returns to be temporarily outside the prescribed ranges due to extreme market volatility or other justifiable company or industry-specific reasons.