running away from the poor: bolsa-familia and entry in ... · running away from the poor:...
TRANSCRIPT
Running Away from the Poor:
Bolsa-Familia and Entry in School Markets ∗
Naercio Menezes-Filho† Rodrigo Moita‡ Eduardo de Carvalho Andrade§
July 22, 2014
Abstract
This paper shows that policies designed to reduce inequality may fail because socioeco-
nomic strati�cation can reappear through the private school system. We develop a theoretical
model linking the skill distribution of the student population in the public system to the prof-
itability of private schools. We then use panel data of Brazilian municipalities to examine the
relationship between the test scores dispersion in the public school system and private school
entry. The expansion of the Bolsa-Familia program, an important conditional cash trans-
fer program implemented in Brazil after democratization, is used as a source of exogenous
variation for the students' test scores distribution. Our results show that towns where the
students' skill distribution widened due to the expansion of the Bolsa-Familia program were
more likely to attract new private schools, which is consistent with the view of endogenous
persistence of inequality in the face of a change in political institutions.
Key words: inequality, school market, education, social interactions.
JEL Classi�cation: I21∗We thank Bruno Komatsu, Marcos Lee and Roberto Rocha for excellent research assistance. We have bene�ted
from comments and suggestions from Miguel Foguel, Vladimir Ponczek, Miguel Urquiola, Sergio Urzua and seminarparticipants at USP, EESP-FGV, EPGE-FGV, PUC-RJ, Insper, NIP, Econometric Society, IIOC and EARIE.†Insper Institute of Education and Research and University of Sao Paulo. Email: [email protected]‡Insper Institute of Education and Research. Email: [email protected]§Insper Institute of Education and Research. Email: [email protected]
1
1 Introduction
Economists have always been worried about improving the prospects of the poor and reducing
income inequality. One way of doing this is to equalize opportunities, especially through improving
access to good schools among the children raised in poor families. Since education is a strong
predictor of future earnings, equalizing access to better quality education is likely to increase
inter-generational mobility and reduce future inequality. The di�culty with doing this is that
individuals and families sort in a number of ways, such as schools and neighborhoods. Poor
families tend to live in the same neighborhoods and go to the same schools, generally of lower
quality, which reinforces inequality (see Fernandez [16] and Fryer and Katz [21]).
Several policies have been devised and implemented to try to break this cycle, such as the
Moving to Opportunity (MTO) experiment (Katz et al [27]), changes in the school �nance (Hoxby
[26]) and conditional cash transfers programs (CCTs) in developing countries (Saavedra and Garcia
[32]). The existing evidence on the results of most of these policies is rather disappointing, however,
as improving neighborhoods, sending poor families to richer neighborhoods, or reforming the school
�nance do not seem to improve education outcomes of poor families per se (see Fryer and Katz
[21]). The exception seems to be the CCTs, which have succeed in terms of increasing access of
poor children to schools. The case of Bolsa-Familia, the CCT program implemented in Brazil after
democratization currently reaching 44 million poor people, is seen worldwide as a success case, a
classic example of a change in the political system that, by extending the voting franchise, has
led to lower poverty and inequality (Meltzer and Richards [30], Acemoglu et al [2]). This has lead
to the introduction of conditional cash transfers programs in developed countries as well, as in
New York (Riccio et al [33]). Are conditional cash transfers, therefore, the way forward to reduce
income inequality and increase inter-generational mobility?
This paper shows that the forces at work leading to strati�cation are harder to overcome
than what one might think at �rst. Policies aimed at equalizing the access and quality of the
public schools in order to reduce future inequality may fail because strati�cation can reappear
through the private school system. Without the possibility of enrolling their children in a better
than average public school, richer families may move their children to private schools. More
2

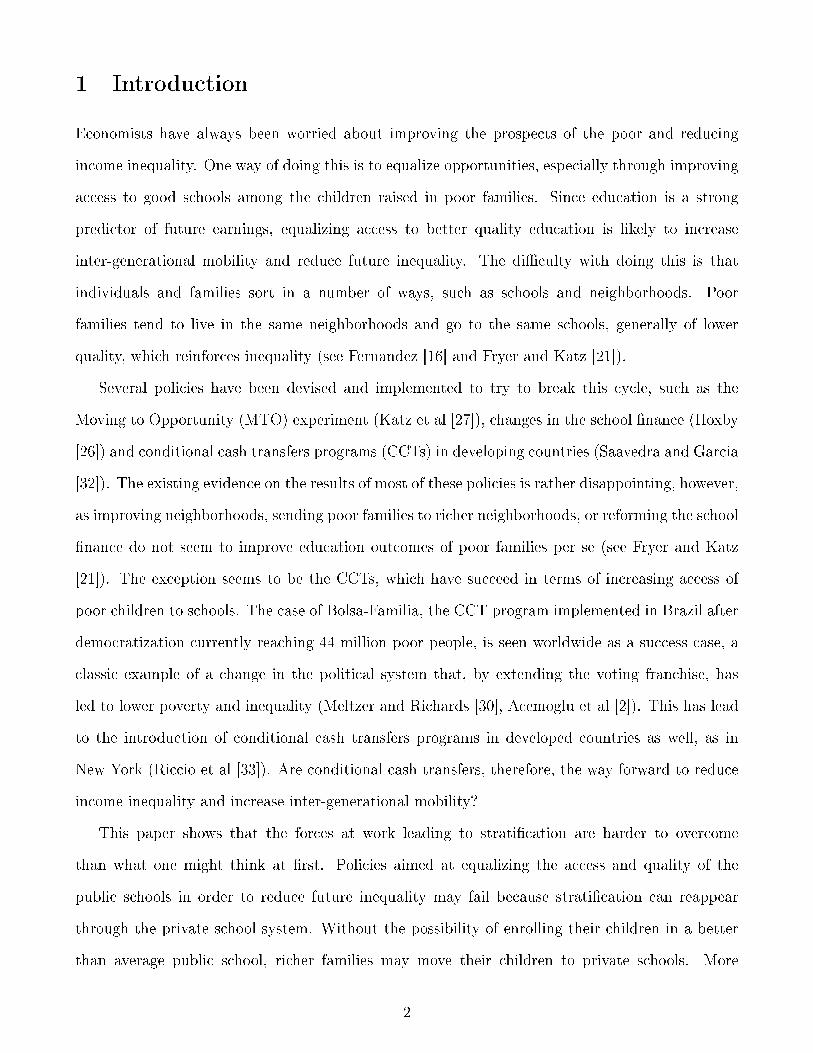
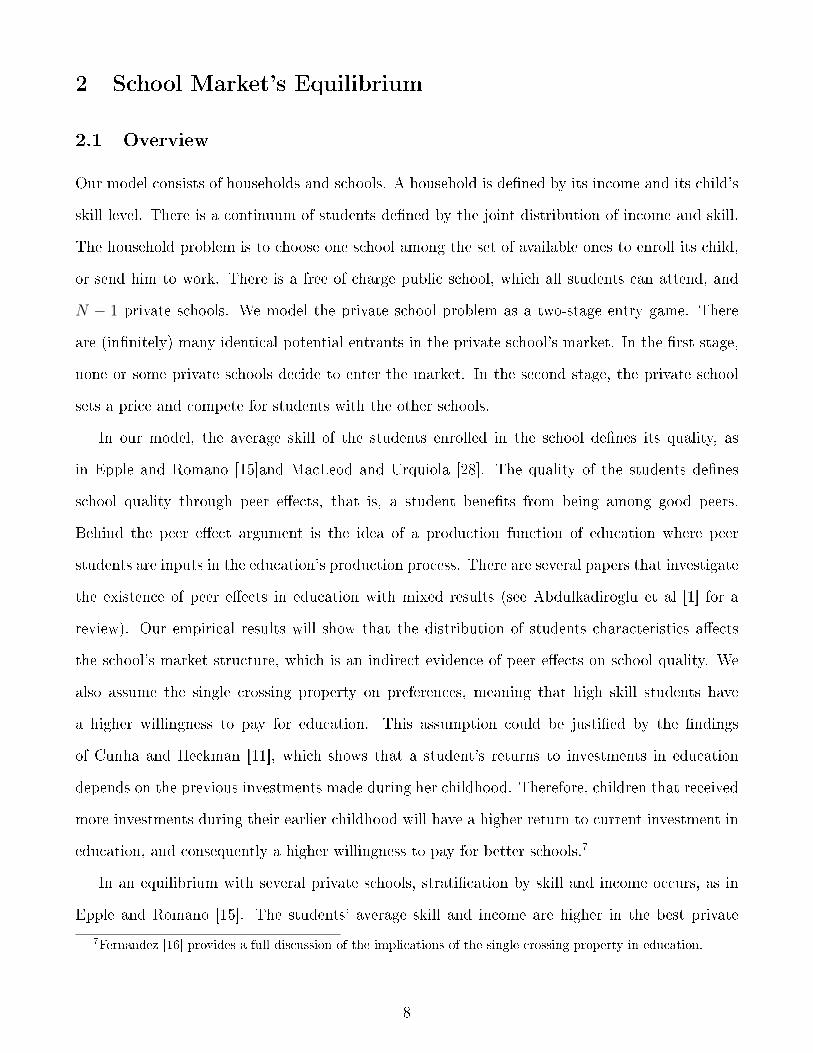
Figure 1: Inequality and Strati�cation Across Countries
USA
ARG
AUS
AUT
BRA
CANCHI
COL
CZEDNKEST
FIN
DEU
GRC
HKG
HUN
IDN
IRL
ISR
ITAJPN
JORKAZ
KOR
KGZ
LUX
MEX
NLD NZL
PAN
PER
POL
PRT QAT
SVK
SVN ESP
SWE CHE
THATTO
TUN
GBR
ALB
URY
0,00
0,20
0,40
0,60
0,80
1,00
1,20
1,40
1,60
1,80
2,00
20 25 30 35 40 45 50 55 60
Socioe
cono
mic Stratificatio
n
Gini Coefficient
speci�cally, we show both theoretically and empirically that strati�cation through private schools
is a function of the inequality in the local public education system. Our model maps the distribution
of socioeconomic characteristics of the student population into the schools' industry organization.
Communities that become more unequal (perhaps because of successful inclusion policies) will
end up with strati�cation across the public and private schools in equilibrium, which helps to
perpetuate inequality over time.
Although reliable empirical evidence on the relationship between private schools and inequal-
ity is scant, there is a clear correlation between inequality and the relevance of private schools
across countries. For example, Figure 1 presents the relationship between income inequality and
socioeconomic strati�cation between publicly and privately managed schools, among the countries
that do have private schools and participated in the 2010 PISA exams.1 It is clear that more
unequal countries also tend to have more strati�cation between students in the public and private
schools, a situation that leads to lower inter-generational mobility. Latin American countries, such
as Brazil and Colombia, are notable examples of highly unequal countries where the rich attend
private schools while the poor have to resort to the lower quality public system.
Our theoretical model consists of a two-stage game where a private school �rst decides whether
to enter the market and then sets its price on the second stage, conditional on entry. Our model
1Strati�cation is measured as the di�erence in the average socioeconomic background of students who attendprivately managed schools and those who attend publicly managed schools (see OECD [31]).
3

builds on Epple and Romano [15], especially the fact that school quality is de�ned as the mean
ability of its students. As in their model, richer households whose children are high skilled pay a
tuition so that their o�spring can study in a more selective private school. In fact, in an equilibrium
with many private schools, there will be strati�cation by skill and income, with an hierarchy of
school qualities, from the lowest level in the public school up to the highest level in the top private
school. There are many di�erences between our model and Epple and Romano [15]'s, however.
The �rst is that in their model all children are in school, whereas in ours households can send
their children to school or to work, which is more suitable to describe the situation in developing
countries. Moreover, Epple and Romano[15] does not explore the consequences of a change in the
skill distribution of the student population for the equilibrium number of private schools. Our new
theoretical result is that private schools' pro�ts depend on the skill heterogeneity among students
in the public system, so that an increase in the variance of the skill distribution will raise post-entry
pro�ts of a private school. The reason is that students with relatively high skill and income will
not stay in the free of charge public school when the student body becomes more heterogeneous,
because average school quality declines, and are therefore willing to pay for private education.
When a private school enters the market, it cream skims the best students who end up with better
peers than in the public system.
The model also explores the impact of conditional cash transfers programs on the distribution
of students skills in a community. The Bolsa-Familia program (BFP hereafter), for example, has
been quite successful in reducing poverty and increasing school attendance in Brazil (Glewwe and
Kassouf [23], Soares and Sátyro [35]). The BFP brought a new population to the public school
system, a large number of new students from very low income classes whose parents had very little
formal education. As a consequence, the number of students enrolled in the public school system
increased, its average quality fell and its skill heterogeneity rose, since the new students had very
little previous investment in skills from their parents and (in our model) the students' average skill
determines school quality.
The model predicts that the rise in the student's skill dispersion brought about by the BFP
increases post-entry pro�ts of private schools and therefore the probability of entry. When the
4
private school enters, it attracts the best students away from the public system, leaving it with an
even lower quality. Therefore, the impact of the BFP on the total human capital of the economy
and its distribution is theoretically uncertain. On the one hand, the bene�ciaries of the program
increase their level of human capital in comparison with the alternative of not being enrolled in
school. The students who migrate to the new private school also improve their human capital,
since the private school has a higher quality. On the other hand, the human capital of the students
who were previously enrolled in the public school and do not transfer to the private school falls,
as the quality of the public schools decreases. Inequality may also increase, since the group who
migrates to the private school will become better educated than the group that remained in the
public school. Strati�cation begins at the top. We also discuss the welfare implications of the
model for the di�erent type of students.
In the empirical part of the paper, we examine what has happened in the Brazilian munic-
ipalities after the inclusion of the poor children in schools, brought about by the Bolsa-Familia
program. Our aim is to examine whether this process of social inclusion has increased the proba-
bility of private school entry, thereby increasing strati�cation within the education system. We use
panel data of Brazilian municipalities to estimate the impact of skill dispersion on private school
entry, controlling for other possible determinants of entry and using the change in the share of
Bolsa-Familia recipients in each municipality as an instrumental variable for the test-scores dis-
persion in the public school system. We �nd a positive, economically and statistically signi�cant
impact of test scores dispersion on private school entry.
This paper is at the juncture of several branches of the literature. Despite its importance for a
substantial part of the world population, education strati�cation through the private school system
has not received much attention in the economics of education literature so far. Some theoretical
models show that private education tends to increase inequality in the steady-state (Glomm and
Ravikumar [24] and Zhang, Davies and Zeng [37]). Hoxby [26] uses the religious population in
metropolitan areas as instruments for the supply of private schools and �nds that private school
competition increases test scores and education attainment of the public school students, but has
no impact on spending or segregation. Epple, Figlio and Romano [14] �nds that the propensity to
5

attend private schools rise with income and ability and that the correlation between income and
ability is greater in the public than in the private sector, but increases in the later when public
sector expenditure falls. But, no study so far has focused on the drivers of private school entry in
the education market.
There is another line of research that examines the relationship between sorting, education and
inequality 2 Fernandez and Rogerson [17], for example, show that if public spending in education
is locally �nanced, in equilibrium families will be strati�ed by income across communities, with
substantial school quality di�erentiation across them. It has been notoriously di�cult to identify
the models of strati�cation, however, because of social interactions. In a paper related to ours,
Hoxby [25] �nds, among other things, that school �nance equalization tends to increase enrollments
in private schools in penalized districts. We argue that the rapid social changes that have been
occurring in Brazil, both in terms of poverty and school attendance, may provide the sort of
exogenous variation that is essential to identify the process of sorting and its potential e�ect on
inter-generational mobility and long run inequality.
Our work also relates to the economics of education literature, in line with the papers of
Epple and Romano [15] and McLeod and Urquiola [28]. In these papers, strati�cation happens in
equilibrium, so that conditional on an income level, the best students attend the private schools.
McLeod and Urquiola [28] assume information asymmetry in the post school labor market, so
that school reputation works as a signal of the unobserved student quality. Epple and Romano
[15] show that with peer e�ects there will be strati�cation by skill and income across public and
private schools, and also across the private schools. In their model, private schools will o�er tuition
discounts to the best students, and these discounts may vary with the expenditure in the public
system. But, no study so far has examined the impact of changes in inequality in the public school
system on private school entry, however.
Entry is the subject of an extensive literature in industrial organization, pioneered by the work
of Bresnahan and Reiss [10]. This literature studies the relationship between the determinants of
�rm's pro�ts and the equilibrium number of �rms in a market. Changes in market fundamentals,
such as market size and costs a�ect industry structure. This well established literature, however,
2See Benabou [6], Durlauf [13] and Fernandez and Rogerson [17], for example.
6
does not take into account one speci�c characteristic of the educational sector: the externality
generated by peer students. This sector belongs to a group of markets in which the type of persons
who consume the good is important for the utility that other consumers derive from it.34 Their
main characteristic is the existence of a positive externality in consumption. In some situations,
these markets are characterized by a strong market di�erentiation, with consumers strati�ed across
qualities in equilibrium. Communities, schools, nightclubs and restaurants are all cases where
there exists substantial product di�erentiation, with groups of consumers associated with certain
varieties. The traditional entry literature does not take into account the full consequences of social
interactions, however. 5
Finally, our paper relates to the growing literature that discusses the relationship between
democracy, redistribution and inequality.6 Some of the papers in this line of research examine why
democracy may fail to reduce inequality by exploring the process of capture of the democratic
decision making process by a country's elite (Acemoglu and Robinson [3]). Our paper provides an
example of how a country's elite can use private schools to maintain strati�cation even in the face
of a radical change in the political system that leads to an increase in school attendance by the
poor. The salient feature of our paper is that this mechanism arises endogenously in equilibrium,
without us having to rely on a process of elite capture of the political system.
This paper is organized as follows. The next section sets up the theoretical model of the
school market and analyzes its empirical implications. Section 3 describes the data, explains the
identi�cation strategy and presents the empirical results. The last section concludes.
3Other examples are: families prefer to live in communities which share their socioeconomic characteristics;people like restaurants, nightclubs and bars attended by 'cool' people; books and movies become more interestingwhen more people watch and read them.
4Becker [4] calls this process `social interactions´ and Glaeser and Scheinkman [22] call it 'non-market interaction'.5Mazzeo [29], for example, estimates an entry model where products are vertically di�erentiated. The pro�tability
of the �rms in these markets crucially depends on the ability to di�erentiate themselves, with prices being a functionof di�erences in quality. But, in our model quality is no longer only a �rm's control variable, since it is de�nedby the consumers choices. This causes a major distinction between entry in a market with vertical di�erentiationand one with social interactions. In a traditional market, changing the distribution of consumers tastes 'far' fromwhere the �rm intends to locate will not have any impact on this �rm's pro�tability, since di�erences in productqualities are �xed. In our model, the inclusion of low income unskilled students in the students' population inducesthe entry of a �rm that provides a good to the wealthiest share of the students, the private school.
6See Acemoglu et al [2] for recent survey.
7
2 School Market's Equilibrium
2.1 Overview
Our model consists of households and schools. A household is de�ned by its income and its child's
skill level. There is a continuum of students de�ned by the joint distribution of income and skill.
The household problem is to choose one school among the set of available ones to enroll its child,
or send him to work. There is a free of charge public school, which all students can attend, and
N − 1 private schools. We model the private school problem as a two-stage entry game. There
are (in�nitely) many identical potential entrants in the private school's market. In the �rst stage,
none or some private schools decide to enter the market. In the second stage, the private school
sets a price and compete for students with the other schools.
In our model, the average skill of the students enrolled in the school de�nes its quality, as
in Epple and Romano [15]and MacLeod and Urquiola [28]. The quality of the students de�nes
school quality through peer e�ects, that is, a student bene�ts from being among good peers.
Behind the peer e�ect argument is the idea of a production function of education where peer
students are inputs in the education's production process. There are several papers that investigate
the existence of peer e�ects in education with mixed results (see Abdulkadiroglu et al [1] for a
review). Our empirical results will show that the distribution of students characteristics a�ects
the school's market structure, which is an indirect evidence of peer e�ects on school quality. We
also assume the single crossing property on preferences, meaning that high skill students have
a higher willingness to pay for education. This assumption could be justi�ed by the �ndings
of Cunha and Heckman [11], which shows that a student's returns to investments in education
depends on the previous investments made during her childhood. Therefore, children that received
more investments during their earlier childhood will have a higher return to current investment in
education, and consequently a higher willingness to pay for better schools.7
In an equilibrium with several private schools, strati�cation by skill and income occurs, as in
Epple and Romano [15]. The students' average skill and income are higher in the best private
7Fernandez [16] provides a full discussion of the implications of the single crossing property in education.
8

schools and decrease as we move down the quality ladder, with the public school remaining in the
bottom. The poorest households will send their unskilled children to work. Since school quality is
given by the average skills of its students, it is not pro�table for a private school to enter the market
when there is no skill dispersion among the students in the public system. With skill homogeneity,
the quality of the private and public schools would be the same and households would not be
willing to pay for private education, as they have the public option for free. Therefore, a higher
dispersion of students' skills in the economy increase the potential quality distance between the
private and the public schools, implying higher pro�ts for the private schools. The conclusion is
that, ceteris paribus, one should expect a greater number of private schools in locations where
the students' skill dispersion in the public system is higher. This is the intuition behind the main
theoretical result in our paper.
The hypothetical situation where all schools (public and privates) enter the market with similar
qualities is not a stable equilibrium (see Fernandez [16]). Students will eventually reallocate
themselves across the di�erent institutions, converging to the situation where schools are vertically
di�erentiated in quality. As such, the equilibrium price of a given private school is a function of the
di�erence in quality between this school and the public institution. The central di�erence between
our model and traditional models of vertical di�erentiation - such as Shaked and Sutton [36] and
Bresnaham [9] - is that quality is not only a �rm's decision variable. Instead, it is also de�ned by
consumers choice.
2.2 The Model
There areM households, each one with income y, with y ∈[y, y], which is exogenously determined.
Each household has a child with skill s, with support s ∈ [s, s], where s = s (y, ε), with s1 ≥ 0
and s2 > 0. Hence, two terms a�ect the child's skill. The �rst term states that richer families are
capable of investing more in its child's education and, therefore, the child's skill is an increasing
function of the household's income. The second term ε represents factors other than the families
income that a�ect the child's skill such as innate ability, the previous teacher the child had etc.
We assume ε is a bounded random variable, with ε ∈ [ε, ε]. Given this structure, skill and income
9

are jointly distributed with density h (y, s), which we assume to be continuous.
Each household cares about its consumption and its child's human capital. The family faces a
discrete choice problem in which it has to decide whether to send its child to work or to study in
a public or in one of the private institutions.8 The subscript j, with j = 0, ..., N , is the number
assigned either to the alternative of working (j = 0) or to the school attended (j > 0). There
are N schools in the market, with the public school being represented by j = 1. Formally, the
household's problem is the following:
maxj{u (y + wj − pj) + θjs : j = 0, ..., N} .
wj is the child's wage, which is positive if he works (w0 > 0) and zero otherwise (wj = 0 if j > 0).
pj is the tuition of school j, where the household does not pay tuition if the child works (p0 = 0)
or is enrolled in the public school that is free of charge (p1 = 0). The term y + wj − pj is the
household's consumption of the numeraire good, with price normalized to 1. Utility function u
has the usual properties, and the linear assumption about θjs is for simplicity. The term θjs is
the child's human capital. It increases with the child's skill s and the quality of school j, which is
measured by the mean skill of its student body θj.9 We assume that θ0 < s, which indicates that
the child's human capital is lower if he works, in comparison with the alternatives of attending
either a private or a public school. The multiplicative term (θjs) in the household's objective
function captures the fact that higher skill students have a higher willingness to pay for education,
as their bene�ts from education are greater, as pointed out it the previous subsection.
Household i is characterized by the pair (si, yi). Given the preferences and the choices the
households have, the set of households choosing j, j ∈ {0, 1, ..., N}, is:
Aj(p., θ.) = {si, yi|u (yi − pj + wj) + θjsi ≥ u(yi − pk + wk) + θksi,∀k 6= j} (1)
8In Brazil, as in many countries, according to the law, all children under the age 14 must be enrolled in school.However, the law is not always followed.
9As pointed out in the previous subsection, this feature of the model captures the positive externality of studyingwith good peers.
10

The share of households choosing option j is given by:
Sj =
ˆ ˆ
Aj
h(s, y)dsdy (2)
The mean skill of the students attending school j (j > 0) is given by:
θj =
ˆ ˆ
Aj
sh(s, y)dsdy (3)
Note that equations 1 and 3 are simultaneously determined. Aj, the set of households who opt
for j, depends on θj, which equals the integral over Aj.
There is only one large public school and it o�ers free admission to all students. The public
school problem is not modeled formally. For simplicity, the public school has a passive role in the
model in the sense that it does not react to the private schools actions.
We model the private school entry decision as a two stage game. On the �rst stage the school
decides whether to enter or not in the market. On the second stage it sets its price and compete
for students with the other schools. In other words, the private schools compete in price. We
normalize the private school's opportunity cost to zero, so that its decision rule on the �rst stage
is : enter if πj > 0
do not enter if πj < 0
where πj is its pro�ts, and j > 1.
On the second stage, upon entering the market, the school decides its price policy, taking as
given the other schools prices, which will depend on its cost structure and demand. It chooses the
optimal tuition p∗j in order to maximize the following pro�t function:
maxpj
pjSjM − C(SjM)− F (4)
where F is the sunk entry cost (assumed to be equal to all schools), C is the variable cost (with
C′> 0 and C
′′> 0), which depends on the number of attending students (SjM).
11

The Bertrand-Nash equilibrium of the two stage entry game is characterized by {pj, θj}Nj=0,
such that: (i) the households maximize its utility sending its child either to work or to study,
taking as given the quality of the schools and the tuitions, (ii) �rms maximize pro�ts by choosing
whether to enter the market and its tuition upon entering, taking as given other schools tuitions
and qualities, with πj > 0 for j > 2; (iii) no household wants to change the school of its child; and
(iv) the market clears,N∑j=0
Sj = 1, that is, the number of children equals the number of students
and young workers in the economy.
2.3 Equilibrium with N Schools
We analyze the oligopolistic equilibrium of the school market. All proofs are in appendix A. We
start by proving existence.
Proposition 1 There exists equilibrium with N schools.
A necessary condition is that the total derivative dSj
dpjbe negative. Hence, although we expect
to see a positive slope is some parts of the demand function, as in Becker [4], equilibrium never
happens in these regions. There are multiple equilibria in the school market, but the only stable
one is the segregated equilibrium (Benabou [6], Glaeser and Scheinkman [22], Fernandez [16]). The
next proposition characterize this equilibrium.
Proposition 2 In a segregated equilibrium, θ1 < θ2 < ... < θN and 0 = p1 < p2 < ... < pN .
Proof. Suppose not. All schools have the same average quality and charge the same prices.
This situation is indeed an equilibrium, but it is an unstable one. Let's focus on two schools, k
and j, such that, θ0k = θ0
j and p0k = p0
j . Suppose one of them, let's say j receives a positive shock
on its quality, such that θ1j > θ0
k. Now if both schools charge the same price, all students strictly
prefer j. In this situation it is optimal for j to raise its price: p1j > p0
j = p0k. All the students
in school j have an utility loss due to the higher price but, by the multiplicative assumption, the
students with higher skill bene�t more from the higher average quality. Some of the students with
lower ability �nd it optimal to transfer to the cheaper school k. When this process ceases, the
12

new equilibrium will have θj > θk and pj > pk. If we apply this argument to all pairs of private
schools, we get the complete ordering for the N − 1 schools. Since the price of the public school
is zero, it cannot select the better students by raising the price, as the private school does. So, in
equilibrium it can only have the lowest skill students.
Recall that a household is characterized by the pair (s, y). We now turn to the proposition that
describes how these di�erent types of households are strati�ed across the alternative private schools,
public school and working. Before proceeding, it is useful to de�ne two types of strati�cation,
as in Epple and Romano [15]. We say that strati�cation by income (SBI) occurs if, for any two
households having the same skill, the household that chooses the private school (public school) has a
higher income than the one that chooses the public school (to work). Analogously, strati�cation by
skill (SBS) holds if, for any two households having the same income, the household that chooses the
private school (public school) has a higher skill than the that chooses the public school (to work).
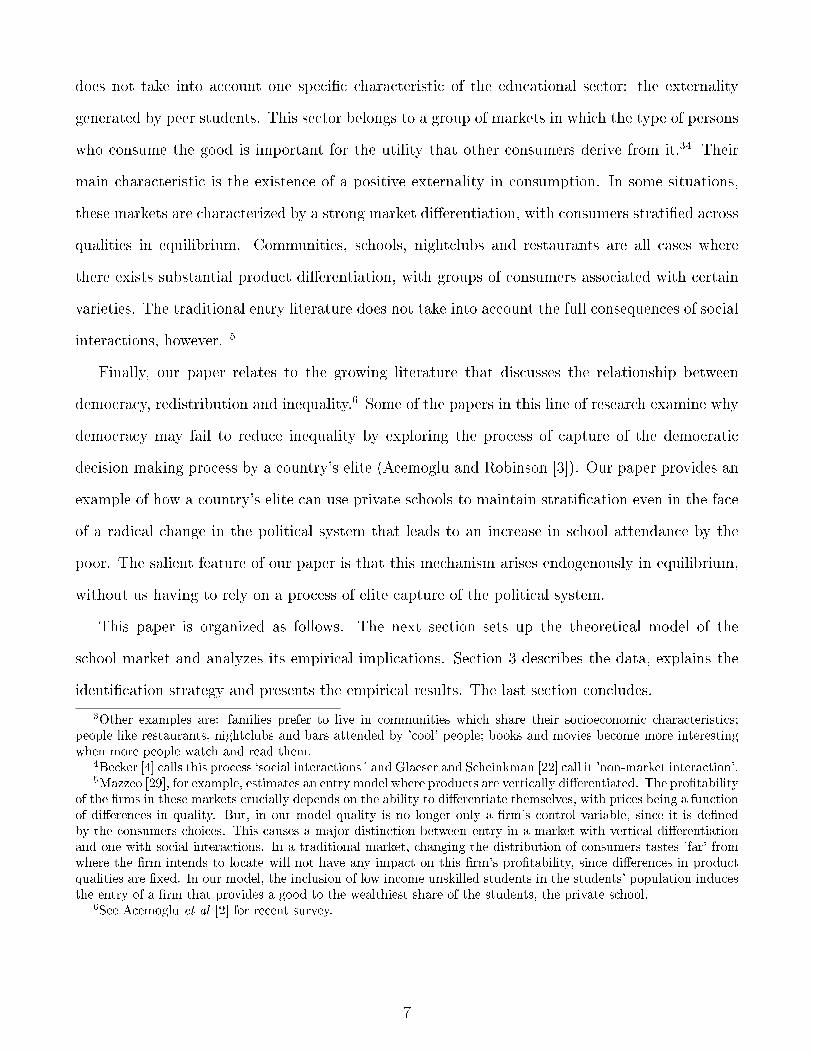
Figure 2 shows how it is an equilibrium in which both types of strati�cation occur simultaneously.
Households with the pair (s, y) in the upper right corner of the �gure enroll its children in the
private school. Those in the middle send its children to the public school. The ones in the lower
left corner opt for the alternative to work.
Proposition 3 In an equilibrium with N schools, SBI and SBS characterizes equilibrium.
To understand the intuition behind the SBI, suppose two households whose children have the
same skill but with di�erent incomes - say y and y′, with y > y′. Since their children have the
same skill, they both bene�t equally from attending school j. However, since utility is a concave
function and y > y′, it implies that the wealthier (y) household has a smaller decrease in utility
when he pays tuition pj. Therefore, the wealthier household strictly prefers the school j if the less
wealthy one is indi�erent between schools j and j − 1.
An analogous argument gives the intuition behind SBS. Suppose two households with the same
income but whose children have di�erent skills - say s and s′, with s > s′. Since they have the same
income, their consumption of other goods fall equally when they enroll their children in school j
and pay tuition pj. If the household whose child has skill s′ is indi�erent between schools j − 1
13

and j, the another one strictly prefers school j. The reason is that, as its child have a higher skill,
the household bene�ts more from school j, as its quality is greater than school j − 1.
Figure 2: School Market Equilibrium
In the next two propositions, we analyze factors that a�ect private school's pro�t and market
entry.
Proposition 4 The price charged by any private school is a positive function of the di�erence in
quality between this private school and the public institution. Speci�cally, for any school j,
pj = y − u−1 [u (y)− (θj − θ1) s] .
The next proposition - our main result - is a comparative statics of the equilibrium we just
described. It states that as the skill distribution widens the potential pro�ts of private schools rise.
Proposition 5 An increase in skill dispersion among students increases the private schools pro�ts.
The above proposition states that a rise in skills dispersion among students implies a higher
pro�tability for the private schools and, as a consequence, entry becomes more likely. The intuition
behind this result is the following. As shown above, the private school tuition increases with the
di�erence in quality between the private and public school. When there is a lot of heterogeneity
among the student population, it is easier for the private schools to di�erentiate themselves from
the public school by attracting the students with relatively higher skills. With this di�erentiation,
households whose children have relatively higher skills are willing to pay for a private education
14
and private schools can charge pro�table tuition. Ceteris paribus, the greater is the skill dispersion,
the higher are private schools pro�ts.
In more homogeneous societies, where students have similar skills, there is little or no room
for a private school to enter the market and cream skimming the best students from the public
school. In contrast, in more heterogeneous societies private schools are able to attract the best
students, have an important di�erentiation with respect to the public school and charge a high
enough tuition, such that entry is pro�table.
2.4 The Bolsa-Familia Program
We now turn to the e�ects of the Bolsa-Familia program (BFP) on the the school market equi-
librium 10 Before proceeding with the analysis, we brie�y describe the program. The BFP is a
conditional cash transfer program focused on poor families in Brazil. Families receive a grant from
the government and in return have to ensure that their school-aged children are enrolled in a public
school and vaccinated. The program aims at reducing poverty in the short-term and increasing
human capital among the poor children through its e�ects on skill and health. The transfer com-
pensates the households for the opportunity cost of attending a school. If the conditionalities are
not met, households may be excluded from the program.
The potential bene�ciaries of the program are the households whose children have relatively
lower level of skills and are working (the fraction S0), which are the ones located in the lower left
corner in Figure 1. The program gives incentives for the households to enroll their children in
the public school, so that they do not receive the wage w0 anymore, receiving the grant from the
government as a compensation instead. The e�ect of the program is to enroll MS0 students in the
public school.
We now use the model results to discuss the e�ects of this program. The following result has
a key role in our empirical analysis, as it states that the Bolsa-Familia is a source of exogenous
variation in our entry model.
Remark 1 The introduction of the Bolsa-Familia program lowers the average quality and increases
10The results of this section are more general than the speci�c case of the BFP, but we prefer to carry on theanalysis within this well de�ned context, to lay the ground for the empirical exercises below.
15
the skill dispersion in the public school.
As the bene�ciaries of the program are the households whose children have relatively lower
level of skills, when they stop working and enter the public school, the mean skill of the students
falls, and the variance increases.
Remark 2 The pro�ts of the private schools increase when the Bolsa-Familia program is intro-
duced.
The children of the households bene�ciaries of the program stop working and enter the public
school. As they are relatively less skilled, this increases the skill dispersion in the public school.
As shown in Proposition 5, the private schools' pro�ts rise with the heterogeneity of student
population. The empirical implication is that, ceteris paribus, we are more likely to observe a
private school in municipalities where the program penetration is higher.
Remark 3 The quality of the public school falls even further when a private school enters in the
market.
The above result indicates that one e�ect related to the presence of a private school in the
market is that the quality of the public school falls. The reason is that the equilibrium with a
private school is strati�ed by skill. When the private school enters the market and attracts the
relatively best students (with higher skills), it leads unequivocally to a fall in the quality of the
public school.
The next remark discuss the e�ects of the program on the total human capital in the economy
and across students.
Remark 4 The e�ect of the program on the total human capital in the economy is uncertain.
The net e�ect of the introduction of the program on the total human capital in the economy is
uncertain, as the program have di�erent e�ects on di�erent types of students. The human capital
of the bene�ciaries of the program increases. They stop working and enroll in the public school. By
assumption, the student's human capital is lower if he works, in comparison with the alternative
16

of studying. The human capital of those students who were enrolled in the public school before
the introduction of the program and stay there after its implementation falls. The reason is that
the quality of the public school falls, as discussed above. This decline is aggravated if the private
school enters the market. Conditional on enter, those students who leave the public school and
move to the private school increase their human capital. In sum, with winners and losers the net
impact of the BFP on the total human capital in the economy is uncertain and di�ers across types
of students.11
The results change when we consider welfare instead of human capital, as shown next.
2.5 Social Welfare
The following exercise illustrates how the BFP a�ects social welfare. In order to perform the
simulations, we parameterize the problem, by assuming �rst that there are three types of students
in the economy, a, b and c, each with its own skill and income, and that the shares of types are
the same, as shown in Table 1. 12
Second, the utility function of household i when making choice k is:
Uik = ln (yi − pk + wk) + θksi (5)
Third, each household's choice set consists of three alternatives: send his child to work (0),
to the public (1) or to the private school (2) if the private school decides to became active. The
infant labor market pays a wage of 0.25, and has quality θ0 equal to zero.
Fourth, the private school has �xed cost equal to 1, and zero marginal cost. It maximizes
pro�ts and charges the maximum price that the lowest ability student attending the private school
is willing to pay:
p2 = yi − exp (ln (yi) + (θ1 − θ2) si) (6)
11In practice, it is possible to say that the human capital of the majority of the students falls. The reasonis simple. Empirically, the majority of the students are those who were enrolled in the public school before theintroduction of the program and stay there after its implementation. Their human capital fall unequivocally.
12It is important to note it is not necessary to assume a positive correlation between skill and income. In fact,imposing the same income for all types do not qualitatively change the results below.
17
The private school enters if it obtains positive pro�ts after entry.
In Table 1 we consider the changes in utility for the students as a result of the introduction
of BFP. Before the program, types a and b attend the public school - there is no strati�cation
across schools - and type c works. When we introduce the BFP, the equilibrium changes, type
c chooses to attend the public school instead of working and the type a student migrates to the
private school. Table 2 presents the simulation results from the schools' point of view, and the
aggregate welfare result. Before the BFP, the private school cannot charge a high enough price
to make entry pro�table. But, BFP lowers the quality of the public school, enabling the private
school to enter the market. The private school maximizes pro�ts by accepting only the type a
student and strati�cation by skill/income holds in equilibrium.
Our main result is that welfare varies along the distinct social groups. Clearly, type c households
gain utility by receiving the Bolsa-Familia and sending their kids to school, while type b households
su�er by remaining in the lower quality public school. Interestingly, type a students - the group
who moves to the private school - also face an utility loss. The reason is that they only moved to
the private institution due to the decrease in the quality of the public school. Before the arrival of
type c students, they preferred the public school over the private one (this result is more general
than what this numerical exercise may suggest). A consequence of this heterogeneity is that we
cannot say much about the aggregate welfare, as it will depend on group sizes and on the skill
distribution. A large (small) fraction of Bolsa-Familia (type c) students renders the aggregate
change in welfare positive (negative) and this e�ect is magni�ed the larger is the skill dispersion.
3 Empirical Analysis
3.1 Data
The Brazilian education system consists of three main cycles: fundamental (primary and sec-
ondary), high school and college. Fundamental education lasts nine years, �ve years of primary
and four of secondary education, while high school and college take three and four years, respec-
tively. All three cycles are o�ered by private and public schools. Private institutions charge a
18

fee, while the public system is free of charge at all levels. Brazil has 5,563 municipalities spread
around the 26 states plus the district capital. Public schools are either managed by the State
or by the municipal (local) authority. Public schools o�ering fundamental education are usually
run by the municipal authority, while high schools are generally managed at the State level and
colleges/universities by the federal government. There were 13 million students in fundamental
education in Brazil in 2011, studying in 146,000 schools, 14% of which were private, caring for 30%
of students.
The data we use in this paper come from several sources. The number of private and pub-
lic schools by municipality come from the School Census, which is carried out annually by the
Ministry of Education and has detailed information on every school in the country. In the em-
pirical exercises below we use data on the number of private schools (for pro�t) o�ering primary
and secondary education by municipality between 2007 and 2011. The information on average
household income, education, poverty rate and school-age population for each municipality come
from the Demographic Census, carried out decennially by the Brazilian Census Bureau. To obtain
yearly values for these variables, we interpolated using the data for 2000 and 2010 by municipality,
assuming a constant growth rate over time. Data on test scores, which were used to compute
average, standard deviation and the coe�cient of variation by municipality, comes from Prova
Brasil, a standardized national examination carried out every other year since 2005 to assess the
quality of public education in Brazil. Once a municipality agrees to participate in the evaluation,
all students of urban public schools with more than 20 students take the test. The information on
the total number of families receiving the Bolsa-Familia program in each year comes from Brazilian
Social Ministry (MDS). In order to compute the share of the population receiving the bolsa-familia
transfer, we multiplied it by four (the average size of a family in Brazil) and divided by the total
population of the municipality.13
We dropped municipalities with a school-age population (0-15) higher than 15,000, as those
cities have dozens of private schools and represent, therefore, more than one education market.
Our �nal data set has 4,823 municipalities, out of the 5,564 existing in Brazil in 2011, 5,042 of
13We therefore assume that the average size of the families evolved similarly across municipalities between 2000and 2010).
19

which had a school-age population smaller than 15,000. Table 3 describes the main variables used
in the analysis, separating municipalities into four di�erent groups: those with private schools
throughout the sample period (1,590), those without (2,808), those where there was private school
entry (240) and those where there were private schools in 2007 but not in 2011 (185). It show that
only 33% of municipalities had a private school throughout the sample period. Between 2007 and
2011, entry occurred in 8% of the cities with no private schools in 2007.
The table shows that municipalities with private schools were bigger, with a student-age pop-
ulation of 6,321, as compared to 2,304 in the cities without private schools throughout the sample
period and around 4,500 in municipalities that changed their private school status between 2007
and 2011. Their population also tends to be richer, with average monthly household per capita
income of 439 reais (around 200 US dollars), as compared to 412 in the public school-only cities
and 373 in the cities where there was private school entry. Adult education was similar in all types
of municipalities, but poverty rates were markedly higher in the cities where there was private
school entry, as was the share of the population receiving Bolsa-Familia program. The share of
students in school and the various test scores indicators were very similar across the di�erent types
of municipalities.
In terms of changes over time, one can note that between 2007 and 2011 the school-age pop-
ulation declined in Brazil, as a result of the demographic transition. It declined less, however, in
cities with no private schools and in those where there was private school entry. Social indicators
progressed very well in Brazil in the �rst decade of the new century. Real income rose in all types
of cities and so did adult education. The poverty rate declined throughout in the country, by
about 5 percentage points, while the coverage of bolsa-familia increased between 6 and 7 percent-
age points. It is interesting to note that both the decline in poverty and the rise in coverage of
bolsa-familia were higher precisely in the municipalities where there was private school entry. Also
interesting is the fact that in those cities both the mean and standard deviation of test scores (of
public schools students) increased by less, a result that could be the consequence of the new private
school attracting the best students of the public system. In the econometric exercises below we
will try to uncover the causal relationship between skill dispersion and private school entry.
20

3.2 Identi�cation Strategy
The theoretical model above predicts that the probability of entry of a private school in a municipal-
ity will increase with the size of the school-age population, with income and with the heterogeneity
of the students in the public school, proxied empirically by the test scores coe�cient of variation
(standard deviation divided by the mean). Formally, the main equation to be taken to the data is:
Privmt = αm + βcvmt + ηlpopmt + γlymt + θXmt + δt + εmt (7)
where Privjt is equal to one if there is at least one private school in the municipality m in time
t (and zero otherwise), cv is the coe�cient of variation of the public school students' test scores,
lpop is the (log of) the total student-age population, ly is the (log of) average household per capita
income, X is a vector of other control variables (including the share of adults with at least high
school and the poverty rate), δt are time dummies to control for common macroeconomic e�ects,
αm are the municipality �xed e�ects, to control for unobserved heterogeneity at the city level that
is �xed over time and may be correlated with the heterogeneity of student population and with
private school entry and ε is a random error.
The main problem with estimating equation 5 using either linear or discrete-choice models is
that skill dispersion in the municipalities may be correlated with other unobserved time-varying
factors, which would render inconsistent our estimates of β. Therefore, we need an instrumental
variable, which should be correlated with the coe�cient of variation of test scores but not with
the random error. In this paper we argue that the share of the population receiving the bolsa-
familia transfers is a valid instrumental variable, since it is correlated with the heterogeneity of
the student population, as the program is targeted to the poor families and is conditional on the
children of these families going to school. Since school performance is strongly correlated with
family background, the children that start attending schools because of the transfers will tend
to have a performance in test scores that is lower on average than that of existing students, so
that student heterogeneity will rise in the public system. Therefore, the share of families receiving
Bolsa-Familia in the municipalities should be positively correlated with the coe�cient of variation
21
of test scores, even conditionally on the municipalities �xed e�ects. This is a testable hypothesis.
Moreover, there is no reason why the share of families receiving Bolsa-Familia should be correlated
with other determinants of private school entry, conditionally on the municipalities �xed e�ects.
Our identifying hypothesis, therefore, is that E[bf ′mtεmt] = 0.
This identi�cation assumption could be challenged on the grounds that the bolsa-familia trans-
fers may impact entry directly, either by increasing family income or because families may ful�ll
the conditionality by sending their kids to a private instead of a public school, as permitted by
the law. We cover the �rst possibility by controlling for average income and the poverty rate in
all regressions. As for the second possibility, Glewwe and Kassouf [23] shows that only 3% of poor
students attend private schools, so that it is highly unlikely that a private school will enter the
market only to attend the Bolsa-Familia recipients.
The �rst-stage of our instrumental variable procedure is given by:
cvmt = θmt + λbfmt + ϑlpopmt + κlymt + µXmt + δt + vmt (8)
where bf is the share of families receiving the bolsa-familia transfer in municipality m in period
t. We implement this estimator by means of the two-stage least squares procedure, which uses
only the variation in skill dispersion predicted by the Bolsa-Famila transfers to identify its e�ect
on private school entry. We implement both stages in a single step and use linear models in all
estimation procedures, which are consistent and have the advantage that the estimated coe�cients
can be directly interpreted as marginal e�ects.
3.3 Econometric Results
We now present our main econometric results. Table 4 sets out the results of our �rst-stage re-
gression, using panel data for 2007, 2009 and 2011. In the �rst column we regress our measure
of skill dispersion, the coe�cient of variation of public students test scores (8th grade mathe-
matics) in each municipality on the share of families receiving transfers from the bolsa-familia
22

program, the control variables, time and state dummies, using pooled OLS.14 We can see that
the estimated coe�cient on the bolsa-familia share is positive and statistically signi�cant. The
size of the coe�cient means that a 18% increase in the coverage of bolsa-familia (one standard
deviation) increases skill dispersion by about 20% of a standard deviation, a sizable e�ect. The
size of school-age population and adult education are also positively associated with the coe�-
cient of variation, whereas a higher average household income compresses the skill distribution.
Column (2) includes the municipality �xed e�ects to control for unobserved heterogeneity at the
municipal level, so that in e�ect we are now using only the within-municipality variation in the
coverage of bolsa-familia over time to identify its e�ect on skill dispersion. One can see that the
bolsa-familia coe�cient remains signi�cant. Column (3) repeats the speci�cation of column (2),
but uses a long-di�erences speci�cation, that is, we use the variation of all variables between 2007
and 2011, and the estimated coe�cient increases in size. In column (4) we include poverty rate
in the econometric model. Since the main aim of the bolsa-familia program is to reduce poverty,
we there is a positive correlation between these two variables. Moreover, poorer municipalities
have a higher proportion of their kids out of schools and the theoretical model set out in section 2
predicts that skill dispersion in the public school system should be lower in that case. The results
show that, indeed, poverty is negatively correlated with skill dispersion and its inclusion decreases
the size bolsa-familia coe�cient substantially, but it remains statistically signi�cant.
Since the bolsa-familia program is very in�uential in Brazil and in other developing countries,
representing a clear change in priorities that occurred after the return to democracy, it is important
to examine its e�ects more thoroughly. Table 5 does that by reporting estimated coe�cients of the
bolsa-familia program in long-di�erences regressions with di�erent dependent variables, controlling
also for the change in the school-age population and education of the municipalities.15 Each row
reports the result of a di�erent regression. The second column of the table reports the magnitude
of the e�ect of increasing the coverage of bolsa-familia by one standard deviation (18.7 percentage
points) in terms of percentage of standard deviation of the dependent variable. The �rst row
14Ferreira and Gignoux [18] discusses the use of the standard deviation of test scores as a measure of educationachievement.
15We are assuming that the share of bolsa-familia recipients is uncorrelated with other determinants of eachdependent variable, which may be a strong assumption in some of the cases.
23

reports the result of using average household income as the dependent variable and shows that
increasing Bolsa-Familia coverage by one standard deviation would have a very small impact on
average income (only 1% of its standard deviation), despite being statistically signi�cant. In
terms of poverty, however, the results of the second row shows that the bolsa-familia program
can signi�cantly decrease the poverty rate (by about 10% of a standard deviation). Moreover,
since the bolsa-familia is a conditional cash transfer, it should increase school attendance as well.
Row (3) shows that it does that in a meaningful way, by raising the share of kids in the 6-17 age
group attending school by about 37% of standard deviation. As this kids come from poor families,
however, and parental education is so important for school outcomes, bolsa-familia should be also
associated with a lower performance in test scores. Row (4) shows that the bolsa-familia coe�cient
is negative and statistically signi�cant, but the impact is not very high (about 8.5% of a standard
deviation). Moreover, it should also increase the standard deviation of test scores, a di�erent
measure of skill dispersion from the one we have been using so far. Row (5) shows that this is
indeed the case and that the e�ect is substantial, so that the e�ects on the coe�cient of variation
presented in Table 4 do not come solely from its negative impact on the mean scores. Finally,
the last row presents the reduced-form e�ects of bolsa-familia directly on private school entry,
without the mediation of skill dispersion and shows that the expansion of the program is a positive
predictor of entry.
Table 6 sets out the estimation results of our main equation. The results of column (1),
estimated by pooled OLS, with state and time dummies included, show that the skill dispersion,
measured by the coe�cient of variation of public school students test scores, is positively correlated
with the operation of private schools in the municipalities. As predicted by any theoretical entry
model, the size of the population and income are also predictors of private school entry. It is
interesting to note that the education of the adult population is positively correlated with private
entry, as more educated parents should place more value on the quality of education. Poverty rate,
on the contrary, is negatively related with entry. All of the variables, therefore, have coe�cients
estimated with the expected signs. But, skill dispersion in the public system could be correlated
with other factors a�ecting private entry and may be even the result of entry. Therefore, in column
24

(2) we implement our instrumental variable approach, using the share of bolsa-familia recipients
in the municipalities as an instrument for the coe�cient of variation of test scores. We can see
that the coe�cient is now about 20 times higher and statistically signi�cant, meaning that higher
heterogeneity in the student population increases the likelihood of a private school entering the
market.
Column (3) of Table 6 repeats the speci�cation of column (1), but now includes municipality
�xed e�ects. The dispersion coe�cient is now negative and statistically signi�cant, possibly re-
�ecting the fact that the entry of a private school may reduce skill dispersion in the public system,
by attracting the best students. The results of column (4), which again uses the bolsa-familia cov-
erage as instrument for dispersion, show that the estimated coe�cient is now positive and similar
in size to the speci�cation in column (2), which does not include �xed e�ects. Columns (5) and
(6), repeats the speci�cations of columns (3) and (4), but now uses a long-di�erences speci�cation
to control for the �xed-e�ects. The results are very similar, adding credibility to the empirical
strategy. The estimated coe�cient of column (6) means that increasing the coe�cient of variation
by one standard deviation (0.027) would increase the probability of entry by 19 percentage points,
a sizable impact. In sum, the results show that the variation in the students heterogeneity brought
about by changes in the share of families receiving transfers from the Bolsa-Familia program causes
an increase in the probability of private school entry, as predicted by our theoretical model.
Table 7 presents the results of some additional econometric exercises to examine the impact of
skill dispersion on private school entry. The �rst row reproduces the coe�cient estimated in column
(6) of Table 6 as benchmark. The second row uses reading test scores instead of mathematics as the
main explanatory variable. The estimated coe�cient is two times higher, but it only marginally
statistically signi�cant (p-value equals 0.07). The third row excludes from the sample the 185
municipalities that experienced exits of all existing private schools between 2007 and 2011 and
the estimated coe�cient of skill dispersion changes very little. Row (4) further excludes from the
sample the 1,595 municipalities that had private schools throughout the sample period and one
can notice that the size of the estimated coe�cient increases, but so does the standard error due
to the smaller sample size. In the last row we do as in the evaluation literature and compare
25

the municipalities with a private schools in 2007 with those that did not have one, but were
very �similar� to the ones that had. In order to do that we predicted the probability of having
a private school in the municipality in 2007 as a function of its population, income, education
and poverty and chose from the sample of cities without private schools does that had similar
predicted probabilities to the ones that had one (nearest neighbor matching). We ended up with
1,775 observations in the treatment and in the control group and the estimated skill dispersion
coe�cient, presented in the last row of Table 7, is almost twice the size of the benchmark one.Using
this estimate means that increasing the coe�cient of variation by one standard deviation would
increase the probability of entry by 34 percentage points.
We would also like to know the impact of skill dispersion on the number of existing private
schools and not only on whether there exists a private school in the municipality or not. Hence,
Table 8 report the results of ordered probit regressions with the same explanatory variables as
the previous tables. Column (1) shows that test scores dispersion (coe�cient of variation of math
scores) in the public system does not have a signi�cant impact on the number of private schools
in the city, once we control for other possible determinants, such as the school-age population,
average income, education and the poverty rate, all of which have the expected signs. But, we
know from out previous results, that we should treat the skill dispersion as endogenous and when
we do that, by using the bolsa-familia program as an instrumental variable, we can see that the
estimated coe�cient is multiplied by a factor of 100 and is now statistically signi�cant. Columns
(3) and (4) repeats this exercise using the coe�cient of variation in Portuguese test scores instead
of in mathematics and the results are pretty similar, with the estimated coe�cient on Portuguese
being even higher than the mathematics one. Therefore, the results show that skill dispersion not
only increases the probability of entry of private schools in the municipality but it also rises the
number of private schools in the cities.
4 Conclusions
In 1970 Brazil was under a military dictatorship, there were no direct income transfers to the poor,
only 63% of the children aged between 7 and 14 were attending school, the poverty rate was 70%
26

and the Gini coe�cient was 0.564. Forty year later, in 2010, Brazil was a stable democracy, a
conditional cash transfer program reaching around 44 million poor people was in place, 98% of
children were attending school, only 10% of the population were poor and the Gini coe�cient was
reduced to 0.533. The democratization of the political process in Brazil seems to have been very
successful in terms of improving social policies, reducing poverty, increasing school attendance
and reducing the country´s historically high levels of income inequality. It seems, therefore, that
Brazil's recent history can be considered as a classic example of a change in the political system
that, by extending the voting franchise, has led to lower inequality (Meltzer and Richards [30]).
This paper shows that the rise in the students' skill dispersion in Brazilian municipalities,
brought about by the expansion of the Bolsa-Familia Program, led to private school entry. There-
fore, the program designed to reduce poverty and inequality had the unexpected e�ect of increasing
private school entry, re-introducing strati�cation and inequality persistence. We believe our results
could be interpreted more broadly, as an example of how a country's elite can maintain its relative
economic position even in the face of a radical change in the political system that has led to an
increase in school attendance and to the introduction of new social programs. The salient feature
of our paper is that this mechanism arises endogenously in equilibrium, without us having to rely
on a process of elite capture of the political system. Future work should examine the impact
of private school entry on the average and standard deviation of test scores in the public school
system and also on income inequality and inter-generation mobility in society as a whole.
References
[1] ABDULKADIROGLU, ANGRIST AND PATHAK (2014) �The Elite Illusion: Achievement
E�ects at Boston and New York Exam Schools�, Econometrica, vol 82, no. 1: 137-196.
[2] ACEMOGLU, D., S. NAIDU, P RESTREPO and J. A. ROBINSON. (2013) �Democracy,
Redistribution and Inequality�. NBER Working Paper no. 19746.
[3] ACEMOGLU, D and J. A. ROBINSON. (2008) �Persistence of Power, Elites, and Institutions�.
American Economic Review, vol 98, no.1: 267�293.
27

[4] BECKER, G.S. (1991) �A Note on Restaurant Pricing and Other Examples of Social In�uences
on Price�. The Journal of Political Economy, Chicago, vol 99, no. 5: 1109-1116.
[5] BECKER, G.S. and M.K. MURPHY. (2000) �Social Economics: Market Behavior in a Social
Environment�. Cambridge, MA: The Belknap Press of Harvard University Press.
[6] BENABOU, R. (1992) �Workings of a City: Location, Education, and Production�. The
Quarterly Journal of Economics, vol. 108, no. 3: 619-652.
[7] BERRY, S.T. (1992) �Estimation of a Model of Entry in the Airline Industry�. Econometrica,
Econometric Society, vol 60, no. 4: 889-917.
[8] BLACK, S. E. and P. J. DEVEREUX. (2010). �Recent Developments in Intergenerational
Mobility�. NBER Working Paper no. 15889.
[9] BRESNAHAN, T.F. (1987) �Competition and Collusion in the American Automobile Indus-
try: The 1955 Price War�. The Journal of Industrial Economics, vol 35, no. 4: 457-482.
[10] BRESNAHAN, T.F.and P.C. REISS. (1991) �Entry and Competition in concentrated mar-
kets�. Jornal of Political Economy, Chicago, vol 99, no. 5: 977-1009.
[11] CUNHA, F. and J.F. HECKMAN. (2007) �The technology of skill formation�. IZA Discussion
Papers, No. 2550.
[12] DOWNES, T. and S. GREENSTEIN. (1996) �Understanding the Supply Decisions of Non-
pro�ts: Modelling the Location of Private Schools�. The RAND Journal of Economics, vol 27,
no. 2: 365-390.
[13] DURLAUF, S. (1996) �A Theory of Persistent Income Inequality�. Journal of Economic
Growth, v 1, no. 1: 75-93.
[14] EPPLE, D., D. FIGLIO and R.E. ROMANO. (2004) �Competition between Private and Public
Schools: Testing Strati�cation and Pricing Predictions�. Journal of Public Economics, vol 88,
1215�1245.
28

[15] EPPLE, D. and R.E. ROMANO. (1998) �Competition Between Private and Public Schools,
Vouchers, and Peer-Group E�ects�. American Economic Review, vol 88, no. 1: 33-62.
[16] FERNANDEZ, R. (2003). �Sorting, Education and Inequality� in Advances in Economics
and Econometrics, Dewatripont, Hansen, and Turnovsky (Eds.), Cambridge University Press,
2003.
[17] FERNANDEZ, R. and R. ROGERSON (1996). �Income Distribution, Communities, and the
Quality of Public Education�. Quarterly Journal of Economics, vol 111, no. 1: 135-164.
[18] FERREIRA, F. and J. GIGNOUX (2011) �The Measurement of Educational Inequality:
Achievement and Opportunity�, World Bank Policy Research Working Paper, no. 5873.
[19] FIGLIO, D. (2001) �Can Public Policy A�ect Private School Cream Skimming?�. Journal of
Urban Economics, vol 49, 240-266.
[20] FRIEDMAN, M. (1962) �Capitalism and freedom� (Chapter 6). Chicago: University of
Chicago Press.
[21] FRYER JR, R and L. KATZ (2013) �Achieving Escape Velocity: neighborhood and School
Interventions to Reduce Persistent Inequality�, American Economic Review, vol 103, no.3:
232-37.
[22] GLAESER , E. and J. SCHEINKMAN. (2002) �Non-Market Interactions�. NBER Working
Paper No. 8053.
[23] GLEWWE, P. and A.L. KASSOUF. (2012) �The Impact of the Bolsa Escola/Família Con-
ditional Cash Transfer Program on Enrollment, Drop Out Rates and Grade Promotion in
Brazil�. Journal of Development Economics, Elsevier, vol 97, no. 2: 505-517.
[24] GLOMM, G., and B. RAVIKUMAR (1992) �Public versus private investment in human cap-
ital: endogenous growth and income inequality,� Journal of Political Economy, vol 100: 818-
834.
29

[25] HOXBY, C. (2000) �Do Private Schools provide Competition for Public Schools? NBER
Working Paper 4978.
[26] HOXBY,C. (2001) �All School Finance Equalization are not Created Equal�, The Quartely
Journal of Economics, vol 116, no. 4: 1189-1231.
[27] KATZ, L, J. KLING and J. LIEBMAN (2001) �Moving to Opportunity in Boston: Early
Results of a Randomized Mobility Experiment�, Quartely Journal of Economics, vol 116, no
2 607-654.
[28] MACLEOD, W.B. and M. URQUIOLA. (2012) �Anti-Lemons: School Reputation, Relative
Diversity, and Educational Quality�. IZA Discussion Papers, no. 6805.
[29] MAZZEO, M. (2002) �Product Choice and Oligopoly Market Structure". RAND Journal of
Economics, vol 33, no. 2: 1�22.
[30] MELTZER, A. and S. RICHARD (1981) �A Rational Theory of the Size of Government�,
Journal of Political Economy, 89: 914-27.
[31] OECD (2012), Public and Private Schools: How Management and Funding Relate to their
Socio-economic Pro�le, OECD Publishing. http://dx.doi.org/10.1787/9789264175006-en
[32] SAAVEDRA, J. and S. GARCIA (2012): �Impacts of Conditional Cash Transfer Programs
on Educational Outcomes in Developing Countries A Meta-analysis� Rand Corporation, WR-
921-1.
[33] RICCIO, J, N. DECHAUSY, C. MILLER, S. NUNEZ, N. VERMA, E. YOUNG (2013) �Con-
ditional Cash Transfers in New York City�, MDRC, September.
[34] SEIM, K. (2006) �An empirical model of �rm entry with endogenous product-type choices�.
RAND Journal of Economics, vol 37, no. 3.
[35] SOARES, S. and N. SÁTYRO. (2009) �O Programa Bolsa Família: Desempenho Institucional,
Impactos e Possibilidades Futuras�. IPEA Discussion Papers, no. 24.
30

[36] SHAKED, A. and J. SUTTON. (1983) �Natural Oligopolies�. Econometrica, vol 51, no. 5:
1469-1484.
[37] ZHANG, J., J. DAVIES and J. ZENG. (2005). �Intergenerational Mobility under Private vs.
Public Education�. Scandinavian Journal of Economics, vol 107: 399-417.
A Proofs
A.1 Proposition 1
Proof. Consider equation θj =˜Ajsh(s, y)dsdy. In a market with N schools, it de�nes a system
with N equations, one for each school. For a given vector of prices p, we can rewrite it as θj =
Hj (θ, p), where θ = (θ1, ..., θN) and p = (p1, ..., pN). De�ne H(θ, p) = (H1 (θ, p) , ..., HN (θ, p)) .We
can re-write this system as
H (θ, p) = θ (9)
Denote the interval [s, s] by I. If s ∈ I, by equation (3), θ ∈ I, a closed and bounded
interval. As is usual, we assume that there is a maximum price p such that S (θ, p) = 0. Denote
the price domain [0, p] by Π, a closed and bounded interval. H(.) is a continuos function, with
H : IN × ΠN → IN .
We now turn to the pricing problem. Taking the derivative of equation 4 with respect to pj we
obtain
Sj (θ, p) + pjdSjdpj
= 0.
Rearranging terms we have Gj (θ, p) = pj, where Gj (θ, p) = −Sj(θ,p)dSj/dpj
.
De�ne G (θ, p) = (G1 (θ, p) , ..., GN (θ, p)). We can write the system of N �rst order conditions
as
G (θ, p) = p (10)
G(.) is a continuous function, de�ned as G : IN × ΠN → ΠN .
The system composed by equations (9) and (10) de�nes the market equilibrium. De�ne the
31

vectors Ψ(θ, p) = (H (θ, p) , S (θ, p)) and ζ = (θ, p). We can re-write this system as
Ψ (ζ) = ζ. (11)
Since Π and I are closed and bounded intervals, the mapping Ψ(.) is continuous and de�ned
as Ψ : IN × ΠN → IN × ΠN , Browers' �xed point theorem applies, so there is a �xed point.
A.2 Proposition 3
Proof. In equilibrium, there is a locus of households who are indi�erent between being enrolled,
say, in school j or school j + 1. This locus is de�ned by the following equality:
u (y − pj) + θjs = u(y − pj+1) + θj+1s (12)
or
u (y − pj)− u(y − pj+1) + (θj − θj+1) s = 0.
We call this locus sj (y). Applying the implicit function theorem and rearranging terms, we have
dsj (y)
dy=
du(y−pj)
dy− du(y−pj+1)
dy
(θj+1 − θj)≤ 0 (13)
This derivative is the slope of the locus of indiferent students. In order to understand why this is
less than zero, �rst note that in equilibrium with strati�cation pj+1 > pj and θj+1 > θj. Second,
u′ > 0 and u′′ ≤ 0. It implies that du(y−pj)/dy ≤ du(y−pj+1)/dy , rendering the numerator negative,
and therefore ds/dy < 0. The same argument holds for the indi�erence locus between the public
school and the working option.
A.3 Proposition 4
Proof. Consider the indi�erence condition between the public and private school #2:
u (y) + θ1s = u(y − p2) + θ2s (14)
32

Since u (.) is a monotonic increasing function, u′ (.) > 0, it has an inverse u−1 (.), which is also
an increasing function. Hence, we can re-write the above equation as
p2 = y − u−1 [u (y)− (θ2 − θ1) s] (15)
Therefore, an increase in the term (θ2 − θ1), increases p2. Now, consider the indiference condition
between schools #2 and #3:
u (y − p3) + θ3s = u(y − p2) + θ2s (16)
Re-writing,
p3 = y − u−1 [u (y − p2)− (θ3 − θ2) s] (17)
Rearranging equation 15, and substituting into equation 17 gives
p3 = y − u−1 [u (y)− (θ3 − θ1) s] . (18)
By mathematical induction, we have the following relationship
pj = y − u−1 [u (y)− (θj − θ1) s] . (19)
A.4 Proposition 5
Proof. We have shown in Proposition 4 that the price the private school charges is an increasing
function of the di�erence in quality between the public and the private school. It remains to show
that (i) an increase in the skill variance increases the di�erence in quality, and (ii) that pro�ts
cannot fall due to smaller market shares in the new equilibrium.
In order to avoid excessive notation, we now assume that h (s, y) is the distribution of char-
acteristics of the student population only, such that children who is not enrolled in school is not
33
represented by this distribution. Now we show that an increase in the students skill variance in-
creases the di�erences in quality between the public and private schools. The quality of school j
is
θj =
¨
Aj
sh(s, y)dsdy (20)
We de�ne the conditional mean skill as
θj (y) =
ˆAj
sh(s|y)ds, (21)
where h (s|y) is the conditional distribution of skill on income.
Consider now another conditional distribution for skill h′ (s′|y), that is a mean preserving spread
of h (s|y).16 We can write s′ = s + u, where u is symmetrically distributed as g (u), with mean
zero and positive variance.
The conditional mean skill of the economy under this new distribution is
E(s′ (y)) =
sˆ
s
s′h′(s′|y)ds′. (22)
Now note that E(s′ (y)) = E(s (y)):
E(s′ (y)) =
sˆ
s
s′h′(s′|y)ds′ =
sˆ
s
sh(s|y)ds+
∞
−∞
ug(u)du = E(s (y)). (23)
Without loss of generality, we consider an equilibrium with three schools: school 1 (public), and
schools 2 and 3 (privates), such that θ3 > θ2 > θ1. The conditional mean skill of the private school
3 under the new distribution is greater than under the original distribution:
θ′3 (y) =
sˆ
s2(y)
s′h′(s′|y)ds′ =
sˆ
s2(y)
sh(s|y)ds+
∞
s2(y)
ug(u)du > θ3 (y) . (24)
The inequality follows from the fact that the last integral, over the variable u, is not zero anymore,
16Such that h (., .) second order stochastic dominates h′ (., .).
34

since we are integrating from some positive value to the right (school 3 is the top school). Since it
holds for any y, we have that θ′3 > θ3. Formally,
θ′3 =
yˆ
y
θ′3 (y)h′y(y)dy =
yˆ
y
θ3 (y)hy(y)dy +
yˆ
y
∞
s2(y)
ug(u)du
hy(y)dy > θ3. (25)
Where h′y is the marginal distribution of y. We can use the same argument to show that the
converse holds for the public school:
θ′1 =
yˆ
y
θ′1 (y)h′y(y)dy =
yˆ
y
θ1 (y)hy(y)dy +
yˆ
y
s1(y)ˆ
−∞
ug(u)du
hy(y)dy < θ1. (26)
Now we need to show what happens to school 2. The sign of the change in θ2 is unde�ned, since
we do not know the sign of the second integral on the right hand side of the following equation:
θ′2 =
yˆ
y
θ′2 (y)h′y(y)dy =
yˆ
y
θ2 (y)hy(y)dy +
yˆ
y
s1(y)ˆ
s2(y)
ug(u)du
hy(y)dy (27)
But what really matters for school 2 pro�tability is the relative e�ect of the change in school
quality with respect to the public school. We need to show that θ′2− θ
′1 > θ2− θ1. From equations
26 and 27, we have
θ′
2 − θ′
1 = θ2 − θ1 +
yˆ
y
s1(y)ˆ
s2(y)
ug(u)du
hy(y)dy −yˆ
y
s1(y)ˆ
−∞
ug(u)du
hy(y)dy
(28)
From the de�nition of the variable u, it follows that the term within brackets is positive.
Last, we need to show that even if the market share of some private schools fall in the new
equilibrium with larger skill dispersion, the pro�t of these schools cannot fall. The equilibrium
share of school j is Sj (θj, θ−j, pj, p−j), where θ−j and p−j are the vectors of other schools qualities
and prices. Partial derivatives are: S1 > 0, S2 < 0, S3 < 0 and S4 > 0. Hence, the larger the
di�erence between the private and the public schools' qualities the larger the share of the private
school, holding prices �xed.
35

Therefore, an increase in the di�erence in qualities allows the private school to do one of three
things: (i) increase its price in order to keep its market share constant, (ii) increase its market
share by keeping its price constant and (iii) to do a combination of (i) and (ii). All of these options
must increase the pro�t of the private school.
36

Table 1: Equilibrium and Welfare - StudentsUtility Before Bolsa-Familia
skill income share public private work choice
a 0.8 5.0 0.33 2.09 2.09 1.66 public
b 0.4 2.5 0.33 1.16 0.89 1.01 public
c 0.1 1.0 0.33 0.06 -1.23 0.22 work
Utility After Bolsa-Familia
a 0.8 5.0 0.33 1.81 1.81 1.66 private
b 0.4 2.5 0.33 1.02 -0.01 1.01 public
c 0.1 1.0 0.33 0.25 -2.41 0.22 public
Table 2: Equilibrium and Welfare - SchoolsBefore Bolsa-Familia After Bolsa-Familia
Price (p2) 0.74 1.78
Pro�ts (π2) -0.26 0.78
Quality (θ2) 0.00 0.8
Entry? no yes
Public School
Quality (θ1) 0.60 0.25
Social Welfare =∑Ui
SW 3.47 3.07
B Tables
37

Table 3: Descriptive Statistics
Variables No Private Schools
With Private Schools
Private School Exit
Private School Entry
School-Age Population Levels 2,304 6,321 4,350 4,499
(2,123) (3,419) (2,887) (2,556)
Changes -112 -279 -248 -201
(258) (402) (361) (350)
Average Income Levels 412 439 414 373
(195) (210) (189) (217)
Changes 78 67 67 63
(60) (40) (41) (36) Share with at least High School Education
Levels 0.15 0.19 0.17 0.16
(0.06) (0.07) (0.06) (0.07)
Changes 0.050 0.053 0.053 0.053
(0.19) (0.19) (0.024) (0.21)
Share in Poverty Levels 0.27 0.27 0.28 0.34
(0.20) (0.18) (0.19) (0.20)
Changes -0.054 -0.052 -0.053 -0.058
(0.024) (0.026) (0.028) (0.027) Share receiving Bolsa Família Transfers
Levels 0.35 0.36 0.36 0.41
(0.18) (0.19) (0.17) (0.19)
Changes 0.047 0.046 0.041 0.069
(0.067) (0.069) (0.080) (0.087)
Share of Students in Schools Levels 0.91 0.91 0.91 0.91
(0.038) (0.023) (0.030) (0.033)
Changes 0.026 0.022 0.026 0.024
(0.025) (0.018) (0.021) (0.020) Standard Deviation of Math Scores
Levels 39.4 40.0 40.1 39.5
(5.72) (4.41) (5.25) (4.98)
Changes 2.47 3.06 2.83 2.06
(6.71) (4.57) (5.65) (5.33)
Mean Math Scores (ln) Levels 5.48 5.46 5.48 5.45
(0.080) (0.070) (0.075) (0.77)
Changes 0.022 0.025 0.024 0.020
(0.057) (0.043) (0.051) (0.050) Coefficient of Variaton (CV) of Math Test Scores
Levels 0.163 0.17 0.169 0.169
(0.021) (0.015) (0.019) (0.018)
Changes 0.008 0.009 0.008 0.006
(0.024) (0.004) (0.024) (0.024)
Number of Municipalities 2,808 1,595 185 240
38

Table 4: First Stage: Bolsa-Familia and Test Score Dispersion
OLS Fixed Effects Long
Differences Long
Differences (1) (2) (3) (4)
Share with Bolsa Familia 0.022* 0.029* 0.036* 0.024*
-0,002 -0,004 (0.005) (0.005) School-Age Population 0,003* 0,022* 0.021* 0.022*
-0,001 -0,005 (0.005) (0.005) Income -0.003* 0.017* 0.017* -0.005
(0.001) -0,005 (0.004) (0.006) Education 0.030* 0,043* 0.044* 0.057*
(0.004) -0,018 (0.018) (0.018) Poverty Rate - - - -0.125*
- - - (0.018) N 14,469 14,469 4,823 4,823 Notes: The dependent variable is the coefficient of variation of test scores in the
municipality. Robust standard errors are in brackets. Time dummies are included in columns (1) and (2). State dummies are included in column (1). Starred coefficients are significant at the 5% level (*).
39

Table 5: The E�ects of Bolsa-Familia
Bolsa-Familia
Coefficient Effect of 1SD increase in Coverage
of Bolsa Familia (% SD) (1) (2)
(1) Income 0.037** 1,3
(0.016) (2) Poverty -0.108** 10
(0.004) (3) Share of Kids in Schools 0.071** 37
-0,005 (4) Mean Score – Math -0.032** 8,5
(0.011) (5) SD Scores – Math 6.79** 23
(1.25) (6) Private School Entry 0.181** 7 (0.060)
Notes: Entries in column (1) are the coefficients of the share of the population receiving
the bolsa-familia tranfers in of a long-differences regression (2011-2007) that controls for the size of school-age population and education. Robust standard errors in bracket. Each row reports the result of a different regression. Starred coefficients (*) are significant at the 5% level. Entries in column (2) are the simulated effects of an increase in one standard deviation of the bolsa-familia coverage on the variable of interest, measured as a % of standard deviation of the variable.
40
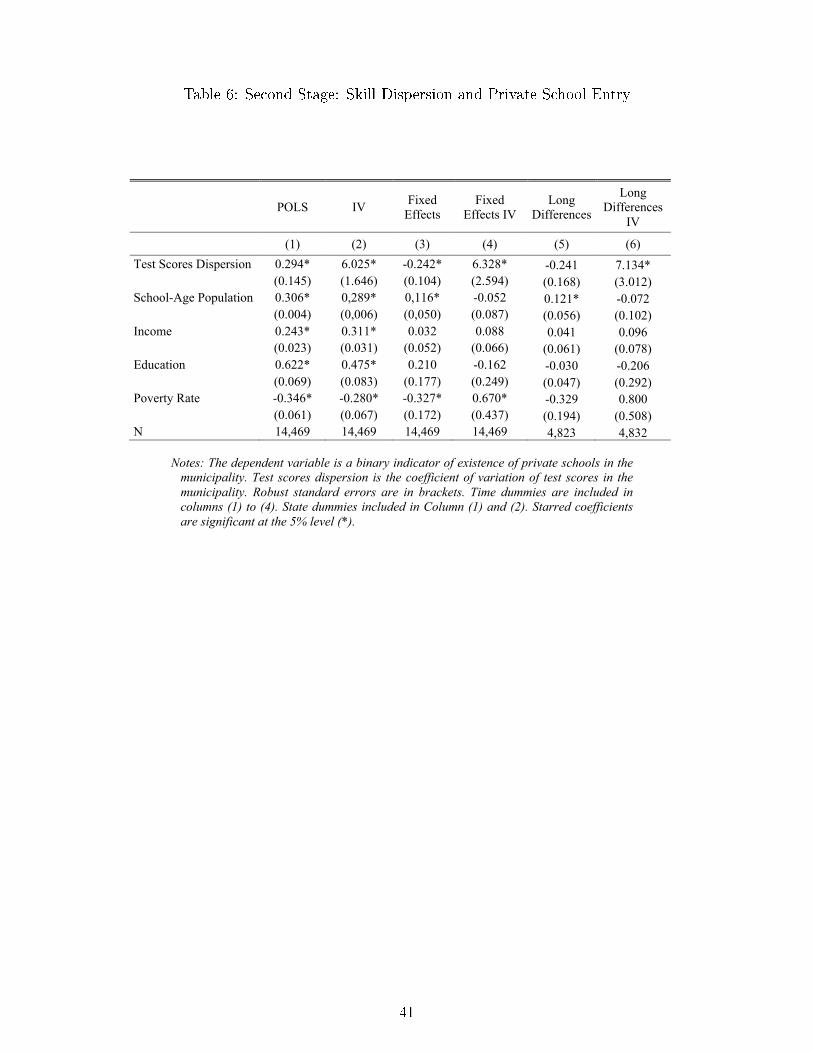
Table 6: Second Stage: Skill Dispersion and Private School Entry
POLS IV Fixed Effects
Fixed Effects IV
Long Differences
Long Differences
IV
(1) (2) (3) (4) (5) (6) Test Scores Dispersion 0.294* 6.025* -0.242* 6.328* -0.241 7.134*
(0.145) (1.646) (0.104) (2.594) (0.168) (3.012) School-Age Population 0.306* 0,289* 0,116* -0.052 0.121* -0.072
(0.004) (0,006) (0,050) (0.087) (0.056) (0.102) Income 0.243* 0.311* 0.032 0.088 0.041 0.096
(0.023) (0.031) (0.052) (0.066) (0.061) (0.078) Education 0.622* 0.475* 0.210 -0.162 -0.030 -0.206
(0.069) (0.083) (0.177) (0.249) (0.047) (0.292) Poverty Rate -0.346* -0.280* -0.327* 0.670* -0.329 0.800
(0.061) (0.067) (0.172) (0.437) (0.194) (0.508) N 14,469 14,469 14,469 14,469 4,823 4,832
Notes: The dependent variable is a binary indicator of existence of private schools in the
municipality. Test scores dispersion is the coefficient of variation of test scores in the municipality. Robust standard errors are in brackets. Time dummies are included in columns (1) to (4). State dummies included in Column (1) and (2). Starred coefficients are significant at the 5% level (*).
41

Table 7: Skill Dispersion and Private School Entry - Robustness Tests
(1) Mathematics 7.13**
(3.01) (2) Reading 14.02*
(7.82) (3) Excluding exits 8.04**
(2.75) (4) No private schools on 2007 10.85*
(4.47) (5) Matched Municipalities 12.56* (6.74)
Notes: The dependent variable is a binary indicator of existence of private schools in
the municipality. Entries are coefficients of instrumental variable regressions of probability of private school entry on the coefficient of variation of test scores in the municipality. Regressions include controls for school-age population and education. Robust standard errors are in brackets. Starred coefficients are significant at the 5% level(*).
42

Table 8: Ordered Probit
Ordered Probit Ordered Probit - IV
Ordered Probit
Ordered Probit - IV
(1) (2) (3) (4)
Test Scores Dispersion 0.030 2.505* 0.047 3.269*
0,032 0.311 (0.029) 0.406
School-age Population 0.070* 0.063* 0.070* 0.062*
(0.001) (0.001) (0.001) -(0.002)
Income 0.042* 0.069* 0.042* 0.082*
(0.005) (0.006) (0.005) (0.007)
Education 0.193* 0.133* 0.192* 0.116*
(0.014) (0.015) (0.014) (0.016)
Poverty Rate -0.091* -0.063* -0.091* -0.057*
(0.012) (0.012) (0.012) (0.013)
N 14,469 14,469 14,469 14,469 Notes: Entries are marginal effects of ordered probit regressions. The dependent
variable is the number of private schools in the municipality. Test scores dispersion is the coefficient of variation of test scores in the municipality. Robust standard errors are in brackets. Time and state dummies included in all columns. Starred coefficients are significant at the 5% level(*).
43