running head: detecting unusual item response patterns ... · irt model estimated responses and the...
TRANSCRIPT

Detecting Unusual Patterns 1
Running head: DETECTING UNUSUAL ITEM RESPONSE PATTERNS
Detecting Unusual Item Response Patterns Based on Likelihood of Answer
Kyoungwon Lee Bishop
Pearson
Christopher Neil Stephens
AIR
Detecting Unusual Patterns 2
Abstract
This paper proposes a hybrid of IRT-based and non-parametric-based methods for
detecting unusual answer patterns. This proposed method uses IRT to estimate θ values for the
examinees and item parameters. It then uses ordering of probability-based permutations (akin to
non-parametric methods conceptually) to identify aberrant response patterns. This is partially in
response to the expectation that at some point in the near future, current erasure-based methods
will become obsolete due to the increase in on-line testing. It is also partially in response to the
problem of cheating from teachers and school administrators. This flagging method also covers
detecting student level item cheating. Whether cheating occurs in administrator level or student
level, unusual item response pattern can be discovered by examination of the likelihood of right
and wrong items by student ability (theta) level. This method provides detection of cheating not
only from paper-pencil but also on computerized tests. In contrast, examination of similar
response patterns from adjacent students would fail to identify such cheating. A procedure such
as this that addresses aberrant response patterns would have much greater utility.

Detecting Unusual Patterns 3
Introduction
There are numerous proposed methods to detect cheating on assessments. In 1999, Cizek
addressed many of these in his book Cheating on Tests: How to Do It, Detect It, and Prevent It.
The different methods have different strengths and weaknesses, depending on what kind of
cheating has occurred. Some of the cheating methods that have been addressed in Cizek’s book
and elsewhere are posttest answer sheet tampering, answer copying during testing, prior access
to test content, and having another examinee take the test (proxy testing). Some of the detection
methods that have been proposed to address these cheating methods include erasure analysis,
gain score models, answer-copying statistical indices, person-fit statistics, and aberrant response
models. The following is a brief summary of some of the history of cheating detection methods,
with an emphasis on person-fit/aberrant response models, which are most relevant to this paper.
Statistical methods to detect cheating flag statistically unusual data patterns and provide
the interested party with some sort of likelihood-based conclusion. It is impossible with these
detection methods to actually show that cheating has occurred. But instead, they can show how
extremely unlikely the flagged occurrence would happen based on the given parameters. The
first proposed method was by Bird (1927, 1929). His method consisted of comparing incorrect
answers for matches between two students being investigated against matched incorrect answers
from a large random sample of paired students. He controlled for ability level by basing the pairs
on similar total scores for both the large random sample and the two students being investigated.
For a 149 item test, the random sample had an average of 4.0 identical incorrect answers per pair,
while the suspected cheaters had 17, 25, 28, and 31 identical incorrect answers. This method

Detecting Unusual Patterns 4
required constructing an empirical distribution for the population, to which the suspected pair
would then be compared in order to determine whether this was an anomalous event.
Detection methods continued with comparing identical incorrect answers and comparing
the likelihood of that event against chance (Dickenson, 1945; Anikeef, 1954). Saupe (1960)
advanced the process by incorporating identical correct answers to the analysis. His method used
a regression line assuming a random distribution of correct/incorrect answers based on total
correct answers, matching correct answers, and matching incorrect answers. He then looked at
the distance between an observed point (based on the product of each student’s total correct
answers on the x-axis, and the matching pairs of either the correct answers or incorrect answers
on the y-axis) and the regression line for the method’s metric. The drawback of his method was
that the regression line assumed that students randomly answered test questions correctly.
Angoff (1974) also included correct answers and used pair averages as the point of comparison.
Frary (1977) added the wrinkle of including omitted answers as well to his analysis.
The previous methods are designed to identify pairs of students that copied off of each
other during a test administration. A different branch of cheating detection arose based on item
response theory (IRT) models. Using IRT models, an examinee’s latent ability, θ, and the item
characteristics (a, b, and/or c parameters, depending on the model) are used to construct a
person-fit or aberrant response index. These types of indices demonstrate the degree to which the
observed response pattern created by a given examinee with an estimated latent ability, θ,
deviates from what the expected response pattern should be given the chosen IRT model. A very
large number of the indices have been developed to detect aberrant response patterns
(Karabatsos, 2003). Karabatsos separates these person-fit statistics into two categories—
parametric and non-parametric. The parametric person-fit statistics measure the distance between

Detecting Unusual Patterns 5
IRT model estimated responses and the observed responses. Sijtsma and Meijer (2001) provide a
detailed and thorough review of many of them. The non-parametric person-fit statistics are not
based on IRT models or IRT parameters and are derived only from the observed responses of the
examinees to the given test items.
Regardless of whether the person-fit index is based on an IRT model or not, the general
idea behind such an index is that given an examinee’s total score (or estimated latent ability, θ),
the examinee’s individual response pattern for the items answered should correspond to the
difficulty of the items. That is, an examinee should answer the easier items correctly and the
harder items incorrectly to some degree. An examinee that answered the easier items incorrectly
and the harder items correctly (depending on the degree it occurred) would display an aberrant
response pattern when compared to the testing population. The conceptual framework for these
person-fit indices can be sorted into one of three types—likelihood, covariance, and deviation.
The likelihood-based frameworks determine which examinees response patterns agree with what
the IRT model predicts for that examinee and produce relatively high maximum values of the
likelihood function (Levine & Rubin, 1979). Examinees whose response patterns are
substantially different than predicted have low maximum values of the likelihood function.
Therefore, the relative magnitude of the likelihood function values can demonstrate which
response patterns are aberrant. Covariance-based frameworks look at the magnitude that an
examinee’s response patterns diverge from the Guttman “perfect pattern.” (Tatsuoka, 1984).
Tatsuoka’s ECIs (Extended Caution Indices) are based on the ratio of the covariance among an
examinee’s responses and the estimates of item difficulty to the covariance among the averages
of the p-value over all examinees and the estimates of item difficulty. Therefore, aberrant
response patterns will result in lower ECI values. Lastly, deviation-based frameworks, like

Detecting Unusual Patterns 6
Wright and Stone (1979) developed with the outfit mean-square. Here, they take the difference
between an examinee’s response (0 or 1) and the p-value for that item, square the value, and then
sum all of the values. A large relative value, when compared to other examinees, would indicate
a deviation from the examinee’s response pattern and the predicted model for that examinee.
This paper proposes a hybrid of IRT-based and non-parametric-based methods to detect
cheating. This proposed method uses IRT to estimate θ values for the examinees and parameters
for the items. It then uses ordering of probability-based permutations (akin to non-parametric
methods conceptually) to identify aberrant response patterns. The probability of item response
patterns (wrong and right responses of a test) is computed for each ability estimate level. This
enables us to detect unlikely response patterns in person level in the same ability student group.
Once a person can be flagged using this method, if the similar unlikely patterns emerge among
multiple students in same classrooms or schools, the classroom or school can be detected for
possible cheating, which maybe was done by teachers or administrators. Therefore the proposed
method would have advantage of detecting both individual and group level cheating. This means
this method has potential to be used whether cheating is done by individual’s copying answers or
prior item exposure or administrators erase multiple item responses over classrooms or schools.
No matter how cheating is done, as long as the students show unfit item response pattern
according to their ability level, the cheating can be detected.

Detecting Unusual Patterns 7
Method
Using the Rasch model, we can obtain the probability of getting an item right.
Let be a dichotomous random variable where, for example, denotes a
correct response and an incorrect response to a given assessment item. In the Rasch model
for dichotomous data, the probability of the outcome is given by:
-
where is the ability of person and is the difficulty of item . Thus, in the case of a
dichotomous item, is the probability of success based on the interaction between the
person and the particular item. Assuming the difficulty values of each item are known, we can
determine the ability level (theta) of a person. Then using both item difficulty values and theta
estimates, we can obtain from the model what the probability of a correct and incorrect response
is for a specific examinee.
Permutation
Using the Rasch model, can be obtained for each item per theta ability level.
Permutation can be used to estimate the likelihood of an item response pattern for a given theta
level. If the person’s ability and item parameters are similar, the probability of permutation will
be higher. If ability level and item difficulty are further apart, the probability of the permutation
will be low. The product of these probabilities for all items in a test becomes the likelihood of
item response pattern. The range of the likelihood (from the least likely to the most likely
pattern) can then be displayed in the order of the permutation for application in detection of
aberrant patterns.

Detecting Unusual Patterns 8
The basic concept of the permutation is described below. Selecting r out of n permutation
without repetition and order is:
Where n is the number of items to choose from, and r is the number of chosen items. So r! is the
number of items right and (n-r)! is the number of items wrong.
The total permutation of right and wrong responses in a test is the sum of combinations from a
person answering all items right to answering all items wrong.
Selection of items for permutation
For most tests, the number of items and resulting permutations becomes large quickly. For
example, on a 40-item test the total number of permutation is 1.68582E+94. This is too many to
list for computation and therefore not practical. In this paper we decided to have a more focused
approach. P(r) or P(w) is highest in the most difficult or the most easy items. Items in the middle
range of difficulty are usually closer to an examinee having a 50 percent chance of success,
which will have less of an impact on a likelihood calculation. Including middle difficult range
items does not contribute much in distinguishing the likelihood of cheating. When cheating
occurs in the middle difficulty items, the P(r) does not increase much but in both ends of extreme
difficult/easy items, the change will be significant. Therefore we chose to focus on the tails of the
item difficulties. We selected the five easiest and the five hardest items for calculating the

Detecting Unusual Patterns 9
permutations of right and wrong item responses. This is an attempt to maximize the evidence of
cheating while maintaining a manageable computation level.
For a permutation using ten items, this works out to be 1024 as given by:
Flagging procedure
Each combination of P(r) and P(w) produces a percentage of permutation (Pperm) where the
sum of all 1024 Pperms is 1. The example Pperms from all right to all wrong item patterns are
presented in Table 3. Only easiest and hardiest items’ Pperms are posted in the table. Items
between these two extreme difficulty items have Pperm values between both ends. A
permutation that is more likely to happen has a higher Pperm than that of a less likely
permutation, which has a smaller Pperm. We chose to use a 95 percent cut off criteria based on
typical use within probability theory where a significance level of 0.05 is considered a
reasonable threshold for hypothesis testing. Within the context of this study, the highest Pperms
summing to 95 percent in descending order are more likely to occur 95 percent of the time in all
possible combinations of item response patterns. This is similar in comparison to where we use
alpha level of .05 for reject the hypothesis.
In the similar way, we think if the Pperm does not fall into the 95 percent times, this person’s
item response probability is very unlikely to happen and more likely is attributable to a different
ability level. If a person’s Pperm in his or her ability level is less than a Pperm at 95 percent, that
person is flagged. By extension, if there are multiple flags within a classroom or a school, then
the classroom or the school can be flagged.

Detecting Unusual Patterns 10
Data
The data used for this study was generated to resemble a state’s accountability program. There
were 40 dichotomous items chosen from the existing state NCLB assessment program. We
generated 10,000 student response sets from the known Rasch item parameters. Of these 40
items, we took the five easiest and the five hardest items to compute the respective Pperms of
item response patterns.
To simulate group level cheating, we created cheating on three sets of student groups (3 schools).
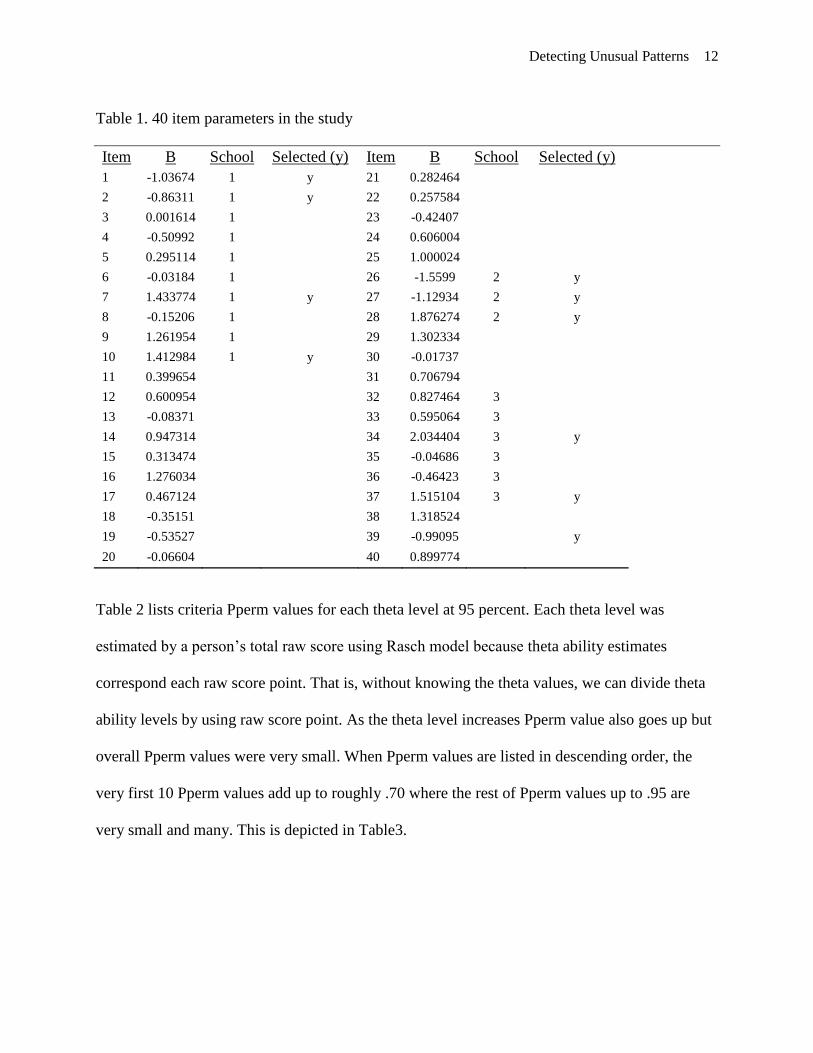
The source item parameters, groups, and easiest/hardest items are presented in Table1. Three sets
of items that were modified were 1) item 1-10 (100 students), 2) item 26-28 (100 students) and
3) item 32-37 (100 students). These 300 students’ responses may not result in all changes from
wrong to right, because some may already have right answers for some items.
To depict individual cheating, we changed wrong item responses to right item responses in the
rest of data (excluding the group cheating part). Item changes were made to reflect individual
cheating across different items. Students had to be selected not to fall in the same classroom or
school. 50 students were selected to meet this condition in item change. Each student’s item
changes targeted at some parts of the 40 items.
The final selected 10 items for permutation were item 26, 27, 1, 39, 2 (easiest items) and item 10,
7, 37, 28, 34 (hardest items). Also the 10 items chosen for permutation overlapped partly with all
modified items randomly throughout student responses.
Analysis
The items selected for three school level cheating and the final 10 items selected for the
permutation are identified in Table1. Item parameters used for individual cheating were not

Detecting Unusual Patterns 11
identified in the Table 1 but since items were changed throughout the data, some items might be
overlapped with the final selected items. Not all items used for group level were used for final
selection since they were distributed throughout the test in a random fashion.
Detecting Unusual Patterns 12
Table 1. 40 item parameters in the study
Item B School Selected (y) Item B School Selected (y)
1 -1.03674 1 y 21 0.282464
2 -0.86311 1 y 22 0.257584
3 0.001614 1
23 -0.42407
4 -0.50992 1
24 0.606004
5 0.295114 1
25 1.000024
6 -0.03184 1
26 -1.5599 2 y
7 1.433774 1 y 27 -1.12934 2 y
8 -0.15206 1
28 1.876274 2 y
9 1.261954 1
29 1.302334
10 1.412984 1 y 30 -0.01737
11 0.399654
31 0.706794
12 0.600954
32 0.827464 3
13 -0.08371
33 0.595064 3
14 0.947314
34 2.034404 3 y
15 0.313474
35 -0.04686 3
16 1.276034
36 -0.46423 3
17 0.467124
37 1.515104 3 y
18 -0.35151
38 1.318524
19 -0.53527
39 -0.99095
y
20 -0.06604 40 0.899774
Table 2 lists criteria Pperm values for each theta level at 95 percent. Each theta level was
estimated by a person’s total raw score using Rasch model because theta ability estimates
correspond each raw score point. That is, without knowing the theta values, we can divide theta
ability levels by using raw score point. As the theta level increases Pperm value also goes up but
overall Pperm values were very small. When Pperm values are listed in descending order, the
very first 10 Pperm values add up to roughly .70 where the rest of Pperm values up to .95 are
very small and many. This is depicted in Table3.

Detecting Unusual Patterns 13
Table 2. 95 percent Criterion P-Value for Each Theta
Level
Raw P Summed P Raw P Summed P
8 0.000839 0.95 25 0.000326 0.95
9 0.000801 0.95 26 0.000332 0.95
10 0.000877 0.95 27 0.000339 0.95
11 0.000958 0.95 28 0.000344 0.95
12 0.000805 0.95 29 0.000345 0.95
13 0.00057 0.95 30 0.000355 0.95
14 0.000342 0.95 31 0.000865 0.95
15 0.000351 0.95 32 0.000933 0.95
16 0.000338 0.95 33 0.000894 0.95
17 0.000336 0.95 34 0.000805 0.95
18 0.000339 0.95 35 0.000778 0.95
19 0.000323 0.95 36 0.000889 0.95
20 0.000304 0.95 37 0.00137 0.95
21 0.000319 0.95 38 0.002761 0.95
22 0.000343 0.95 39 0.005305 0.95
23 0.000328 0.95 40 0.020311 0.95
24 0.000306 0.95
Note. There were no raw scores between 0-7 for this data.
Theta level was estimated by raw score.
95 percent of the time, individual student’s response pattern p-values (w/r) for the 10 selected
items exceeded the p-value in the table. If the individual p-value is less than the criterion p-value
given the same ability level, the student will be flagged for an unfit expected wrong and right
item response pattern. 95 percent of the p-values are distributed within almost zero to .05 with
the exception of a few higher p-values in the highest ability levels. Figure 1 presents where most
and least p-values occur by theta ability level.

Detecting Unusual Patterns 14
Figure 1.Item Pattern Probability and Flags per Score Point

Detecting Unusual Patterns 15
Table 3 presents how Pperm value changes where the item response patterns change. The
permutations at the beginning of the Table 3 illustrate when items are right. Here permutation 1
indicates where all 40 responses are correct. Permutation 2 is where 39 items are correct and one
item is wrong. The number of wrong item response increases as the number of permutation
reaches to 1024. The 1024th
permutation is where all items are wrong. The Pperm values in easy
and hard items are opposite in the same item response patterns. Easy items start with very small
Pperm values when all items were right and hard items starts with higher Pperm values in the
same level and go down when the items are answered wrong. This degree of the Pperm decreases
as the item difficulty becomes less extreme (the middle difficult items).

Detecting Unusual Patterns 16
Table 3. Probability of Each Permutation of Item Response Pattern of Wrong and Right
Easy Items Hard Items
Permutation
WR
Pattern p_8 p_9 p_10 p_11 p_37 p_38 p_39 p_40
1 All right 0.0000 0.0000 0.0000 0.0000 0.2337 0.3788 0.6147 0.8639
2
0.0000 0.0000 0.0000 0.0000 0.0029 0.0030 0.0023 0.0009
3
0.0000 0.0000 0.0000 0.0000 0.0044 0.0045 0.0035 0.0014
4
0.0000 0.0000 0.0000 0.0000 0.0048 0.0050 0.0039 0.0016
5
0.0000 0.0000 0.0000 0.0000 0.0050 0.0052 0.0041 0.0017
6
0.0000 0.0000 0.0000 0.0000 0.0057 0.0059 0.0046 0.0019
7
0.0000 0.0000 0.0000 0.0000 0.0001 0.0000 0.0000 0.0000
8
0.0000 0.0000 0.0000 0.0000 0.0001 0.0000 0.0000 0.0000
9
0.0000 0.0000 0.0000 0.0000 0.0001 0.0000 0.0000 0.0000
:
: : : : : : : :
:
: : : : : : : :
1016
0.0378 0.0322 0.0233 0.0273 0.0000 0.0000 0.0000 0.0000
1017
0.0395 0.0366 0.0301 0.0310 0.0000 0.0000 0.0000 0.0000
1018
0.0434 0.0383 0.0342 0.0325 0.0000 0.0000 0.0000 0.0000
1019
0.0356 0.0420 0.0358 0.0356 0.0000 0.0000 0.0000 0.0000
1020
0.0405 0.0290 0.0393 0.0180 0.0000 0.0000 0.0000 0.0000
1021
0.0424 0.0330 0.0231 0.0205 0.0000 0.0000 0.0000 0.0000
1022
0.0465 0.0345 0.0263 0.0214 0.0000 0.0000 0.0000 0.0000
1023
0.0715 0.0379 0.0275 0.0235 0.0000 0.0000 0.0000 0.0000
1024 All wrong 0.0765 0.0583 0.0302 0.0362 0.0000 0.0000 0.0000 0.0000
Results
Classroom/School level
Three schools were targeted for higher level cheating. Responses for items 1 through 10 were
altered from wrong to right in School 1 (number of students was 98). Not all 98 item responses
were changed but anyone whose response was wrong became right. In three classrooms in
School 1 nine students were identified for possible cheating. Responses for items 26 to 28 were
changed in School 2. There were 198 students in School 2. For this case, all wrong responses to
these three items were changed to right. The total number of students flagged for possible
cheating was 8 across 4 classrooms in this school. In School 3, responses to items 32 through 37

Detecting Unusual Patterns 17
were changed from wrong to right in a similar manner, which resulted in 6 unlikely student
responses across 3 classrooms. Here the total number of school level cheating for three schools
was 23.
Individual level
For individual level analyses item responses were changed throughout the student file. The final
students who were selected were neither in the same class nor school. Each individual student’s
item changes varied but were targeted to cover the entire test. The changed item scores ranged
from 0-8. From the final 50 students, 7 students’ item response patterns were flagged. Still there
were 809 students resulted in flags who we did not intentionally change the item responses.
The results demonstrate this item pattern probability method can detect person and group level
cheating. When teachers and administrators erase responses, it usually occurs in a block of same
items across classrooms and schools. So this type of cheating occurs in item level. But when
individual cheating occurs—whether they copied answers from the one sits next or he or she
knew some items before the test—this type of cheating occurs in person level. There are no same
sets of items to identify but the cheating items vary across individuals. The method in this paper
aimed to capture these two different types of cheating in item and person level. Pperm values
allow us to identify the individuals who are cheating whether they belong to group or not. This
means person level cheating can be detected using this method. To be able to indentify item level
cheating, we need to investigate each individual’s item response pattern of wrong and right. Item
response patterns need to be examined according to the person’ ability level how likely each item
was to be right and wrong. Then we may have a better idea about which item is suspicious.
Table 4 demonstrates school and individual level flags.

Detecting Unusual Patterns 18
Table 4
Flags in Group and Individual Levels per Score
Rawscore Total
N
Total
Flag
School1
Flag
School2
Flag
School3
Flag
Individual
Flags Non-Targeted Flags
8 28 0
0
9 69 13
13
10 55 14
14
11 106 27
1 26
12 181 69 1 1 2 1 64
13 304 112 4 1
107
14 180 55 2
53
15 302 109
1 2 106
16 360 83
2 1
80
17 373 69 1 1 1 1 65
18 301 41
1
40
19 563 28
28
20 360 28
28
21 468 42
1
1 40
22 439 55 1 1
1 52
23 574 13
13
24 340 0
0
25 544 12
1
10
26 371 14
14
27 437 14
14
28 450 0
0
29 439 0
0
30 493 0
0
31 363 0
0
32 333 0
0
33 425 0
0
34 359 0
0
35 274 0
0
36 205 0
0
37 192 27
27
38 42 0
0
39 42 14
1 13
40 28 0
0
Total 10000 839 9 8 6 7 809

Detecting Unusual Patterns 19
Discussion
It was anticipated that the proposed method flagged not only classroom/school level but also
individual level cheating successfully. However, there were many unintended flags in the results.
The criteria values from the permutations are mostly very small and the computed likelihoods of
each individual item response patterns are also very small too. The results were based on the
items used for item response pattern permutation were mostly overlapped with items used in
cheating. Depending on the level of overlap, the precision of the results may change. The power
of detecting the unusual item response patterns was diminished greatly by just one or two items’
probabilities. It was obvious that simply including parts of items from the test into the
permutations was not powerful enough to override the effect of unchanged item responses. For
those individuals which item responses changed but were not flagged, if few changed items are
overlapped with the items used for permutation, this proved to be problematic. We need to
research methods to improve precision in both situations.
Despite these issues, it is still anticipated that this method provides a fairly simple approach
which does not require unattainable assumptions. Premised on the idea that IRT models will
capture the measurement characteristics of a given students’ true ability and the achievement
results will respond to ability level, this method laid out the likelihood of getting different levels
of difficulty per individual ability level. The analyses were possible to carry out because most
large state testing programs have item parameter values, the data is large enough to run IRT
model, and there is a large enough number of individual students in the same theta level.
But in real settings, it is not known that what the typical probability of item response is in normal
situations. Although this study used 95 percent’s p-value as the criteria, in empirical setting, the
p-value that occurs most and can be distinguished from the rest of p-values of unusual item

Detecting Unusual Patterns 20
responses is not known. That needs to be compared and further investigated. This could help
deciding where we need to draw the flagging criteria.

Detecting Unusual Patterns 21
References
Angoff, W.H. (1974). The development of Statistical indices for detecting cheaters. Journal of
American Statistical Association, 69, 44-49.
Anikeef, A.M. (1954). Index of collaboration for test administrators. Journal of Applied
Psychology, 38, 174-177.
Bird, C. (1927). The detection of cheating on objective examinations. School and Society, 25
(635), 261-262.
Bird, C. (1929). An improved method of detecting cheating in objective examinations. Journal of
Educational Research, 19 (5), 341-348.
Cizek, G. J. (1999). Cheating on tests: how to do it, detect it, and prevent it. NJ: Lawrence
Erlbaum.
Dickenson, H. F. (1945). Identical errors and deception. Journal of Educational Research, 38,
534-542.
Frary, R. B., Tideman, T. N., & Watts, T. M. (1977). Indices of cheating on multiple-choice
tests. Journal of Educational Statistics, 6, 152-165.
Karabastos, G. (2003). Comparing the aberrant response detection performance of thirty-six
person-fit statistics. Applied Measurement in Education, 16, 277-298.
Levine, M. V., & Rubin, D. B. (1979). Measuring the appropriateness of multiple choice test
scores. Journal of Educational Statistics, 4, 269–290.
Meijer, R. R., & Sijtsma, K. (2001). Methodology review: Evaluating person fit. Applied
Psychological Measurement, 25, 107–135.
Saupe, J.L. (1960). An empirical model for the corroboration of suspected cheating on multiple-
choice tests. Educational and Psychological Measurement, 20, 475-489.
Tatsuoka, K. K. (1984). Caution indices based on item response theory. Psychometrika, 49, 95–
110.
Wright, B. D., & Stone, M. H. (1979). Best test design: Rasch measurement. Chicago: MESA
Press.