running head: ‘i play, therefore i learn?’...
TRANSCRIPT
Running head: ‘I PLAY, THEREFORE I LEARN?’ 1
‘I play, therefore I learn?’
Measuring the Evolution of Perceived Learning and Game Experience in the Design Flow of
a Serious Game
De Grove Frederik, Van Looy Jan, Cédric Courtois, De Marez Lieven
Research group for Media and ICT (IBBT-MICT)
Ghent University
Korte Meer 7-9-11
9000 Gent
Tel: +32 9 264 84 76
Email: [email protected], [email protected], [email protected],

‘I PLAY, THEREFORE I LEARN?’ 2
Abstract
This article explores how the serious game Poverty Is Not a Game (PING) is
experienced by high school students in its subsequent design stages. We first focus on the
multifaceted construct of game experience and how it is related to serious games. To measure
game experience we use the Game Experience Questionnaire and add a perceived learning
scale to account for the specificity of serious games in a classroom. Next, the data obtained
from testing PING in 22 classrooms are analyzed. Results suggest that the evolution in the
different design stages of the game is not just an issue of game experience, but also of
usability. Furthermore, little evidence is found indicating that the learning experience
changed positively during the different test phases. However, findings show a strong effect of
the game experience on perceived learning while the game experience also varies
significantly between different classrooms.

‘I PLAY, THEREFORE I LEARN?’ 3
’I play, therefore I learn?’Measuring the Evolution of Perceived Learning and Game
Experience in the Design Flow of a Serious Game
Although video games are mainly associated with entertainment, since their inception,
they have also been used as tools to educate, inform and train thus positioning themselves on
the intersection of fun and learning (Michael & Chen, 2006). This tendency to use video
games for other purposes than mere fun has, in the past decade, seen a steep rise in interest
from academics, developers and a broad range of organizations. Furthermore, the concept of
game experience has become a major topic of interest when it comes to commercial video
games. However, up to date, little research has been performed to explore how serious games
are experienced. Therefore, the primary aim of this study is to gain insight in the relation
between serious games and game experience. Moreover, as we had a video game at our
disposal that was still in development, we are not only interested in exploring how serious
games are experienced but also in how this experience evolves during subsequent design
stages.
The first part of this article gives an overview of the most important academic literature
on the topic of game experience and serious games used in a classroom context. The second
part discusses the research performed to assess the evolution of game experience in the design
flow of the serious game PING (Poverty Is Not A Game). This game aims to raise awareness
concerning poverty and was tested in 22 Western European high school classrooms populated
by students aged 14 to 16 years old, following a General or Technical education. As such we
hope to contribute to the ongoing efforts in the field of gaming research to explore how video
games are experienced.
‘I PLAY, THEREFORE I LEARN?’ 4
Game Experience
Although game experience has become an important concept in recent academic
research concerning video games (IJselsteijn, de Kort, Poels, Jurgelionis, Bellotti, 2007),
attempts to clearly define it are scarce. This can probably be attributed to the complex,
subjective and dynamic nature of the idea of experience (Buchenau & Suri, 2000). Ermi &
Mäyrä (2005) describe game experience as “an ensemble made up of the player’s sensations,
thoughts, feelings, actions and meaning-making in a gameplay setting”. This definition gives
us a notion of the concept by implying a relationship between game, gamer and context.
However, it also uncovers its problematic nature by referring to a variety of agent-dependent,
hence subjective processes making clear that “The experience of play comes in so many
forms that creating a single catalogue that takes all of them into account would be an
impossible task” (Salen & Zimmerman, 2004, p.314).
It could therefore be more interesting to approach game experience from a different
angle than an ontological one. By reframing the question as why the concept of game
experience has become a topic of interest for academic research, it can be narrowed down to a
workable proportion. As such, game experience is directly related to the motivational aspect
of gaming which is in turn connected to the question of what makes video games enjoyable
(see e.g. Vorderer, Hartmann & Klimmt, 2003; Sweetser & Wyeth, 2005; Shen, Wan &
Ritterfeld, 2009). In that respect, game experience can be considered as the underlying
mechanism that makes video games intrinsically motivating and fun.
The Central Role of Flow
A central construct exploring what makes activities enjoyable is that of flow or optimal
experience (Csíkszentmihályi, 1990). In the 1970s, Csikszentmihalyi started conducting
research on why people enjoyed activities such as rock climbing or library research (Salen &
Zimmerman, 2004). Since then, flow has been applied to a broad variety of activities in a

‘I PLAY, THEREFORE I LEARN?’ 5
diversity of research fields ranging from pedagogy (e.g. Shernoff, Csikszentmihalyi,
Schneider & Shernoff, 2003) to marketing (e.g. Hoffman & Novak, 1996). Flow itself can be
described as “an optimal, intrinsically motivating experience induced by an activity in which
one is fully absorbed” (Csíkszentmihályi, 1990). As such, the motivation to perform a certain
activity lies within the activity itself, namely the experience of flow. Playing video games can
thus be seen as an automotivational and enjoyable activity because it is able to induce a flow
state (IJsselsteijn et al., 2007). However, despite its frequent use, there is no conformity when
it comes to the conceptualization and operationalisation of flow, its antecedents and
consequences. In a literature review of 16 studies using flow, Hoffman, Novak and Yung
(1998) identified 12 different, often closely related concepts that have been used to explain
the flow concept: arousal, challenge, control, exploratory behavior, focused attention,
interactivity, optimum stimulation level, playfulness, positive affect, skill, telepresence and
time distortion. They further differentiate between those concepts by dividing them into 6
categories: background variables, content characteristics, primary and secondary antecedents,
flow correlates and flow consequences. Although considerable disaccord exists as to how to
conceptualize flow, it becomes clear that it concerns a complex network of interdependent
dimensions forming a multi-facetted construct that can be conceptualized by the relations
between those dimensions. Furthermore, it is remarkable how most of these dimensions can
and have been applied to video games; not in the least when researching enjoyment (e.g.
Järvinen, Heliö & Mäyrä, 2002; Sherry, 2004).
A Gameflow Model
Based on Csikszentmihalyi’s conceptualization of flow, Sweetser & Wyeth (2005)
constructed a Gameflow Model with eight correlating components: concentration, challenge,
skills, control, clear goals, feedback, immersion and social interaction. In comparison with
Csikszentmihalyi’s model, the Gameflow Model omits reference to ‘an activity’ since playing

‘I PLAY, THEREFORE I LEARN?’ 6
a game is an activity in itself and it adds the social interaction component pointing out that
social interaction might interfere with attaining a flow state but that it is also unmistakably a
factor that adds to the enjoyment of playing video games. As enjoyment in games in strongly
intertwined with aspects of usability (see e.g. Federoff, 2002), it is not unreasonable to
assume that improvements in the design of a video game will have their effect on the user
experience.
H1: The game experience will become significantly more positive over the three design
stages of PING.
State of the Art: The FUGA Game Experience Questionnaire
Although the Gameflow model has pointed out the importance of the flow concept in
relation to game experience, no actual operationalisation is proposed. This lack of
operationalising and measuring game experience while accounting for validity and reliability
has been around until a validated instrument to measure game experience was constructed
during the “Fun of Gaming” (FUGA) project (Poels, de Kort & IJsselsteijn, 2007). This Game
Experience Questionnaire (GEQ) is a self-report measure composed of three modules: a core
module, a social presence module and a post game module. The core module has seven
dimensions similar, but not identical, to the Gameflow model: Competence, Annoyance,
Negative Affect, Positive Affect, Flow, Immersion and Challenge. The post game module
consists of Positive Experience, Negative Experience, Tiredness and Returning to Reality
while the social presence module is composed of Empathy, Negative Affect and Behavioral
Involvement. The GEQ was used as a basis for our research (cf. infra).
Serious Games and Experience
When exploring how serious games can be described, we discern two complementary
approaches. A first one focuses on the purposes of serious games (e.g. for education) while
the second one positions them in relation to other concepts such as e-learning or digital game-

‘I PLAY, THEREFORE I LEARN?’ 7
based learning. We will not elaborate on these definitional issues and we describe serious
games as video games that are being used with the intention to learn. Learning pertains to a
variety of types of content such as educational, governmental, military, corporate, healthcare,
political, religious and art.
The key question regarding serious games is how they can be integrated in the game
experience construct. On the one hand our central assumption is that fun is at the core of the
game experience while on the other hand the core characteristic of serious games is that their
primary aim is anything but entertainment (Susi, Johannesson & Backlund 2007). At first
glance, this might look contradictory. However, looking at why video games are used to
educate, persuade, train or inform will make things clear.
Without fail, one of the strengths of serious games is seen in their automotivational
capabilities (see e.g. Garris, Ahlers & Driskell, 2002; O’Neil, Wainess & Baker, 2005;
Pereira & Roque, 2009; Squire, 2005; Michael & Chen, 2006). Video games are intrinsically
motivating because they are enjoyable and it is this trait that is used as a lever to facilitate
learning (Chuang & Chen, 2009). Authors like Gee (2003) and Prensky (2001) argue that the
motivational nature of video games combined with educational content will make learning
more effective. As a consequence, enjoyment becomes a prerequisite for success, c.q.
learning. Since motivation is directly linked to the idea of flow it would not be unreasonable
to assume that learning could be conceptualized as an effect of flow. This is confirmed by a
review of academic literature in which learning has been linked to flow in the capacity of
increased learning. This holds true for the broader academic field concerned with learning
(see e.g. Webster, Trevino & Ryan, 1993) and for the field of gaming research. For example,
Kiili (2005) used the flow construct as a framework to build an experiential gaming model in
which positive user experiences are conceptualized as a sine qua non to enhance the impact
of educational games.

‘I PLAY, THEREFORE I LEARN?’ 8
As we are mainly interested in the learning experience and not in learning per se, we
will be using the concept of perceived learning which refers to a self-reported learning
experience. Thus two more hypotheses can be formulated.
H2: Perceived learning will rise significantly over the three design stages of PING.
H3: There is a positive effect of the game experience on perceived learning.
Furthermore, the context in which video games are played can influence the game
experience (see e.g. Squire, 2005; Van Eck, 2006; De Castell & Jenson, 2003; Sisler, Brom &
Slavik, 2008a; Sisler & Brom, 2008b; Tuzun, 2007; Ulicsak, Facer, Sandford, 2007, Michael
& Chen, 2006). During our tests in different classrooms, we noticed that contextual factors
strongly differed between classrooms in terms of social interaction, infrastructure and IT and
educational support. Since contextual factors were not included in the original research design
(cf. infra), we are limited to formulating a general hypothesis.
H4: The game experience will differ significantly across classrooms.
Measuring Perceived Learning
To measure perceived learning in video games, we will first turn to literature on
gaming. Fu, Su and Yu (2009) adapted and operationalised the Gameflow Model of Sweetser
& Wyeth to the specificity of what they call e-learning games. Although useful at first sight,
the concept of Knowledge Improvement introduced by Yu et al. (2009) does not cover the
whole construct of learning which is typically seen as having a cognitive, an affective and a
psychomotor component (cf. infra). Since PING has an important affective component, this
narrow interpretation of learning makes the scale unsuitable for our purposes.
As this scale is to our knowledge the only attempt in gaming literature to operationalise
the experience of learning in video games, we looked at how (perceived) learning has been
operationalised in the broader academic field of education. In 2008, Rovai, Wighting, Baker

‘I PLAY, THEREFORE I LEARN?’ 9
and Grooms developed and validated a scale, based on the taxonomy of Bloom, to measure
perceived learning in higher education classrooms. The central assumption of Bloom’s
taxonomy is that there are different domains of learning: cognitive, affective, and
psychomotor. Cognitive learning refers to the more traditional idea of learning and covers
absorbing and reproducing knowledge and developing skills and intellectual capabilities
(Rovai, 2002). In contrast to the cognitive domain, the affective domain addresses “interests,
opinions, emotions, attitudes, and values” (Rovai et al., 2008, p.3). The psychomotor domain
covers learning through physical activities to effectively perform manual tasks. It goes
without saying that the cognitive and the affective domain are of particular interest in the case
of PING. However, when looking at the nine-item scale of Rovai et al. (2008), it becomes
clear that it cannot be used for our purposes. The main reason is the strong emphasis on
learning through a course structured system which conflicts with the nature of most video
games (De Castell & Jenson, 2003).
A further review of scholarship on the topic of perceived learning resulted in similar
problems. The instruments found were too specific, too global or too narrow (see Richmond,
McCroskey, Kearny & Plax, 1987; Wu & Hiltz, 2003; Caspi & Blau, 2008; Glass & Sue,
2008; Russo & Benson, 2005; Alavi, 1994; McCroskey, 1994; Richardson & Swan, 2003;
Frick, Chadha, Watson, Wang & Green, 2007; Kember & Leung, 2009) to suit the specificity
of video games. It was therefore decided to develop our own perceived learning scale. As a
starting point, we used the cognitive and affective domains discussed above. However, as we
are using an untraditional medium for learning, we wanted our perceived learning scale to
take this into account. Support for this decision was found in Kirkpatrick’s (1998) key work
in which he proposes a model of four levels to evaluate training programs. The first level is
named Reaction and pertains to how participants react affectively to a certain training
program. If the reaction is positive, success on the second level is possible whereas a negative

‘I PLAY, THEREFORE I LEARN?’ 10
reaction will inhibit success. The second level is defined as Learning and implies the
measuring of the affective and cognitive domains (O’Neil et al., 2005). The following levels,
Behavior and Results concern learning assessment outside the direct learning context on a
personal and a company level. It goes without saying that the first two levels can be used as a
framework for our specific needs.
To construct a perceived learning scale we kept the first two levels of Kirkpatrick in
mind. Moreover, we incorporated the affective and cognitive domain of Bloom by using the
operationalisation of the scale of Rovai et al. (2008) as a guideline. The constructed scale is
formed by two dimensions. A first dimension (Affective Gaming) questions the attitude
towards receiving education through a video game. The second dimension (Learning) pertains
to the affective and cognitive domain in relation to perceived learning.
Method and Procedure
Method
To measure game experience, an online survey was used. It consisted of the GEQ, the
perceived learning scale and several questions inquiring about socio-demographic and gaming
parameters. Both the GEQ and the perceived learning scale were presented as five-point
Likert scale items: Not at all, Slightly, Moderately, Fairly and Extremely. Regarding the
gaming behavior of the respondent we asked how frequent one played (6 choices ranging
from never to daily). Socio-demographic parameters covered Gender, Age and Educational
Level.
The Game
PING (Poverty Is Not A Game) was commissioned by the King Baudouin Foundation
and is part of one of the initiatives surrounding the European Year for Combating Poverty and
Social Exclusion (2010). Its primary aim is to raise consciousness in adolescents concerning
poverty and social exclusion in a way that is close to their own daily lives.

‘I PLAY, THEREFORE I LEARN?’ 11
The game takes place in a three dimensional environment which represents an average
Western European city. Players can choose between a male or female avatar. Although the
decision to play with a certain avatar has an impact on the storyline, the central message the
game wishes to convey stays the same. It hopes to raise consciousness about the mechanisms
underlying poverty and is specifically aimed at what is sometimes referred to as the fourth
world.
Population and Sampling
As PING has been specifically developed for use in a classroom, the obvious
consequence is that it needed to be tested in the classroom as well. For the sake of uniformity
it was tested in third and fourth grade classes only (age: 14-16 years). Furthermore,
participation was limited to General and Technical educational levels. Our population thus
consists of all third and fourth grade students attending a General or Technical class in a
school certified by the Flemish Government.
Sampling was performed on the basis of a database of schools listed on the website of
the Flemish Ministry of Education (http://onderwijs.vlaanderen.be/) and on the basis of a
database of schools provided by the King Baudouin Foundation. Schools were picked out at
random and were sent an e-mail asking for their cooperation. Schools that did not respond
were contacted by telephone.
Procedure
The general procedure was the same for all test phases and for all classes. The teacher in
charge of the class was asked to give a brief introduction about the video game and about the
subject matter (poverty). After this introduction, students could start playing. Due to the
status of the game, during the Alpha phase, students were allowed to play for approximately
25 minutes while students were allowed to play for 50 minutes during the Beta and Release
Candidate phases. After playing, students were asked to fill out an online survey.

‘I PLAY, THEREFORE I LEARN?’ 12
Results
Instrument Adjustment
As we used the GEQ in an atypical context (a video game in a pre-launch status in a
classroom setting), we first checked, using confirmatory factor analysis, if satisfactory results
emerged concerning factor structure and convergent and divergent validity. Goodness of fit
indices for the core module (N=330, χ2/df = 2.86, CFI = .78, TLI = .75, RMSEA = .075, CI90
= .071, .080), the social presence module (N=330, χ2/df = 3.68, CFI = .84, TLI = .81, RMSEA
= .090, CI90 = .081, .099) and the post game module (N=330, χ2/df = 4.44, CFI = .84, TLI =
.81, RMSEA = .102, CI90 = .093, .111) did not yield acceptable results. It was therefore
decided to adapt the GEQ and to add our own perceived learning scale. This eventually
resulted in a model in which game experience is conceptualized as a second order construct
with eight dimensions: Affective Gaming, (Perceived) Learning, Vividness, Competence,
Immersion, Challenge, Negative Affect and Positive Affect. Due to the fact that the social
presence module was not deemed fit to be used in a classroom context, it was omitted. For the
post game module, we retained three dimensions: Positive Experience, Negative Experience
and Returning to Reality. This Serious Game Experience model yielded an acceptable fit
(N=330, χ2/df = 1.84, CFI = .93, TLI = .92, RMSEA = .050, CI90 = .045, .056) and is shown
in Figure 1. This model shows that Vividness (.94), Positive Affect (.93), and Immersion
(.76) are strong predictors for Game Experience while Competence (.37) and Affective
Gaming (.42) are moderate predictors. The fact that Learning has a standardized regression
weight of .50 confirms our hypothesis that there is a positive effect of the game experience on
perceived learning (H3). Remarkable is the fact that Game Experience has no effect
whatsoever on Challenge (.01). As for Post Game Experience, Returning to Reality (.97),
Positive Effect (.65) and Negative Effect (.74) are strong predictors.

‘I PLAY, THEREFORE I LEARN?’ 13
Finally, by connecting the error terms of Affective Gaming and Learning, of
Competence and Challenge and of Negative Affect and Positive Affect, we wanted to
examine if those constructs shared variance that was not explained by the Game Experience
construct. The rationale behind this was that it could be expected, on theoretical grounds, that
those constructs share other common causes for their variation. This was confirmed for
Competence and Challenge (-.57), Affective Gaming and Learning (.36) and for Positive
Affect and Negative Affect (-.63).

‘I PLAY, THEREFORE I LEARN?’ 14
,89
Vividness
,55
Q4.18e3,74
,56
Q2.28e4 ,75
,43
Q2.27e5
,65
,14
Competence
,64
Q3.13e8 ,80
,62
Q2.25e9,79
,29
Negative Affect,64
Q2.1e10
,80
,78
Q2.11e11,88
,87
Positive Affect,74
Q3.27e13
,86
,74
Q3.26e14,86
,57
Immersion,43
Q4.23e16,66
,71
Q3.29e17 ,85
,00
Challenge,25
Q2.16e18,50
,79
Q4.7e19 ,89
Game Experience
,37
,94
-,54
,93
,76
,01
Post Game Experience
,43
Positive Exp.
,45
Q7.10 e20,67,62
Q7.16 e21,79
,67
Q7.14 e22
,82
,55
Negative Exp.
,75
Q7.17 e23,86,61
Q7.18 e24,78
,44
Q7.11 e25
,66
,94
Returning to R.
,64
Q7.19 e26,80,56
Q7.21 e27,75
,65
,74
,97
e28
e29
e30
e31
e32
e33
e34
e35
e36
,49
Q2.3e38
,70
,24
Learning
,41
Q6.8e39
,64,64
Q8.4e40
,80
,46
Q8.7e41
,68
,57
Q8.2e42,75
,70
Q8.5e43 ,84
,37
Q6.1e44
,61
,57
Q8.6e45
,76
,18
Affective Gaming,55
Q8.3e46,74
,99
Q8.1e47 ,99
,49
e48
,42
e49
,22
-,57
-,63
,36
Figure 1: Serious Game Experience Model

‘I PLAY, THEREFORE I LEARN?’ 15
Sample Description
Testing took place from October 2009 to May 2010. In total, 50 schools were contacted
of which 14 agreed to cooperate. This resulted in a total of 22 classrooms in which PING was
tested. The mean age of our participants was 15 years (N = 318, S.D. = .9). As shown in
Figure 2, 205 respondents were female while 122 were male. More than half (N = 202)
followed General education while 138 attended Technical education (Figure 3).
205
122
0
50
100
150
200
250
female male
Figure 2: Gender
202
138
0
50
100
150
200
250
General Technical
Figure 3: Level of Education
When asked about their gaming behavior, about half of the respondents (56%) indicated
that they game at least once a month while 19% games on a daily basis. Less than half (44%)
only seldom or never play video games.

‘I PLAY, THEREFORE I LEARN?’ 16
46
65
3540
79
64
0
10
20
30
40
50
60
70
80
90
Never Almost
never
A few times
a year
Each month Each week Daily
Figure 4: Frequency of gaming
As we tested PING in its three different design stages (Alpha, Beta, Release Candidate),
it is essential to have a look at how parameters such as Educational Level, Gender and
Frequency of Gaming are represented in those different stages. Figure 5 through Figure 7
show that there are some unbalanced distributions. At first sight, males are underrepresented
during Alpha en Beta testing. A χ2 test showed that the differences in Gender were significant
(p < .001). The same holds true for Educational Level (p < .000), which has a highly
unbalanced distribution in the Beta stage.
65
64
76
30
22
70
0
10
20
30
40
50
60
70
80
Alpha Beta RC
female
male
Figure 5: Comparison between design stages: gender

‘I PLAY, THEREFORE I LEARN?’ 17
46
7
85
54
86
62
0
10
20
30
40
50
60
70
80
90
100
Alpha Beta RC
TSO
ASO
Figure 6: Comparison between design stages: educational level
To explore the differences in frequency of gaming, we used a Kruskal-Wallis test. No
significant differences were found between the three design stages (p > .05).
1921
15
24
33 33
0
5
10
15
20
25
30
35
Never Almost
never
A few
times a
year
Each
month
Each week Daily
Alpha
Beta
RC
Figure 7: Comparison between design stages: frequency of gaming
Design Stage Description
No detailed accounts exist concerning what has been changed over the different design
stages of PING. An informal conversation with the game developers revealed that changes
primarily pertained to the story of the game and to the navigation in the game. The Alpha
stage only consisted of a rudimentary storyline while orientation in the 3D game world was a
challenge as no maps were readily available. In comparison, the Release Candidate (RC)
provided a fully developed story which could be finished in about 50 minutes. Navigation

‘I PLAY, THEREFORE I LEARN?’ 18
was facilitated by a mini-map with GPS functionality. Similar in all design stages is the fact
that PING had no sounds or music.
A major difference between the RC stage and the previous stages concerns the channel
in which the game was presented. In the first two stages, the game could be played online.
However, as the Beta version of the game became more dependent on the performance of IT
networks, some difficulties emerged since not all schools had an adequate infrastructure. This
resulted in strongly reduced playability. To cope with this problem, it was decided to use a
CD-rom version of the game during the RC stage.
Global Results
Figure 8 shows the mean results regarding the game experience of PING. Overall,
scores are positive. Affective Gaming (M = 4.0, SD = 1.17) has the highest mean score which
implies that receiving education through a game is experienced positively. This is followed by
a mean of 3.18 (S.D. = 1.00) for Positive Affect while Negative Affect only scores 1.98 (S.D.
= .95). A mean of 3.03 (S.D. = 1.2) shows that most students felt competent playing the game
which is confirmed by a low score for Challenge (M = 1.9, S.D. =.93). Vividness (M = 2.7,
S.D. = 1.00) and Immersion (M = 2.5, S.D. = 1.10) score moderately. It is interesting to see
that (Perceived) Learning has a score of 2.94 (S.D. =.81), indicating that on average, students
thought this to be a positive educational experience.
In contrast to the game experience during gameplay, the post game experience
dimensions all have low scores. The reason that Returning to Reality only scores 1.45 (S.D. =
.78) can probably be attributed to the fact that PING was played in a classroom context which
does not support the induction of a flow state. The low score on Negative Experience (M =
1.2, S.D. =.56) is in sync with that of Negative Affect while the low score on Positive

‘I PLAY, THEREFORE I LEARN?’ 19
Experience (M = 1.7, S.D. = .93) can probably be explained by the fact that the items
composing this scale all referred to strong emotions.
3,03
2,662,54
1,90 1,89
3,18
3,99
2,94
1,72
1,231,45
0
1
2
3
4
5
Figure 8: Serious Game Experience of PING - means.
Caution is advised when judgments are to be generalized to our whole population.
Figure 9 and Table 1 show all dimensions and their confidence intervals (.95). Findings
discussed are to be treated with this information in mind.
0
1
2
3
4
5
Figure 9: Serious Game Experience of PING – confidence intervals.

‘I PLAY, THEREFORE I LEARN?’ 20
CI95 Low Mean CI95 High
Competence 2.91 3.03 3.16
Vividness 2.55 2.66 2.77
Immersion 2.42 2.54 2.65
Challenge 1.80 1.90 2.00
NegativeAffect 1.79 1.89 1.99
PositiveAffect 3.07 3.18 3.29
AffectiveGaming 3.87 3.99 4.12
Learning 2.85 2.94 3.02
PositiveExperience 1.62 1.72 1.82
NegativeExperience 1.17 1.23 1.29
ReturningToReality 1.37 1.45 1.54
Table 1: Mean scores - confidence intervals
Comparing the Three Design Stages
To compare how the different dimensions behaved during subsequent design stages, we
analyzed the variance within groups and between groups (ANOVA). First, however, we
performed a power analysis using the tool GPower3.1. Power can be described as the
“probability of correctly rejecting the null hypothesis when it is false” (Hair et al., p2). In
other words: the probability of finding existing differences. A power above .80 can be
considered as acceptable. When using an effect size of .25 (meaning we will be able to
effectively spot large and medium effects) we achieved a power of .99 which is good. Yet,
with our current sample size we will not be able to spot smaller differences (effect size .10) as
power is then reduced to .36.
‘I PLAY, THEREFORE I LEARN?’ 21
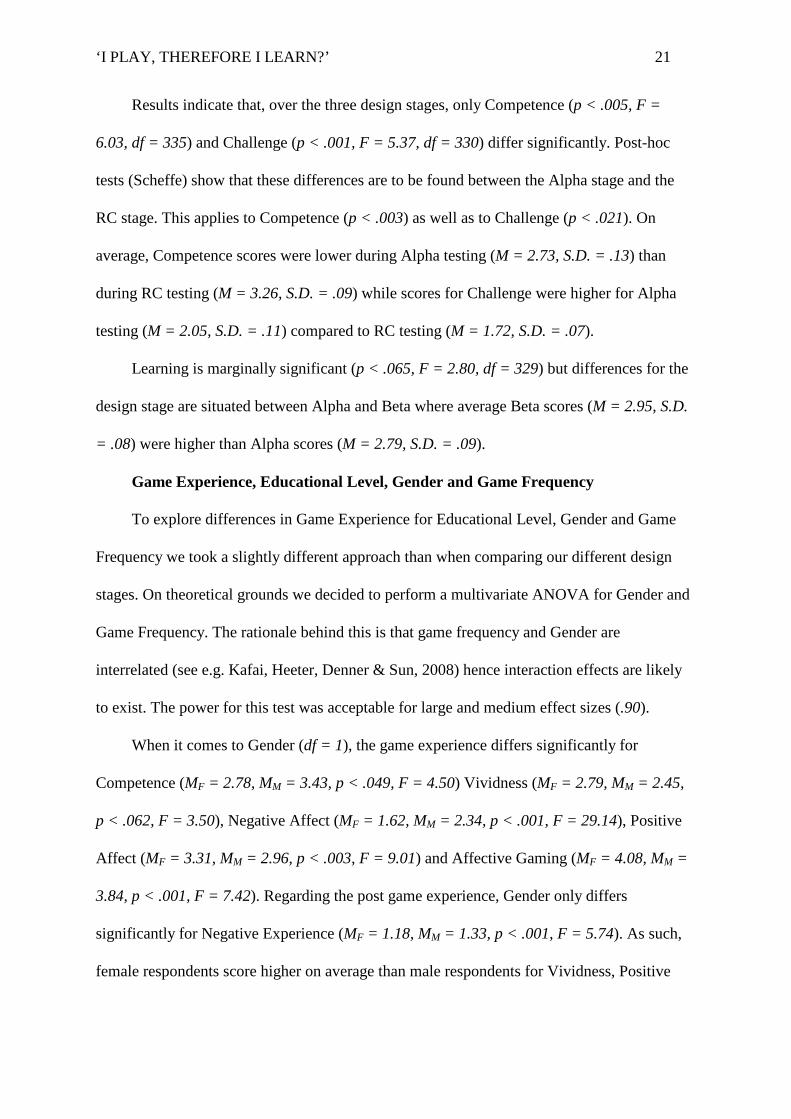
Results indicate that, over the three design stages, only Competence (p < .005, F =
6.03, df = 335) and Challenge (p < .001, F = 5.37, df = 330) differ significantly. Post-hoc
tests (Scheffe) show that these differences are to be found between the Alpha stage and the
RC stage. This applies to Competence (p < .003) as well as to Challenge (p < .021). On
average, Competence scores were lower during Alpha testing (M = 2.73, S.D. = .13) than
during RC testing (M = 3.26, S.D. = .09) while scores for Challenge were higher for Alpha
testing (M = 2.05, S.D. = .11) compared to RC testing (M = 1.72, S.D. = .07).
Learning is marginally significant (p < .065, F = 2.80, df = 329) but differences for the
design stage are situated between Alpha and Beta where average Beta scores (M = 2.95, S.D.
= .08) were higher than Alpha scores (M = 2.79, S.D. = .09).
Game Experience, Educational Level, Gender and Game Frequency
To explore differences in Game Experience for Educational Level, Gender and Game
Frequency we took a slightly different approach than when comparing our different design
stages. On theoretical grounds we decided to perform a multivariate ANOVA for Gender and
Game Frequency. The rationale behind this is that game frequency and Gender are
interrelated (see e.g. Kafai, Heeter, Denner & Sun, 2008) hence interaction effects are likely
to exist. The power for this test was acceptable for large and medium effect sizes (.90).
When it comes to Gender (df = 1), the game experience differs significantly for
Competence (MF = 2.78, MM = 3.43, p < .049, F = 4.50) Vividness (MF = 2.79, MM = 2.45,
p < .062, F = 3.50), Negative Affect (MF = 1.62, MM = 2.34, p < .001, F = 29.14), Positive
Affect (MF = 3.31, MM = 2.96, p < .003, F = 9.01) and Affective Gaming (MF = 4.08, MM =
3.84, p < .001, F = 7.42). Regarding the post game experience, Gender only differs
significantly for Negative Experience (MF = 1.18, MM = 1.33, p < .001, F = 5.74). As such,
female respondents score higher on average than male respondents for Vividness, Positive

‘I PLAY, THEREFORE I LEARN?’ 22
Affect and Affective Gaming but lower on Competence, Negative Affect and Negative
Experience.
When looking at how Game Frequency (df = 5) influences the game experience we see
that Competence (p < .006, F = 3.37), Positive Affect (p < .030, F = 2.46) and Affective
Gaming (p < .006, F = 3.36) differ significantly.
Finally, there is an interaction effect between Gender and Game Frequency for
Vividness (p < .011, F = 3.02, df = 5) which means that the effect of Gender on Vividness is
also dependent on how frequently the respondent games. More specifically, the score on
Vividness for a male gamer is not dependent on how frequently he games whereas this score
is negatively influenced if the respondent is female and indicates to game ‘never’, ‘a few
times a year’ or ‘each month’.
To assess the effect of Educational Level on the game experience we performed an
Independent Samples t-test. Only Positive Affect (MT = 3.02, MG = 3.29, p < .021, F =
10.79, df = 252), Affective Gaming (MT = 3.80, MG = 4.11, p < .027, F = 6.39, df = 252) and
Positive Experience (MT = 1.86, MG = 1.63, p < .038, F = 6.83, df = 250) differed
significantly. Thus respondents following a General education were on average slightly more
positive during gameplay and scored higher on the attitude towards learning by gaming than
respondents from a Technical educational level. Remarkable is the fact that the post game
Positive Experience was on average more positive for those following Technical education
than for those following General education classes.
Game Experience in a Classroom Context
In total, we tested PING in 22 different classrooms. To check if our sample size was big
enough to execute an ANOVA with 22 groups, we performed a power analysis. With a power
of .77 our data will only be capable to reliably detect large or, to a lesser degree, medium
differences.

‘I PLAY, THEREFORE I LEARN?’ 23
Notwithstanding our relatively low power, Table 2 shows a considerable amount of
dimensions that prove to differ significantly between classrooms (H4). Only Immersion,
Positive Experience and Returning to Reality do not differ. Regrettably, we did not have
enough data at our disposal to identify differences between individual classrooms.
Furthermore, classroom is a level 2 unit. By using an ANOVA we do not know whether the
differences we found are related to the different compositions of the classrooms (e.g. more
females in some classrooms) or if they were caused by level 2 variables (e.g. a positive group
atmosphere).
Dimension Sig. F df
Competence*** .001 2.317 335
Vividness*** .012 1.880 330
Immersion .264 1.183 330
Challenge*** .020 1.784 330
NegativeAffect*** .000 3.428 338
PositiveAffect*** .000 2.684 335
AffectiveGaming*** .002 2.234 329
Learning*** .011 1.900 329
PositiveExperience .398 1.054 329
NegativeExperience*** .000 2.642 329
ReturningToReality .428 1.029 329
Table 2: one-way ANOVA - Classroom

‘I PLAY, THEREFORE I LEARN?’ 24
Conclusion/Discussion
The testing of PING yielded some interesting results. A first remarkable outcome is the
fact that there is a strong effect of the game experience on perceived learning which confirms
that a positive, enjoyable game experience contributes to the experience of perceived learning
(H3).
When it comes to the game experience and the different design stages, only Competence
and Challenge differ significantly between the Alpha and RC stage. When we add the fact
that, first of all, variation in Challenge was not explained by the game experience but shared
unexplained variation with Competence (-.57, Figure 1), and secondly, that one of the two
major changes during the design stages pertains to the usability of the game (navigation),
some interesting assumptions can be made. On theoretical grounds, both Competence and
Challenge can be connected to usability issues. Usability can be considered as a prerequisite
for a good game experience but it is not equal to it. As such, it is possible that Challenge (or
the way it was operationalised) is actually a measure of usability. This would explain why it
failed to fit in our game experience construct. Furthermore, this could also explain some of
the error variance of Competence. As such, we did not find a significant positive change in
the game experience during the different design stages (H1) but we did find a significant
change in the experienced usability of PING.
Although there is a positive effect of the game experience on Learning, the change is
only marginally significant between the Alpha and Beta stages of the game. This significance
is probably due, however, to the fact that the Beta stage had some atypical distributions.
When performing a multivariate ANOVA by adding Gender or Educational Level, the
difference in Learning ceases to be (marginally) significant. The fact that perceived learning
does not change positively during the subsequent design stages (H2) is surprising. Especially
because the storyline expanded significantly during the different design stages. Furthermore,

‘I PLAY, THEREFORE I LEARN?’ 25
students were allowed to play the Beta and RC versions longer than the Alpha version which
could have resulted in a better learning experience. On the other hand, this finding is not
illogical if we look at our serious game experience model (Figure 1). As most of the
dimensions do not vary across different design stages, it is reasonable that learning does not
vary either. More specifically, if the storyline would have changed enough, this would have
been reflected in the concept of Vividness. Consequently the experience of perceived learning
would have changed too. This indicates that the changes in the subsequent design stages of
PING were not large enough to evoke a better learning experience.
Another interesting finding pertains to Gender. Although video games are still mostly
seen as a pastime for males (which was also confirmed by our data), female students
responded more positively to PING than male respondents, despite the fact that they reported
to feel less competent than their male counterparts. This can probably be explained by the fact
that it concerns an educational game. During testing, male students regularly asked if they
could steal a car or find some weapons. This was not observed in female students. In contrast,
female students were more interested in the storyline which could in turn explain why they
score significantly (marginally) higher on Vividness than male students.
Finally, it is interesting to see that there seem to exist strong differences between
classrooms on most of the game experience dimensions (H4). Perhaps the most remarkable
result is that, when gaming, only Immersion does not differ significantly between classrooms.
A possible explanation could be that social interaction during gameplay prevents Immersion
to go above a certain level while the absence of sounds or music could have been a decisive
factor in stimulating social interaction. Equally intriguing is the fact that constructs such as
Competence, Vividness, Challenge and Learning seem to have a collective component. With
our current dataset, however, we cannot explore this further.

‘I PLAY, THEREFORE I LEARN?’ 26
Several suggestions can be made regarding future research on the serious game
experience in a classroom setting. Considering the pre-launch status of the game, an
interesting starting point could be to use an experience measure in combination with a
validated usability measure. That way, improvements in usability can be linked to game
experience. Furthermore, to explain why the perceived learning experience did not differ, it
could be considered to use focus groups or to use an experimental design in which the
content-related variable is manipulated. Finally, as contextual factors proved to be a major
point of interest, future research could benefit considerably if this were to be included. Be it
in a quantitative way in a serious game experience model or in a qualitative, ethnographic
way. At the very least, social interactions in the classroom should be accounted for.

‘I PLAY, THEREFORE I LEARN?’ 27
References
Alavi, M. (1994). Computer-Mediated Collaborative Learning: An Empirical Evaluation. MIS
Quarterly, 18(2), 159-174.
Billiet, J., Waege, H. (2005). Een Samenleving Onderzocht. Methoden van sociaal-
wetenschappelijk onderzoek. Uitgeverij De Boeck nv.: Antwerpen.
Blunch, N.J. (2008). Introduction to Structural Equation Modelling using SPSS and AMOS.
Sage Publications Ltd.: London.
Brockmyer, J.H., Fox, C.M., Curtiss, K.A., McBroom, E., Burkhart, K.M., Pidruzny, J.N.
(2009). The Development of the Game Engagement Questionnaire: A measure of
engagement in video game-playing. Journal of Experimental Social Psychology, 45,
624-634.
Buchenau, M. ,Suri, J. F. (2000). Experience prototyping. In Proceedings of the 3rd
Conference on Designing interactive Systems: Processes, Practices, Methods, and
Techniques. New York, USA, August 17 - 19, 2000.
Caspi, A., Blau, I. (2008). Social presence in online discussion groups: testing three
conceptions and their relations to perceived learning. Social Psychology of Education,
11, 323–346.
Choi, D.H., Kim, J., Kim, S.H. (2007). ERP Training With a Web-Based Electronic Learning
System: The Flow Theory Perspective. International Journal of Human-Computer
Studies, 65, 223–43.
Csíkszentmihályi, M. (1990). Flow: The psychology of optimal experience. Harper & Row:
New York.
Chuang, T.Y., Chen, W.F. (2009). Effect of Computer-Based Video Games on Children: An
Experimental Study. Educational Technology & Society, 12 (2), 1–10.
De Castell, S., Jenson, J. (2003). Serious Play. Journal of Cirriculum Studies, 35(6), 649-665.

‘I PLAY, THEREFORE I LEARN?’ 28
Federoff, M.A., (2002). Heuristics and Usability Guidelines for the Creation and Evaluation
of Fun in Video Games. Master Thesis. Retrieved the 24th of April 2010 from
http://melissafederoff.com/heuristics_usability_games.html
Frick, T.W., Chadha, R., Watson, C., Wang, Y., Green, P. (2009). College student
perceptions of teaching and learning quality. Educational Technology Research and
Development, 57(5), 705-720.
Fu, F-L., Su, R-C., Yu, S-C. (2009). EGameflow: A scale to measure learners’ enjoyment of
e-learning games. Computers & Education, 52, 101-112.
Garris, R., Ahlers, R., Driskell, J.E. (2002). Games, motivation, and learning: A research and
practice model. Simulation & Gaming, 33(4), 441-467.
Gee, J. P. (2003). What video games have to teach us about learning and literacy. New York:
Palgrave Macmillian.
Glass, J., Sue, V. (2008). Student Preferences, Satisfaction, and Perceived Learning in an
Online Mathematics Class. MERLOT Journal of Online Learning and Teaching,(4)3,
325-338.
Hair, J.F., Black, W.C., Babin, B.J., Anderson, R.E., Tatham, R.L. (2006). Multivariate Data
Analysis (6th ed). Pearson Prentice Hall: New Jersey.
Hoffman, D. L., Novak, T.P. (1996). Marketing in Hypermedia Computer-Mediated
Environments: Conceptual Foundations, Journal of Marketing, 60, 50-68.
Hoffman, D. L., Novak, T.P., Yung, Y.F. (1998), Measuring the Customer Experience in
Online Environments: A Structural Modeling Approach. Working paper. Retrieved the
5th of April 2010 from
http://citeseerx.ist.psu.edu/viewdoc/download?doi=10.1.1.87.7233&rep=rep1&type=pd
f

‘I PLAY, THEREFORE I LEARN?’ 29
IJsselsteijn, W. A., Nap, H. H., de Kort, Y. A. W., Poels, K., Jurgelionis, A., & Bellotti, F.
(2007). Characterizing and Measuring User Experiences in Digital Games. ACE
Conference 2007, Salzburg, Austria.
Järvinen, A., Heliö, S., Mäyrä, F. (2002). Communication and Community in Digital
Entertainment Services. Prestudy Research Report. Retrieved the 4th of February 2010
from http://tampub.uta.fi/tup/951-44-5432-4.pdf.
Kafai, Y.B., Heeter, C., Denner, J., Sun, J.Y. (2008). Beyond Barbie and Mortal Kombat:
New Perspectives on Gender and Gaming. The MIT Press.
Kember, D., Leung, D.Y.P. (2009). Development of a questionnaire for assessing students’
perceptions of the teaching and learning environment and its use in quality assurance.
Learning Environments Research, 12(1), 15-29.
Kiili, K. (2005). Digital game-based learning: Towards an experiential gaming model.
Internet and Higher Education, 8, 13-24.
Kirkpatrick, J.D. (1998). Evaluating Training Programs. The four levels. San Fransisco, CA:
Berrett-Koehler Publishers.
Kline, R. B. (1998). Principles and Practice Of Structural Equation Modeling. New York:
Guilford Press.
Koufaris, M (2002). Applying the Technology Acceptance Model and Flow Theory to Online
Consumer Behavior. Information Systems Research, 13, 205–23.
McCroskey, J. C. (1994). Assessment of affect toward communication and affect toward
instruction in communication. In S Morreale & M. Brooks (Eds.), SCA summer
conference proceedings and prepared remarks: Assessing college student competence
in speech communication. Annandale, VA: Speech Communication Association.

‘I PLAY, THEREFORE I LEARN?’ 30
McCroskey, J. C., Sallinen, A., Fayer, J. M., Richmond, V. P., Barraclough, R. A. (1996).
Nonverbal immediacy and cognitive learning: A cross-cultural investigation.
Communication Education, 45(3), 200-211.
Michael, D. & Chen, S. (2006). Serious games: Games that educate, train, and inform.
Boston, MA.: Thomson Course Technology.
O’Neil, H.F., Wainess, R., Baker, E.L. (2005). Classification of learning outcomes: evidence
from the computer games literature. The Curriculum Journal, 16(4), 455 – 474.
Pereira, L.L., Roque, L.G. (2009). Design Guidelines for Learning Games: the Living Forest
Game Design Case. In Proceedings of DiGRA 2009. Breaking New Ground: Innovation
in Games, Play, Practice and Theory. Brunel University, West London, United
Kingdom.
Peter, J.P. (1981). Construct Validity: A Review of Basic Issues and Marketing Practices.
Journal of Marketing Research, 18(2), 133-145.
Poels, K., de Kort, Y., Ijsselsteijn, W. (2007). "It is always a lot of fun!": exploring
dimensions of digital game experience using focus group methodology. In international
conference on Future Play, ACM press, pp.83-89.
Prensky, M. (2001). Digital game-based learning. New York: McGraw-Hill.
Richardson, J.C., Swan, K.S. (2003). Examining social presence in online courses in relation
to students’ perceived learning and satisfaction. JALN, 7(1), 68-88.
Richmond, V.P., McCroskey, J.C., Kearny, P., & Plax, T.G. (1987). Power in the classroom
VII: Linking behavior alteration techniques to cognitive learning. Communication
Education, 36, 141-153.
Rovai, A.P. (2002). Sense of community, perceived cognitive learning, and persistence in
asynchronous learning networks. Internet and Higher Education, 5, 319–332.

‘I PLAY, THEREFORE I LEARN?’ 31
Rovai, A.P., Wighting , M.J., Baker, J.D., Grooms, L.D. (2008). Development of an
instrument to measure perceived cognitive, affective, and psychomotor learning in
traditional and virtual classroom higher education settings. Internet and Higher
Education, 12, 7–13.
Russo, T., & Benson, S. (2005). Learning with Invisible Others: Perceptions of Online
Presence and their Relationship to Cognitive and Affective Learning, Educational
Technology & Society, 8 (1), 54-62.
Salen K., Zimmerman, E. (2004). Rules of Play. Game Design Fundamentals. Cambridge:
MIT Press.
Shen, C., Wang, H., Ritterfield, U. (2009). Serious Games and Seriously Fun Games. In
Ritterfeld, U., Cody, M. Vorderer, P. (Eds.), Serious games: Mechanisms and effects.
New York: Routledge.
Shernoff, D.J., Csikszentmihalyi, M., Schneider, B., Shernoff, E.S. (2003). Student
Engagement in High School Classrooms from the Perspective of Flow Theory, School
Psychology Quarterly, 18(2), 158–176.
Sisler, V., and Brom, C. (2008). Designing an Educational Game: Case Study of 'Europe
2045'. In Transactions of Edutainment I, LNCS 5080. Springer-Verlag, Berlin, 1-16.
Sisler, V., Brom, C., Slavik, R. (2008). Towards a Novel Paradigm for Educational Games:
The augmented Learning Environment of ‘Europe 2045’. 12th International MindTrek
Conference: Entertainment and Media in the Ubiquitous Era, Tampere, p.34-38.
Susi, T., Johannesson, M., Backlund, P. (2007). Serious Games – An overview. Technical
Report HS-IKI-TR07-001. Sweden: University of Skövde.
Sweetser, P., Wyeth, P. (2005). GameFlow: a model for evaluating player enjoyment in
games. Computers in Entertainment, 3(3), 1-24.
‘I PLAY, THEREFORE I LEARN?’ 32
Tüzün, H. (2007). Blending video games with learning: Issues and challenges with classroom
implementations in the Turkish context. British Journal of Education Technology,
38(3), 465-477.
Van Eck, R. (2006). Digital Game-Based Learning: It’s not just the digital natives who are
restless. Educase Review, 41(2), 16-30.
Van Looy, J. (2010). Understanding Computer Game Culture: the Cultural Shaping of a New
Medium. Lambert Academic Publishing: Saarbrücken.
Vorderer, P., Hartmann, T.,Klimmt, C. (2003). Explaining the enjoyment of playing video
games: the role of competition. In: Proceedings of the 2nd IFIP International
Conference on Entertainment Computing ICEC’03. New York: ACM.
Vorderer, P., Klimmt, C., Ritterfeld, U. (2004). Enjoyment: At the heart of media
entertainment. Communication Theory, 14(4), 388-408.
Wu, D., & Hiltz, S. R. (2003). Online discussions and perceived learning. Paper presented at
9th Americas Conference on Information Systems. Tampa, FL. Retrieved the 20th of
April 2010 from:
http://www.alnresearch.org/Data_Files/articles/full_text/wu_Hiltz(2003).pdf
Qin, H., Rau, P.P., Salvendy, G. (2009). Measuring Player Immersion in the Computer Game
Narrative. Journal of Human-Computer Interaction, 25(2), 107-133.