runnymede 2035 · functional economic area analysis, final report, june2015 page 6 • to...
TRANSCRIPT

June 2015
Runnymede 2035Functional EconomicArea Analysis
Future Electronics, The Glanty, Egham

Functional Economic Area Analysis, final report, June 2015 Page 2
This page has been left intentionally blank

Functional Economic Area Analysis, final report, June 2015 Page 3
Contents Page Chapter Page
1. Introduction and planning policy overview……………………………5 2. Background to Runnymede Borough, an overview of its
context in the wider area and employment overview………………..7 3. The extent of the housing market area (HMA) that
Runnymede is located within…………………………………………..9 4. Conclusions of previous research on property market areas………11 5. The functional labour market area…………………………………….22 6. Industry Clusters………………………………………………………...31 7. Retail and service markets for consumers and catchment areas
of cultural facilities………………………………………………………36 8. Local FEA studies-conclusions of previous research……………….41 9. Overall conclusions and recommendations………………………….44
Appendices
Appendix 1-List of organisations consulted on the draft FEA report in March/April 2015
Appendix 2-Schedule of comments made on the draft FEA analysis report during the focussed consultation event in March/April 2015 and the officer responses
Figures
Figure 1: Location of Runnymede Borough
Figure 2: Property market areas identified in the CBRE South East Regional Property Market Study (March 2007)
Figure 3:Overview of the Enterprise M3 LEP area
Figure 4: Identified commercial property market areas in the Enterprise M3 LEP area
Figure 5: Upper M3 commercial market area
Figure 6: Enterprise M3 LEP sites by estimated floorspace bands
Figure 7: Travel to Work areas in the Surrey/West Hampshire area as defined by ONS
Figure 8: Commuting Flows to Previously Defined HMAs
Figure 9: top ten locations of employment for Runnymede residents
Figure 10: Top ten locations of residence for the Runnymede workforce
Figure 11: Commuting Flows to Larger Employment Centres in South East
Figure 12: Commuting Flows with Key Outer London Employment Centres

Functional Economic Area Analysis, final report, June 2015 Page 4
Figure 13: Dominant Commuting Destinations, 2011
Figure 14: Top ten destinations for tech firms by local authority
Figure 15: Total employment in key tech based sectors in the Enterprise M3 LEP area
Figure 16: SEEDA priority areas (top 100 by turnover)
Figure 17: Employee Jobs by Industry
Figure 18: Summary of findings from the retail studies of the boroughs adjoin Runnymede
Figure 19: Figure 19: Summary of findings in studies which consider the extent of the FEAs in the local area
Figure 20: Summary of boroughs with key links to Runnymede as identified in this report

Functional Economic Area Analysis, final report, June 2015 Page 5
CHAPTER 1: INTRODUCTION AND PLANNING POLICY OVERVIEW 1.1 This report considers the geographic extent of the ‘functional economic area’ (FEA)
that Runnymede Borough forms a part of. This first chapter sets out why Runnymede Borough Council (RBC) needs to identify the extent of this area, and considers what is meant by the phrase ‘functional economic area’ in the context of planning policy. It also considers how the FEA is defined. This report has been produced specifically to determine which authorities RBC needs to engage with during future work relating to the economy and employment.
Planning Policy Background
1.2 The National Planning Policy Framework (NPPF) requires local authorities to work together on strategic planning issues. The NPPF specifically states in paragraph 160 that local planning authorities ‘should have a clear understanding of business needs within the economic markets in and across their area’.
1.3 Paragraph 160 of the NPPF goes onto state that local planning authorities should: • work together with county and neighbouring authorities and with Local Enterprise
Partnerships to prepare and maintain a robust evidence base to understand both existing business needs and likely changes in the market; and,
• Work closely with the business community to understand their changing needs and identify and address barriers to investment, including a lack of housing, infrastructure or viability.
What is a Functional Economic Area and why is it important?
1.4 The Planning Practice Guidance (PPG) establishes that as part of a local authority’s economic development work it is particularly important that the extent of the FEA that their borough is located within is understood. Since patterns of economic activity vary from place to place, there is no standard approach to defining a FEA, however, the PPG states that it is possible to define them taking account of indicators including:
• extent of any Local Enterprise Partnership (LEP) within the area; • travel to work areas; • housing market area; • flow of goods, services and information within the local economy; • service market for consumers; • administrative area; • catchment areas of facilities providing cultural and social well-being; and, • the transport network.
1.5 As the boundaries of an FEA vary depending on the indicator used, a judgement
needs to be taken as to which features of the economy to consider. Therefore, in this report the economic geography is sought to be defined where there is confidence that the majority of economic linkages and flows exist.
1.6 Understanding the extent of the FEA that a borough sits within is considered to be
important for the following reasons:

Functional Economic Area Analysis, final report, June 2015 Page 6
• To understand the contribution that their part of that FEA makes to the whole; • To appreciate the influences that will shape economic development in their area; • To help identify which other local authorities and organisations the Council will need
to work with under the Duty to Co-operate as their employment work continues; and, • To ensure that employment policies in the Local Plan are specific enough to meet
local needs, but broad enough to ensure that spill-over effects are contained and addressed within the relevant FEA(s).
Report structure
1.7 The rest of this report examines the different ways in which the FEA of which RBC forms a part can be defined, before presenting conclusions and recommendations for the Council to take forward in planning for economic development. The methodology adopted by the Council in the following chapters is to draw on existing evidence, data and information from a variety of sources to reach conclusions rather than undertaking extensive primary research.
1.8 It should be noted that following the completion of this report in draft form, a focussed
consultation event was carried out with key stakeholders in March/April 2015 including:
• the Enterprise M3 LEP; • neighbouring local authorities; • Surrey County Council; • in addition to those local authorities identified above, any other local planning
authorities identified in this report as having important links to the borough in relation to the economy; and,
• other organisations with an interest in economic development in the FEA including the Runnymede Business Partnership and the Egham, Chertsey and Surrey Chambers of Commerce.
1.9 The list of the organisations/stakeholders consulted on the draft FEA report can be
found at Appendix 1. The comments made by stakeholders were considered by Officers at Runnymede and addressed in the report where considered necessary, prior to the report being finalised. A summary of the comments made by stakeholders and the responses of Officers can be found at Appendix 2.

Functional Economic Area Analysis, final report, June 2015 Page 7
CHAPTER 2: BACKGROUND TO RUNNYMEDE BOROUGH, AN OVERVIEW OF ITS CONTEXT IN THE WIDER AREA AND EMPLOYMENT OVERVIEW
2.1 Runnymede Borough is located in North West Surrey only 20 miles from Central
London. It is a small borough when compared with most other Surrey authorities, measuring only 8 miles from north to south. Approximately 79% of its area lies within the metropolitan Green Belt which makes it an attractive area to live, work and visit. Figure 1 below shows the location of Runnymede in the wider context.
Figure 1: Location of Runnymede Borough
2.2 As figure 1 shows, Runnymede has boundaries with five neighbouring Local Authorities. The nearest major settlements in these adjacent local authorities are Staines-upon-Thames, Walton-on-Thames, Weybridge, Windsor and Woking. Camberley and Maidenhead are also large towns located within the neighbouring authorities but are geographically some distance from the boundary of Runnymede. Figure 1 also shows the key transport links in the Borough and surrounding area.
2.3 The Borough itself has a strong local economic base with many commercial
enterprises located in the town centres (Addlestone, Chertsey and Egham), industrial estates, suburban business areas and business parks. The local economy, in common with the rest of Surrey, is dominated by the service sector which employs some 89% of the workforce, while manufacturing accounts for just 2.5% (Nomis, 2013).

Functional Economic Area Analysis, final report, June 2015 Page 8
2.4 There are a large number of major businesses and institutions in the Borough from a
variety of sectors, including: Astellas Pharma, Automatic Data Processing, Belron, BUPA, British Gas/Centrica, Chep, Compass Group, Crest Nicholson, Gartner, Hitachi, Kone, Merlin Entertainments (Thorpe Park), Procter & Gamble, Samsung Electronics, Thales and Toshiba, as well as a number of institutions such as the Animal and Plant Health Agency veterinary laboratories, CABI, Royal Holloway (University of London) and Ashford and St Peter’s NHS Foundation Trust.
2.5 The number of residents in Runnymede in employment has grown over recent years
to 48,600 (Nomis, October 2013 – September 2014). Runnymede records high earnings in the workplace with the median gross weekly pay recorded as approximately £661 per week for full-time workers when compared against the England average of £523 (Nomis, 2014). In addition to high workplace earnings being recorded within the Borough, the majority of residents in Runnymede are qualified to NVQ Level 3 and above (Nomis, January 2013-December 2013). Both of these factors are considered to be indicative of a strong local economy.
2.6 Factors that may affect future economic growth in the Borough include: • Its extensive Green Belt, heritage and flood risk factors, which potentially limit the
supply of new employment sites, and the ability of existing businesses to expand their sites/premises;
• Its high housing costs; • High wage levels in London and other nearby areas which result in high levels of out
commuting, potentially limiting local labour supply; • Potential competition from larger economic centres nearby: and, • Competition for land from other types of uses. 2.7 There are also potential constraints on redeveloping existing industrial areas to
provide more modern employment space, partly as a result of ownership factors and partly as a result of the need to protect some industrial land for low cost small start-up units and for ‘bad neighbour’ uses.

Functional Economic Area Analysis, final report, June 2015 Page 9
CHAPTER 3: THE EXTENT OF THE HOUSING MARKET AREA (HMA) THAT RUNNYMEDE IS LOCATED WITHIN
3.1 In June 2014 the Planning Advisory Service (PAS) published a document entitled
‘Objectively Assessed Housing Need and Housing Targets’. This document is a technical advice note prepared by Peter Brett Associates (PBA). In this advice note PBA clarify that just as a Housing Market Area (HMA) is an area in which households search for housing, a FEA is an area in which businesses search for sites and premises. They also advise that FEAs may be defined as labour market areas, which are areas of commuting closure - meaning that a high proportion of all journeys to work occur within the same area. They state that one can expect HMAs and FEAs to be geographically similar because in broad terms both are largely determined by the reach of a daily trip; just as households’ location decisions are largely driven by access to jobs and services, business location decisions are largely driven by access to the workers that fill those jobs and the customers who consume those services.
3.2 For this reason, and also for convenience, PBA advise that it is useful to combine the
FEA and HMA into a single boundary. This makes both analysis and policy making manageable. It also makes it possible to plan for alignment of jobs and workers-something which is very difficult to do at the level of individual authorities, precisely because labour markets are generally larger than local authority areas.
3.3 The PPG concurs that the extent of the HMA that a borough sits within is also a
relevant consideration when carrying out analysis of the FEA.
3.4 In this regard, it is important to note that in 2014 Runnymede and Spelthorne Borough Councils jointly commissioned GL Hearn to produce its Strategic Housing Market Assessment (SHMA). The SHMA contains a section which analyses the HMA(s) that Runnymede and Spelthorne boroughs sit within. When all relevant factors are considered (including consideration of evidence related to migration and house prices as well as travel to work analysis) it has been concluded that Runnymede and Spelthorne sit together in a North West Surrey HMA grouping. The report acknowledges however that there are a series of inter-connected local housing markets in the area surrounding the boroughs which reflects the density of transport networks, both road and rail. It is therefore one of the recommendations of the report that Runnymede and Spelthorne Councils work alongside their neighbouring authorities (particularly Elmbridge, Hounslow and Woking) to better understand any relevant issues and seek to coordinate activities. This is recommended as some notable links between the Runnymede-Spelthorne HMA and parts of these boroughs were found even though these three boroughs have stronger links elsewhere and are believed to fall with different local HMAs. This demonstrates that overlapping can occur along the boundaries of HMAs.
3.5 The report also notes that the following post-NPPF SHMA studies have been
undertaken in the area surrounding the Runnymede-Spelthorne HMA which help to build up a picture of HMAs in this part of the South-East of England.

Functional Economic Area Analysis, final report, June 2015 Page 10
Hart, Rushmoor & Surrey Heath SHMA – the Final Report for the SHMA, dated December 2014, concludes that when taken together, previous research on housing markets and up-to-date analysis of migration and travel to work patterns supports the particular importance of Hart, Rushmoor and Surrey Heath working together; West Surrey SHMA - this defines a housing market area centred on Guildford which includes Guildford, Waverley and Woking, but with a degree of overlap with the Hart, Rushmoor and Surrey Heath market and an influence from London; Windsor & Maidenhead SHMA – this SHMA, dated Jan 2014, defines an HMA which includes all of the Borough’s adjoining Districts, these being Reading, Wokingham, Wycombe, South Bucks, Slough, Bracknell Forest, Surrey Heath, Runnymede1 and Spelthorne; and, London SHMA – the Greater London Authority’s (GLA) 2013 SHMA looks at the Greater London area, but recognises links beyond this, setting out that ‘its urban area extends beyond this boundary and encompasses a substantial hinterland’ but sets out that there is no universally accepted way of measuring this, noting that boundaries based on analysis of commuting and migration “are highly sensitive to the specific level of containment used” based on the CURDS Study findings.
3.6 It is also relevant to note the findings of slightly older SHMAs which relate to the immediate surrounding area:
2007 Berkshire SHMA - This Study, prepared by DTZ, reviewed the definition of the Inner West Market identified in their earlier 2004 Study, and concluded that there was a separate East Berkshire HMA containing Slough and Windsor and Maidenhead (and possibly South Bucks). Eastern Surrey SHMA – this 2007 Study defined an Eastern Surrey HMA which included Elmbridge, Epsom & Ewell, Mole Valley, Reigate and Banstead and Tandridge;
3.7 The GL Hearn report also notes the influence of London on both Runnymede and
Spelthorne. The extent of its influence varies depending on the commuting threshold used. However London’s primary catchment area is confined within Greater London and this is thus considered to be a reasonable assessment of the London HMA. This is consistent with the GLA’s analysis.
3.8 The report concludes that whilst it is important to recognise the influence of London,
and to take this into account when planning for housing, it is not practical to develop a SHMA covering London and a significant proportion of the Home Counties, hence the recommendation for a smaller ‘Local Housing Market Area’ by GL Hearn. This is consistent with the approach taken by other local authorities in the surrounding area.
3.9 In the chapters that follow it will be considered whether the commercial market(s) that
Runnymede is located within is consistent with the HMA analysis in the 2014 GL Hearn SHMA work.
1 While Runnymede was included in the RBWM HMA this was to reflect localised links around Sunningdale and Virginia Water.

Functional Economic Area Analysis, final report, June 2015 Page 11
CHAPTER 4: CONCLUSIONS OF PREVIOUS RESEARCH ON PROPERTY MARKET AREAS
4.1 In its role as a Local Planning Authority, RBC is required to allocate adequate land for businesses and other employment creating activities. Local Plans identify sites for employment use (office, industrial and warehouse), and to do this local authorities require a detailed understanding of the property markets in their locality. This chapter will now consider the extent of the commercial property market area(s) that the borough is located within, based on existing research.
CBRE South East Regional Property Market Study (March 2007)
4.2 CBRE’s report into property market areas (PMA) in the South East which was
published in 2007 is considered a useful starting point when seeking to determine the PMA(s) that Runnymede is impacted by. The report identified 13 functional PMAs within the South East region. PMAs are described in the following way in the CBRE report;
‘This classification is proposed as an indication of areas within which market linkages and agglomeration tendencies are most robust, and hence where the case for cross-authority dialogue on employment land allocation is strongest. It does not imply an absence of linkages between the individual areas. Indeed given the fluid nature of markets in some parts of the region, linkages across the boundaries of adjacent areas may be strong, particularly in high-demand areas where in strong market conditions displacement and substitution activity can be significant’ (page 107).
4.3 The bulk of commercial property deals involve churn in the market, as a company’s
location is largely dictated by the need to be easily accessible to where the majority of their staff live. A PMA therefore can reflect the extent of a FEA. The 13 PMAs identified by CBRE can be seen in figure 2 below:

Functional Economic Area Analysis, final report, June 2015 Page 12
Figure 2: property market areas identified in 2007 CBRE study
Image reproduced from the CBRE South East Regional Property Market Study
4.4 The CBRE study identifies two PMAs relevant to Runnymede. Egham is immediately
adjacent to the Heathrow, Slough and High Wycombe area (property market 5 in figure 2) which includes Spelthorne, Slough, High Wycombe, Windsor and Uxbridge. Staines-upon-Thames is noted as being one of the key centres within this PMA. Chertsey and Addlestone are located within the Surrey South-West London PMA with Guildford, Woking, Leatherhead, Weybridge, Redhill, Reigate, and the London Boroughs of Kingston, Richmond, Merton, Sutton and Croydon (property market 8 as shown in figure 2).
4.5 The Heathrow-Slough-High Wycombe PMA effectively represents the eastern end of
the Thames Valley market and, in overlapping significantly with the London area, acknowledges the pervasive influence of Heathrow Airport.
4.6 The report acknowledges that linkages across the boundaries of adjacent PMAs may
be strong, particularly in areas where demand for property is high and displacement and substitution activity may be high. This is likely to be the case between the adjacent property markets of area 5 (Heathrow, Slough and High Wycombe), 6 (M3 Corridor) and 8 (Surrey-South West London Fringe).
4.7 Whilst this study was completed 7 years ago, it benefits from not being constrained in
a sub-regional context by administrative boundaries. Recent discussions with
Functional Economic Area Analysis, final report, June 2015 Page 13
commercial agents operating in the Borough support this study’s findings, with agents generally recognising the existence of two property markets influencing Runnymede:
• A market in the north covering Egham, which is considered almost as an M4
town in the same market area as Heathrow, Slough and Uxbridge, but also including Thorpe and the area to the north of Virginia Water
• A market to the south covering Addlestone and Chertsey which comprise part of the South West London M3/A3 corridor market.
4.8 This split is supported by recent company moves into and out of the borough, which
have seen companies moving to the Addlestone area from Guildford and vice versa, and companies moving into the Egham area from neighbouring boroughs to the north and north east.
The Enterprise M3 LEP geographical area
4.9 When LEPs were established in 2010, the geographical boundaries were proposed
by the partnerships and then agreed to formally by Ministers. The boundaries were assessed using the criteria set out in the Local Growth White Paper. Lord Heseltine summarised the purpose and logic for the current boundaries as reflecting the "geography of local functioning economic areas". Planning Policy Guidance supports the potential usefulness of LEP geography to a Council who is carrying out its economic development needs work by stating that the extent of any LEP within an area may be of relevance in defining the extent of an area’s FEA.
4.10 Some argue however that the premise upon which some LEPs were originally
designated may have changed. For example Professor David Bailey and Gill Bentley, in conjunction with the Regional Studies Association, believe that some local economies no longer match the boundaries of their LEP stating that, ‘LEPs are much more fragmented and failed to match functional economic geography in any meaningful sense’. There is also criticism from some that the geographical boundaries of LEPs are more political than economic2.
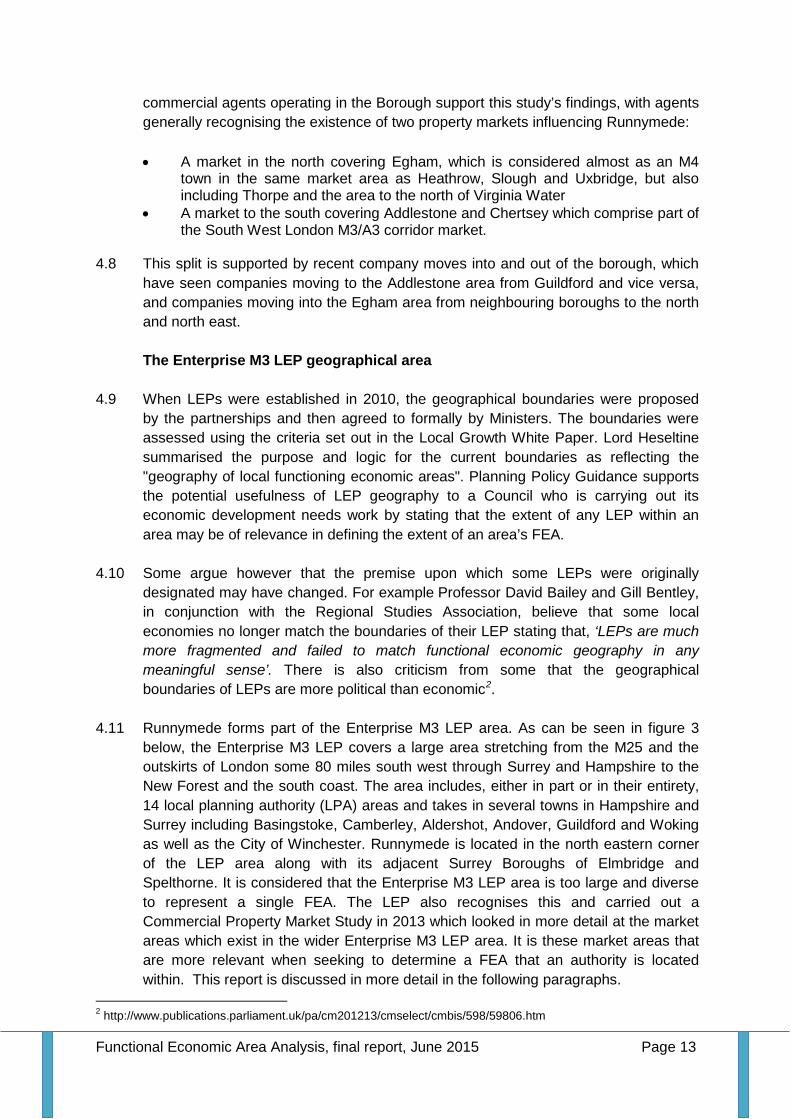
4.11 Runnymede forms part of the Enterprise M3 LEP area. As can be seen in figure 3
below, the Enterprise M3 LEP covers a large area stretching from the M25 and the outskirts of London some 80 miles south west through Surrey and Hampshire to the New Forest and the south coast. The area includes, either in part or in their entirety, 14 local planning authority (LPA) areas and takes in several towns in Hampshire and Surrey including Basingstoke, Camberley, Aldershot, Andover, Guildford and Woking as well as the City of Winchester. Runnymede is located in the north eastern corner of the LEP area along with its adjacent Surrey Boroughs of Elmbridge and Spelthorne. It is considered that the Enterprise M3 LEP area is too large and diverse to represent a single FEA. The LEP also recognises this and carried out a Commercial Property Market Study in 2013 which looked in more detail at the market areas which exist in the wider Enterprise M3 LEP area. It is these market areas that are more relevant when seeking to determine a FEA that an authority is located within. This report is discussed in more detail in the following paragraphs.
2 http://www.publications.parliament.uk/pa/cm201213/cmselect/cmbis/598/59806.htm

Functional Economic Area Analysis, final report, June 2015 Page 14
Figure 3: Overview of the Enterprise M3 area
The Enterprise M3 LEP Commercial Property Market Study (April 2013)
4.12 In 2013, the Enterprise M3 LEP Land and Property Action Group commissioned a report on the Commercial Property Market of the Enterprise M3 LEP area, in order to develop a robust commercial property evidence base to enable the LEP to engage with and influence planning and economic policy development and delivery. At the outset of the study, it was understood that the Enterprise M3 LEP area was so large that the market conditions within the area were likely to vary, depending on a number of key drivers. Analysis of these key drivers together with the findings of consultation with the property market and business community resulted in the identification of the following six distinct sub-areas within the Enterprise M3 LEP area, each of which has different market characteristics:
• New Forest • Basingstoke & Andover • Central Hampshire (including Winchester and Petersfield) • Blackwater Valley (including Camberley, Aldershot, Farnborough and
Farnham) • Guildford & Woking • Upper M3 (including Staines-upon-Thames and part of the south
western quadrant of the M25)

Functional Economic Area Analysis, final report, June 2015 Page 15
4.13 These market areas (as seen in figure 4) are described in the report as ‘fluid geo-
spatial concepts that broadly represent distinct local commercial property markets defined, among other factors, by rental contours.’ The LEP’s Land and Property Action Group discussed and agreed the use of these “market areas” as a means of reflecting the practical operation of the property market and enabling discussion about the performance of different sub-markets within the wider LEP area. The study combines a variety of datasets with market intelligence on perceived market areas, as well as public and private sector views on the suitability of employment sites.
4.14 Overall the study is considered to provide detailed assessment of the commercial property market in West Surrey and Hampshire.
Figure 4: Identified commercial property market areas in the Enterprise M3 LEP area
Image reproduced from the LEP Commercial Property Market Study (April 2013)

Functional Economic Area Analysis, final report, June 2015 Page 16
Figure 5: Upper M3 commercial market area
Image reproduced from the LEP Commercial Property Market Study (April 2013), appendix 1.
4.15 As can be seen from figures 4 and 5 above, Runnymede is located in the Upper M3 commercial market area along with Spelthorne and Elmbridge boroughs. Appendix 1 of the LEP Commercial Property Market Study contains a ‘pen portrait’ of the Upper M3 LEP area which notes the following key points: General overview of the area
• Unlike the other Enterprise M3 LEP commercial market areas, the upper M3
market area is mostly urbanised with major employment centres in Chertsey, Egham, Esher, Staines upon Thames and Weybridge;
• The area is adjacent to Heathrow Airport and is served by both the M3 and M25;
• There are a number of large business parks in the market area, including the Bourne Business Park (Addlestone), Hillswood Business Park (Chertsey), The Causeway (Egham), Watermans (Staines) and Weybridge and Brooklands, as well as numerous smaller business parks;
• There is a very strong private sector employee presence in the Information and Communications sector, as well as in Utilities, Professional, Scientific and Technical and Wholesale sectors. The public sector is also a major employer in the education and health sectors;
• There were around 142,700 employees in 2011.

Functional Economic Area Analysis, final report, June 2015 Page 17
Labour market
• Average employment rates are around 75% of the working age population- above the England average of 70%, whilst unemployed jobseekers allowance rates are two and a half times lower than the national average;
• The market area has the highest proportion of workers employed in the private sector in the Enterprise M3 LEP area at 84%, which is well above the England rate (77%);
• Almost half the workforce (48%) are qualified to degree or equivalent levels, compared to 38% nationally;
• Median average workplace earnings are at a level of £600 per week. This is much higher than the England average of £5103, reflecting the close proximity to London.
Commercial sites, floorspace and average rents
• According to Valuation Office Agency 2012 data and the whole district definition (Elmbridge, Runnymede and Spelthorne) there were around 7,000 hereditaments4, split: Retail (2,720, 38%), Office (2,190, 31%); Industrial (1,460, 21%); and Other (700, 10%). Total floorspace for the three boroughs was around 2.5 million sq.m, with around 35% (0.9 million sq.m) in industrial use;
• The Upper M3 has office rents being quoted between £6.50 and £35/sq ft pa; the average is just over £19.00;
• The Upper M3 area has examples of industrial units on the market at an average quoting rent of about £8.50/sq ft pa (about 10% or 11% higher than the LEP average);
4.16 As a general point the LEP Commercial Property Market Study found that Surrey appears to command a premium for office rents of up to 35% over Hampshire. Similarly, quoting rents for industrial property in Surrey are, on average, about 25% higher than in Hampshire although figures vary from property to property.
4.17 Comparative site, floorspace and rent figures for Runnymede show:
• There were around 2,000 hereditaments, split: Retail (590, 29.5%), Office (710, 35.5%); Industrial (490, 24.5%); and Other (210, 10.5%). Total floorspace for the borough was around 678,000sq.m, with around 42% in office use and 33% in industrial use. Thus Runnymede exhibits a lower level of retail hereditaments and a higher number of office and industrial hereditaments than the Upper M3 area;
• Office rents currently being quoted in the Borough range from approximately £15/sq.ft and £35/sq ft pa. New build premises on the major business parks across the Borough are quoting rents at approximately £32 to 35/sq.ft with
3 Please note that this data differs from that in paragraph 2.5 as it provides earnings data from an earlier period. 4 Section 115 (1) of the General Rate Act 1967 (the 1967 Act) defines a hereditament as follows :'hereditament means property which is or may become liable to a rate, being a unit of such property which is, or would fall to be, shown as a separate item in the valuation list,'.

Functional Economic Area Analysis, final report, June 2015 Page 18
second hand space showing more variation in cost depending on location with Grade A space ranging from £21-£30/sq.ft. Grade A premises along the Causeway in Egham appear to command a slight premium of approximately £1 to £2/sq.ft due to this areas proximity to Heathrow and the M25.
• Industrial units in Runnymede are being marketed at an average quoting rent of about £10/sq ft pa.
4.18 The LEP study also analysed over 100 employment sites across the LEP area to assess their market attractiveness, site quality and availability to the market, together with an additional explicit assessment of overall development potential. These sites are mapped in figure 6 below.
Figure 6: Enterprise M3 LEP sites by estimated floorspace bands
Image reproduced from the LEP Commercial Property Market Study (April 2013)
4.19 Figure 6 demonstrates how there are several obvious concentrations of sites in the Enterprise M3 LEP area along the M3 corridor itself, and in close proximity to the M25, A3, A31, A34 and A303. One such concentration is in the Upper M3 Market Area and another is in the Blackwater Valley to the south west of this market area, both of which are also served by Farnborough Airport and the major international hub airport of Heathrow.

Functional Economic Area Analysis, final report, June 2015 Page 19
4.20 Of particular significance within the Upper M3 Property Market Area is the former Defence Evaluation and Research Agency (DERA) site at Chobham on the western side of Runnymede. Part of the site also extends into the neighbouring authority of Surrey Heath. This site covers some 125 hectares of land in total, and is split into two parts (known as DERA North and DERA South) by the M3 which runs NE/SW through it. The majority of the existing commercial development at the site is on DERA North. There are two extant planning permissions on the site which relate to commercial redevelopments. These are summarised as follows: -RU.05/0538: Outline planning consent granted on 6th June 2011 for development comprising up to 113,434 sq.m of built floorspace (in total) including: business premises (Class B1 use); with supporting retail and cafe/restaurant facilities (Class A1 and A3 use), childcare facilities (Class D1 use), leisure facilities (Class D2 use), and decked vehicle parking. -RU.13/0856-Hybrid planning application where permission was granted on 12th August 2014 for the demolition of existing buildings and redevelopment of the site to provide; up to 79,025sqm (GEA) of Class B1 employment uses (including parking); up to 36,000sqm (GEA) of sui generis Data Centres use (including ancillary facilities and parking); up to 200 dwellings, up to 6,300sqm (GEA) of ancillary uses, including Class A1 - A5 uses (i.e. retail uses, cafe/restaurants and a public house up to 1,550sqm GEA), Class D1 uses (i.e. childcare facilities up to 600sqm GEA); Class D2 uses (i.e. Health and Leisure (up to 1900sqm GEA); the creation of Publicly Accessible Open Space (PAOS), and other ancillary development (please note that at the time of writing this application is the subject of a legal challenge).
4.21 Currently there is a significant amount of employment floorspace on the site (some 71675sqm of B1A floorspace according to RU.13/0856). The Environmental Statement which accompanied RU.05/0538 (and which drew on data from 1999) stated that historic employment levels peaked at the site in the 1970s at around 1700 employees. This dropped to approximately 749 workers when QinetiQ were at the site (up to late 2002). It is understood that the current main business activity at the site is in connection with its use as a film studio/location and whilst the number of workers is unknown, it is likely that the permanent staff numbers on the site are relatively low, but that this changes significantly depending on whether the studios are in use.
4.22 On the basis of the extant planning consents, this site has the potential to become a high profile employment site if either consent is implemented with all floorspace in one of the consents being built out and occupied. The planning statement accompanying RU.13/0856 stated (page 10, para 2.8) that, ‘the type of employment uses being promoted by Crest and Aviva Investors is aimed at creating a significant number of new job opportunities at the DERA North Site. To this end, it is estimated that the proposals could provide the space for in the region of 5,259 jobs’. Given that the site straddles the boundary with Surrey Heath Borough Council, further discussions with this council may be necessary if any issues relating to economic development issues connected with the site arise as the Council progresses work on

Functional Economic Area Analysis, final report, June 2015 Page 20
its Local Plan; even if it is considered the Runnymede and Surrey Heath are not located in the same FEA.
4.23 Figure 6 also shows clusters of sites in the Egham/Staines-upon-Thames area, both in the boroughs of Runnymede and Spelthorne. A cluster of sites is also observed in the Brooklands area to the south of the Borough within Elmbridge.
4.24 The LEP report provides an in-depth analysis of property market areas operating
within the Enterprise M3 LEP area. However a limitation of the study is that it draws an artificial barrier at the edge of the LEP area, beyond which functional links with other boroughs/areas are not considered in any detail. Given Runnymede’s location on the edge of the Enterprise M3 LEP area, in reality it is considered that such linkages are likely to exist as highlighted by the overlap between the Upper M3 market area with parts of market areas 5 and 8 as identified in the CBRE study earlier in this chapter.
4.25 Whilst this may be the case, the LEP study is considered to be a valuable piece of evidence in this FEA analysis work, which, alongside other data/studies will help identify where the strongest functional links with other authorities lie. It should be noted that during the production of this FEA analysis report the LEP has advised the Council that as the Commercial Property Market Study was based on data from 2012, an updated report will be carried out within the next year. This will be reviewed by the Council once produced to see if it has any implications for its ongoing economic development needs work. Working towards a Smarter Future: The Enterprise M3 Strategic Economic Plan (2014-2020)
4.26 Another document produced by the Enterprise M3 LEP, which is considered worthy of mention, is its Strategic Economic Plan. This document sets out that the Enterprise M3 LEP will focus investment on four Growth Towns (Basingstoke, Guildford, Farnborough and Woking) and five Step-Up towns of (Aldershot, Andover, Camberley, Staines upon Thames and Whitehill and Bordon) within the LEP area during 2014 to 2020. Growth Packages have been produced for each of these towns to detail how investment will be delivered. It is worth noting that two major transport investments in Egham - the Runnymede Roundabout and Egham Sustainable Transport Package are included in the Growth Package for Staines-upon-Thames as these two areas are intrinsically linked. It is also worth noting that LEP funding is available to locations outside the Growth Towns and Step-Up towns mentioned above, especially for projects which support development and promotion of the Sci-Tech Corridor. Conclusions
4.27 The CBRE South-East Regional Property Market Study and the LEP Commercial Property Market Study present different geographical boundaries for the PMAs impacting Runnymede. The CBRE study shows two different sub-regional commercial property market areas that cover parts of Runnymede, which split the

Functional Economic Area Analysis, final report, June 2015 Page 21
Borough into two zones - a northern zone encompassing Egham and Thorpe (heavily influenced by Heathrow airport) and a southern zone encompassing Chertsey and Addlestone. This north/south split is supported by discussions with commercial agents operating in the Borough. The Upper M3 property market area identified in the LEP Commercial Property Market Study encompasses the Boroughs of Elmbridge, Runnymede and Spelthorne, and presents a more localised PMA for Runnymede. The boundaries of this market area however were dictated to the north and east by the boundaries of the LEP.

Functional Economic Area Analysis, final report, June 2015 Page 22
CHAPTER 5: THE FUNCTIONAL LABOUR MARKET AREA
5.1 Previous sections of this report have concentrated on the employment context for the Borough, the main locations of employment uses and potential market areas relevant to the Borough as identified in other studies. However, most FEA analyses consider the relationship between where people live and where they work as the most reliable factor in defining an area’s FEA, when considered together with other data. The transport network in Runnymede at a glance
5.2 As shown in figures 1 and 3 earlier in this report, Runnymede is strategically located at the junction of the M25 and M3 motorways. The M25 runs north/south through the Borough and encircles Greater London whilst the M3 runs east/west through the Borough and links South West London to Southampton and the South Coast. The intersection of these two motorways occurs at junction 12 of the M25 which is located relatively centrally in the Borough. Whilst there are no junctions of the M3 which provide access into the Borough, junctions 11 (Chertsey) and 13 (Egham) of the M25 provide access from the strategic road network into the Borough.
5.3 The Borough is also in easy reach of the M4 motorway which links London to Bristol and South Wales, and the A3 which links London to Portsmouth, passing close to Kingston, Guildford, Haslemere and Petersfield. Given its location in relation to the strategic road network, Runnymede has excellent road connections to the capital and Heathrow and Gatwick Airports in particular. The motorway network also provides good access to the wider South East and South West regions.
5.4 The Borough also contains 6 railway stations at Addlestone, Chertsey, Virginia Water, Egham, Byfleet and New Haw, and Longcross. All of the stations in the Borough provide regular daily commuter services (with the exception of Longcross which has a more limited offering during the week and no service at the weekend). Longcross, Egham and Virginia Water stations are on the main line from Reading to London Waterloo and access from these stations into London Waterloo can be achieved in less than an hour.
5.5 Byfleet and New Haw station is located on the main line to Waterloo via Surbiton. Going in the opposite direction, this line provides access to Woking and various other locations in the south (Basingstoke, Guildford, Southampton, Havant and Portsmouth for example). Chertsey and Addlestone stations are situated on a branch line linking these two main lines and offer a regular service to Virginia Water and Weybridge. Again access to London Waterloo from these stations can be achieved in less than an hour. Runnymede’s strategic location and excellent road and rail links to London and the wider South East make Runnymede a highly desirable business location and also a desirable base for commuters to reside in. Travel to Work Areas
5.6 The Office for National Statistics (ONS) states that labour market areas are defined to reflect areas where the bulk of the resident population also work within the same

Functional Economic Area Analysis, final report, June 2015 Page 23
area. Defining labour market areas requires the analysis of commuting patterns, and ONS has worked with Newcastle University to apply a complex allocation process to define a set of Travel to Work Areas (TTWAs) for the whole of the UK.
5.7 The current criteria for defining TTWAs is that generally at least 75% of an area's resident workforce work in the area and at least 75% of the people who work in the area also live in the area. The area must also have a working population of at least 3,500. However, for areas with a working population in excess of 25,000, self-containment rates as low as 66.7% are accepted. TTWA boundaries are non-overlapping and contiguous, and cover the whole of the UK. TTWAs do cross national boundaries.
5.8 The 243 current TTWAs were defined in 2007 using 2001 Census information on home and work addresses, and are based on Lower Layer Super Output areas in England and Wales.
5.9 According to the 2001 ONS-defined TTWAs, the whole of Runnymede is located within the Guildford and Aldershot TTWA. The local authorities that fall within this TTWA are as follows:
• Runnymede • Surrey Heath • Rushmoor • Woking • Hart • Guildford (great majority of the borough) • Waverley (great majority of the borough) • Bracknell Forest (Sandhurst and Crowthorne area only) • East Hampshire (small part of district only)
5.10 Very small parts of Spelthorne and Windsor and Maidenhead Local Authority areas
also fall in the Guildford and Aldershot TTWA, but can reasonably be excluded from consideration since the majority of these two authorities fall into other Travel to Work Areas.
5.11 The extent of the 2001 based TTWA can be seen in figure 7 below.

Functional Economic Area Analysis, final report, June 2015 Page 24
Figure 7: Travel to Work areas in the Surrey/West Hampshire area as defined by ONS
Figure reproduced from the Hart FEA study 2014
5.12 The TTWA have not yet been updated to reflect the commuting flow data from the 2011 Census (these updated TTWAs are due to be published in 2015 according to the ONS website). Over time the number of TTWAs has reduced due to the trend in more and longer distance commuting increases. Indeed the ONS website notes that there were only 314 TTWAs in 1991 compared to 334 TTWAs in 19815. This trend is considered likely to continue, given trends in commuting, but also due to greater numbers of people working remotely which means that they can reside a substantial distance from their places of work. According to the ONS the number of people working from home in the UK in the first three months of 2014 rose to its highest level (£4.2 million people or 13.9% of the workforce) since records began in 1998 when 11.1% of the workforce was home based. However, only 34% of homeworkers are employed by a company or organisation.
Analysis of commuting data
5.13 Commuting data from the 2011 Census was also analysed by GL Hearn as part of their work on the SHMA. Their report found that the influence of London on commuting patterns in Runnymede and Spelthorne is quite clear with around 36% of working residents in Spelthorne and 19% of those in Runnymede commuting to Inner
5 http://www.ons.gov.uk/ons/guide-method/geography/beginner-s-guide/other/travel-to-work-areas/index.html

Functional Economic Area Analysis, final report, June 2015 Page 25
London. The proportion of people commuting to Greater London as a whole is higher still. 44% of working residents in Spelthorne commute to work in London, with 24% commuting to London from Runnymede. There is clearly a strong relationship to London from Spelthorne in particular; and a significant relationship from Runnymede.
5.14 Indeed significantly more working residents from Runnymede commute to work in London (24%) than commute to work in the three West Surrey authorities (Guildford, Waverley and Woking - 9%), or the area defined as within East Surrey in the 2007 SHMA (Elmbridge, Epsom & Ewell, Mole Valley, Reigate and Banstead and Tandridge - 10.8%) or to Surrey Heath/North Hampshire - 2%. The largest single flows from Runnymede were to Elmbridge (8.9%), Spelthorne (7.2%) and Woking (6.3%) but in all cases flows are significantly lower than towards London.
5.15 When the locations where residents in Runnymede and Spelthorne work, and where those working within the two Boroughs live are plotted, based on analysis of 2011 Census data at Mid Super Output Area (MSOA) level the following trends were noted:
• Cross-boundary commuting between Spelthorne and Runnymede; • Short cross-boundary flows with adjoining areas to/from Byfleet, Woking,
Windsor, Weybridge, Langley; • Notable flows to work from both Boroughs to Heathrow and London; and, • Relatively more modest links towards Guildford.
5.16 When commuting flows to the other Surrey HMAs defined by previous studies (as
described in paragraphs 3.5 and 3.6) are considered, the analysis highlights: • Low self-containment levels within the two authorities individually or
combined, reflecting the significant influence of commuting to London; and, • Some commuting to the West Surrey and East Surrey HMAs, particularly from
Runnymede; but low links with North Hampshire/ Surrey Heath.

Functional Economic Area Analysis, final report, June 2015 Page 26
Figure 8: Commuting Flows to Previously Defined HMAs From Runnymede From Spelthorne All working residents 32,578 41,291 Working in London 7,970 17,989 % to London 24% 44% Self containment 11,229 11,153 Self containment % 34% 27% To opposite borough 2,344 4,215 To opposite borough % 7% 10% To North Hampshire and Surrey Heath
764 591
To North Hampshire and Surrey Heath
2% 1%
To West Surrey 2855 898 To West Surrey % 9% 2% To East Surrey 3,534 2,106 To East Surrey % 11% 5%
(table taken from GL Hearn ‘Defining Housing Market Areas’ report, November 2014)
5.17 Further commuting analysis can be carried out by considering where people who work in Runnymede live and visa versa. In this regard, according to the 2011 census the top ten locations of employment for Runnymede residents are as shown in figure 9 below: Figure 9: top ten locations of employment for Runnymede residents
Location of employment Commuters % of Runnymede residents Runnymede 11,229 34.5 Elmbridge 2,908 8.9 Spelthorne 2,344 7.2 Woking 2,037 6.3 Hillingdon 1,687 5.2 Hounslow 1,633 5.0 Westminster, City of London 1,328 4.1 Windsor and Maidenhead 986 3.0 Slough 736 2.3 Guildford 689 2.1
5.18 Figure 10 below shows the top ten locations of residence for the Runnymede
workforce.

Functional Economic Area Analysis, final report, June 2015 Page 27
Figure 10: Top ten locations of residence for the Runnymede workforce
Place of residence Work in Runnymede % of workforce Runnymede 11,229 26.8 Spelthorne 4,215 10.1 Woking 2,957 7.1 Elmbridge 2,077 5.0 Surrey Heath 1,649 3.9 Hounslow 1,645 3.9 Windsor and Maidenhead 1,554 3.7 Bracknell Forest 1,112 2.7 Richmond upon Thames 1,068 2.5 Guildford 916 2.2
5.19 As can be seen from the tables above, when aggregated to local authority level, it
can be seen that Runnymede has 34% of its residents also working in the Borough (11,229 people). It then sees commuting to a range of destinations, with the largest numbers travelling to Elmbridge (2,908 people), Spelthorne (2,037 people) and Woking (2,037 people). Notable flows are also seen to Hillingdon, Hounslow and Westminster (emphasising the links between the borough and London and Heathrow). In terms of in-commuting, again, strong links are also shown with Elmbridge, Woking and Spelthorne in particular.
5.20 The density of transport links (rail and road), and plethora of employment centres, means that commuting flows to a number of employment centres are observed. GL Hearn sought to define larger employment centres, based on local authorities with a workplace population of over 50,000 persons in 2011. They then assessed flows to these areas from Runnymede and Spelthorne. This analysis is shown in figure 11 (where the most notable flows between Runnymede and Spelthorne are highlighted in green). These are the centres outside of London which might therefore be expected to have their own wider Travel to Work Area (TTWA).
5.21 The analysis carried out by GL Hearn suggests that of these, those larger employment centres in the South East to which there is a significant commuting flow (over 500 persons) from Runnymede or Spelthorne comprise:
• Slough • Guildford • Windsor and Maidenhead
5.22 However there is both a geographic proximity and economic inter-relationship
between Slough and Windsor and Maidenhead (as found by GL Hearn in their 2014 SHMA work and also as concluded in the earlier East Berkshire Local Economic Assessment of 2011 which is discussed in more detail in section 9 of this report), and GL Hearn therefore expect these centres to fall within a common TTWA6. Similarly looking further east, there is a proximity and inter-relationship between Crawley and Reigate and Banstead.
6 The 2001 TTWAs defined by ONS supports this

Functional Economic Area Analysis, final report, June 2015 Page 28
Figure 11: Commuting Flows to Larger Employment Centres in South East
Employment Centre Runnymede Spelthorne UK Reading 122 103 76,269 Crawley 126 97 72,060 Basingstoke and Deane 110 104 68,346 Slough 736 1416 63,388 Guildford 689 292 63,309 Wycombe 85 117 62,191 Windsor and Maidenhead 986 722 60,123 Reigate and Banstead 139 87 53,585 Wokingham 189 143 52,545
(based on 2011 Census information. Table taken from GL Hearn ‘Defining Housing Market Areas’ report, November 2014)
5.23 Figure 11 demonstrates that there is a relationship from both authorities to Slough and Windsor and Maidenhead; but a relatively weak link between Spelthorne and Guildford.
5.24 There is also clearly a relationship with centres in Outer London. Using a similar approach, Figure 12 tracks commuting from Runnymede and Spelthorne (as well as Elmbridge). Elmbridge is included in this table to demonstrate the contrasting commuting patterns to Richmond and Kingston. The following notable commuting patterns are observed:
• From Spelthorne to Hounslow (5,579 persons), Hillingdon (4,219) and Richmond (2,111);
• From Elmbridge to Kingston (3,947), Richmond (2,083) and Hounslow (1,487);
• From Runnymede to Hillingdon (1,687) and Hounslow (1,633). Figure 12: Commuting Flows with Key Outer London Employment Centres
Place of work Spelthorne Runnymede Elmbridge UK Hillingdon 4,219 1,687 994 143,012 Hounslow 5579 1633 1487 105,269 Ealing 635 293 260 97,801 Croyden 52 58 141 88,324 Richmond upon Thames 2111 577 2083 57,322 Kingston upon Thames 871 473 3947 56,946 Merton 167 165 770 55,011
(based on 2011 Census information. Table taken from GL Hearn ‘Defining Housing Market Areas’ report, November 2014)
5.25 Hillingdon, Hounslow and Ealing in economic terms are closely related, due to links with Heathrow and this part of the M4 Corridor.

Functional Economic Area Analysis, final report, June 2015 Page 29
5.26 GL Hearn then sought to use the catchment mapping to define the economic influence of these larger employment centres. Figure 13 shows where the strongest commuting flows are with different areas, to the defined employment centres. This analysis shows that strongest commuting flows from Runnymede and Spelthorne are towards Heathrow/ West London; that Elmbridge and Epsom and Ewell relate more towards South West London Boroughs; whilst the influence of London Boroughs extending further south/west is not seen. Furthermore the commuting relationship with Heathrow/West London from Runnymede and Spelthorne is stronger than that with Slough/ Windsor and Maidenhead. It should be noted that this map does not consider commuting flows to Bracknell/ Farnborough and other towns in the Blackwater Valley which are likely to influence commuting in Surrey Heath.
Figure 13: Dominant Commuting Destinations, 2011
(Table taken from GL Hearn ‘Defining Housing Market Areas’ report, November 2014)
5.27 Figure 13 indicates that the strongest commuting flows from Runnymede and
Spelthorne are towards London, and particularly West London Boroughs. This reflects in particular the concentration of employment around Heathrow and the M4 Corridor. However the south-western part of Runnymede around New Haw, Woodham and Ottershaw shows a stronger relationship to Woking. This analysis therefore reinforces the north/south split in the borough of Runnymede as discussed in the CBRE report.

Functional Economic Area Analysis, final report, June 2015 Page 30
5.28 Commuting is also seen to a range of other employment centres reflecting in part the density of the transport network (both road and rail), including the M25 and links to London, although a stronger relationship towards London from Runnymede and Spelthorne is observed than to other parts of Surrey.
5.29 Overall, when all of the analysis is pulled together the travel to work and commuting data demonstrates notable flows to work from Runnymede to Heathrow and London. Indeed the top three commuting flows from Runnymede to London Boroughs are to Hounslow, Hillingdon and Westminster. Major local travel to work relationships are also observed between the borough and Spelthorne, Elmbridge and Woking which are the top three locations of residence for the Runnymede workforce (outside of Runnymede itself).These three boroughs are also the top 3 locations of employment for Runnymede residents (again outside of Runnymede).
5.30 The functional labour market for Runnymede (where the bulk of the resident population also work within the same area) is therefore considered to include Spelthorne and at least parts of the following boroughs:
• Woking • Elmbridge • Hounslow • Hillingdon
5.31 The flow of commuters to Westminster is uniquely influenced by Runnymede’s
location in the London commuter belt and it is thus not considered necessary for this area to be included in the above list.

Functional Economic Area Analysis, final report, June 2015 Page 31
CHAPTER 6: INDUSTRY CLUSTERS
6.1 Paragraph 21 of the NPPF requires local authorities to ‘plan positively for the location, promotion and expansion of clusters or networks of knowledge driven, creative or high technology industries’. It is relevant, therefore, to consider in this analysis whether there are any particular clusters or networks of knowledge driven, creative or high tech industries in Runnymede Borough.
6.2 In October 2013 KPMG and Markit produced a report entitled ‘Understanding Tech clusters and tracking the UK Tech sector’s outlook for employment and growth’7. This report found that the top 10 tech job clusters are all close to the M4, M3 and M25 motorways, providing easy access to Heathrow and Gatwick Airports, as well as relatively short train journeys to London. Wokingham is the number one tech employment cluster in Great Britain with the proportion of tech jobs in Wokingham being more than 5 times greater than the UK average. Rushmoor is in second place and contains Farnborough which is home to a number of tech firms at business parks such as IQ Farnborough (now known as Farnborough Business Park) and the Farnborough Aerospace Centre. Hart District Council is in third place being home to the Bartley Wood Business Park in Hook and the Meadows Business Park in Blackwater which contain a number of large tech companies. Runnymede is in 6th place. Overall 4 of the top 10 technology clusters in the country are located in the LEP M3 area. Figure 14 below shows the top 10 clusters for tech firms by local authority in Great Britain. Figure 14: Top ten destinations for tech firms by local authority
Ranking Region Local Authority 1 South East Wokingham 2 South East Rushmoor 3 South East Hart 4 South East Slough 5 South East Mole Valley 6 South East Runnymede 7 South East Windsor and Maidenhead 8 South East Reading 9 South East Woking 10 South East West Berkshire
(In the table above the entries highlighted in green indicates the clusters which are located in the Enterprise M3 LEP area).
6.3 The Enterprise M3 LEP ‘Working for a smarter future: The Enterprise M3 Strategic Economic Plan-2014-2020’ also acknowledges the relatively high concentration of
7 http://www.kpmg.com/UK/en/IssuesAndInsights/ArticlesPublications/Documents/PDF/Market%20Sector/Technology/tech-monitor-uk.pdf

Functional Economic Area Analysis, final report, June 2015 Page 32
knowledge based industries in the LEP area. Figure 15 identifies total employment8 in key technology based sectors in the Enterprise M3 LEP area. The Location Quotient reported is a measure of whether the industry is more strongly represented in the LEP area than in Great Britain as a whole. For those sectors displaying a number greater than 1, this indicates that the industry accounts for a higher share of total employment in the LEP area than in the country as a whole; whilst a figure below 1 indicates the industry is under represented compared to the national average. Figure 15: Total employment in key tech based sectors in the Enterprise M3 LEP area
Employment Concentration (location quotient)
2009 2010 2011 Change 2009-11 (%)
2009 2010 2011
Energy 5,900 6,700 6,600 11.86 1.06 1.18 1.16 Digital Media 23,300 24,800 24,800 6.44 1.57 1.66 1.59 Pharmaceuticals 6,800 6,600 7,200 5.88 1.63 1.44 1.64 Environment 8,800 9,200 9,300 5.68 1.13 1.1 1.07 Defence 3,800 4,000 4,000 5.26 1.64 1.51 1.69 Healthcare 73,300 75,400 76,600 4.50 0.97 0.96 0.99 Computing 35,900 35,300 35,700 -0.56 2.12 1.97 2 Aerospace 5,200 5,000 5,100 -1.92 0.8 0.81 0.84 Professional Services
42,700 41,600 40,700 -4.68 1.16 1.13 1.08
Advanced Engineering
37,700 35,600 33,300 -11.67 1.35 1.3 1.22
Finance 24,600 22,500 20,800 -15.45 0.83 0.76 0.69 Source: Enterprise M3 Strategic Economic Plan, Annex A – Economic Profile, April 2014
6.4 Although 8 out of 11 key technology based sectors have a location quotient greater than 1 and are thus better represented in the local economy compared to the national average, 4 of these 8 sectors have a very high representation with a location quotient greater than 1.5. These four sectors are:
• Computing • Defence • Pharmaceuticals • Digital Media
6.5 In terms of employment, by far the highest employing technology based sector in
2011 was healthcare which was responsible for over 76,000 employees. The next most important sectors in terms of employment in 2011 were professional services, computing and advanced engineering.
6.6 The report highlights that the Enterprise M3 LEP area is the primary Sci-Tech corridor in the UK, an economic asset of national importance, and a global leader in a
8 Total employment is calculated by workforce jobs. This includes employees, self-employed, government trainees and her majesty’s forces.

Functional Economic Area Analysis, final report, June 2015 Page 33
range of sectors and activities which capitalises on the Enterprise M3 LEP area’s industrial strengths and world class research capability.
6.7 Investment is proposed into the LEP’s priority sectors and a set of niche technologies and specialisms which are:
• ICT and digital media • Pharmaceuticals • Aerospace and defence • Professional and business services • 5G telecoms • Satellite technologies • Cyber security • Advanced materials and nano technology • Photonics • Advanced aerospace/automotive manufacturing • Animal health, and • Computer games and entertainment technologies
6.8 There are a number of both public and private research centres within Runnymede
Borough active in these niche technologies and specialisms, including pharmaceuticals, cyber security, animal health and nano technology. Royal Holloway, University of London located in the north of the Borough is a U.K Academic Centre of Excellence in Cyber Security Research, and is home to one of the largest and most established security groups in the world – ICT4D group. This group has climbed to 7th place in a list of the world’s top Science and Technology think tanks and is ranked 1st in the U.K9. The cyber security centre at the university is active in both education and research and cooperates with both Government and industry.
6.9 The priority sectors identified in the Enterprise M3 LEP study are similar to those identified in earlier sector analysis by the former South East England Development Agency (SEEDA). This research identified the following sectors as being critical to the future growth of the South East Economy:
• Advanced Engineering & Marine • ICT, Software & Digital Media • Pharmaceuticals, Life Sciences & Healthcare • Environment & Energy • Aerospace & Defence • Financial & Professional Services
6.10 The following figure (Figure 16) produced for SEEDA using 2010 MINT data shows
the location of the top 100 most strategic businesses in Surrey (by turnover). The biggest clusters of such companies are to be found in the north of the county,
9 University of Pennsylvania/Wharton Business School’s global think tank ranking. This is based on a survey of over 1,100 international experts evaluating a pool of over 6.500 think tanks from 182 countries.

Functional Economic Area Analysis, final report, June 2015 Page 34
especially around Chertsey, Addlestone and Weybridge. These represent the head office locations of some of the largest companies in Europe and the world.
Figure 16: SEEDA Priority Sectors (Top 100 by Turnover)
6.11 Figure 17 below highlights how the service sector dominates employee jobs within Runnymede (almost 90% of all employee jobs). Although public administration accounts for the largest proportion of employee jobs in the Borough (25.2%) the proportion of jobs in this sector is lower in Runnymede than in both the South East and Great Britain. Figure 17 highlights in green those sectors with a higher proportion of employee jobs compared to the South East and Great Britain. Of these sectors, the financial and other business services category account for almost a quarter of all jobs. The dominance of this sector has declined since 2008 however when it made up approximately 35% of all jobs, having previously grown in the decade 1998-2008 by 67%. Runnymede and Surrey as a whole has attracted many large (and small) financial sector businesses from their traditional base in London, by being able to offer good quality but cheaper accommodation, a supply of highly qualified people and good access into London by road and rail.

Functional Economic Area Analysis, final report, June 2015 Page 35
Figure 17: Employee Jobs by Industry Employee Jobs by Industry
Runnymede (Employee Jobs – Number)
Runnymede (%)
South East (%) Great Britain (%)
Primary Services (A-B: agriculture and mining)
0 0.0 0.9 0.9
Energy and Water (D-E)
2,100 4.2 1.0 1.1
Manufacturing (C)
1,300 2.5 6.4 8.5
Construction (F) 2,200 4.4 4.7 4.4 Services (G-S) 45,600 88.9 87.7 85.7 Wholesale and retail, including motor trades (G)
7,300 14.3 17.3 15.9
Transport storage (H)
1,400 2.7 4.1 4.5
Accommodation and food services(I)
2,700 5.3 7.3 7.0
Information and communication (J)
5,700 11.2 6.3 4.0
Financial and other business services(K-N)
12,400 24.1 20.8 21.8
Public admin, education and health (O-Q)
12,900 25.2 26.6 28.0
Other Services (R-S)
3,100 6.1 5.2 4.6
Source: ONS Business Register and Employment Survey (2012)
6.12 It is evident that both the Enterprise M3 LEP sub-region and Runnymede have a strong representation of high technology companies and research facilities. The Borough has an increasing cluster of businesses in the information and communications sector and has witnessed a number of new ICT companies locate in the Borough in recent years.
6.13 The NPPF requirement to plan positively to support the development of clusters is of particular importance to Runnymede, and it is important for the Council to work with neighbouring authorities to plan positively to ensure the supply of employment sites meets the needs of the commercial market and supports the growth of key sectors.

Functional Economic Area Analysis, final report, June 2015 Page 36
CHAPTER 7: RETAIL AND SERVICE MARKETS FOR CONSUMERS AND CATCHMENT AREAS OF CULTURAL FACILITIES
7.1 This chapter seeks to explore retail and service market consumers relevant to Runnymede to see if any notable trends or functional links are observed which may assist in determining the extent of the FEA that Runnymede is located within. At the end of the chapter, the catchment areas of cultural facilities are also briefly considered.
7.2 The Runnymede Retail Study (2009) found that incomes and expenditure had shown strong growth over the preceding 20 years, with retail expenditure (increasing about 4% per annum in real terms between the late 80s and the production of the Retail Study) growing faster than incomes. During the recent recession expenditure dropped, although recent figures show the amount spent in the retail industry in November 2014 increased by 4.3% compared with November 2013 and by 1.2% compared with October 2014.
7.3 Average living standards however have fallen dramatically since the recession, as income growth has failed to keep pace with the rate of inflation. Projections suggest that real median household income in 2013–14 is more than 6% below its pre-crisis peak. This fall in average incomes has largely been driven by declines in real earnings. According to the Office for Budget Responsibility, real earnings are not expected to return to their 2009–10 levels until 2018–19. Further discretionary cuts to benefits and tax credits will put downward pressure on real incomes, particularly for low-income households. Given this, it seems highly unlikely that living standards will recover their pre-crisis levels by 2015–16.
7.4 Income growth over the last 20 years has led to increased car ownership and personal mobility. The Runnymede Retail Study 2009, commented that over the preceding 25 years the number of households having access to one or more cars had increased from about 55% to about 75% nationally and the number with two or more cars has nearly trebled from 11% to 30%. More recently a decrease has been recorded in the number of households in Runnymede that do not have access to a motor vehicle. Specifically between the 2001 Census and 2011 Census, the number of households with no cars or vans fell from 15.20% to 14.71% (2001/2011 Census). The average car availability per household in the Borough was 1.47 in 2011, an increase from 1.46 in the 2001 Census (2001/2011 Census).
7.5 This increased mobility has meant that the overwhelming majority of households have greater choice of shopping destinations. As a result the majority of shoppers are willing, and able, to travel to either centres or specific individual retail outlets that offer the choice they are looking for or best serve their shopping needs.
7.6 In general, increased mobility and affluence has favoured the larger, sub-regional, shopping centres over small centres. These centres have tended to increase in size and importance relative to small centres – particularly for key comparison goods and “big ticket” items. However the Runnymede Retail Study 2009 did suggest that retailing in the larger sub-regional centres and the more attractive, or specialised,

Functional Economic Area Analysis, final report, June 2015 Page 37
smaller centres is changing with a blurring of the distinction between trips made exclusively for shopping and those now being made for leisure. Growth in expenditure on leisure was noted at this time to be outstripping that on retail goods.
7.7 The Runnymede Retail Study 2009 found that a clear pattern emerged for the main towns in Runnymede. Each of the three main towns (Egham, Chertsey and Addlestone) was found to provide for residents’ main food shopping needs but did not provide choice. None of the borough’s main towns were found to be a significant comparison goods shopping destination and considerable expenditure on these goods was found to be lost to other centres, mostly to Staines-upon-Thames, with Woking also seeing significant flows, especially from Addlestone, especially for purchases of clothing and footwear, furniture, carpets and floor coverings, and household textiles and soft furnishings. This supports links noted elsewhere in this report between the southern part of the borough and Woking.
7.8 Addlestone was found to buck the trend slightly by providing a limited offer in some categories, notably electrical goods and china, glass and utensils. Overall, though, it was clear that at this time, the role of the Borough’s town centres was to provide convenience goods shopping and a range of services.
7.9 The Council has recently commissioned Carter Jonas to produce a Town and Local Centres Study for the Borough which will provide an update to the 2009 Runnymede Retail Study. It is anticipated that this Study will be published in July 2015.
7.10 It should be noted that in 2014 permission was granted under RU.14/0435 for a large town centre regeneration scheme in Addlestone town centre. This scheme will include the erection of 213 residential apartments (class C3), a 101 bed hotel (Class C1), 6,966 sqm of retail accommodation (class A1 to A5), a 2,705 sqm cinema, and 445 parking spaces. Work on this scheme is due to commence imminently and is likely to influence shopping patterns in the borough and surrounding area once completed. Less leakage of expenditure for comparison goods and leisure may result, however any change in shopping habits will need to be explored through an updated household survey once this redevelopment scheme is completed and has been in use for a reasonable period of time.
7.11 When considering the catchment area for retail and service markets (as suggested by the PPG for FEA analysis), the retail studies of the boroughs adjoining Runnymede have been consulted. The key findings from this review are summarised in Figure 18 below:

Functional Economic Area Analysis, final report, June 2015 Page 38
Figure 18: Summary of findings from the retail studies of the boroughs adjoining Runnymede
Borough and date of study
Key findings
Spelthorne Retail Study (2004) and draft Retail & Other Town Centre Uses 2015
The 2004 Spelthorne Retail Study notes that the catchment of Staines-upon-Thames for retail purposes includes Addlestone, Egham and Chertsey. The 2004 Study also notes that Spelthorne’s residents use some of the retail facilities in Runnymede, for example, the catchment area for the Tesco store in Addlestone extends into Spelthorne. Overall both the Runnymede (2009) and Spelthorne (2004) Retail Studies show the strong links between these two boroughs. The draft Retail and Other Town Uses Study 2015 also includes almost the whole of Runnymede in its catchment area including the main town of Egham, Chertsey and Addlestone. The household surveys again highlight the links between Spelthorne and Runnymede with Runnymede residents travelling to Staines upon Thames for restaurants, swimming, the cinema and comparison retail in particular.
Woking Town, District and Local Centres Study (2009)
Found that due to retail and leisure patterns not being constrained by administrative boundaries, the study area was wider than the borough boundary. The study area was disaggregated into 11 zones, based on postcodes. In one such zone (zone 6), the majority of the population lived within the administrative area of Runnymede in the southern part of the Borough (area south of the M3 including Addlestone (and its suburbs) and most of Chertsey). The study found that Zone 6 had no dominant centre (supporting the conclusions of the 2009 Runnymede Retail Study). In areas where no dominant centre exists, competition for market share is most intense. In zone 6 Woking, Staines-upon-Thames and Weybridge were found to have a subsidiary influence, having a market share of between 10 and 39%. The Woking study also contains a section on expenditure on leisure. For zone 6 it found that the most popular destinations for restaurants, cafes and bookmakers was Addlestone, whilst Woking was the most popular destination for the theatre, cinema and family entertainment. This supports the strong links noted elsewhere in this report between the southern half of Runnymede and Woking in particular.
Elmbridge Retail Study (2006)
Contained none of Runnymede’s urban areas within its study area and the report did not note strong links between the two

Functional Economic Area Analysis, final report, June 2015 Page 39
boroughs. Indeed it was noted in the report that, ‘as there is unlikely to be highly significant inflow of expenditure from outside the Borough, a study area would be drawn up based on postal districts covering the Borough and a band just outside the Borough boundaries’. The study found that the study area looked towards an external centre; Kingston for a large part of its residents’ comparison retail.
Surrey Heath Retail Study update (2010)
Included only very small parts of Runnymede on the western side of the Borough in the study area (in zone 3). Overall however strong links between the 2 boroughs were not found.
RBWM retail capacity update study (2009)
Includes Virginia Water and parts of Egham and Staines- upon-Thames (including part of Staines-upon-Thames which is located within the administrative boundary of Runnymede) in the study catchment area (zones 2 and 5) showing some links between zone 5 which includes Staines-upon-Thames and Maidenhead, and between zones 2 and 5 and Windsor Town Centre. Clear links were also found between zone 2 (which contains Egham and Virginia Water) and Ascot and Sunningdale District Centres.
7.12 Overall the analysis of retail studies of neighbouring boroughs highlights the strong links between Runnymede, Spelthorne and Woking. Some links with Windsor and Maidenhead (in particular Windsor) were also found. Cultural facilities
7.13 The Council’s Infrastructure Delivery Plan provides an overview of cultural facilities in the Borough. These include a range of open spaces and leisure facilities (such as leisure centres, golf courses, community halls which provide for a range of clubs and activities, tennis courts and sports pitches). The Borough also contains two museums and the 200 seater Caryl Churchill theatre which is located on the Royal Holloway University campus. The theatre is used by the University’s drama department which put on some public performances. The University also has a performance space at the Boilerhouse on campus. There is also a community theatre base in the Magna Carta School. Both of the theatres in the Borough are considered to have a fairly local catchment.
7.14 The Borough does not contain a cinema with the nearest being in Woking (which also
benefits from a theatre), Staines-upon-Thames, and Windsor (which also benefits from a theatre). Kingston (cinema and theatre) and Guildford (theatre and cinema) also contain such facilities, and Guildford also offers a live music venue. The lack of a cinema in the Borough results in Runnymede’s residents travelling outside the Borough to access such facilities. The Addlestone One development which will be completed in 2017 will provide a six screen cinema together with a number of restaurants which will help reduce leakage of leisure expenditure outside the Borough. It is also considered that the majority of residents would travel outside of

Functional Economic Area Analysis, final report, June 2015 Page 40
the Borough for the theatre, given the limited offer within Runnymede. As well as travelling to the theatres in the local area listed earlier in this paragraph, the excellent transport links between the Borough and London also allows residents easy access to the theatres and concert halls in the West End.

Functional Economic Area Analysis, final report, June 2015 Page 41
CHAPTER 8: LOCAL FEA STUDIES-CONCLUSIONS OF PREVIOUS RESEARCH 8.1 Before conclusions are drawn in this report it is considered sensible to review other
FEA analysis carried out in the area surrounding Runnymede to see if there are any findings that are particularly pertinent to this report. It should be noted that a number of the councils in the local area do not appear to have published reports which analyse the extent of the FEAs that they are located in.
Figure 19: Summary of findings in studies which consider the extent of the FEAs in the local area
Report Findings Surrey Heath Functional Economic Area analysis (November 2014)
There is an absolute requirement for Surrey Heath Borough Council to work closely with Rushmoor Borough Council and Hart District Council. These three authorities are the major players in the area covered by the Blackwater Valley commercial property market and need to adopt a co-ordinated approach to bringing forward sites and premises for business. It is recommended that the ‘core authorities’ covering the Blackwater Valley – Rushmoor, Surrey Heath and Hart also include Waverley and Guildford Borough Councils in their process of joint working given the links between these Authority areas and the Blackwater Valley. The Council should also expect to engage with adjacent authorities on the eastern part of the Borough on employment land, retail and leisure issues since the eastern part of the Borough is functionally tied more closely to Woking, Runnymede and Bracknell Forest than to the Blackwater Valley. The report specifically mentions the need to work closely with Runnymede in relation to the proposals for the former DERA site at Chertsey, given the scale of this proposed development and its location straddling the border between the two authorities.
Hart Functional Economic Area Analysis (August 2014)
There is an absolute requirement for Hart District Council to work closely with Rushmoor Borough Council and Surrey Heath Borough Council. These three authorities are the major players in the area covered by the Blackwater Valley commercial property market and need to adopt a co-ordinated approach to bringing forward sites and premises for business. It would be very desirable also to include Waverley Borough Council in this process given that Farnham is functionally part of the Blackwater Valley. There is evidence of growing economic linkages between Hart District and Basingstoke and Deane Borough in terms of commuter flows in both directions. Areas of common interest between Hart and Basingstoke and Deane should be explored.
Rushmoor Functional The report identifies that Rushmoor should approach Hart

Functional Economic Area Analysis, final report, June 2015 Page 42
Economic Area analysis (October 2014)
and Surrey Heath as a priority to produce an up-to-date employment land evidence base to enable holistic planning for the FEA that the Borough is part of. However, it is important that the Council also engages with Guildford Borough Council, Waverley Borough Council and potentially Bracknell Forest Council to establish if there are any key economic issues that need to be addressed cross boundary and whether they consider themselves to be part of the Rushmoor Functional Economic Area.
East Berkshire Local Economic Assessment (August 2011)
Consultants were commissioned to carry out the East Berkshire Local Economic Assessment which encompasses the Slough Borough Council and Royal Borough of Windsor and Maidenhead areas. Rather than explore the extent of the FEA that these boroughs sit within, this document sought to summarise the key issues for East Berkshire and provide a tool for informing strategy for both local authorities and partners. The study found some links between Runnymede and East Berkshire, although East Berkshire was found to have much stronger links with other neighbouring authorities (such as Hillingdon, Wycombe, South Bucks, Wokingham and Bracknell Forest).
Woking Borough Council Development Strategy and Action Plan 2012-2017
States that although Woking will inevitably be competing with its neighbouring local authorities in terms of attracting inward investment, visitors and shoppers, in the wider context of promoting Surrey as an economic destination, partnership working across the other ten authorities and County Council will be essential. In the context of some economic development projects, cross-county working may be applicable. The FEA that Woking is located in is not discussed.
Hounslow Local Economic Assessment update (November 2013 (finalised in January 2014))
Report finds that Hounslow continues to be part of a wider functioning economic area that extends well beyond its boundaries. The borough experiences high levels of in and out commuting. Heathrow remains an important source of employment for Hounslow’s employed residents which results in high levels of out commuting to Hillingdon. Other data contained in the report suggests notable links with Sutton, Ealing, Richmond upon Thames, Spelthorne and central London.
Bracknell Forest Functional Economic Area Study (consulted on in draft form in March 2015)
Based on the various thematic assessments carried out for Bracknell Forest, the core FEA for the authority is concluded to comprise of the Local Authority areas of Wokingham, Surrey Heath, Slough, Windsor & Maidenhead and Reading. These Local Authorities are consistently identified in the draft FEA analysis carried out as having an inter-relationship with Bracknell Forest. The report does acknowledge some links between Bracknell Forest and Runnymede, in particular with the western part of Runnymede being concluded to sit within the same consumer market area as Bracknell Forest.

Functional Economic Area Analysis, final report, June 2015 Page 43
Buckinghamshire Councils: Housing Market Area and Functional Economic Market Area Study-Consultation Draft (January 2015)
Report highlights that Runnymede is located adjacent to a Berkshire FEMA which is comprised of Bracknell, Reading, Slough, West Berkshire, Windsor & Maidenhead and Wokingham, together with South Bucks.
8.2 None of the above studies suggest that Runnymede is located in their FEA, however the Authorities of Surrey Heath, Bracknell Forest and Windsor and Maidenhead suggest some linkages between part of their area and parts of Runnymede Borough.

Functional Economic Area Analysis, final report, June 2015 Page 44
CHAPTER 9: OVERALL CONCLUSIONS AND RECOMMENDATIONS
9.1 This report gathers a wide range of evidence to assist in determining the extent of the FEA that Runnymede Borough is located within. The term ‘functional economic area’ is not defined and this study therefore examines a number of different factors which influence the economic geography of Runnymede and the surrounding area. The key findings of the research can be summarised as follows:
• Runnymede and Spelthorne have been found to sit together in a North West Surrey HMA grouping, however it is acknowledged that there are a series of inter-connected local housing markets in the area surrounding the boroughs which reflects the density of transport networks, both road and rail. Neighbouring boroughs with particular links are identified as Elmbridge, Hounslow and Woking.
• The CBRE South-East Regional Property Market Study and the LEP Commercial Property Market Study present different potential extents for the PMA(s) that Runnymede could be located within. The CBRE study shows two different sub-regional commercial PMAs that Runnymede is located within, which split the Borough into two zones - a northern zone encompassing Egham and Thorpe (heavily influenced by Heathrow airport) and a southern zone encompassing Chertsey and Addlestone (which looks towards Elmbridge and Woking and further afield to Guildford, Redhill, Reigate, and the outer boroughs of south-west London). The Upper M3 area identified in the LEP Commercial Property Market Study (which encompasses the Boroughs of Elmbridge, Spelthorne and Runnymede) presents a more localised PMA for Runnymede. However as the extent of this area was dictated in part by the LEP’s administrative boundary, linkages with Boroughs to the north and east are not considered.
• The functional labour market for Runnymede (where the bulk of the resident population also work within the same area) is relatively large, reflecting in part the density of the transport network, and is considered to include Spelthorne and parts of Woking, Elmbridge, Hounslow and Hillingdon.
• Runnymede in common with the wider sub-region (particularly in the Thames Valley to the north and west of the Borough) has a strong representation of high technology companies and research facilities. The Borough has an increasing cluster of businesses in the information and communications sector and has witnessed a number of new ICT companies locate in the Borough in recent years, particularly in the Egham area to the north.
• The analysis of the Borough’s retail study and those in the surrounding area demonstrates that Runnymede has the strongest links with Woking and Spelthorne Borough Councils. This is perhaps unsurprising given the location of Woking Town Centre and Staines upon Thames Town Centre in these adjoining local authority areas, which are more major regional centres and which provide a significantly greater offering of comparison goods than any of the borough’s town centres. In addition, these larger centres provide a greater range of cultural venues. Some links between parts of the borough and the town and district centres in the Royal Borough of Windsor and Maidenhead

Functional Economic Area Analysis, final report, June 2015 Page 45
have also been found. Bracknell Forest has also identified some links with parts of Runnymede.
9.2 Overall, given the strength of transport links in and out of Runnymede, the above
findings show that the Borough is most likely to sit on the edges of two different FEAs. The northern part of the Borough, in particular the Thorpe and Egham areas are considered to sit within a wider FEA which focusses on Heathrow airport at its centre. The boroughs that Runnymede has the strongest relationships with in this Heathrow centred FEA are Spelthorne, Hounslow and Hillingdon. It is these three authorities that it is recommended that Runnymede engages with as it progresses its economic work. Some links with the Royal Borough of Windsor and Maidenhead have also been found although overall this authority is considered to have stronger links elsewhere and be located in a different FEA to Runnymede. The same can be said for Bracknell Forest.
9.3 The southern parts of the borough, in particular the Addlestone and Chertsey areas are considered to sit on the edge of a South West London/M3/A3 corridor market. Again the extent of this wider FEA is considered to cover a substantial geographical area stretching to Reigate to the south, Croydon to the east and Guildford to the south west. Whilst these areas undoubtedly have some links to Runnymede due to the existing transport network, this report has not identified that Runnymede benefits from any strong links with these authorities. The analysis carried out indicates that in this wider FEA, Runnymede has the strongest links with Woking and Elmbridge and as such it is these authorities that it is also recommended that Runnymede engages with as it progresses its economic work.
9.4 Figure 20 below summaries the economic links between Runnymede and its surrounding boroughs, identified in the analysis. This is supported by the SHMA work and other analysis in this report. Figure 20: Summary of boroughs with key links to Runnymede as identified in this report
Indicator Borough
LEP geography
LEP sub area analysis
HMA analysis
Travel to work analysis/ transport network
Main catchment areas for retail and cultural facilities
Spelthorne Woking Elmbridge Hounslow Hillingdon
9.5 It is acknowledged that there are certain issues relating to employment and the economy which may require the Council to work with other authorities and bodies

Functional Economic Area Analysis, final report, June 2015 Page 46
within both identified FEAs, in addition to those identified in the table above. For example, it is important to note that Runnymede Borough Council actively works with other local authorities across the whole of Surrey County and the Enterprise M3 LEP area as well as Surrey County Council on strategic issues that affect these wider areas. The Council is committed to engaging with these organisations and others found to be important as it progresses its Local Plan.
9.6 There are a number of forthcoming major strategic decisions which are likely to have a significant impact on the sub-region, including the review of the London Plan and the decision of the Davies Review on airport expansion. The Council will monitor such decisions and factor into future economic work as appropriate.
Other links identified in this study
9.7 In addition to the above, given the location of the former DERA site on the western side of the Borough, it is also recommended that the Council engages with Surrey Heath Borough Council on any matters that arise relating to this large employment site. Whilst such discussions are important, it is considered that Surrey Heath Borough Council does not fall within the same FEA as Runnymede. The FEA analysis conducted by Surrey Heath in 2014 supports these findings.
9.8 Although it is considered that the links with Royal Borough of Windsor and Maidenhead and Runnymede are not as strong as those with Spelthorne, Hounslow and Hillingdon, it is considered necessary that the Council engages with RBWM in particular with regard to retail policy, given the links identified. Given the findings of the Bracknell Forest FEA analysis, the Council will also ensure that this Authority is consulted on any future retail work. Engagement with local authorities moving forwards
9.9 The depth and nature of joint working and consultation on economic matters moving forwards will be influenced by the issues being considered and the different timescales that each authority may be working to. In determining who needs to work together, ‘what’, ‘how’ and ‘when’ issues will be relevant. A degree of pragmatism will be required. This report provides the basis for establishing the appetite of potential partners to work with Runnymede Borough Council as part of their economic development work.

Functional Economic Area Analysis, final report, June 2015 Page 47
Appendix 1: List of organisations consulted on draft FEA study (March/April 2015)
Enterprise M3 LEP
Coast to Capital LEP
Thames Valley Berkshire LEP
Bracknell Forest Council
Elmbridge Borough Council
Epsom and Ewell Borough Council
Greater London Authority
Guildford Borough Council
Hart District Council
Homes and Communities Agency
London Borough of Hillingdon
London Borough of Hounslow
London Borough of Richmond upon Thames
Mole Valley District Council
Reigate and Banstead Borough Council
Royal Borough of Kingston upon Thames
Royal Borough of Windsor and Maidenhead
Rushmoor Borough Council
Slough Borough Council
South Bucks District Council
Spelthorne Borough Council
Surrey County Council
Surrey Heath Borough Council
Tandridge District Council
Waverley Borough Council
Woking Borough Council
Runnymede Business Partnership (Steering Group members)

Functional Economic Area Analysis, final report, June 2015 Page 48
Chertsey Chamber of Commerce
Egham Chamber of Commerce
Surrey Chamber
Royal Holloway University of London
Heathrow Airport Ltd

Functional Economic Area Analysis, final report, June 2015 Page 49
Appendix 2: Functional Economic Area Analysis-comments received on draft report and officer responses
Organisation commenting
Summary of comments made Officer response
Surrey Heath Borough Council (SHBC)
1-Page 7 para 2.2 Should there also be reference to DERA and Surrey Heath at this stage 2-Page 10 Para 3.5 refer to Final Report for the SHMA for Hart, Rushmoor and Surrey Heath. This was published in December 2014. 3-Page 19 Para 4.18 May want to explain the term ‘hereditaments’ 4-Page 31 Para 6.2. I think that the consultants do not mean the Meadows Business Park in Blackwater. This is a relatively small business park in Hart. I think they may mean Watchmoor Park which is in Surrey Heath which contains a number of high tech companies, including Bank of America. Please can the consultants check. This may have an impact on the table in figure 14 5-Page 40 Figure 19 Please refer to the Surrey Heath Area Final Report November 2014. Reference should also be made to the fact that it will be important for Runnymede to work closely with Surrey Heath Borough Council in relation to the proposals for the former DERA site
1-as this paragraph only refers to the main settlements that Runnymede Borough is located in close proximity to, it is considered that it is not appropriate to refer to the DERA site in this paragraph although the site is referred to in other places in the document. 2- Officers have updated the text as suggested. 3- Footnote added to explain what this term means. 4-This is data from a 3rd party source (KPMG and Markit). RBC suggests that SHBC takes this up directly with KPMG if they think there is an error. 5-The entry for Surrey Heath in figure 19 has been amended to address the comments made.
Woking Borough Council (WBC)
Acknowledge that Runnymede and Spelthorne form a core functional economic area but with some linkages with Woking. The evidence so far demonstrates that Guilford, Waverley and Woking form a Functional Economic Area. As such RBC’s emerging recommendations are not at odds with what WBC knows from other studies. WBC will work with RBC to strengthen our economic links where necessary and will appreciate it if RBC will continue to consult WBC on this matter, in particular, on how we intend to take the
Support for conclusions noted. RBC welcomes the commitment from Woking Borough Council for further engagement.

Functional Economic Area Analysis, final report, June 2015 Page 50
outcome of the study into practical actions. Peter Sims (Runnymede Business Partnership Steering Group)
1-Para 1.6, 3rd bullet point, delete ‘to’ at end of line 2-Para 1.8, we should include the Runnymede Business Partnership in the list of relevant organisations and possibly Surrey Chambers of Commerce 3-Para 2.4 Procter not Proctor. St. Peter’s should be Ashford & St. Peter’s NHS Foundation Trust 4-Para 4.2 First line of the quote, the word ‘with’ looks wrong. Should it be which or where? 5-Para 4.9 It is the Local Enterprise Partnership, not Economic (2 references) 6-Para 2.5 we compare to the GB average of £520 and in para 4.16 we compare to the England average of £510. To avoid confusion we should probably use the same comparator 7-Paras 5.10 and 5.11 refer to residents commuting. From Figure 8, this should be ‘working’ residents 8-Para 6.5, after ‘in terms’, insert ‘of’ 9-Para 6.9 SEEDA was South East England Development Agency 10-Para 7.5 Higher car ownership gives greater choice of shopping destinations, but also busier roads. Is there evidence that traffic congestion is leading to more local shopping? 11-Para 7.14 Presumably good links to London also allow access to West End theatres and concert halls
Points 1, 2, 3, 4, 5, 7, 8, 9 and 11 have been addressed in the report in line with the comments made. In regard to point 6, paragraph 2.5 has been amended to refer to the England rather than Great Britain average. The data is still different to that shown in para 4.16 which relies on earlier data. This is clarified with a footnote to explain the discrepancy. In regard to point 10, officers are not aware of any evidence that would support the links described at the current time.
Tandridge District Council
No comments to make on contents of report. No response required
Guildford Borough Council (GBC)
1-Agreement with the findings of the report with regards to the strongest economic area links, as summarised at paragraphs 9.2 and 9.3. 2-Agreement with the findings of the report that there are some functional links between Guildford and Runnymede, although it seems that both Councils
1-support for findings noted. 2-Whilst the report recognises that Runnymede does not have strong links with GBC, the report acknowledges that Runnymede sits on the fringes of a wider FEA of which Guildford is part of and as such RBC would wish to be consulted on any

Functional Economic Area Analysis, final report, June 2015 Page 51
agree that although Woking is an adjoining borough to both Guildford and RBC and is within both Council’s functional economic areas, there is no need for Guildford and Runnymede to be directly involved in each other’s employment needs work.
employment evidence produced by Guildford Borough Council as appropriate. RBC will continue to consult GBC at key stages of the development of its employment evidence base as this work is progressed.
Spelthorne Borough Council (SBC)
1-The draft FEA takes account of the relevant factors for determining an FEA as set out in the PPG note on Housing & Economic Needs Assessments. The methodology appears to be consistent with the PPG. 2-the transport network is briefly mentioned in Chapter 5, although it may be useful to add further detail about general rail commute times and major highways other than motorways and where they connect to. 3-SBC concurs with the conclusions drawn in terms of the FEAs that Runnymede sits within based on the analysis of TTWA, the extent of the HMA and retail catchments as set out in the draft assessment. 4-Figure 18 – Reference could be made to the draft Spelthorne Retail & Other Town Centre Uses Study 2015 5-Figure 19 – Reference could be made to the work undertaken so far on the Bucks FEA? 6-Given the links identified between Runnymede and Spelthorne and the wider area it will be important for the two Boroughs to continue to engage with one another (and others) under the DtC. In particular engagement will be required with respect of demand/supply for employment land locally and over the wider FEA as a whole and the role this plays in balancing housing/jobs across HMAs and FEAs.
1-support for methodology noted. 2-additional text has been added into chapter 5 to address this point. 3-support for conclusions drawn noted. 4-additional text added 5-additional text added 6-RBC agrees. Following completion of the FEA analysis work, officers at Runnymede will be identifying the issues/topics where co-operation is required with individual authorities as we move forwards.
Rushmoor Borough Council
Welcome the table summarising the findings of the various FEA studies including the Rushmoor Functional Economic Area analysis report (October 2014) in Figure 19. Request that the following amendments are made:
Amendments made to paragraphs 3.5 and 6.2 as suggested.

Functional Economic Area Analysis, final report, June 2015 Page 52
• Paragraph 3.5 – it would be useful to amend the text to reflect that the final Hart, Rushmoor and Surrey Heath SHMA was published in December 2014.
• Paragraph 6.2 – It would be useful to amend the text to acknowledge that ‘IQ Farnborough’ is now known as ‘Farnborough Business Park’.
Hart District Council Hart has no particular comment to make and, for the purposes of the duty to cooperate, agrees with Runnymede's conclusions at para 9.4 which identifies no specific or direct economic link with Hart. Such a conclusion was also drawn from Hart’s corresponding FEA analysis, as highlighted within our FEA analysis at para 8.1.
Support for conclusions noted
Mole Valley District Council
Having read the document no direct references to the Mole Valley area that would indicate the need to submit formal comments could be identified. The only para of note, 9.3, indicates an area stretching to Reigate and which, by inference, would include parts of Mole Valley. However the para also indicates that these are not strong links. Mole Valley will be preparing it’s own FEA analysis in the near future.
RBC awaits the Mole Valley FEA analysis with interest to see if similar conclusions are drawn regarding the links between Mole Valley and Runnymede.
Elmbridge Borough Council (EBC)
1-Elmbridge Borough Council is currently working together with Epsom & Ewell, Mole Valley, Kingston-upon-Thames and Richmond on a SHMA. This work is due to report in late summer. From a scoping area which covered all Surrey authorities and seven London authorities, initial analysis of data suggested that Elmbridge is part of a wider HMA that includes a number of Surrey authorities bordering London and a number of South West London authorities. 2-The analysis references the LEP geography but does not highlight the location of EM3 Growth and Step up
1-noted. RBC will follow this SHMA work with interest. 2-A paragraph has been added in chapter 4 to highlight the growth and step up towns in the Enterprise M3 LEP area. 3-Additional text has been added into the conclusions chapter (in paragraph 9.6) to address this comment. 4-Officers do not consider than additional analysis in this regard is necessary. 5-Officers can confirm that demand and supply

Functional Economic Area Analysis, final report, June 2015 Page 53
Towns. As the focus of prospective funding this investment could in time have some bearing on the commercial property market locally. 3-The future impact of London could also be considered further, with issues such as possible airport expansion and the impact of the London Plan having the potential to impact on the economic geography of the wider area. 4-Although not strictly an economic function, analysis of the sphere of influence of the hospital within the borough may further reinforce the linkages identified within the report, including the relationship with Elmbridge. 5-The use of commercial agent input provides valuable insight into the commercial property market locally. We assume that future collaborative work would further explore supply and demand issues relating to commercial floorspace within the identified FEA. 6- The table summarising the key links at figure 20 is a very clear way to demonstrate the economic linkages, however the use of shading on alternate lines does make it a little difficult to read. 7- We note and agree with the identified linkages with Elmbridge and are keen to work collaboratively in this area. We are currently starting our own Functional Economic Area analysis, which we will be keen to discuss further with you.
issues will be considered further in its Employment Land Review. The Council will be contacting all Local Authorities identified in the FEA analysis as having notable links with Runnymede to see if there is interest in producing a joint ELR with the Council. Even if a joint ELR is not pursued, consultation with neighbours will still be carried out. 6-Officers agree with the comment made in regard to the shading in this table. The table has been amended accordingly. 7-Support for findings noted. RBC looks forward to engaging with EBC as they progress with their FEA analysis and subsequent employment work.
London Borough of Richmond upon Thames (LBR)
While there is no direct border between RBC and LBR, LBR recognise the wider links identified in the report and support the conclusion to progress economic work with those areas where a stronger relationship is centred. Planning Policy and Economic Development officers therefore have no further detailed comments to raise at this time.
Comments noted.
Royal Borough of Winsor and Maidenhead
RBWM has reviewed the report and notes its contents. RBWM considers that the methodology appears to
Comments noted. The Runnymede Town and Local Centres Study is currently underway and RBC will

Functional Economic Area Analysis, final report, June 2015 Page 54
(RBWM) follow national guidance and requirements. RBWM looks forward to effective and ongoing engagement with Runnymede under the Duty to Cooperate, particularly on the subject of retail policy as identified in the report.
engage with RBWM as this work progresses and beyond the completion of this study, as policies in the new Local Plan start to be formed in relation to retail development.
Surrey County Council We consider this to be a very thorough document that reviews all relevant data and reports and we would support its overall conclusions and recommendations. Following comments made: 1-The analysis carried out in the report is thorough and comprehensive. We support the approach which has been to consider the extent of the FEA by looking at all relevant land uses/indicators including housing, property markets, labour markets, industry clusters and retail/service/cultural facilities as well as reviewing other local FEA studies. 2-We support the recommendation for Runnymede to engage with Spelthorne, Hounslow, Hillingdon, Woking and Elmbridge as it progresses its economic work but also acknowledges that there may be some issues which require the Council to work with other authorities such as Surrey Heath in relation to the DERA site and that it is important that they work with other authorities across the whole of Surrey County and the EM3 LEP area on strategic issues. 3-Para. 9.5 could be strengthened by saying that the ".... Council actively works with other authorities across the whole of Surrey County, the County Council and the EM3 LEP on strategic issues that affect these wider areas."
1-Support for methodology welcomed. 2-Support for recommendations welcomed. 3-Amendment to text made as suggested.
Enterprise M3 LEP 1-Section 4, paragraphs 4.9– 4.12 are intended to give detail of the Enterprise M3 geographical area. I was unclear from paragraphs 4.11 and 4.12 whether the argument was being made that LEPs do not represent
1-The text in this section has been amended to address the comments made and figure 3 amended to provide a better overview of the LEP geography. 2-The text in this paragraph has been updated to

Functional Economic Area Analysis, final report, June 2015 Page 55
FEAs and it was not clear why the quote from Buckinghamshire Thames Valley LEP had been included in this section. The Strategic Economic Plan contains information about the LEP area and it would be helpful if this could be included as part of this section. 2- At section 4.25 the report states that the Enterprise M3 Commercial Property Market Report provides an “up-to-date analysis of the property market”. This report was actually published in April 2013 and based on information from the 12 months before this date and therefore Enterprise M3 is of the view that this report can no longer be considered “up to date”. The LEP will be updating this study over the next year. 3- Section 6.4 makes reference to the location quotients of key technology sectors in the UK. The term “over-represented” that is used in this paragraph could imply that these concentrations are a negative rather than a strength of the local economy and therefore it may be helpful to re-word this paragraph. 4- We support the conclusions of the report made in Section 9 and welcome the recognition of the need to engage widely, including with Enterprise M3, in the preparation of your Local Plan. Although not recognised as part of the FEA, Enterprise M3 is of the view that engagement with Surrey Heath in relation to the strategic DERA site is vital. This site was recognised in the Enterprise M3 Strategic Economic Plan as a key housing and employment site. 5- It would be helpful if the report could be consistent when referencing Enterprise M3, the current draft uses a number of different abbreviations and it would be appreciated if a single approach could be used throughout the report.
address the comments made. 3-The text has been amended in this paragraph to address this point. 4-The Council notes this point but is of the opinion that this is satisfactorily addressed in paragraph 9.7. 5-Amendments have been made throughout the report to address this point.
London Borough of Based on the assessment in the document provided, Support for findings noted. RBC looks forward to

Functional Economic Area Analysis, final report, June 2015 Page 56
Hounslow the Council agrees that there is a small but clear link with Hounslow in terms of inward commuting from Runnymede to jobs within the borough and vice versa. We would therefore welcome continued engagement on economic and employment issues as the work is taken forward.
engaging with the London Borough of Hounslow as it progresses its economic development needs work.

This page has been left intentionally blank

All enquiries about this paper should be directed to:
Policy & Strategy TeamPlanning Business Centre
Runnymede Borough CouncilThe Civic Centre Station RoadAddlestoneSurrey KT15 2AH
Tel 01932 838383
Further copies of this publication can be obtained from the above address, or email: [email protected]
www.runnymede.gov.uk
2015