rupis - investigating the social aspects and …2 declaration of own work i declare that this thesis...
TRANSCRIPT

1
Investigating the social aspects and conservation implications of wild
animal poisoning in Portugal
Joshua Paul Taylor September 2016
A thesis submitted for the partial fulfilment of the requirements for the degree of Master of Science at Imperial College London
Submitted for the MSc in Conservation Science

2
Declaration of Own Work
I declare that this thesis ‘Investigating the social aspects and conservation
implications of wild animal poisoning in Portugal’ is entirely my own work and
that where material could be construed as the work of others, it is fully cited and
referenced, and/or with appropriate acknowledgement given.
Signature:
Name of Student: Joshua Taylor
Name of Supervisors: Dr. Ana Nuno, Dr. Simon Pooley, and Dr. Andrew Knight

3
Contents list
List of acronyms ............................................................................................................................... 5
Personal acknowledgements ....................................................................................................... 6
Abstract ................................................................................................................................................ 7
Introduction ....................................................................................................................................... 9
Methods ............................................................................................................................................ 12
Study area .................................................................................................................................... 12
Site and household selection ................................................................................................ 14
Data collection ........................................................................................................................... 14
Interview protocol ................................................................................................................... 15
Grouping of variables .............................................................................................................. 16
Prevalence estimates .............................................................................................................. 17
Coding of open-ended questions ........................................................................................ 18
Multivariate analysis ............................................................................................................... 18
Results ............................................................................................................................................... 19
Study sample .............................................................................................................................. 19
Prevalence estimates .............................................................................................................. 20
Key descriptive statistics ....................................................................................................... 22
Ordinal regression models .................................................................................................... 22
Additional qualitative information .................................................................................... 25
Cases of poisoning .................................................................................................................... 28

4
Discussion ........................................................................................................................................ 28
Acknowledgements ...................................................................................................................... 33
Literature cited .............................................................................................................................. 34
Supporting Information ............................................................................................................. 38
S1. Pilot feedback ...................................................................................................................... 38
S2. Study area ............................................................................................................................. 39
S3.1 Interview protocol (English) ...................................................................................... 40
S3.2 Interview protocol (Portuguese) .............................................................................. 42
S4. Household sample ............................................................................................................. 44
S5. Sample sociodemographics ........................................................................................... 45
S6. Photos .................................................................................................................................... 46
S7.1 Questionnaire (Eng.)...................................................................................................... 48
S7.2. Questionnaire (Por.) ..................................................................................................... 57
S8 Cards (English) .................................................................................................................... 66
S9. Detailed methods ............................................................................................................... 80
S10. Indices and scores .......................................................................................................... 83
S11. Descriptive statistics ..................................................................................................... 84
S12. Model output .................................................................................................................... 86
S13. Unpublished data ............................................................................................................ 96
5
List of acronyms
AIC: Akaike’s information criterion
ATN: Associação Transumância da Natureza
CWM: Crosswise model
GNR: Guarda Nacional Republicana
ICNF: Instituto da Conservação da Natureza e das Florestas
Palombar: Associação da Conservação da Natureza e do Património Rural
PBC: Perceived Behavioural Control
PSN: Perceived Social Norms
SE: Standard error
SPEA: Sociedade Portuguesa para o Estudo de Aves
TPB: Theory of Planned Behaviour
UCT: Unmatched count technique
Word count: 5999

6
Personal acknowledgements
I would like to thank my two supervisors, Dr Ana Nuno and Dr Simon Pooley, as
well as Dr Andrew Knight for supervising my studies this year. A special thanks
also goes to Julieta Costa, from SPEA, who coordinated all in-country logistics for
the project and facilitated contact with local NGOs in the study area.
I would like to thank my field assistants from ATN: Marisa Almeida dos
Santos, Micael Figueiro, and Alberto Siracusano from Palombar for their
invaluable help during the pilot and data collection collection process. In
addition, many thanks to Silvia Lorga for handling excessive printing and
scanning, and the rest of the staff at ATN for their assistance in developing the
questionnaire and planning the sampling, as well as introducing me to the
nuances of Portuguese cuisine. I would also like to thank Miguel Novoa, Nuno
Martins, Jose Pereira and the rest of the staff from Palombar for facilitating the
research and providing accommodation for the second half of the study.
Many thanks to Alison Fairbrass for access to her UCT cards and some
welcome advice which prepared me for some particular difficulties of fieldwork.
A big thanks to my ConSci companions, especially those who accompanied
me on the long nights in the computer room and to Omar and Josh R. for
providing valuable comments on my thesis drafts. Finally, a heartfelt thanks to
Sole, without whom this journey would’ve been that bit more difficult!
Statement of Own Work: I led study design and data collection for all aspects of
the household surveys, supported by staff from SPEA, ATN and Palombar. Data
on cases of poison use was provided by A. Monteiro from ICNF.
7
Investigating the social aspects and conservation implications of wild
animal poisoning in Portugal
Abstract 1
Conservation regulations rely on compliance to be effective. However, enforcing 2
compliance can be difficult when the targeted illegal behaviours are poorly 3
understood. Illegal poison use is a widespread and harmful practice, often 4
motivated by a desire to kill wild animals or control predator populations, but 5
can lead to non-target species of conservation concern being killed in large 6
numbers. Addressing illegal poison use requires an understanding of the factors 7
that influence personal choice and compliance. However, the social aspects of 8
poison use have received relatively little attention in conservation research. Here 9
I show that illegal poison use can persist despite dominant social norms and 10
attitudes against it. Results suggest that historical efforts to reduce poison use in 11
the region have been effective, however small number of individuals will 12
continue to engage in poisoning behaviour regardless of its illegal status. I 13
propose that this is due to the high costs incurred by people, due to wild animal 14
attacks on livestock and domestic animals. I suggest that a combined approach of 15
education schemes, targeted law enforcement, and community involvement in 16
decision-making within the protected area are required to deter the remaining 17
individuals from using poison. This study provides an example of non-18
compliance in a protected area. The sensitive nature poison use as a subject 19
means that it is not discussed within the community, reducing the effectiveness 20
of household surveys as a research approach. Research targeted at groups more 21
likely to be engaged in the behaviour may improve effectiveness and yield much-22
needed information on motivation and costs incurred. 23

8
Keywords: Illegal behaviour, compliance, poison, Theory of Planned Behaviour. 24
25
Resumo 26
Regulações de conservação dependem do cumprimento das pessoas para ser 27
efectivas. Porém, forçar a obedecer pode ser dificil quando os comportamentos 28
ilegais de interesse são mal entendidos. O uso ilegal de veneno é uma prática bem 29
distribuida e prejudicial, frequentemente motivado por um desejo de matar 30
animais silvestres ou controlar populações de predadores, mas pode resultar em 31
animais não-alvos morrendo em números grandes. Abordar o uso ilegal de veneno 32
precisa entendimento dos fatores que influençam escolhas pessoais e a 33
conformidade. Porém, os aspeitos sociais do uso de veneno receberam 34
relativamente pouca atenção na pesquisa de conservação. Aqui eu mostro que o 35
uso ilegal de veneno pode persistir apesar de normas sociais e attitudes contra ele. 36
Os resultados sugerem que esforços antigos de reduzir o uso de veneno na região 37
foram efectivos, porém números pequenos de individuais continuam fazendo uso 38
ilegal de veneno indiferente do estado ilegal dele. Eu proponho que é devido aos 39
custos altos incorridos por pessoas, pelos ataques de animais selvagens ao gado e 40
animais domésticas. Eu sugero que uma abordagem combinando esquemas de 41
educação, fiscalização de lei, e a inclusão das communidades no processo de tomar 42
decisões do parque são necessários para deter as pessoas remanescentes de usar 43
veneno. Este estudo é um exemplo de não cumprimento em uma área protegida. O 44
sujeito sensível do uso de veneno não é discutido na comunidade, reduzindo a 45
eficácia de inquéritos domiciliares como abordagem de pesquisa. Pesquisa atingido 46
aos grupos que são mais provaveis de estar envolvido no comportamento pode 47
melhorar a eficácia e resultar em mais informação sobre motivação e custos. 48

9
Introduction 49
Conservation interventions are often prompted by unsustainable human 50
behaviour, such as uncontrolled harvesting of species or killing species with 51
already depleted populations. Protected areas are frequently proposed as a 52
solution to illegal behaviour in conservation, introducing new laws and 53
regulations that place restrictions on people’s actions within them. However, 54
resistance to conservation regulations is not uncommon; especially when a 55
protected area is created where people are already present (Holmes 2007). 56
Whether residents comply by these new laws and regulations can depend on 57
numerous factors, such as attitudes and subjective norms (St John et al. 2010). 58
The presence of laws can’t guarantee the absence of the illegal behaviour 59
(Rowcliffe et al. 2004), therefore it is necessary to understand the factors that 60
influence compliance with conservation regulations. 61
General drivers of illegal behaviour in conservation range from economic 62
incentives and lack of knowledge of laws, to tradition and fairness (Keane et al. 63
2008). The deliberate poisoning of wildlife occurs worldwide, and is an example 64
of an illegal behaviour that has proven difficult to control (Mateo-Tomás et al. 65
2012). Poisons are used for retaliatory killings and predator control, particularly 66
in rural areas when game animals or livestock are threatened (Ogada et al. 2012, 67
Redpath et al. 2015). Such poisonings are often in the form of poison-baited 68
carcasses and present a risk to non-target species such as birds of prey and 69
carnivores that are also likely to feed on the poisoned carcasses (Márquez et al. 70
2012). In addition, the application of pesticides and rodenticides can result in 71
secondary poisoning through the consumption of contaminated animals (Ogada 72
et al. 2012). 73

10
The risk presented to non-target species is evident in the observed 74
declines in bird of prey populations worldwide due to poisoning. In Asia, Gyps 75
vultures declined by more than 95% following unintentional poisoning caused 76
by the use of diclofenac to treat livestock, a veterinary drug that has 77
subsequently been outlawed (Ogada et al. 2012). In Europe, illegal persecution of 78
birds of prey through poisoning and shooting has led to EU-wide declines in 79
populations, despite extensive legal protection for these birds in the form of the 80
Birds Directive (BirdLife 2011; Ogada et al. 2012). Though there has been some 81
progress in restricting the use of poison in certain areas such as the UK and 82
Spain, the presence of laws has not been enough to stop the use and impacts of 83
poison use. 84
While there has been a welcome increase in attention given to the social 85
aspects of human behaviour and their conservation implications (St John et al. 86
2010), the social aspects of poisoning have been neglected (Mateo-Tomás et al. 87
2012). Those that have considered the social aspects have focused on assessing 88
the potential linkages between attitudes and behaviours of conservation 89
concern. However, there is evidence that societal norms, such as what peers 90
perceive to be acceptable, are key drivers of human behaviour with a vital role in 91
explaining the feasibility and success of conservation interventions (Jones et al. 92
2008). The Theory of Planned Behaviour (TPB) has been utilised as a framework 93
for determining behavioural intention through examining the roles of attitudes, 94
subjective norms and perceived behavioural control on behavioural intention 95
(Ajzen & Fishbein 1980; Ajzen 1991). It has been used to predict deer hunting 96
behaviour (Shrestha et al. 2012), activities of cattle ranch managers (Willcox et 97

11
al. 2012) and to investigate compliance with wildlife protection laws (Fairbrass 98
et al. 2015). 99
This study adapts and expands an existing framework used to include the 100
effect that legal knowledge of products (i.e. pesticides, herbicides etc. that may 101
be used for poisoning) and motivation (i.e. why poison may be used) have on the 102
root TPB components (Fig. 1). It was not possible to follow the framework 103
through to explore the effect that these components have on behavioural 104
intention, and subsequently behaviour, due a lack of variation in responses to 105
questions on intention. 106
Figure 1. Theory of Planned Behaviour framework, adapted from Fairbrass et al. (2015).

12
This study aims to provide a better understanding of poisoning behaviour 107
by exploring the relationships between attitudes, perceived social norms and 108
perceived behavioural control. Furthermore, it aims to provide 109
recommendations for how laws and regulations within protected areas can be 110
better implemented to prevent the use of poison. This information will be passed 111
on to relevant local and national NGOs to enable more effective conservation 112
implementation and improve relationships between protected area authorities 113
and residents. 114
115
Methods 116
Study area 117
The study area of Douro International Natural Park (Fig. 2, henceforth referred 118
to as ‘the Park’) was set up in 1998 in Portugal’s Trás-os-Montes and Beira 119
regions on the northeastern border with Spain. The area, covering 87,000ha and 120
extending 120km North to South, is one of the most important habitats in the 121
Iberian Peninsula for the endangered Egyptian vulture (Neophron percnopterus), 122
the near-threatened Bonelli’s eagle (Aquila fasciata) and the red kite (Milvus 123
milvus; BirdLife International 2016). Despite their protected status, populations 124
of these species are declining nationally and in the wider EU, in part due to 125
poisoning but also due to poor habitat quality and disturbance (Ogada et al. 126
2012). Poisoning is a problem throughout Portugal and the surrounding 127
Mediterranean region, with historical poison use linked to conflict with wolves 128
(Canis lupus signatus) and foxes (Vulpes vulpes silacea) (Álvares 2003; BirdLife 129
2011; Ogada et al. 2012). 130

13
Figure 2. Map of Parque Natural do Douro Internacional, on the Portuguese-Spanish
border, showing main viewpoints, roads and settlements of Figueira de Castelo Rodrigo,
Freixo de Espada a Cinta, Mogadouro and Miranda do Douro (ICNF 2016).
14
Site and household selection 131
Following a two-week pilot study, villages with <100 residents and those >1hr 132
drive away from where I was based were excluded due to the low chance of 133
sampling success and time constraints (Supporting Information). This left 22 134
suitable villages, 3 in Figueira de Castelo Rodrigo, 3 in Freixo de Espada à Cinta, 8 135
in Mogadouro and 8 in Miranda do Douro, with populations ranging from 141 to 136
2237 (INE 2011). I divided sampling of the park into two stages to facilitate 137
travel and enable collaboration with local NGOs, starting in the south of the park 138
(Figueira and Freixo) and finishing in the north (Mogadouro and Miranda). 139
Participant selection was done through systematic sampling of households in 140
randomly selected villages (Supporting Information). 141
142
Data collection 143
I carried out interviews in 13 villages, 2 in Figueira, 3 in Freixo, 3 in Mogadouro 144
and 5 in Miranda, between the 9th of June and 21st of July. Sampling in the south 145
was carried out over 11 days, and over 12 days in the north. All interviews were 146
carried out in Portuguese by myself and 4 field assistants. 147
Written consent was not required because no personal data or personal 148
identifiers were collected during questionnaire administration. It was made clear 149
that participation was voluntary and that consent was implied from participating 150
in the survey. To protect participants’ privacy and ensure no harm or negative 151
repercussions come to respondents from sharing information about illegal 152
activities, villages are not identifiable by name and participants will remain 153
anonymous (St John et al. 2016). The initial research proposal was passed 154
through and approved by the ethics committee of the Faculty of Natural Sciences, 155

15
Imperial College London. I carried out all work in accordance with the 156
International Society for Ethnobiology’s Code of Ethics (International Society of 157
Ethnobiology 2006). 158
159
Interview protocol 160
Interviews started with an explanation of the study purpose, the interviewers’ 161
student status and an outline of the anonymous, confidential and non-obligatory 162
nature of the questionnaire. At this stage, free, prior and informed consent was 163
gained verbally from participants. Age, gender and any reason for not 164
responding were recorded for non-consenting participants. 165
Consenting respondents were first asked a series of questions on socio-166
demographic information before administering the unmatched count technique 167
(UCT) questions. The UCT is an indirect questioning technique designed to yield 168
prevalence estimates for sensitive behaviours (Nuno & St John 2014). 169
Respondents are shown either a control or treatment card and asked to state 170
how many of those activities, but not which, they have been involved in 171
(Droitcour et al. 1991). Respondents were randomly assigned to either a control 172
or treatment group using a coin toss. The control card had four non-sensitive 173
activities, with the treatment card showing the additional sensitive behaviour 174
(poison use), totalling five activities (Supporting Information). All non-sensitive 175
activities were chosen based on advices from local NGO staff, the aim being to 176
have one very rare and one very common item. 177
The questionnaire included sections on attitudes, perceived behavioural 178
control and perceived social norms in accordance with the TPB framework 179
(Supporting Information). A section on local knowledge covering trends of wild 180

16
animal populations and trends in livestock ownership was added to avoid 181
subject fatigue. These were followed by questions on knowledge of products (e.g. 182
herbicides, rat poison and illegal poison) and their legal status, and a section on 183
possible motivations for the use of poison. Respondents were then presented 184
with a card showing activities of a conservation initiative due to start within the 185
park to evaluate their opinions of the actions and conservation work in general. 186
Finally, respondents were asked a series of direct questions related to their 187
intention to use poison (or not), and their involvement in the use of poison for 188
both wild animals and rats in the past 3 years. Rats were separated conceptually 189
from wild animals due to the expected high prevalence of poison use for rats. 190
Five-point Likert scales were used to investigate the TPB elements, 191
knowledge of local trends in livestock ownership and wild animal populations, 192
motivation, and intention, complemented by a number of open-ended questions 193
to extract more detailed information on barriers to poison use and local actors of 194
nature protection. Laminated A4 cards with the two Likert scales were used to 195
help respondents understand the questions and respond on the appropriate 196
(Supporting Information). 197
198
Grouping of variables 199
Data for all variables were visually assessed for normality before 200
proceeding with the multivariate analysis. Responses were grouped, where 201
appropriate, for several sociodemographic variables due to the low number of 202
respondents in each category. Indices were developed for attitudes, perceived 203
social norms (PSN) and perceived behavioural control (PBC) by averaging the 204
scores from the related questions. 205

17
Higher attitude scores (i.e. “Positive”) indicate that individuals view the 206
use of poison as good or relieving. Higher PSN scores (i.e. “Agree”) indicate how 207
much individuals believe their peers either use or agree with the use of poison, 208
and their expectations for that individual to use poison. Higher PBC scores (i.e. 209
“Neither agree nor disagree”) indicate that individuals were more likely to agree, 210
or not disagree, that there is nothing stopping them from using poison and 211
believe it’s their decision whether to use poison or not. 212
Additionally, a summed score was developed for product legal knowledge 213
where correct responses were given a value of 1 and incorrect responses were 214
given a value of 0, resulting in a summed score ranging from 0 to 6 (Supporting 215
Information). 216
217
Prevalence estimates 218
Prevalence estimates using the UCT were calculated as the difference between 219
the sample means of the control (n=95) and treatment (n=96) group counts. 220
Standard error of the estimates was calculated using Welch’s t-test due to the 221
likelihood of the variance of the error term being different between the two 222
groups. Prevalence estimates through direct questions were calculated as the 223
proportion of individuals who answered ‘Yes’ to the questions ‘Have you used 224
poison to kill wild animals in the past 3 years?’ and ‘Have you used poison to kill 225
rats in the past 3 years?’. Additionally, prevalence estimates were yielded in the 226
same way by using intention as a proxy for behavior. In this case, proportion was 227
calculated by developing a binomial variable where a positive response (i.e. 228
Agree or Strongly agree) to either of the two questions on intention (Supporting 229
Information) resulted in a value of 1, and any other response yielded a value of 0. 230

18
Standard errors for both the direct questions and intention were calculated as SE 231
= sqrt(p(1-p)/n), where p=population proportion and n=sample size. 232
In addition, I was provided with a database of confirmed cases of poison 233
use within the Park and the surrounding area from 1992-2015 (A. Monteiro, 234
unpublished data [see Supporting Information]). 235
236
Coding of open-ended questions 237
I coded the responses to open-ended questions and transcripts of comments 238
supplementary to the structured questionnaire, following an inductive approach 239
(Newing 2011). This resulted in the following codes of themes for the 240
supplementary comments: animal, poison, park, nature, community, and 241
research. 242
243
Multivariate analysis 244
Due to the lack of variation in the responses to the UCT questions, direct 245
questions and questions on intention, no reliable estimates were provided (Fig. 246
3). Therefore, I excluded these variables from further analysis and could not 247
explore links to intention within the TPB framework. Subsequently, to explore 248
the relationships between the fundamentals of the TPB framework, I developed 249
three models with indices for each of attitudes, perceived social norms and 250
perceived behavioural control as the outcome variables. 251
I used multivariate analysis to identify key factors that would potentially 252
influence the model outcome variables. Key sociodemographic variables, 253
variables from the motivation section (i.e. likelihood of poison being used to 254

19
control predators, control weeds, kill stray dogs etc.) and the product score were 255
used as predictor variables in the statistical model. 256
I chose ordinal regression to account for the ordinal nature of the 257
outcome variables without making assumptions about distances between 258
categories. I used the ‘ordinal’ package v.2015.6-28 (Christensen 2015) in 259
RStudio version 0.99.903 (RStudio Team 2015) to develop the global model and 260
perform ordinal regression on those variables judged to potentially influence 261
attitudes towards poison use. Parameter estimates were averaged across models 262
with ΔAIC <4 because ΔAIC ≥4 indicates considerably less support for the 263
alternative model (Burnham & Anderson, 2002). I used the MuMIn package 264
v.1.15.6 (Bartón 2016) to select and rank the most parsimonious models, and to 265
provide model-averaged coefficients for all predictor variables. Relative variable 266
importance was calculated by summing the Akaike weights (wi) for each model 267
in which that variable appears. 268
269
Results 270
Study sample 271
A total of 1960 households were visited across 13 locations during the study, 272
ranging from 63 to 323 households per village (Supporting Information). Due to 273
a high rate of abandonment within study locations, 343 individuals were 274
encountered, of which 150 refused to participate (non-response rate = 43.7%), 275
leaving a total of 193 respondents (Supporting Information). We collected 276
gender data for 338 of the 343 individuals, with a total of 238 women (70.4%) 277
and 100 men (29.6%). Of the 238 women encountered, 111 refused to 278
participate (46.6%), and 34 of the 100 men refused (34.0%). Key reasons for 279
20
refusal (n=142, 94.6%) included not having time (n=54, 38.0%), not wanting to 280
participate (n=44, 31.0%) and not knowing about the subject (n=26, 18.3%). 281
Survey respondent refusals did not differ by age group (χ2 = 5.782, df = 3, p = 282
0.123) or village (χ2 = 6.998, df = 12, p = 0.858), but did differ by gender (χ2 = 283
4.592, df = 1, p = 0.032). This suggests that women were more likely to refuse to 284
participate. Of the 193 respondents, the majority were over 65 years old (55%) 285
and female (65.8%). In addition, most respondents had either primary school or 286
no formal education (55.9%). 287
288
Prevalence estimates 289
The unmatched count technique (UCT) produced an unrealistic negative 290
estimate of prevalence use, however the estimate overlaps with zero due to the 291
large standard error (SE) and is therefore inconclusive (Fig. 3). There were no 292
positive responses to the direct question regarding the use of poison to kill wild 293
animals, producing a prevalence estimate of zero. The direct question prevalence 294
estimate for the use of poison to kill rats was 56% (3.6 SE). Intention to use 295
poison, calculated as a proxy for poison use, produced prevalence estimates of 296
6% (1.8 SE). 297
Supplementary information was provided through comments made 298
related to poison from key respondents, including the use of herbicides and rat 299
poison (n=35). The majority of these comments related to the use of poison by 300

21
Figure 3. Percentage prevalence estimates of the use of poison to kill wild animals using
the unmatched count technique (UCT, N= 191) and direct questioning (DQ: Wild
animals, N= 188). Prevalence estimates of the use of poison to kill rats, from direct
questioning (DQ: Rats, N= 188), and intention to use poison (N=188) are also presented.
Standard error bars are included for each estimate.
people, whether personal use, use by others or general use (n=26, 74.3%). While 301
no individuals said that they always agreed with the use of poison, 7 comments 302
were made indicating that poison use could be acceptable under certain 303
circumstances, 4 of which were specific to wild animals. Reasons for these 4 304
were that it depended on the animal, and that if they owned cattle then poison 305
use may not be bad; one respondent stated “If it were wolves I prefer to kill 306
22
them”’. In contrast, 6 comments indicated that those individuals did not agree 307
with the use of poison. 308
309
Key descriptive statistics 310
Most respondents had negative attitudes towards poisoning (n=154, 80.6%), 311
disagreed that there was nothing stopping them from using poison (n=161, 312
84.3%) and disagreed that others expected them to use poison (n=165, 86.4%). 313
The most probable motivation for poison use, apart from for rats and weeds, was 314
to kill a problem animal (n=42, 22.5%). The least probable motivation was to 315
control bird of prey populations (n=14, 0.074%) (Supporting Information). 316
317
Ordinal regression models 318
The most important parameters from the averaged ordinal regressions models 319
were classified as those with a relative variable importance (RVI) of >0.4 (Table 320
1), with models variations and corresponding predictor variables not shown 321
here (Supporting Information). Possession of a hunting license was not included 322
in the models due to very high correlation with gender (>0.9). 323
Individuals with positive attitudes towards poison were more likely to 324
express relatively greater PBC (RVI= 0.82, estimate= 2.17, 2.5-97-5% CIs= 0.93-325
4.37), the same for individuals whose higher PSN scores indicated that they 326
believe their peers agree with poison use (RVI= 0.57, estimate= 1.92, 2.5-97.5% 327
CIs= 0.52-6.22). Similarly, individuals that had greater PBC scores were more 328
likely to have positive attitudes towards poison (RVI= 0.77, estimate= 1.51, 2.5-329
97-5% CIs= 0.48-3.51) and have higher PSN scores (RVI= 0.9, estimate= 2.18, 330
2.5-97-5% CIs= 0.66-4.17). 331

23
Table 1. Averaged parameters obtained from ordinal regression models of attitudes, perceived social norms (PSN) and perceived behavioural
control (PBC). Estimates, standard errors (SE), z-values, relative variable importance (RVI), and lower and upper confidence intervals (CI) are
provided for each parameter in the averaged sets of models. Variables with RVI <0.4 were excluded.
Model
Parameter Estimate SE z value
CI 2.5%
CI 97.5%
Relative variable importance
Attitude
Intercept Very negative | Negative -1.15 1.20 0.95 -3.50 1.21 -
Negative | Neither 1.62 1.21 1.34 -0.75 4.00
Neither | Positive 3.88 1.26 3.05 1.39 6.37
Are there barriers to using
poison in the park Yes -1.41 0.35 3.96 -2.11 -0.71 1
No REF1 - - - -
PBC index Disagree 1.06 0.81 1.30 0.08 2.67 0.77
Neither 1.51 1.04 1.44 0.48 3.41
Strongly disagree REF1 - - - -
Occupation Housewife -0.02 0.35 0.07 -0.98 0.89 0.54
Other -0.62 0.69 0.89 -2.21 -0.09
Retired -0.31 0.44 0.70 -1.46 0.32
Farmer REF1 - - - -
Perceived Social Norms
Intercept Strongly disagree | Disagree -3.06 1.34 2.27 -5.70 -0.41 -
Disagree | Neither 1.70 1.37 1.23 -1.00 4.40
Neither | Agree 4.59 1.46 3.14 1.73 7.46
Knowledge score -0.43 0.17 2.45 -0.75 -0.14 0.96
PBC index Disagree 1.40 0.90 1.56 -0.03 3.15 0.9

24
Neither 2.18 1.11 1.95 0.66 4.17
Strongly disagree REF1 - - - -
Are there barriers to using
poison in the park Yes -0.35 0.42 0.82 -1.39 0.13 0.56
No REF1 - - - -
Size Town or city 0.21 0.37 0.57 -0.31 1.36 0.41
Village REF1 - - - -
Perceived Behavioural Control
Intercept Strongly disagree | Disagree -0.75 1.86 0.40 -4.41 2.91 -
Disagree | Neither 3.81 1.98 1.92 -0.09 7.70
Attitude index Negative 0.63 0.57 0.57 -0.30 1.83 0.82
Neither 0.66 0.63 0.63 -0.40 2.00
Positive 2.17 1.29 1.30 0.93 4.37
Very negative REF1 - - - -
PSN index Disagree 0.94 1.16 0.81 -0.49 3.79 0.57
Neither 1.32 1.44 0.91 0.05 4.59
Agree 1.92 1.99 0.96 0.52 6.22
Strongly disagree REF1 - - - -
Importance of others’ opinions A little -0.29 0.86 0.34 -2.95 1.69 0.46
More or less 0.67 1.04 0.64 -0.70 3.62
Quite 0.81 1.10 0.73 -0.18 3.71
Very 0.49 0.85 0.58 -0.83 2.98
Don’t know 1.33 1.89 0.70 -0.63 6.44
Not at all REF1 - - - -
Knowledge score 0.08 0.15 0.57 -0.13 0.53 0.41 1. Reference level for that parameter

25
The belief that there are no barriers (physical or legal) to using poison in 332
the Park was an important predictor for positive attitudes towards poison use 333
(RVI= 1, estimate= -1.41, 2.5-97-5% CIs= -2.11--0.71), while also being a 334
predictor of higher PSN index, but at a less important (RVI= 0.56) and non-335
significant level. Individuals with a non-pre-defined employment (“Other”, i.e. 336
not a farmer, housewife or retired) were more likely to express negative 337
attitudes towards poison (RVI= 0.54, estimate= -0.62, 2.5-97.5 CI= -2.21—0.09). 338
Individuals with low knowledge scores of poison products were more 339
likely to have a higher PSN index score (RVI= 0.96, estimate= -0.43, 2.5-97.5 CI= -340
0.75—0.14). Knowledge score was also somewhat important in predicting PBC 341
scores (RVI= 0.41) but with no significant directional effect. Similarly, size of 342
town or city was a somewhat important predictor of PSN scores (RVI= 0.41), as 343
was the importance of others’ opinions for PBC scores (RVI= 0.46); however, 344
neither variable showed a significant directional effect. 345
Municipality, gender, age, livestock ownership, attitudes towards 346
fertilizer use, and all variables concerning motivations were included in the 347
averaged models but had low relative importance (<0.4; Supporting 348
Information). 349
350
Additional qualitative information 351
Comments were selected from 19 respondents based on the detail and relevance 352
of their additional comments outside of the structured questions, as well as their 353
honesty as perceived by the interviewers. Transcriptions of comments were 354
coded and 127 subjects were identified across 7 themes and 86 sub-themes, with 355
the most prevalent themes extracted and summarised (Table 2). Less prevalent 356

26
themes were related to the community (n=6), the research (n=2) and 357
environmental organizations (n=2). 358
Animal-focused comments were the most frequent (n=43, 33.8%), 359
covering wolves, foxes, birds of prey, domestic animals and livestock. Wolves 360
were the most frequently mentioned species in relation to both targeting (n=8) 361
and attacks (n=4). One respondent in a northern village explained that 3 years 362
ago a neighbour lost several calves to a wolf attack, so he began searching for a 363
method of eliminating the wolves even though it was illegal. This respondent 364
openly expressed his negative views of poison use, so found an alternative means 365
through bear traps. 366
Attitudes towards wild animals were mostly negative (n=6, 60%), the 367
most common reason given was that they cause harm (n=4). Two comments 368
specifically mentioned birds of prey, stating that they cause harm and are bad for 369
hunters because they harm rabbits and partridges (common game animals). 370
Another respondent highlighted the risks of birds of prey attacking chickens, 371
pointing out a bird of prey that was circling a chicken coop during the interview. 372
However, positive attitudes (n=3) were based on the beliefs that wild animals 373
have a right to live, don’t cause harm and actually provide a service through 374
maintaining a clean environment (i.e. vultures). 375
The Park was also mentioned frequently (n=26, 22.8%), with respondents 376
openly expressing their attitudes towards the Park, both positive (n=2) and 377
negative (n=6), and the restrictions (n=9) and actions (n=6) implemented. 378
Respondents with negative attitudes towards the park stated how the park 379

27
Table 2. Main themes extracted from additional comments made by key respondents (n=19) from 10 villages, with descriptions and examples. The
main themes were related to animals (n=43), poison (n=35), the park (n=26), and nature (n=13).
Theme Subject Definition and examples Frequency Details
Animals Targeting Cases where animals have been targeted by people for either removal or
elimination, e.g. by hunting, poisoning, bear traps, contacting the vet or dog
kennel
14 Wolf = 8, Bird of prey = 3,
Fox = 2, Other = 3
Attitudes Respondents expressed either negative or positive feelings towards wild
animals, e.g. birds of prey only do harm, they are not good for the hunters
10 Negative = 6
Positive = 3
Balanced = 1
Populations Indications that populations of animals have either increased or decreased,
e.g. rabbits, partridge, wild boar, wolves, foxes, wild goats, and livestock
9 Increase = 3
Decrease = 7
Attacks Cases where wild animals have attacked domestic animals, e.g. reports that
a villager lost 30 sheep in a wolf attack 3 years ago
5 Wolf = 4
Fox = 1
Poison Consequences Cases where animals or people have come to physical harm through contact
with poison, or where legal consequences were highlighted, e.g. a family
was killed over 30 years ago by consuming a potent poison (People)
6 Animals = 4
People = 1
Legal = 1
Park Attitudes The expression of positive or negative feelings towards the natural park.
Given reasons: ‘No communication’ and ‘They do nothing’
8 Positive = 2
Negative = 6
Restrictions Mentioning specific restrictions implemented by the park authorities upon
the residents, e.g. cutting firewood, constructing houses, maintaining land
9 Cutting firewood = 3
Construction = 3
Actions The mentioning of actions (real or perceived) performed by park staff, or
the defense of park actions
6 Introduction of animals = 4
Actions misunderstood = 2
Nature Protection Statements around the protection of nature, e.g. should be done for birds of
prey (n=1), by villagers (n=1), by other people (n=1), conditionally (n=1), or
necessary (n=1)
7

28
shouldn’t exist (n=3), that it doesn’t communicate well with residents, and that it 380
does nothing (n=1). The most common restrictions cited were not being able to 381
cut firewood (n=3) or construct houses (n=3), as well as limits on the levels of 382
trees (n=1) and how to maintain one’s land (n=1). All but one reference to Park 383
restrictions were associated with negative attitudes towards the Park. All 384
references to specific actions by the Park were about the introduction of animals 385
into the area (n=4), such as wolves and snakes, whereas two respondents stated 386
that the Park’s actions were misunderstood (n=2). Three respondents also spoke 387
of having unmet expectations of the Park. 388
Comments were also made about the need to protect nature (n=7) and the 389
risk of fire in the area (n=3). One respondent mentioned environmental 390
organisations, stating that they are uninformed as only the villagers know how to 391
protect nature, and that the organizations were partially responsible for the fires 392
that occurred in the area. 393
394
Cases of poisoning 395
There were 42 cases of poison use in the Park and surrounding area between 396
1992 and 2015, with 10 confirmed by laboratory testing. Cases involved birds of 397
prey (n=17, 40.5%), dogs (n=15, 35.7%), foxes (n=8, 19.0%), 1 magpie (2.4%) 398
and 1 crow (2.4%). The number of animals involved ranged from 1 to 13 399
(Supporting Information). 400
401
Discussion 402
Addressing illegal behaviours requires understanding of the factors that 403
influence compliance with laws and regulations. I used household surveys to 404

29
investigate the poisoning of animals in Douro International Natural Park, 405
Portugal. I investigated the socio-psychological aspects of poisoning: attitudes, 406
perceived social norms (PSN) and perceived behavioural control (PBC), and used 407
a combination of direct and indirect questioning techniques to produce estimates 408
for prevalence of poison use in this region. 409
The use of poison is a sensitive topic in the study area and one that is not 410
commonly discussed among residents, as often mentioned by respondents. 411
Furthermore, one respondent said that if they knew of someone who used 412
poison, they wouldn’t tell us (the researchers). One frequent difficulty during 413
surveying was that participants often preferred to respond while in their 414
doorways, where passing neighbours could listen and interact. This introduced 415
social desirability bias where respondents were influenced by the presence and 416
suggestions of their peers (Nuno & St John 2014). 417
The unmatched count technique (UCT) was used to try and overcome the 418
sensitive subject nature, however prevalence estimates from the UCT were 419
inconclusive due to a large standard error (SE). This suggests that poison use 420
occurs at very low prevalence within the study sample. This suspicion is 421
supported by the lack of positive responses to direct questioning about poison 422
use, and the predominantly negative attitudes expressed towards poison. 423
However, carcasses collected by park staff show that infrequent poisoning 424
persists throughout the park and surrounding area. Low prevalence and high 425
sensitivity make it difficult to accurately assess the prevalence of poison use 426
using direct questioning or the UCT in this context, similar to previous work in 427
Portugal (Fairbrass et al. 2015). Therefore, this context may provide an 428
30
opportunity to trial an alternative indirect questioning technique in the future 429
(Nuno & St John 2014). 430
The Theory of Planned Behaviour (TPB) models indicate that perceived 431
behavioural control (PBC) and attitudes positively affect each other, whereas 432
perceived social norms (PSN) positively influences PBC. This suggests that PBC 433
may play a key role in whether an individual is willing to engage in poisoning 434
behaviour, with perceived approval from peers and a positive attitude towards 435
poisoning increasing the likelihood of using poison to kill wild animals. The link 436
between a belief in the existence of barriers against poisoning within the park 437
and negative attitudes towards poisoning suggests that an awareness of the risks 438
of poison use makes it less attractive. Application of the TPB framework in this 439
study was limited by an inability to examine behavioural intention, and therefore 440
behaviour (Fig. 1). Therefore, I suggest future research in this field implements a 441
framework based on both perceptions and attitudes, not the TPB, with research 442
focused on the target groups i.e. hunters and farmers, via a combined approach 443
of focus groups and surveys. Understanding the who, what, where, when and 444
why of noncompliance in this context need to be addressed to enable more 445
effective conservation strategies in the future (Arias 2015). 446
The high prevalence of poison use for rats (>50%) suggests a mental 447
dichotomy between the use of poison to kill rats and other animals. In addition, 448
the use of products to control agricultural pests, considered as poisons in this 449
context, was often viewed as potentially harmful to people and animals but 450
necessary to manage pests and maintain productive livelihoods. The legal use of 451
these products is common, despite their purchase and use being regulated. 452
Individuals with poor legal product knowledge were more likely to believe that 453

31
their peers approved of poisoning, suggesting that a lack of awareness of the 454
potential legal consequences may affect their view of poisoning. Conservation 455
managers could focus on carefully considered and collaborative education 456
programmes to address this lack of common knowledge and awareness, and 457
minimize the unnecessary use products that can poison non-target animals 458
(Leisher et al. 2012). 459
Predominantly negative attitudes towards poison use, and a general 460
awareness of the illegal status of poisoning suggests that historical efforts to 461
reduce poison use in the area have been effective. However, respondents’ 462
comments indicate that a small number of individuals are likely to engage in 463
poisoning irrespective of its illegality. This may be due to the high costs incurred 464
through livestock losses from animal attacks. Therefore, education and increased 465
awareness may not be enough on its own, with more effective and targeted 466
enforcement providing an effective complimentary mitigation measure. I support 467
a joint approach being taken between local and national NGOs and the Guarda 468
Nacional Republicana (GNR, National Republican Guard), involving canine 469
patrols to detect and deter the use of poison in the Park. 470
The topic of poison use frequently led respondents to express their 471
negative attitudes towards wild animals, especially wolves and foxes. Historical 472
conflict and targeting of wolves (Álvares 2003) were evident, with wolf attacks 473
on livestock still a reality in some villages. Attitudes towards birds of prey varied 474
depending on the respondents’ priorities, with comments suggesting that close 475
ties to hunting and domestic animals were linked to negative attitudes, and ties 476
to tourism were linked to positive attitudes. Nonetheless, despite the negative 477
attitudes, most of those respondents were aware of the risks of using poison or 478

32
any other means to kill these animals, with some stating that it could be worse 479
than killing a person due to the severe and rapid legal consequences. There is 480
currently a scheme to compensate for wolf attacks, however one resident stated 481
that it didn’t work as authorities treated wolf attacks as dog attacks. 482
Compliance with regulations may be undermined by negative views 483
towards the Park, often founded on restrictions implemented or perceived 484
actions taken by the park authorities. For example, there were suggestions that 485
park authorities transport snakes on a plane for distribution throughout the 486
protected area, or that they re-introduce wolves. Similar reports have been 487
heard by NGO staff working in the area (J. Costa personal communication 2016), 488
though the park authorities insist they do not introduce any animals to the area 489
(A. Monteiro personal communication 2016). These misunderstandings could be 490
due to poor communication by park authorities, or could be fueled by an 491
underlying resentment of the changes introduced by an external authority into 492
an already populated region. Importantly, these negative views of the Park and 493
its work, well-founded or not, are likely to inhibit conservation efforts in the 494
area. Including resource users in the rule formation process has been shown to 495
affect compliance with conservation regulations (Pollnac et al. 2010). 496
Therefore, improved communication efforts by park authorities and 497
organisations working in the area may improve relationships and understanding 498
with park residents. This could be in the form of annual meetings with 499
neighbourhood committees, which represent the views and needs of residents 500
and landowners. Local NGOs with good local relations could partner with park 501
authorities to pioneer this in the villages where they work. 502

33
This research suggests that poison use persists at low prevalence in the study 503
area, though further research is needed given limitations of the methods 504
employed. Future research should focus on identifying those most likely to 505
engage in poisoning and addressing the reasons behind their non-compliance. I 506
suggest that low prevalence poison use can be addressed through a combined 507
approach of collaborative education programmes, targeted law enforcement, and 508
the establishment of neighbourhood committees to include residents in the 509
decision-making process of the Park. 510
Acknowledgements 511
Thanks to all staff from SPEA, ATN and Palombar for their invaluable assistance 512
in the planning and implementation of this study. Thanks to Dr Ana Nuno, Dr 513
Simon Pooley and Julieta Costa for providing invaluable advice. Further thanks to 514
SPEA and Imperial College London for funding this work. 515
Supporting Information 516
Pilot feedback (S1), study area (S2), interview protocol (S3), household sample 517
(S4), photos (S6), questionnaires (S7), cards (S8), detailed methods (S9), indices 518
and scores (S10), descriptive statistics (S11), model output (S12), and 519
unpublished data (S13) are available. The author is solely responsible for the 520
content and functionality of these materials. Queries (other than absence of the 521
material) should be directed to the corresponding author. 522
34
Literature cited 523
Ajzen I. 1991. The theory of planned behavior. Orgnizational Behavior and Human 524
Decision Processes 50:179–211. 525
Ajzen I, Fishbein M. 1969. The prediction of behavioral intentions in a choice 526
situation. Journal of Experimental Social Psychology 5:400–416. 527
Álvares F. 2003. A Problemática dos Venenos na Conservação do Lobo e o seu 528
Impacto na Biodiversidade dos Ecossistemas:17. 529
Arias A. 2015. Understanding and managing compliance in the nature conservation 530
context. Journal of Environmental Management 153:134–143. Elsevier Ltd. 531
Bartoń, K. 2016. MuMIn: Multi-Model Inference. R package version 1.15.6. 532
https://CRAN.R-project.org/package=MuMIn 533
BirdLife. 2011. Review of the Illegal Killing and Trapping of Birds in Europe. Paper 534
presented at the European Conference on Illegal Killing of Birds, Larnaca, 535
Cyprus 536
BirdLife International. 2016. IUCN Red List for birds. Available from 537
http://www.birdlife.org (accessed April 2016). 538
Burnham KP, Anderson DR. 2002. Model selection and multimodel inference: a 539
practical information-theoretic approach, 2nd edn. Springer, New York 540
Christensen, RHB. 2015. ordinal - Regression Models for Ordinal Data. R package 541
version 2015.6-28. http://www.cran.r-project.org/package=ordinal/ 542
Droitcour J, Caspar RA, Hubbard ML, Parsley TL, Visscher W, Ezzati TM. 1991. The 543
item count technique as a method of indirect questioning: a review of its 544
development and a case study application. Pages 185–210 in Biemer PP, 545
Groves RM, Lyberg LE, Mathiowetz NA, Sudman S, editors. Measurement 546
errors in surveys. John Wiley, New York. 547

35
Fairbrass A, Nuno A, Bunnefeld N, Milner-Gulland EJ. 2016. Investigating 548
determinants of compliance with wildlife protection laws: bird persecution 549
in Portugal. European Journal of Wildlife Research 62:93–101. 550
Gavin MC, Solomon JN, Blank SG. 2010. Measuring and monitoring illegal use of 551
natural resources. Conservation Biology 24:89–100. 552
Holmes G. 2007. Protection, Politics and Protest: Understanding Resistance to 553
Conservation. Conservation and Society 5:184–201. 554
ICNF. 2016. Parque Natural do Douro Internacional – Classificação. Instituto da 555
Conservação da Natureza e das Florestas, Lisbon, Portugal. Available from 556
http://www.icnf.pt/portal/ap/p-nat/pndi/class-carac#map (accessed 557
August 2016) 558
INE. 2011. Censos 2011. Resultados definitivos: Portugal. Instituto Nacional de 559
Estatística, Lisbon, Portugal. Available from 560
http://censos.ine.pt/xportal/xmain?xpgid=censos2011_apresentacao&xpid561
=CENSOS (accessed May 2016) 562
International Society of Ethnobiology. 2006. International Society of Ethnobiology 563
Code of Ethics (with 2008 additions). http://ethnobiology.net/code-of-564
ethics/ 565
Jones JPG, Andriamarovololona MM, Hockley N. 2008. The importance of taboos 566
and social norms to conservation in Madagascar. Conservation Biology: the 567
journal of the Society for Conservation Biology 22:976–86. 568
Keane a., Jones JPG, Edwards-Jones G, Milner-Gulland EJ. 2008. The sleeping 569
policeman: understanding issues of enforcement and compliance in 570
conservation. Animal Conservation 11:75–82. 571

36
Leisher C et al. 2012. Measuring the benefits and costs of community education and 572
outreach in marine protected areas. Marine Policy 36:1005–1011. 573
Márquez C, Vargas JM, Villafuerte R, Fa JE. 2013. Understanding the propensity of 574
wild predators to illegal poison baiting. Animal Conservation 16:118–129. 575
Mateo-Tomás P, Olea PP, Sánchez-Barbudo IS, Mateo R. 2012. Alleviating human-576
wildlife conflicts: Identifying the causes and mapping the risk of illegal 577
poisoning of wild fauna. Journal of Applied Ecology 49:376–385. 578
Nuno A, St. John FA V. 2014. How to ask sensitive questions in conservation: A 579
review of specialized questioning techniques. Biological Conservation 580
189:5–15. Elsevier Ltd. 581
Ogada DL, Keesing F, Virani MZ. 2012. Dropping dead: Causes and consequences of 582
vulture population declines worldwide. Annals of the New York Academy of 583
Sciences 1249:57–71. 584
Pollnac R, Christie P, Cinner JE, Dalton T, Daw TM, Forrester GE, Graham N a J, 585
McClanahan TR. 2010. Marine reserves as linked social-ecological systems. 586
Proceedings of the National Academy of Sciences of the United States of 587
America 107:18262–18265. 588
Redpath SM, Gutierrez RJ, Wood KA, Sidaway R, Young JC. 2015. An introduction to 589
conservation conflicts. Conflicts in Conservation: Navigating Towards 590
Solutions. 591
Rowcliffe JM, de Merode E, Cowlishaw G. 2004. Do Wildlife Laws Work? Species 592
Protection and the Application of a Prey Choice Model to Poaching 593
Decisions. Proceedings. Biological sciences / The Royal Society 271:2631–594
2636. 595

37
RStudio Team (2015). RStudio: Integrated Development for R. RStudio, Inc., Boston, 596
MA URL http://www.rstudio.com/. 597
Shrestha SK, Burns RC, Pierskalla CD, Selin S. 2012. Predicting Deer Hunting 598
Intentions Using the Theory of Planned Behavior: A Survey of Oregon Big 599
Game Hunters. Human Dimensions of Wildlife 17:129–140. 600
St John F a V, Edwards-Jones G, Jones JPG, A Moloney K. 2010. Conservation and 601
human behaviour: lessons from social psychology. Wildlife Research 602
37:658–667. 603
St John FA V, Brockington D, Bunnefeld N, Duffy R, Homewood K, Jones JPG, Keane 604
AM, Milner-Gulland EJ, Nuno A, Razafimanahaka JH. 2016. Research ethics: 605
Assuring anonymity at the individual level may not be sufficient to protect 606
research participants from harm. Biological Conservation 196:208–209. 607
Willcox AS, Giuliano WM, Monroe MC. 2012. Predicting Cattle Rancher Wildlife 608
Management Activities: An Application of the Theory of Planned Behavior. 609
Human Dimensions of Wildlife 17:159–173. 610

38
Supporting Information
S1. Pilot feedback
The pilot study was carried out during the period from 28/05/2016 until 07/06/2016,
with two teams consisting of the author and three field assistants (S. Serrano, M. dos Santos
and M. Figueiro). Villages were selected considering demographic data from the 2011
Census. Four villages were visited in the municipality of Figueira de Castelo Rodrigo outside
of the area of Parque Natural do Douro Internacional, with the intention of testing and
adjusting the questionnaire contents and developing the interview protocol A total of 450
houses were visited, with 86 individuals encountered and 22 consenting respondents
(refusal rate = 74.4%).
In the pilot study, a proposed indirect questioning technique, the crosswise model
(CWM), was found to be too complex so was excluded from the main study in favour of the
unmatched count technique (UCT). Based on previous work (Fairbrass et al. 2015) the
intention was to maximise sample size to increase the effectiveness of the UCT [more
detail].
Respondents appeared to experience subject fatigue during the theory of planned
behaviour (TPB) sections, therefore I decided to include a section on local trends to reduce
the explicit focus on poison-related questions. Wording in the Motivation section was
changed from ‘People in my village would use poison to…’ to ‘People in my village may use
poison to…’ to avoid respondents rejecting the questions (i.e. non-response bias). A section
with an increased law enforcement scenario was removed to, (i) reduce the length of the
questionnaire, and (ii) keep all questions as relevant and focused as possible. Following this,
the section with the nature protection scenario was expanded to include additional
questions from project partners at SPEA.

39
S2. Study area
The Park lies within the Douro region, the oldest demarcated region in the world,
and promotes the sustainable use of species, habitats and ecosystems in harmony with the
preservation of traditional activities such as the use of dovecotes in agriculture (ICNF 2016).
The level of protection inside the park is variable, ranging from total protection (i.e. with
minimal human disturbance) to type II complementary protection, where suitable
agricultural and forestry practices are prioritised (RCM no 120/2005, July 28th). There are
currently 28 village parishes within the park, with around 13,000 residents, spanning four
municipalities (Figueira de Castelo Rodrigo, Freixo de Espada à Cinta, Mogadouro and
Miranda do Douro; INE, 2011). Communities within the park are primarily rural, with
traditional livelihoods centred on the farming of wheat and rye, herding cattle, and the
cultivation of olives, wine and almonds. However, rapid socio-economic changes and
migration along with an aging and stagnant population are affecting local knowledge and
traditional land-use systems, with tourism being increasingly important to the local
economy (Carvalho & Frazão-Pereira, 2011).
A four-year project, coordinated by the Portuguese Society for the Protection of
Birds (SPEA), has been funded by the EU’s LIFE programme to combat illegal activities, such
as poison use, in DINP (LIFE14 NAT/PT/000855). The project will introduce a number of anti-
poisoning and anti-poaching initiatives, including the operation of human-canine brigades to
detect and act against illegal use of poison, and the more detailed investigation of suspected
cases of illegal poisoning.

40
S3.1 Interview protocol (English)
1) Before beginning sampling
a) Select a village from the randomised list (using a randomly generated number
list from https://www.random.org/sequences/), excluding villages with <100
residents and those that are >1 hour away.
i) Confirm the number of residents from the ‘Sampling variables’ document
b) Contact the chairman of the parish council (Presidente da Junta) at least a day
before the start of field work to inform them that we will be working in the
village.
c) Arrive at each village after lunch, approximately 2pm. When possible, stay until
approximately 7pm (or later) to enable contact with workers.
2) Household selection
a) Divide into two teams of two people, with ideally one man and one woman per
team
i) Sub-team 1 – even numbers
ii) Sub-team 2 – odd numbers
iii) If only one team, visit both odd and even numbered houses
b) Visit every house and knock on the door/ring the bell
3) Recording of houses
a) Make a note of road name or reference point when starting in a new street or
area
b) House status
i) Open: If someone comes to the door and makes contact
ii) Closed: If no answer
iii) Abandoned: If house is clearly not inhabited
iv) Work: Café, garage, etc.
4) Participant selection and consent:
a) Must be over 18
b) Must live in the village or be a regular visitor (>2 times per year for >2 weeks
each visit)
c) Must give free, prior and informed consent
i) Involves outlying the topic, time requirements, anonymity and
confidentiality, and non-obligatory nature of the questionnaire (i.e. can be
abandoned at any time)
ii) If there are any further questions, explain where possible or refer to the
participant information sheet
d) If more than one person in the house, allow them to decide between them who
will participate
e) Only begin the questionnaire once free, prior and informed consent is
given
5) Recording consent
i) If consent is given, note C

41
ii) If consent is not given, note NC
iii) If the individual is not eligible because they don’t meet criteria 4b, note NM
6) Before starting questions
a) Note the date
b) Note village ID: First village = A1, second village = A2, etc.
c) Note household ID: X.Y.Z where X = team letter, Y = day in that village, Z = no.
questionnaire on that day. e.g. A.1.2, Team A doing the second questionnaire of
the first day in that village.
d) Note interviewer ID: Initials of team member reading questions
e) Decide UCT treatment
i) Toss a coin to decide whether the house will be control or treatment.
(1) Heads (“Cara”) = Control
(2) Tails (“Croa”) = Treatment
ii) Can be done by team member not introducing the questionnaire
7) Carrying out the questionnaire
a) Read all text in italics
b) Read all questions and options for responding
c) Text in brackets [example] indicates an action needed, e.g. showing a card
i) Cards can be shown by team member not reading the questions
ii) Refer to cards when relevant to show options for responding or to explain i.e.
UCT cards and List of activities
d) When a response is given
i) Circle corresponding answer on questionnaire form
ii) If response is ‘Don’t know’, make a note next to the corresponding question
iii) If response doesn’t correspond to any appropriate answer, prompt with the
given answers from the questionnaire.
iv) Note any anecdotal responses or stories of interest on the questionnaire
e) Once finished, leave house and complete Section 10
8) Complementary sampling
a) If hard to achieve sample size:
i) Discuss options with the Presidente da Junta
ii) Use local contacts
iii) Organise a meeting of farmers or hunters (if these groups are
underrepresented in the sample for that village)
iv) Move to another village and return at a later date
b) Must be complementary and not the main sampling method

42
S3.2 Interview protocol (Portuguese)
1) Antes de começar a amostragem
a) Selecionar uma vila da lista randomizada (usar numero randomizado da lista
generado por https://www.random.org/sequences/), excluindo vilas com <100
residentes e aquelas há >1 hora de distância.
i) Confirmar o numero de residents do documento ‘Sampling variables’ .
b) Contactar o Presidente de Junta ao menos um dia antes de começar o trabalho de
campo para informar ele o trabalho a realizar na vila.
c) Chegar a cada vila depois da hora do almoço, aproximadamente 2pm. Quando for
possível, ficar até 7pm aproximadamente, para conseguir contactar os
trabalhadores.
2) Seleção das residências
a) Dividir em duas equipes de duas pessoas, idelamente com uma mulher e um
hómem por equipe:
i) Sub-equipe 1 – números pares
ii) Sub-equipe 2 – números impares
iii) Se só tem uma equipe, visitar casas com numeros pares e impares
b) Visitar cada casa e bater na porta/tocar a campanhina
3) Registro das residências
a) Anotar o nome da rua ou uma referência quando começar uma nova rua ou area
nova
b) Estado da casa
i) Aberta: se alguém vem até a porta e faz contato
ii) Fechada: se não tem resposta
iii) Abandonada: se a casa esta claramente inabitada
iv) Trabalho: Café, garagem, etc.
4) Seleção do participante e consentimento:
a) Deve ser maior de 18
b) Deve morar na vila ou user um visitante regular (2 veces por ano >2 semanas
cada visita)
c) Deve dar livre, previo e informado consentimento
i) Incluindo o sujeto principal, tempo requerido, anonimato e confidencialidade,
e aclarar que o questionário não é obligatório (i.e.pode ser abandonado em
qualquer momento)
ii) Se tiver alguma pergunta, explicar quando for possível ou entregar ao
participante a “Folha do participante”
d) Se tiver mais de uma pessoa na casa, permitir a eles decidir quem participará
e) Começar o questionário só quando o previo consentimento informado e
livre é dado.
5) Registro do consentimento

43
i) Se o consentimento é dado, notar C
ii) Se o consentimento não é dado, notar NC
iii) Se o individuo não cumple com criteria 4b, notar NM
6) Antes de começar com as perguntas
a) Notar a data
b) Notar a vila ID: Primeira vila = A1, segunda vila = A2, etc.
c) Notar casa ID: X.Y.Z. onde X = letra da equipe, Y = dia nessa vila, Z = nro. do
questionário nesse dia. Ex. A.1.2, Equipe A fazendo o Segundo questionário no
primeiro dia na vila.
d) Notar entrevistador ID: Iniciais do membro da equipe fazendo as perguntas
e) Decidir UCT tratamento
i) Jogar uma moeda para decider se a casa sera controle ou tratamento.
(1) Cara = Controle
(2) Crua = Tratamento
ii) Pode ser realizado por o membro da equipe que não faz as perguntas
7) Realização do questionário
a) Ler os textos em italic
b) Ler todas as perguntas e opções de respostas
c) Textos em colchetes [exemplo] indica uma acção, ex.mostrar o cartão
i) Cartões podem ser apresentados pelo membro da equipe que não esta lendo
as perguntas
ii) Referir aos cartões quando for relevante para mostrar as opções para
responder ou explicar ex.UCT cartões e Lista de atividades
d) Quando uma resposta é dada
i) Marcar a resposta correspondiente no questionário
ii) Se a resposta é ‘Não sei’, notar ao lado da pergunta
iii) Se a resposta não corresponde a nenhuma das opções, sugeri com as
respostas do questionário.
iv) Notar qualquer resposta anecdótica,ou historias de interesse no questionário
e) Uma vez finalizado, sair da casa e completer a secção 10
8) Amostragem complemetário
a) Se não se consegue um tamanho de amostragem suficente:
i) Discutir opções com o Presidente da Junta
ii) Usar contatos locais
iii) Organizar uma reunião/encontro de agricultores ou cazadores (se esses
grupos não estão suficientemente representados na amostragem da vila)
iv) Continuar com outra vila e voltar em uma data posterior
b) Deve ser complementaria e não o metodo de amostragem principal

44
S4. Household sample
Table 4.1 Summary of the time worked, state of sampled households (N=1961), number of consenting individuals, and number and details of non-consenting individuals per village (N=13).
Village
State of house N (%) Open houses outcome
Time worked (min)
Houses visited
Closed Abandoned Work Open Consent
N (%)
No Consent
N (%) Sex N (%) Age Group N (%)
Female Male 18-24
25-44 45-64 65+
A1 585 115 44 (38.3) 43 (37.4) 6 (5.2) 22 (19.1) 15 (65.2) 7 (31.8) 5 (71.4) 2 (28.6) 0 (0) 0 (0) 2 (33.3) 4 (66.7)
A2 270 115 51 (44.3) 39 (33.9) 5 (4.3) 20 (17.4) 9 (45) 9 (45) 8 (80) 2 (20) 0 (0) 0 (0) 3 (30) 7 (70)
A3 610 196 99 (50.5) 48 (24.5) 13 (6.6) 36 (18.4) 15 (42.9) 13 (37.1) 10 (76.7) 3 (24.1) 0 (0) 0 (0) 6 (46.2) 7 (53.8)
A4 805 312 186 (59.6)
49 (15.7) 11 (3.5) 66 (21.2) 25 (37.9) 24 (36.4) 18 (78.3) 5 (21.7) 0 (0) 6 (27.3) 5 (22.7) 11 (50)
A5 510 163 74 (45.4) 47 (28.8) 18 (11) 24 (14.7) 15 (62.5) 6 (25) 4 (66.7) 2 (33.3) 0 (0) 0 (0) 0 (0) 6 (100)
A6 420 145 69 (47.6) 42 (29) 3 (2.1) 31 (21.4) 15 (48.4) 14 (45.2) 10 (71.4) 4 (28.6) 0 (0) 2 (14.3) 2 (14.3) 10 (71.4)
A7 389 103 69 (67) 6 (5.8) 0 (0) 28 (27.2) 12 (42.9) 11 (39.3) 6 (54.5) 5 (45.5) 0 (0) 3 (30) 3 (30) 4 (40)
A8 850 323 174 (53.9)
83 (25.7) 14 (4.3) 52 (16.1) 25 (48.1) 24 (46.2) 22 (91.7) 2 (8.3) 0 (0) 2 (8.3) 5 (20.8) 17 (70.8)
A9 680 201 95 (47.3) 45 (22.4) 18 (9) 43 (21.4) 25 (58.1) 14 (32.6) 9 (69.2) 4 (30.8) 0 (0) 1 (7.7) 5 (38.5) 7 (53.8)
A10 282 64 33 (51.6) 12 (18.8) 4 (6.3) 15 (23.4) 10 (66.7) 5 (33.3) 2 (50) 2 (50) 0 (0) 0 (0) 1 (25) 3 (75)
A11 137 76 32 (42.1) 22 (28.9) 5 (6.6) 17 (22.4) 9 (50) 7 (38.9) 4 (57.1) 3 (42.9) 0 (0) 1 (14.3) 1 (14.3) 5 (71.4)
A12 348 81 34 (42) 24 (29.6) 2 (2.5) 21 (25.9) 11 (52.4) 8 (38.1) 5 (100) 0 (0) 0 (0) 0 (0) 2 (40) 3 (60)
A13 288 63 24 (38.1) 18 (28.6) 4 (6.3) 17 (27) 7 (36.8) 8 (42.1) 8 (100) 0 (0) 0 (0) 0 (0) 2 (28.6) 5 (71.4)
Total 6174 1961 984 (50.2)
478 (24.4)
103 (5.3)
395 (20.1)
193 (48.6)
150 (37.8)
111 (76)
34 (23.3)
0 (0)
15 (10.4)
37 (25.7)
90 (62.5)

45
S5. Sample sociodemographics
Table 5.2 Key sociodemographic characteristics of sample of resident households (N=193)
Categorical variables Level Count
18-34 14
35-44 19
45-54 21
55-64 33
65+ 106
Gender Female 127
Male 66
Primary school or no formal education 108
Mid-level education 37
College or university 48
Occupation Farmer 34
Housewife 46
Retired or unemployed 75
Other 38
Years in village <10 12
10-30 49
30-50 48
>50 84
Hunting license Yes 13
No 180
Own livestock Yes 69
Yes, in the past 41
No 83
Type of human settlement City/town 63
Village 130
District Bragança 163
Guarda 30
Municipality Figueira de Castelo Rodrigo 30
Freixo de Espada à Cinta 49
Mogadouro 46
Miranda do Douro 71
Region North 114
South 79

46
S6. Photos
Figure S6.1. Example of an abandoned house in a study village
Figure S6.2. Example of an abandoned house in a study village
47
Figure S6.3. The Douro valley on the Spanish border of Parque Natural do Douro
Internacional
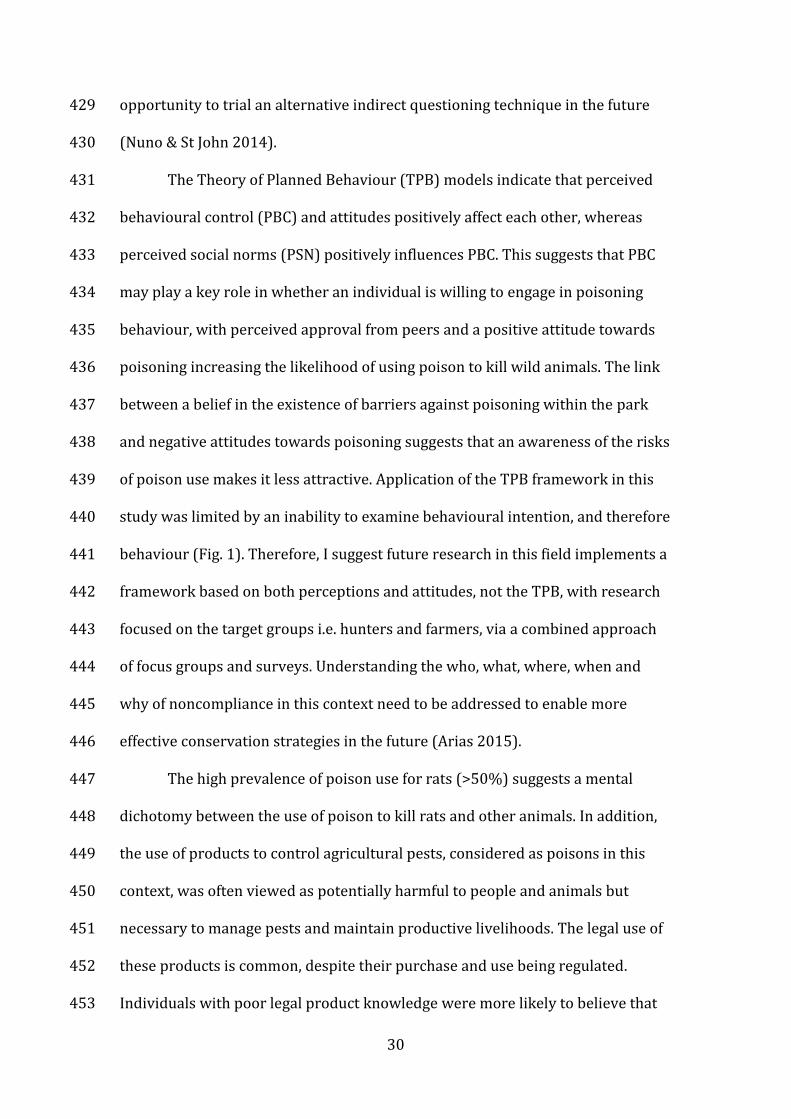
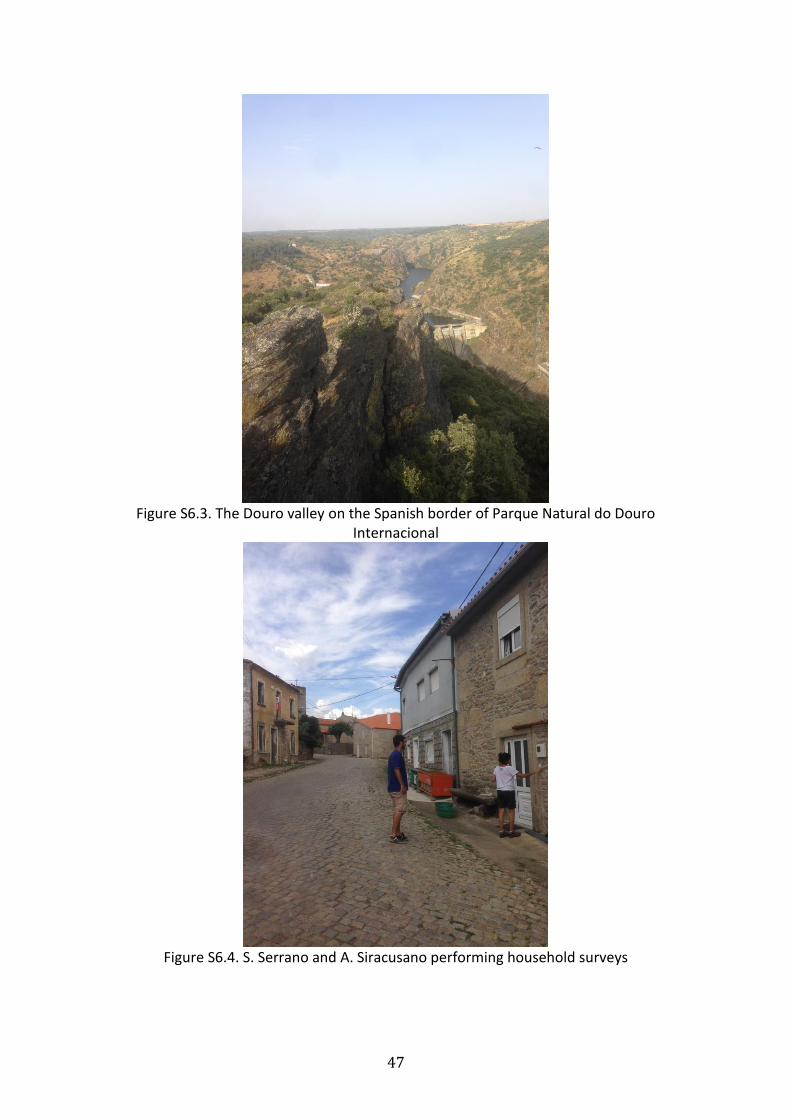
Figure S6.4. S. Serrano and A. Siracusano performing household surveys
48
S7.1 Questionnaire (Eng.)
Date: Village ID code: Household ID code: Enumerator ID:
Good afternoon, we are students and we’re here to ask some questions to the residents of the village for a university study at Imperial College London. They are simple questions about the community and nature, and takes about 10 to 15 minutes. You do not need to be able to read or write, it is only a conversation. If you choose to take part, this information will be anonymous and confidential. Do you have time and would like to participate?
Verbal consent given? Yes No [If NO, write gender, approximate age of respondent and reason (if given) on recording sheet and FINISH HERE] [If YES, write down time interview started] Start time:___________ Section 1: Social demographics First I’m going to ask you some questions about yourself. 1. Gender Male__________ Female__________ 2. Age a. 18-24 b. 25-34 c. 35-44 d. 45-54 e. 55-64 f. 65+ 3. Level of education a. Primary school b. Mid-level education c. Secondary/college education d. University e. No formal education
49
4. Main field of occupation a. Farmer b. Housewife c. Shepherd d. Council worker e. Supermarket f. Unemployed g. Retired h. Other:__________________________ 5. How long have you lived in this village? __________________________ 6. Do you have a hunting license or have you had one in the past? a. Yes b. No 7. Do you own livestock or poultry, or did you in the past? a. Yes b. Yes, in the past c. No [If No, skip to Section 2] 8. What kind of livestock? a. Cow b. Goat c. Sheep d. Donkey e. Horse f. Chicken 9. Has your livestock or poultry ever been attacked by a predator? a. Yes
i.What type? ______________________________________________ b. No c. I’d rather not say 10. Do you have a guard dog? a. Yes b. Yes, in the past c. No d. I’d rather not say

50
Section 2: UCT
I am going to show you a card with the names of various places on. I will read the names of the places and then I would like you to tell me how many of these places
you have visited in the last month. Please, don’t tell me which ones, just tell me how many.
[Show card A] 11. How many of these places have you visited in the past month? 1 2 3 4 5
Now I am going to show you a card with a number of activities on. I will read the names and would like to know how many of these activities you have done in the past
3 years. Again, please don’t tell me which ones, just tell me how many.
12.
Control (heads/C)/Treatment (tails/B) [delete as appropriate]
[CONTROL - Show card C] a. How many of these activities have you conducted in the past 3 years? 1 2 3 4 [TREATMENT – Show card B] b. How many of these activities have you conducted in the past 3 years? 1 2 3 4 5

51
Section 3: Attitude
I am now going to read some statements and would like to know how you feel about them:
13. For me the use of insecticides in the fields around my village would be 1
Very bad
2 Bad
3 Neither bad
nor good
4 Good
5 Very good
14. For me the use of poison to kill wild animals in the area around my village would be
1 Very bad
2 Bad
3 Neither bad
nor good
4 Good
5 Very good
15. For me to use poison to kill wild animals in the area around my village would make me feel
1 Very worried
2 Worried
3 Neither worried
nor relieved
4 Relieved
5 Very relieved
Section 4: Perceived behavioural control
I am going to read some statements and would like to know how much you either agree or disagree with them, where 1 is strongly disagree, and 5 is strongly agree.
16. There is nothing stopping me from using fertilizers on plants in the garden 1
Strongly disagree
2 Disagree
3 Neither agree nor disagree
4 Agree
5 Strongly
agree
17. There is nothing stopping me from using poison to kill wild animals in the areas around my village
1 Strongly disagree
2 Disagree
3 Neither agree nor disagree
4 Agree
5 Strongly
agree
18. Whether I use poison to kill wild animals is entirely my decision 1
Strongly disagree
2 Disagree
3 Neither agree nor disagree
4 Agree
5 Strongly
agree

52
19. Are there any barriers to using poison to kill wild animals in the park? __________________________________________________________________________________________________________________________________________ Section 5: Local activities Again, I am going to read some statements and would like to know how much you agree or disagree with them, where 1 is strongly disagree, and 5 is strongly agree. 20. In the last 10 years, the number of people in my village with cattle has decreased.
1 Strongly disagree
2 Disagree
3 Neither agree nor disagree
4 Agree
5 Strongly
agree 21. In the last 10 years, the number of wild animals in the local area has decreased.
1 Strongly disagree
2 Disagree
3 Neither agree nor disagree
4 Agree
5 Strongly
agree Section 6: Perceived norms
22. The majority of people in this village use poison to kill wild animals 1
Strongly disagree
2 Disagree
3 Neither agree nor disagree
4 Agree
5 Strongly
agree 23. I feel that other people expect me to use poison to kill wild animals.
1 Strongly disagree
2 Disagree
3 Neither agree nor disagree
4 Agree
5 Strongly
agree 24. Among your neighbours, how much agreement would there be that it is a good thing to use poison to kill wild animals?
1 Strong
disagreement
2 Disagreement
3 Neither
4 Agreement
5 Strong
agreement 25. In your family, how much agreement would there be that it’s a good thing to use poison to kill wild animals?
1 Strong
disagreement
2 Disagreement
3 Neither
4 Agreement
5 Strong
agreement

53
For the following statement, please tell me which applies to you: 26. The approval of my family and friends is important to me
1 Not at all
2 A little
3 More or less
4 Quite a lot
5 Very much
Section 6: Legal knowledge
For each the following products, please tell me whether using this product is: always legal, always illegal, or legal only for certain activities (regulated). 27. It is illegal, regulated or legal to use… [Read in a random order] i. Calda bordalesa
Legal Regulated Illegal Don’t recognise Don’t know
ii. Rat poison Legal Regulated Illegal Don’t recognise Don’t know
iii. Strychnine Legal Regulated Illegal Don’t recognise Don’t know
iv. Confidor Legal Regulated Illegal Don’t recognise Don’t know
v. Kanat-zeon Legal Regulated Illegal Don’t recognise Don’t know
vi. Roundup Legal Regulated Illegal Don’t recognise Don’t know
Section 7: Motivation
I will now ask some questions about why you think poison might be used by people in your village. I will read a list of potential reasons and would like you to rate them from 1 to 5 where 1 is ‘very unlikely’ and 5 is ‘very likely’.
28. People in my village might use poison to… [Read in a random order]
a Control populations of pest animals [e.g. rats] near their houses……………………………………………………………..
1 2 3 4 5
b Control populations of predators [e.g. fox, wolf] around the village………………………………………………………………………..
1 2 3 4 5
c Control populations of predators [e.g. fox, wolf] far from the village………………………………………………………….
1 2 3 4 5
d Control weeds…………………………………………………………………. 1 2 3 4 5 e Kill an animal that attacked their livestock…………………….. 1 2 3 4 5 f Control populations of birds of prey [e.g. vulture, eagle] …. 1 2 3 4 5 g To kill stray dogs…………………………………………………………….. 1 2 3 4 5
1 Very unlikely
2 Unlikely
3 Neither likely nor
unlikely
4 Likely
5 Very likely

54
Section 8: Scenario Type: 1 / 2 I am now going to present a scenario, and would like your opinion on how it might affect you and your village.
I.A number of actions for the protection of nature are put into place in Parque Natural do Douro Internacional, with the aim of increasing populations of birds of prey [show list of actions and note type]. In relation to this… 29. What effect do you think these actions would have on the lives of people in your village?
1 Very negative
2 Negative
3 No effect
4 Positive
5 Very positive
30. An increase in the number of birds of prey in the local area would be
1 Very bad
2 Bad
3 Neither bad
nor good
4 Good
5 Very good
31. An increase in the number of birds of prey in the local area will result in an increase or decrease in the use of poison to kill wild animals by people in my village.
1 Increase considerably
2 Small
increase
3 No change
4 Small
decrease
5 Decrease
considerably Now, in connection with the above questions I would like your opinion on how the protection of nature relates to you. 32. In your opinion, who carries out work for the protection of nature on your land? __________________________________________________________________________________________________________________________________________ 33. Do you think that the protection of nature is
1 Very
unnecessary
2 Unnecessary
3 Neither necessary nor
unnecessary
4 Necessary
5 Very
necessary 34. Do you think that the protection of nature is connected to you?
Yes No Don’t know
a. If yes, in what way? __________________________________________________________________________________________________________________________________________

55
Section 9: Direct questions Now, I’m going to read two statements and would like to how how much you agree or disagree with them, 1 being ‘Strong disagree’ and 5 being ‘Agree completely’.
35. I intend to use poison to kill wild animals in Parque Natural do Douro Internacional in the next 3 years
1 Strongly disagree
2 Disagree
3 Neither agree nor disagree
4 Agree
5 Strongly
agree 36. I intend to use poison to kill wild animals on my land in the next 3 years
1 Strongly disagree
2 Disagree
3 Neither agree nor disagree
4 Agree
5 Strongly
agree I am now going to ask you some direct questions. You don’t have to answer if you don’t want to, but if you feel comfortable please answer either ‘yes’ or ‘no’ to each question. 37. In the past 3 years, have you used poison to kill wild animals?
Yes No Don’t want to answer 38. In the past 3 years, have you used poison to kill rats?
Yes No Don’t want to answer 39. Is there someone in this village who has used poison to kill wild animals in the past 3 years?
Yes No Don’t want to answer
Thank you very much for your time and participation. Do you have any comments or questions? _________________________________________________________________________________________________________________________________________________________________________________________________________________________________________________________________________________________________________________________________________________________ End time: _________________
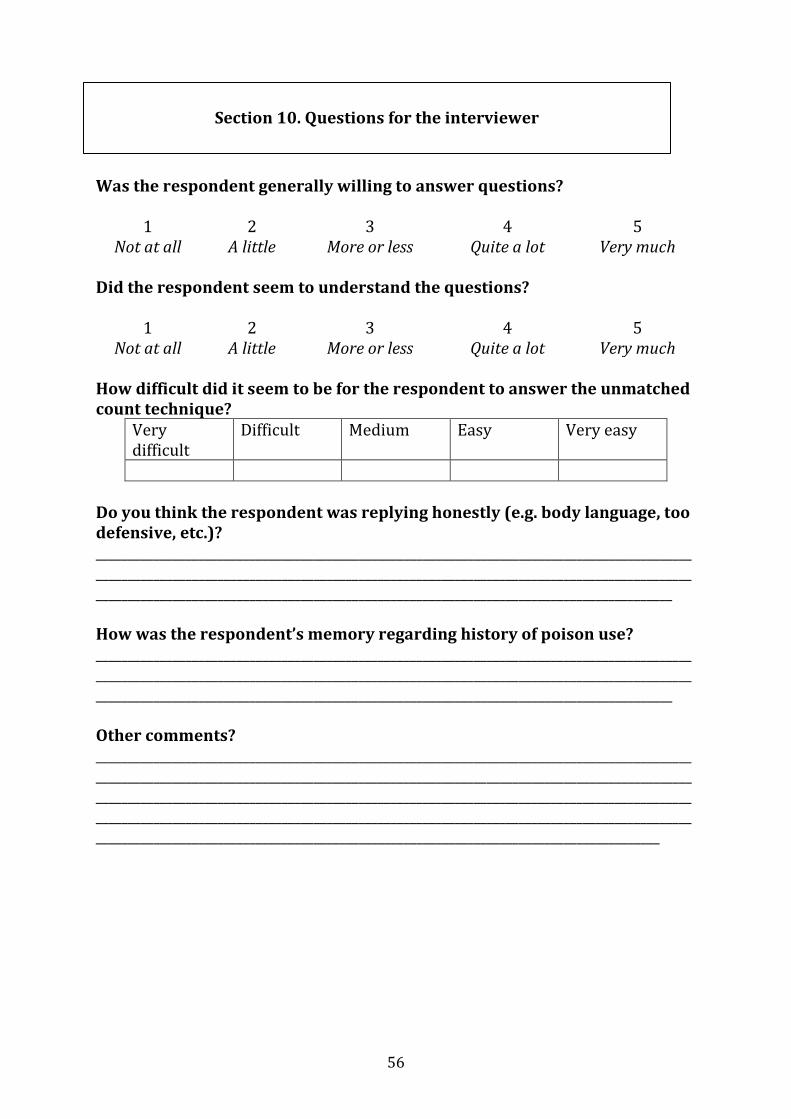
56
Was the respondent generally willing to answer questions?
1 Not at all
2 A little
3 More or less
4 Quite a lot
5 Very much
Did the respondent seem to understand the questions?
1 Not at all
2 A little
3 More or less
4 Quite a lot
5 Very much
How difficult did it seem to be for the respondent to answer the unmatched count technique?
Very difficult
Difficult Medium Easy Very easy
Do you think the respondent was replying honestly (e.g. body language, too defensive, etc.)? ____________________________________________________________________________________________________________________________________________________________________________________________________________________________________________________________________________________ How was the respondent’s memory regarding history of poison use? ____________________________________________________________________________________________________________________________________________________________________________________________________________________________________________________________________________________ Other comments? ____________________________________________________________________________________________________________________________________________________________________________________________________________________________________________________________________________________________________________________________________________________________________________________________________________________________________________________________________________
Section 10. Questions for the interviewer

57
S7.2. Questionnaire (Por.)
Data: Código ID da aldeia: Código ID da casa: Entrevistador ID:
Boa tarde, nós somos estudantes e estamos aqui a fazer algumas perguntas aos moradores da aldeia para um estudo da universidade de Imperial College London. São perguntas simples sobre a comunidade e a natureza, e leva alguns 10 a 15 minutos. Não precisa de saber ler ou escrever, é só uma conversa. Se decidir participar, esta informação será anónima e confidencial. Será que o/a senhor/a tem tempo e vontade de participar? Consentimento verbal? Sim Não [Se NÃO, escreve sexo, idade aproximada da pessoa que respondeu e motivo (se foi explicado) na folha de notas e FINALIZA AQUI] [Se SIM, escrever a hora de início da entrevista] Hora início:___________ Seção 1: Informação sociodemográfica Primeiro eu vou fazer algumas perguntas sobre o/a senhor/a 1. Sexo Masculino__________ Feminino__________ 2. Idade a. 18-24 b. 25-34 c. 35-44 d. 45-54 e. 55-64 f. 65+ 3. Nivel de educação a. Escola primária: 1ª a 4ª classe b. 5º - 9º ano c. Ensino secundário: 10º - 12º ano d. Universidade e. Sem estudos formais

58
4. Ocupação principal a. Agricultor/a b. Doméstica c. Pastor/a d. Funcionário/a da câmara e. Funcionário/a do supermercado f. Desempregado/a g. Reformado/a h. Outro:__________________________ 5. Há quanto tempo mora na sua aldeia? __________________________ 6. Tem uma carta de caçador ou teve uma no passado? a. Sim b. Não 7. Possui gado ou aves domésticas, ou teve no passado? a. Sim b. Sim, no passado c. Não [Se Não, passe a Seção 2] 8. Que tipo de gado ou aves domésticas [marcar todos que aplica]? a. Vaca b. Bode/cabra c. Ovelha/carneiro d. Burro e. Cavalo f. Galinha 9. Os seus animais alguma vez foram atacados por predadores? a. Sim
i.Que tipo de predador? ____________________________________________ b. Não c. Prefiro não responder 10. Tem cão de gado ou teve no passado? a. Sim b. Sim, no passado c. Não d. Prefiro não responder

59
Seção 2: UCT
Vou mostrar o/a senhor/a um cartão com os nomes de vários lugares. Vou ler os nomes e gostaria de saber quantos lugares desta lista visitou no último mês.
Por favor, não me diga quais, diga-me só quantos. [Mostrar cartão A] 11. Quantos destes lugares visitou no último mês? 1 2 3 4 5 Agora vou mostrar um cartão com os nomes de várias atividades. Vou ler os nomes
e gostaria de saber quantas atividades desta lista fez nos últimos 3 anos. Novamente por favor, não me diga quais, diga-me só quantas.
12.
CONTROLE (cara/C)/ TRATAMENTO (crua/B) [apagar o correspondente]
[CONTROLE - Mostrar cartão C] a. Quantas destas atividades realizou nos últimos 3 anos? 1 2 3 4 [TRATAMENTO - Mostrar cartão B] b. Quantas destas atividades realizou nos últimos 3 anos? 1 2 3 4 5

60
Seção 3: Atitude
Agora, vou ler algumas frases e gostaria de saber como se sente acerca delas:
13. Para mim o uso de produtos multi-pragas nos campos ao redor a minha aldeia seria
1 Muito mau
2 Mau
3 Nem mau nem bom
4 Bom
5 Muito bom
14. Para mim o uso de veneno para matar animais selvagens nas áreas ao redor minha aldeia seria
1 Muito mau
2 Mau
3 Nem mau nem bom
4 Bom
5 Muito bom
15. Para mim o uso de veneno para matar animais selvagens nas áreas ao redor minha aldeia me faz sentir
1 Muito
preocupado
2 Preocupado
3 Nem preocupado
nem aliviado
4 Aliviado
5 Muito
aliviado
Seção 4: Percepção do comportamento de controle
Eu vou ler algumas frases e gostaria de saber quanto você concorda ou discorda com elas, sendo 1 ‘discordo totalmente’ e 5 ‘concordo totalmente’.
16. Nada me impede de usar fertilizantes nas plantas no jardim. 1
Discordo totalmente
2 Discordo
3 Nem concordo nem discordo
4 Concordo
5 Concordo
totalmente 17. Nada me impede de usar veneno para matar animais selvagens nas áreas ao redor minha aldeia
1 Discordo
totalmente
2 Discordo
3 Nem concordo nem discordo
4 Concordo
5 Concordo
totalmente 18. Se eu usar veneno para matar animais selvagens é inteiramente minha decisão
1 Discordo
totalmente
2 Discordo
3 Nem concordo nem discordo
4 Concordo
5 Concordo
totalmente
19. Existe algum impedimento para o uso de veneno para matar animais selvagens no parque natural? ________________________________________________________________________________________________________________________________________________________________________________________

61
Seção 5: Atividades locais Novamente, eu vou ler algumas frases e gostaria de saber quanto você concorda ou discorda com elas, sendo 1 ‘discordo totalmente’ e 5 ‘concordo totalmente’. 20. Nos últimos 10 anos, o número de pessoas na minha aldeia com gado diminuiu.
1 Discordo
totalmente
2 Discordo
3 Nem concordo nem discordo
4 Concordo
5 Concordo
totalmente 21. Nos últimos 10 anos, o número de animais selvagens na área local diminuiu.
1 Discordo
totalmente
2 Discordo
3 Nem concordo nem discordo
4 Concordo
5 Concordo
totalmente Seção 6: Percepção de normas 22. A maioria das pessoas desta aldeia usa veneno para matar animais selvagens.
1 Discordo
totalmente
2 Discordo
3 Nem concordo nem discordo
4 Concordo
5 Concordo
totalmente 23. Eu sinto que outras pessoas esperam que eu use veneno para matar animais selvagens.
1 Discordo
totalmente
2 Discordo
3 Nem concordo nem discordo
4 Concordo
5 Concordo
totalmente 24. O que é que seus vizinhos acham acerca do uso de veneno para matar animais selvagens?
1 Discordam totalmente
2 Discordam
3 Nem concordam nem discordam
4 Concordam
5 Concordam totalmente
25. O que é que a sua família acha acerca do uso de veneno para matar animais selvagens?
1 Discordam totalmente
2 Discordam
3 Nem concordam nem discordam
4 Concordam
5 Concordam totalmente

62
Como se sente acerca da seguinte frase, em que 1 significa ‘para nada’ e 5 é ‘muito’: 26. A aprovação da minha família e amigos é importante para mim
1 Para nada
2 Um pouco
3 Mais ou menos
4 Bastante
5 Muito
Seção 6: Conhecimento legal
Para cada um dos seguintes produtos, por favor, diga-me se o uso desse produto é: sempre legal, sempre ilegal, ou legal só para algumas atividades (regulados).
27. É legal, ilegal ou regulado para usar… [Ler em um ordem randomizado e notar o ordem]
vii. Calda bordalesa
Legal Regulado Ilegal Não conheço Não sei
viii. Veneno para ratos
Legal Regulado Ilegal Não conheço Não sei
ix. Estricnina Legal Regulado Ilegal Não conheço Não sei x. Confidor Legal Regulado Ilegal Não conheço Não sei
xi. Kanat-zeon Legal Regulado Ilegal Não conheço Não sei
xii. Roundup Legal Regulado Ilegal Não conheço Não sei Seção 7: Motivação
Agora vou fazer algumas perguntas sobre porque acha que o veneno pode ser usado por pessoas na sua aldeia. Vou ler uma lista de possíveis motivos e gostaria para avaliá-los de 1 a 5, sendo 1 ‘muito pouco provável’ e 5 ‘muito provável’.
28. Pessoas na minha aldeia poderiam usar veneno para… [Ler em um ordem randomizado e notar o ordem]
a Controlar as populações de animais praga (ex. ratos) perto das casas deles..............................................................................
1 2 3 4 5
b Controlar as populações de predadores (ex. raposa, lobo) perto das casas deles..............................................................................
1 2 3 4 5
c Controlar as populações de predadores (ex. raposa, lobo) afastado da aldeia...................................................................................
1 2 3 4 5
d Controlar ervas daninhas.................................................................... 1 2 3 4 5 e Matar um animal que atacou o gado ou ave doméstica....... 1 2 3 4 5 f Controlar as populações de aves de rapina (ex. abutres,
águias)......................................................................................................... 1 2 3 4 5
g Matar cães vadios................................................................................... 1 2 3 4 5
1 Muito pouco
provável
2 Pouco
provável
3 Nem provável nem
pouco provável
4 Provável
5 Muito
provável

63
Seção 8: Cenário Tipo: 1 / 2 Agora eu vou apresentar um cenário, e gostaria de saber a sua opinião acerca de como poderia afectar-se e a sua aldeia.
II.Um número de ações para a proteção da natureza são feitas no Parque Natural, querendo resultar num aumento nas populações das aves de rapina [mostra a lista das ações e notar o tipo]. No que respeita a isso... 29. Que efeito você acha que estas ações teriam nas vidas das pessoas da sua aldeia?
1 Muito negativo
2 Negativo
3 Sem efeito
4 Positivo
5 Muito positivo
30. Um aumento no número das aves de rapina na área local seria
1 Muito mau
2 Mau
3 Nem mau nem bom
4 Bom
5 Muito bom
31. Um aumento no número das aves de rapina na área local resultaria em um aumento ou diminuição do uso de veneno pelas pessoas na sua aldeia?
1 Aumento grande
2 Aumento pequeno
3 Sem mudar
4 Diminuição
pequena
5 Diminuição
grande Agora, em conexão com as perguntas prévias, gostaria de saber a sua opinião de como a proteção da natureza tem relação convosco. 32. Na sua opinião, quem é que faz o trabalho da proteção da natureza na sua terra? ________________________________________________________________________________________________________________________________________________________________________________________ 33. Na sua opinião, ações para a proteção da natureza são
1 Muito
desnecessário
2 Desnecessário
3 Nem necessário
nem desnecessário
4 Necessário
5 Muito
necessário 34. Acha que a proteção da natureza tem algo a ver convosco?
Sim Não Não sei
a. Se sim, como assim? _____________________________________________________________ _____________________________________________________________________________________________

64
Seção 9: Perguntas directas Agora, eu vou ler duas frases e gostaria de saber quanto você concorda ou discorda com elas, sendo 1 ‘discordo totalmente’ e 5 ‘concordo totalmente’. 35. Eu pretendo usar veneno para matar animais selvagens no Parque Natural nos próximos 3 anos.
1 Discordo
totalmente
2 Discordo
3 Nem concordo nem discordo
4 Concordo
5 Concordo
totalmente 36. Eu pretendo usar veneno para matar animais selvagens perto da minha casa nos próximos 3 anos.
1 Discordo
totalmente
2 Discordo
3 Nem concordo nem discordo
4 Concordo
5 Concordo
totalmente Agora eu gostaria de saber se fez as seguintes actividades durante os últimos 3 anos. Não precisa responder se não quer, mas se sente confortável por favor responder ‘sim’ ou ‘não’ a cada pergunta. 37. Usou veneno para matar animais selvagens nos últimos 3 anos?
Sim Não Não quero responder 38. Usou veneno para matar ratos nos últimos 3 anos?
Sim Não Não quero responder 39. Tem alguém neste aldeia quem usou veneno para matar animais selvagens nos últimos 3 anos?
Sim Não Não quero responder Muito obrigado pela sua disponibilidade para responder a este questionário. Tem algum comentário ou pergunta que gostaria de fazer? ____________________________________________________________________________________________________________________________________________________________________________________________________________________________________________________________________________________________________________________________________________________________________________________ _____________________________________________________________________________________________ Hora fim: _________________

65
O entrevistado estava disposto a responder às perguntas?
1 Para nada
2 Um pouco
3 Mais ou menos
4 Bastante
5 Muito
O entrevistado entendeu as perguntas facilmente?
1 Para nada
2 Um pouco
3 Mais ou menos
4 Bastante
5 Muito
Foi dificil para o entrevistado responder ao UCT?
Muito dificil Dificil Médio Fácil Muito fácil
O entrevistado forneceu respostas honestas (por exemplo. linguagem corporal, defensivo demais, etc.)? ____________________________________________________________________________________________________________________________________________________________________________________________________________________________________________________________________________________ Como foi a memória do entrevistado sobre história do uso de veneno? ____________________________________________________________________________________________________________________________________________________________________________________________________________________________________________________________________________________ Outros comentários? ____________________________________________________________________________________________________________________________________________________________________________________________________________________________________________________________________________________________________________________________________________________________________________________________________________________________________________________________________________
Seção 10. Perguntas para o entrevistador

66
S8 Cards (English)
Figure 8.1.1 UCT training card, adapted from Fairbrass et al. (2015)
Card A
Cafe Restaurant Dentist Supermarket Cinema

67
Figure 8.1.2 UCT control card, adapted from Fairbrass et al. (2015)
Cartão C
Prune trees
Gardening Put organic waste in the composter Use insect repellents
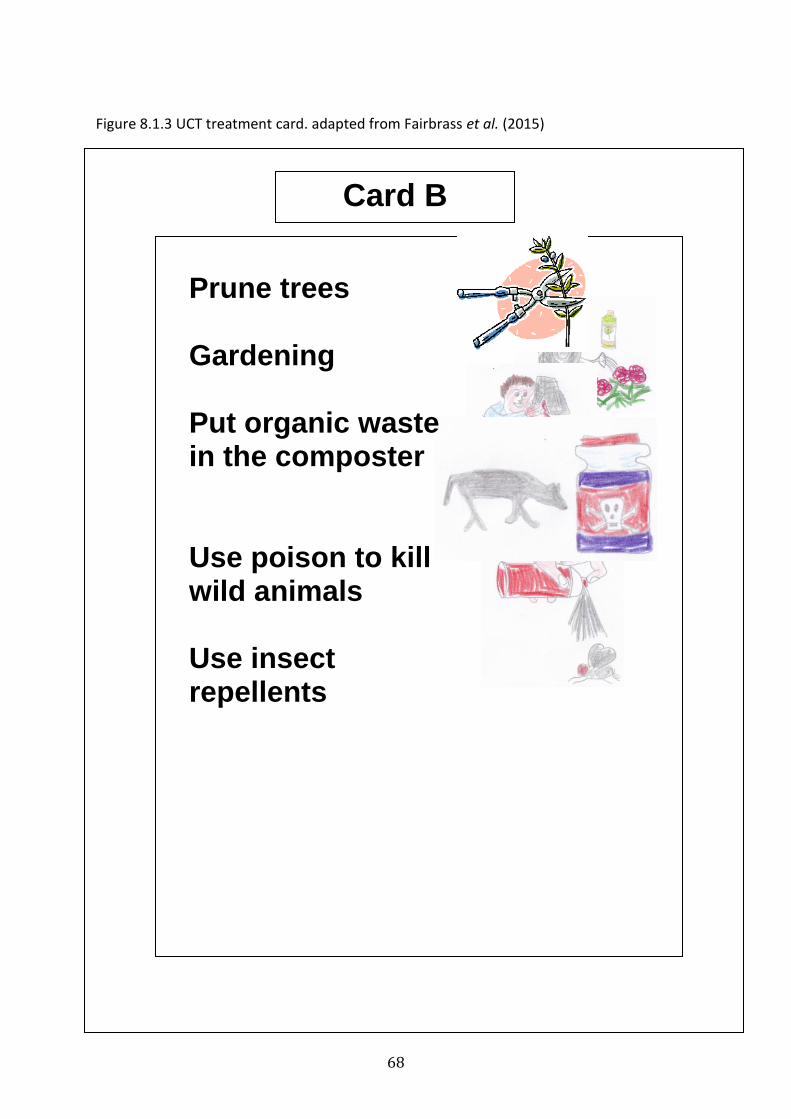
68
Figure 8.1.3 UCT treatment card. adapted from Fairbrass et al. (2015)
Card B
Prune trees Gardening Put organic waste in the composter Use poison to kill wild animals Use insect repellents
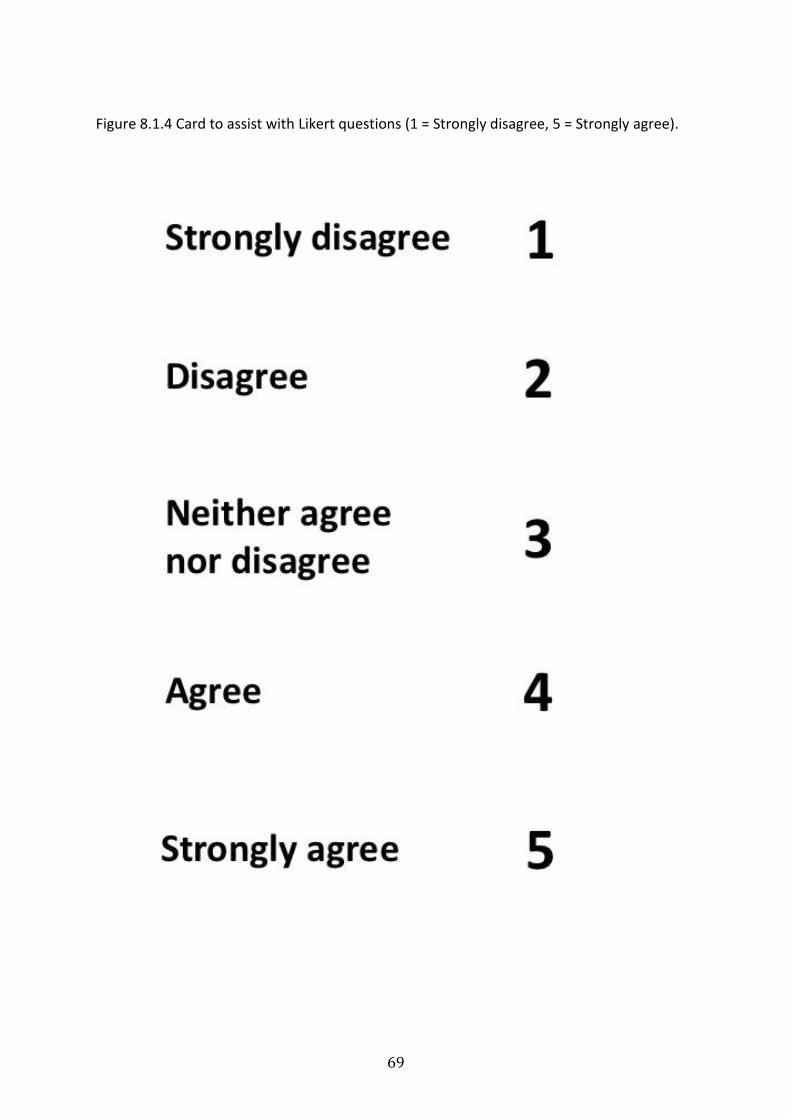
69
Figure 8.1.4 Card to assist with Likert questions (1 = Strongly disagree, 5 = Strongly agree).
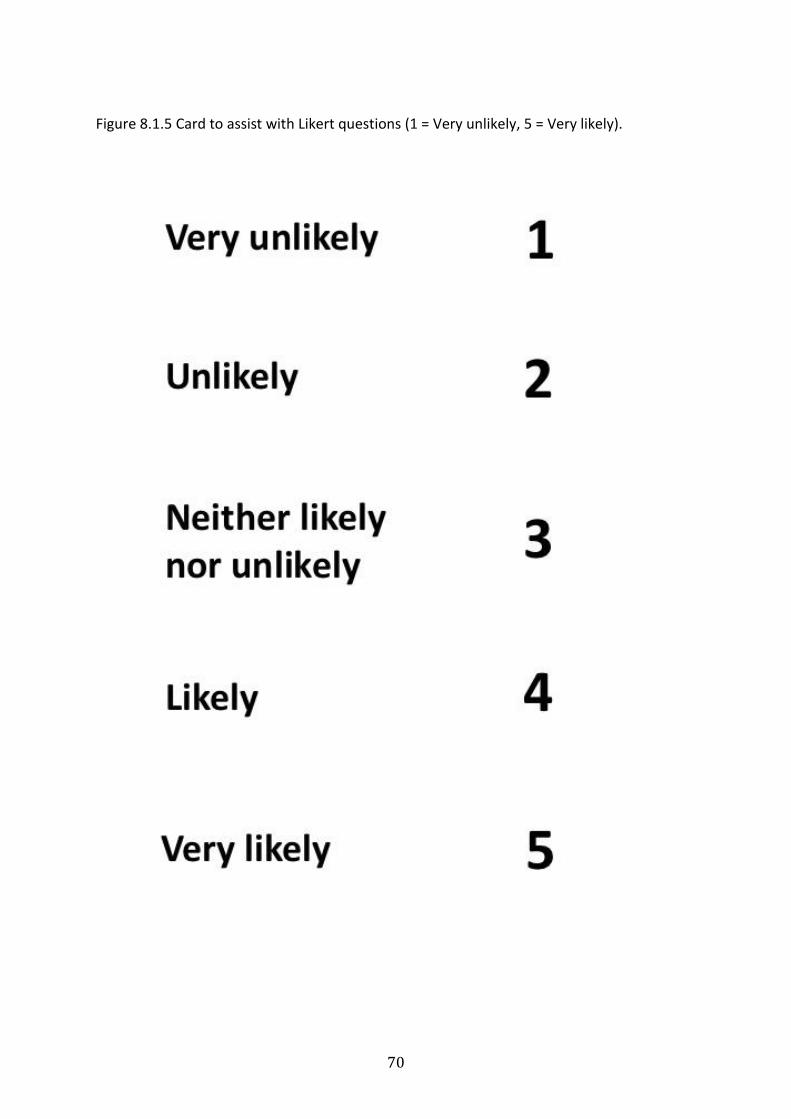
70
Figure 8.1.5 Card to assist with Likert questions (1 = Very unlikely, 5 = Very likely).
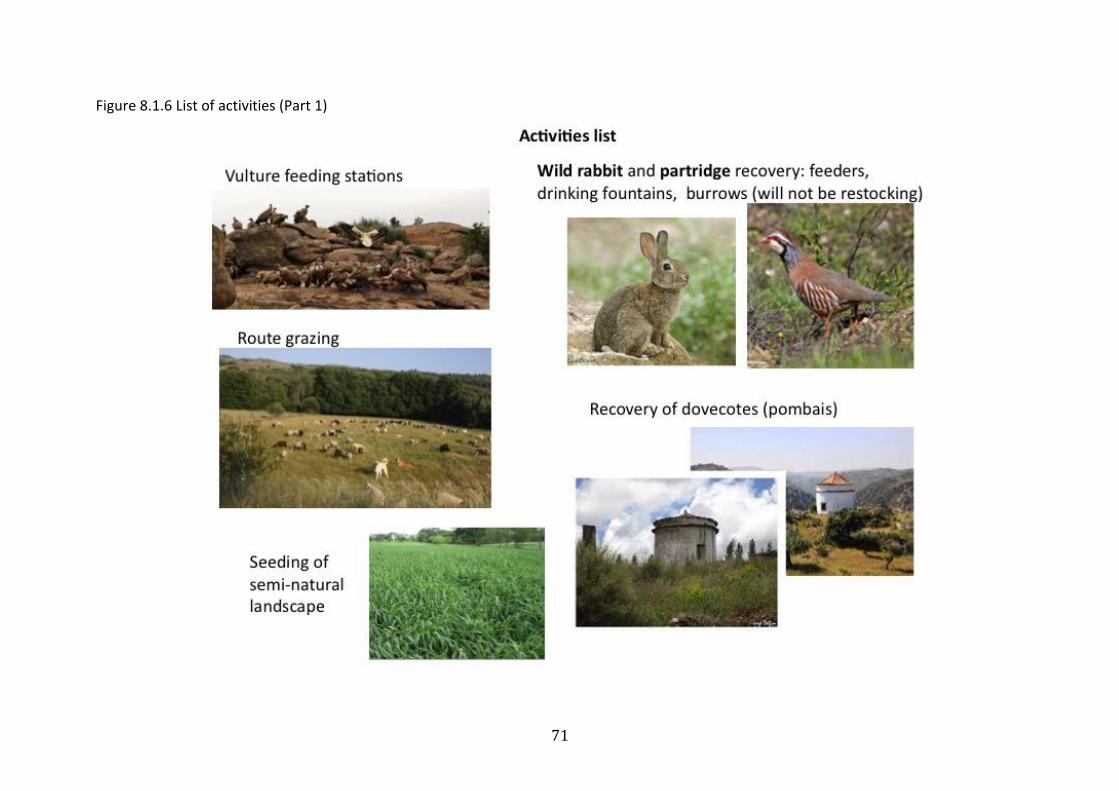
71
Figure 8.1.6 List of activities (Part 1)
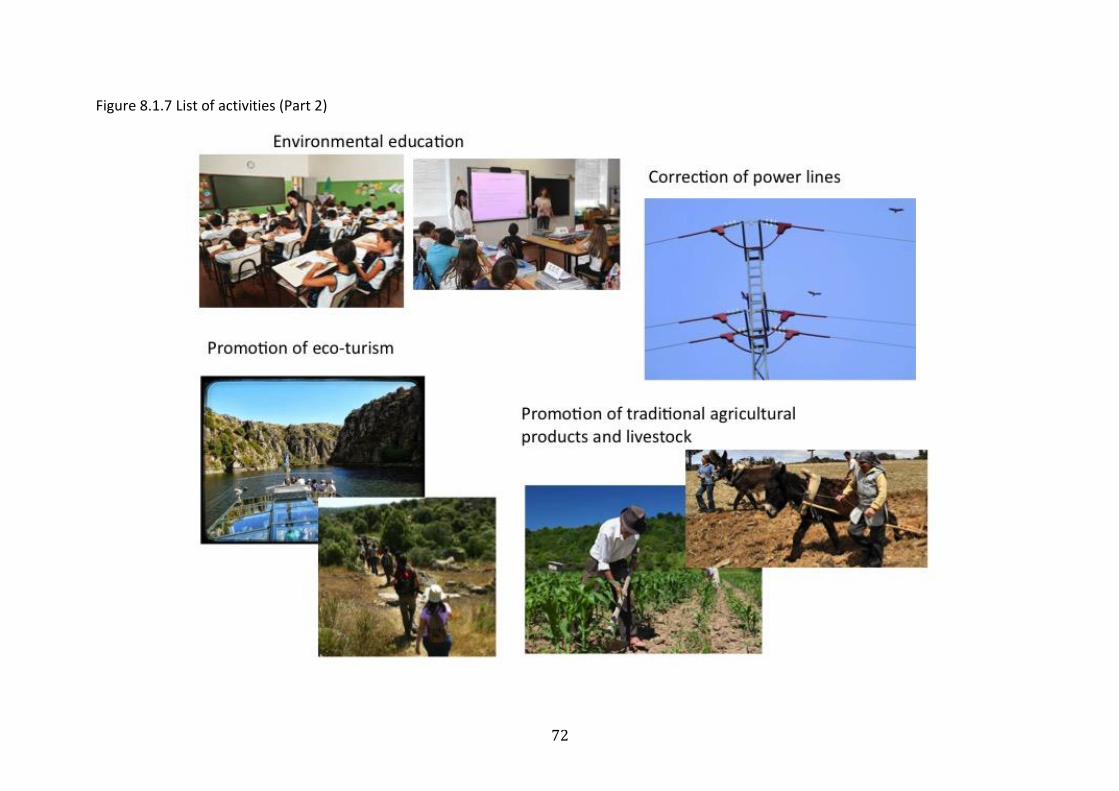
72
Figure 8.1.7 List of activities (Part 2)

73
8.2 Cards (Portuguese) Figure 8.2.1 UCT training card, adapted from Fairbrass et al. (2015)
Cartão A
Um café Um restaurante A dentista O supermercado
O cinema

74
Figure 8.2.2 UCT control card, adapted from Fairbrass et al. (2015)
Cartão C
Podar arvores
Trabalhar no jardim Pôr lixo orgânico no compostor Usar repelentes para insectos

75
Figure 8.2.3 UCT treatment card. adapted from Fairbrass et al. (2015)
Cartão B
Podar arvores Trabalhar no jardim Pôr lixo orgânico no compostor Usar veneno para matar animais selvagens Usar repelentes para insectos

76
Figure 8.2.4 Card to assist with Likert questions (1 = Strongly disagree, 5 = Strongly agree).

77
Figure 8.2.5 Card to assist with Likert questions (1 = Very unlikely, 5 = Very likely).
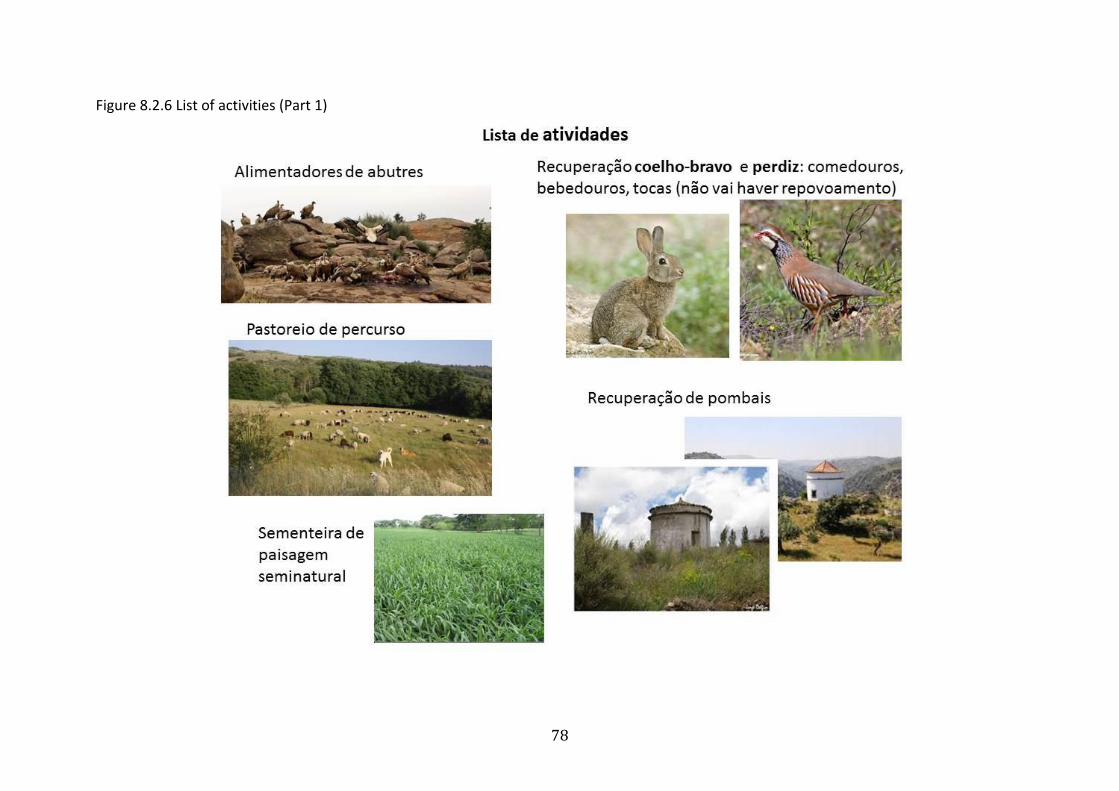
78
Figure 8.2.6 List of activities (Part 1)

79
Figure 8.2.7 List of activities (Part 2)
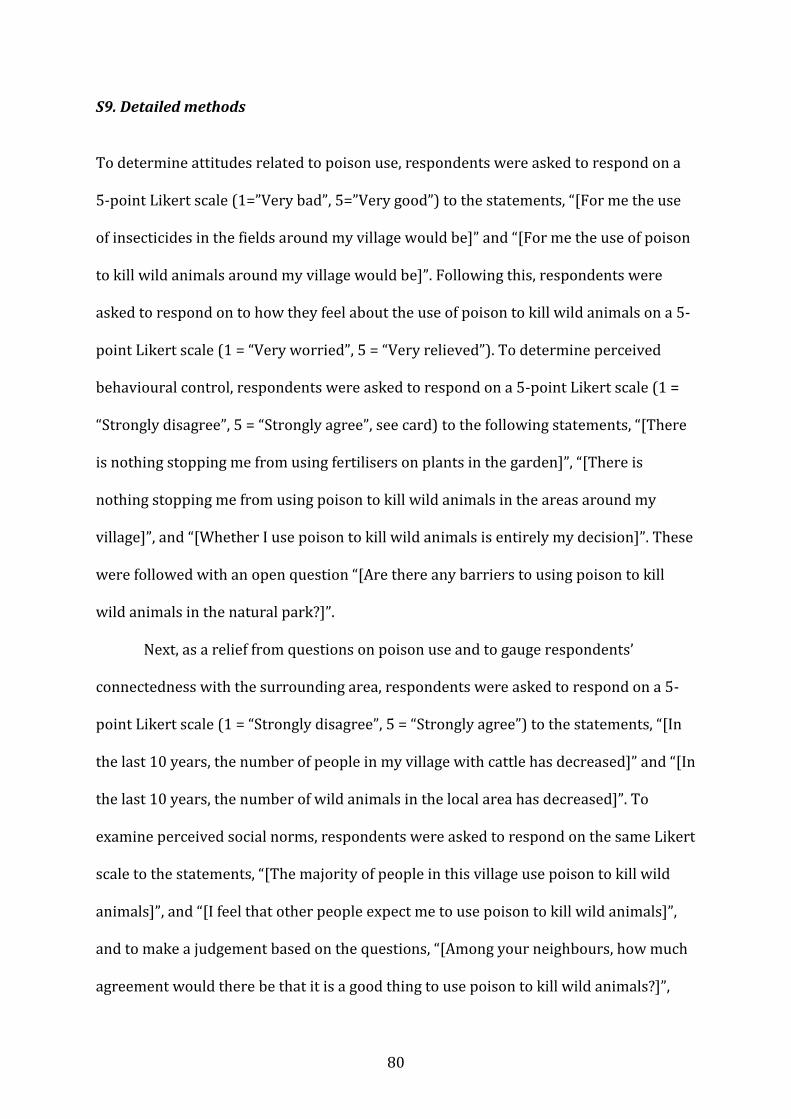
80
S9. Detailed methods
To determine attitudes related to poison use, respondents were asked to respond on a
5-point Likert scale (1=”Very bad”, 5=”Very good”) to the statements, “[For me the use
of insecticides in the fields around my village would be]” and “[For me the use of poison
to kill wild animals around my village would be]”. Following this, respondents were
asked to respond on to how they feel about the use of poison to kill wild animals on a 5-
point Likert scale (1 = “Very worried”, 5 = “Very relieved”). To determine perceived
behavioural control, respondents were asked to respond on a 5-point Likert scale (1 =
“Strongly disagree”, 5 = “Strongly agree”, see card) to the following statements, “[There
is nothing stopping me from using fertilisers on plants in the garden]”, “[There is
nothing stopping me from using poison to kill wild animals in the areas around my
village]”, and “[Whether I use poison to kill wild animals is entirely my decision]”. These
were followed with an open question “[Are there any barriers to using poison to kill
wild animals in the natural park?]”.
Next, as a relief from questions on poison use and to gauge respondents’
connectedness with the surrounding area, respondents were asked to respond on a 5-
point Likert scale (1 = “Strongly disagree”, 5 = “Strongly agree”) to the statements, “[In
the last 10 years, the number of people in my village with cattle has decreased]” and “[In
the last 10 years, the number of wild animals in the local area has decreased]”. To
examine perceived social norms, respondents were asked to respond on the same Likert
scale to the statements, “[The majority of people in this village use poison to kill wild
animals]”, and “[I feel that other people expect me to use poison to kill wild animals]”,
and to make a judgement based on the questions, “[Among your neighbours, how much
agreement would there be that it is a good thing to use poison to kill wild animals?]”,

81
and “[In your family, how much agreement would there be that it’s a good thing to use
poison to kill wild animals?]”. Finally, on a 5-point Likert scale (1 = “Not at all”, 5 = “Very
much”) respondents were asked to respond to the statement “[The approval of my
family and friends is important to me]”.
For the knowledge quiz, respondents were asked “[It is illegal, regulated or legal
to use product name]” for each of six products ranging from illegal poison to rat poison
and legal insecticides. To determine motivations for poison use, respondents were
asked to respond on a 5-point Likert scale (1 = “Very unlikely”, 5 = “Very likely”, see
card) to a seven potential reasons preceded by “[People in my village might use poison
to…]”. These potential reasons were based on previous studies and advice from local
NGO staff. For both the quiz and motivation sections, lists were read in a random order
to account for potential order effects. Then, respondents were presented with the
following scenario “[A number of actions for the protection of nature are put into place
in Parque Natural do Douro Internacional, with the aim of increasing populations of
birds of prey.]” and an accompanying card of activities (see card) based on input from
SPEA staff regarding the proposed LIFE Rupis project activities. Respondents were then
asked “[What effect do you think these actions would have on the lives of people in your
village?]” on a scale of 1 = “Very negative” to 5 = “Very positive”. Two statements
followed, “[An increase in the number of birds of prey in the local area would be]” on a
scale of 1 = “Very bad” to 5 = “Very good”, and “[An increase in the number of birds of
prey in the local area will result in an increase or decrease in the use of poison to kill
wild animals by people in my village]” on a scale of 1 = “Increase considerably” to 5 =
“Decrease considerably”. This was followed by an open question about who carries out
work for the protection of nature (changed from ‘conservation’ following the pilot),
whether the protection of nature is necessary (1 = “Very unnecessary”, 5 = “Very

82
necessary”), and whether respondents felt connected to the protection of nature (“Yes”,
“No” or “Don’t know”) with “Yes” resulting in a prompt for more detail as to how they
felt connected.
Finally, respondents were asked to respond on the agree/disagree Likert scale to
“[I intend to use poison to kill wild animals in the natural park in the next 3 years]” and
“[I intend to use poison to kill wild animals on my land in the next 3 years]”.
Respondents were then asked directly to respond “Yes” or “No” to whether they had
used poison to (1) kill wild animals, (2) kill rats, and whether there was anyone in the
village who had use poison to kill wild animals in the last 3 years.

83
S10. Indices and scores
Theory of Planned Behaviour indices
PBC index scores ranged from 1 (“Strongly disagree”) to 5 (“Strongly agree”) and
combined two questions (17 and 18) on how much individuals agree or disagree that
nothing is stopping them from using poison to kill wild animals around their village and
that it’s their decision whether to use poison or not.
PSN index scores ranged from 1 (“Strongly disagree”) to 5 (“Strongly agree”)
combining agreement from four questions (22, 23, 24 and 25) on how much individuals
believe that the majority of people in their village use poison, how much they feel that
others expect them to use poison, and how much they believe their neighbours and
family agree with the use of poison to kill wild animals.
Attitude index scores ranged from 1 (“Very negative”) to 5 (“Very positive”)
combing two questions (14 and 15) on whether individuals would find the use of poison
to kill wild animals around their village to be very bad/very good and very
worrying/very relieving.
Product legal knowledge score
Responses for a legal product were ‘Legal’ or ‘Regulated’, and for illegal products was
‘Illegal’. An incorrect response for illegal products was ‘Legal’ or ‘Regulated’, and for
legal products the incorrect response was ‘Illegal’. ‘Don’t know’ and ‘Don’t know
product’ were considered incorrect responses for all products. Correct responses scored
1, incorrect responses scored 0. A score of 6 indicates perfect legal knowledge of
products.

84
S11. Descriptive statistics
Table 11. Descriptive statistics of questionnaire responses (N=193). Missing data is shown as NA.
Type Variables Responses
0 1 2 3 4 5 Don't know NA's
Attitudes
Pesticides in field 1 - 43 85 55 7 1 - 2
Poison to kill animals 1 - 73 81 28 7 1 1 2
Poison to kill animals 2 - 23 73 64 26 1 4 2
Perceived
behavioural
control
Nothing stopping from using fertilisers 3 - 6 49 36 94 4 1 3
Nothing stopping from using poison 3 - 48 113 11 19 - - 2
Own decision whether to use poison 3 - 31 113 9 36 1 1 2
Barriers to using poison in the Park 4 123 68 - - - - - 2
Perceived
social
norms
Majority in village use poison 3 - 20 116 13 10 1 30 3
Others expect me to poison 3 - 24 141 9 11 - 5 3
Agreement among neighbours 5 - 10 87 21 7 - 63 5
Agreement among family 6 - 27 126 11 6 - 12 11
Importance of family/friends’ approval 6 - 8 9 19 71 80 3 3
Legal
knowledge
Calda bordalesa 7 - 103 32 1 37 16 - 4
Rat poison 7 - 135 28 8 5 13 - 4
Strychinine 7 - - 3 56 97 33 - 4
Confidor 7 - 9 3 3 169 5 - 4

85
Kanat-zeon 7 - 1 3 1 181 3 - 4
Roundup 7 - 51 37 24 56 21 - 4
Motivation
Control pest animals 8 - 4 29 10 116 27 3 4
Control predators near house 8 - 33 99 13 31 8 5 4
Control predators outside village 8 - 30 105 14 30 4 6 4
Control weeds 8 - 4 28 12 98 43 4 4
Kill problem animal 8 - 23 101 9 37 5 12 6
Control birds of prey near house 8 - 42 115 9 8 6 9 4
Kill stray dogs 8 - 47 108 8 21 1 4 4
Direct
questions
Used poison to kill wild animals? 4 188 - - - - - - 5
Used poison to kill rats? 4 83 105 - - - - - 5
Others used poison? 4 107 13 - - - - 68 5
1 On a scale of 1-5 where 1= “Very bad”, and 5= “Very good” 2 On a scale of 1-5 where 1= “Very worried”, and 5= “Very relieved” 3 On a scale of 1-5 where 1= “Strongly disagree” and 5= “Strongly agree” 4 On a scale of 0-1 where 0= “No” and 1= “Yes” 5 On a scale of 1-5 where 1= “Strong disagreement” and 5= “Strong agreement” 6 On a scale of 1-5 where 1= “Not at all” and 5= “Very much” 7 On a scale of 1-5 where 1= “Legal”, 2= “Regulated”, 3= “Illegal”, 4= “Don’t know product”, and 5= “Don’t know” 8 On a scale of 1-5 where 1= “Very unlikely” and 5= “Very likely”
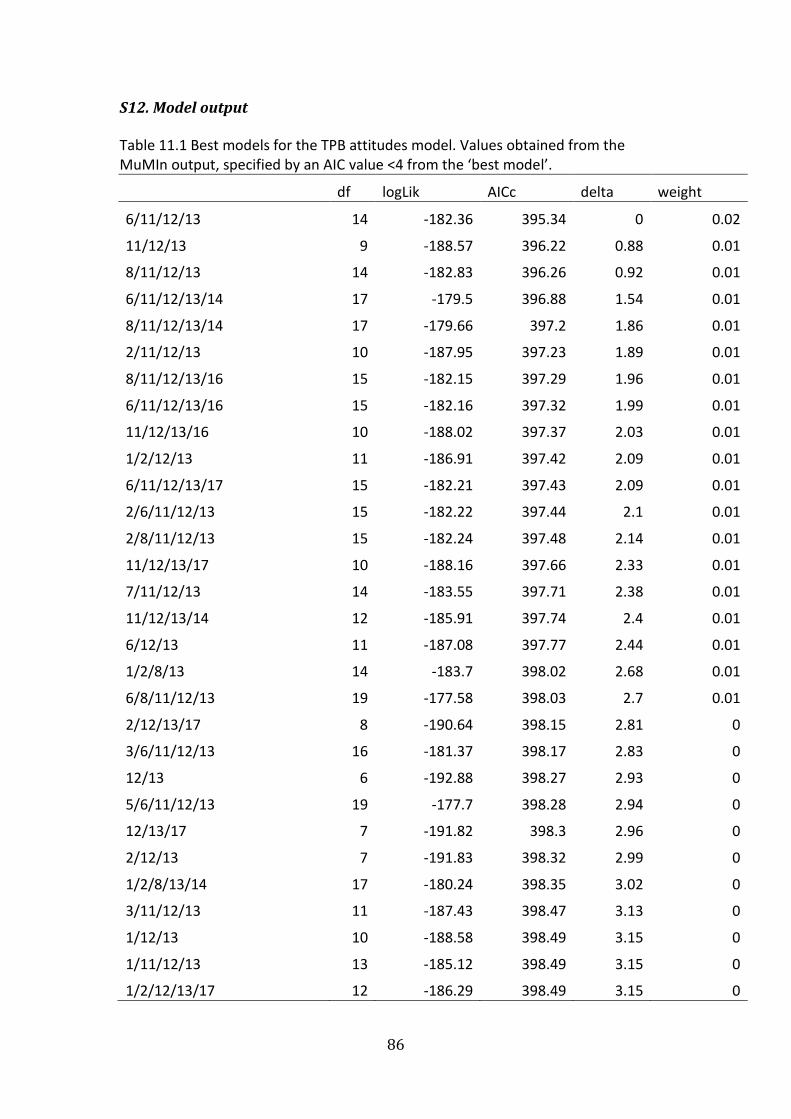
86
S12. Model output
Table 11.1 Best models for the TPB attitudes model. Values obtained from the MuMIn output, specified by an AIC value <4 from the ‘best model’.
df logLik AICc delta weight
6/11/12/13 14 -182.36 395.34 0 0.02
11/12/13 9 -188.57 396.22 0.88 0.01
8/11/12/13 14 -182.83 396.26 0.92 0.01
6/11/12/13/14 17 -179.5 396.88 1.54 0.01
8/11/12/13/14 17 -179.66 397.2 1.86 0.01
2/11/12/13 10 -187.95 397.23 1.89 0.01
8/11/12/13/16 15 -182.15 397.29 1.96 0.01
6/11/12/13/16 15 -182.16 397.32 1.99 0.01
11/12/13/16 10 -188.02 397.37 2.03 0.01
1/2/12/13 11 -186.91 397.42 2.09 0.01
6/11/12/13/17 15 -182.21 397.43 2.09 0.01
2/6/11/12/13 15 -182.22 397.44 2.1 0.01
2/8/11/12/13 15 -182.24 397.48 2.14 0.01
11/12/13/17 10 -188.16 397.66 2.33 0.01
7/11/12/13 14 -183.55 397.71 2.38 0.01
11/12/13/14 12 -185.91 397.74 2.4 0.01
6/12/13 11 -187.08 397.77 2.44 0.01
1/2/8/13 14 -183.7 398.02 2.68 0.01
6/8/11/12/13 19 -177.58 398.03 2.7 0.01
2/12/13/17 8 -190.64 398.15 2.81 0
3/6/11/12/13 16 -181.37 398.17 2.83 0
12/13 6 -192.88 398.27 2.93 0
5/6/11/12/13 19 -177.7 398.28 2.94 0
12/13/17 7 -191.82 398.3 2.96 0
2/12/13 7 -191.83 398.32 2.99 0
1/2/8/13/14 17 -180.24 398.35 3.02 0
3/11/12/13 11 -187.43 398.47 3.13 0
1/12/13 10 -188.58 398.49 3.15 0
1/11/12/13 13 -185.12 398.49 3.15 0
1/2/12/13/17 12 -186.29 398.49 3.15 0

87
8/11/12/13/17 15 -182.75 398.49 3.16 0
2/11/12/13/17 11 -187.46 398.53 3.19 0
8/11/13/14 15 -182.78 398.56 3.23 0
6/12/13/17 12 -186.34 398.6 3.26 0
3/8/11/12/13 16 -181.61 398.63 3.3 0
1/6/11/12/13 18 -179.17 398.71 3.37 0
11/12/13/16/17 11 -187.56 398.73 3.4 0
2/11/12/13/16 11 -187.59 398.78 3.44 0
1/2/8/12/13 16 -181.68 398.78 3.45 0
2/8/11/12/13/14 18 -179.23 398.81 3.48 0
6/12/13/14 14 -184.12 398.85 3.51 0
1/2/12/13/14 14 -184.13 398.87 3.54 0
2/7/11/12/13 15 -182.95 398.9 3.57 0
1/2/7/12/13 16 -181.74 398.91 3.57 0
2/8/11/12/13/16 16 -181.76 398.95 3.61 0
1/2/13 9 -189.94 398.96 3.62 0
2/11/12/13/14 13 -185.36 398.97 3.63 0
8/12/13/14 14 -184.2 399 3.67 0
8/12/13 11 -187.7 399.02 3.68 0
2/6/11/12/13/14 18 -179.37 399.09 3.75 0
8/11/12/13/14/16 18 -179.37 399.09 3.76 0
8/11/13 12 -186.59 399.1 3.76 0
1/6/12/13 15 -183.08 399.17 3.83 0
7/11/12/13/16 15 -183.09 399.18 3.84 0
6/11/12/13/14/17 18 -179.42 399.2 3.86 0
2/6/12/13 12 -186.64 399.2 3.86 0
12/13/14 9 -190.06 399.21 3.88 0
11/12/13/14/17 13 -185.49 399.22 3.88 0
2/8/12/13 12 -186.66 399.23 3.89 0
7/12/13 11 -187.82 399.25 3.91 0
6/11/12/13/14/16 18 -179.46 399.28 3.95 0
1/8/13/14 16 -181.94 399.3 3.97 0
12/13/14/17 10 -188.99 399.32 3.98 0

88
Table 11.2. Key to variable codes used in model development and the corresponding codes from the attitude model selection.
Model code Parameter code Parameter
1 Age
2 Gen
3 Liv
4 Mot1
5 Mot2
6 Mot3
7 Mot4
8 Mot5
9 Mot6
10 Municipality
11 Occ_sim
12 Per_con_ind
13 Per_con4_sim
14 Per_nor_ind
15 Per_nor5
16 Prd_scr
17 Size
Table 11.3. Best models for the TPB perceived behavioural control model. Values obtained from the MuMIn output, specified by an AIC value <4 from the ‘best model’.
df logLik AICc delta weight
11/14/15/16 12 -135.41 296.73 0 0.02
11/14/15/16/17 13 -134.43 297.11 0.38 0.02
14/15/16 7 -141.36 297.39 0.66 0.01
14/16 6 -142.61 297.72 0.99 0.01
11/14/16 11 -137.13 297.87 1.14 0.01
3/14/16 9 -139.41 297.9 1.17 0.01
11/13/14/15/16/17 16 -131.29 298.01 1.28 0.01
12/14/15/16 10 -138.35 298.03 1.31 0.01
8/14/15/16 12 -136.2 298.31 1.59 0.01
11/12/13/14/15/16/17 19 -127.8 298.48 1.75 0.01

89
8/14/16 11 -137.44 298.49 1.76 0.01
11/12/14/15/16/17 16 -131.54 298.51 1.78 0.01
11/12/14/15/16 15 -132.79 298.59 1.86 0.01
14/15/16/17 8 -140.88 298.63 1.9 0.01
3/14/16/17 10 -138.66 298.64 1.92 0.01
12/14/15/16/17 11 -137.55 298.7 1.97 0.01
3/14/15/16 10 -138.73 298.79 2.06 0.01
11/14/16/17 12 -136.5 298.91 2.19 0.01
11/13/14/15/16 15 -132.98 298.97 2.24 0.01
12/14/16 9 -139.95 298.98 2.25 0.01
1/11/14/15/16 16 -131.81 299.04 2.32 0.01
4/11/14/15/16 13 -135.4 299.06 2.33 0.01
14/16/17 7 -142.29 299.25 2.53 0.01
8/14/15/16/17 13 -135.51 299.27 2.54 0.01
3/14/15/16/17 11 -137.84 299.29 2.56 0.01
4/14/15/16 8 -141.22 299.3 2.58 0.01
11/12/13/14/15/16 18 -129.55 299.46 2.73 0
4/11/14/15/16/17 14 -134.43 299.47 2.75 0
5/11/14/15/16 14 -134.44 299.48 2.76 0
4/14/16 7 -142.42 299.51 2.79 0
7/14/15/16 12 -136.8 299.52 2.79 0
3/12/14/16 12 -136.89 299.69 2.96 0
12/14/16/17 10 -139.18 299.7 2.97 0
3/11/14/15/16/17 16 -132.14 299.7 2.98 0
3/11/14/16 14 -134.56 299.73 3 0
1/11/14/15/16/17 17 -130.93 299.74 3.01 0
8/12/14/15/16 15 -133.38 299.76 3.03 0
7/14/16 11 -138.09 299.8 3.07 0
3/11/14/16/17 15 -133.42 299.83 3.11 0
3/4/14/16 10 -139.25 299.84 3.11 0
8/14/16/17 12 -136.99 299.89 3.17 0
1/14/15/16 11 -138.16 299.93 3.2 0
5/11/14/15/16/17 15 -133.47 299.94 3.21 0
3/16 7 -142.64 299.94 3.22 0
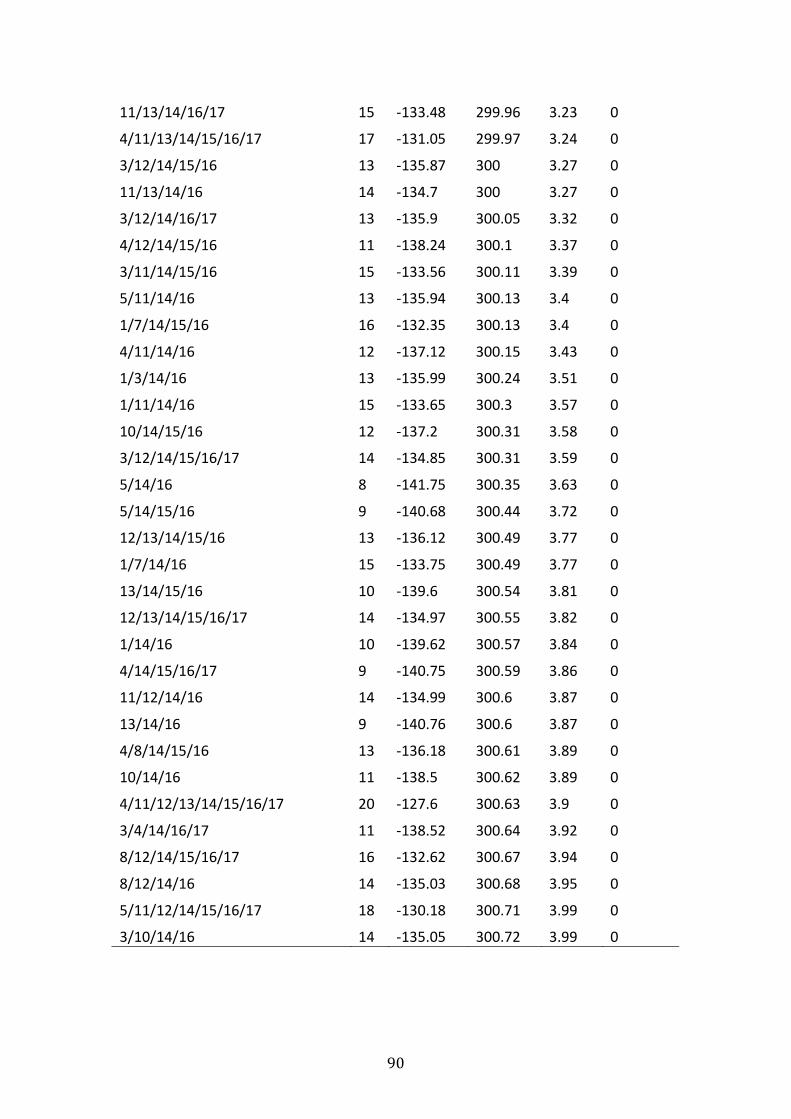
90
11/13/14/16/17 15 -133.48 299.96 3.23 0
4/11/13/14/15/16/17 17 -131.05 299.97 3.24 0
3/12/14/15/16 13 -135.87 300 3.27 0
11/13/14/16 14 -134.7 300 3.27 0
3/12/14/16/17 13 -135.9 300.05 3.32 0
4/12/14/15/16 11 -138.24 300.1 3.37 0
3/11/14/15/16 15 -133.56 300.11 3.39 0
5/11/14/16 13 -135.94 300.13 3.4 0
1/7/14/15/16 16 -132.35 300.13 3.4 0
4/11/14/16 12 -137.12 300.15 3.43 0
1/3/14/16 13 -135.99 300.24 3.51 0
1/11/14/16 15 -133.65 300.3 3.57 0
10/14/15/16 12 -137.2 300.31 3.58 0
3/12/14/15/16/17 14 -134.85 300.31 3.59 0
5/14/16 8 -141.75 300.35 3.63 0
5/14/15/16 9 -140.68 300.44 3.72 0
12/13/14/15/16 13 -136.12 300.49 3.77 0
1/7/14/16 15 -133.75 300.49 3.77 0
13/14/15/16 10 -139.6 300.54 3.81 0
12/13/14/15/16/17 14 -134.97 300.55 3.82 0
1/14/16 10 -139.62 300.57 3.84 0
4/14/15/16/17 9 -140.75 300.59 3.86 0
11/12/14/16 14 -134.99 300.6 3.87 0
13/14/16 9 -140.76 300.6 3.87 0
4/8/14/15/16 13 -136.18 300.61 3.89 0
10/14/16 11 -138.5 300.62 3.89 0
4/11/12/13/14/15/16/17 20 -127.6 300.63 3.9 0
3/4/14/16/17 11 -138.52 300.64 3.92 0
8/12/14/15/16/17 16 -132.62 300.67 3.94 0
8/12/14/16 14 -135.03 300.68 3.95 0
5/11/12/14/15/16/17 18 -130.18 300.71 3.99 0
3/10/14/16 14 -135.05 300.72 3.99 0

91
Table 11.4. Key to variable codes used in model development and the corresponding codes from the perceived behavioural control model selection.
Model code Parameter code Parameter
1 Age
2 Att_1
3 Att_ind
4 Gen
5 Liv
6 Mot1
7 Mot2
8 Mot3
9 Mot4
10 Mot5
11 Mot6
12 Municipality
13 Occ_sim
14 Per_con_ind
15 Per_con4_sim
16 Prd_scr
17 Size

92
Table 6.5. Best models for the TPB perceived social norms model. Values obtained from the MuMIn output, specified by an AIC value <4 from the ‘best model’.
df logLik AICc delta weight
3/14/15 13 -112.37 252.99 0 0.03
3 5 -121.49 253.33 0.34 0.02
3/15 10 -116.01 253.35 0.36 0.02
3/14 8 -118.3 253.46 0.47 0.02
3/14/16 9 -117.26 253.61 0.62 0.02
3/14/15/16 14 -111.56 253.74 0.75 0.02
3/9 10 -116.24 253.81 0.81 0.02
3/14/15/17 14 -111.91 254.44 1.45 0.01
3/9/14/16 14 -111.98 254.57 1.58 0.01
3/4 6 -121.12 254.74 1.75 0.01
3/16 6 -121.13 254.75 1.76 0.01
3/9/16 11 -115.62 254.84 1.85 0.01
3/9/15 15 -110.93 254.86 1.87 0.01
14/15 10 -116.76 254.86 1.87 0.01
3/4/15 11 -115.67 254.95 1.96 0.01
3/14/17 9 -117.95 254.99 2 0.01
3/9/14 13 -113.39 255.02 2.03 0.01
3/4/14/16 10 -116.85 255.03 2.04 0.01
3/4/14/15 14 -112.22 255.05 2.06 0.01
3/15/16 11 -115.78 255.17 2.18 0.01
3/17 6 -121.34 255.17 2.18 0.01
3/15/17 11 -115.79 255.18 2.19 0.01
3/5/14/15 15 -111.1 255.21 2.22 0.01
3/14/15/16/17 15 -111.12 255.24 2.25 0.01
3/14/16/17 10 -116.96 255.25 2.26 0.01
3/4/14 9 -118.13 255.34 2.35 0.01
3/4/14/15/16 15 -111.19 255.39 2.4 0.01
3/9/14/15 18 -107.61 255.58 2.58 0.01
14/15/17 11 -115.99 255.6 2.6 0.01
3/4/16 7 -120.53 255.73 2.74 0.01

93
3/4/9 11 -116.08 255.76 2.77 0.01
3/9/17 11 -116.12 255.86 2.87 0.01
14/15/16 11 -116.15 255.92 2.92 0.01
3/5/14 10 -117.31 255.95 2.96 0.01
3/5 7 -120.65 255.97 2.98 0.01
3/5/15 12 -115.03 255.98 2.99 0.01
3/9/14/15/16 19 -106.58 256.03 3.04 0.01
3/5/9 12 -115.18 256.27 3.28 0.01
3/9/14/16/17 15 -111.71 256.42 3.43 0
3/4/9/16 12 -115.26 256.43 3.44 0
3/5/14/15/16 16 -110.51 256.43 3.44 0
3/4/15/16 12 -115.27 256.45 3.45 0
3/9/15/16 16 -110.53 256.48 3.49 0
3/4/14/15/17 15 -111.74 256.49 3.5 0
3/4/9/14/16 15 -111.76 256.52 3.52 0
3/4/17 7 -120.95 256.56 3.57 0
4/14/15 11 -116.48 256.57 3.57 0
3/6/16 11 -116.5 256.61 3.62 0
3/16/17 7 -120.99 256.66 3.66 0
3/5/14/16 11 -116.52 256.66 3.67 0
3/4/14/16/17 11 -116.53 256.67 3.68 0
14/15/16/17 12 -115.39 256.69 3.7 0
5/14/15 12 -115.41 256.74 3.75 0
3/4/15/17 12 -115.42 256.76 3.77 0
3/9/14/17 14 -113.09 256.78 3.79 0
3/4/14/15/16/17 16 -110.72 256.86 3.87 0
3/4/14/17 10 -117.77 256.88 3.89 0
3/9/16/17 12 -115.52 256.96 3.97 0
3/9/15/17 16 -110.78 256.97 3.98 0
3/5/14/15/17 16 -110.78 256.97 3.98 0

94
Table 6.6. Key to variable codes used in model development and the corresponding codes from the perceived social norm model selection.
Model code Parameter code Parameter
1 Age Age of participant
2 Att_1 Attitude towards the use of herbicides
3 Att_ind Index of attitudes
4 Gen Gender of participant
5 Liv Owner of livestock (now or in the past)
6 Mot1 Poison used to kill rats
7 Mot2 Poison used to control predators (near to village)
8 Mot3 Poison used to control predators (far from village)
9 Mot4
10 Mot5
11 Mot6 Poison used to control birds of prey populations
12 Municipality The municipality in which the site is located
13 Occ_sim Main occupation
14 Per_nor_ind Index of perceived behavioural control
15 Per_nor5 Family/friends approval is important
16 Prd_scr
17 Size Site is a village or town

95
Table 6.7. Reference levels for parameters of the Theory of Planned Behaviour models for attitude, perceived social norms and perceived behavioural control.
Parameter Reference level
Attitude
Attitude index NA
Are there barriers to using poison in the park No
PBC index Strongly disagree
Occupation Farmer
Perceived Social Norms
PSN index NA
Knowledge score NA
PBC index Strongly disagree
Are there barriers to using poison in the park No
Size Village
Perceived Behavioural Control
PBC index NA
Attitude index Very negative
PSN index Strongly disagree
Opinions of others Not at all important
Knowledge score NA

96
S13. Unpublished data
Confirmed cases of wild animal poisoning in and around Parque Natural do Douro Internacional 1992-2015. Dataset contains dates, species, number of animals and laboratory results of poisoning incidents, confirmed through retrieval and laboratory testing of poisoned carcasses. Access provided by A. Monteiro, ICNF.