rupture process of subduction-zone earthquakes · the seismicity in other subduction zones is...
TRANSCRIPT

Ann. Rev. Earth Planet. Sci. 1986. 14 : 293-322Copyri#ht © 1986 by Annual Reviews Inc. All ri#hts reserved
RUPTURE PROCESS OFSUBDUCTION-ZONEEARTHQUAKES
Hiroo Kanamori
Seismological Laboratory, California Institute of Technology, Pasadena,California 91125
INTRODUCTION
This review is primarily concerned with the rupture process of largesubduction-zone earthquakes determined by various seismologicalmethods, and with its interpretation in terms of an asperity model.It is not possible to make a thorough and extensive review on the subjectbecause of the limited length. Consequently, this review is inevitably biasedtoward the works in which I was directly involved through collaborationswith various investigators.
The distribution of large earthquakes along subduction zones has adistinct pattern. Great earthquakes occur in South America, Alaska, theAleutians, and Kamchatka. In contrast, earthquakes along the Marianasare smaller. The seismicity in other subduction zones is intermediatebetween these two groups (see Figure 1). Although this regional variation now generally accepted, it was not until an appropriate method forquantification of large earthquakes was developed that the regionalvariation was clearly recognized. In view of its fundamental importance inseismology, we first review the quantification method.
QUANTIFICATION OF EARTHQUAKES
Since the physical process underlying an earthquake is very complex, wecannot express everY detail of an earthquake by a single parameter.Nevertheless, it would be useful if we could find a single number thatrepresents the overall physical size of an earthquake. This was the very
2930084-6597/86/0515-0293502.00
www.annualreviews.org/aronlineAnnual Reviews
Ann
u. R
ev. E
arth
. Pla
net.
Sci.
1986
.14:
293-
322.
Dow
nloa
ded
from
arj
ourn
als.
annu
alre
view
s.or
gby
CA
LIF
OR
NIA
IN
STIT
UT
E O
F T
EC
HN
OL
OG
Y o
n 09
/13/
05. F
or p
erso
nal u
se o
nly.

294 KANAMORI
+
www.annualreviews.org/aronlineAnnual Reviews
Ann
u. R
ev. E
arth
. Pla
net.
Sci.
1986
.14:
293-
322.
Dow
nloa
ded
from
arj
ourn
als.
annu
alre
view
s.or
gby
CA
LIF
OR
NIA
IN
STIT
UT
E O
F T
EC
HN
OL
OG
Y o
n 09
/13/
05. F
or p
erso
nal u
se o
nly.

SUBDUCTION-ZONE EARTHQUAKES 295
philosophy of Richter’s (1935) earthquake magnitude scale. He defined local magnitude scale ML for southern California using the amplitude ofseismic waves recorded by the Wood-Anderson seismograph. Although MI~is a purely empirical scale without any direct relation to the physicalparameters of the earthquake source, it has proved to be extremely useful instudying seismicity.
Gutenberg and Richter (e.g. Gutenberg 1945, Gutenberg & Richter 1956)extended the magnitude scale to earthquakes worldwide and developedvarious empirical scales. One of the most widely used scales is the surface-wave magnitude Ms, which is defined by the amplitude of surface waveswith a period of about 20 s. (For more details on magnitude scales, seeGeller & Kanamori 1977, Bath 1981, Abe 1981, Chung & Bernreuter 1981,Kanamori 1983.)
An important empirical relation is the magnitude-energy relationobtained by Gutenberg & Richter (1956)
log Es = 1.5Ms + 11.8, (1)
where Es is the energy (in ergs) radiated from an earthquake source in theform of elastic waves. This relation was determined empirically too, and it issubject to large uncertainty. Nevertheless, it is widely used in seismology.
In Figure 1, the surface-wave magnitude Ms is given in parentheses. The1906 Colombia earthquake has the largest Ms (8.6). However, the size of itsrupture zone (indicated by the shaded area in Figure 1) is not the largest.The 1960 Chilean earthquake and the 1964 Alaskan earthquake, forexample, have much larger rupture zones, yet the Ms values for these eventsare smaller. If Ms is related to the energy Es through (1), and if the energyrelease per unit rupture area is approximately constant, it is rather strangeto have smaller Ms values for events with much larger rupture zones. Thisproblem had been recognized by several investigators, but no systematicinvestigation was made until long-period seismic waves began to be usedfor seismic source studies.
The difficulty in using Ms for quantification of large earthquakes arisesfrom the fact that the period of surface waves (20 s) used for thedetermination of Ms is much shorter than the time scale of faultingassociated with great earthquakes, for which the fault length can be aslong as 1000 km. The duration of faulting is approximately equal to thefault length L divided by the rupture velocity V (which is usually about2-3 km s-1). The time scales of faulting are therefore about 40, 100, and400 s for events with rupture lengths of 100, 250, and 1000 km, respec-tively. Hence, the 20-s surface waves cannot represent the entire ruptureprocess of great earthquakes, and the result is that the Ms scale issaturated (as seen in Figure 1).
www.annualreviews.org/aronlineAnnual Reviews
Ann
u. R
ev. E
arth
. Pla
net.
Sci.
1986
.14:
293-
322.
Dow
nloa
ded
from
arj
ourn
als.
annu
alre
view
s.or
gby
CA
LIF
OR
NIA
IN
STIT
UT
E O
F T
EC
HN
OL
OG
Y o
n 09
/13/
05. F
or p
erso
nal u
se o
nly.

296 KANAMORI
We can circumvent this difficulty by using longer-period surface wavesfor quantification purposes. Aki (1966a,b) used long-period Love waves determine the seismic moment M0 of the 1964 Niigata earthquake. Theseismic moment Mo is equal to #DS, where D is the average slip on the fault,S is the fault area, and/~ is the rigidity of the material surrounding the fault(see Steketee 1958, Maruyama 1963, Burridge & Knopoff 1964). Theamplitude of long-period (longer than the duration of faulting) seismicwaves generated by an earthquake is proportional to the seismic moment.
Although the seismic moment represents the size of an earthquake onlyat very long periods, it has proved to be a useful parameter for overallquantification of earthquakes, particularly for great earthquakes. It can bealso related to Es with some assumptions. Kanamori (1977a) shows that
E~ = Mo/(2#/Aa), (2)
where Atr is the average stress drop in earthquakes. Various observationsindicate that 2/~/Atr is roughly 2 x 10⁴. With these assumptions, we canestimate Es from Mo. Since Mo can be reliably determined from obser-vational data, and since the energy is a fundamental physical quantity,this method is useful for quantification purposes. Once E~ is determined,it is possible to convert it to a magnitude scale by using (1) inversely, i.e.
M~, = (log s- 11.8)/1.5 (3)
or
Mw = (log 0-16.1)/1.5. (4)
M,~ is a magnitude scale defined in terms of energy or moment through (3)or (4). It is important to note that unlike other magnitude scales, this scale not empirical as long as the estimate of the energy through (2) is correct.Since this magnitude is derived from either energy or seismic moment, it isoften called either the energy magnitude or the moment magnitude (see alsoPurcaru & Berckhemer 1978, Hanks & Kanamori 1979). For earthquakessmaller than 8, M~, generally agrees with Ms, which suggests that both of theassumptions used in estimating Es from Mo through (2) and relation (1) reasonable. Since Mo does not saturate as the size of the rupture zoneincreases, Mw does not saturate. In this regard, Mw is a better parameter forquantification of earthquakes than Ms. In Figure 1, Mw values for very largeearthquakes are given in brackets. The 1960 Chilean earthquake has thelargest Mw (9.5), and the 1964 Alaskan earthquake has the second largest
Mw (9.2).Since Mw is determined from very-long-period waves, it does not
necessarily represent the size of an earthquake at short periods (e.g. 1-10 s).However, many studies suggest that earthquake source spectra have certain
www.annualreviews.org/aronlineAnnual Reviews
Ann
u. R
ev. E
arth
. Pla
net.
Sci.
1986
.14:
293-
322.
Dow
nloa
ded
from
arj
ourn
als.
annu
alre
view
s.or
gby
CA
LIF
OR
NIA
IN
STIT
UT
E O
F T
EC
HN
OL
OG
Y o
n 09
/13/
05. F
or p
erso
nal u
se o
nly.
SUBDUCTION-ZONE EARTHQUAKES 297
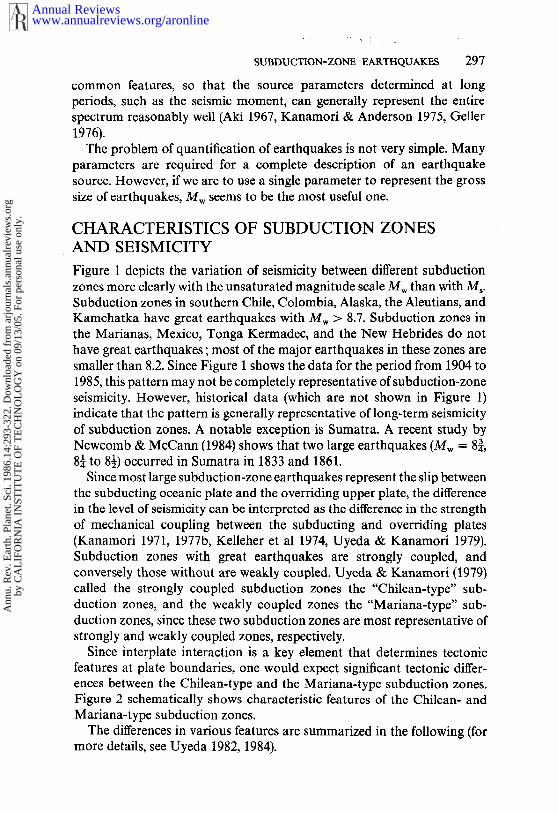
common features, so that the source parameters determined at longperiods, such as the seismic moment, can generally represent the entirespectrum reasonably well (Aki 1967, Kanamori & Anderson 1975, Geller1976).
The problem of quantification of earthquakes is not very simple. Manyparameters are required for a complete description of an earthquakesource. However, if we are to use a single parameter to represent the grosssize of earthquakes, Mw seems to be the most useful one.
CHARACTERISTICS OF SUBDUCTION ZONESAND SEISMICITYFigure 1 depicts the variation of seismicity between different subductionzones more clearly with the unsaturated magnitude scale Mw than with Ms.Subduction zones in southern Chile, Colombia, Alaska, the Aleutians, andKamchatka have great earthquakes with Mw > 8.7. Subduction zones inthe Marianas, Mexico, Tonga Kermadec, and the New Hebrides do nothave great earthquakes; most of the major earthquakes in these zones aresmaller than 8.2. Since Figure 1 shows the data for the period from 1904 to1985, this pattern may not be completely representative of subduction-zoneseismicity. However, historical data (which are not shown in Figure 1)indicate that the pattern is generally representative of long-term seismicityof subduction zones. A notable exception is Sumatra. A recent study byNewcomb & McCann (1984) shows that two large earthquakes (Mw = 8¼ to 8½) occurred in Sumatra in 1833 and 1861.
Since most large subduction-zone earthquakes represent the slip betweenthe subducting oceanic plate and the overriding upper plate, the differencein the level of seismicity can be interpreted as the difference in the strengthof mechanical coupling between the subducting and overriding plates(Kanamori 1971, 1977b, Kelleher et al 1974, Uyeda & Kanamori 1979).Subduction zones with great earthquakes are strongly coupled, andconversely those without are weakly coupled. Uyeda & Kanamori (1979)called the strongly coupled subduction zones the "Chilean-type" sub-duction zones, and the weakly coupled zones the "Mariana-type" sub-duction zones, since these two subduction zones are most representative ofstrongly and weakly coupled zones, respectively.
Since interplate interaction is a key element that determines tectonicfeatures at plate boundaries, one would expect significant tectonic differ-ences between the Chilean-type and the Mariana-type subduction zones.Figure 2 schematically shows characteristic features of the Chilean- andMariana-type subduction zones.
The differences in various features are summarized in the following (formore details, see Uyeda 1982, 1984).
www.annualreviews.org/aronlineAnnual Reviews
Ann
u. R
ev. E
arth
. Pla
net.
Sci.
1986
.14:
293-
322.
Dow
nloa
ded
from
arj
ourn
als.
annu
alre
view
s.or
gby
CA
LIF
OR
NIA
IN
STIT
UT
E O
F T
EC
HN
OL
OG
Y o
n 09
/13/
05. F
or p
erso
nal u
se o
nly.

298 KANAMORI
CALC-ALKALINE ANDESITES
(a) C.,.E.N TYPEMOUNTAIN BELT
RIDGE TYPE BASALTS
BASALTS
J~) FEW ANDESITES
~LD PLATE
:::::::::::::::::::::::::::::::::::: ~:::::::::::::::::::::::::::::::::::: f:::::::::::::::::::::::::::::::::::::::::;,
~r~~%: ::~:::~:~:::::~:~:~:: :~ :~ :::::::::::::::::::::::::::::::::::::::::::::::::::::::::::::::::::::::::::::::::::::::::::::::::::::
::~::~:~:~:]:’ .~ :~ ;~::::::::~:~:~:~:~:~:::::~:~:~:~:~:~:~:~:~:::::::::
Figure 2 Schematic comparison between the Chilean- and the Mariana-type subductionzones (slightly modified from Uyeda 1984).
www.annualreviews.org/aronlineAnnual Reviews
Ann
u. R
ev. E
arth
. Pla
net.
Sci.
1986
.14:
293-
322.
Dow
nloa
ded
from
arj
ourn
als.
annu
alre
view
s.or
gby
CA
LIF
OR
NIA
IN
STIT
UT
E O
F T
EC
HN
OL
OG
Y o
n 09
/13/
05. F
or p
erso
nal u
se o
nly.

SUBDUCTION-ZONE EARTHQUAKES 299
1. BENIOFF-ZONE DIP ANGLES The dip angle of the Benioff (or Wadati-Benioff) zone is very shallow in the Chilean-type subduction zone and steepin the Mariana-type subduction zone. Since the width of the interplatecontact zone is likely to increase as the dip angle decreases (Kelleher et al1974), this difference is consistent with the difference in the strength ofinterplate coupling. The trench is deeper at Mariana-type zones than atChilean-type zones.
2. EXISTENCE OF THE BACK-ARC BASIN The back-arc basin is commonlyfound for the Mariana-type subduction zones, but it is rare in the Chilean-type zones. A possible reason for this is that the increased horizontalcompressional stress associated with the strong plate coupling in theChilean-type zones inhibits back-arc opening.
3. OUTER RISE Watts & Talwani (1975) show that the shape of the outerrise (see Figure 2) varies from place to place, reflecting the difference in themagnitude of the compressive stress in the oceanic lithosphere. However,more recent studies indicate that the outer rise is a universal feature of thetrench-arc system and that no obvious regional variation exists (Caldwell etal 1976). If the magnitude of the compressive stress increases with thestrength ofinterplate coupling, one would expect a more pronounced outerrise off the Chilean-type subduction zones. The data available now,however, are inconclusive.
In the outer-rise zone, many normal-fault and thrust events occur(Stauder 1968, Chapple & Forsyth 1979). Normal-fault events are generallyshallower than thrust events, and they are considered to result fro.m thebending of the oceanic plate before it subducts beneath the upper plate.Ward (1983) examined the depth of outer-rise events and suggests that thedepth of transition from normal to thrust events varies from place to place.In general, it is shallower at the Chilean-type zones than at the Mariana-type zones, which suggests that the horizontal compressive stress is largerfor the Chilean-type zones.
4. VOLCANIC ROCK TYPES In general, andesites are more abundant in theChilean-type subduction zones, whereas basalts are more common inthe Mariana-type zones (e.g. Miyashiro 1974, Gill 1981). Although thedistribution of volcanic rocks is rather complex and there are manyexceptions, this general trend can be explained in terms of the differentdegree of plate coupling. At the Chilean-type zones, tlie higher compressivestress in the upper plate would increase interaction between the ascendingmagma and the crust, producing more andesitic volcanic rocks (e.g. Coulon& Thorpe 1981). However, the detailed mechanism is presently unknown.
www.annualreviews.org/aronlineAnnual Reviews
Ann
u. R
ev. E
arth
. Pla
net.
Sci.
1986
.14:
293-
322.
Dow
nloa
ded
from
arj
ourn
als.
annu
alre
view
s.or
gby
CA
LIF
OR
NIA
IN
STIT
UT
E O
F T
EC
HN
OL
OG
Y o
n 09
/13/
05. F
or p
erso
nal u
se o
nly.

300 KANAMORI
5. UPLIFT OF SHORELINES There is a striking difference in the uplift rateof shorelines between Chilean-type and Mariana-type subduction zones.Figure 3 shows the maximum height of the Holocene shoreline (5000 + 1000yr old) around the Pacific compiled by Yonekura (1983). The uplift of shorelines in the Chilean-type zones such as Chile and Alaska is very large,but almost no uplift is observed for the Marianas and Tonga subductionzones (both Mariana-type zones). A notable exception is the New Hebrides.Because of its moderate seismicity, the plate coupling there is notconsidered to be very strong. However, the uplift is almost as large as inChile. This can be explained by the collision of buoyant topographicfeatures against the New Hebrides arc (Taylor et al 1980). Such collisionsseem to play an important role in controlling the mechanical interactionbetween the plates.
PLATE MOTION AND SEISMICITY
Since great subduction-zone earthquakes are ultimately caused by strainaccumulation due to plate motion, seismicity is expected to correlate withplate parameters such as the absolute velocity, corivergence rate, plate age,
120"E 18o" 120"w
/.0 N
u’~, "~1 ~3 -~2
40"N." 7’.5
,2 ~" :’
0" ¯ -. .~_y ~.~.;? ~"
" 33
LO’S~/ //’~x .v MAXIMUM HEIOHT OF THE /~ ] :O’S
~J "25 HOLOCENE SHORELINE /} ~
120"E 180’ 120"W
Figure 3 Maximum height of the Ho]oc¢n¢ shorcfin¢ (5 + 1 x 10³ yr o]d) in mctc[s in and
around the Pacific (Yonekura 1983).
www.annualreviews.org/aronlineAnnual Reviews
Ann
u. R
ev. E
arth
. Pla
net.
Sci.
1986
.14:
293-
322.
Dow
nloa
ded
from
arj
ourn
als.
annu
alre
view
s.or
gby
CA
LIF
OR
NIA
IN
STIT
UT
E O
F T
EC
HN
OL
OG
Y o
n 09
/13/
05. F
or p
erso
nal u
se o
nly.

SUBDUCTION-ZONE EARTHQUAKES 301
Benioff-zone dip angle, and length of the downgoing slab. In order toinvestigate this problem, it is necessary to quantify the seismicity of eachsubduction zone. One difficulty is that the instrumental data are availableonly for roughly the past 80 yr.
Ruff & Kanamori (1980) assumed that the level of seismic activity of indivudual subduction zone can be represented by the magnitude Mw of thelargest earthquake recorded for that subduction zone. Implicit in thisassumption is that at least one large earthquake characteristic of eachsubduction zone occurred during the past 80 yr. Ideally, it is best tointegrate the seismic energy released during the time period considered anddetermine the energy release rate per unit time and unit length of thesubduction zone. Unfortunately, it is difficult to do this accurately becauseof the lack of reliable data. In an attempt to do this approximately, Ruff &Kanamori (1980) considered the overall level of seismicity during thepreinstrumental period and modified Mw. The modified magnitude M~differs only slightly from M~,, but it represents the overall seismicity ofsubduction zones better than M,~.
Peterson & Seno (1984) carefully evaluated the magnitude and theseismic moment values listed in various seismicity catalogs and estimatedthe moment release rate (MRR) per unit time and unit length along the arc.Although considerable error is involved in converting the magnitude to theseismic moment, their estimates of the moment release rate are the bestpresently available.
Figure 4 compares MRR (determined by Peterson & Seno 1984) with M’~(determined by Ruff& Kanamori 1980) for various subduction zones. Sincethe division of subduction zones is slightly different between the two studies,some adjustments are made in this comparison, as explained in the figurecaption. In general, log (MRR) correlates very well with M~; this corre-lation suggests that M~, is a good parameter to represent the level ofseismicity in each subduction zone. The regression line shown in Figure 4gives MRR = 10(l’2M~+la’2) dyne-cm/(100 km-100 yr). In this sense, it more appropriate to interpret M~, as a parameter that represents the rate ofseismic moment release rather than as the magnitude of the characteristicearthquake in the region.
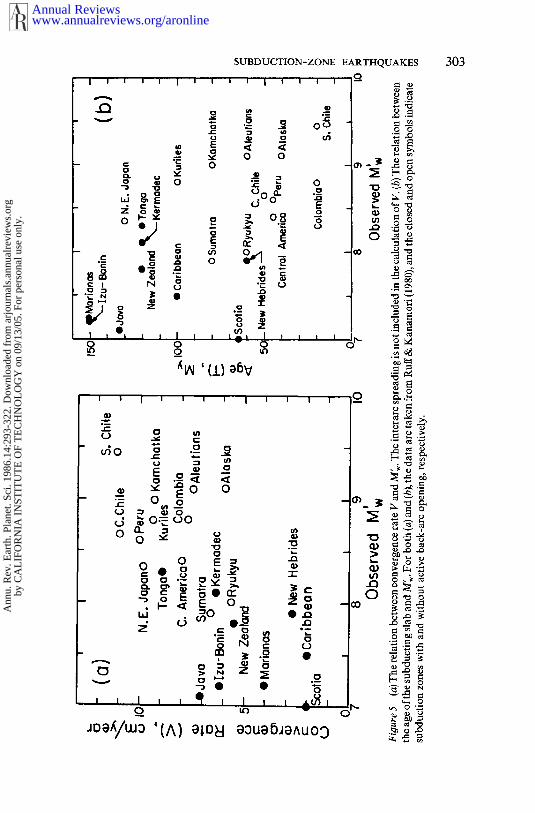
Ruff & Kanamori (1980) correlated M~, (or M~,) with various plateparameters. For example, Figure 5a shows the relation between M~, and theplate convergence rate F. In general, as the convergence rate increases, onewould expect stronger interplate interaction and, therefbre, higher seis-micity. Although Figure 5a shows a generally positive correlation, thescatter is very large, which suggests that other factors are also important incontrolling seismicity.
Another important plate parameter is the age of the subducting plate.
www.annualreviews.org/aronlineAnnual Reviews
Ann
u. R
ev. E
arth
. Pla
net.
Sci.
1986
.14:
293-
322.
Dow
nloa
ded
from
arj
ourn
als.
annu
alre
view
s.or
gby
CA
LIF
OR
NIA
IN
STIT
UT
E O
F T
EC
HN
OL
OG
Y o
n 09
/13/
05. F
or p
erso
nal u
se o
nly.

302 KANAMORI
Since the older plates are more dense, they have a stronger tendency to sinkspontaneously, thereby decreasing the strength of mechanical coupling(Molnar & Atwater 1978, Vlaar & Wortel 1976, Wortel & Vlaar 1978).Figure 5b shows the relation between M~ and the age T of the subductingplate. The correlation is negative, as expected, but the scatter is very large;this result suggests that the plate age is not the sole controlling factor ofseismicity.
Figure 5 indicates that the convergence rate V and the plate ageT together might be controlling seismicity. Ruff & Kanamori (1980)performed a three-parameter regression analysis in the form M~ =aT+bV+c, where a, b, and c are constants. Using the data listed inTable 1 of Ruff & Kanamori (1980), they obtained a relation,
M~ = - 0.00953 T + 0.143 V + 8.01 (5)
where T is in million years and 1/is in cm yr- 1.Figure 6 compares the observed M~, values with those calculated from T
and 1/through (5), showing a good correlation between the observed and
~.~oc
0.1
Kornchofko~ ~=u,,uuNankai /~,C. olom bion~ KuriI
New Hebr[des~ ¯ .,,~Co Americo ~T°nge _
S~@Ryukyu
8 9Mw,
¯ Izu - 8onTn
~Marianadava I
Figure 4 The relation between the seismic moment release rate MRR [in 1027 dyne-cm/(100km-100 yr)] and M~,. The data are taken from Peterson & Seno (1984) and Ruff & Kanamori(1980). Peterson & Seno’s regionalization of the subduction zones is modified as follows (thefirst and the second names in the parentheses refer to Peterson & Seno’s and Ruff &Kanamori’s data, respectively): (Peru-south, Peru), (average of Central America and Mexico,Central America), (Aleutian-east and Aleutian-west, Aleutian), (Nankai, SW Japan), (Japan,.NE Japan).
www.annualreviews.org/aronlineAnnual Reviews
Ann
u. R
ev. E
arth
. Pla
net.
Sci.
1986
.14:
293-
322.
Dow
nloa
ded
from
arj
ourn
als.
annu
alre
view
s.or
gby
CA
LIF
OR
NIA
IN
STIT
UT
E O
F T
EC
HN
OL
OG
Y o
n 09
/13/
05. F
or p
erso
nal u
se o
nly.
EARTHQUAKESO
o ~
c~
303
www.annualreviews.org/aronlineAnnual Reviews
Ann
u. R
ev. E
arth
. Pla
net.
Sci.
1986
.14:
293-
322.
Dow
nloa
ded
from
arj
ourn
als.
annu
alre
view
s.or
gby
CA
LIF
OR
NIA
IN
STIT
UT
E O
F T
EC
HN
OL
OG
Y o
n 09
/13/
05. F
or p
erso
nal u
se o
nly.

304 KANAMORI
calculated M~v values. Also note that the subduction zones with active back-arc opening plot in the lower-left corner of Figure 6, which indicatesgood correlation between low seismicity and back-arc opening. Ruff &Kanamori (1980) tried similar correlations between M~ and other plateparameters. They found that among all the three-parameter combinationsconsidered, the M~-T-V combination yields the best correlation.
It should be noted that (5) is obtained empirically without any particularphysical model. It is possible that other parameters are equally important.For example, Uyeda & Kanamori (1979) and Peterson & Seno (1984)suggest that the absolute velocity of the upper plate is important indetermining the strength of plate coupling. In any case, despite the lack ofclear physical models, (5) provides a useful scheme for interpreting globalseismicity in terms of a simple plate interaction model.
An alternative approach would be to build a specific physical model andtest it by using Mw and other plate parameters. Hager et al (1983) used global convective flow model of the Earth’s mantle (Hager & O’Connell1981) to determine the flow patterns and pressure distributions in themantle. They found that the model that allows whole mantle flow yields
10
Co.Chile~PeruO o /
~ - .0 / Kamchatka
@ / ~QAleutians._ r~yu~,yu/ Kur~les
SumatraOoNew /~N. E. Japan
o~ Hebrides ~ ~x~ Tonga
& 8
.J~ava ./~ ~Kermadec~ Scotia //~New Zealand-Izu-Bonin~
~_~ Caribbean
/~ Mar[anas
7 8 9 I0
Observed M w
Figure 6 The relation between M~, calculated from T aiad V using the relation M~, =--0.00953T+0.143V+8.01 and the observed M~. Closed and open symbols indicate sub-duction zones with and w~thout active back-arc opening, respectively.
www.annualreviews.org/aronlineAnnual Reviews
Ann
u. R
ev. E
arth
. Pla
net.
Sci.
1986
.14:
293-
322.
Dow
nloa
ded
from
arj
ourn
als.
annu
alre
view
s.or
gby
CA
LIF
OR
NIA
IN
STIT
UT
E O
F T
EC
HN
OL
OG
Y o
n 09
/13/
05. F
or p
erso
nal u
se o
nly.

SUBDUCTION-ZONE EARTHQUAKES 305
flow patterns that are consistent with the observed Benioff-zone geometries.Higher pressure gradients between the mantles beneath the trench and theback-arc area computed for this model correlate well with higher Mw. Sincea larger pressure gradient tends to press the downgoing slab more tightlyagainst the upper plate, this correlation is reasonable. The correlation isespecially good when it is taken for the following three parameters:pressure gradient, age of the subducting plates, and M~,. This exampledemonstrates that seismicity data can provide important constraints on thedynamics of the Earth’s mantle.
ASPERITY MODEL
As shown in the preceding sections, the global variation of seismicity can beinterpreted in terms of the variation of strength of mechanical coupling.However, so far it is not clear what is causing this regional variation ofstrength.
The width of the lithospheric interface has been correlated with themaximum length of rupture zones by Isacks et al (1968) and Kelleher et (1974). In this case, the width of the contact zone is the primary factordetermining the coupling strength. Kanamori (1971, 1977b) interpreted thevariation of interplate coupling in terms of a weakening of the lithosphericinterface. Topographic features on the subducting seafloor, such as sea-mounts and fracture zones, may be controlling the coupling strength(Kelleher & McCann 1976, 1977). However, until recently little was knownabout the stress distribution on the fault plane of great earthquakes.
Lay & Kanamori (1980) studied body waves and surface waves of largeearthquakes in the Solomon Islands region in an attempt to determine thestress distribution on the thrust plane. They found that relatively short-period (about 10 s) seismic body waves are radiated from only small parts the entire rupture plane, which generates longer-period (about 200 s)surface waves and over which the aftershocks occur (Figure 7a). Theyinterpreted the results in terms of an asperity model, as shown by Figure 7.This asperity model is an outgrowth of laboratory experiments on rockfriction. Byerlee (1970) and Scholz & Engelder (1976) suggested that the sides of a fault are held together by areas of high strength, which theytermed asperities. Extending this model to earthquake faults, we call theareas on the fault plane from where relatively short-period seismic bodywaves are radiated the (fault) asperities; it is assumed that the strongerspots are responsible for high-frequency seismic radiation. However, thefault asperities can be areas of geometrical irregularity. From seismicobservations alone, it is not possible to determine their physical properties.The parts of the fault plane where only long-period seismic radiation occurs
www.annualreviews.org/aronlineAnnual Reviews
Ann
u. R
ev. E
arth
. Pla
net.
Sci.
1986
.14:
293-
322.
Dow
nloa
ded
from
arj
ourn
als.
annu
alre
view
s.or
gby
CA
LIF
OR
NIA
IN
STIT
UT
E O
F T
EC
HN
OL
OG
Y o
n 09
/13/
05. F
or p
erso
nal u
se o
nly.

306 KANAMORI
or where processes with longer time scales than that of seismic radiation(e.g. creep, aftershock expansion, etc) occur are called the weak zones.
Lay & Kanamori (1980) examined seismograms of events from othersubduction zones and found that the complexity of body waveforms is verydifferent. For example, the events that occur in the Kurile Islands generallyradiate body waves with very complex waveforms, and these waveformssuggest a rather heterogeneous and complex asperity distribution on thefault plane (see Figure 7b).
Lay & Kanamori (1981) and Lay et al (1982) extended these results more general picture (see Figure 7c). In the typical Chilean-type subductionzones, the fault plane is uniformly strong (all asperity), and the size of therupture zone is determined by major transverse tectonic structures suchas fracture zones and ridges (Mogi 1969a, Kelleher & Savino 1975). subduction zones such as the Aleutian Islands and the Solomon Islands,asperities are relatively large, but they are surrounded by weak zones. Thesizes of earthquakes are not as large as those that occur in Chile and Alaska,but failure of one asperity often triggers failure of adjacent asperities, whichresults in large multiple events or earthquake multiplets (two or moredistinct events closely spaced in time). In subduction zones such as theKurile Islands, asperities become smaller and more heterogeneous in size.In the Mariana-type subduction zones, the fault plane is uniformly weak(no asperities), and no large earthquakes occur.
Ruff & Kanamori (1983a) used seismic body waves to directly determinethe asperity distributions on the fault plane of several large earthquakes.Figure 8 illustrates this method.
ASPERITY DISTRIBUTION
~ -5o k~---~m "’- "’" ~
SOLOMON TYPEV \ / AREAS FALLING IN SINGLE EVEN~
-,\
(t) Chile
Asperity Model
V///?/////////////////////A
Figure 7 Representation of the interplate interface in subduction zones by an asperity model.Hatched areas indicate asperities. (a) A model for the Solomon Islands region. The asperitiesare of comparable size. (b) A model for a more heterogeneous interface in regions such as Japanand the Kurile Islands. (c) A schematic representation of asperity distributions for differentregions (from Lay & Kanamori 1980, 1981, Lay et a11982).
www.annualreviews.org/aronlineAnnual Reviews
Ann
u. R
ev. E
arth
. Pla
net.
Sci.
1986
.14:
293-
322.
Dow
nloa
ded
from
arj
ourn
als.
annu
alre
view
s.or
gby
CA
LIF
OR
NIA
IN
STIT
UT
E O
F T
EC
HN
OL
OG
Y o
n 09
/13/
05. F
or p
erso
nal u
se o
nly.

SUBDUCTION-ZONE EARTHQUAKES 307
Figure 8a shows a simple fault with length L and area S. At point A in thenear field, the displacement would look like a ramp function (Figure 8b).The total displacement is equal to half the offset D of the fault. The build-uptime ~ is approximately (within a factor of two) equal to L/V, where Vis therupture velocity. At point B on the other side of the fault, the displacementtime function is reversed in polarity (Figure 8c). At a point in the far field,the displacements from both sides of the fault interfere. As a result, the timefunction in the far field is given by the time derivative of the near-fielddisplacement (Figure 8d). The area under the bell-shaped function proportional to the seismic moment, and the width is approximately equalto z. This function is often called the far-field source time function, and it isused to characterize the source complexity. We can determine the faultdimension and the seismic moment from the duration and the area of thefar-field time function.
Figure 8f shows a more complex case that involves two asperities. Thenear-field and far-field displacements for this case are shown in Figures 8gand 8h. The far-field time function has two pulses, each representing one ofthe asperities. From the far-field time function like the one shown in Figure8h, we can determine the asperity distribution. However, because of (a) thedistortion of the waveform during propagation between the source and the
Far Field
(d) Areo~Mo
I ~ =~Ds (e)
r*,’-’~/v ~ ~-~
(f)/ ~ (g) (h) (i)
L~/v LZ/v f
Figure 8 Fault model and far-field body-wave time function. (a) A simple fault model withuniform strength (i.e. single asperity). (b) The near-field displacement at point A. (c) The field displacement at point B. (d) The far-field displacement, often called the far-field sourcetime function. (e) The far-field displacement viewed through a seismograph (seismogram).(f) A complex fault model with two asperities. (#) The near-field displacement. (h) The field displacement. (i) Seismogram.
www.annualreviews.org/aronlineAnnual Reviews
Ann
u. R
ev. E
arth
. Pla
net.
Sci.
1986
.14:
293-
322.
Dow
nloa
ded
from
arj
ourn
als.
annu
alre
view
s.or
gby
CA
LIF
OR
NIA
IN
STIT
UT
E O
F T
EC
HN
OL
OG
Y o
n 09
/13/
05. F
or p
erso
nal u
se o
nly.

308 KANAMORI
station and (b) the instrument response, the observed waveforms are verycomplex (Figures Be,i), and the determination of the far-field time function isextremely difficult. Furthermore, for very large earthquakes such as the1964 Alaskan earthquake, relatively few usable seismograms exist becausemost of the seismograms were off-scale. Ruff & Kanamori (1983a) useddiffracted P waves to circumvent this difficulty.
Figure 9 compares the waveforms of four large earthquakes: the 1964Niigata earthquake (Mw = 7.6), the 1963 Kurile Islands earthquake(Mw = 8.5), the 1965 Rat Islands earthquake (Mw = 8.7), and the 1964Alaskan earthquake (Mw = 9.2). The Niigata earthquake is the smallestin this group. Since the fault length of this earthquake is about 60 km, theduration of faulting is about 25 s, and the body waveform viewedthrough the passband of the long-period WWSSN seismograph (i.e.5-50 s) is a simple impulse (Figure 9a), which suggests a simple source(Figure 10a), at least as viewed through this passband. In contrast, thewaveform of the Kurile Islands earthquake is far more complex andsuggests a complex asperity distribution (Figure 10b). The waveformsof the Alaskan earthquake are unique. Not only is the amplitude verylarge, but also the period is very long. This long-period wave indicatesthat the asperity responsible for the body-wave radiation is very large. Byremoving the effects of the wave propagation and the instrument fromthe body waves, Ruff & Kanamori (1983a) determined that the lengthscale of the asperity is about 200 km (Figure 10d). The pattern
(a) Niigata June 16, 1964Mw=7.6
~ NAIA=IO0.~°
(b) Kurile Is. Oct. 1:3, 1963
~ Mw=8.5LPSA : 100.8°
(C) Rof Is. Feb. 4, 1965
~ Mw=8.7
A=99.6°
(d) Alaska March 28, 1964Mw=9.2
WELA =lOG.5
I~ cm
BUL,~ = 139.0
Figure 9 Representative seismograms for four large earthquakes, plotted with the sameamplitude and time scales. For the Alaskan earthquake, the seismogram at A = 106.5° is off-scale, and another seismogram from a station in the shadow zone is shown. Note the largeamplitude and the long period of the Alaskan earthquake seismograms (modified from Ruff Kanamori 1983a).
www.annualreviews.org/aronlineAnnual Reviews
Ann
u. R
ev. E
arth
. Pla
net.
Sci.
1986
.14:
293-
322.
Dow
nloa
ded
from
arj
ourn
als.
annu
alre
view
s.or
gby
CA
LIF
OR
NIA
IN
STIT
UT
E O
F T
EC
HN
OL
OG
Y o
n 09
/13/
05. F
or p
erso
nal u
se o
nly.

SUBDUCTION-ZONE EARTHQUAKES 309
asperity distribution for the Rat Islands earthquake is intermediatebetween the Kurile Islands and the Alaskan earthquakes (Figure 10c).
Hartzell & Heaton (1985) determined far-field time functions from waves of 63 large, shallow subduction-zone earthquakes that occurred inthe circum-Pacific belt. They used the seismograms recorded at Pasadenaby a Benioff long-period seismograph. Since the passband of this instru-ment is about 2.5-50 s, the complexity of the source can be resolved only onthis time scale. Viewed through this passband, the seismograms showed noobvious global trends in the character of far-field time functions. However,most of the subduction zones do behave characteristically, and this findingsuggests regional variations of asperity distribution. For example, the timefunctions for earthquakes from central Chile, Peru, the Solomon Islands,and the New Hebrides are simple and smooth. The Solomon Islandsearthquakes, in particular, are characterized by unusually broad, simpletime functions (Figure 11). These results are consistent with the expansionpatterns of aftershocks, as is shown later.
More recent studies by Beck & Ruff (1984), Schwartz & Ruff (1985), Kikuchi & Fukao (1985) have succeeded in resolving important details the source process. Figure 11 compares the results obtained by differentinvestigators (Hartzell & Heaton 1985). Although the details differ betweendifferent studies, the general features as shown in Figure 10 seem to be wellestablished.
If the stress drop Aaa at the asperity does not vary from event to event, themagnitude of the tectonic stress drop Atr is approximately equal toAtr, (S,/S), where S is the total area of the fault plane and Sa is the total areaof the asperities. We conclude that in the context of the asperity model,the regional variation of the strength of mechanical coupling (i.e. Aa) is manifestation of the regional variation of asperity size and its distribution.
This type of asperity model is a gross generalization of the actual stressdistribution on the fault plane, but it also provides simple physicalinterpretations of some seismicity patterns (e.g. swarms, quiescence, fore-shock) before large earthquakes (e.g. Kanamori 1981).
196’q- 1963 Kurile 1965 Rat. Is.
(a) ~ (b)~ 0 ~00 t~m
Figure 10 Interpretation of Figure 9 in terms of the asperity model (modified from Ruff Kanamod 1983a). Compare Figures 9 and 10 with Figures 8i and 8f.
www.annualreviews.org/aronlineAnnual Reviews
Ann
u. R
ev. E
arth
. Pla
net.
Sci.
1986
.14:
293-
322.
Dow
nloa
ded
from
arj
ourn
als.
annu
alre
view
s.or
gby
CA
LIF
OR
NIA
IN
STIT
UT
E O
F T
EC
HN
OL
OG
Y o
n 09
/13/
05. F
or p
erso
nal u
se o
nly.

310 KANAMORI
Chile Ecuador7/9/71 7.5Ms 1/19/58 7.7Mw#72 #62
Solomon Is.7/26/71 8JMw#2
Colombia North Honshu12/12/79 8,2 Mw 5/16/68 8.2 MW (Tokachi-Oki)#65 #22
North Honshu Kuriles5/26/83 7.8Mw (A~,ilo-Okl) 8/11/69 8.2 Mw# 105 #31
Aleutians214165 8.7 M,~ (Re! Is.)# 43
0 60 120 180 240 300 360 420 480se¢
Figure 11 Comparisons of far-field time functions obtained by different investigators. Theshaded functions are from Hartzell & Heaton (1985). Sources are as follows: (1) Malgrange et
al (1981); (2) Beck & Ruff (1984); (3) M. Kikuchi (written communication); (3b) Fukao (1985) ; (4) Schwartz & Ruff(1985); (5) S. Beck & L. Ruff(unpublished work) ;
Kanamori (1983a) (after Hartzell & Heaton 1985).
Another class of heterogeneous fault models is the barrier modelproposed by Das & Aki (1977). In this model, strong spots (barriers) on fault plane do not fail during the mainshock. The differences between theasperity model and the barrier model are discussed by Madariaga (1979)and Rudnicki & Kanamori (1981). It is difficult to distinguish between thesetwo models from seismic data alone.
EXPANSION PATTERN OF AFTERSHOCK AREA
Further evidence for regional variations in mechanical heterogeneities offault zones, here characterized by asperity distributions, came fromexpansion patterns of aftershock areas. Although the mechanism of
www.annualreviews.org/aronlineAnnual Reviews
Ann
u. R
ev. E
arth
. Pla
net.
Sci.
1986
.14:
293-
322.
Dow
nloa
ded
from
arj
ourn
als.
annu
alre
view
s.or
gby
CA
LIF
OR
NIA
IN
STIT
UT
E O
F T
EC
HN
OL
OG
Y o
n 09
/13/
05. F
or p
erso
nal u
se o
nly.

SUBDUCTION-ZONE EARTHQUAKES 311
aftershock occurrence is not fully understood, the spatial distribution ofaftershocks and its expansion pattern seem to provide clues to themechanical property of the source region. Mogi (1968, 1969b) notedsignificant variations of expansion patterns of aftershock areas andinterpreted them in terms of regional variations of tectonic structures.
Tajima & Kanamori (1985a) developed a method to objectively definethe aftershock area by using spatio-temporal patterns of seismic energyrelease; they then used this method to examine the aftershock areaexpansion patterns of about 50 earthquakes. Four examples are shown inFigure 12. For the 1964 Alaskan earthquake, no significant expansionoccurred, while the aftershock area of the 1978 Miyagi-Oki, Japan,earthquake expanded nearly threefold in area during the period from 1 dayto 100 days after the mainshock. Tajima & Kanamori (1985b) defined the100-day linear expansion ratio r/1 (100) by the ratio of the maximum lineardimension of the aftershock area observed at 100 days after the mainshockto that of the 1-day aftershock area. Figure 13, which shows r/l (100) plottedat the respective mainshock epicenter, demonstrates a distinct regional
1964 Alaska
159~N
19~0 Lo~yalty 119°S
(c). ~Ms=7"2
65°N
1978 Miyagi-oki / /
500krn’ 155°-N 14~ E142°W
~1978 Oaxaca ~ I0 days~ I00 days
150 km ~~ trench line(d)
167*E 172° IF 960~N
Figure 12 The aftershock areas determined at four different times : 1 day, 10 days, 100 days,and 1 yr (slightly modified from Tajima & Kanamori 1985b).
www.annualreviews.org/aronlineAnnual Reviews
Ann
u. R
ev. E
arth
. Pla
net.
Sci.
1986
.14:
293-
322.
Dow
nloa
ded
from
arj
ourn
als.
annu
alre
view
s.or
gby
CA
LIF
OR
NIA
IN
STIT
UT
E O
F T
EC
HN
OL
OG
Y o
n 09
/13/
05. F
or p
erso
nal u
se o
nly.

312 KANAMORI
variation. In the western Pacific subduction zones (northeastern Japan,Ryukyu, the Philippines, New Hebrides, and Tonga), the expansion ratiosare generally large. On the other hand, in the northern Pacific subductionzones and along the Central American trench, the ratios are generally small.The events in the Solomon Islands (Nos. 18 and 27) are doublets and areindicated by an open circle (large expansion); however, this large linearexpansion could be due to the occurrence of the second event of the doublet.If each event of the doublet is considered separately, they would have beenclassified as events with a small expansion ratio. In the South Americansubduction zones, the expansion ratios vary from event to event.
These results can be explained in terms of the asperity model, as shown byFigure 14. The rupture during the mainshock mostly involves asperities.After the main rupture is completed, the stress change caused by themainshock gradually propagates outward into the surrounding weakzones. This stress propagation manifests itself as an expansion of aftershockactivity. If the fault zone consists of large asperities abutting each other (e.g.Chilean-type), little expansion occurs (Figure 14b). If the average size asperities is relatively small, then the strength of interplate coupling ismoderate. If these asperities are densely distributed and separated by smallweak zones, no extensive aftershock expansion is expected (Figure 14c). TheMexican subduction zone is a typical example of this type. In contrast, ifsmaller asperities are sparsely distributed (Mariana-type), large expansion
+60° ~
.......00 +g00 +600 +90° +1200 +1500 ~180° -1500 -1200 -900 -600
Figure 13 Plo~ of th¢ 100-day linear expansion ratio ~ (1 ~). The number beside each symbolcorresponds to the ewnt number listed in Tajima & Kanamori (1985b). The asi¢fisk indicatesthe first event of a doublet (after Tajima & Kanamori 1985b).
www.annualreviews.org/aronlineAnnual Reviews
Ann
u. R
ev. E
arth
. Pla
net.
Sci.
1986
.14:
293-
322.
Dow
nloa
ded
from
arj
ourn
als.
annu
alre
view
s.or
gby
CA
LIF
OR
NIA
IN
STIT
UT
E O
F T
EC
HN
OL
OG
Y o
n 09
/13/
05. F
or p
erso
nal u
se o
nly.

SUBDUCTION-ZONE EARTHQUAKES 313
(a)Small t I
(e.g. I day) (~
Large t . [(e.g. 100 day)I
(b) (c) (d)
Strong Moderate WeakCoupling Coupling Coupling
e.g. e.g. e.g.Alaska Mexico NE JapanRat Is. New Hebrides
Fiaure 14 Schematic figure showing typical expansion patterns of aftershock area. Thehatched areas indicate aftershock areas. The aftershock areas at small t (time) are consideredasperities on a fault zone. (a) A typical expansion pattern. The aftershock area expands fromthe asperity to the surrounding weak zone. (b) A fault zone with a uniform, large asperity. Theaftershock area does not expand, and interplate coupling is strong. (c) Densely distributedsmall asperities. The aftershock zone expands little, and interplate coupling is moderate.(d) Sparsely distributed small asperities. An aftershock area expands significantly, oftenoverlapping with that of the adjacent event. Interplate coupling is weak (after Tajima Kanamofi 1985b).
ratios are to be expected, and the aftershock areas of adjacent events mayoverlap each other (e.g. northeastern Japan, the Philippines, New Hebrides,and Tonga-Kermadec; Figure 14d).
The pattern shown in Figure 13 is generally consistent with_that ofasperity distribution inferred from the locations of great earthquakes andfrom the body-wave studies, and it renders support to the asperity model.
THE ASPERITY
In the preceding discussion, we introduced asperities as spots of increasedstrength on the fault plane without specifying what they physically are. Asshown earlier, the age of the subducting plate and the plate convergencerate seem to have a strong influence on plate coupling. On the other hand,the coupling strength is also controlled by the heterogeneity on the faultplane. However, the relation between plate parameters such as the age, theconvergence rate, and the fault-plane heterogeneities is not obvious. Ruff &Kanamori (1983b) discussed this subject in detail and suggested variouspossibilities, but at present there is no definite answer to this question.
One important factor, however, seems to be the trench sediment. Theamount of trench sediments is very different between different subductionzones because it is controlled by factors such as the supply rate from the
www.annualreviews.org/aronlineAnnual Reviews
Ann
u. R
ev. E
arth
. Pla
net.
Sci.
1986
.14:
293-
322.
Dow
nloa
ded
from
arj
ourn
als.
annu
alre
view
s.or
gby
CA
LIF
OR
NIA
IN
STIT
UT
E O
F T
EC
HN
OL
OG
Y o
n 09
/13/
05. F
or p
erso
nal u
se o
nly.

314 KANAMORI
adjacent land and the disposal rate. In some subduction zones, sedimentsriding on the oceanic plate are scraped off and deposited to formaccretionary prisms, while other subduction zones seem to be subductingmost of the sediments without forming accretionary prisms (see, e.g., Schollet al 1977, Hilde 1983, Uyeda 1984). Hilde & Sharman (1978) suggest thathorst-and-graben structures, which are often seen on the seafloor near thetrench, may be acting as a carrier of the sediments beneath the upper plate,as illustrated in Figure 15. The horst-and-graben structure is thought to bea result of plate bending before subduction. Ruff (1985) proposed that thickexcess sediments at subduction zones form a uniform interplate contactplane enhancing the coupling, whereas seafloors with horst-and-grabenstructures develop a heterogeneous contact plane that decreases thestrength of mechanical coupling. Figure 16 shows the global distribution ofsubduction zones with excess trench sediments (ETS) and with horst-and-graben structures (HGS). Also shown in this figure are the epicenters large earthquakes. In general, the subduction zones that have experiencedvery large earthquakes are associated with ETS, and those without largeearthquakes are characterized by HGS. We note several exceptions.The Sumatran subduction zone is characterized by ETS, but no greatearthquakes have occurred there in this century. Newcomb & McCann(1984), however, documented two great Sumatran earthquakes thatoccurred in 1833 and 1861. The subduction zone off southwestern Japanhas not experienced events with Mw >~ 8.2 during this century, but it is thesite of two Mw = 8.1 earthquakes in this century and many historical greatearthquakes. The subduction zone off the Washington-Oregon coast ofNorth America (Juan de Fuca subduction zone) has not experienced greatearthquakes for at least the past 150 yr; however, its long-term seismicpotential is unknown and is presently a matter of debate (see Heaton Kanamori 1984).
Another interesting aspect of this model is that it may provide a linkbetween the M’w-T-V relation and the asperity distribution. There is ageneral correlation between the dip angle and the age of the oceanic plate
(a) trench sedimentsExcess
/ ! ~" T c: ~ Subducte~[ ~’--, ~, sed~-ments~
(b) Horst and Graben structure
~’ ’ ~’ sed~men|s ~
Figure 15 Two trench morphologies. (a) Excess trench sediments. Sediments are scraped offon subduction and form an accretionary prism. (b) Horst-and-graben structure. A well-developed horst-and-graben structure provides a mechanism to carry down the sediments(after Ruff 1985).
www.annualreviews.org/aronlineAnnual Reviews
Ann
u. R
ev. E
arth
. Pla
net.
Sci.
1986
.14:
293-
322.
Dow
nloa
ded
from
arj
ourn
als.
annu
alre
view
s.or
gby
CA
LIF
OR
NIA
IN
STIT
UT
E O
F T
EC
HN
OL
OG
Y o
n 09
/13/
05. F
or p
erso
nal u
se o
nly.

SUBDUCTION-ZONE EARTHQUAKES 315
~ c~_i" ~,: ~,~ ~~ ..
......... .~ ~ ~ 42
ff " 9.5
Figure 16 Classification of subduction zones by the two trench morphologies (ETS andHGS). Also shown are w values and t he approximate rupture zones of major e arthquakes(after Ruff 1985).
(Molnar & Atwater 1978). Therefore, older plates may develop morepronounced horst-and-graben structures, since they are bent more sharplybefore subduction, which results in smaller asperities and weaker coupling.
RELATED PROBLEMS
Evaluation of Seismic PotentialThe M’w-T-V relation given by (5) could be used to evaluate the seismicpotential of subduction zones that have not experienced great earthquakesin historical times. Since the age T of the subducting plate and theconvergence rate V are known for most subduction zones, M~, can beestimated from (5).
Heaton & Kanamori (1984) applied (5) to the subduction zone off Oregon-Washington coast (Juan de Fuca subduction zone), where no greatearthquake is known to have occurred for at least the past 150 yr.Furthermore, instrumentally determined seismicity during the last 80 yr isextremely low. Hence, if we extrapolate the past seismicity to the future, wewould expect a very low seismic potential. However, the estimated T and Vare about 8 Myr and 3.5 cm yr- 1, respectively, which would yield a M~, of8.4 through (5); this M’w value suggests a high seismic potential. Since (5)
www.annualreviews.org/aronlineAnnual Reviews
Ann
u. R
ev. E
arth
. Pla
net.
Sci.
1986
.14:
293-
322.
Dow
nloa
ded
from
arj
ourn
als.
annu
alre
view
s.or
gby
CA
LIF
OR
NIA
IN
STIT
UT
E O
F T
EC
HN
OL
OG
Y o
n 09
/13/
05. F
or p
erso
nal u
se o
nly.

316 KANAMORI
obtained entirely empirically, this value of M~, should not be taken at facevalue. However, it does mean that the Juan de Fuca subduction zone issimilar, with respect to the plate-boundary characteristics, to othersubduction zones that have experienced great earthquakes, and furtl~erinvestigations into this problem are warranted.
One of the unique features of the Juan de Fuca subduction zone is thevery young age of the subducting plate. Since the subduction zones used todetermine (5) have a subducting plate older than 10 Myr, there is somequestion as to whether (5) applies to the very young Juan de Fuca plate. recent study by Singh et al (1985), however, demonstrates that the 1932Jalisco, Mexico, earthquake(Ms = 8.2) occurred on the boundary betweenthe very young (9 Myr) Rivera plate and the North American plate. Thisboundary is geometrically similar to that between the Juan de Fuca plateand the North American plate.
Aseismic and Seismic Slip
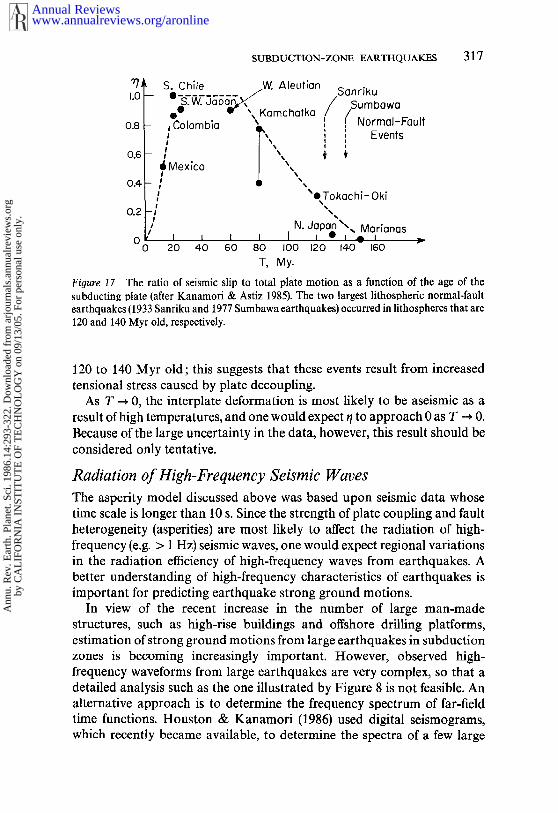
At the Mariana-type subduction zones, seismicity is so low that the slipassociated with earthquakes cannot accommodate the total plate motion;this suggests that a substantial amount of slip is occurring aseismically.Kanamori(1977b) estimated the amount of seismic slip at various sub-duction zones and concluded that the ratio ~ of seismic slip to the totalplate motion is approximately 1, 0.25, and 0 for southern Chile, the KurileIslands, and the Marianas, respectively. However, these estimates aresubject to large uncertainties because of (a) errors in the estimates of seismicslip and (b) incomplete data on the repeat times. Subsequently, Seno Eguchi (1983), Sykes & Quittmeyer (1981), and Peterson & Seno (1984)have made independent analyses of the data. The results of these fourstudies are in general agreement, though they differ in details, particularlyfor subduction zones for which repeat-time data are incomplete. Onthe basis of these studies, Kanamori & Astiz (1985) attempted anotherinterpretation of the data. Figure 17 shows the values of ~7 as a function ofthe ageof the subducting plate. These values probably depend on variousfactors such as the convergence rate, the upper plate velocity, the roughness.,of the oceanic and upper plate, and the structure of the sediment. Figure 17shows only the effect of T on ~.
Subduction zones with a relatively young subductingplate (ranging from20 to 60 Myr old) have ~/values very close to 1, and thus interplate slip forthese subductionl zones is predominantly seismic. For subduction zoneswith a very old plate, such as the Marianas and northern Japan, ~ is wrysmall, and therefore the plates are almost decoupled. It is interesting to notethat~ the two largest lithospheric normal-fault earthquakes, the 1933Sanriku and 1977 Sumbawa earthquakes, occurred in lithospheres that are
www.annualreviews.org/aronlineAnnual Reviews
Ann
u. R
ev. E
arth
. Pla
net.
Sci.
1986
.14:
293-
322.
Dow
nloa
ded
from
arj
ourn
als.
annu
alre
view
s.or
gby
CA
LIF
OR
NIA
IN
STIT
UT
E O
F T
EC
HN
OL
OG
Y o
n 09
/13/
05. F
or p
erso
nal u
se o
nly.
SUBDUCTION-ZONE EARTHQUAKES 317
"~/~’ S. Chile W. Aleut~an1.0-- 0 -S~ ~V.- 3 ~_~ Sanriku
~0 O~ "\ Kamchatka / /Sumbawo0.8 ~ Colombia ~ ~, ~ Normal-Fault
~ ~ ~ l Events
0.4- ~
N~. dop~, ~ ~oHonos
0 20 40 ~0 80 ;00 ~20 ~40 ~@0T, Wy.
~ ~ 7 ~ redo o~ s~sm~c sH~ ~o ~ot~~m motion ~s
~20 and ~40 ~y~ o~d,
120 to 140 Myr old; this suggests that these events result from increasedtensional stress caused by plate decoupling.
As T --} 0, the interplate deformation is most likely to be aseismic as aresult of high temperatures, and one would expect r/to approach 0 as T ~ 0.Because of the large uncertainty in the data, however, this result should beconsidered only tentative.
Radiation of High-Frequency Seismic WavesThe asperity model discussed above was based upon seismic data whosetime scale is longer than 10 s. Since the strength of plate coupling and faultheterogeneity (asperities) are most likely to affect the radiation of high-frequency (e.g. > 1 Hz) seismic waves, one would expect regional variationsin the radiation efficiency of high-frequency waves from earthquakes. Abetter understanding of high-frequency characteristics of earthquakes isimportant for predicting earthquake strong ground motions.
In view of the recent increase in the number of large man-madestructures, such as high-rise buildings and offshore drilling platforms,estimation of strong ground motions from large earthquakes in subductionzones is becoming increasingly important. However, observed high-frequency waveforms from large earthquakes are very complex, so that adetailed analysis such as the one illustrated by Figure 8 is not feasible. Analternative approach is to determine the frequency spectrum of far-fieldtime functions. Houston & Kanamori (1986) used digital seismograms,which recently became available, to determine the spectra of a few large
www.annualreviews.org/aronlineAnnual Reviews
Ann
u. R
ev. E
arth
. Pla
net.
Sci.
1986
.14:
293-
322.
Dow
nloa
ded
from
arj
ourn
als.
annu
alre
view
s.or
gby
CA
LIF
OR
NIA
IN
STIT
UT
E O
F T
EC
HN
OL
OG
Y o
n 09
/13/
05. F
or p
erso
nal u
se o
nly.

318 KANAMORI
E
~ ,...’-4. , , ,
’ ~oS r(’A \x ~ IOs 59-i0~
10’~ i0’~ , , ~
F~ure 18 Comparison of source spectra (i.e. spectrum of.the source time function, such as the
one shown by Figure 8h) of six large earthquakes. The dashed curves, which are computed for theoretical source model, are shown for reference. Note that the spectral amplitude of the 1982
Tonga earthquake at 1 s (10e Hz) is significantly lower than that for other events.
www.annualreviews.org/aronlineAnnual Reviews
Ann
u. R
ev. E
arth
. Pla
net.
Sci.
1986
.14:
293-
322.
Dow
nloa
ded
from
arj
ourn
als.
annu
alre
view
s.or
gby
CA
LIF
OR
NIA
IN
STIT
UT
E O
F T
EC
HN
OL
OG
Y o
n 09
/13/
05. F
or p
erso
nal u
se o
nly.

SUBDUCTION-ZONE EARTHQUAKES 319
subduction-zonc earthquakes with comparable magnitudes. The results areshown in Figure 18.
Among the events shown in Figure 18, the event in the Tonga Islandsoccurred in a Mariana-typ¢ subduction zone. Comparing the long-periodand short-period spectral amplitudes, we see that the Tonga earthquakehas proportionally less high-frequency energy than the other events,possibly because of the weak mechanical coupling at the Tonga subductionzone. Since the presently available data are very limited in quantity, moredefinitive conclusions must await further studies.
CONCLUSIONS
The distribution of great earthquakes and fault-zone mechanical hetero-geneities inferred from seismic waveforms and expansion patterns ofaftershock areas suggest that the nature and strength of interplate couplingat subduction zones vary significantly from place to place. This regionalvariation can be characterized best by the use of an asperity model, whichassumes that a fault zone consists of two parts : mechanically strong spotsherein called the asperities, and weaker zones surrounding the asperities.Strongly coupled subduction zones have a fault zone that consists of largeand uniform asperities. As the asperity size decreases with increasing area ofweak zones, the fault zone becomes more heterogeneous and the strength ofplate coupling decreases.
Tectonic features associated with strongly coupled subduction zonessuch as the Chilean and Alaskan subduction zones include shallow oceanictrenches, shallow dipping Benioff zones, generally andesitic volcanism, andthe absence of active back-arc basins. Weakly coupled subduction zonessuch as the Marianas have tectonic features more or less opposite in nature.This difference is intuitively consistent with the difference in the magnitudeof horizontal compressive stress in the trench-arc system associated withthe difference in the degree of plate coupling. However, the details of thephysical mechanism remain to be investigated.
The magnitude M~, of the largest "characteristic" earthquake of asubduction zone correlates well with the age T of the subducting plate andthe convergence rate V in the form M~, = aT+bV+c (a = -0.00953,b = 0.143, c = 8.01, T in Myr, V in cm yr-1). This relation, thoughpurely empirical, is useful in predicting M~, for subduction zones thathave not experienced large earthquakes in historical time.
ACKNOWLEDGMENTS
I thank Luciana Astiz and Holly Eissler for reviewing the manuscript.Larry Ruff provided me with some figures before publication. This work
www.annualreviews.org/aronlineAnnual Reviews
Ann
u. R
ev. E
arth
. Pla
net.
Sci.
1986
.14:
293-
322.
Dow
nloa
ded
from
arj
ourn
als.
annu
alre
view
s.or
gby
CA
LIF
OR
NIA
IN
STIT
UT
E O
F T
EC
HN
OL
OG
Y o
n 09
/13/
05. F
or p
erso
nal u
se o
nly.

320 KANAMORI
was partially supported by the National Science Foundation under grantEAR-8116023 and the US Geological Survey under contract 14-08-0001-G-979. This article is contribution No. 4252 of the Division of Geologicaland Planetary Sciences.
Literature Cited
Abe, K. 1981. Magnitude of large shallowearthquakes from 1904 to 1980. Phys.Earth Planet. Inter. 27: 72-92
Aki, K. 1966a. Generation and propagationof G waves from the Niigata earthquake ofJune 16, 1964. Part 1. A statistical analysis.Bull. Earthquake Res. Inst. Univ. Tokyo44 : 23-72
Aki, K. 1966b. Generation and propagationof G waves from the Niigata earthquake ofJune 16, 1964. Part 2. Estimation of earth-quake moment, from the G wave spectrum.Bull. Earthquake Res. Inst. Univ. Tokyo44 : 73-88
Aki, K. 1967. Scaling law of seismic spectrum.J. Geophys. Res. 72:1217-31
Bath, M. 1981. Earthquake magnitude--recent research and current trends. Earth$ci. Rev. 17 : 315-98
Beck, S. L., Ruff, L. J. 1984. The ruptureprocess of the great 1979 Colombia earth-quake : evidence for the asperity model. J.Geophys. Res. 89 : 9281-91
Burridge, R., Knopoff, L. 1964. Body forceequivalents for seismic dislocations. Bull.Seismol. Soc. Am. 54:1901-14
Byerlee, J. D. 1970. Static and kinetic frictionof granite under high stress. Int. J. RockMech. Min. Sci. 7 : 577-82
Caldwell, J. G., Haxby, W. F., Karig, D. E.,Turcotte, D. L. 1976. On the applicabilityof a universal elastic trench profile. EarthPlanet. Sci. Lett. 31:239-46
Chapple, W. M., Forsyth, D. W. 1979. Earth-quakes and bending of plates at trenches.J. Geophys. Res. 84: 6729-49
Chung, D. H., Bernreuter, D. L. 1981.Regional relationship among earthquakemagnitude scales. Rev. Geophys. SpacePhys. 19 : 649-63
Coulon, C., Thorpe, R. S. 1981. Role of con-tinental crust in petrogenesis of orogenicvolcanic associations. Tectonophysics77 : 79-93
Das, S., Aki, K. 1977. Fault planes withbarriers: a versatile earthquake model. J.Geophys. Res. 82 : 5658-70
Geller, R. J. 1976. Scaling relations for earth-quake source parameters and magnitudes.Bull. Seismol. Soc. Am. 66:1501-23
Geller, R. J., Kanamori, H. 1977. Magnitudeof great shallow earthquakes from 1904 to
1952. Bull. Seismol. Soc. Am. 67 : 587 98Gill, J. 1981. Orogenic Andesites and Plate
Tectonics. New York: Springer-Verlag.390 pp.
Gutenberg, B. 1945. Amplitudes of surfacewaves and magnitudes of shallow earth-quakes. Bull. Seismol. Soc. Am. 35:3-12
Gutenberg, B., Richter, C. F. 1956. Magni-tude and energy of earthquakes. Ann.Geofis. 9:1-15
Hager, B. H., O’Connell, R. J. 1981. A simpleglobal model of plate motions and mantleconvection. J. Geophys. Res. 86 : 4843-67
Hager, B. H., O’Connell, R. J., Raefsky, A.1983. Subduction, back-arc spreading andglobal mantle flow. Tectonophysics 99:165-89
Hanks, T. C., Kanamori, H. 1979. A momentmagnitude scale. J. Geophys. Res. 84:2348-50
Hartzell, S. H., Heaton, T. H. 1985. Tele-seismic time functions for large, shallowsubduction zone earthquakes. Bull. Seis-mol. Soc. Am. 75:965-1004
Heaton, T., Kanamori, H. 1984. Seismicpotential associated with subduction in thenorthwestern United States. Bull. Seismol.Soc. Am. 74:933-41
Hilde, T. W. C. 1983. Sediment subductionversus accretion around the Pacific.Tectonophysics 99 : 381-97
Hilde, T. W. C., Sharman, G. F. 1978. Faultstructure of the descending plate and itsinfluence on the subduction process. Eos,Trans. Am. Geophys. Union 59:1182(Abstr.)
Houston, H., Kanamori, H. 1986. Sourcespectra of great earthquakes: teleseismicconstraints on rupture process and strongmotion. Bull. Seismol. Soc. Am. In press
Isacks, B., Oliver, J., Sykes, L. 1968. Seis-mology and the new global tectonics. J.Geophys. Res. 73 : 5855-99
Kanamori, H. 1971. Great earthquakes atisland arcs and the lithosphere. Tectono-physics 12:187-98
Kanamori, H. 1977a. The energy release ingreat earthquakes. J. Geophys. Res. 82:2981-87
Kanamori, H. 1977b. Seismic and aseismicslip along subduction zones and theirtectonic implications. In Island Arcs,
www.annualreviews.org/aronlineAnnual Reviews
Ann
u. R
ev. E
arth
. Pla
net.
Sci.
1986
.14:
293-
322.
Dow
nloa
ded
from
arj
ourn
als.
annu
alre
view
s.or
gby
CA
LIF
OR
NIA
IN
STIT
UT
E O
F T
EC
HN
OL
OG
Y o
n 09
/13/
05. F
or p
erso
nal u
se o
nly.

SUBDUCTION-ZONE EARTHQUAKES 321
Deep Sea Trenches and Back-Arc Basins,Maurice Ewin# Set., ed. M. Talwani, W. C.Pitman III, 1:163-74. Washington, DC:Am. Geophys. Union
Kanamori, H. 1977c. Quantification of earth-quakes. Nature 271:411-14
Kanamori, H, 1981. The nature of seismicitypatterns before large earthquakes. InEarthquake Prediction--An InternationalReview, Maurice Ewin# Ser., ed. D. W.Simpson, P. G. Richards, 4: 1-19. Wash-ington, DC : Am. Geophys. Union
Kanamori, H. 1983. Magnitude scale andquantification of earthquakes. Tectono~physics 93:185-99
Kanamori, H., Anderson, D. L. 1975.Theoretical basis of some empirical rela-tions in seismology. Bull. Seismol. Soc. Am.65 : 1073-95
Kanamori, H., Astiz, L. 1985. The 1983Akita-Oki earthquake (Mw = 7.8) and itsimplications for systematics of subductionearthquakes. Earthquake Predict. Res. 3:305-17
Kelleher, J., McCann, W. 1976. Buoyantzones, great earthquakes, and unstableboundaries of subduction. J. Geophys. Res.81:4885-96
Kelleher, J., McCann, W. 1977. Bathymetrichighs and the development of convergentplate boundaries. In Island Arcs, Deep SeaTrenches and Back-Arc Basins, MauriceEwine Set., ed. M. Talwani, W. C. PitmanIII, 1:115-22. Washington, DC: Am.Geophys. Union
Kelleher, J., Savino, J. 1975. Distribution ofseismicity before large strike-slip andthrust-type earthquakes. J. Geophys. Res.80: 260-71
Kelleher, J., Savino, J., Rowlett, H., McCann,W. 1974. Why and where great thrustearthquakes occur along island arcs. J.Geophys. Res. 79 : 4889-99
Kikuchi, M., Fukao, Y. 1985. Iterativedeconvolution of complex body wavesfrom great earthquakes--the Tokachi-Okiearthquake of 1968. Phys. Earth Planet.Inter. 37 : 23548
Lay, T., Kanamori, H. 1980. Earthquakedoublets in the Solomon Islands. Phys.Earth Planet. Inter. 21:283-304
Lay, T., Kanamori, H. 1981. An asperitymodel of great earthquake sequences. InEarthquake Prediction--An InternationalReview, Maurice Ewin# Ser., ed. D. W.Simpson, P. G. Richards, 4: 579-92. Wash-ington DC : Am. Geophys. Union
Lay, T., Kanamori, H., Ruff, L. 1982. Theasperity model and the nature of largesubduction zone earthquakes. EarthquakePredict. Res. 1 : 3-71
Madariaga, R. 1979. On the relation between
seismic moment and stress drop in thepresence of stress and strength hetero-geneity. J. Geophys. Res. 84 : 2243-50
Malgrange, M., Deschamps, A., Madariaga,R. 1981. Thrust and extentional faultingunder the Chilean coast: 1965, 1971Aconcagua earthquakes. Geophys. J. R.Astron. $oc. 66:313-31
Maruyama, T. 1963. On the force equivalentsof dynamical elastic dislocations withreference to the earthquake mechanism.Bull. Earthquake Res. Inst. Univ. Tokyo ̄41 : 467-86
Miyashiro, A. 1974. Volcanic rock series inisland ares and active continental margins.Am. J. Sci. 274:321-55
Mogi, K. 1968. Sequential occurrences ofrecent great earthquakes. J. Phys. Earth16 : 30-36
Mogi, K. 1969a. Relationship between theoccurrence of great earthquakes and tec-tonic structures. Bull. Earthquake Res.Inst. Univ. Tokyo 47:429-41
Mogi, K. 1969b. Some features of recentseismic activity in and near Japan, (2)Activity before and after great earth-quakes. Bull. Earthquake Res. Inst. Univ.Tokyo 47 : 395-417
Molnar, P., Atwater, T. 1978. Inter-arcspreading and cordilleran tectonics asalternates related to the age of subductedoceanic lithosphere. Earth Planet. Sci. Lett.41 : 330-40
Newcomb, K. R., McCann, W. R. 1984.Seismic history and seismotectonics of theSunda arc. Preprint (Lamont-DohertyGeol. Obs., Palisades, N.Y.)
Peterson, E. T., Seno, T. 1984. Factors affect-ing seismic moment release rates in sub-duction zones. J. Geophys. Res. 89 : 10233-48
Purcaru, G., Berckhemer, H. 1978. A magni-tude scale for very large earthquakes.Tectonophysics 49 : 189-98
Richter, C. F. 1935. An instrumental earth-quake magnitude scale. Bull. Seismol. Soc.Am. 25 : 1-32
Rudnicki, J. W., Kanamori, H. 1981. Effectsof fault interaction on moment, stress dropand strain energy release. J. Geophys. Res.86 : 1785-93
Ruff, L. J. 1985. Do trench sedimems affectsubduction zone seismicity? In EarthquakeSource Mechanics, Maurice Ewing Ser., ed.S. Das, Vol. 5. Washington, DC: Am.Geophys. Union. In press
Ruff, L., Kanamori, H. 1980. Seismicityand the subduction process. Phys. EarthPlanet. Inter. 23 : 240-52
Ruff, L., Kanamori, H. 1983a. The ruptureprocess and asperity distribution of threegreat earthquakes from long-period dif-
www.annualreviews.org/aronlineAnnual Reviews
Ann
u. R
ev. E
arth
. Pla
net.
Sci.
1986
.14:
293-
322.
Dow
nloa
ded
from
arj
ourn
als.
annu
alre
view
s.or
gby
CA
LIF
OR
NIA
IN
STIT
UT
E O
F T
EC
HN
OL
OG
Y o
n 09
/13/
05. F
or p
erso
nal u
se o
nly.

322 KANAMORI
fracted P-waves. Phys. Earth Planet. Inter.31 : 202-30
Ruff, L., Kanamori, H. 1983b. Seismic coup-ling and uncoupling at subduetion zones.Tectonophysics 99 : 99-117
Scholl, D. W., Marlow, M. $., Cooper, A. K.1977. Sediment subduction and offscrap-ing at Pacific margins. In Island Arcs,Deep Sea Trenches and Back-arc Basins,Maurice Ewin# Set., ed. M. Talwani, W. C.Pitman III, 1 : 199-210. Washington DC :Am. Geophys. Union
Scholz, C. H., Engelder, J. T. 1976. The role ofasperity indentation and ploughing in rockfriction--1. Asperity creep and stick-slip.Int. J. Rock. Mech. Min. $ci. Geomech.13:149-54 (Abstr.)
Schwartz, S., Ruff, L. 1985. The 1968Tokachi-Oki and the 1969 Kurile Islandsearthquakes: variability in the ruptureprocess. J. Geophys. Res. 90:8613-26
Seno, T., Eguchi, T. 1983. Seismotectonics ofthe western Pacific region~ In Geodynamicsof the Western Pacific-Indonesian Region,Geodyn. Ser., ed. T. W. C. Hilde, S. Uyeda,11 : 5-40. Washington, DC : Am. Geophys.Union/Geol. Soc. Am.
Singh, S. K., Ponce, L., Nishenko, S. P. 1985.The great Jalisco, Mexico, earthquake of1932 and the Rivera subduction zone. Bull.Seismol. Soc. Am. 75 : 1301-13
Stauder, W. 1968. Tensional characterof earthquake foci beneath the Aleutiantrench with relation to sea floor spreading.J. Geophys. Res. 73 : 7693-7701
Steketee, J. A. 1958. On Voltera’s disloca-tions in a semi-infinite elastic medium.Can. J. Phys. 36 : 192-205
Sykes, L. R., Quittmeyer, R. C. 1981. Repeattimes of great earthquakes along simpleplate boundaries. In Earthquake Predic-tion-An International Review, MauriceEwin9 Set., ed. D. W. Simpson, P. (3.Richards, 4:217-47. Washington, DC:Am. Geophys. Union
Tajima, F., Kanamori, H. 1985a. (31obalsurvey of aftershock area expansion pat-terns. Phys. Earth Planet. Inter. 40: 72134
Tajima, F., Kanamori, H. 1985b. Aftershockarea expansion and mechanical hetero-geneity of fault zone within subductionzones. Geophys. Res. Lett. 12 : 345-48
Taylor, F. W., Isacks, B. L., Jouannic, C.,Bloom, A. L., Dubois, J. 1980. Coseismicand Quaternary vertical tectonic move-ments, Santo and Malekula Islands, NewHebrides island arc. J. Geophys. Res. 85:5367-81
Uyeda, S. 1982. Subduction zones : an intro-duction to comparative subductology.Tectonophysics 81:133-59
Uyeda, S. 1984. Subduction zones: theirdiversity, mechanism and human impacts.GeoJournal 8 : 381-406
Uyeda, S., Kanamori, H. 1979. Back-arcopening and the mode of subduction. J.Geophys. Res. 84 : 1049-61
Vlaar, N. J., Wortel, M. J. R. 1976. Litho-spheric aging, instability, and subduction.Tectonophysics 32 : 331-51
Ward, S. N. 1983. Body wave inversion:moment tensors and depths of oceanicintraplate bending earthquakes. J. Geo-phys. Res. 88:9315-30
Watts, A. B., Talwani, M. 1975. Gravityanomalies seaward of deep-sea trenchesand their tectonic implications. Geophys. J.R. Astron. Soc. 36 : 57-90
Wortel, M. J. R., Vlaar, N. J. 1978. Age-dependent subduction of oceanic litho-sphere beneath western South America.Phys. Earth Planet. Inter. 17 : 201-8
Yonekura, N. 1983. Late Quaternary verticalcrustal movements in and around thePacific as deduced from former shorelinedata. In Geodynamics of the WesternPacific-lndonesian Region, GeodynamicsSer., ed. T. W. C. Hilde, S. Uyeda, 11:41-50. Washington, DC: Am. Geophys.Union/Geol. Soc. Am.
www.annualreviews.org/aronlineAnnual Reviews
Ann
u. R
ev. E
arth
. Pla
net.
Sci.
1986
.14:
293-
322.
Dow
nloa
ded
from
arj
ourn
als.
annu
alre
view
s.or
gby
CA
LIF
OR
NIA
IN
STIT
UT
E O
F T
EC
HN
OL
OG
Y o
n 09
/13/
05. F
or p
erso
nal u
se o
nly.

Ann
u. R
ev. E
arth
. Pla
net.
Sci.
1986
.14:
293-
322.
Dow
nloa
ded
from
arj
ourn
als.
annu
alre
view
s.or
gby
CA
LIF
OR
NIA
IN
STIT
UT
E O
F T
EC
HN
OL
OG
Y o
n 09
/13/
05. F
or p
erso
nal u
se o
nly.