rural border health chartbook - arizona center for rural ... · and intervening organizations such...
TRANSCRIPT

220 Stoneridge Drive, Suite 204 ▪ Columbia, SC 29210 ▪ P: 803-251-6317 ▪ F: 803-251-6399 ▪ http://rhr.sph.sc.edu
RURAL BORDER HEALTH
CHARTBOOK
Rural Health
South
Research Center
At the Heart of Health Policy
Carolina

RURAL BORDER HEALTH
CHARTBOOK
Authors:
Amy Brock Martin, Dr.P.H.
Myriam Torres, Ph.D.
Medha Vyavaharkar, MD, PhD
Zhimin Chen, MS
Samuel Towne, MPH, CPH
Janice C. Probst, Ph.D.
South Carolina Rural Health Research Center
September 2012
Funding Acknowledgement:
This report was prepared under Grant Award U1CRH03711
With the Federal Office of Rural Health Policy, Health Resources and Services Administration
Iran Naqvi, D.P.A., Project Officer

i
EXECUTIVE SUMMARY
Similarities exist in the health issues and priorities in the United States (U.S.) and
Mexico, particularly in the border region where eight of the ten leading causes of death are
the same on either side of the border. Given these similarities, the changing dynamics of
the U.S. population, and the fluidity with which people cross the border each day, it is
essential to better understand health status and health care utilization among border
residents. A majority of research related to the health of U.S.-Mexico border residents has
examined selected health topics or locations within border states. Other studies have
analyzed specific interventions, social factors related to border crossings to obtain
healthcare and health disparities. There is little documentation of the health status and
health care utilization among persons residing on the U.S. side of the entire U.S.-Mexico
border.
Our chartbook adds to existing knowledge regarding conditions in the border
region by examining potential geographic and ethnic disparities among U.S. border
residents. Our chartbook describes select indicators related to access to care, women’s
preventive services, oral health, infectious and communicable diseases and mental health
that have been previously identified as serious disparities warranting programmatic and
policy interventions. We examine these issues among residents of the four border states,
Arizona, California, New Mexico, and Texas, comparing indicators by ethnicity (Hispanic
vs. non-Hispanic), rurality (rural vs. urban), and proximity to border (border vs. non-
border). Our findings should be useful in educating public health officials, policymakers
and intervening organizations such as the United States Border Health Commission, the
Office of Rural Health Policy, and the National Rural Health Association.
Data for this chartbook were drawn from three sources: 2005-2009 State
Behavioral Risk Factor Surveillance System (BRFSS) Surveys obtained from four border
states (Arizona, California, New Mexico, and Texas), 2006-2009 National Health
Interview Surveys (NHIS), and 2008 Area Resource File (ARF).
Access to Care
Border – Non Border Comparisons
Border county adults were less likely to have health insurance coverage than their
respective non-border county peers [border 82.6%, other counties, 84.7%].
Border county adults were less likely to report having a usual source of care than were
non-border residents [border adults, 81.6%, non-border county adults, 85.7%].
Comparisons within Border Counties
Within border counties, Hispanic adults were less likely to have health insurance
coverage than were non-Hispanic peers [Hispanic border adults, 65.6%; non-Hispanic
border adults, 91.9%]. Hispanic adults were also less likely to report a usual source of
care than were their non-Hispanic counterparts [Hispanic border adults, 74.9%, non-
Hispanic border adults, 84.6%].
Within border counties, rural adults were less likely to report having a usual source of
care than were urban residents [rural border adults, 75.7%, urban border adults 82.1%].

ii
Within border counties, Hispanics were more likely to report delaying care due to costs
than were non-Hispanic residents [Hispanic border adults, 23.2%, non-Hispanic border
adults, 10.6%].
Women’s Preventive Services
Border – Non Border Comparisons
Across rural counties, women aged 40 years or older residing in rural border counties
were more likely to report ever receiving a mammogram compared to their rural non-
border peers [rural border women, 93.3%, rural non-border women, 83.9%].
Comparisons within Border Counties alone
Within border county residents, Hispanic women were less likely to report ever having
received a clinical breast examination than were their non-Hispanic peers [Hispanic
border women, 83.8%, non-Hispanic border women, 93.2%].
Within border county residents, Hispanic women were less likely to report having
every received a Pap test than were non-Hispanic women [Hispanic border women,
88.7%, non-Hispanic border women, 96.4%].
Chronic Disease and Associated Risk Factors
Border – Non Border Comparisons
Adults with asthma who lived in border counties were less likely than those living in
non-border counties to report visiting a healthcare provider for routine asthma care
[border adults, 87.0%, non-border adults, 97.0%].
Comparisons within Border Counties alone
Within border county residents, Hispanic adults with asthma were more likely to report
visiting a health care provider for routine check-ups for asthma than were non-Hispanic
adults [Hispanic border adults, 96.4%, non-Hispanic border adults, 77.4%].
Oral Health
Comparisons within Border Counties alone
Among border county residents, non-Hispanic adults were more likely to have a dental
visit in the past year than were Hispanic adults [Hispanic border adults, 58.8%, non-
Hispanic border adults, 72.9%].
Infectious Disease Risks, Screenings, and Immunizations
Border – Non Border Comparisons
Among residents of rural counties in border states, older adults, age 65 years or above,
residing in rural border counties were less likely to receive a flu shot than were rural
older adults in non-border counties [rural border adults, 38.5%, rural non-border adults,
64.5%]. Border disparities were not present in urban counties.
Comparisons within Border Counties alone
With border counties, older adults residing in rural border counties were less likely to
receive a flu shot than were older adults in urban border counties [rural border adults,
38.5%, urban border adults, 64.6%].
iii
Within border county residents, Hispanic adults [overall and rural] were less likely to
have ever received an HIV test than were non-Hispanic adults [Hispanic border adults,
40.9%, non-Hispanic border adults, 48.2%].
Within border county residents, Hispanic adults were less likely to have ever received
Hepatitis B immunization than were non-Hispanic adults [Hispanic border adults,
29.6%, non-Hispanic border adults, 35.1%].
Among border county residents, Hispanic adults were less likely to report personally
knowing an individual with tuberculosis than were their non-Hispanic peers [Hispanic
border adults, 18.9%, non-Hispanic border adults, 23.9%].
Behavioral Health
Border – Non Border Comparisons
Across levels of rurality, border county residents were less likely to report poor mental
health compared to their non-border counterparts.
Comparisons within Border Counties alone
Within border counties, Hispanic adults were less likely to report ever having been
diagnosed with a depressive disorder than were non-Hispanic adults [Hispanic border
adults, 12.5%, non-Hispanic border adults, 19.7%]. This difference was present within
both rural and urban border residents.

DEDICATION & ACKNOWLEDGEMENT
The completion of this chartbook would not have occurred without the technical support provided
by our partners dedicated to improving health along the U.S.-Mexico border region. We thank
them for their partnership and assistance in the sharing and analysis of data, as well as their
guidance throughout the writing process.
Arizona
Richard Porter, Chief, Bureau of Public Health Statistics, Arizona Department of Health
Services
Robert Guerrero, Chief, Office of Border Health, Arizona Department of Health Services
California
Arti Parikh-Patel, Coordinator, Survey Research Group, Public Health Institute
Mauricio Leiva, Chief, California Office of Binational Border Health, California
Department of Public Health
Marta Induni, Research Program Director, Survey Research Group, Public Health Institute
New Mexico
Vivian Heye, Coordinator, Epidemiology & Response Division, New Mexico Department
of Health
Wayne Honey, Survey Epidemiologist, Survey Section, Injury & Behavioral Epidemiology
Bureau, Epidemiology & Response Division, New Mexico Department of Health
Paul Dulin, Director, New Mexico Office of Border Health, New Mexico Department of
Health
Texas
Michelle Cook, Coordinator, Center for Health Statistics, Texas Department of State
Health Services
Ronald J. Dutton, Director, Texas Office Border Health, Texas Department of State Health
Services
US Border Health Commission
Cecilia Rosales, U.S.-México Border Health Commission Member-Arizona
Dan Reyna, General Manager, U.S. Section, U.S.-México Border Health Commission
Lorraine Navarrete, Binational Operations Coordinator, MSA, Inc. (CTR)
During the writing of this chartbook, we lost two important advocates for our work, Ms. Rosemary
McKenzie and Mr. Dan Reyna. Rosemary served as the Minority Liaison and Program Services
Manager for the National Rural Health Association for 27 years. She also served on the Expert
Work Group for our Center since its inception. Dan was the General Manager for the U.S.-Mexico
Border Health Commission, U.S. Section. Both Rosemary and Dan provided significant counsel to
the team who assembled this report and had visions of how it could be used to improve the health
status for people they championed on a daily basis. We dedicate this chartbook to their years of
service.
Table of Contents
Introduction ................................................................................................................................................................................................ 3
Purpose of Chartbook ............................................................................................................................................................................ 4
Chartbook Methodology ........................................................................................................................................................................ 4
Access to Care – Health Services Availability ............................................................................................................................................... 5
Access to Care: Insurance Coverage ........................................................................................................................................................... 6
Access to Care: Usual Source of Care ......................................................................................................................................................... 7
Access to Care: Delayed Care Due to Cost .................................................................................................................................................. 8
Women’s Preventive Services: Mammography .......................................................................................................................................... 9
Women’s Preventive Services: Clinical Breast Examination ..................................................................................................................... 10
Women’s Preventive Services: Pap Test ................................................................................................................................................... 11
Chronic Disease: Diabetes ......................................................................................................................................................................... 12
Chronic Disease: Overweight or Obesity ................................................................................................................................................... 13
Chronic Disease: Routine Check-ups for Asthma ....................................................................................................................................... 14
Chronic Disease: Emergency Visits for Asthma among Adults................................................................................................................... 15
Chronic Disease: Symptomatic Treatment for Asthma .............................................................................................................................. 16
Oral Health: Any Dental Visits ................................................................................................................................................................... 17
Oral Health: Dental Cleaning ..................................................................................................................................................................... 18
Infectious Disease: Influenza (Flu) Shot ..................................................................................................................................................... 19
Infectious Disease: HIV Testing................................................................................................................................................................. 20
Infectious Disease: Hepatitis B Immunization ........................................................................................................................................... 21
Infectious Disease: Perceived Susceptibility to Tuberculosis (TB) ............................................................................................................. 22
Infectious Disease: Personally Knowing a Tuberculosis (TB) Patient ......................................................................................................... 23
Infectious Disease: Homelessness ............................................................................................................................................................. 24
Behavioral Health: Poor Mental Health ..................................................................................................................................................... 25
Behavioral Health: Depressive Disorder ................................................................................................................................................... 26
Appendix A: Technical Notes ..................................................................................................................................................................... 27
DATA SOURCES .................................................................................................................................................................................... 27
Behavioral Risk Factor Surveillance System (BRFSS) – 2005-2009 .................................................................................................. 27
National Health Interview Survey (NHIS) -- 2006-2009................................................................................................................... 28
KEY DEFINITIONS.................................................................................................................................................................................. 28
Border States and Counties ............................................................................................................................................................ 28
Rurality ........................................................................................................................................................................................... 28
Ethnicity.......................................................................................................................................................................................... 29
DATA ANALYSIS .................................................................................................................................................................................... 29
Accuracy of Results ......................................................................................................................................................................... 29
Data Limitations ............................................................................................................................................................................. 29
Appendix B: Bibliography .......................................................................................................................................................................... 30
Appendix C: Number of Observations for Each Indicator ......................................................................................................................... 31
3
Introduction
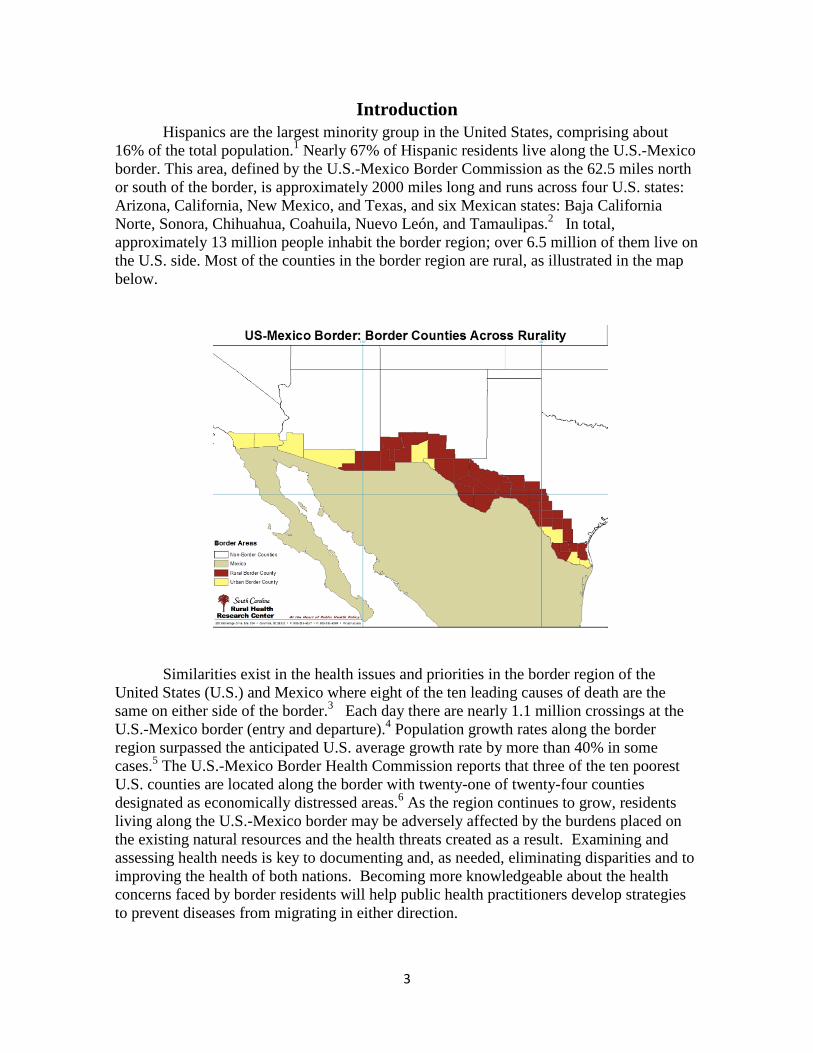
Hispanics are the largest minority group in the United States, comprising about
16% of the total population.1 Nearly 67% of Hispanic residents live along the U.S.-Mexico
border. This area, defined by the U.S.-Mexico Border Commission as the 62.5 miles north
or south of the border, is approximately 2000 miles long and runs across four U.S. states:
Arizona, California, New Mexico, and Texas, and six Mexican states: Baja California
Norte, Sonora, Chihuahua, Coahuila, Nuevo León, and Tamaulipas.2 In total,
approximately 13 million people inhabit the border region; over 6.5 million of them live on
the U.S. side. Most of the counties in the border region are rural, as illustrated in the map
below.
Similarities exist in the health issues and priorities in the border region of the
United States (U.S.) and Mexico where eight of the ten leading causes of death are the
same on either side of the border.3 Each day there are nearly 1.1 million crossings at the
U.S.-Mexico border (entry and departure).4 Population growth rates along the border
region surpassed the anticipated U.S. average growth rate by more than 40% in some
cases.5 The U.S.-Mexico Border Health Commission reports that three of the ten poorest
U.S. counties are located along the border with twenty-one of twenty-four counties
designated as economically distressed areas.6 As the region continues to grow, residents
living along the U.S.-Mexico border may be adversely affected by the burdens placed on
the existing natural resources and the health threats created as a result. Examining and
assessing health needs is key to documenting and, as needed, eliminating disparities and to
improving the health of both nations. Becoming more knowledgeable about the health
concerns faced by border residents will help public health practitioners develop strategies
to prevent diseases from migrating in either direction.

4
Purpose of Chartbook
Given the health disparity similarities for residents on either side of the U.S.-
Mexico border, the changing dynamics of the U.S. population, and the fluidity with which
people cross the border each day, it is essential to better understand the health status and
health care utilization among border residents. A majority of research related to the health
of U.S.-Mexico border residents has examined specific health topics or geographic
locations within border states.7-9
Other studies have analyzed specific interventions, social
factors related to border crossings to obtain healthcare, and health disparities. However,
few studies have examined the health status and health care utilization among persons
residing on the U.S. side of the entire U.S.-Mexico border.
Our chartbook adds to and expands the existing knowledge base on conditions in
the border region by examining potential geographic and ethnic disparities among U.S.
border residents. Our chartbook describes select indicators related to access to care,
women’s preventive services, oral health, infectious and communicable diseases and
mental health that have been previously identified as serious disparities warranting
programmatic and policy interventions. We examine these issues among residents of the
four border states, Arizona, California, New Mexico, and Texas, comparing indicators by
ethnicity (Hispanic vs. non-Hispanic of any race), rurality (rural vs. urban), and proximity
to border (border vs. non-border). Because much of the analysis relies on information
provided by individual border states and not available in public use data sets, the study
does not examine the rest of the U.S.
We reference relevant Healthy People 2010 objectives for each section to provide
context on how border state findings from 2005-2009 compare to national public health
targets for the same time period. Given data limitations, direct comparisons cannot always
be made. Our findings should be useful in informing public health officials, policymakers
and relevant organizations such as the United States Border Health Commission, the Office
of Rural Health Policy, and the National Rural Health Association.
Chartbook Methodology
We analyzed information from multiple sources to develop an effective picture of
health and health services use among persons residing on the U.S. side of the U.S./Mexico
border. We drew extensively from the Behavioral Risk Factor Surveillance System
(BRFSS), coordinated by the Centers for Disease Control and Prevention and implemented
within each U.S. state. To get county-level information for small rural counties, we
worked with BRFSS coordinators in each state, who are acknowledged in the Dedication
and Acknowledgement. We also used the National Health Interview Survey of the
National Center for Health Statistics, and the 2008 Area Resource File, a compendium of
county-level information about hospitals, physicians and other providers which is
sponsored by the Health Resources and Services Administration, United States Department
of Health and Human Services. Details about each of these sources are provided in
Appendix A, Technical Notes. Appendix B lists citations used. Appendix C provides
background tables showing the number of observations that underlie each table and figure
in the chartbook.

5
Access to Care – Health Services Availability
Accessing health care can be challenging
for border residents in Arizona, California, New
Mexico and Texas. Only one border county,
located in Texas, is not a Primary Care Health
Professional Shortage Area (HPSA), either at the
whole or partial county level (map at right).
Access to mental health services presents even
greater challenges. All but one Arizona border
county is a whole county Mental Health HPSA
(map at right).
Access to oral health care is equally
challenging along the U.S.-Mexico border. As
illustrated by the map at right, most U.S.-Mexico
border counties are whole county dental HPSAs.

6
Access to Care: Insurance Coverage
Border county adults were significantly
less likely (p=.047) to report having health
insurance coverage than were adults residing
in non-border counties in Arizona,
California, New Mexico and Texas (See
chart at right). Rural border adults were not
less likely to be insured than adults in non-
border counties in the same states. However,
urban border adults were significantly less
likely to report having health coverage
compared to their urban non-border
counterparts (p=.018).
Among border county adults, insurance
rates were similar in rural and urban counties
(Table 1, below). Urban non-Hispanic adults
had the highest rates of health coverage
(92.0%) whereas urban Hispanics had the lowest rates (65.1%). Hispanic adults were less
likely to report health insurance regardless of where they lived.
Table 1. Percent of Border County Adults Who Report Having Health Coverage, by
Rurality and Ethnicity, 2005-2009
Area of Residence
Ethnicity
Total Hispanic Non-Hispanic p-value for ethnicity
Total 82.6 65.6 91.9 < .0001 Rural 81.1 69.3 90.4 .0146 Urban 82.8 65.1 92.0 < .0001
p-value for rurality 0.75 0.71 0.53
Bold numbers indicate significant differences at p<0.05
Results are based on responses to the Behavioral Risk Factor Surveillance System. Respondents were asked, “Do you have any kind of health care coverage, including health insurance, prepaid plans such as HMOs, or government plans such as Medicare?”
Healthy People 2010 Objective 1-1: Increase the proportion of persons with health insurance to
100%
Previous national estimates: 83% (1997)
Source: National Health Interview Survey
81.1 82.8† 82.6† 77.4
85.2† 84.7†
0.0
25.0
50.0
75.0
100.0
Rural Urban Total
Percent of Adults Living in Border States Who Report Having Health Insurance,
by Rurality, BRFSS, 2005-2009
Border Counties Non-Border Counties
† Significantly Different at p < 0.05
7
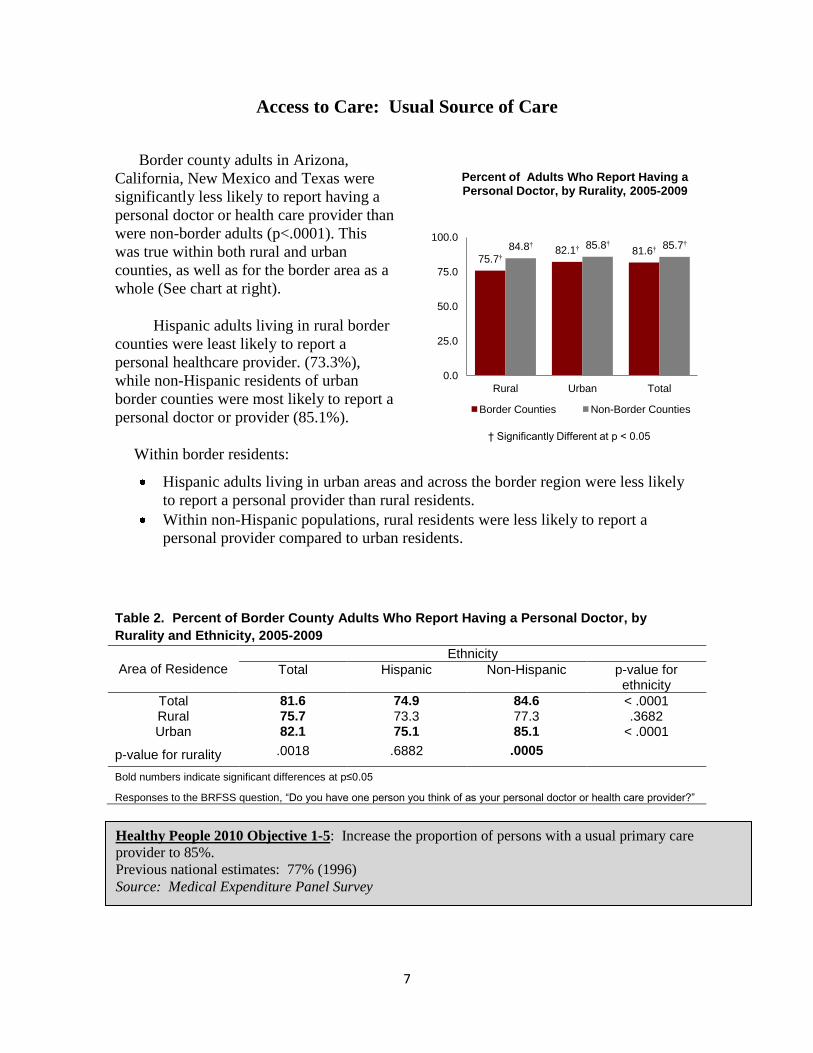
Access to Care: Usual Source of Care
Border county adults in Arizona,
California, New Mexico and Texas were
significantly less likely to report having a
personal doctor or health care provider than
were non-border adults (p<.0001). This
was true within both rural and urban
counties, as well as for the border area as a
whole (See chart at right).
Hispanic adults living in rural border
counties were least likely to report a
personal healthcare provider. (73.3%),
while non-Hispanic residents of urban
border counties were most likely to report a
personal doctor or provider (85.1%).
Within border residents:
Hispanic adults living in urban areas and across the border region were less likely
to report a personal provider than rural residents.
Within non-Hispanic populations, rural residents were less likely to report a
personal provider compared to urban residents.
Table 2. Percent of Border County Adults Who Report Having a Personal Doctor, by
Rurality and Ethnicity, 2005-2009
Area of Residence
Ethnicity
Total Hispanic Non-Hispanic p-value for ethnicity
Total 81.6 74.9 84.6 < .0001 Rural 75.7 73.3 77.3 .3682 Urban 82.1 75.1 85.1 < .0001
p-value for rurality .0018 .6882 .0005
Bold numbers indicate significant differences at p≤0.05
Responses to the BRFSS question, “Do you have one person you think of as your personal doctor or health care provider?”
Healthy People 2010 Objective 1-5: Increase the proportion of persons with a usual primary care
provider to 85%.
Previous national estimates: 77% (1996)
Source: Medical Expenditure Panel Survey
75.7† 82.1† 81.6† 84.8† 85.8† 85.7†
0.0
25.0
50.0
75.0
100.0
Rural Urban Total
Percent of Adults Who Report Having a Personal Doctor, by Rurality, 2005-2009
Border Counties Non-Border Counties
† Significantly Different at p < 0.05

8
Access to Care: Delayed Care Due to Cost
Adults living in border counties were not
more likely than adults living in non-border
counties in Arizona, California, New
Mexico and Texas to report delaying care
due to cost (chart at right). Overall, between
15% and 16% of adults reported this cost
barrier.
Within border county residents, rural
non-Hispanic adults were most likely to
report delaying care (35.6%) while urban
non-Hispanics were least likely (8.5%).
Hispanics (overall and urban) were more
likely than their respective non-Hispanic
peers to delay care due to costs (Table 3).
Among border county residents, differences included:
Among non-Hispanic adults, rural residents were more likely than urban to forgo a
doctor’s visit due to cost.
Hispanic adults (overall and urban) were more likely than their respective non-
Hispanic peers to delay care due to cost.
Table 3. Percent of Border County Adults Who Report Delaying Care Due to Cost, by
Rurality and Ethnicity, 2005-2009
Area of Residence
Ethnicity
Total Hispanic Non-Hispanic p-value for ethnicity
Total 15.1 23.2 10.6 < .0001 Rural 29.7 22.3 35.6 .4490 Urban 13.6 23.4 8.5 < .0001
p-value for rurality .0627 .8982 .0150
_________________________________________________________________________ Bold numbers indicate significant differences at p≤0.05.
Responses to the BRFSS question: “Was there a time in the past 12 months when you needed to see a doctor but could not because of cost?”
Healthy People 2010 Objective 1-6: Reduce the proportion of families to 7% that experience difficulties
or delays in obtaining health care or do not receive needed care for one or more family members.
Previous national estimates: 12% (1996)
Source: Medical Expenditure Panel Survey
29.7
13.6 15.1
25.7
15.1 15.8
0.0
25.0
50.0
75.0
100.0
Rural Urban Total
Percent of Adults Who Report Delaying Care Due
to Cost, by Rurality, 2005-2009
Border Counties Non-Border Counties
9
Women’s Preventive Services: Mammography
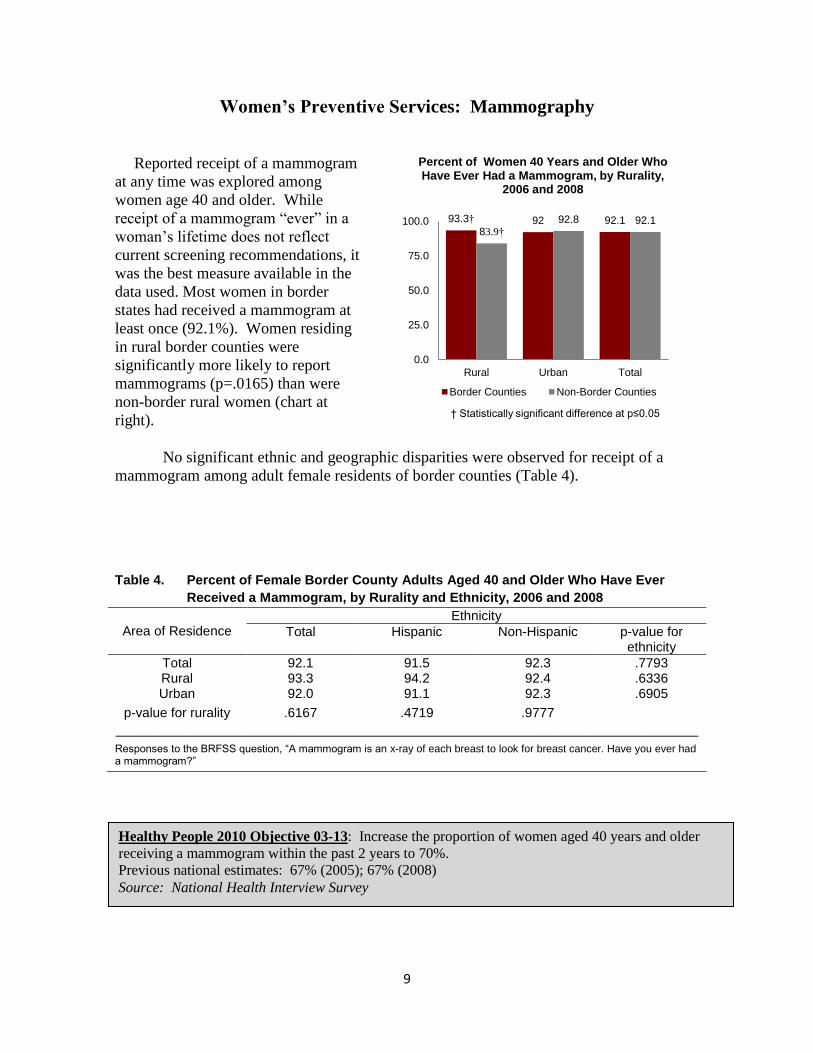
Reported receipt of a mammogram
at any time was explored among
women age 40 and older. While
receipt of a mammogram “ever” in a
woman’s lifetime does not reflect
current screening recommendations, it
was the best measure available in the
data used. Most women in border
states had received a mammogram at
least once (92.1%). Women residing
in rural border counties were
significantly more likely to report
mammograms (p=.0165) than were
non-border rural women (chart at
right).
No significant ethnic and geographic disparities were observed for receipt of a
mammogram among adult female residents of border counties (Table 4).
Table 4. Percent of Female Border County Adults Aged 40 and Older Who Have Ever
Received a Mammogram, by Rurality and Ethnicity, 2006 and 2008
Area of Residence
Ethnicity
Total Hispanic Non-Hispanic p-value for ethnicity
Total 92.1 91.5 92.3 .7793 Rural 93.3 94.2 92.4 .6336 Urban 92.0 91.1 92.3 .6905
p-value for rurality .6167 .4719 .9777
_________________________________________________________________________ Responses to the BRFSS question, “A mammogram is an x-ray of each breast to look for breast cancer. Have you ever had a mammogram?”
Healthy People 2010 Objective 03-13: Increase the proportion of women aged 40 years and older
receiving a mammogram within the past 2 years to 70%.
Previous national estimates: 67% (2005); 67% (2008)
Source: National Health Interview Survey
93.3† 92 92.1 83.9†
92.8 92.1
0.0
25.0
50.0
75.0
100.0
Rural Urban Total
Percent of Women 40 Years and Older Who Have Ever Had a Mammogram, by Rurality,
2006 and 2008
Border Counties Non-Border Counties
† Statistically significant difference at p≤0.05
10
Women’s Preventive Services: Clinical Breast Examination
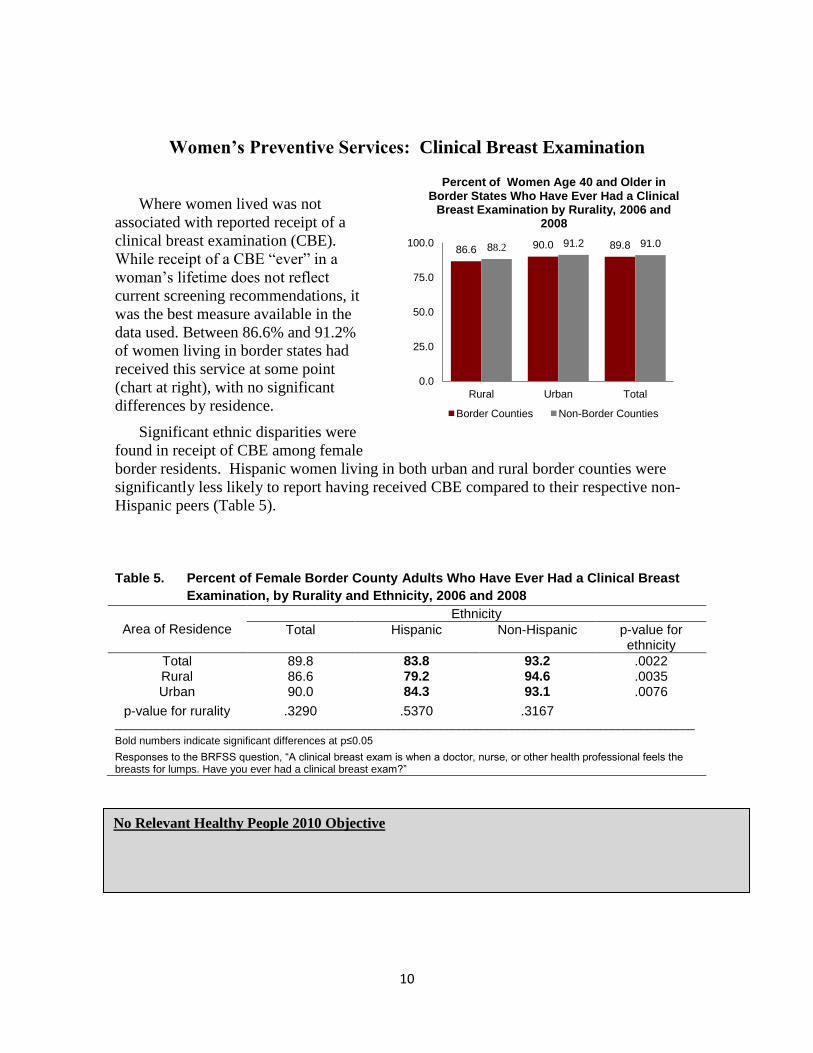
Where women lived was not
associated with reported receipt of a
clinical breast examination (CBE).
While receipt of a CBE “ever” in a
woman’s lifetime does not reflect
current screening recommendations, it
was the best measure available in the
data used. Between 86.6% and 91.2%
of women living in border states had
received this service at some point
(chart at right), with no significant
differences by residence.
Significant ethnic disparities were
found in receipt of CBE among female
border residents. Hispanic women living in both urban and rural border counties were
significantly less likely to report having received CBE compared to their respective non-
Hispanic peers (Table 5).
Table 5. Percent of Female Border County Adults Who Have Ever Had a Clinical Breast
Examination, by Rurality and Ethnicity, 2006 and 2008
Area of Residence
Ethnicity
Total Hispanic Non-Hispanic p-value for ethnicity
Total 89.8 83.8 93.2 .0022 Rural 86.6 79.2 94.6 .0035 Urban 90.0 84.3 93.1 .0076
p-value for rurality .3290 .5370 .3167 __________________________________________________________________________________________________
Bold numbers indicate significant differences at p≤0.05
Responses to the BRFSS question, “A clinical breast exam is when a doctor, nurse, or other health professional feels the breasts for lumps. Have you ever had a clinical breast exam?”
No Relevant Healthy People 2010 Objective
86.6 90.0 89.8 88.2 91.2 91.0
0.0
25.0
50.0
75.0
100.0
Rural Urban Total
Percent of Women Age 40 and Older in Border States Who Have Ever Had a Clinical
Breast Examination by Rurality, 2006 and 2008
Border Counties Non-Border Counties

11
Women’s Preventive Services: Pap Test
Women living in border counties in
Arizona, California, New Mexico and
Texas were no less likely than women
living in non-border counties to report
having ever received a Pap test (chart at
right).
Within border counties, there were no
differences in Pap receipt associated with
residence. Significant differences were
found among urban women:
Hispanic urban female residents
were less likely to report receiving a
Pap test (88.3%) than were non-
Hispanic urban residents (96.5%).
Hispanic women overall, were less
likely than non-Hispanic women to report receiving a Pap test (Table 6).
Table 6. Percent of Female Border County Adults Who Have Ever Had a Pap Test, by
Rurality and Ethnicity, 2006 and 2008
Area of Residence
Ethnicity
Total Hispanic Non-Hispanic p-value for ethnicity
Total 93.6 88.7 96.4 .0016 Rural 92.8 91.9 93.8 .6542 Urban 93.6 88.3 96.5 .0018
p-value for rurality .7367 .4591 .2818 __________________________________________________________________________________________________
Bold numbers indicate significant differences at p≤0.05.
Responses to the BRFSS question, “A Pap test is a test for cancer of the cervix. Have you ever had a Pap test?”
Healthy People 2010 Objective 03-11a: Increase the proportion of women who have ever received a Pap
test to 97%.
Previous national estimates: 92% have ‘ever’ had a Pap test (1998)
Source: National Health Interview Survey
92.8 93.6 93.6 94.2 95.3 95.2
0.0
25.0
50.0
75.0
100.0
Rural Urban Total
Percent of Women Living in Border States Who Have Ever Had a Pap Test, by Rurality,
2006 and 2008
Border Counties Non-Border Counties
12
Chronic Disease: Diabetes
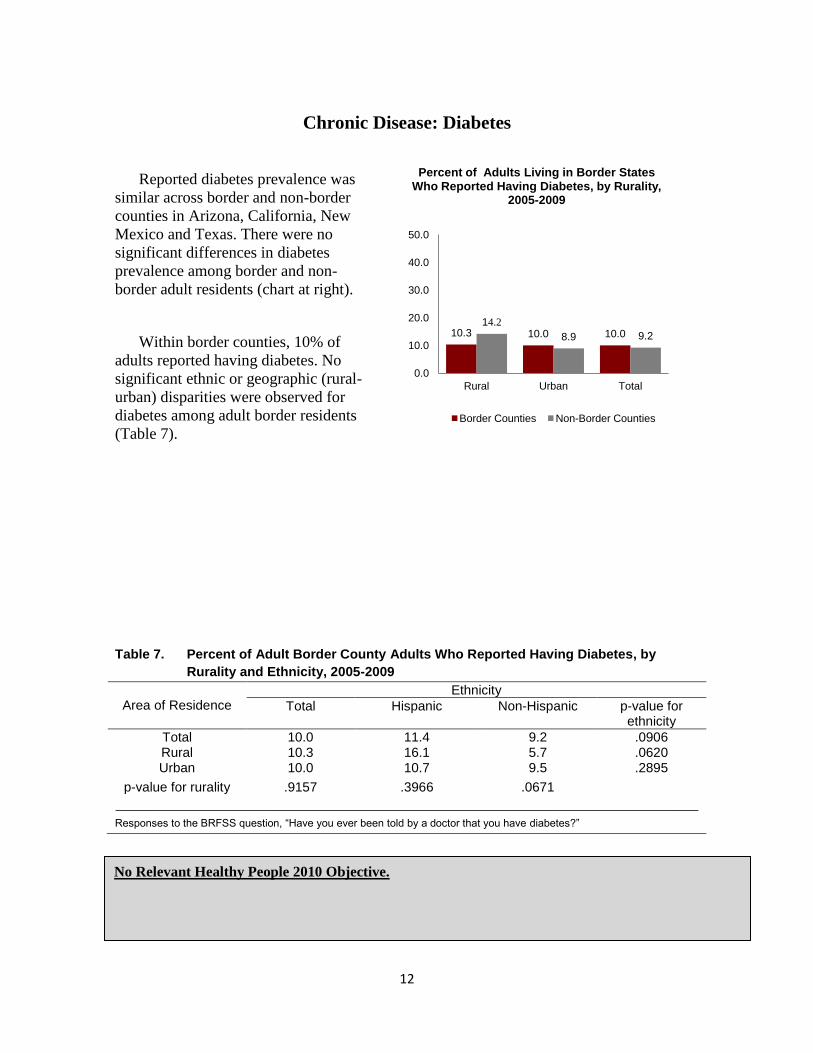
Reported diabetes prevalence was
similar across border and non-border
counties in Arizona, California, New
Mexico and Texas. There were no
significant differences in diabetes
prevalence among border and non-
border adult residents (chart at right).
Within border counties, 10% of
adults reported having diabetes. No
significant ethnic or geographic (rural-
urban) disparities were observed for
diabetes among adult border residents
(Table 7).
Table 7. Percent of Adult Border County Adults Who Reported Having Diabetes, by
Rurality and Ethnicity, 2005-2009
Area of Residence
Ethnicity
Total Hispanic Non-Hispanic p-value for ethnicity
Total 10.0 11.4 9.2 .0906 Rural 10.3 16.1 5.7 .0620 Urban 10.0 10.7 9.5 .2895
p-value for rurality .9157 .3966 .0671
_________________________________________________________________________ Responses to the BRFSS question, “Have you ever been told by a doctor that you have diabetes?”
Infectious Disease Screening & Immunization
No Relevant Healthy People 2010 Objective.
10.3 10.0 10.0 14.2
8.9 9.2
0.0
10.0
20.0
30.0
40.0
50.0
Rural Urban Total
Percent of Adults Living in Border States Who Reported Having Diabetes, by Rurality,
2005-2009
Border Counties Non-Border Counties
13
Chronic Disease: Overweight or Obesity
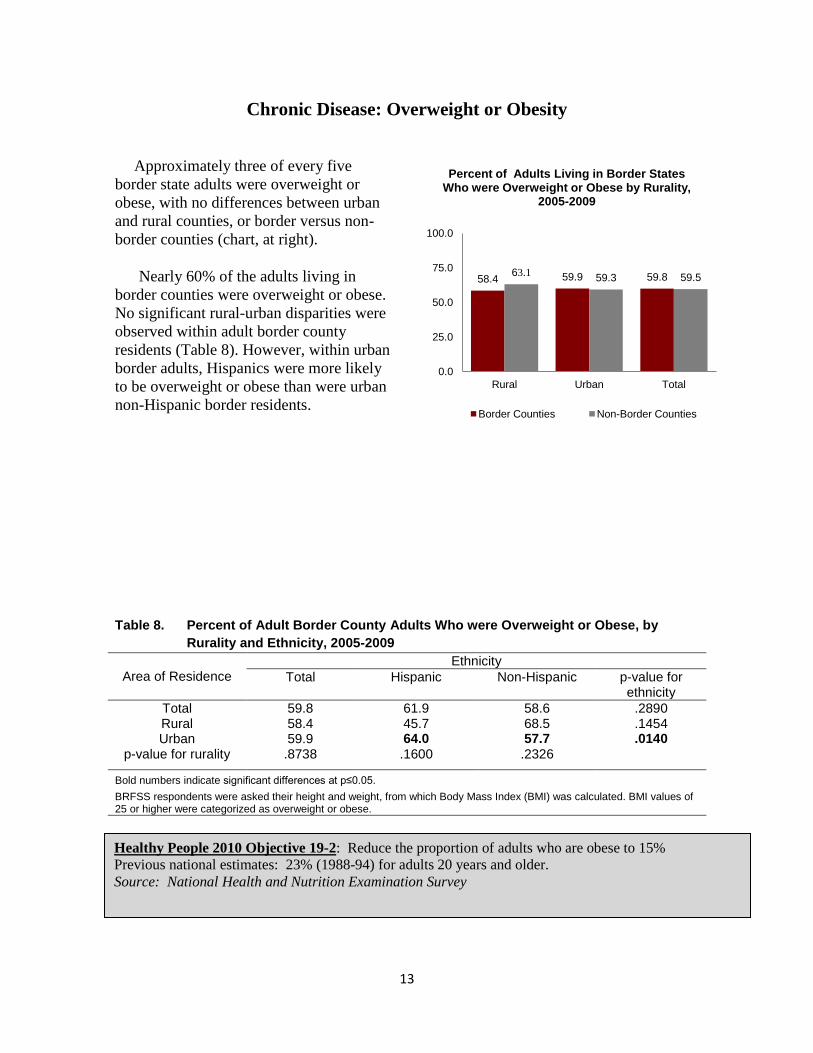
Approximately three of every five
border state adults were overweight or
obese, with no differences between urban
and rural counties, or border versus non-
border counties (chart, at right).
Nearly 60% of the adults living in
border counties were overweight or obese.
No significant rural-urban disparities were
observed within adult border county
residents (Table 8). However, within urban
border adults, Hispanics were more likely
to be overweight or obese than were urban
non-Hispanic border residents.
Table 8. Percent of Adult Border County Adults Who were Overweight or Obese, by
Rurality and Ethnicity, 2005-2009
Area of Residence
Ethnicity
Total Hispanic Non-Hispanic p-value for ethnicity
Total 59.8 61.9 58.6 .2890 Rural 58.4 45.7 68.5 .1454 Urban 59.9 64.0 57.7 .0140
p-value for rurality .8738 .1600 .2326
Bold numbers indicate significant differences at p≤0.05.
BRFSS respondents were asked their height and weight, from which Body Mass Index (BMI) was calculated. BMI values of 25 or higher were categorized as overweight or obese.
Healthy People 2010 Objective 19-2: Reduce the proportion of adults who are obese to 15%
Previous national estimates: 23% (1988-94) for adults 20 years and older.
Source: National Health and Nutrition Examination Survey
58.4 59.9 59.8 63.1 59.3 59.5
0.0
25.0
50.0
75.0
100.0
Rural Urban Total
Percent of Adults Living in Border States Who were Overweight or Obese by Rurality,
2005-2009
Border Counties Non-Border Counties
14
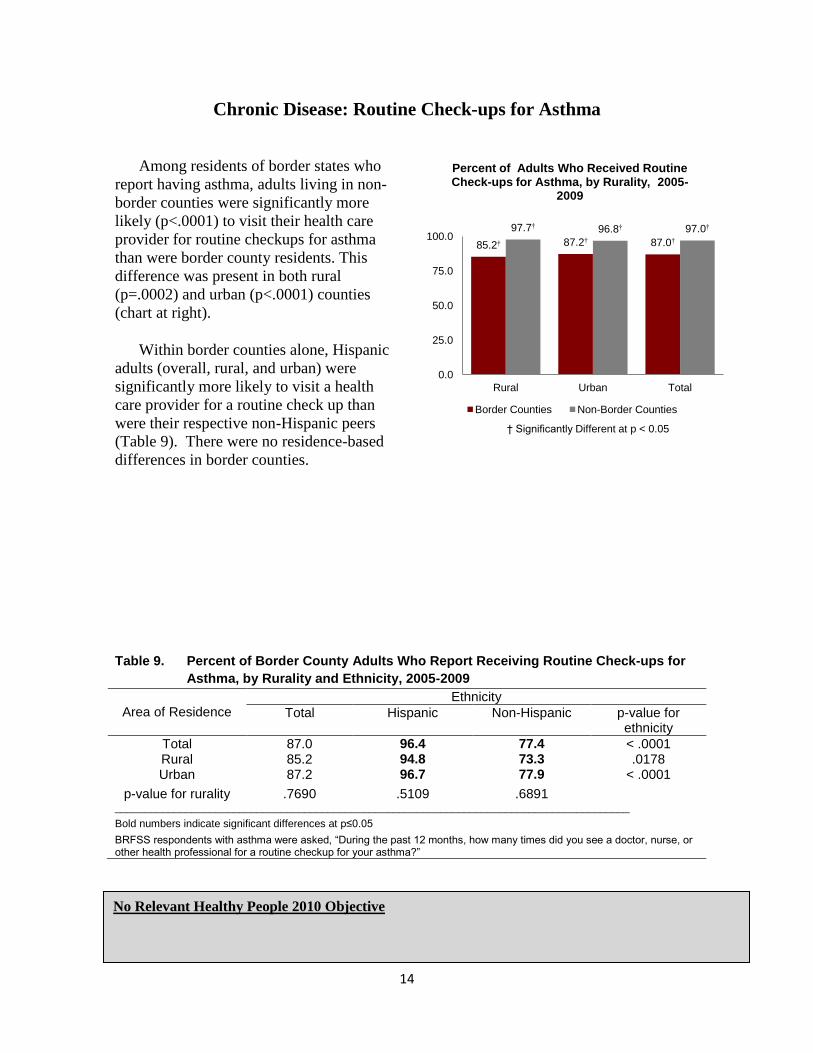
Chronic Disease: Routine Check-ups for Asthma
Among residents of border states who
report having asthma, adults living in non-
border counties were significantly more
likely (p<.0001) to visit their health care
provider for routine checkups for asthma
than were border county residents. This
difference was present in both rural
(p=.0002) and urban (p<.0001) counties
(chart at right).
Within border counties alone, Hispanic
adults (overall, rural, and urban) were
significantly more likely to visit a health
care provider for a routine check up than
were their respective non-Hispanic peers
(Table 9). There were no residence-based
differences in border counties.
Table 9. Percent of Border County Adults Who Report Receiving Routine Check-ups for
Asthma, by Rurality and Ethnicity, 2005-2009
Area of Residence
Ethnicity
Total Hispanic Non-Hispanic p-value for ethnicity
Total 87.0 96.4 77.4 < .0001 Rural 85.2 94.8 73.3 .0178 Urban 87.2 96.7 77.9 < .0001
p-value for rurality .7690 .5109 .6891 _______________________________________________________________________________________
Bold numbers indicate significant differences at p≤0.05
BRFSS respondents with asthma were asked, “During the past 12 months, how many times did you see a doctor, nurse, or other health professional for a routine checkup for your asthma?”
No Relevant Healthy People 2010 Objective
85.2† 87.2† 87.0†
97.7† 96.8† 97.0†
0.0
25.0
50.0
75.0
100.0
Rural Urban Total
Percent of Adults Who Received Routine Check-ups for Asthma, by Rurality, 2005-
2009
Border Counties Non-Border Counties
† Significantly Different at p < 0.05
15
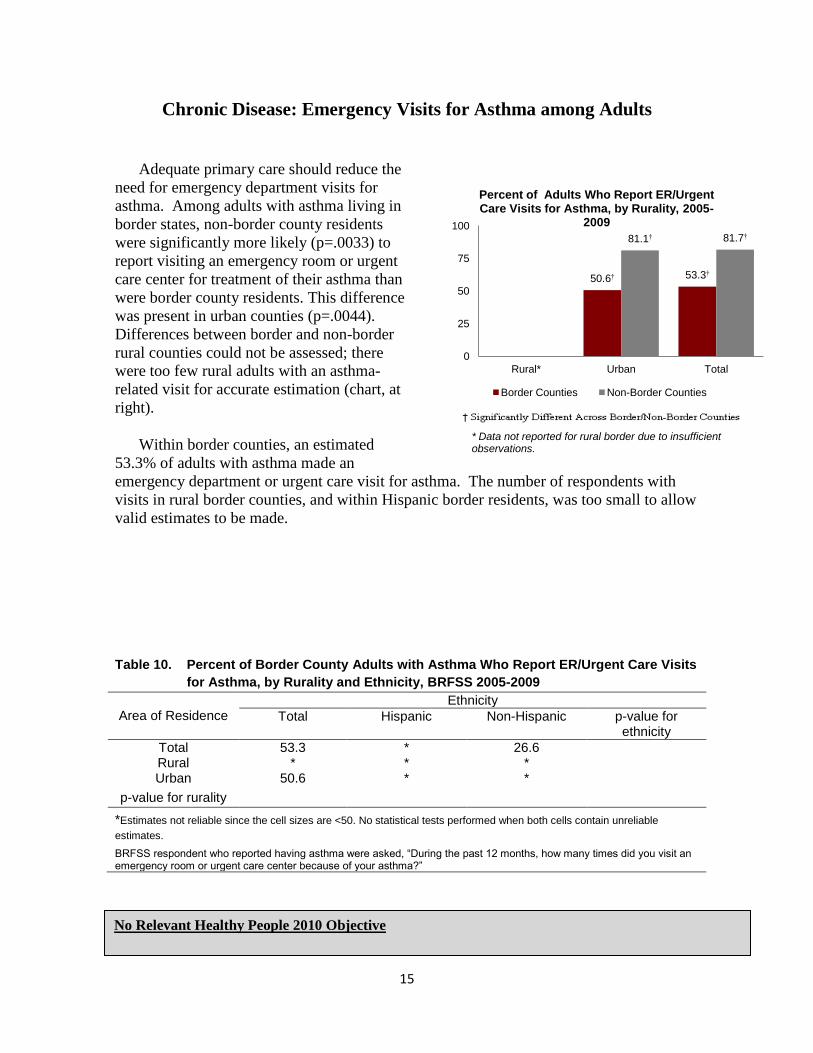
Chronic Disease: Emergency Visits for Asthma among Adults
Adequate primary care should reduce the
need for emergency department visits for
asthma. Among adults with asthma living in
border states, non-border county residents
were significantly more likely (p=.0033) to
report visiting an emergency room or urgent
care center for treatment of their asthma than
were border county residents. This difference
was present in urban counties (p=.0044).
Differences between border and non-border
rural counties could not be assessed; there
were too few rural adults with an asthma-
related visit for accurate estimation (chart, at
right).
Within border counties, an estimated
53.3% of adults with asthma made an
emergency department or urgent care visit for asthma. The number of respondents with
visits in rural border counties, and within Hispanic border residents, was too small to allow
valid estimates to be made.
Table 10. Percent of Border County Adults with Asthma Who Report ER/Urgent Care Visits
for Asthma, by Rurality and Ethnicity, BRFSS 2005-2009
Area of Residence
Ethnicity
Total Hispanic Non-Hispanic p-value for ethnicity
Total 53.3 * 26.6 Rural * * * Urban 50.6 * *
p-value for rurality
*Estimates not reliable since the cell sizes are <50. No statistical tests performed when both cells contain unreliable
estimates.
BRFSS respondent who reported having asthma were asked, “During the past 12 months, how many times did you visit an emergency room or urgent care center because of your asthma?”
No Relevant Healthy People 2010 Objective
50.6† 53.3†
81.1† 81.7†
0
25
50
75
100
Rural* Urban Total
Percent of Adults Who Report ER/Urgent Care Visits for Asthma, by Rurality, 2005-
2009
Border Counties Non-Border Counties
* Data not reported for rural border due to insufficient observations.

16
Chronic Disease: Symptomatic Treatment for Asthma
Border-state adults with asthma
who lived in non-border counties were
significantly more likely (p<.0001) to
report visiting a doctor, nurse or other
health professional for urgent
treatment of worsening asthma
symptoms than were border county
residents (chart at right). This BRFSS
question excludes visits to emergency
rooms or urgent care, but focuses on
other visits to a healthcare practitioner.
Within border counties, 92.3% of
Hispanic adults versus 53.2% of non-
Hispanic adults reported visiting a
healthcare provider for worsening
asthma symptoms (p < 0.0001, Table 11). Rural urban differences are difficult to assess
because of the low numbers of Hispanic respondents.
Table 11. Percent of Border County Adults Who Report Having Urgent Treatment for
Asthma, by Rurality and Ethnicity, 2005-2009
Area of Residence
Ethnicity
Total Hispanic Non-Hispanic p-value for ethnicity
Total 72.7 92.3 53.2 < .0001 Rural 79.0 * * Urban 71.3 * 54.5
p-value for rurality .5625 .9355 .2433
*Estimates not reliable since the cell sizes are <50. No statistical tests performed when both cells contain unreliable
estimates.
Bold numbers indicate significant differences at p≤0.05,
BRFSS respondents with asthma were asked, “Besides emergency room or urgent care center visits [emphasis added], during the past 12 months, how many times did you see a doctor, nurse or other health professional for urgent treatment of worsening asthma symptoms?”
No Relevant Healthy People 2010 Objective
79.0 71.3 72.7†
93.2 93.1 93.1†
0.0
25.0
50.0
75.0
100.0
Rural Urban Total
Percent of Adults Who Report Having Treatment for Asthma Symptoms, by Rurality
Source: BRFSS, 2005-2009
Border Counties Non-Border Counties

17
Oral Health: Any Dental Visits
Across the border states, similar
proportions of adults living in border and
non-border counties reported having a
dental visit for any reason in the past year
(See chart on right).
Within border county residents:
Non-Hispanic adults (total and
urban) were significantly more
likely to report any dental visits
compared to their Hispanic
counterparts.
Within non-Hispanic adults, urban
residents were more likely to have
any dental visits compared to their
rural peers (Table 12).
Table 12. Percent of Border County Adults Reporting Dental Visits, by Rurality and
Ethnicity, 2005-2009
Area of Residence
Ethnicity
Total Hispanic Non-Hispanic p-value for ethnicity
Total 67.7 58.8 72.9 .0038 Rural 74.2 78.5 68.0 .4791 Urban 67.1 56.0 73.2 .0002
p-value for rurality
.4724 .1730 .0398
Bold numbers indicate significant differences at p≤0.05.
BRFSS respondents were asked, “How long has it been since you last visited a dentist or a dental clinic for any reason? Include visits to dental specialists, such as orthodontists.”
Healthy People 2010 Objective 21-10: Increase the proportion of adults who use the oral health care
system each year to 56%.
Previous national estimates: 43% (1996) adults 18 years and older
Source: Medical Expenditure Panel Survey
74.2 67.1 67.7
63.0 66.8 66.6
0.0
25.0
50.0
75.0
100.0
Rural Urban Total
Percent of Adults Who Report Having a Dental Visit, by Rurality, 2005-2009
Border Counties Non-Border Counties

18
Oral Health: Dental Cleaning
There were no significant differences
in reported receipt of dental cleaning
among border and non-border residents
(at right). Across the four border states,
65.2% of border county adults and
58.7% of adults in other counties in the
state reported having their teeth cleaned
by a dentist or hygienist during the past
12 months.
Within border counties, reported
receipt of a dental cleaning in the past
year did not differ by residence or
ethnicity (Table 13).
Table 13. Percent of Border County Adults Who Reported having a Dental Cleaning, by
Rurality and Ethnicity, 2005-2009
Area of Residence
Ethnicity
Total Hispanic Non-Hispanic p-value for ethnicity
Total 65.2 65.6 64.8 .9243 Rural 71.4 77.6 62.3 .3328 Urban 63.8 62.2 65.2 .7276
p-value for rurality .4987 .3646 .4723
BRFSS respondents were asked, “How long has it been since you had your teeth cleaned by a dentist or dental hygienist?” Responses shown are those reporting a cleaning in the past 12 months.
No Relevant Healthy People 2010 Objective.
71.4 63.8 65.2
56.5 59.1 58.7
0.0
25.0
50.0
75.0
100.0
Rural Urban Total
Percent of Adults Reporting a Dental Cleaning, by Rurality, 2005-2009
Border Counties Non-Border Counties
19
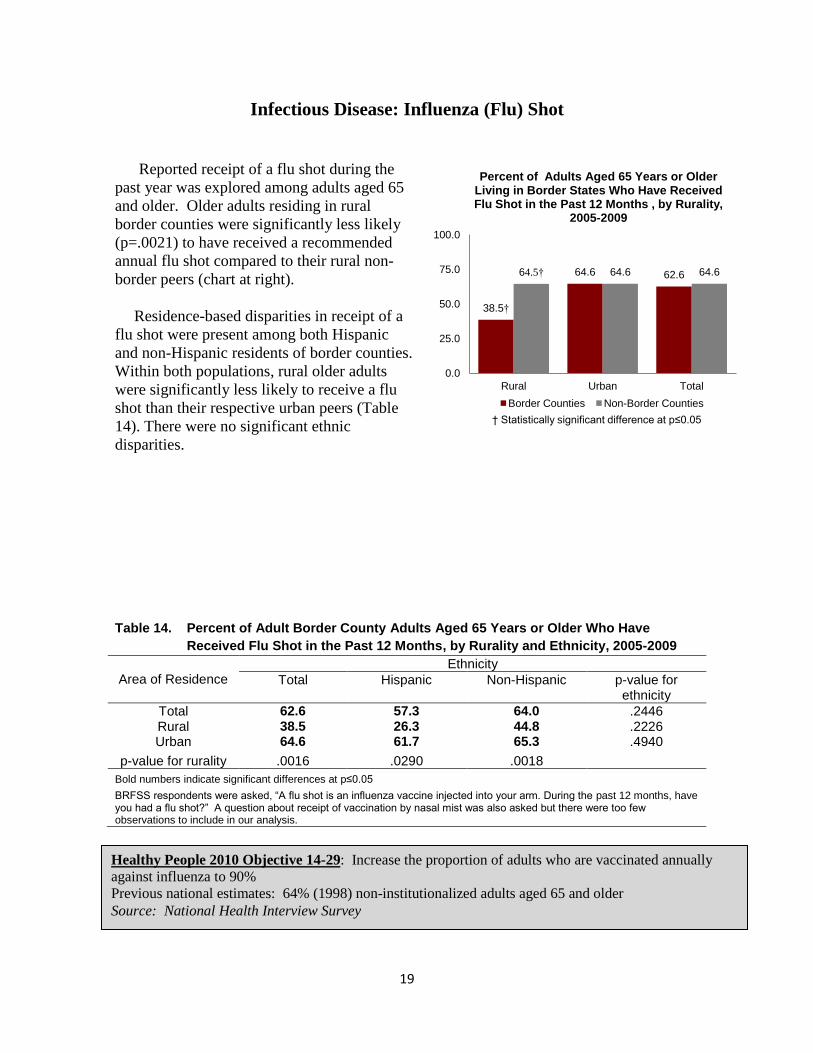
Infectious Disease: Influenza (Flu) Shot
Reported receipt of a flu shot during the
past year was explored among adults aged 65
and older. Older adults residing in rural
border counties were significantly less likely
(p=.0021) to have received a recommended
annual flu shot compared to their rural non-
border peers (chart at right).
Residence-based disparities in receipt of a
flu shot were present among both Hispanic
and non-Hispanic residents of border counties.
Within both populations, rural older adults
were significantly less likely to receive a flu
shot than their respective urban peers (Table
14). There were no significant ethnic
disparities.
Table 14. Percent of Adult Border County Adults Aged 65 Years or Older Who Have
Received Flu Shot in the Past 12 Months, by Rurality and Ethnicity, 2005-2009
Area of Residence
Ethnicity
Total Hispanic Non-Hispanic p-value for ethnicity
Total 62.6 57.3 64.0 .2446 Rural 38.5 26.3 44.8 .2226 Urban 64.6 61.7 65.3 .4940
p-value for rurality .0016 .0290 .0018
Bold numbers indicate significant differences at p≤0.05
BRFSS respondents were asked, “A flu shot is an influenza vaccine injected into your arm. During the past 12 months, have you had a flu shot?” A question about receipt of vaccination by nasal mist was also asked but there were too few observations to include in our analysis.
Healthy People 2010 Objective 14-29: Increase the proportion of adults who are vaccinated annually
against influenza to 90%
Previous national estimates: 64% (1998) non-institutionalized adults aged 65 and older
Source: National Health Interview Survey
38.5†
64.6 62.6 64.5† 64.6 64.6
0.0
25.0
50.0
75.0
100.0
Rural Urban Total
Percent of Adults Aged 65 Years or Older Living in Border States Who Have Received Flu Shot in the Past 12 Months , by Rurality,
2005-2009
Border Counties Non-Border Counties
† Statistically significant difference at p≤0.05

20
Infectious Disease: HIV Testing
Across the border states, there were no
significant geographic disparities in the
proportion of adults who reported ever
having received an HIV test (not counting
tests associated with blood donation).
Rates only varied slightly (between 44.0
and 45.5) across rural and urban counties
between non-border and border county
residents (chart at right).
Within border counties, no significant
rural-urban disparities were observed for
HIV testing. However, there were
significant ethnic disparities in receipt of
HIV tests. Within both the rural and the
total categories, rural Hispanic adults were
significantly less likely to report receiving
an HIV test than were their non-Hispanic peers (Table 15).
Table 15. Percent of Adult Border County Residents Who Have Ever Had an HIV Test, by
Rurality and Ethnicity, 2005-2009
Area of Residence
Ethnicity
Total Hispanic Non-Hispanic p-value for ethnicity
Total 45.4 40.9 48.2 .0318 Rural 45.5 23.9 63.8 .0152 Urban 45.4 43.2 46.7 .2326
p-value for rurality .9903 .0728 .1799
Bold numbers indicate significant differences at p≤0.05.
BRFSS respondents were asked, “Have you ever been tested for HIV? Do not count tests you may have had as part of a blood donation. Include testing fluid from your mouth.”
No Relevant Healthy People 2010 Objective.
45.5 45.4 45.4 44.0 44.0 44.0
0.0
25.0
50.0
75.0
100.0
Rural Urban Total
Percent of Adults Living in Border States Who Have Ever Had HIV Test by Area of
Residence Source: BRFSS, 2005-2009
Border Counties Non-Border Counties
21
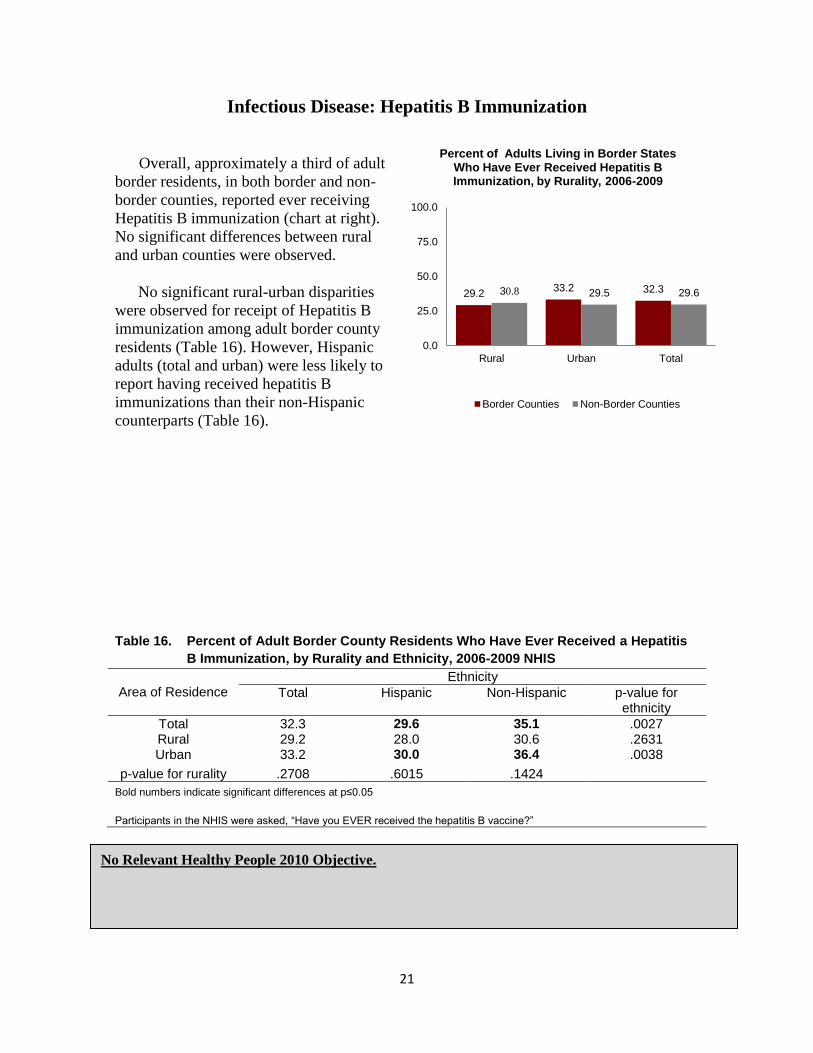
Infectious Disease: Hepatitis B Immunization
Overall, approximately a third of adult
border residents, in both border and non-
border counties, reported ever receiving
Hepatitis B immunization (chart at right).
No significant differences between rural
and urban counties were observed.
No significant rural-urban disparities
were observed for receipt of Hepatitis B
immunization among adult border county
residents (Table 16). However, Hispanic
adults (total and urban) were less likely to
report having received hepatitis B
immunizations than their non-Hispanic
counterparts (Table 16).
Table 16. Percent of Adult Border County Residents Who Have Ever Received a Hepatitis
B Immunization, by Rurality and Ethnicity, 2006-2009 NHIS
Area of Residence
Ethnicity
Total Hispanic Non-Hispanic p-value for ethnicity
Total 32.3 29.6 35.1 .0027 Rural 29.2 28.0 30.6 .2631 Urban 33.2 30.0 36.4 .0038
p-value for rurality .2708 .6015 .1424
Bold numbers indicate significant differences at p≤0.05
Participants in the NHIS were asked, “Have you EVER received the hepatitis B vaccine?”
No Relevant Healthy People 2010 Objective.
29.2 33.2 32.3 30.8 29.5 29.6
0.0
25.0
50.0
75.0
100.0
Rural Urban Total
Percent of Adults Living in Border States Who Have Ever Received Hepatitis B Immunization, by Rurality, 2006-2009
Border Counties Non-Border Counties
22
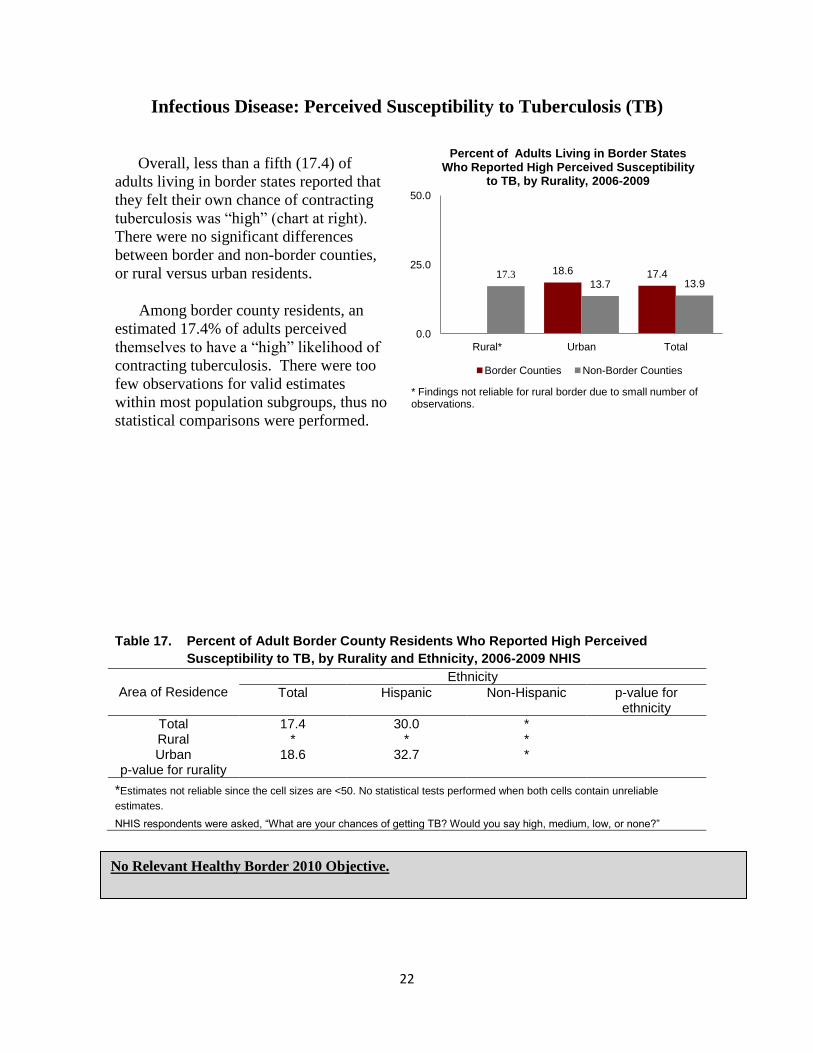
Infectious Disease: Perceived Susceptibility to Tuberculosis (TB)
Overall, less than a fifth (17.4) of
adults living in border states reported that
they felt their own chance of contracting
tuberculosis was “high” (chart at right).
There were no significant differences
between border and non-border counties,
or rural versus urban residents.
Among border county residents, an
estimated 17.4% of adults perceived
themselves to have a “high” likelihood of
contracting tuberculosis. There were too
few observations for valid estimates
within most population subgroups, thus no
statistical comparisons were performed.
Table 17. Percent of Adult Border County Residents Who Reported High Perceived
Susceptibility to TB, by Rurality and Ethnicity, 2006-2009 NHIS
Area of Residence
Ethnicity
Total Hispanic Non-Hispanic p-value for ethnicity
Total 17.4 30.0 * Rural * * * Urban 18.6 32.7 *
p-value for rurality
*Estimates not reliable since the cell sizes are <50. No statistical tests performed when both cells contain unreliable
estimates.
NHIS respondents were asked, “What are your chances of getting TB? Would you say high, medium, low, or none?”
18.6 17.4 17.3 13.7 13.9
0.0
25.0
50.0
Rural* Urban Total
Percent of Adults Living in Border States Who Reported High Perceived Susceptibility
to TB, by Rurality, 2006-2009
Border Counties Non-Border Counties
* Findings not reliable for rural border due to small number of observations.
No Relevant Healthy Border 2010 Objective.

23
Infectious Disease: Personally Knowing a Tuberculosis (TB) Patient
Approximately one in five border state
adults (21.5%) reported knowing a person
who had experienced tuberculosis. No
differences were observed between
respondents living in border and non-border
counties or rural versus urban residents
(chart at right).
Among border county residents,
significant rural-urban and ethnic disparities
were observed (Table 18). For the total
population, urban residents were less likely
to have known of a TB victim than were
rural residents. Across the total population
and among urban residents, non-Hispanic
adults were more likely to have known a
person with tuberculosis than their Hispanic peers.
Table 18. Percent of Adult Border County Residents Who Have Ever Personally Known a
Person with Tuberculosis, by Rurality and Ethnicity, 2006-2009
Area of Residence
Ethnicity
Total Hispanic Non-Hispanic p-value for ethnicity
Total 21.5 18.9 23.9 .0101 Rural 27.8 * 27.5 Urban 19.5 16.2 22.8 .0042
p-value for rurality .0008 .1220
*Estimates not reliable since the cell sizes are <50. No statistical tests performed when both cells contain unreliable
estimates.
Bold numbers indicate significant differences at p≤0.05,
NHIS respondents were asked, “Have you ever personally known anyone who had TB?”
27.8
19.5 21.5
24.3
19.2 19.6
0.0
25.0
50.0
Rural Urban Total
Percent of Adults Living in Border States Who Have Ever Personally Known a Person
With TB, by Rurality, 2006-2009
Border Counties Non-Border Counties
No Relevant Healthy People 2010 Objective.

24
Infectious Disease: Homelessness
Homelessness is a risk factor for
acquiring tuberculosis, as well as other
poor health outcomes. Overall, between
5.7% and 9.0% of respondents reported
that they had been homeless for more than
24 hours (chart, at right). No differences
were observed between border and non-
border county residents, or rural-urban
residents.
The overall experience of
homelessness among border county
residents was 6.2%, similar to the rate at
non-border counties (6.4%). There were
with no differences based on ethnicity.
Because of the low number of
observations for rural counties, no residence based comparisons were done.
Table 19. Percent of Adult Border County Residents Who Reported Homelessness for at
least 24 Hours, by Rurality and Ethnicity, 2006-2009
Area of Residence
Ethnicity
Total Hispanic Non-Hispanic p-value for ethnicity
Total 6.2 6.0 6.4 .8594 Rural * * * Urban 5.7 6.1 * .6543
p-value for rurality
*Estimates not reliable since the cell sizes are <50. No statistical tests performed when both cells contain unreliable
estimates.
NHIS respondents were asked, “Have you ever spent more than 24 hours living on the streets, in a shelter, or in a jail or prison?”
5.7 6.2 9.0
6.2 6.4
0
10
20
30
40
50
Rural* Urban Total
Percent of Adults Living in Border States Who Reported Being Homeless for at least 24
Hours, by Rurality, 2006-2009
Border Counties Non-Border Counties
* Estimates not reliable for rural border
No Relevant Healthy People 2010 Objective.

25
Behavioral Health: Poor Mental Health
Across the border states, adults living in
border counties were significantly less likely to
report poor mental health in the past month than
residents in non-border counties. This tendency
was present for the population overall and within
both rural and urban counties (total; p=.0001;
rural: p=.0013: and urban: p=.0218). With the
exception of rural border county residents, more
than a third of respondents reported having at
least one day in the past month when their mental
health was not good (chart at right).
Within border county adults, no significant
ethnic or geographic (rural-urban) disparities
were observed (Table 20).
Table 20. Percent of Adult Border County Residents Who Reported Poor Mental Health in
the Past Month, by Rurality and Ethnicity, 2005-2009
Area of Residence
Ethnicity
Total Hispanic Non-Hispanic p-value for ethnicity
Total 34.5 34.7 34.3 .8765 Rural 24.1 25.3 23.2 .8391 Urban 35.5 35.9 35.3 .7821
p-value for rurality .0511 .2609 .0965
BRFSS respondents were asked, “Now thinking about your mental health, which includes stress, depression, and problems with emotions, for how many days during the past 30 days was your mental health not good?” The responses were categorized into two categories: persons reporting poor mental health for at least one day in the past month, and persons reporting no days of poor mental health.
24.1†
35.5† 34.5† 38.6† 39.2† 39.2†
0.0
25.0
50.0
75.0
100.0
Rural Urban Total
Percent of Adults Living in Border States Who Reported One or more Days of Poor
Mental Health in the Past Month, by Rurality, 2005-2009
Border Counties Non-Border Counties
† Statistically significant differences at p≤.05
No Relevant Healthy People 2010 Objective.

26
Behavioral Health: Depressive Disorder
An estimated 17.4% of adults, living in
border states, report having been told by a
health care provider at some point in their
lives that they suffered from a depressive
disorder. There were no residence-based
disparities in the prevalence of a history of
depression.
Among border county residents, ethnic
disparities were observed irrespective of
area of residence. Hispanic respondents
were less likely than non-Hispanic to report
ever being diagnosed with a depressive
disorder in every residential category (total,
rural, urban), as demonstrated in Table 21.
Table 21. Percent of Adult Border County Residents Who Have Ever Been Diagnosed with
Depressive Disorder by Rurality and Ethnicity, 2006 (CA, NM, and TX) and 2008
(AZ)
Area of Residence
Ethnicity
Total Hispanic Non-Hispanic p-value for ethnicity
Total 17.4 12.5 19.7 <.0001 Rural 16.1 12.5 18.1 .0129 Urban 17.7 12.5 20.0 <.0001
p-value for rurality .4208 .9849 .4878
Bold numbers indicate statistically significant differences at p≤0.05
BRFSS respondents were asked, “Has a doctor or other healthcare provider EVER told you that you have a depressive disorder (including depression, major depression, dysthymia, or minor depression)?” Because this question comes from an optional BRFSS module, it was not asked by all states in all years.
16.1 17.7 17.4 17.6 18.4 18.3
0.0
10.0
20.0
30.0
40.0
50.0
Rural Urban Total
Percent of Adults Living in Border States Who Have Ever Been Diagnosed with
Depressive Disorder, by Rurality CA, NM, TX, 2006 and AZ, 2008
Border Counties Non-Border Counties
No Relevant Healthy People 2010 Objective.

27
Appendix A: Technical Notes
DATA SOURCES Data for the preceding report were obtained from the Behavioral Risk Factor
Surveillance System (BRFSS), 2005 – 2009, and the National Health Interview Survey
(NHIS), 2006-2009.
Behavioral Risk Factor Surveillance System (BRFSS) – 2005-2009
The Behavioral Risk Factor Surveillance System (BRFSS) is a large landline
telephone survey coordinated through the Centers for Disease Control and Prevention
(CDC) and implemented by individual states. Capturing approximately 400,000 responses
per year, it is one of the largest continuing telephone surveys in the world. Respondents
are adults aged 18 years and older. The BRFSS questionnaire includes a core set of
standard questions asked by all states, a series of optional modules on topics of special
interests that states may choose to use, and state developed questions, at the request of
individual states.
The BRFSS sampling frame is intended to provide accurate estimates at the state
level. Generally, each state constitutes a single stratum. However, to provide adequate
sample sizes for smaller geographically defined populations of interest, some states sample
disproportionately from strata defined to correspond to sub-state regions. From 2005-2009,
the Border States (Arizona, California, New Mexico, and Texas) collected the BRFSS data
from disproportionately sampled geographic strata. This sampling frame was reflected in
our analysis.
We used BRFSS data from four Border States: Arizona, California, New Mexico
and Texas for the years 2005-2009. We obtained BRFSS data directly from these states, as
publicly available data released by the Centers for Disease Control and Prevention
suppresses information for any counties with less than 10,000 residents. In highly rural
states such as Texas, this data suppression would impede comparisons across rural
counties. We completed Institutional Review Board (IRB) applications to each state, in
addition to the University of South Carolina IRB, to obtain state-specific BRFSS data.
Concatenating the four years of data yielded 89,220 total observations. Since some
analyses are restricted to border counties alone, while others are based on optional modules
only used in alternating years, the actual number of observations used for each table will
vary. Documentation for the number of observations included with each study is provided
in Appendix C.
BRFSS data modules used for the report include: healthcare access, cancer
screenings, diabetes mellitus, HIV testing, immunizations, injury prevention, mental
health, oral health and respiratory diseases. These data modules also reflect the Healthy
Border 2010 initiative, which outlines 21 health objectives grouped into 11 focus areas
(http://www.dshs.state.tx.us/borderhealth/hb2010.shtm).
28
National Health Interview Survey (NHIS) -- 2006-2009
The National Health Interview Survey (NHIS), initiated in 1957 and administered
since that time, is an annual household-based personal interview survey.10
Surveys are
conducted by the U.S. Census Bureau, which trains and supervises household interviewers.
Basic demographic and health information is collected for each household. In addition,
one adult and one child in each household are randomly selected to receive a detailed
interview regarding health and use of health care services. Chartbook findings are based
on the Sample Adult file.
The NHIS is designed to produce nationally representative estimates; unlike the
BRFSS, it cannot generally be used for public health surveillance for a single state.
However, it provides sufficient observations for estimation across the four-state border
region. In addition, black and Hispanic populations generally, as well as black, Hispanic
or Asian populations age 65 and older, are oversampled.
Description of NHIS questionnaires and data documentation can be found at
http://www.cdc.gov/nchs/nhis/quest_data_related_1997_forward.htm.
KEY DEFINITIONS
Border States and Counties
The four U.S. states that abut the Mexican border are Arizona, California, New
Mexico and Texas. Counties within the four-state region are classified as border counties
and non-border counties. The border counties are defined by the U.S.-Mexico Border
Commission.
For Arizona, border counties are: Cochise, Pima, Santa Cruz and Yuma.
For California, border counties are Imperial and San Diego.
For New Mexico, border counties are Doña Ana, Grant, Hidalgo, Luna, Otero and
Sierra.
For Texas, border counties are Brewster, Brooks, Cameron, Crockett, Culberson,
Dimmit, Duval, Edwards, El Paso, Frio, Hidalgo, Hudspeth, Jeff Davis, Jim Hogg,
Kenedy, Kinney, La Salle, Maverick, McMullen, Pecos, Presidio, Real, Reeves,
Starr, Sutton, Terrell, Uvalde, Val Verde, Webb, Willacy, Zapata and Zavala.
Rurality
County of residence was classified as urban or rural using the 2003 Urban
Influence Codes of the U.S. Department of Agriculture’s Economic Research Service.11
The 2003 Urban Influence Codes (UIC) categorize counties into 12 groups based on
population and commuting data from the 2000 Census of the Population, in the case of
metropolitan counties, and adjacency to metro area in the case of nonmetropolitan
counties. The 12 UICs were grouped into two categories: UICs 1 (metropolitan area with
one million or more residents) and 2 (metropolitan area with less than one million
residents) were classified as urban; all other counties were classified as rural.

29
Ethnicity
Respondents to the BRFSS and the NHIS were classified based on self-reported
ethnicity as “Hispanic” or “non-Hispanic.” The BRFSS question asks, “Are you Hispanic
or Latino?” The NHIS question reads, “Do you consider yourself to be Hispanic or
Latino?” with an alternate question of “Where did your ancestors come from?” NHIS
prompts list several Central and South American countries. In the current report, only
ethnicity was used, with no attempt to subcategorize Hispanic or non-Hispanic populations
by race.
DATA ANALYSIS
Statistical analyses were conducted using SAS-callable SUDAAN, to account for
weighting and complex sample design. Responses of “don’t know” and “refused to
answer” were counted as missing data. All outcome variables are presented by ethnicity
and residence.
The data from four states were combined across five years from 2005-2009 for
analyses. For the NHIS data, we used Sample Adult files combined across four years from
2006-2009. The sampling weights for both pooled data were adjusted in accordance with
recommendations of BRFSS and NHIS.
For all analyses, a Likelihood Ratio Chi Square (LLQ) test was carried out for
detecting the statistical significance at 95% confidence interval (α=0.05) because of
multilevel frequency tables. The LLQ has advantages over the usual Pearson Chi Square
for large dimensional table decomposition.
Accuracy of Results
Data from border states BRFSS and NHIS results are subject to the usual variability
associated with sample surveys. Small differences between survey estimates may be due to
random errors and these do not reflect true differences among adults or across states. When
the number of respondents within a category was too small for reliable statistical estimates
to be made (e.g., 50 unweighted BRFSS observations), results are not reported. Low
sample size is principally a problem when questions are not asked of the whole survey
population, as for example age-specific preventive health practices.
Data Limitations
Data from land-line surveys are becoming increasingly biased, as different types of
households use only wireless telephone technology. During the period covered, the
national proportion of wireless-only households increased from 5.8% in January-June,
2005 11
to 24.5% in July-December, 2009. 13
Within the states studied, estimated wireless
only prevalence as of January-December 2009 was as follows: Arizona, 27.2% (±1.5%);
California, 16.3% (±0.6%); New Mexico, 26.3% (±1.9%), and Texas, 30.0% (±1.0%). 14
While BRFSS responses are statistically weighted to adjust for the differing characteristics
between landline and wireless only households, the potential for bias, and thus inaccuracy,
remains. This is particularly true for Hispanic respondents, as Hispanic adults are more
likely to be wireless only than are other adults (40.8% in January – June, 2011). 14
30
Appendix B: Bibliography
1. The United States Bureau of the Census. Facts for Features, CB10-FF.17. July 15, 2010.
Retrieved from http://www.census.gov/newsroom/releases/pdf/cb10ff-17_hispanic.pdf on
November 15, 2011.
2. The United States Border Health Commission. Retrieved from
http://www.borderhealth.org/border_region.php on November 15, 2011.
3. United States-Mexico Border Health Commission (USMBHC) (2003). Healthy Border 2010:
An Agenda for Improving Health on the United States-Mexico Border.
4. United States-Mexico Border Health Commission (USMBHC) (2003). Healthy Border 2010:
An Agenda for Improving Health on the United States-Mexico Border.
5. US Environmental Protection Agency (2009). US-Mexico Border 2012 Program. Retrieved
January 26, 2010 from: http://www.epa.gov/border2012/framework/index.html).
6. The United States Border Health Commission. The United States-Mexico Border Region at a
Glance. (2009). Retrieved from http://www.nmsu.edu/~bec/BEC/Readings/10.USMBHC-
TheBorderAtAGlance.pdf on November 15, 2011.
7. Robinson KL, Ernst KC, Johnson BL, Rosales C. Health status of southern Arizona border
counties: a Healthy Border 2010 midterm review. Rev Panam Salud Publica. 2010
Nov;28(5):344-52.
8. Garza A, Rodriguez-Lainz A, Arnelas IJ. The health of the California region bordering
Mexico. J Immigr Health. 2004 Jul;6(3):137-44.
9. Brown HS 3rd
, Pagan JA, Bastida E. International competition and the demand for health
insurance in the US: evidence from the Texas-Mexico border region. Int J Health Care
Finance Econ. 2009 Mar;9(1):25-38. Epub 2008 Jul 29.
10. Centers for Disease Control and Prevention (CDC). National Health Interview Survey. Atlanta,
Georgia: U.S. Department of Health and Human Services, Centers for Disease Control and
Prevention, National Center for Health Statistics (2006-2009).
11. Economic Research Service. Urban Influence Codes. U.S. Department of Agriculture.
Available at http://www.ers.usda.gov/Briefing/Rurality/NewDefinitions/
12. Blumberg SJ, Luke JC. Wireless Substitution: Early Release of Estimates from the National
Health Interview Survey, July-December 2008; National Center for Health Statistics May
2009. Available from: http://www.cdc.gov/nchs/nhis.htm.
13. Blumberg SJ, Luke JV. Wireless substitution: Early release of estimates from the National
Health Interview Survey, January–June 2011. National Center for Health Statistics. December
2011. Available from: http://www.cdc.gov/nchs/nhis.htm.
14. Blumberg SJ, Luke JV, Ganesh N, et al. Wireless substitution: State-level estimates from the
National Health Interview Survey, January 2007–June 2010. National health statistics reports;
no 39. Hyattsville, MD: National Center for Health Statistics. 2011.
31
Appendix C: Number of Observations for Each Indicator
Number of residents in the U.S.-Mexico Border States who reported having health coverage by
area of residence, BRFSS 2005-2009 Total Counties Rural Counties Urban Counties
Border Counties 17,727 5,639 12,088
Non-Border Counties 71,493 15,052 56,441
Number of border county adults who reported having health coverage by rurality and ethnicity,
BRFSS 2005-2009 (Table 1)
Total Hispanics Non-Hispanics
Total 17,727 4,841 12,886
Rural 5,639 1,869 3,770
Urban 12,088 2,972 9,116
Number of residents in the U.S.-Mexico Border States who reported having a usual source of care
by area of residence, BRFSS 2005-2009
Total Counties Rural Counties Urban Counties
Border Counties 16,221 5,372 10,849
Non-Border Counties 62,856 14,310 48,546
Number of border county adults who reported having a usual source of care by rurality and
ethnicity, BRFSS 2005-2009 (Table 2)
Total Hispanics Non-Hispanics
Total 16,221 4,599 11,622
Rural 5,372 1,845 3,527
Urban 10,849 2,754 8,095
Number of residents in the U.S.-Mexico Border States who reported having delayed care due to
costs by area of residence, BRFSS 2005-2009
Total Counties Rural Counties Urban Counties
Border Counties 2,901 1,044 1,857
Non-Border Counties 10,950 2,768 8,182
Number of border county adults who reported having delayed care due to costs by rurality and
ethnicity, BRFSS 2005-2009 (Table 3)
Total Hispanics Non-Hispanics
Total 2,901 1,620 1,281
Rural 1,044 579 465
Urban 1,857 1,041 816

32
Number of women (40 years or older) in the U.S.-Mexico Border States who reported ever having
mammogram by area of residence, BRFSS 2006 & 2008
Total Counties Rural Counties Urban Counties
Border Counties 3,213 1,094 2,119
Non-Border Counties 12,886 3,015 9,871
Number of border county female residents aged 40 years or older who reported ever having
mammogram by rurality and ethnicity, BRFSS 2006 & 2008 (Table 4)
Total Hispanics Non-Hispanics
Total 3,213 825 2,388
Rural 1,094 361 733
Urban 2,119 464 1,655
Number of women in the U.S.-Mexico Border States who reported ever having a clinical breast
examination by area of residence, BRFSS 2006 & 2008
Total Counties Rural Counties Urban Counties
Border Counties 4,539 1,570 2,969
Non-Border Counties 17,248 4,102 13,146
Number of border county female residents who reported ever having a clinical breast examination
by rurality and ethnicity, BRFSS 2006 & 2008 (Table 5)
Total Hispanics Non-Hispanics
Total 4,539 1,459 3,080
Rural 1,570 615 955
Urban 2,969 844 2,125
Number of women in the U.S.-Mexico Border States who reported ever having a pap test by area of
residence, BRFSS 2006 & 2008
Total Counties Rural Counties Urban Counties
Border Counties 4,804 1,663 3,141
Non-Border Counties 18,138 4,361 13,777
Number of border county female residents who reported ever having a pap test by rurality and
ethnicity, BRFSS 2006 & 2008 (Table 6)
Total Hispanics Non-Hispanics
Total 4,804 1,631 3,173
Rural 1,663 688 975
Urban 3,141 943 2,198

33
Number of residents in the U.S.-Mexico Border States who reported having diabetes by area of
residence, BRFSS 2005-2009
Total Counties Rural Counties Urban Counties
Border Counties 2,355 796 1,559
Non-Border Counties 8,620 2,288 6,332
Number of border county adults who reported having diabetes by rurality and ethnicity, BRFSS
2005-2009 (Table 7)
Total Hispanics Non-Hispanics
Total 2,355 943 1,412
Rural 796 373 423
Urban 1,559 570 989
Number of residents in the U.S.-Mexico Border States who were overweight or obese by area of
residence, BRFSS 2005-2009
Total Counties Rural Counties Urban Counties
Border Counties 12,324 4,024 8,300
Non-Border Counties 48,645 11,403 37,242
Number of border county adults who were overweight or obese by rurality and ethnicity, BRFSS
2005-2009 (Table 8)
Total Hispanics Non-Hispanics
Total 12,324 4,346 7,978
Rural 4,024 1,559 2,465
Urban 8,300 2,787 5,513
Number of residents with asthma in the U.S.-Mexico Border States who reported routine check-ups
for asthma by area of residence, BRFSS 2005-2009
Total Counties Rural Counties Urban Counties
Border Counties 426 145 281
Non-Border Counties 1,385 392 993
Number of border county adults with asthma who reported routine check-us for asthma by rurality
and ethnicity, BRFSS 2005-2009 (Table 9)
Total Hispanics Non-Hispanics
Total 426 123 303
Rural 145 50 95
Urban 281 73 208

34
Number of residents with asthma in the U.S.-Mexico Border States who visited emergency room
(ER) or urgent care center for treatment by area of residence, BRFSS 2005-2009
Total Counties Rural Counties Urban Counties
Border Counties 117 46 71
Non-Border Counties 315 91 224
Table 9B: Number of border county adults with asthma who visited an ER or urgent care center for
treatment by rurality and ethnicity, BRFSS 2005-2009 (Table 10)
Total Hispanics Non-Hispanics
Total 117 39 78
Rural 46 14 32
Urban 71 25 46
Number of residents with asthma in the U.S.-Mexico Border States who needed urgent treatment
for worsening asthma (Excluding ER or urgent care center visits) by area of residence, BRFSS
2005-2009
Total Counties Rural Counties Urban Counties
Border Counties 190 68 122
Non-Border Counties 658 170 488
Number of border county adults with asthma who needed urgent treatment for worsening asthma
(Excluding ER or urgent care center visits) by rurality and ethnicity, BRFSS 2005-2009 (Table 11)
Total Hispanics Non-Hispanics
Total 190 61 129
Rural 68 21 47
Urban 122 40 82
Number of residents in the U.S.-Mexico Border States who reported having any dental visit by area
of residence, BRFSS 2005-2009
Total Counties Rural Counties Urban Counties
Border Counties 5,160 1,640 3,520
Non-Border Counties 20,841 4,254 16,587
Number of border county adults who reported having any dental visit by rurality and ethnicity,
BRFSS 2005-2009 (Table 12)
Total Hispanics Non-Hispanics
Total 5,160 1,460 3,700
Rural 1,640 585 1,055
Urban 3,520 875 2,645

35
Number of residents in the U.S.-Mexico Border States who reported having a dental cleaning by
area of residence, BRFSS 2005-2009
Total Counties Rural Counties Urban Counties
Border Counties 3,811 1,573 2,238
Non-Border Counties 10,141 3,915 6,226
Number of border county adults who reported having a dental cleaning by rurality and ethnicity,
BRFSS 2005-2009 (Table 13)
Total Hispanics Non-Hispanics
Total 3,811 1,191 2,620
Rural 1,573 584 989
Urban 2,238 607 1,631
Number of residents aged 65 years or older in the U.S.-Mexico Border States who reported having
a flu shot by area of residence, BRFSS 2005-2009
Total Counties Rural Counties Urban Counties
Border Counties 3,030 878 2,152
Non-Border Counties 13,068 3,194 9,874
Number of border county adults aged 65 years or older who reported having a flu shot by rurality
and ethnicity, BRFSS 2005-2009 (Table 14)
Total Hispanics Non-Hispanics
Total 3,030 538 2,492
Rural 878 189 689
Urban 2,152 349 1,803
Number of residents in the U.S.-Mexico Border States who reported having an HIV test (excluding
blood donation) by area of residence, BRFSS 2005-2009
Total Counties Rural Counties Urban Counties
Border Counties 5,469 1,728 3,741
Non-Border Counties 21,755 3,961 17,794
Number of border county adults who reported having an HIV test (excluding blood donation) by
rurality and ethnicity, BRFSS 2005-2009 (Table 15)
Total Hispanics Non-Hispanics
Total 5,469 2,069 3,400
Rural 1,728 716 1,012
Urban 3,741 1,353 2,388

36
Number of residents in the U.S.-Mexico Border States who reported receiving Hepatitis B
immunization by area of residence, NHIS 2006-2009
Total Counties Rural Counties Urban Counties
Border Counties 643 117 526
Non-Border Counties 5,463 350 5,113
Number of border county adults who reported receiving Hepatitis B immunization by rurality and
ethnicity, NHIS 2006-2009 (Table 16)
Total Hispanics Non-Hispanics
Total 643 344 299
Rural 117 58 59
Urban 526 286 240
Number of residents in the U.S.-Mexico Border States who perceived themselves susceptible to
Tuberculosis by area of residence, NHIS 2006-2009
Total Counties Rural Counties Urban Counties
Border Counties 128 20 108
Non-Border Counties 1,189 82 1,107
Number of border county adults who perceived themselves susceptible to Tuberculosis by rurality
and ethnicity, NHIS 2006-2009 (Table 17)
Total Hispanics Non-Hispanics
Total 128 90 38
Rural 20 12 8
Urban 108 78 30
Number of residents in the U.S.-Mexico Border States who reported knowing personally a case of
Tuberculosis by area of residence, NHIS 2006-2009 (Reference: Figure 18)
Total Counties Rural Counties Urban Counties
Border Counties 357 104 253
Non-Border Counties 3,549 310 3,239
Number of border county adults who reported knowing personally a case of Tuberculosis by
rurality and ethnicity, NHIS 2006-2009 (Table 18)
Total Hispanics Non-Hispanics
Total 357 163 194
Rural 104 48 56
Urban 253 115 138
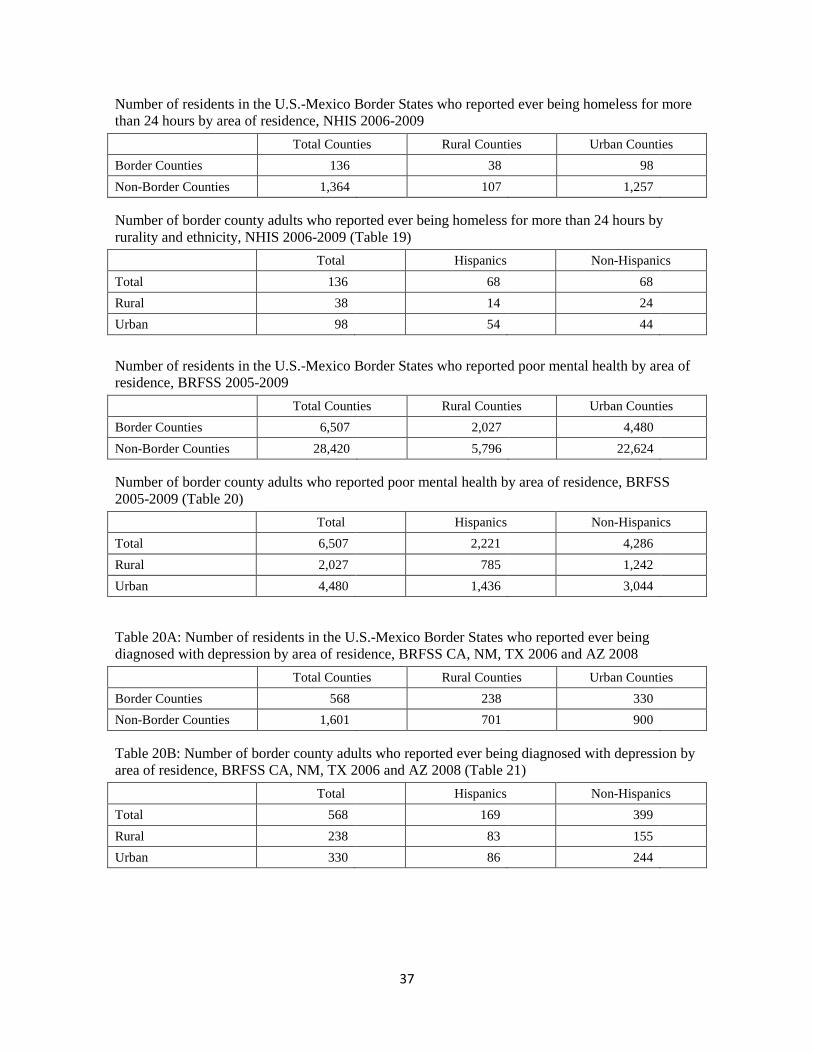
37
Number of residents in the U.S.-Mexico Border States who reported ever being homeless for more
than 24 hours by area of residence, NHIS 2006-2009
Total Counties Rural Counties Urban Counties
Border Counties 136 38 98
Non-Border Counties 1,364 107 1,257
Number of border county adults who reported ever being homeless for more than 24 hours by
rurality and ethnicity, NHIS 2006-2009 (Table 19)
Total Hispanics Non-Hispanics
Total 136 68 68
Rural 38 14 24
Urban 98 54 44
Number of residents in the U.S.-Mexico Border States who reported poor mental health by area of
residence, BRFSS 2005-2009
Total Counties Rural Counties Urban Counties
Border Counties 6,507 2,027 4,480
Non-Border Counties 28,420 5,796 22,624
Number of border county adults who reported poor mental health by area of residence, BRFSS
2005-2009 (Table 20)
Total Hispanics Non-Hispanics
Total 6,507 2,221 4,286
Rural 2,027 785 1,242
Urban 4,480 1,436 3,044
Table 20A: Number of residents in the U.S.-Mexico Border States who reported ever being
diagnosed with depression by area of residence, BRFSS CA, NM, TX 2006 and AZ 2008
Total Counties Rural Counties Urban Counties
Border Counties 568 238 330
Non-Border Counties 1,601 701 900
Table 20B: Number of border county adults who reported ever being diagnosed with depression by
area of residence, BRFSS CA, NM, TX 2006 and AZ 2008 (Table 21)
Total Hispanics Non-Hispanics
Total 568 169 399
Rural 238 83 155
Urban 330 86 244