russian pharmaceutical market
TRANSCRIPT

RUSSIAN PHARMACEUTICALMARKET
2012
2
TTT AAA BBB LLL EEE OOO FFF CCC OOO NNN TTT EEE NNN TTT SSS
Summary
1. Pharmaceutical market value in Russia 3
2. Commercial segment of RTU drugs 5
3. Drug reimbursement program 11
4. Sales value in the segment of health care institutions 33
5. Nutritional supplements 50
6. Beauty products 61
7. Drug Import 71
8. Pharmacy networks 86
9. Distribution segment of the pharmaceutical market 91
10. Manufacturing 95
JSC DSM Group
General Manager Sergei Shulyak
Director of Strategic Research Yulia Nechayeva
Senior Analyst Yulia Prozherina
Analyst
Anastasia Kazova
Analytical Report Pharmaceutical
market in RUSSIA
Results of 2012
Address: 125040, Moscow, 5-ya ul. Yamskogo Polya, d. 7, str. 2
Phone:
(495) 780-72-63, 780-72-64
Fax: (495) 780-72-65
http://www.dsm.r
u

3
Summary
In 2012, the audit of government programs that affect the pharmaceutical
market took place. In the previous year, a number of laws were approved. It will
affect the development of the market in the short and long term (for example,
increasing the availability of high-quality, effective and safe medicines to meet
needs of the population is the main goal of "The Strategy of providing the
population of the Russian Federation with drugs till 2025".
The Russian pharmaceutical market is among the ten largest pharmaceutical
markets in the world. At the end of 2012 Russia took the 7th place. In Russia in
2012, the value of the pharmaceutical market amounted to 921 billion rubles (VAT)
in consumer prices, which is 12% more compared to 2011. Russia was ranked third
for growth rate.
The Russian pharmaceutical market is import oriented. 76% of drugs in
terms of money consumed by the population are produced abroad. Therefore, on
the first place in the ranking of foreign producers is: SANOFI, NOVARTIS. On the
third line is PHARMSTANDARD - the only domestic manufacture of the top 20
leading players in the Russian pharmaceutical market.
The development of the pharmaceutical distribution sector of the market is on a
given vector in recent years - business diversification: all national distributors are
within the control structure of a subordinate pharmacy chains, the second direction,
which is actively developing – is domestic manufacture. In 2012, there was a
redistribution of the market. "Protek" took the leading position with a share of
16.5%. "Sensation" of the year – the distributor "Katren" got the second place.
Rounding up the Top-3 was the distributor "SIA" (Leader of previous years). Their
combined share of the total market is 44%.
For the pharmacy chain, the year was marked by the development of new
formats within the chain. Many market players have discount stores under different
brand names now. On the other hand pharmacy chains offer premium pharmacies,
shops and cosmetic studios, etc. Also redistribution of the market take place in the
retail segment - the leader of the pharmacy chain is "Rigla", "A5" takes the second

4
place, the leader of previous years, "36.6" get only the third place. Their combined
share reaches 7.3%.
Commercial segment of the Russian market in 2012 shows strong growth
(+15%). Volume of sales in 2012 in the commercial segment amounted to about
537 billion rubles. (17.3 billion dollars). It was sold 4.46 billion units, which was
almost coincided with the index in 2011.
The "parapharmaceutical" segment didn’t reach pre-crisis level in terms of
growth in 2012. In 2012, the capacity of this segment amounted to 149 billion
rubles, which is 14% higher than the volume in 2011. Despite this, the pharmacy is
actively developing this tendency in their sales – firstly non-drug products under its
own brand name are manufactured.
The state sector shows a growth of 4% in 2012. This is one of the most
stable segments of the pharmaceutical market, because its development depends
on budget funds. At the end of 2012 it was spent 78.4 billion rubles in order to
purchase medicines for the privileged categories of citizens (Drug reimbursement
program). The increase amounted to -7.4% and was negative compared to 2011.
At the end of 2012 segment capacity of hospital purchases amounted to 157 billion
rubles, which is 11.7% higher than in 2011. In natural terms, the volume of
purchased drugs is approximately 1.1 billion units, which is also higher by 8.3%
than in 2011.
The value of drug import in Russia in 2012 amounted to 14.4 billion dollars,
which is 9% higher than in 2011.
According to the forecast DSM Group, the Russian pharmaceutical market will
grow in 2013 by 12% in rubles and will exceed 1,035 billion rubles.
5
1. Pharmaceutical market value in Russia
Russia, in the times of the Soviet Union, preferred to live by five year
periods. Today’s Russia is developing larger scale and longer term plans. Since
2013, Russia has launched a number of new federal programs related to a variety
of areas - from health care to aviation industry. Over the period of 2013 - 2015, the
expected funding of the 50 federal target programs will be at 1,021 billion Rubles in
2013, 926.2 billion Rubles in 2014 and 935 billion Rubles in 2015.
One of the first long-term projects related to the pharmaceutical market was
the Concept of Long-Term Socio-Economic Development of the Russian
Federation until 2020 adopted in 2008.
In 2012, the Strategy for the Development of Medical Science in
Russia until 2025 was approved. The strategy includes measures to develop
innovative products and critical technologies. The main purpose of the document is
to create high-tech innovative products and use them in public health practices.
The expected share of innovative products on the market will be up to 10% of the
amount of newly registered products. Today, Russia is in the fourth place after
China, the U.S. and Japan in the total number of scientists. As regards research
funding, Russia ranks ninth in the world. As regards the number of scientific
publications, it is in the 15th - 18th place.
On December 24, 2012, the State Program Development of Health Care
of the Russian Federation until 2020 was approved. Over 33 trillion Rubles will
be allocated from budgets of all levels to support its implementation. The State
Program measures are expected to be implemented in two phases: the first phase -
from 2013 through 2015, the second phase - from 2016 through 2020. The State
Program includes 11 subprograms: “Prevention of Diseases and Promotion of
Healthy Lifestyles. Development of Primary Health Care”; “Enhanced Provision of
Specialized, including High-Tech, Health Care, Emergency Care, including
Emergency Specialized Care, Medical Evacuation”, etc.
The State Program of Development of Pharmaceutical and Medical
Industries was adopted. It involves the allocation of more than 100 billion rubles
out of the federal budget by 2020. The State Program is to ensure the application
of international standards in the industry, and the inflow of foreign investments.

6
The State Program Development of the Pharmaceutical and Medical Industries
consists of three subprograms:
Development of Drug Production; the main goal is to organize
production of generic and innovative drugs to treat socially significant diseases.
Development of Medical Device Production aims to organize production
of high-tech medical devices.
Improved State Regulation in the Field of Pharmaceuticals and Medical
Devices aims to create a legal and regulatory framework, improve the quality and
safety of products, and ensure the priority development of the national
pharmaceutical and medical industries, etc.
Also, the State Program has its targets: nationally produced pharmaceuticals
must take up 50% of the market by 2020, and nationally produced medical devices
- 40%.
The Strategy of Pharmacological Support for the Population of the
Russian Federation until 2025 was adopted. The aim of the Strategy is to
increase availability of high-quality, effective and safe pharmaceuticals to meet the
needs of the population and the health care system through development of a
rational system, aligned with the available resources, and of the pharmacological
support of the population of the Russian Federation.
Also 2012 saw the approval of the Strategy of the Long-Term
Development of the Pension System and the adoption of the State Program
Social Support of Citizens", both of which will also indirectly affect the
pharmaceutical market.
The pharmaceutical market in Russia is going through a time of change and
state innovations. The reform of the pharmaceutical market is not over yet, and in
the future, the industry awaits new changes. From January 1, 2014, GMP (Good
Manufacturing Practice - GMP) standards will be mandatory. The question whether
the industry is prepared to adopt these standards in 2014 is still debated.
So far, the impact of the developed strategies and programs on the numerical
indicators of the pharmaceutical market has been minimal. And the market is
growing quite steadily at an average rate.
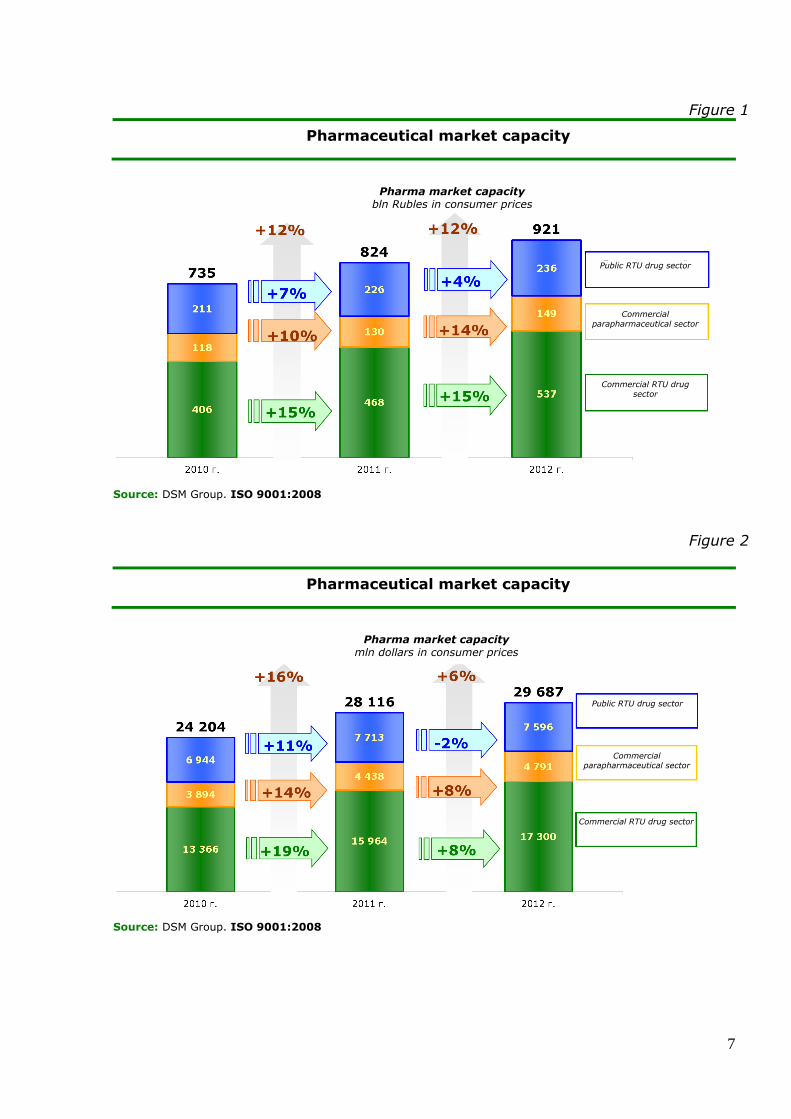
Figure 1-2 shows the dynamics of the pharmaceutical market in Russia over
2010-2012 in retail prices.
7
Figure 1
Pharmaceutical market capacity
Source: DSM Group. ISO 9001:2008
Figure 2
Pharmaceutical market capacity
Source: DSM Group. ISO 9001:2008
Pharma market capacity bln Rubles in consumer prices
Public RTU drug sector
Commercial
parapharmaceutical sector
Commercial RTU drug sector
Pharma market capacity mln dollars in consumer prices
Public RTU drug sector
Commercial parapharmaceutical sector
Commercial RTU drug sector

8
Over the past year, the market capacity reached 921 billion Rubles (or 29.7
billion Dollars), which is 12% more than in 2011. The market growth has
accelerated and remains stable, though without recovering the pre-crisis 20-25%.
The market growth in packages, compared with the Ruble-expressed growth,
looks very modest at a 1.3% gain. If we consider the market by segment,
pharmacy sales of pharmaceuticals showed the greatest growth at 15% - 537
billion Rubles, pharmacy sales of parapharmaceuticals grew by 14% (149 billion
Rubles), the government procurement market showed the smallest growth at +4%
- 236 billion Rubles.
The government continues to adhere a clear policy in the sphere of
pharmacological support of the population. In 2012, the public funds had a market
share of 25.6%. Furthermore, procurement of drugs by medical institutions is
growing faster at +11%, whereas in the drug reimbursement program, the state
“saves up” through the tender system and import substitution program (the drug
supplies showed a negative growth of -7.5%). Also, the drug supplies to the
pharmacies to meet the subsidized provision system requirements have been
affected by a decline in the numbers of beneficiaries.
The market growth continues to be driven through an increase in the drug
price index. It is comparable with the consumer price index of the State Statistics
Committee and is 6.0%. The index grew due to a drop in profitability for the entire
supply chain, as a result of changes in taxation and price regulation for drugs from
the list of vital and essential drugs (VED). If the index of VED prices was only 1.5%,
and this was due to peculiar registration of imported pharmaceuticals and increased
currency costs, the index of pharmaceuticals beyond the VED list was 7.8% for
2012. That was the only way the market was able to somewhat compensate for the
lost income from the controlled drugs.
Russia's pharma market value compared to the rest of the world
According to IMS HEALTH, the total sales of drugs in 14 major pharmaceutical
markets across the world over 12 months - from January to December 2012 -
amounted to 573.4 billion US Dollars (a gain of less than 1%). Traditionally, the
most rapidly growing markets include countries in Latin America and China.
At the end of 2012, Russia is the world's 7th leading pharmaceutical market
and the third-fastest one percentage-wise.

9
The biggest market is the U.S., where only the retail sales of drugs are worth
236.5 billion dollars, though in 2012, the drug sales in the U.S. market shrank.
Sales also declined in almost all European countries. Generally, the pharmaceutical
markets of the top 5 European countries fell by 2%.
Figure3
Retail RTU drug market value in Russia
and other countries in 2012
Source: IMS Health, DSM Group. ISO 9001:2008
Note: The RTU drug pharmacy market = the commercial segment of RTU drugs + DLO
Russia is still 3 and 5 times behind, respectively, the average European and US
drug consumption. Only Brazil and China have smaller per-capita drug consumption
than Russia (140 Dollars) at 115 and 38 Dollars, respectively.
Market volume, bln Dollars
growth rates
USA
Japan
Chin
a
Germ
any
Fra
nce
Bra
zil
Russia
Canada
Italy
Spain
UK

10
Figure 4
RTU drug consumption in Russia
and other countries in 2012
Source: IMS Health, DSM Group. ISO 9001:2008
Note: The RTU drug pharmacy market = the commercial segment of RTU drugs + DLO
USA
Japan
Chin
a
Germ
any
Fra
nce
Bra
zil
Russia
Canada
Italy
Spain
UK
Market volume, bln Dollars
RTU drug consumption per capita, $ per annum

11
2. Commercial segment of RTU drugs
The RTU drug commercial market in 2012 amounted to 537 billion Rubles in
consumer prices, or 408 billion Rubles in pharmacy purchase prices1 (Figure 5)
which is 14% more than in 2011. 4.5 billion packages were sold, which
substantially coincides with the 2011 figure.
1. Imported to domestic RTU drug retail commercial market
sales ratio
The breakdown of the RTU drug commercial market by sales of domestic and
imported pharmaceuticals is shown in Figure 5.
Figure 5
Shares of imported and domestic RTU drug sales
on the retail commercial market in Russia
269 075(75,4%)
310 395(76,1%)
87 862(24,6%)
97 297(23,9%)
356 937
407 692
Общий объем рынка
Отечественные
Импортные
1 776(39,9%)
1 870(42,0%)
2 679(60,1%)
2 586(58,0%)
4 454 4 455
2011 г. 2012 г. 2011 г. 2012 г.
Стомостный объем, млн. руб. Натуральный объем, млн. уп.
Source: Monthly retail audit of the pharmaceutical market in the Russian Federation, DSM Group. ISO
9001:2008 Note: Sales value are given in pharmacy purchase prices, VAT included.
1 All volumes and prices further on in the RTU drug commercial segment section are given in pharmacy purchase
prices, VAT included.
Total market volume
Domestics
Imports
Sales value, mln Rubles Real volume, mln packages

12
In value terms, the share of domestic drugs traditionally accounts for about
one-fourth of the Russian RTU drug commercial market. In 2012, the share of
domestic drugs accounted for 24%. At the same time, domestic pharmaceuticals
prevail in pharmacy sales in volume terms - 58.0%. It is worth noting that in 2012
the share of the domestic drug packages decreased by 2.3%. This was due to
cheap pharmaceuticals, such as ACTIVATED CARBON, BACTERICIDAL PATCH,
CORVALOL, VALIDOL, etc., priced within 15-20 Rubles.
In 2012, sales of domestic drugs were less pronounced than those of the
imports: 11% vs 15% in value terms. In volume terms, sales of Russian drugs
decreased by 3%, while imported pharmaceuticals gained 5%.
The average price of a domestic drug package in 2012 was 38 Rubles, which is
more than 4 times less than the price of an imported drug package. In 2012, the
price of an imported package averaged toward 166 Rubles.
2. The ratio of sales of Rx drugs to OTC drugs in the retail
commercial market
At the end of 2012, the pharmaceutical market was stirred up by a new wave
of information about the decision allowing sales of OTC drugs at retail stores.
This information appeared on the market in late October, and already in early
December, the Industry and Trade Ministry prepared and sent to the Ministry of
Health for approval a list of OTC drugs that can be sold in grocery stores - it
consists of 34 drug groups without specific names.
Representatives of the pharma community stated that this decision might put
many retail pharmacies out of business, with the consumer being hit the hardest.
Though the Ministry of Health periodically asserts its support for this initiative,
the decision to allow retail sales of OTC drugs is premature in Russia.
The ratio of Rx vs OTC drugs is shown in Figure 6.

13
Figure 6
Shares of OTC and Rx drugs
on the retail commercial market in Russia
Source: Monthly retail audit of the pharmaceutical market in the Russian Federation, DSM Group. ISO
9001:2008
Note: Sales value are given in pharmacy purchase prices, VAT included.
Note: When calculating shares of Rx and OTC, drugs were distributed officially according to the OTC list. The fact
that that pharmacies freely dispense Rx drugs was ignored.
Sales of prescription and non-prescription drugs grew in monetary terms in the
RTU drug retail commercial segment, as based on the 2012 results. Typically, sales
of prescription drugs rise faster than sales of OTC drugs, as was the case in 2012.
Compared with 2011, the value volumes of OTC drugs gained 14%, while that of Rx
drugs gained about 15%. In volume terms, equivalent dynamics was observed:
negative growth in sales of OTC drugs (-2%) and an increase in sales of Rx drugs
(+4%). The share of Rx drugs in Rubles amounted to 49.8%; in volume terms,
non-prescription drugs dominate (71.3%).
The thing to notice is that the average cost of Rx drugs in 2012 was 160
Rubles, while the price of OTC drugs was on average 2.5 times lower - 64 Rubles
per packaging.
Total market value
Sales value, mln Rubles Real volume, mln packages

14
3. RTU drug sales on the retail commercial market broken down
by ATC group
RTU drug pharmacy sales by Level I ATC group in Russia are shown in Figure 1.
Table 1
RTU drug sales on the Russian retail commercial market broken down
by ATC group
Level I ATC groups Sales value,
mln Rubles
The group's
share in sales
value, %
Actual volume,
million packs
The group's
share in the
actual
volume, %
A: Alimentary tract and metabolism 80,549 19.8% 815.1 18.3%
R: Respiratory system 51,471 12.6% 621.9 14.0%
C: Cardiovascular system 50,901 12.5% 429.0 9.6%
N: Nervous system 48,345 11.9% 850.8 19.1%
M: Musculo-skeletal system 31,307 7.7% 281.2 6.3%
J: Antiinfectives for systemic use 29,644 7.3% 264.2 5.9%
G: Genito-urinary system and sex
hormones 29,502 7.2% 77.7 1.7%
D: Dermatologicals 23,606 5.8% 478.0 10.7%
L: Antineoplastic and
immunomodulating agents 17,569 4.3% 77.2 1.7%
[~] Pharmaceuticals without an ATC
group 13,840 3.4% 255.8 5.7%
B: Blood and blood forming organs 13,204 3.2% 125.2 2.8%
S: Sensory organs 11,399 2.8% 112.9 2.5%
H: Systemic hormonal preparations,
excluding sex hormones 2,654 0.7% 19.6 0.4%
V: Various 2,171 0.5% 22.9 0.5%
P: Antiparasitic products, insecticides
and repellents 1,460 0.4% 23.9 0.5%
Source: Monthly retail audit of the pharmaceutical market in the Russian Federation, DSM Group. ISO
9001:2008 Note: Sales value are given in pharmacy purchase prices, VAT included.
Note:[~] Pharmaceuticals without an ATC group (homeopathic drugs, drugs of plant and animal origin, substances etc.)
15
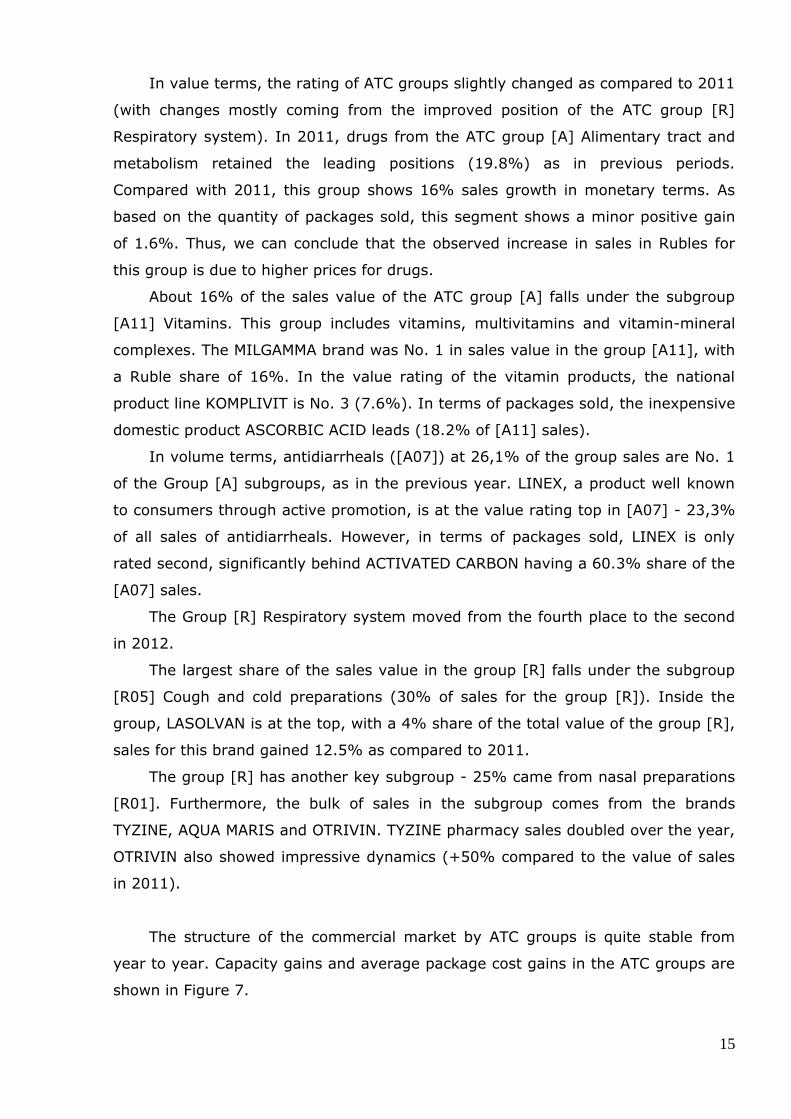
In value terms, the rating of ATC groups slightly changed as compared to 2011
(with changes mostly coming from the improved position of the ATC group [R]
Respiratory system). In 2011, drugs from the ATC group [A] Alimentary tract and
metabolism retained the leading positions (19.8%) as in previous periods.
Compared with 2011, this group shows 16% sales growth in monetary terms. As
based on the quantity of packages sold, this segment shows a minor positive gain
of 1.6%. Thus, we can conclude that the observed increase in sales in Rubles for
this group is due to higher prices for drugs.
About 16% of the sales value of the ATC group [A] falls under the subgroup
[A11] Vitamins. This group includes vitamins, multivitamins and vitamin-mineral
complexes. The MILGAMMA brand was No. 1 in sales value in the group [A11], with
a Ruble share of 16%. In the value rating of the vitamin products, the national
product line KOMPLIVIT is No. 3 (7.6%). In terms of packages sold, the inexpensive
domestic product ASCORBIC ACID leads (18.2% of [A11] sales).
In volume terms, antidiarrheals ([A07]) at 26,1% of the group sales are No. 1
of the Group [A] subgroups, as in the previous year. LINEX, a product well known
to consumers through active promotion, is at the value rating top in [A07] - 23,3%
of all sales of antidiarrheals. However, in terms of packages sold, LINEX is only
rated second, significantly behind ACTIVATED CARBON having a 60.3% share of the
[A07] sales.
The Group [R] Respiratory system moved from the fourth place to the second
in 2012.
The largest share of the sales value in the group [R] falls under the subgroup
[R05] Cough and cold preparations (30% of sales for the group [R]). Inside the
group, LASOLVAN is at the top, with a 4% share of the total value of the group [R],
sales for this brand gained 12.5% as compared to 2011.
The group [R] has another key subgroup - 25% came from nasal preparations
[R01]. Furthermore, the bulk of sales in the subgroup comes from the brands
TYZINE, AQUA MARIS and OTRIVIN. TYZINE pharmacy sales doubled over the year,
OTRIVIN also showed impressive dynamics (+50% compared to the value of sales
in 2011).
The structure of the commercial market by ATC groups is quite stable from
year to year. Capacity gains and average package cost gains in the ATC groups are
shown in Figure 7.

16
At the end of 2012, almost all ATC groups show gains in the value of the sales,
with the exception of the ATC group [L] Antineoplastic and immunomodulating
agents (sales of the group drugs shrank by 2.3%). In monetary terms, maximum
gains of 23% were noted for the group [D] Dermatologicals (due to increased sales
of the brands EXODERIL, MIRAMISTIN, BEPANTEN, etc.). In volume terms, the
largest pharmacy sales gain was registered for the RTU drugs in the group [M]
Musculo-skeletal system drugs - it amounted to +10%.
Figure 7
Structure of the RTU drug commercial market in 2011-2012
Source: Monthly retail audit of the pharmaceutical market in the Russian Federation, DSM Group. ISO
9001:2008Note: Sales value are given in pharmacy purchase prices, VAT included.
The largest price for a weighted average package, as based on the 2012
results, was for the group [G] Genito-urinary system and sex hormones. Such a
high price is due to the fact that the package price for some RTU drugs in this
group is about and over 5 thous. Rubles. Also a high price for a weighted average
package was noted in the groups [L] Antineoplastic and immunomodulating agents
- about 210 Rubles, and [H] Systemic hormonal preparations, excluding sex
hormones - about 130 Rubles.
Sale
s v
alu
e,
mln
. Ruble
s
Average weighted price 2011
Avera
ge w
eig
hte
d p
rice
Average weighted price 2012
Sales value of the group 2011 Sales value of the group 2012
17
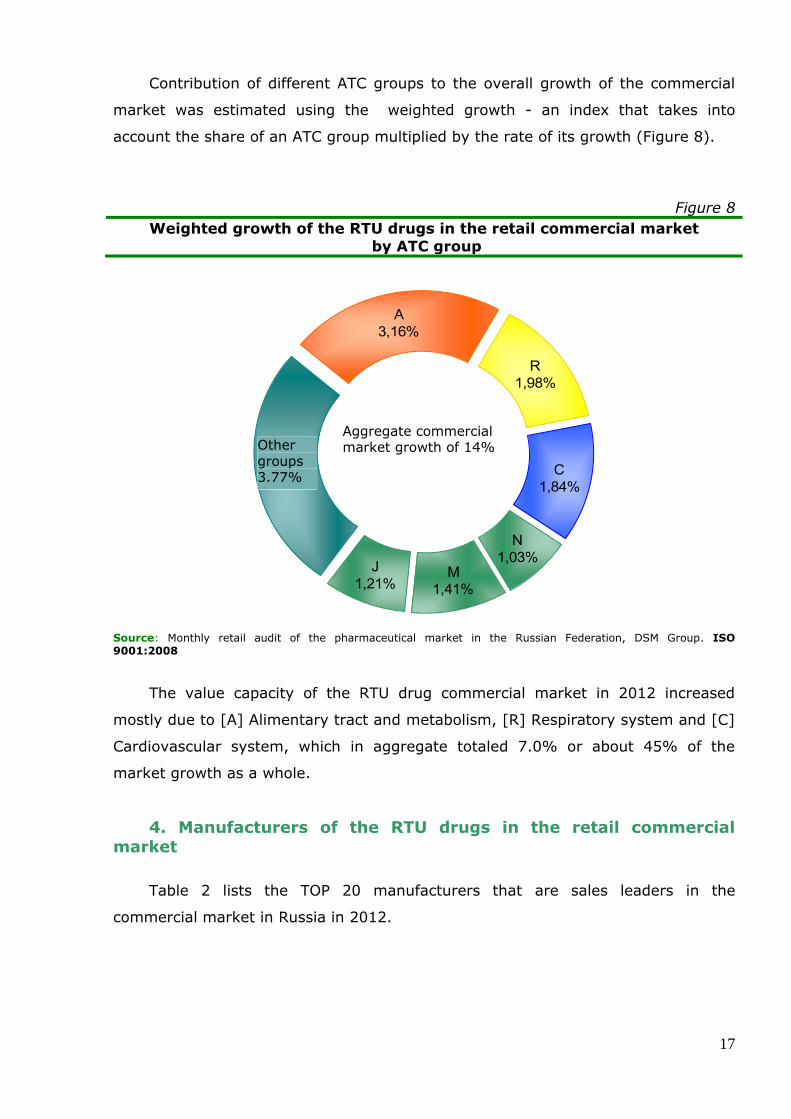
Contribution of different ATC groups to the overall growth of the commercial
market was estimated using the weighted growth - an index that takes into
account the share of an ATC group multiplied by the rate of its growth (Figure 8).
Figure 8
Weighted growth of the RTU drugs in the retail commercial market
by ATC group
A
3,16%
R
1,98%
C
1,84%
N
1,03%M
1,41%
J
1,21%
Другие
группы
3,77%
Рост коммерческого
рынка в целом 14%
Source: Monthly retail audit of the pharmaceutical market in the Russian Federation, DSM Group. ISO
9001:2008
The value capacity of the RTU drug commercial market in 2012 increased
mostly due to [A] Alimentary tract and metabolism, [R] Respiratory system and [C]
Cardiovascular system, which in aggregate totaled 7.0% or about 45% of the
market growth as a whole.
4. Manufacturers of the RTU drugs in the retail commercial
market
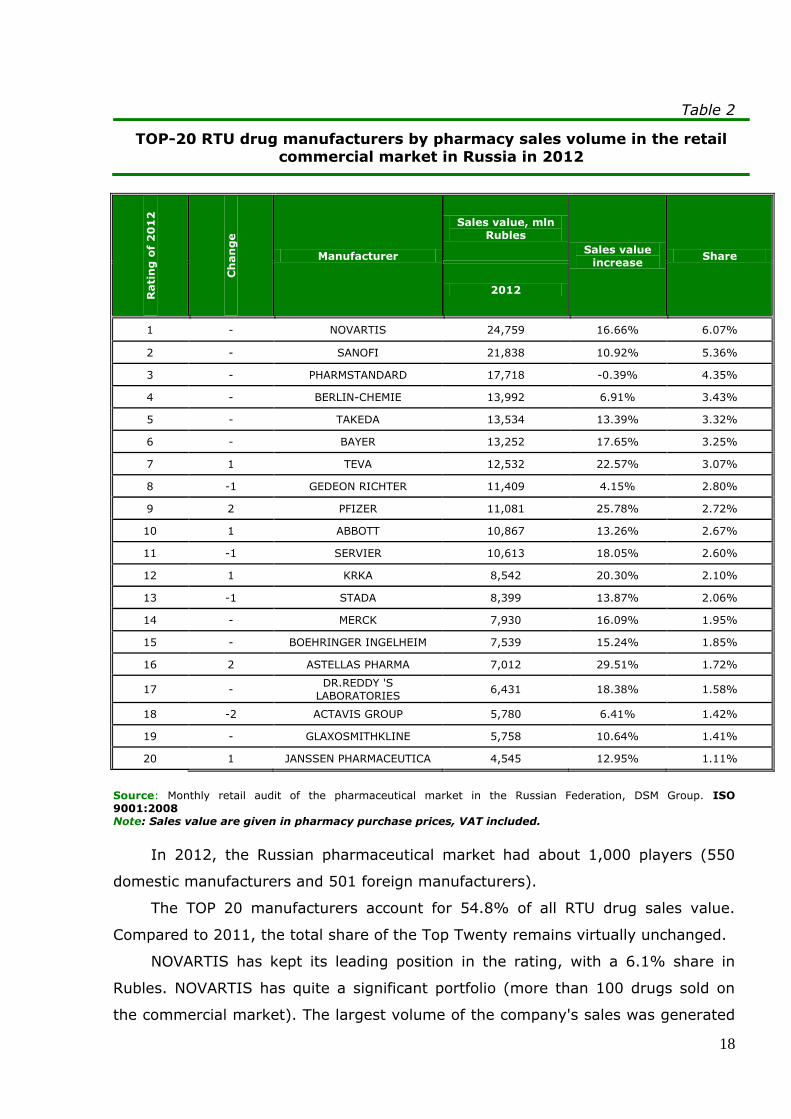
Table 2 lists the TOP 20 manufacturers that are sales leaders in the
commercial market in Russia in 2012.
Other
groups 3.77%
Aggregate commercial market growth of 14%
18
Table 2
TOP-20 RTU drug manufacturers by pharmacy sales volume in the retail
commercial market in Russia in 2012
Rati
ng
of
20
12
Ch
an
ge
Manufacturer
Sales value, mln
Rubles
Sales value
increase Share
2012
1 - NOVARTIS 24,759 16.66% 6.07%
2 - SANOFI 21,838 10.92% 5.36%
3 - PHARMSTANDARD 17,718 -0.39% 4.35%
4 - BERLIN-CHEMIE 13,992 6.91% 3.43%
5 - TAKEDA 13,534 13.39% 3.32%
6 - BAYER 13,252 17.65% 3.25%
7 1 TEVA 12,532 22.57% 3.07%
8 -1 GEDEON RICHTER 11,409 4.15% 2.80%
9 2 PFIZER 11,081 25.78% 2.72%
10 1 ABBOTT 10,867 13.26% 2.67%
11 -1 SERVIER 10,613 18.05% 2.60%
12 1 KRKA 8,542 20.30% 2.10%
13 -1 STADA 8,399 13.87% 2.06%
14 - MERCK 7,930 16.09% 1.95%
15 - BOEHRINGER INGELHEIM 7,539 15.24% 1.85%
16 2 ASTELLAS PHARMA 7,012 29.51% 1.72%
17 - DR.REDDY 'S
LABORATORIES 6,431 18.38% 1.58%
18 -2 ACTAVIS GROUP 5,780 6.41% 1.42%
19 - GLAXOSMITHKLINE 5,758 10.64% 1.41%
20 1 JANSSEN PHARMACEUTICA 4,545 12.95% 1.11%
Source: Monthly retail audit of the pharmaceutical market in the Russian Federation, DSM Group. ISO
9001:2008 Note: Sales value are given in pharmacy purchase prices, VAT included.
In 2012, the Russian pharmaceutical market had about 1,000 players (550
domestic manufacturers and 501 foreign manufacturers).
The TOP 20 manufacturers account for 54.8% of all RTU drug sales value.
Compared to 2011, the total share of the Top Twenty remains virtually unchanged.
NOVARTIS has kept its leading position in the rating, with a 6.1% share in
Rubles. NOVARTIS has quite a significant portfolio (more than 100 drugs sold on
the commercial market). The largest volume of the company's sales was generated

19
by LINEX - as based on the results of 2012, its share in the company’s sales was
11.7% in monetary terms, with a gain of 11% compared to sales in 2011. The
highest increase in sales was noted for OTRIVIN (+51%), SINECOD (+61%),
GALVUS (+109%), etc. In volume terms, such well-known brands as TERAFLU,
LINEX, KETONAL lead the sales. These three items account for 29% of packages
sold, which is equivalent to the total share of these products in the company’s sales
value.
SANOFI-AVENTIS, the runner-up, lost 0.71% of the Ruble share to the leader.
The “irreplaceable” sales hits - ESSENTIALE, NO-SPA, MAGNE - give the company
strong market positions, and ESSENTIALE and NO-SPA are TOP-20 brands.
As in 2011, PHARMSTANDARD is in the third place, with a share of 4.35%. The
company's sales in 2012 demonstrated a decline at -0.4%, it is noteworthy that the
largest domestic drug manufacturer is the only one of all rated companies to
demonstrate reduced pharmacy sales. This is due to a drop in sales of the leading
pharmaceutical brands - ARBIDOL (-22% compared to sales in 2011), KODELAK (-
29%).
As based on 2012, the following companies improved their standing as Top-20
manufactures on the Russian commercial drug market: TEVA (pharmacy drug sales
grew by 22.6% driven by strong growth in demand for such RTU drugs as
SUMAMED, AMBROBENE and HYLAK), PFIZER (which gained almost 26% compared
the sales level in 2011 due to increased sales of several brands, in particular
TYZINE, LYRICA and DIFLUCAN), ABBOTT moved one place up in the rating.
Furthermore, KRKA moved from the 13th place to the 12th, helped by more than
20% growth in sales of the company’s drugs (the growth flagships were drugs such
as ENAP (+5%), LORISTA (+77%), GERBION ( 24%) and ATORIS (41%)).
ASTELLAS PHARMA moved from the 18th place in 2011up to the 16th in 2012,
having demonstrated the highest pharmacy sales gains of 29.5% among the top
twenty companies. Russian pharmacies sell 19 pharmaceutical brands of the
company, with DE-NOL, OMNIC, FLEMOXIN and others showing marked demand
gains. In 2012, sales grew almost for all drugs of ASTELLAS PHARMA.
We should also mention JANSSEN PHARMACEUTICA which is the pharmaceutical
business unit of Johnson & Johnson. In 2012, the company ranked 20th, having
increased its domestic pharmacy sales by nearly 13%. This was also caused by
rising demand for drugs, such as the antidiarrheal IMODIUM (+35% compared to
sales in 2011), the antiulcer agent PARIET (+13%) and MOTILIUM, a drug that
relieves symptoms of dyspepsia (+28%).

20
5. Retail commercial market drugs
Table 3 lists the TOP 20 brands that are sales leaders in the commercial
market in Russia in 2012.
Table 3
TOP 20 brands by sales value terms, in the commercial market in Russia in 2011-2012
Rati
ng
of
20
12
Ch
an
ge
Brand name
Sales value, mln
Rubles Sales value
increase Share
2012
1 1 ESSENTIALE 3,812 5.5% 0.93%
2 -1 ARBIDOL 3,744 -22.1% 0.92%
3 3 CONCOR 3,291 16.5% 0.81%
4 1 ACTOVEGIN 3,214 10.7% 0.79%
5 -2 VIAGRA 3,037 -4.7% 0.75%
6 1 LINEX 2,892 11.2% 0.71%
7 -3 NUROFEN 2,844 -7.7% 0.70%
8 1 ALFLUTOP 2,683 26.0% 0.66%
9 -1 TERAFLU 2,443 11.3% 0.60%
10 3 DETRALEX 2,336 17.7% 0.57%
11 6 NISE 2,218 22.0% 0.54%
12 3 NO-SPA 2,095 12.1% 0.51%
13 3 LASOLVAN 2,091 13.2% 0.51%
14 46 REDUXIN 2,079 108.1% 0.51%
15 -3 ANAFERON 2,077 3.2% 0.51%
16 2 MEXIDOL 2,054 13.7% 0.50%
17 4 MILGAMMA 2,053 22.5% 0.50%
18 51 KAGOCEL 2,049 124.7% 0.50%
19 -5 MOVALIS 2,021 6.7% 0.50%
20 -10 OSCILLOCOCCINUM 2,013 -4.0% 0.49%
Source: Monthly retail audit of the pharmaceutical market in the Russian Federation, DSM Group. ISO
9001:2008 Note: Sales value are given in pharmacy purchase prices, VAT included.
In aggregate, the top 20 leading brands account for 12.5% of the value of the
RTU drug commercial segment. The three sales hits have changed: ESSENTIALE
became the leader (displacing ARBIDOL to the 2nd place), CONCOR settled the
third position, surpassing VIAGRA and ACTOVEGIN.
21
It should be noted that 2012 did not bring about any "large-scale" epidemics
of influenza and other respiratory infections, drugs in this category grew at an
uneven pace: sales of ARBIDOL and OSCILLOCOCCINUM shrank by 22% and 4%,
respectively, at the same time, demand for TERAFLU, ANAFERON and KAGOCEL
increased. KAGOCEL showed a particularly noticeable growth, its sales more than
doubled over 2012.
Two drugs - the above mentioned KAGOCEL (+51 line) and REDUXIN that
moved from the 60th line to the 14th - improved their positions in the 2012 rating
most noticeably. A massive advertising campaign that stimulated a growing
demand for the eponymous nutritional supplement also "boosted" sales of the drug.
As a result, over 2012, pharmacy sales of REDUXIN increased by 108%, as
compared to 2011.
In terms of sold packages, inexpensive preparations, such as ACTIVATED
CARBON, CITRAMONUM and ACETYLSALICYLIC ACID, have the leading positions. Of
the RTU DRUG's that made it to the TOP-20 by value, only NUROFEN is rated as a
TOP-20 drug in volume terms, with its 16th place. It should be noted that the TOP-
20 RTU DRUG's in volume terms are almost 100% the so-called "traditional"
pharmaceuticals, that is those sold only in Russia and the former Soviet Union. In
the Ruble rating, they stand below the 100th position. The weighted average price
of the TOP 20 in packages is about 10 Rubles.
6. Vital Drugs
Currently, the the VED list has about 500 INN's. These are essential drugs that
contribute to reduced mortality and morbidity in the population. The number of
drugs in the list of vital and essential drugs (VED) doubled over three years, from
about 5,000 items in 2009 to 10,000 in 2012. In 2011, the list of such drugs was
expanded to include 37 international non-proprietary names, in 2012, it was
expanded to include 29.
Drugs in this list are subject to state regulation in force from April 2010.
Regulation is based on determining the manufacturer's maximum price and
maximum trade markups, that is the wholesale and retail prices. Markups vary by
region. According to the pricing methodology, Russian pharmaceutical
manufacturers can annually re-register the prices adjusted for inflation, or subject
to changes in the prices for raw-stuff and materials or overheads. Foreign
manufacturers register the prices based on the data of the minimum prices in the
22
manufacturing countries and states where the drugs are registered. However, in
reality, neither domestic, nor foreign manufacturers have been able to raise the ex-
works prices for the VED drugs in two years since this system was put in place. This
gave rise to tensions in the pharma community.
In October 2012, a new pricing method was approved for the VED drugs. This
method assumes annual indexation of the prices for the domestic drugs that are in
the VED list, depending on the inflation rate. The inflation rate had earlier been a
criteria to raise the price, however, domestic manufacturers had not been able to
raise the prices based on this indicator. As for foreign companies, the methodology
for determining the maximum ex-works price for them has not changed.
The VED list for 2013 will be the same as in 2012. As a result, the current full
VED list contains 567 pharmaceuticals, of which 93 titles (16.4%) are manufactured
only by domestic companies, 207 titles (36.5%) - only by foreign companies, and
267 titles (47.1%) are manufactured by both Russian and foreign pharmaceutical
companies.
The renewal of the VED list for 2013 is explained by the current preparations
to migrate to the new insurance-based drug provision system which, according to
the Russian Ministry of Health plans, may take effect in the near years.
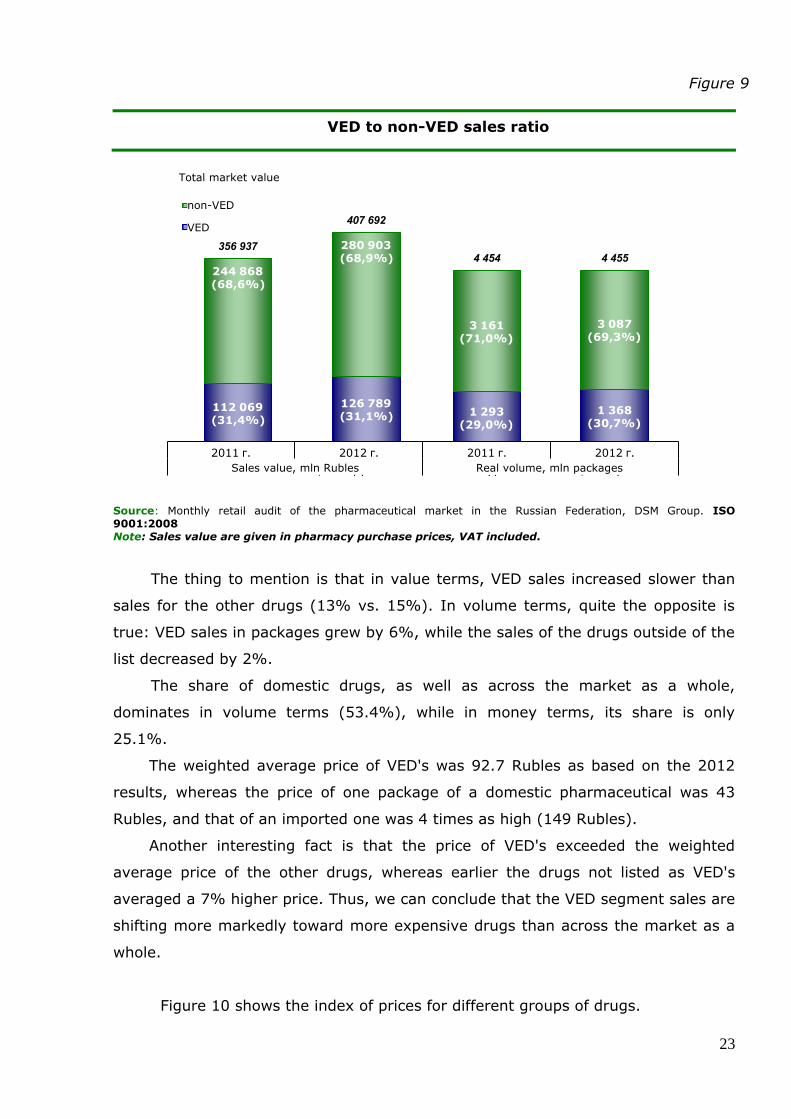
Based on the 2012 results, 479 INN's listed as VED's (corresponding to 1604
brands) were on sale at pharmacies. VED sales totaled 100.6 billion Rubles, or
1,262 million packages (Figure 9).
23
Figure 9
VED to non-VED sales ratio
112 069(31,4%)
126 789(31,1%)
244 868(68,6%)
280 903(68,9%)
356 937
407 692
Общий объем рынка
не-ЖНВЛП
ЖНВЛП
1 293(29,0%)
1 368(30,7%)
3 161(71,0%)
3 087(69,3%)
4 454 4 455
2011 г. 2012 г. 2011 г. 2012 г.
Стомостный объем, млн. руб. Натуральный объем, млн. уп.
Source: Monthly retail audit of the pharmaceutical market in the Russian Federation, DSM Group. ISO
9001:2008 Note: Sales value are given in pharmacy purchase prices, VAT included.
The thing to mention is that in value terms, VED sales increased slower than
sales for the other drugs (13% vs. 15%). In volume terms, quite the opposite is
true: VED sales in packages grew by 6%, while the sales of the drugs outside of the
list decreased by 2%.
The share of domestic drugs, as well as across the market as a whole,
dominates in volume terms (53.4%), while in money terms, its share is only
25.1%.
The weighted average price of VED's was 92.7 Rubles as based on the 2012
results, whereas the price of one package of a domestic pharmaceutical was 43
Rubles, and that of an imported one was 4 times as high (149 Rubles).
Another interesting fact is that the price of VED's exceeded the weighted
average price of the other drugs, whereas earlier the drugs not listed as VED's
averaged a 7% higher price. Thus, we can conclude that the VED segment sales are
shifting more markedly toward more expensive drugs than across the market as a
whole.
Figure 10 shows the index of prices for different groups of drugs.
Total market value
non-VED
VED
Sales value, mln Rubles Real volume, mln packages

24
Figure 10
Dynamics of the price index on the commercial market in 2012
6,0%
0,0% 0,2%
1,8%
-1,9%
1,0%
-1,8%
2,0%
2,0% 0,1% -0,2%
-1,9%0,0%
7,8%
Дек
аб
рь
20
11
Ян
вар
ь 2
01
2
Фев
ра
ль
20
12
Ма
рт
20
12
Ап
рел
ь 2
01
2
Ма
й 2
01
2
Ию
нь
20
12
Ию
ль
20
12
Авг
уст
20
12
Сен
тяб
рь
20
12
Окт
ябр
ь 2
01
2
Но
ябр
ь 2
01
2
Дек
аб
рь
20
12
Индекс цен по рынку, руб. Индекс цен по списку ЖНВЛП, руб.
Индекс цен по не -ЖНВЛП, руб.
1,5%
Source: Monthly retail audit of the pharmaceutical market in the Russian Federation, DSM Group. ISO
9001:2008
Over 12 months of 2012, the VED prices increased by 1.5 times. Drugs not
listed as VED's gained 7.8% in their price, compared with December 2011. The
main increase in the prices was in the 2nd half of 2012 - during this period, the
price index rose by 4%. That was the only way the market was able to somewhat
compensate for the reduced income due to the fixed VED prices.
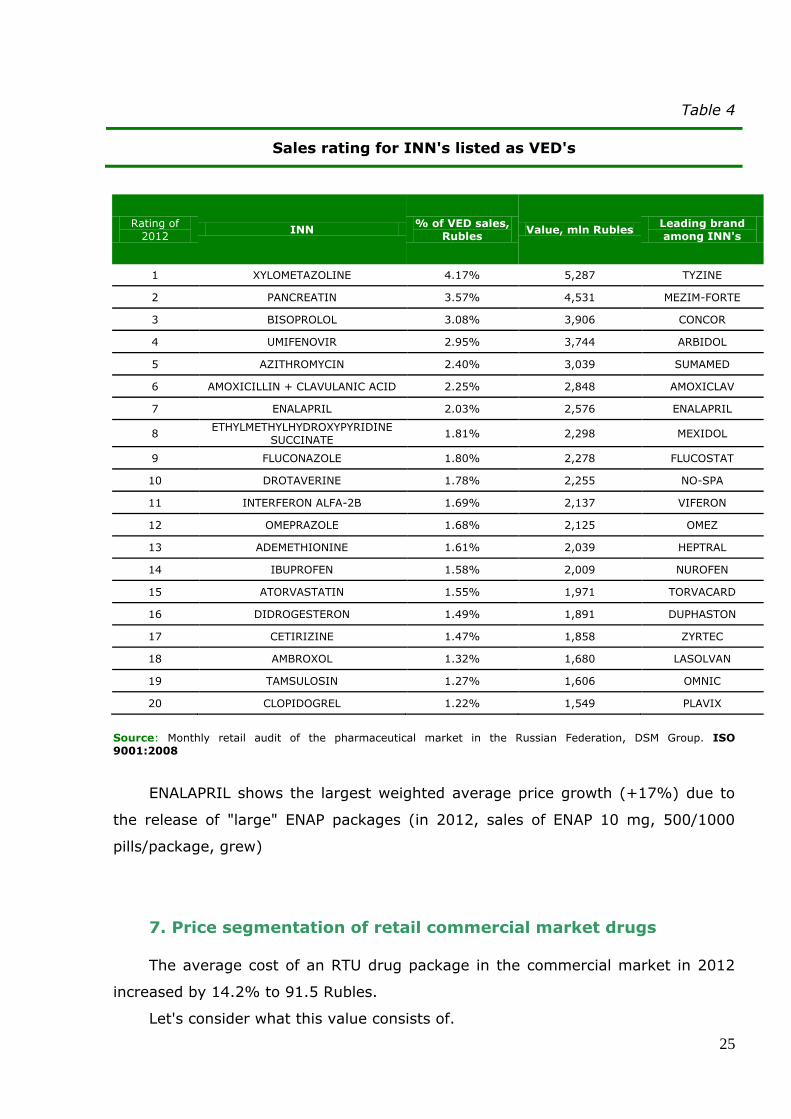
RTU drug sales by INN added to the VED list are rated in Table 4. At the top of
the VED rating by INN is XYLOMETAZOLINE. Note that in 2011, UMIFENOVIR
(ARBIDOL) led the rating, however, the 22.1% fall of the pharmacy sales of this
INN in 2012, at a time when the demand for TYZINE (INN XYLOMETAZOLINE)
tripled, displaced the leading INN. PANCREATIN preparations are in the second
place in the VED rating, with MEZIM-FORTE leading the sales. INN BISOPROLOL is
in the third place (CONCOR is the INN leader).
Price index for the market, Rubles
Price index for non-VED
Price index for VED list, Rubles
Decem
ber
2011
January
2012
Febru
ary
2012
Marc
h 2
012
Apri
l 2012
May 2
012
June 2
012
July
2012
August
2012
Septe
mber
2012
Octo
ber
2012
Novem
ber
2012
Decem
ber
2012
25
Table 4
Sales rating for INN's listed as VED's
Rating of
2012 INN
% of VED sales,
Rubles Value, mln Rubles
Leading brand
among INN's
1 XYLOMETAZOLINE 4.17% 5,287 TYZINE
2 PANCREATIN 3.57% 4,531 MEZIM-FORTE
3 BISOPROLOL 3.08% 3,906 CONCOR
4 UMIFENOVIR 2.95% 3,744 ARBIDOL
5 AZITHROMYCIN 2.40% 3,039 SUMAMED
6 AMOXICILLIN + CLAVULANIC ACID 2.25% 2,848 AMOXICLAV
7 ENALAPRIL 2.03% 2,576 ENALAPRIL
8 ETHYLMETHYLHYDROXYPYRIDINE
SUCCINATE 1.81% 2,298 MEXIDOL
9 FLUCONAZOLE 1.80% 2,278 FLUCOSTAT
10 DROTAVERINE 1.78% 2,255 NO-SPA
11 INTERFERON ALFA-2B 1.69% 2,137 VIFERON
12 OMEPRAZOLE 1.68% 2,125 OMEZ
13 ADEMETHIONINE 1.61% 2,039 HEPTRAL
14 IBUPROFEN 1.58% 2,009 NUROFEN
15 ATORVASTATIN 1.55% 1,971 TORVACARD
16 DIDROGESTERON 1.49% 1,891 DUPHASTON
17 CETIRIZINE 1.47% 1,858 ZYRTEC
18 AMBROXOL 1.32% 1,680 LASOLVAN
19 TAMSULOSIN 1.27% 1,606 OMNIC
20 CLOPIDOGREL 1.22% 1,549 PLAVIX
Source: Monthly retail audit of the pharmaceutical market in the Russian Federation, DSM Group. ISO
9001:2008
ENALAPRIL shows the largest weighted average price growth (+17%) due to
the release of "large" ENAP packages (in 2012, sales of ENAP 10 mg, 500/1000
pills/package, grew)
7. Price segmentation of retail commercial market drugs
The average cost of an RTU drug package in the commercial market in 2012
increased by 14.2% to 91.5 Rubles.
Let's consider what this value consists of.

26
Figure 11 shows the structure of the commercial market and the average price
per package in the price segments in 2011-2012.
Figure 11
RTU drug value sales on the retail commercial market broken down by
price segment
Source: Monthly retail audit of the pharmaceutical market in the Russian Federation, DSM Group. ISO 9001:2008 Note: Sales value are given in pharmacy purchase prices, VAT included.
The greatest fear in 2012 was the possibility that cheap drugs would be
eliminated from the distributers' and pharmacies' offerings due to the regulated
prices for VED's. The fears proved groundless, the offering is largely determined by
the needs of consumers, and pharmacies always try to close positions for items out
of stock. If there is a disconnect between the pharmacy's offering and the buyers'
need, the buyer is inevitably lost.
As seen in Figure 9, the share of drugs priced below 50 Rubles fell by 1.6%
over the last year, the share of these drugs in the VED list dropped by 1.1%. And
this has been characteristic of our market in recent years, and not related directly
to the regulation of prices. This tendency can be seen as the shifting of consumer
preferences toward more expensive and more effective drugs. Thus, sales of such
below 50 Rubles from 50 Rubles to
150 Rubles
from 150 Rubles to 300 Rubles
from 300 Rubles to 500 Rubles
above 500 Rubles
average price of an RTU drug package

27
popular pharmaceuticals as NAFTIZIN, ACTIVATED CARBON, CITRAMCITRAMONUM
AND ANALGIN dropped by 32.6 million packages.
And if we "fix" the consumer basket at the 2011 level (i.e. irrespective of the
drug price in 2012, it will end up in the same segment as it is based on the 2011
results), the share of pharmaceuticals priced below 50 Rubles in 2012 will amount
to 10.2%, that is only 0.2% less than in 2011. Changes will also be minimal for the
remaining segments. Thus, we can conclude that market shares by price segment
change mainly due to price increases and transition of a pharmaceutical from one
price group to another higher one.
The segment of pharmaceuticals priced below 50 Rubles remains the most
capacious in volume terms, amounting to 57%.
The fastest growing price group both in value terms (+25%) and in volume
terms (+24%) is a group of pharmaceuticals priced above 500 Rubles, its share
increased by 1.9% to 22.0% in Rubles. In packages, the share of this group is
minimal at 2.2%.
The group that is most capacious as based on the results of 2012 is a group of
pharmaceuticals priced between 150 and 300 Rubles. It took up 29.2% of the
volume in money terms. Sales growth for this group was +18% in 2012 as
compared to 2011.
8. The price index for retail commercial market drugs
To make an objective estimate of drug price change on the retail commercial
market segment, a price index based upon a fixed list of ready-to-use drugs was
considered.2.
As in previous years, the market growth continues to be driven through an
increase in the drug price index. In 2012, the drug inflation rate (6.0%) was lower
than the overall consumer price index of the SSC (6.6%). Drug prices rose
unevenly, the main growth came in the second half. The index grew due to a drop
in profitability for the entire supply chain, as a result of changes in taxation and
price regulation for VED drugs.
2 Price index for the current year was calculated on the basis of an intersected list of all full names of drugs present on the market in the previous year.

28
The price rise of the most popular drugs on the market was slightly lower: in
2012 the price index of the TOP-100 brands (in turnover) amounted to 4.9%
(Figure 12).
Figure 12
Change in prices of RTU drugs on the Russian commercial market in 2012
Source: Monthly retail audit of the pharmaceutical market in the Russian Federation, DSM Group. ISO
9001:2008
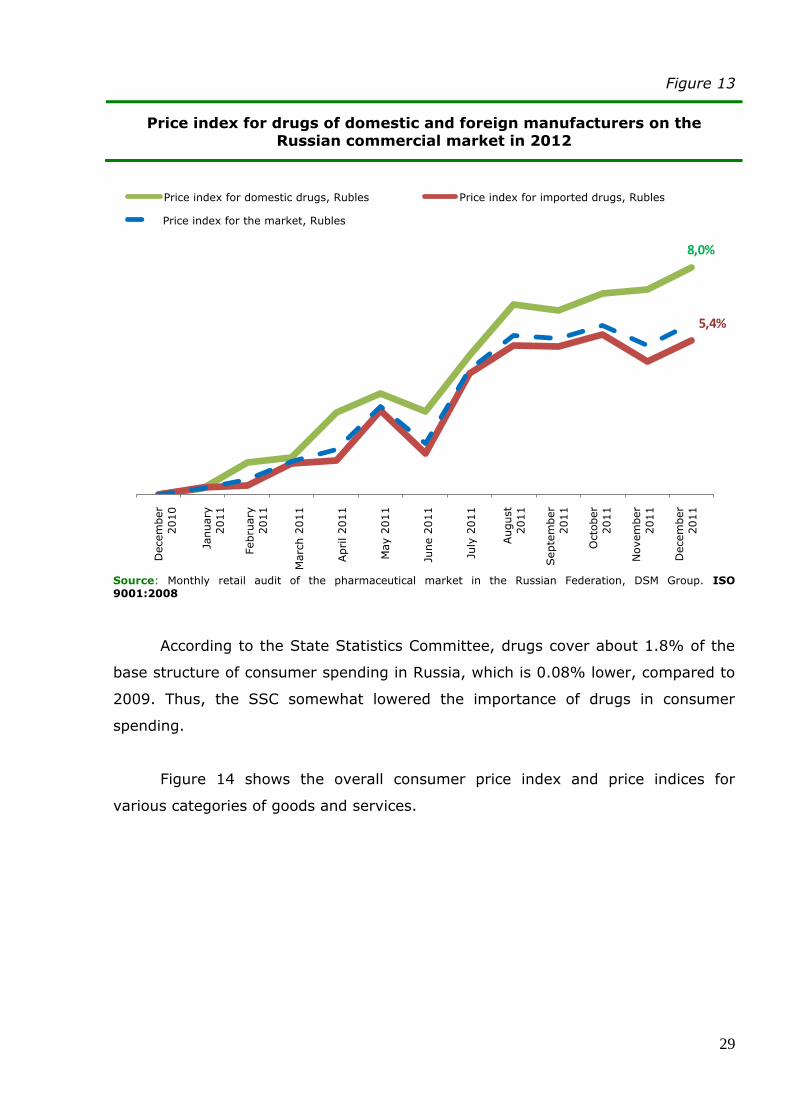
The price index for imported and domestic drugs in 2012 is shown in Figure
13.
In 2012, the changes in prices for domestic and imported drugs were
different. The indicators were 8.0% and 5.4%, respectively. Prices for drugs
produced in Russia grew at a substantially faster rate than those for imported
pharmaceuticals.
Decem
ber
2011
January
2012
Febru
ary
2012
Marc
h
2012
Apri
l 2012
May 2
012
June 2
012
July
2012
August
2012
Septe
mber
2012
Octo
ber
2012
Novem
ber
2012
Decem
ber
2012
Price index for the market, Rubles Price index for TOP 100, Rubles
29
Figure 13
Price index for drugs of domestic and foreign manufacturers on the Russian commercial market in 2012
5,4%
8,0%
Дек
аб
рь
20
10
Ян
вар
ь 2
01
1
Фев
ра
ль
20
11
Ма
рт
20
11
Ап
рел
ь 2
01
1
Ма
й 2
01
1
Ию
нь
20
11
Ию
ль
20
11
Авг
уст
20
11
Сен
тяб
рь
20
11
Окт
ябр
ь 2
01
1
Но
ябр
ь 2
01
1
Дек
аб
рь
20
11
Индекс цен на отечественные препараты, руб. Индекс цен на импортыне препараты, руб.
Индекс цен по рынку, руб.
Source: Monthly retail audit of the pharmaceutical market in the Russian Federation, DSM Group. ISO
9001:2008
According to the State Statistics Committee, drugs cover about 1.8% of the
base structure of consumer spending in Russia, which is 0.08% lower, compared to
2009. Thus, the SSC somewhat lowered the importance of drugs in consumer
spending.
Figure 14 shows the overall consumer price index and price indices for
various categories of goods and services.
Decem
ber
2010
January
2011
Febru
ary
2011
Marc
h 2
011
Apri
l 2011
May 2
011
June 2
011
July
2011
August
2011
Septe
mber
2011
Octo
ber
2011
Novem
ber
2011
Decem
ber
2011
Price index for domestic drugs, Rubles Price index for imported drugs, Rubles
Price index for the market, Rubles

30
Figure 14
The index of consumer prices in Russia
(December 2012 compared to December 2011)
6,6%
7,5%
7,3%
5,2%
6,8%
6,0%
Индекс потребительских цен
Продукты питания
Услуги
Непродовольственные товары
Бензин
Лекарства
Source: Monthly retail audit of the pharmaceutical market in the Russian Federation, DSM Group. ISO
9001:2008, SSC
The overall index of consumer prices in 2012 was 6.6%. The highest price
rise was observed in the food segment (7.5%). The price rise for non-food products
was the lowest (5.2%). The index of drug prices was lower than overall inflation
rate.
9. New drugs on the retail commercial market
New drugs are brought to market each year. In 2012, more than 620 new drug
brands appeared in the Russian pharmacies. Compared to 2011, this figure
increased almost 1.8-fold (in 2011, around 180 brands appeared in pharmacies).
Total sales volume of new products amounted to 862 million Rubles in 2012
and about 4.6 million packages, which amounted to 0.21% of the sales value and
0.10% of real pharmacy sales of all drugs on the retail commercial market. The
weighted average cost per standard package of a new drug was about 187 Rubles.
Most of the new drugs are produced by foreign manufacturers, the Russian
manufacturers brought to market 228 brands in 2012.
Consumer price index
Food
Services
Non-food
Petrol
Drugs
31
Table 4
Top 20 new brands in 2012
on the commercial market of the Russian Federation Rating o
f
2012
Brand name Company Value, mln
Rubles Date of appearance
in pharmacies
1 WICKS PROCTER & GAMBLE 189.5 May 2012
2 ANVIMAKS ANVILAB 67.2 October 2012
3 HONDROGARD FARMFIRMA SOTEX 58.9 February 2012
4 ALERANA VERTEX 56.5 March 2012
5 ORTANOL LEK D.D. 45.0 June 2012
6 NASIVIN SENSITIVE NYCOMED 42.3 April 2012
7 ORSOTEN SLIM KRKA 39.9 January 2012
8 NEXT PHARMSTANDARD 31.6 April 2012
9 ROSUKARD ZENTIVA 15.6 August 2012
10 ROXERA KRKA 13.4 May 2012
11 ANTISTEN MV OZON 13.2 March 2012
12 LISINOPRIL-TEVA TEVA PHARMACEUTICAL 12.0 April 2012
13 EFFEZEL GALDERMA 10.7 May 2012
14 SUMATROLID SOLUTAB OZON 7.9 July 2012
15 DIAFLEX ROMPHARM S.C.ROMPHARM COMPANY 7.5 June 2012
16 BRILINTA 7.5 May 2012
17 NOVALGIN CONCERN STIROL 6.8 June 2012
18 ROSULIP EGIS 6.2 June 2012
19 ONBREZ BREEZHALER NOVARTIS 5.6 March 2012
20 TUTABIN LABORATORY TUTEUR 5.0 April 2012
Source: Monthly retail audit of the pharmaceutical market in the Russian Federation, DSM Group. ISO
9001:2008
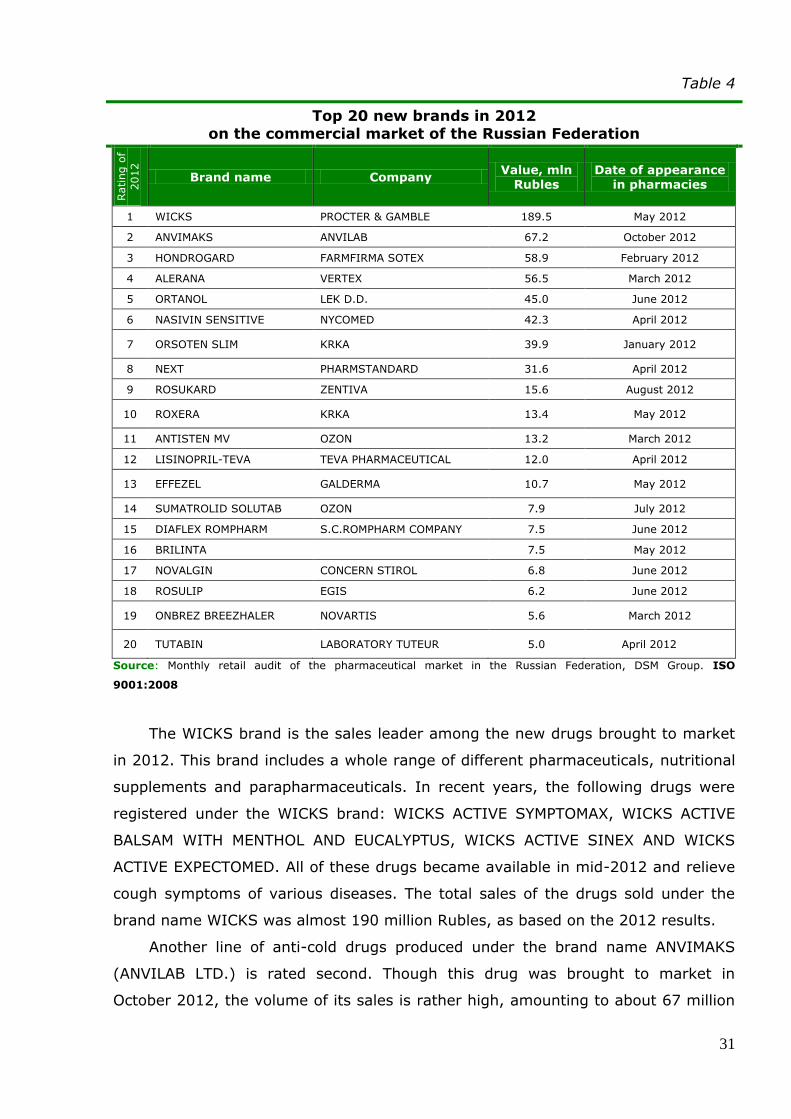
The WICKS brand is the sales leader among the new drugs brought to market
in 2012. This brand includes a whole range of different pharmaceuticals, nutritional
supplements and parapharmaceuticals. In recent years, the following drugs were
registered under the WICKS brand: WICKS ACTIVE SYMPTOMAX, WICKS ACTIVE
BALSAM WITH MENTHOL AND EUCALYPTUS, WICKS ACTIVE SINEX AND WICKS
ACTIVE EXPECTOMED. All of these drugs became available in mid-2012 and relieve
cough symptoms of various diseases. The total sales of the drugs sold under the
brand name WICKS was almost 190 million Rubles, as based on the 2012 results.
Another line of anti-cold drugs produced under the brand name ANVIMAKS
(ANVILAB LTD.) is rated second. Though this drug was brought to market in
October 2012, the volume of its sales is rather high, amounting to about 67 million
32
Rubles in pharmacy purchase prices. The reason is this pharmaceutical is not a new
product but rather a new brand that emerged as a result of the rebranding of
ANTIGRIPPIN-MAXIMUM. Importantly, the composition, the release form and
packaging design of this product are the same, which contributed to its successful
market promotion under a new name.
HONDROGARD based on chondroitin sulfate, from ZAO FARMFIRMA SOTEX,
ranked third in the sales of new products (59 million Rubles). The drug is available
as a solution for intramuscular injection and is used for degenerative diseases of
the joints and spine.
The spray ALERANA (JSC VERTEX) made it to the rating of new drugs in 2012.
The brand ALERANA currently covers a number of anti-hair loss agents: shampoos,
nutritional supplements, and different product kits. In 2011, the manufacturer
created a new product to deal with alopecia - the spray ALERANA based on
minoxidil - and registered it as a drug. Its sales in 2012 amounted to about 57
million Rubles.
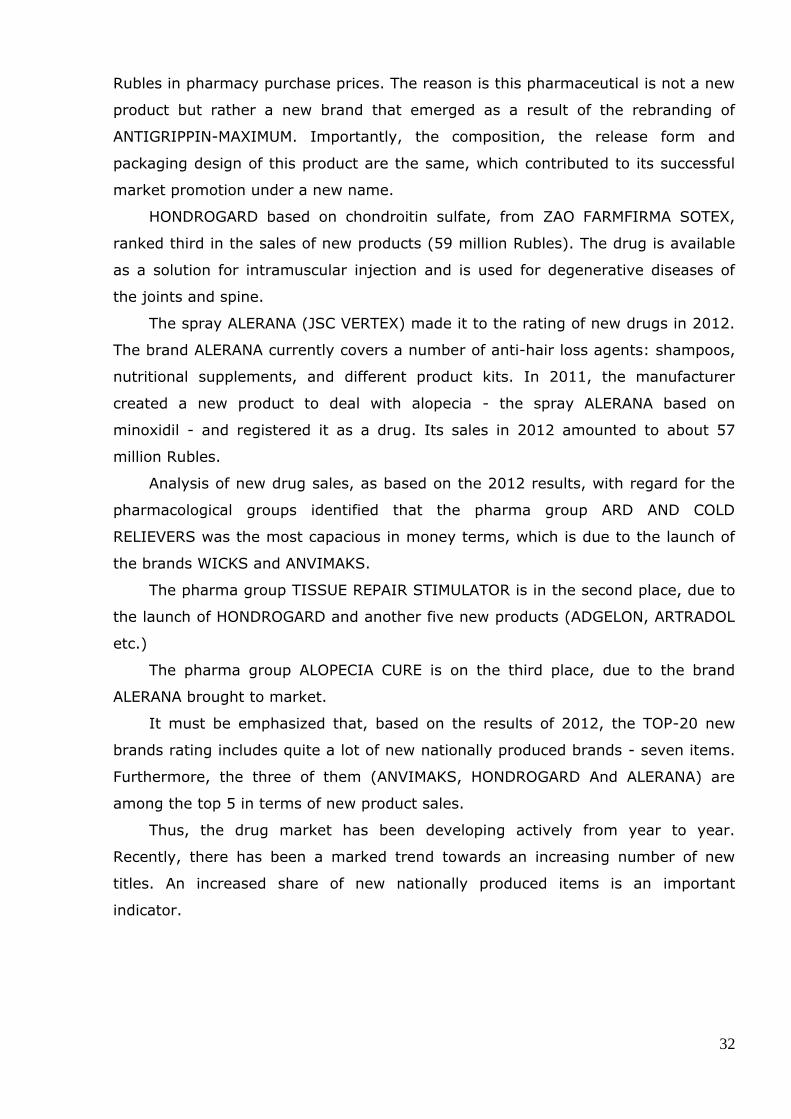
Analysis of new drug sales, as based on the 2012 results, with regard for the
pharmacological groups identified that the pharma group ARD AND COLD
RELIEVERS was the most capacious in money terms, which is due to the launch of
the brands WICKS and ANVIMAKS.
The pharma group TISSUE REPAIR STIMULATOR is in the second place, due to
the launch of HONDROGARD and another five new products (ADGELON, ARTRADOL
etc.)
The pharma group ALOPECIA CURE is on the third place, due to the brand
ALERANA brought to market.
It must be emphasized that, based on the results of 2012, the TOP-20 new
brands rating includes quite a lot of new nationally produced brands - seven items.
Furthermore, the three of them (ANVIMAKS, HONDROGARD And ALERANA) are
among the top 5 in terms of new product sales.
Thus, the drug market has been developing actively from year to year.
Recently, there has been a marked trend towards an increasing number of new
titles. An increased share of new nationally produced items is an important
indicator.

33
3. Drug reimbursement program
As one of social support measures, drug reimbursement program covering
certain categories of citizens supports citizens eligible to state aid.
DRP was established as part of the health care reform and has changed the
approach to providing people with drugs. Previously, the state provided free drugs
to patients with certain diseases, and since 2005, all representatives of the
privileged citizen categories are on DRP.
In 2007-2008, it became necessary to revise the existing system under
which privileged categories of citizens are provided with pharmaceuticals, and the
two components of the drug reimbursement program were singled out:
1. Pharmaceuticals centrally procured with the federal funds that are
intended to treat patients with malignant neoplasms of the lymphoid,
haematopoietic and related tissues, hemophilia, cystic fibrosis, pituitary
dwarfism, Gaucher's disease, multiple sclerosis, and after transplantation
of organs and/or tissues (Decree of the Government of the Russian
Federation, dated February 14, 2009, No. 115, in Moscow). This program
was called "7 high-cost nosologies" (7 nosologies", "high-cost nosologies
(HCN)").
2. Essential drug reimbursement program (EDRP) performed regionally.
Today beneficiary drug coverage, funded by the state, has become an
established segment of the pharmaceutical market.
Since 2007, beneficiaries have had the right to choose how to receive the
benefit: compensation or prescription drugs. Around 12 million people are now
eligible to beneficiary coverage.
In 2012, there were 3.7 million beneficiaries who have chosen drug
coverage. (Figure 15). The Russian authorities allocated nearly 27 billion rubles on
drugs for the privileged categories of citizens in 2012. The standard amount is the
basis for calculating the subsidy which is then transferred to the regions to finance
drug coverage. For an individual citizen entitled to subsidized drugs, this standard
amount cannot limit the price of a prescription.
As can be seen from Figure 15, based on the results of 2012, 78.4 billion
Rubles was spent on drug purchases for the privileged categories of citizens. As
compared to 2011, the gain is -7.4%. In real terms, about 83.9 million drug

34
packages were sold under this program. This is 13.6% less than in 2011. Thus, if in
2011 this indicator showed positive dynamics, and before that the number of
packaged sold had been on continuous decline, from 2012 the situation got back to
the initial state.
Figure 15
Federal beneficiaries number dynamics (mln people) and the value of
money spend under DRP
Source: DSM Group. ISO 9001:2008
Despite the declining number of federal beneficiaries, the amount of funding
allocated to the program is growing every year. In 2013, the allocated funds will
continue to grow at the 2012 level, amounting to 52 bln Rubles. The largest budget
allocations will go to Moscow (more than 4.5 billion Rubles), St. Petersburg (about
1.3 billion) and Moscow region (1.23 billion).
The standard amount of monthly financial costs per citizen receiving state
social assistance in the form of drugs, medical accessories, and nutritional care for
children with disabilities will be 604 Rubles in 2013, as in 2012.
It should be noted that during the period of the DRP program, the level of
availability of quality drugs to beneficiaries increased significantly. This is reflected
in the growth of the average price of a sold package. In 2012, the average price of
prescriptions for subsidized drugs increased by 7,1% and amounted to 935 Rubles.
Value, bln Rubles

35
If the two parts of the program are considered separately, the share of sub-
program on expensive drugs procurement is increasing. While the funding is
declining: in 2012, it was at 37.8 billion Rubles, which is 1.5% less than in 2011
(Figure 16). The "7 nosologies" (high-cost nosologies) program is peculiar in that it
covers a small number of beneficiaries - different data puts their number at about
100 thousand people. Thus, the HCN program allocates about 378 thous. Rubles
per one beneficiary. In volume terms, consumption under the HCN program
amounted to about 2.8 million packages, which is 1.6% lower than in 2011. Thus,
based on the results of 2012, a tendency towards a reduced number of packages
sold was observed (in the past 2 years, this indicator showed growth).
Figure 16
Ratio of spending under the "7 nosologies" programs and EDRP in the total
volume of funds spent under the DRP, in Rubles
Source: DSM Group. ISO 9001:2008
Currently, the possibility of expanding the "7 nosologies" program is widely
discussed: in 2014 it may include another 27 rare diseases affecting about 13
thous. people in Russia now. According to preliminary estimates of the Ministry of
Health and Social Development, an additional 4.5 billion Rubles need to be
allocated from the national budget to treat these diseases.
Another fundamental change which may affect the "7 nosologies" program is
a bill that would allow the regional authorities, from 2014, to purchase drugs for
people with rare diseases with the funds allocated from the federal budget (a
Group share in the DRP value, Rubles
HCN EDRP
36
program similar to the EDRP). These measures will allow for prompt provision of
required drugs to citizens. Today the Ministry purchases drugs once a year.
The EDRP program had 40.6 bln Rubles spent on it in 2012, which is 12.5%
less than in 2011. Furthermore, the share of the EDRP sub-program in the total
beneficiary drug coverage dropped from 55% to 52% (Figure 16). In volume terms,
about 81.1 million packages were purchased, which is 14% less than in 2011. Thus,
the average price per prescription was 500 Rubles, up from 2011 (492 Rubles).
1. Ratio of imported and domestic drugs the DRP program
The DRP program includes mainly "imported drugs", while the domestic
production takes only a modest place in the volume of the reimbursed drugs.
According to the program Pharma-2020, the main task of the government is to
dramatically change this situation: the ultimately targeted share of domestic
products should be about 50%.
It is therefore no mere chance that the market, in particular, the subsidized
drug coverage program, now exhibits a tendency toward a growing number of
domestic products that can replace its imported counterparts.
Based on the results of 2012, the share of domestic products in value terms
increased by 2% (Figure 17). The increase in cash costs for the purchase of
domestic drugs was 12%, while the consumption of imported drugs decreased by
10%.
"Victory" of domestic drugs can be exemplified with INN ZOLEDRONIC ACID:
in 2010, the share of imported drugs for this INN was 73%, in 2011, it was already
28%, and in 2012 it shrank to 14%. Imported drugs were driven out by domestic
counterparts: RESORBA (ZAO PHARM-SINTEZ), ZOLERIKX (BIOCAD) RESOKLASTIN
FS (SINTEZ AKO) and VEROKLAST (OOO LENS-PHARM)
With respect to the HCN program, for subsidized pharmaceuticals, we can give
an example of NOVOSEVEN (NOVO NORDISK) having been replaced with the
domestic pharmaceutical COAGIL (LEKKO) with the same INN EPTACOG ALFA
[ACTIVATED].
For the INN IMATINIB, most of the drugs are the imported drugs GLEEVEC
(NOVARTIS) and GENFATINIB (LABORATORY TUTEUR S.A.C.I.F.I.A.), but this year,
with the market launch of the new drug FILACHROMIN FS (ZAO F-SINTEZ),
transition to the domestic pharmaceutical can be expected in the coming years.

37
As regards the INN INTERFERON BETA-1B, there has been an ever more
marked shift from the imported pharmaceuticals BETAFERON (BAYER AG) and
EXTAVIA (NOVARTIS) toward the domestic pharmaceuticals RONBETAL (ZAO
BIOCAD) and INFIBETA (ZAO GENERIUM).
Figure 17
Ratio of imported and domestic RTU drug sales
Source: DSM Group. ISO 9001:2008 Note: the sales value shown is in final consumer prices with VAT included.
Thus, despite the positive trends, the ratio continues to favor imported drugs:
the value share of imported drugs is 87%, and the value share of domestic drugs is
13%.
In volume terms, the share of domestic drugs reduced by 1% (a growth of -
15%). If in 2011, it amounted to 46%, in 2012 it amounted to 45%. The share of
imported drugs in packages increased by 1%.
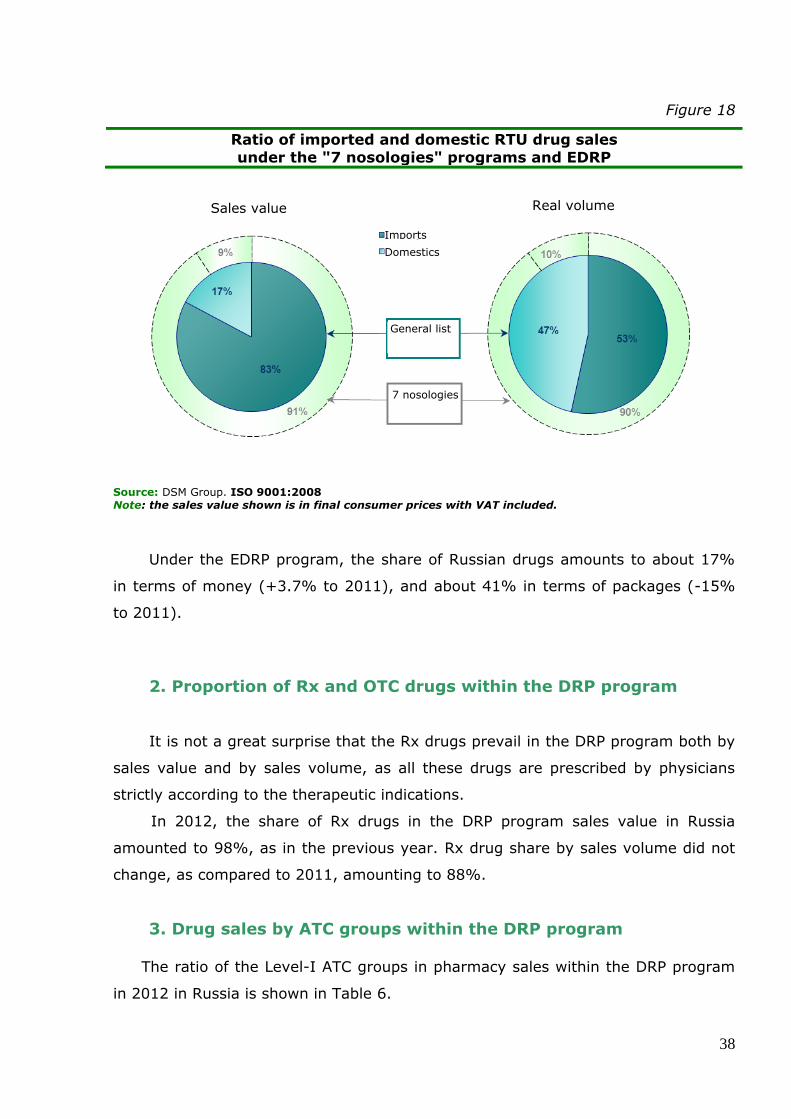
The ratio of imported and domestic RTU drug sales under the "7 nosologies"
program and the EDRP is shown in Figure 18. In the part of the DRP program
corresponding to 7 high-cost nosologies, domestic drugs covered about 9% of the
sales value in 2012. In volume terms, their share was about 10%. Furthermore, the
share of domestic drugs increased by 2.5% compared to 2011. Bringing new drugs
to market is not a quick process, so the share of Russian producers in subsidized
programs will increase "in leaps and bounds."
Sales value Real volume
Imports
Domestics
38
Figure 18
Ratio of imported and domestic RTU drug sales
under the "7 nosologies" programs and EDRP
Source: DSM Group. ISO 9001:2008 Note: the sales value shown is in final consumer prices with VAT included.
Under the EDRP program, the share of Russian drugs amounts to about 17%
in terms of money (+3.7% to 2011), and about 41% in terms of packages (-15%
to 2011).
2. Proportion of Rx and OTC drugs within the DRP program
It is not a great surprise that the Rx drugs prevail in the DRP program both by
sales value and by sales volume, as all these drugs are prescribed by physicians
strictly according to the therapeutic indications.
In 2012, the share of Rx drugs in the DRP program sales value in Russia
amounted to 98%, as in the previous year. Rx drug share by sales volume did not
change, as compared to 2011, amounting to 88%.
3. Drug sales by ATC groups within the DRP program
The ratio of the Level-I ATC groups in pharmacy sales within the DRP program
in 2012 in Russia is shown in Table 6.
Sales value Real volume
Imports
Domestics
General list
7 nosologies

39
Table 6
Drug sales by ATC groups on the DRP market
Level I ATC groups Sales value,
mln Rubles.
The group's
share in sales
value, %
Actual
volume,
million packs
The group's
share in the
actual
volume, %
L: Antineoplastic and immunomodulating agents
37,837.1 48.3% 3.2 3.9%
A: Alimentary tract and metabolism 11,661.0 14.9% 18.3 21.9%
B: Blood and blood forming organs 10,766.3 13.7% 5.2 6.2%
R: Respiratory system 4,478.8 5.7% 5.4 6.4%
C: Cardiovascular system 3,504.4 4.5% 29.6 35.2%
N: Nervous system 3,476.5 4.4% 12.8 15.3%
H: Systemic hormonal preparations, excluding sex hormones
1,740.3 2.2% 1.2 1.4%
M: Musculo-skeletal system 1,368.2 1.7% 3.6 4.3%
J: Antiinfectives for systemic use 1,288.3 1.6% 0.9 1.1%
V: Various 873.2 1.1% 0.3 0.4%
[~] Pharmaceuticals without an ATC group
623.0 0.8% 0.2 0.2%
G: Genito-urinary system and sex hormones
451.7 0.6% 0.9 1.1%
S: Sensory organs 283.0 0.4% 2.0 2.4%
D: Dermatologicals 31.4 0.04% 0.3 0.3%
P: Antiparasitic products, insecticides and repellents
3.7 0.005% 0.01 0.01%
Source: DSM Group. ISO 9001:2008 Note: the sales value shown is in final consumer prices with VAT included.
The ATC rating by sales volume in accordance with the DRP program is quite
stable.
Group [L] Antineoplastic and immunomodulating agents remain the most
expense item of the DRP program - in 2012 more than 48% of all allocated state
funds were spent for their purchase. However, the purchase costs did not change
significantly compared to the previous year in Rubles (-0.4%), but rose in packages

40
(+5.7%). Antineoplastic agents ([L01] and [L02]) of the latest generations have
proven efficacy in the treatment of patients with oncological diseases, and improve
the quality and length of life. The leaders in this ATC group are GLEEVEC,
MABTHERA, VELCADE, averaging a price per package of 50 thousand rubles. Based
on the results of 2012, only GLEEVEC sales increased, while those of MABTHERA
and VELCADE fell.
Group [A] Alimentary tract and metabolism are in the second place in ATC
group rating. In 2012, sales in this group fell by 11.4% in money terms, and by
6.4% in packages. Almost 72% of all sales in this group accounts for diabetes
mellitus drugs ([A10]). The foreign-made drugs LANTUS and CEREZYME lead the
sales in this group. The average price per pack for LANTUS is about 3,300 Rubles,
and that for CEREZYME is about 70 thousand Rubles.
At the bottom of the rating is group [В] Blood and blood forming organs
(13.7%). The tendency for this group was as follows: in terms of value, sales fall,
while in real terms, they grow - 2012 was no exception (-6.3% in Rubles and 2.4%
in packages). The most capacious subgroup in this ATC is [B02] HEMOSTATICS,
accounting for 74% turnover. The prices went down due the replacement of the
Danish hemostatic NOVOSEVEN with its Russian counterpart COAGIL-VII.
In 2012, the DRP structure by ATC groups did not change significantly
compared to the previous year: the groups [C] and [R] traded places, but the five
ATC leaders are the same, accounting for 87% of the ruble volume at the end of
2012 (Figure 19).

41
Figure 19
Ratio of sales by ATC groups in the DRP program
Source: DSM Group. ISO 9001:2008
Group [L] Antineoplastic and immunomodulating agents still takes two fifths of
the DRP sales, there is a significant increase in its share in value terms (+3.5%).
This is the most expensive drug group in the DRP - the weighted average price per
package is about 12,500 Rubles. At the end of 2012, sales value in Rubles declined
in all 5 leading ATC groups. The groups [L] (-0,4%) and [B] (-6,3%) were affected
to a lesser extent. The largest decline in sales was for group [C] (-35,7%). Positive
growth in packages was observed only for the groups [L] and [B] of these TOP-5
ATC groups.
It is interesting to look at how much money is spent for treatment of specific
disease under the DRP. To this end, we aligned the drugs to the therapeutic
indications. The result is the following rating of costs in the DRP by disease (Table
7).
L: Antineoplastic and immunomodulating agents
A: Alimentary tract and metabolism
B: Blood and blood forming organs
R: Respiratory system
C: Cardiovascular system
Other ATC groups

42
Table 7
Cost rating in the DRP by diseases, 2012
Diseases Value,
mln Rubles Share
ONCOLOGY 28,160.9 35.9%
DISORDERS OF BLOOD AND HEMOPOIETIC ORGANS 10,771.9 13.7%
IMMUNE SYSTEM DISORDERS 10,270.5 13.1%
DIABETES MELLITUS 8,491.0 10.8%
RESPIRATORY DISORDERS 4,489.9 5.7%
CARDIOVASCULAR DISORDERS 3,504.5 4.5%
NERVOUS SYSTEM DISORDERS 3,246.6 4.1%
ALIMENTARY DISORDERS 3,002.2 3.8%
HORMONAL DISORDERS 1,742.6 2.2%
OTHER 1,549.3 2.0%
INFECTIOUS AGENTS DISEASES 1,549.3 1.5%
MUSCULOSKELETAL DISORDERS 1,085.6 1.4%
MALE AND FEMALE REPRODUCTIVE DISORDERS 451.7 0.6%
OCULAR DISORDERS 282.8 0.4%
AIDS/HIV 142.0 0.2%
SKIN DISEASES 36.0 0.05%
Source: DSM Group. ISO 9001:2008 Note: the sales volume shown is in final consumer prices with VAT included.
Oncology drugs rank first, accounting for 36% of the sales value of the entire
DRP segment (about 28 billion Rubles). The largest value of purchases are for the
drugs INN Imatinib (GLEEVEC), INN Rituximab (MABTHERA) and INN Bortezomib
(VELCADE) added to the "high-cost 7 nosologies" as agents for treating patients
with malignant neoplasms of the lymphoid, haematopoietic and related tissues.
According to the Russian Ministry of Health and Social Development, cancer is the
second cause of death in Russia after cardiovascular diseases. In 2009, the National
Cancer Program started, which improved early diagnosis of neoplastic diseases and
reversed the mortality from this pathology in Russia for the first time in several
43
decades. For example, in 2010 compared with 2009, mortality decreased by 0.9%,
while in 2011 compared to 2010 it shrank a further 1.1%, which is the best result
over the past 15 years. According to the Health Minister B. Skvortsova, in 2012
Russia had a decrease of mortality from all of the most significant diseases, with a
steady decline in mortality from cancer.
At the end of 2012, in the sales rating, drugs for blood disorders overtook the
agents for immune system disorders.
Of the agents for the disorders of blood and hemopoietic organs, the biggest
sales were generated by the INN BLOOD COAGULATION FACTOR VIII (41,5%), INN
EPTACOG ALPHA [ACTIVATED] (13.3%) and INN EPOETIN ALFA (10.3%). However,
compared to 2011, their sales dropped significantly. Of the INN leaders, the INN
BLOOD COAGULATION FACTOR IX retains positive growth (+99,4%) due to
increased sales of the drugs IMMUNIN and OCTANINE added to the program "7
nosologies."
Drugs used to treat disorders of the immune system rank third, which
translates to 13.1% of the purchase volume under the DRP (about 10.3 billion
Rubles). In this group, the largest increase of costs was noted for drugs with
immunomodulatory and immunosuppressive action.
As in the previous year, of the immunomodulating agents, the drug
COPAXONE-TEVA (INN GLATIRAMER ACETATE) accounted for most spending, also
at the end of 2012, GENFAXON and RONBETAL had leading positions. It should be
noted that COPAXONE-TEVA (INN GLATIRAMER ACETATE) is listed as a drug used
for the treatment of multiple sclerosis under the "7 nosologies" program. At the
same time, the INN GLATIRAMER ACETATE is on the list of strategic drugs,
manufacturing of which must start in this country in the near future. In 2012, the
share of COPAXONE-TEVA declined as compared to 2011 (-25% in Rubles), while
the sales of another drug for the treatment of multiple sclerosis GENFAXON
increased (+77%).
Several immunosuppressants are used also to treat autoimmune diseases such
as rheumatoid arthritis, Crohn's disease and so on. Their purchase costs also
increased. So, one of the group leaders, the selective immunosuppressant
REMICADE, which has already been mentioned above, is intended to treat these
pathologies.
Thus, diseases that can be referred to high-cost nosologies are at the top of
the DRP rating. At the end of 2012, the total share of the spending on the drugs for

44
these three groups amounted to over 60% of the entire DRP segment, or 50 bln
Rubles.
4. Manufacturers in the DRP segment
Table 8 lists the TOP 20 manufacturers that lead by consumption value in the
DRP in 2012.
In 2012, over 421 manufacturers took part in the DRP program, which is more
than in 2011. Of the manufacturers that took part in the DRP for the first time,
SINNAGEN CO. leads by sales value. (205 mln.). Under the DRP program, this
company supplies CINNOVEX, an ATC [L] drug for the treatment of multiple
sclerosis. TEKHNOLOGIA LEKARSTV OOO, a company which produces antineoplastic
agents (BICALUTAMIDE, ANASTROZOLE-TL and LETROZOLE), antimicrobial agents
(VALACYCLOVIR in tablets) and drugs for the treatment of nervous system
disorders (QUETIAPINE), is the second place of the "newcomers" in sales volume.
Table 8
TOP-20 RTU drug manufacturers by the consumption volume in the DRP
program in 2012
Rati
ng
of
20
12
Ch
an
ge
Manufacturer
Sales value, mln Rubles
2012
Sales value
increase Share
1 0 F.HOFFMANN-LA ROCHE 14,850.3 25.1% 18.9%
2 +1 JANSSEN PHARMACEUTICA 6,236.0 -11.4% 8.0%
3 -1 NOVARTIS 5,419.4 -42.4% 6.9%
4 0 TEVA PHARMACEUTICAL 3,901.8 -25.0% 5.0%
5 0 SANOFI 3,628.2 -8.3% 4.6%
6 +9 LABORATORY TUTEUR 3,563.0 154.9% 4.5%
7 0 BAXTER HEALTHCARE 2,905.2 -8.2% 3.7%
8 0 NOVO NORDISK 2,837.0 -8.6% 3.6%
9 0 MERCK 2,581.0 -11.2% 3.3%
10 -4 ASTRAZENECA 2,511.7 -24.0% 3.2%
11 -1 PHARMSTANDARD 2,418.9 -6.0% 3.1%
12 +33 F-SINTEZ 1,762.1 604.8% 2.2%
13 -1 ELI LILLY 1,419.3 -16.2% 1.8%
14 +3 BOEHRINGER INGELHEIM 1,333.6 1.3% 1.7%
15 -1 GENZYME CORPORATION 1,217.7 -15.3% 1.6%
16 +43 TALECRIS BIOTHERAPEUTICS 1,150.9 1006.9% 1.5%
17 +1 OCTAPHARMA AG 1,138.8 -1.2% 1.5%
18 -7 BAYER 1,061.0 -46.1% 1.4%
45
Source: DSM Group. ISO 9001:2008 Note: the sales value shown is in final consumer prices with VAT included.
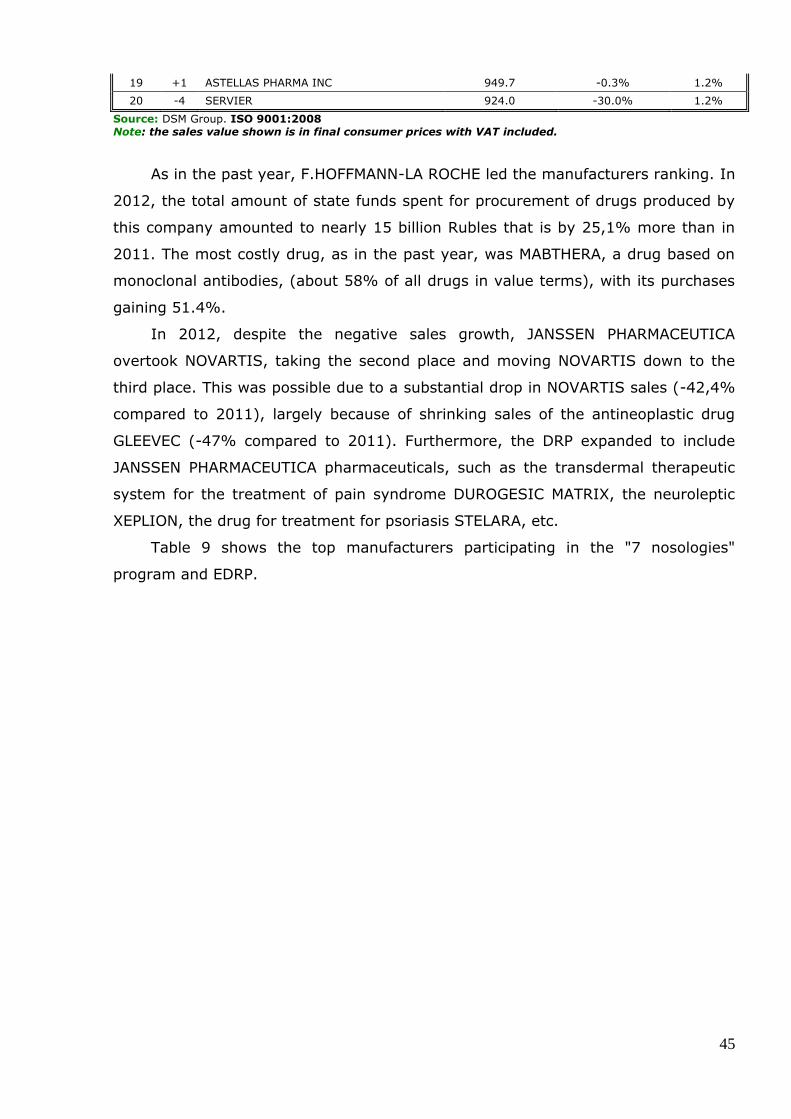
As in the past year, F.HOFFMANN-LA ROCHE led the manufacturers ranking. In
2012, the total amount of state funds spent for procurement of drugs produced by
this company amounted to nearly 15 billion Rubles that is by 25,1% more than in
2011. The most costly drug, as in the past year, was MABTHERA, a drug based on
monoclonal antibodies, (about 58% of all drugs in value terms), with its purchases
gaining 51.4%.
In 2012, despite the negative sales growth, JANSSEN PHARMACEUTICA
overtook NOVARTIS, taking the second place and moving NOVARTIS down to the
third place. This was possible due to a substantial drop in NOVARTIS sales (-42,4%
compared to 2011), largely because of shrinking sales of the antineoplastic drug
GLEEVEC (-47% compared to 2011). Furthermore, the DRP expanded to include
JANSSEN PHARMACEUTICA pharmaceuticals, such as the transdermal therapeutic
system for the treatment of pain syndrome DUROGESIC MATRIX, the neuroleptic
XEPLION, the drug for treatment for psoriasis STELARA, etc.
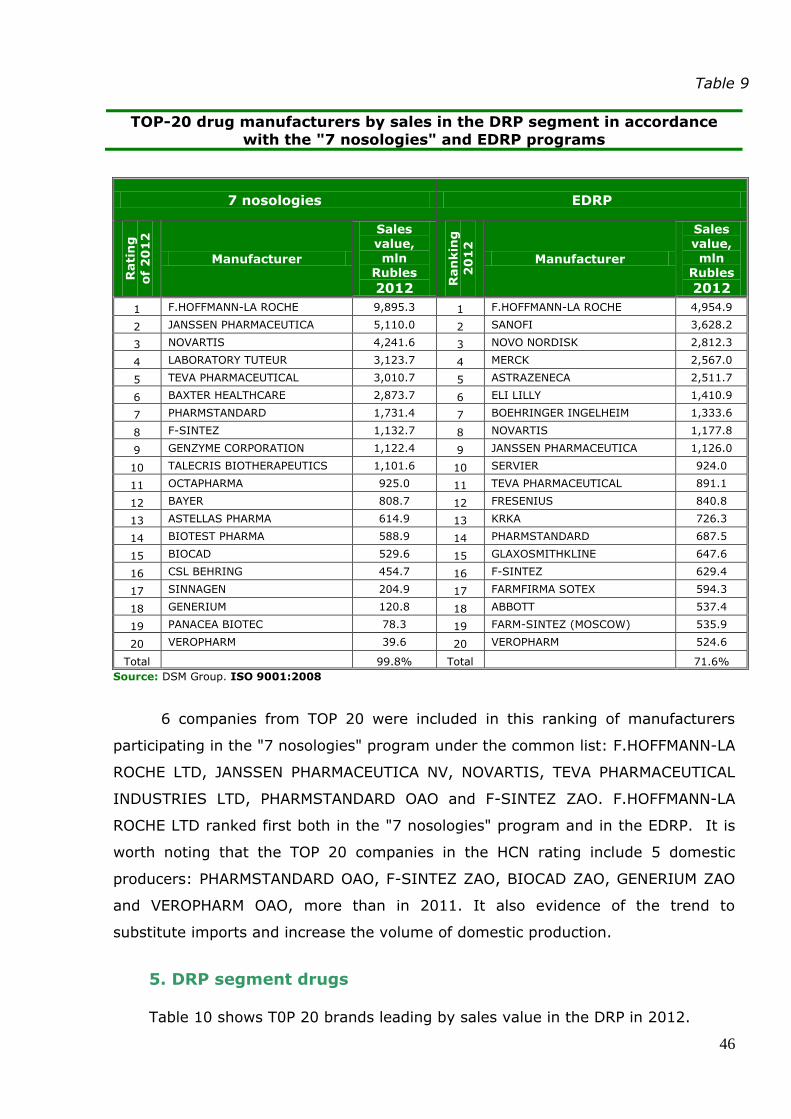
Table 9 shows the top manufacturers participating in the "7 nosologies"
program and EDRP.
19 +1 ASTELLAS PHARMA INC 949.7 -0.3% 1.2%
20 -4 SERVIER 924.0 -30.0% 1.2%
46
Table 9
TOP-20 drug manufacturers by sales in the DRP segment in accordance
with the "7 nosologies" and EDRP programs
7 nosologies EDRP
Rati
ng
of
20
12
Manufacturer
Sales value, mln
Rubles
2012
Ran
kin
g
20
12
Manufacturer
Sales value, mln
Rubles
2012
1 F.HOFFMANN-LA ROCHE 9,895.3 1 F.HOFFMANN-LA ROCHE 4,954.9
2 JANSSEN PHARMACEUTICA 5,110.0 2 SANOFI 3,628.2
3 NOVARTIS 4,241.6 3 NOVO NORDISK 2,812.3
4 LABORATORY TUTEUR 3,123.7 4 MERCK 2,567.0
5 TEVA PHARMACEUTICAL 3,010.7 5 ASTRAZENECA 2,511.7
6 BAXTER HEALTHCARE 2,873.7 6 ELI LILLY 1,410.9
7 PHARMSTANDARD 1,731.4 7 BOEHRINGER INGELHEIM 1,333.6
8 F-SINTEZ 1,132.7 8 NOVARTIS 1,177.8
9 GENZYME CORPORATION 1,122.4 9 JANSSEN PHARMACEUTICA 1,126.0
10 TALECRIS BIOTHERAPEUTICS 1,101.6 10 SERVIER 924.0
11 OCTAPHARMA 925.0 11 TEVA PHARMACEUTICAL 891.1
12 BAYER 808.7 12 FRESENIUS 840.8
13 ASTELLAS PHARMA 614.9 13 KRKA 726.3
14 BIOTEST PHARMA 588.9 14 PHARMSTANDARD 687.5
15 BIOCAD 529.6 15 GLAXOSMITHKLINE 647.6
16 CSL BEHRING 454.7 16 F-SINTEZ 629.4
17 SINNAGEN 204.9 17 FARMFIRMA SOTEX 594.3
18 GENERIUM 120.8 18 ABBOTT 537.4
19 PANACEA BIOTEC 78.3 19 FARM-SINTEZ (MOSCOW) 535.9
20 VEROPHARM 39.6 20 VEROPHARM 524.6
Total 99.8% Total 71.6%
Source: DSM Group. ISO 9001:2008
6 companies from TOP 20 were included in this ranking of manufacturers
participating in the "7 nosologies" program under the common list: F.HOFFMANN-LA
ROCHE LTD, JANSSEN PHARMACEUTICA NV, NOVARTIS, TEVA PHARMACEUTICAL
INDUSTRIES LTD, PHARMSTANDARD OAO and F-SINTEZ ZAO. F.HOFFMANN-LA
ROCHE LTD ranked first both in the "7 nosologies" program and in the EDRP. It is
worth noting that the TOP 20 companies in the HCN rating include 5 domestic
producers: PHARMSTANDARD OAO, F-SINTEZ ZAO, BIOCAD ZAO, GENERIUM ZAO
and VEROPHARM OAO, more than in 2011. It also evidence of the trend to
substitute imports and increase the volume of domestic production.
5. DRP segment drugs
Table 10 shows T0P 20 brands leading by sales value in the DRP in 2012.
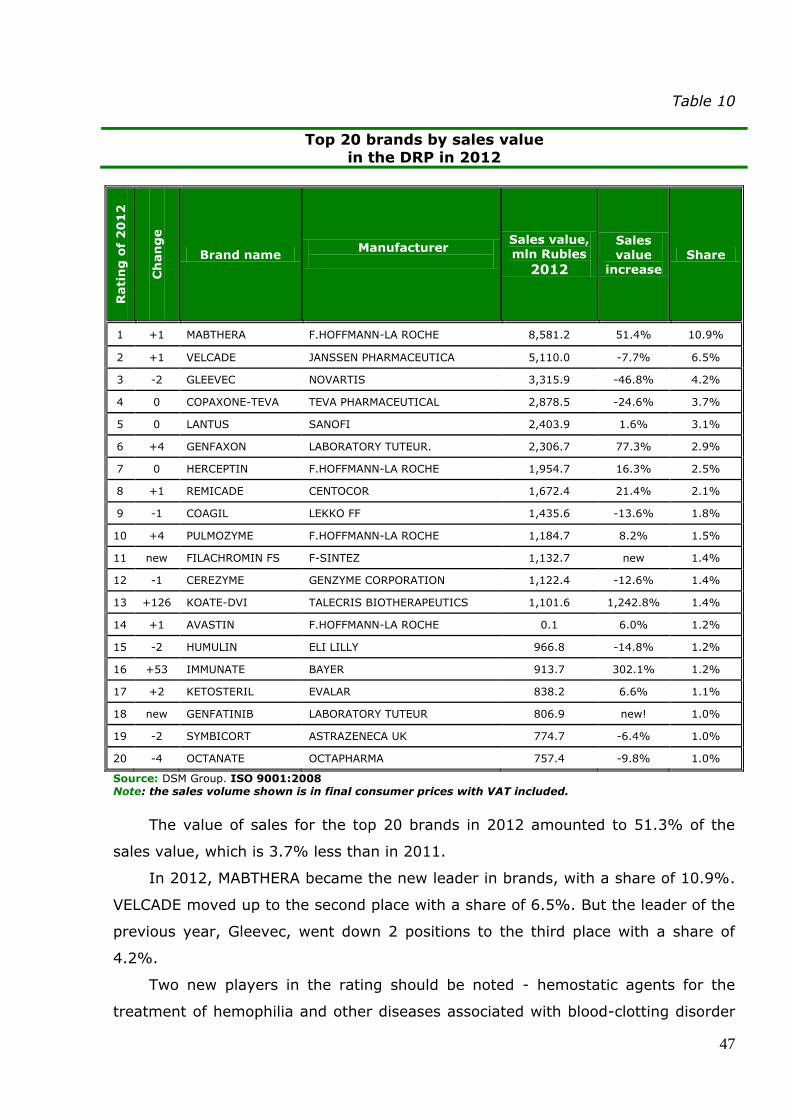
47
Table 10
Top 20 brands by sales value
in the DRP in 2012
Rati
ng
of
20
12
Ch
an
ge
Brand name Manufacturer
Sales value, mln Rubles
2012
Sales value
increase
Share
1 +1 MABTHERA F.HOFFMANN-LA ROCHE 8,581.2 51.4% 10.9%
2 +1 VELCADE JANSSEN PHARMACEUTICA 5,110.0 -7.7% 6.5%
3 -2 GLEEVEC NOVARTIS 3,315.9 -46.8% 4.2%
4 0 COPAXONE-TEVA TEVA PHARMACEUTICAL 2,878.5 -24.6% 3.7%
5 0 LANTUS SANOFI 2,403.9 1.6% 3.1%
6 +4 GENFAXON LABORATORY TUTEUR. 2,306.7 77.3% 2.9%
7 0 HERCEPTIN F.HOFFMANN-LA ROCHE 1,954.7 16.3% 2.5%
8 +1 REMICADE CENTOCOR 1,672.4 21.4% 2.1%
9 -1 COAGIL LEKKO FF 1,435.6 -13.6% 1.8%
10 +4 PULMOZYME F.HOFFMANN-LA ROCHE 1,184.7 8.2% 1.5%
11 new FILACHROMIN FS F-SINTEZ 1,132.7 new 1.4%
12 -1 CEREZYME GENZYME CORPORATION 1,122.4 -12.6% 1.4%
13 +126 KOATE-DVI TALECRIS BIOTHERAPEUTICS 1,101.6 1,242.8% 1.4%
14 +1 AVASTIN F.HOFFMANN-LA ROCHE 0.1 6.0% 1.2%
15 -2 HUMULIN ELI LILLY 966.8 -14.8% 1.2%
16 +53 IMMUNATE BAYER 913.7 302.1% 1.2%
17 +2 KETOSTERIL EVALAR 838.2 6.6% 1.1%
18 new GENFATINIB LABORATORY TUTEUR 806.9 new! 1.0%
19 -2 SYMBICORT ASTRAZENECA UK 774.7 -6.4% 1.0%
20 -4 OCTANATE OCTAPHARMA 757.4 -9.8% 1.0%
Source: DSM Group. ISO 9001:2008 Note: the sales volume shown is in final consumer prices with VAT included.
The value of sales for the top 20 brands in 2012 amounted to 51.3% of the
sales value, which is 3.7% less than in 2011.
In 2012, MABTHERA became the new leader in brands, with a share of 10.9%.
VELCADE moved up to the second place with a share of 6.5%. But the leader of the
previous year, Gleevec, went down 2 positions to the third place with a share of
4.2%.
Two new players in the rating should be noted - hemostatic agents for the
treatment of hemophilia and other diseases associated with blood-clotting disorder

48
- KOATE-DVI (TALECRIS BIOTHERAPEUTICS INC and BAYER AG) and IMMUNATE
(BAXTER HEALTHCARE CORP).
New drugs made it to the DRP rating - drugs for the treatment of leukemia
FILACHROMIN FS (F-SINTEZ ZAO) and GENFATINIB (LABORATORY TUTEUR
S.A.C.I.F.I.A).
The weighted average price for the TOP 20 brands is very high - more than 8,
592 Rubles per package. The most expensive drug was the drug for the treatment
of such an orphan disease as Gaucher disease, CEREZYME (about 72,000 Rubles),
the "cheapest" drug was HUMULIN (about 722 rubles.), a genetically engineered
human insulin.
Most TOP 20 drugs and the three leaders belong to group [L] Antineoplastic
and immunomodulating agents (10 brands). ATC [B] Disorders of blood and
hemopoietic organs have the second place by this measure.
Most drugs in this rating are drugs provided under the "7 nosologies" program.
The hypoglycemic LANTUS, which ranks 5th in the TOP-20 list, is the leader of the
general list of subsidized drugs.
6. Segments by price in the DRP
As was mentioned above, in 2012, the average cost per package in the DRP
continued to grow and amounted to about 935 rubles. It should be noted that such
impressive result is observed neither in the commercial segment of the market, nor
in hospital procurement.
Since the DRP was introduced, the price structure in this market segment has
been continuously changing to feature expensive drugs more prominently. At the
end of 2012, the segment of expensive drugs priced from 500 Rubles took up 89%
of the sales value.
The drug consumption structure within the DRP is presented in Figure 20.
As is clear from the Figure, the average cost per package in the segments
has remained virtually the same, except for the expensive drug segment priced
above 10,000 Rubles. In the latter segment, the average price fell compared with
the previous year and amounted to about 30 thousand Rubles.
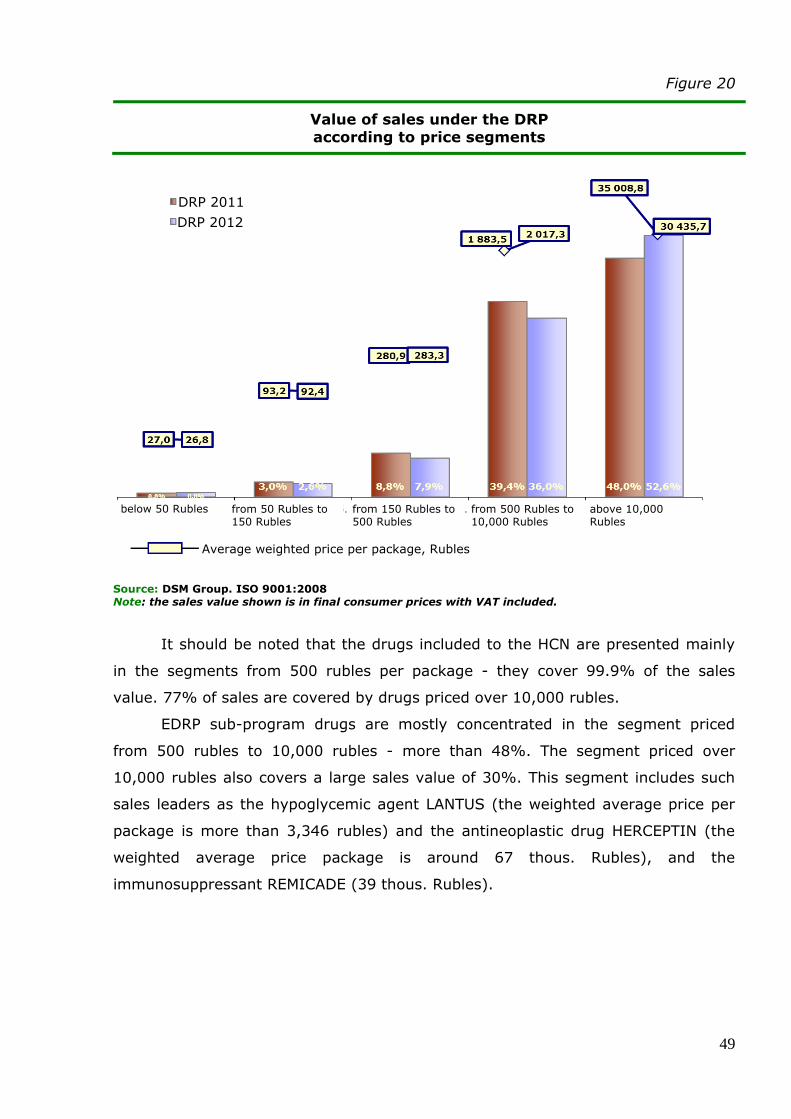
49
Figure 20
Value of sales under the DRP according to price segments
Source: DSM Group. ISO 9001:2008
Note: the sales value shown is in final consumer prices with VAT included.
It should be noted that the drugs included to the HCN are presented mainly
in the segments from 500 rubles per package - they cover 99.9% of the sales
value. 77% of sales are covered by drugs priced over 10,000 rubles.
EDRP sub-program drugs are mostly concentrated in the segment priced
from 500 rubles to 10,000 rubles - more than 48%. The segment priced over
10,000 rubles also covers a large sales value of 30%. This segment includes such
sales leaders as the hypoglycemic agent LANTUS (the weighted average price per
package is more than 3,346 rubles) and the antineoplastic drug HERCEPTIN (the
weighted average price package is around 67 thous. Rubles), and the
immunosuppressant REMICADE (39 thous. Rubles).
DRP 2011
DRP 2012
below 50 Rubles from 50 Rubles to 150 Rubles
from 150 Rubles to 500 Rubles
from 500 Rubles to 10,000 Rubles
above 10,000 Rubles
Average weighted price per package, Rubles
50
4. Sales value in the segment of health
care institutions (HCI)
Since 2011, Russia has pursued an active health system modernization
program. The main task of the modernization program is to raise medicine to a new
level. To make it affordable and high quality, and not only in the regional capital,
but also in the province. At the same time, doctors should provide treatment and
prevention. Morbidity is expected to decline and life expectancy - to increase.
The implementation of the modernization program seeks to achieve the
following objectives:
1. Reinforce the physical infrastructure of medical institutions.
2. Introduce modern information systems in health care.
3. Implement standards of health care delivery.
460 billion Rubles was allocated to implement the program. In 2011, the
federation units used only about 20% of the allocated amount. Active spending
came in the second half of 2012. Still, the program is not fully implemented. By the
end of the year, 70% of the budgeted money had been used. 8% of health care
providers did not complete overhaul. Only 12.7% of the HCI's in the plan finished
the full scope of medical equipment deliveries. There are only 3 units of the Russian
Federation not connected to the Unified Doctor Appointment Registration System.
The plan is to continue with the health care system modernization in 2013.
As part of and in connection with the program implementation, we have
observed steady growth of the HCI segment in recent years, as well as a qualitative
change in the structure of purchased drugs. At the end of 2012, the market for this
segment grew by 11.7% in Ruble terms (compared to 2011) and amounted to 157
billion Rubles. In volume terms, the volume of drugs purchased in 2012 amounted
to about 1.1 billion packages, which is also 8.3% higher than in the previous year.
Let us consider the basic pharmacoeconomic indicators of the hospital
procurement segment.
The cost of one RTU drug package purchased by an HCI amounted to an
average of 143 rubles. Compared to 2011, the increase of average price of package
in the HCI segment was about 3.1%.

51
As in the previous year, in the HCI segment, imported products accounted for
the largest share by sales value, while domestic drugs lead by volume in packages.
Thus, in volume terms, two times as much domestic drugs, as the cheaper ones,
are procured compared to imported drugs. Domestic drugs take up about 30% of
the money volume and 67% in volume terms. Nonetheless, compared to 2011,
their share in sales value, and especially in physical volume decreased (Figure 21),
while the share of imported drug procurement in 2012 increased.
Figure 21
Ratio of imported and domestic RTU drug sales
Source: DSM Group. ISO 9001:2008 Note: the sales value shown is in final consumer prices with VAT included.
The imported drugs procurement in 2012 grew in rubles by 15%, and that of
domestic drugs - by 6%. In volume terms, the volume of imported drug
procurement was up 58%, while the volume domestic drug procurement fell by 6%.
A package of an imported drug costs almost 5 times as much as a package of
a domestic drug purchased by HCI's: in 2012, one imported RTU drug package on
average cost 299 Rubles, a domestic package cost 64 Rubles. Compared with the
previous year, the gap between the cost of an imported package and a domestic
package narrowed: in 2011 imported drugs were 7 times as expensive as
domestics. Compared to 2011, the cost of a purchased imported drug package fell
by 27.5%, and one domestic package in 2012 cost the hospitals 12.8% more. Thus,
in 2012, HCI's purchased more imported drugs though of the cheaper variety (than
Sales value Real volume
Imports
Domestics

52
in the previous year) and fewer domestic drugs though of the more expensive
variety (as compared to 2011).
The structure of HCI segment by price category is shown in Figure 22.
Sorting the drugs into price categories revealed that in 2012 all segments
showed an increase in sales value, with the exception of the 50 to 150 Ruble
segment, where the procurement volume shrank by 4%.
Figure 22
Structure of HCI segment by price category in 2011 and 2012
Source: DSM Group. ISO 9001:2008 Note: the sales value shown is in final consumer prices with VAT included.
The most capacious segment is the segment of drugs priced above 500 Rubles,
and its share increased by almost 1% due to reduced procurement volumes in the
50 to 150 Ruble segment. In 2012, it took about 61.9% of the sales value of the
HCI sector sales value, and only 4.1% in volume terms. Note that the average cost
of one package in the segment priced above 500 rubles is about 2160 Rubles,
below 50 Rubles from 50 Rubles to 150 Rubles
from 150 Rubles to 500 Rubles
above 500 Rubles
Average weighted price per package, Rubles
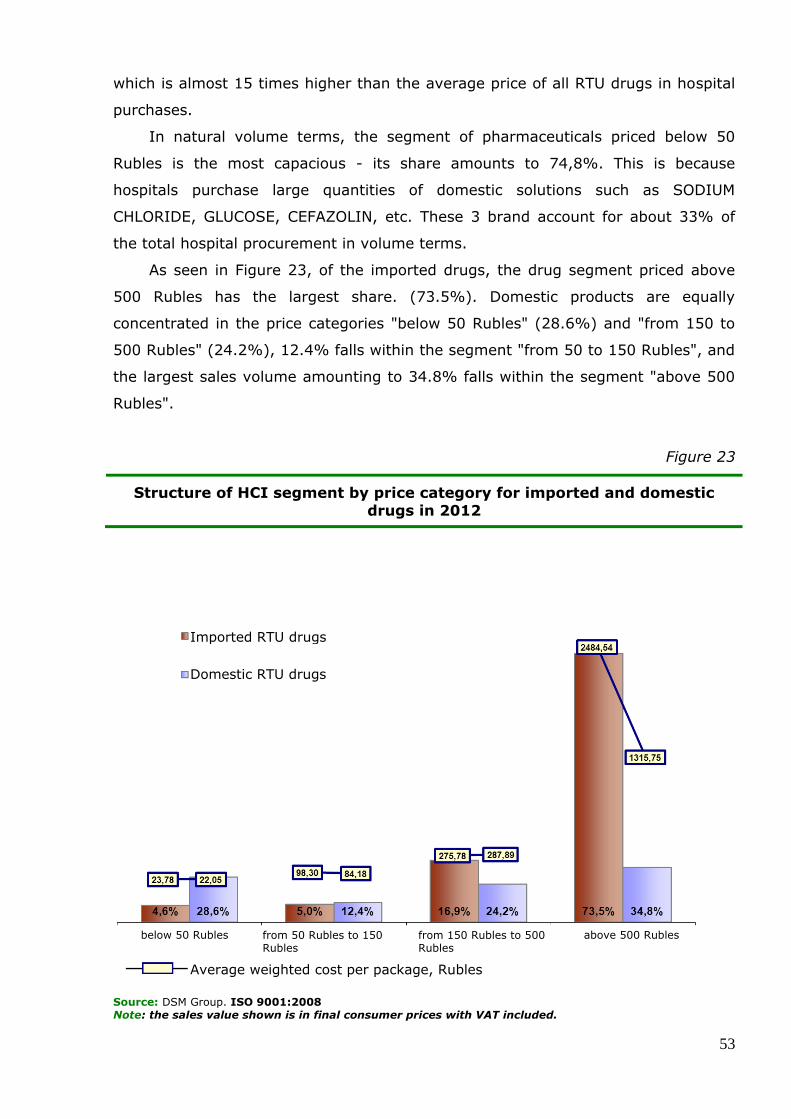
53
which is almost 15 times higher than the average price of all RTU drugs in hospital
purchases.
In natural volume terms, the segment of pharmaceuticals priced below 50
Rubles is the most capacious - its share amounts to 74,8%. This is because
hospitals purchase large quantities of domestic solutions such as SODIUM
CHLORIDE, GLUCOSE, CEFAZOLIN, etc. These 3 brand account for about 33% of
the total hospital procurement in volume terms.
As seen in Figure 23, of the imported drugs, the drug segment priced above
500 Rubles has the largest share. (73.5%). Domestic products are equally
concentrated in the price categories "below 50 Rubles" (28.6%) and "from 150 to
500 Rubles" (24.2%), 12.4% falls within the segment "from 50 to 150 Rubles", and
the largest sales volume amounting to 34.8% falls within the segment "above 500
Rubles".
Figure 23
Structure of HCI segment by price category for imported and domestic
drugs in 2012
Source: DSM Group. ISO 9001:2008 Note: the sales value shown is in final consumer prices with VAT included.
below 50 Rubles from 50 Rubles to 150 Rubles
from 150 Rubles to 500 Rubles
above 500 Rubles
Average weighted cost per package, Rubles
Imported RTU drugs
Domestic RTU drugs

54
If in the segments with the cost of a package below 500 Rubles the difference
between the weighted average price of imported and domestic drugs is not as
noticeable, in the most capacious segment "above 500 rubles", imported drugs are
almost 2 times as expensive as domestics.
The ratio of RTU drug hospital procurement by Level I ATC group in Russia for
2012 is shown in Table 11.
The HCI segment drug rating by ATC group considerably differs from the
commercial market. The three leading ATC groups did not change compared to
2011. The undisputed leader in hospital purchases is group [J] Anti-infectives for
systemic use. If in 2011 this group showed a decrease in sales value compared to
the previous similar period, by the end of 2012, this group showed the greatest
increase in sales of all ACT Level I groups, both in rubles (+45%) and in packages
(21%).
Sales growth in group [J] was mainly due to increased hospital procurement of
antivirals for systemic use [J05] (+73% in Rubles) and drugs for treatment of
tuberculosis [J04] (+77% in Rubles). Positive growth was observed for the most
capacious sub-segment of group [J] - [J01] antibacterials for systemic use (+34%).
The total share in rubles for these 3 subgroups was approximately 83.6%.
An increase in purchases in subgroup [J05] mostly affected drugs for the
treatment of the HIV infection, such as KALETRA, PREZISTA, REYATAZ, ISENTRESS,
etc.

55
Table 11
Structure of RTU drug hospital procurement by ATC group in 2012
Level I ATC groups Sales value, mln Rubles
The group's share in
sales value,
%
Actual volume,
million packs
The group's share in the
actual
volume, %
J: Antiinfectives for systemic use 58,831.0 37.4% 360.1 32.6%
B: Blood and blood forming organs 30,629.6 19.5% 387.8 35.2%
L: Antineoplastic and
immunomodulating agents 17,965.8 11.4% 11.5 1.0%
N: Nervous system 14,889.9 9.5% 101.2 9.2%
A: Alimentary tract and metabolism 11,379.3 7.2% 77.0 7.0%
C: Cardiovascular system
6,457.9 4.1% 52.3 4.7%
V: Various 3,836.6 2.4% 9.2 0.8%
M: Musculo-skeletal system 3,683.1 2.3% 21.0 1.9%
R: Respiratory system 3,406.0 2.2% 29.3 2.7%
H: Systemic hormonal preparations,
excluding sex hormones 2,208.6 1.4% 14.5 1.3%
G: Genito-urinary system and sex
hormones 1,710.6 1.1% 3.0 0.3%
D: Dermatologicals 1,006.7 0.6% 29.1 2.6%
S: Sensory organs 898.9 0.6% 5.6 0.5%
[~] Pharmaceuticals without an ATC
group 327.8 0.2% 1.2 0.1%
P: Antiparasitic products, insecticides
and repellents 36.5 0.02% 0.3 0.03%
Source: DSM Group. ISO 9001:2008 Note: the sales value shown is in final consumer prices with VAT included.
In subgroup [J04], the largest share of purchases fell to antibiotics [J04AB]
and aminosalicylic acid and derivatives [J04AA]. These subgroups account for more
than 80% in Rubles and also showed the greatest gains compared to 2011: for
[J04AB] +104%, and for [J04AA] +89%. High growth in subgroup [J04] is mainly
due to increased procurement of AMINOSALICYLIC ACID, drugs for treatment of
tuberculosis TERIZIDONE and CAPREOSTAT, etc.
Sales of the most capacious subsegment in group [J] - Antibacterial drugs for
systemic use [J01], which accounted in 2012 for 45% of the value of procurement
56
in the entire subgroup [J01], compared to 2011, consolidated their positions and
rose in Rubles (+34%) and packages (+14%). Of the procurement leaders in this
subsegment, most sales growth was identified for the brands CEFTRIABOL,
AVELOX, LEVOFLOXACIN, CEFOGRAM, etc., and the best-selling brand in [J01] - the
carbapenem antibiotic MEROPENEM - showed a 31% decline in purchases.
If in 2011, the sub-segment of vaccines [J07] was noted for one of the most
significant drops in purchases, in 2012 it showed an increase in sales compared to
the previous period. Thus, purchases of myelitis vaccines increased, particularly for
POLIORIX, which led to a high gain in the subsegment. In addition to the myelitis
vaccines (17.2% share in [J07], gain of +211%), the leaders in the subgroup in
procurement volume are hepatitis vaccines (18.9% share in [J07], gain of +26%)
and rabies vaccines (12.7% share in [J07], gain of +11%)
Based on the results of 2012, group [B] Blood and blood forming organs took
the second place in the ATC group rating in the hospital segment. Compared to
2011, the number of purchased drug packages of this group increased by 21%, and
HCI spending for procurement - by 14%. The largest volume of funds falls to the
drugs in subgroup [B05] Plasma substitutes and perfusion solutions (a share of
55% in Rubles in group [B]). The most "procured" drug, as in 2011, continues to be
SODIUM CHLORIDE which is widely used as a solvent for many drugs administered
by injection and infusion.
Group [L] Antineoplastic and immunomodulating agents ranks third.
Compared with the previous year, procurement of drugs in this group decreased by
13% in money terms and by 6% in packages. The most capacious subgroup
continues to be [L01] Antineoplastic agents which account for 70% of the total
costs across the subgroup. While drugs based on the INN Docetaxel led INN
purchases in money terms and the situation here changes every year, in volume
terms in 2012, as well as for the previous years, at the top of group [L] is the
antineoplastic drugs INN CYCLOPHOSPHAMIDE with a share of 23% which have a
low price (about 48 Rubles per package).
Table 12 ranks the TOP 20 manufacturers in the HCI segment based on the
results of 2012.

57
Table 12
TOP 20 manufacturers in the HCI segment based on the results of
2012
Source: DSM Group. ISO 9001:2008 Note: the sales value shown is in final consumer prices with VAT included.
If in the previous two years, the three leaders in the manufacturer's rating had
been the same, 2012 brought about serious changes. GLAXOSMITHKLINE took the
first place in 2012, with a share of 5.7%, ahead of its nearest rival in the past year
- SANOFI-AVENTIS (5.1% share). GLAXOSMITHKLINE was in the first place thanks
to substantially increased (3000-fold) procurement of the myelitis vaccine
POLIORIX and of the brands for the treatment of the HIV infection - ZIAGEN,
EPIVIR 3TC, TELZIR, the anticoagulant FRAXIPARINE and other brands.
ABBOTT ranked third with a share of 4.6%, having moved 6 lines up and
demonstrated the strongest sales growth of the TOP-10 manufacturers (138.7%).
ABBOTT made it to the top three companies by acquiring SOLVAY PHARMA back in
2011. ABBOTT significantly reinforced its positions, including the hospital
procurement segment, thanks to the merger and revision of the portfolios of the
Rati
ng
of
20
12
Ch
an
ge
Manufacturer
Sales value, mln Rubles
2012
Sales value
increase Share
1 +1 GLAXOSMITHKLINE 8,758.5 24.9% 5.7%
2 -1 SANOFI 7,890.0 -2.7% 5.1%
3 +6 ABBOTT 7,036.1 138.7% 4.6%
4 -1 F.HOFFMANN-LA ROCHE 5,314.5 -13.5% 3.4%
5 -1 MERCK 5,242.3 3.8% 3.4%
6 -1 NOVARTIS 4,371.5 -10.8% 2.8%
7 +1 TAKEDA 4,309.5 36.1% 2.8%
8 -2 ASTRAZENECA 3,731.7 -11.7% 2.4%
9 +11 JANSSEN PHARMACEUTICA 3,156.1 70.9% 2.0%
10 +5 ABOLMED 3,069.4 35.0% 2.0%
11 +19 KRASFARMA 2,962.1 116.9% 1.9%
12 +7 MICROGEN 2,938.9 47.8% 1.9%
13 -1 PFIZER 2,658.0 -4.2% 1.7%
14 -4 BIOTEC MFPDK 2,552.8 -11.1% 1.7%
15 -4 TEVA PHARMACEUTICAL 2,486.7 -12.3% 1.6%
16 0 SINTEZ AKO 2,381.3 9.8% 1.5%
17 -10 VEROPHARM 2,327.7 -29.5% 1.5%
18 -5 GEDEON RICHTER 2,311.5 -6.7% 1.5%
19 +2 BAYER 2,207.2 28.0% 1.4%
20 -3 BRISTOL-MYERS SQUIBB 2,169.2 1.5% 1.4%

58
two companies. In addition, some of the company's drugs generated substantially
increased sales. The leading hospital purchase is KALETRA, a drug for the treatment
of the HIV infection. It experienced a 8.5-fold increase in procurement, compared
to the previous year. PROPOFOL, a drug for general anesthesia, generated 20x
more sales, and the antiviral drug SINAGIS generated 4x more sales.
Compared to the previous year, the TOP-20 rating now includes JANSSEN
PHARMACEUTICA (+11 positions and 9th place) and KRASFARMA (+19 positions
and 11th place). These companies showed the strongest growth in hospital
purchases: +70.9% and +116.9%, respectively.
KRASFARMA's high gain was due to increased purchases of drugs such as
LEVOFLOXACIN (23x increase), VANCOMYCIN (75x increase), and CEFUROXIME
(125x increase).
JANSSEN PHARMACEUTICA showed +70.9% growth in Rubles mainly due to
increased purchases of drugs for the treatment of the HIV infection - PREZISTA
(3.8x increase) and INTELENCE (3.5x increase).
The maximum decline in purchases, as compared to 2011, was noted for
VEROPHARM (-29.5%) which "rolled back" in the ranking from the 7th to the 17th
place. This significant decline was because hospitals reduced purchases of some of
the core drugs produced by the company. These are mostly the antineoplastic
drugs, such as PACLITAXEL, TAUTAX, DOXORUBICIN-LENS, VERO VANCOMYCIN,
etc.
Thus, compared to 2011, the reason for the changed positions of the
manufacturers was largely the increased purchases of drugs for the treatment of
the HIV infection, as well as anti-TB drugs, and reduced purchases of
antineoplastics. Importantly, as regards the HIV drugs, instead of growing
purchases we should rather talk of recovering the necessary level of coverage
provided by these drugs that was lowered in the previous year.
Table 13 ranks the TOP 20 brands in the HCI segment based on the results of
2012.
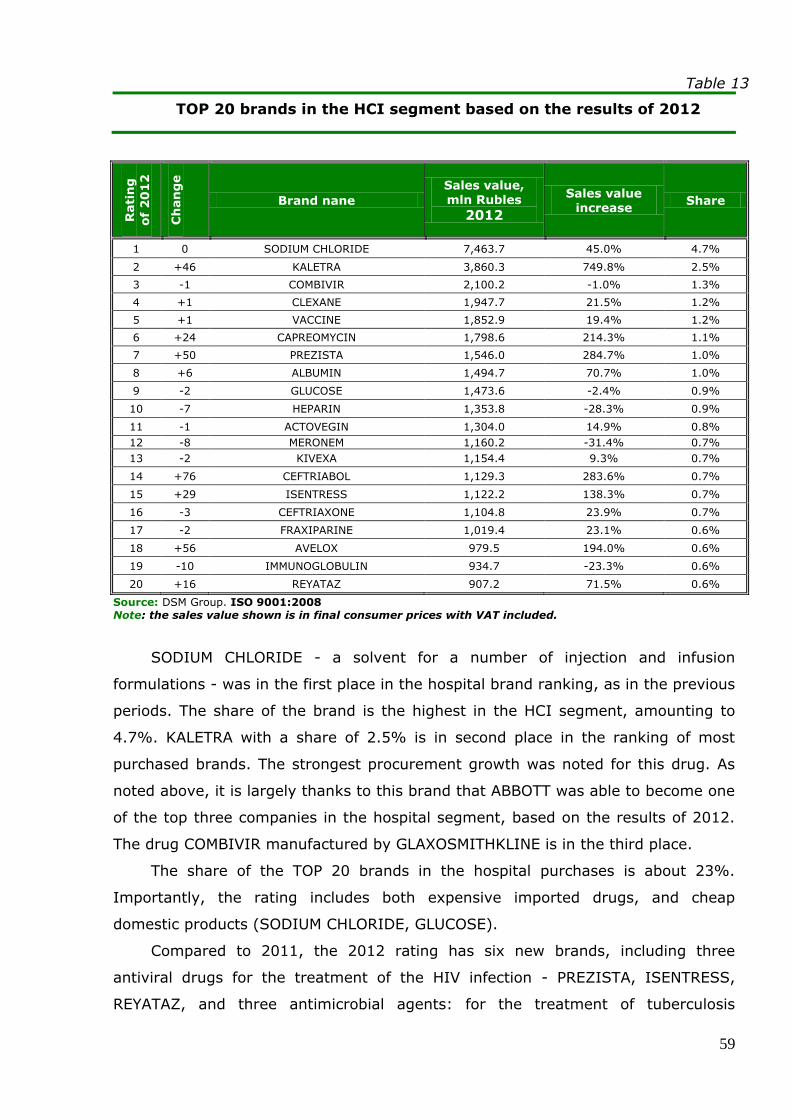
59
Table 13
TOP 20 brands in the HCI segment based on the results of 2012
Source: DSM Group. ISO 9001:2008 Note: the sales value shown is in final consumer prices with VAT included.
SODIUM CHLORIDE - a solvent for a number of injection and infusion
formulations - was in the first place in the hospital brand ranking, as in the previous
periods. The share of the brand is the highest in the HCI segment, amounting to
4.7%. KALETRA with a share of 2.5% is in second place in the ranking of most
purchased brands. The strongest procurement growth was noted for this drug. As
noted above, it is largely thanks to this brand that ABBOTT was able to become one
of the top three companies in the hospital segment, based on the results of 2012.
The drug COMBIVIR manufactured by GLAXOSMITHKLINE is in the third place.
The share of the TOP 20 brands in the hospital purchases is about 23%.
Importantly, the rating includes both expensive imported drugs, and cheap
domestic products (SODIUM CHLORIDE, GLUCOSE).
Compared to 2011, the 2012 rating has six new brands, including three
antiviral drugs for the treatment of the HIV infection - PREZISTA, ISENTRESS,
REYATAZ, and three antimicrobial agents: for the treatment of tuberculosis
Rati
ng
of
20
12
Ch
an
ge
Brand nane
Sales value, mln Rubles
2012
Sales value increase
Share
1 0 SODIUM CHLORIDE 7,463.7 45.0% 4.7%
2 +46 KALETRA 3,860.3 749.8% 2.5%
3 -1 COMBIVIR 2,100.2 -1.0% 1.3%
4 +1 CLEXANE 1,947.7 21.5% 1.2%
5 +1 VACCINE 1,852.9 19.4% 1.2%
6 +24 CAPREOMYCIN 1,798.6 214.3% 1.1%
7 +50 PREZISTA 1,546.0 284.7% 1.0%
8 +6 ALBUMIN 1,494.7 70.7% 1.0%
9 -2 GLUCOSE 1,473.6 -2.4% 0.9%
10 -7 HEPARIN 1,353.8 -28.3% 0.9%
11 -1 ACTOVEGIN 1,304.0 14.9% 0.8%
12 -8 MERONEM 1,160.2 -31.4% 0.7%
13 -2 KIVEXA 1,154.4 9.3% 0.7%
14 +76 CEFTRIABOL 1,129.3 283.6% 0.7%
15 +29 ISENTRESS 1,122.2 138.3% 0.7%
16 -3 CEFTRIAXONE 1,104.8 23.9% 0.7%
17 -2 FRAXIPARINE 1,019.4 23.1% 0.6%
18 +56 AVELOX 979.5 194.0% 0.6%
19 -10 IMMUNOGLOBULIN 934.7 -23.3% 0.6%
20 +16 REYATAZ 907.2 71.5% 0.6%

60
(CAPREOMYCIN), diseases of the respiratory system (AVELOX) and the broad
spectrum cephalosporin antibiotic CEFTRIABOL.
61
5. Nutritional supplements
Nutritional supplements (NS) in pharmacies and on the Russian market have
long been a recurring issue in debates. Periodically, proposals are tabled to tighten
control over the circulation of nutritional supplements. Still another wave came at
the end of 2012.
To prevent the convergence of nutritional supplements and drugs under the
same brand name, the Federal Antimonopoly Service proposed that the Ministry of
Health register nutritional supplements in the same way as drugs. In that case,
manufacturers of supplements would have to spend millions of dollars on clinical
trials, and the time of the registration procedure would increase to 1.5 to 2 years.
The FAS has argued for several years on the advisability of regulating nutritional
supplements with the law On Circulation of Drugs. Today, however, the market
offers products that are positioned as both drugs and supplements, which misleads
consumers.
The All-Russian Public Opinion Research Center (VTsIOM) presented data3 on
the level of awareness the Russians have with respect to nutritional supplements,
and on how widespread the use of nutritional supplements among our fellow
citizens is. For most Russians, a nutritional supplement is an addition to food. 60%
of the respondents think so. 16% of the respondents say that nutritional
supplements are vitamins. Only 5% of respondents believe that nutritional
supplements are drugs.
Every fourth Russian takes nutritional supplements with varying degree of
frequency. Every tenth respondent occasionally consumes supplements (only
subject to deterioration of health), one in five respondents takes nutritional
supplements seasonally, and 6% follow a regimen. Only 2% do so on a regular
basis.
Where to sell nutritional supplements is another topic for debate. Many
legislators believe that nutritional supplements should be removed from pharmacies
and sold in special sectors of stores. And the Russian State Duma will soon consider
appropriate amendments to the laws.
3 The All-Russian opinion poll was conducted December 1-2, 2012 among 1,600 people in 138 villages
in 46 regions and republics of Russia.

62
As of now, most of the Russians who take nutritional supplements buy them at
pharmacies (70%). And we hope that this situation will not change.
As can be seen from Figure 24, in 2012 pharmacies sold about 294 million
packages of nutritional supplements for a total of about 22.2 billion Rubles in
wholesale prices and 29.8 billion Rubles in retail prices. The growth in value terms
(in pharmacy purchase prices) amounted to 18.6%, sales in packages slightly
declined, compared to 2011 (-0.7%). Thus, we can conclude that the observed
increase in sales in Rubles is exclusively due to growing prices for nutritional
supplements. So, if in 2011, the cost per one conditional package of a nutritional
supplement was 63.1 Rubles, in 2012, it was 75.7 Rubles, which is 19.9% higher.
Figure 24
Sales of nutritional supplements in Russia in 2011-2012
Source: Monthly retail audit of the pharmaceutical market in the Russian Federation, DSM Group. ISO
9001:2008 Note: Sales value are given in pharmacy purchase prices, VAT included.
NS price dynamics was analyzed using the Laspeyres price index (Figure 25).
Sales value, mln Rubles
Real volume, mln packs
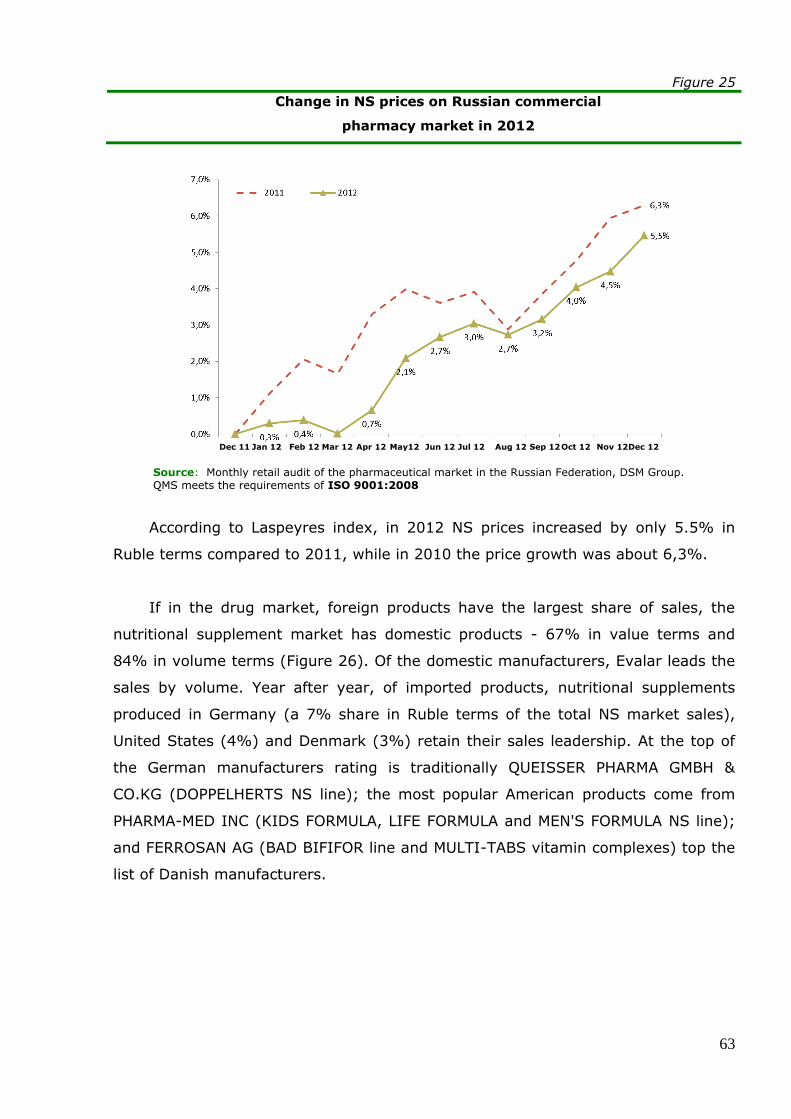
63
Figure 25
Change in NS prices on Russian commercial
pharmacy market in 2012
Source: Monthly retail audit of the pharmaceutical market in the Russian Federation, DSM Group.
QMS meets the requirements of ISO 9001:2008
According to Laspeyres index, in 2012 NS prices increased by only 5.5% in
Ruble terms compared to 2011, while in 2010 the price growth was about 6,3%.
If in the drug market, foreign products have the largest share of sales, the
nutritional supplement market has domestic products - 67% in value terms and
84% in volume terms (Figure 26). Of the domestic manufacturers, Evalar leads the
sales by volume. Year after year, of imported products, nutritional supplements
produced in Germany (a 7% share in Ruble terms of the total NS market sales),
United States (4%) and Denmark (3%) retain their sales leadership. At the top of
the German manufacturers rating is traditionally QUEISSER PHARMA GMBH &
CO.KG (DOPPELHERTS NS line); the most popular American products come from
PHARMA-MED INC (KIDS FORMULA, LIFE FORMULA and MEN'S FORMULA NS line);
and FERROSAN AG (BAD BIFIFOR line and MULTI-TABS vitamin complexes) top the
list of Danish manufacturers.
Dec 11 Jan 12 Feb 12 Mar 12 Apr 12 May12 Jun 12 Jul 12 Aug 12 Sep 12 Oct 12 Nov 12 Dec 12

64
Figure 26
Sales of domestic and imported NS
by country
Source: Monthly retail audit of the pharmaceutical market in the Russian Federation, DSM Group. ISO
9001:2008 Note: Sales value are given in pharmacy purchase prices, VAT included.
Imported nutritional supplements, like imported drugs, are more expensive
than domestics: the price of one package of imported nutritional supplements was
157.8 Rubles, that of a domestic was 60.1 Rubles. In 2012, domestic nutritional
supplements became pricier (+17.1%) than the imported ones (+16.5%).
It should be noted that in 2012 consumers became more willing to purchase
more expensive nutritional supplements. While in the past year, the bulk of sales
came from the 50 to 150 Ruble price range, by the end 2012, around 33.9% of
sales in money terms came from nutritional supplements, the weighted average
price per conditional package ranged between 150 to 500 Rubles. Approximately
30.4% came from the NS's priced from 50 to 150 Rubles, expensive NS's (priced
above 500 rubles) had 21.9%, while the cheapest NS's (below 50 Rubles) had 14%
of sales in Rubles.
Russia Imports
Germany
USA
Denmark
Malaysia
Netherlands
Canada
China
Other countries
Sales value
Real volume
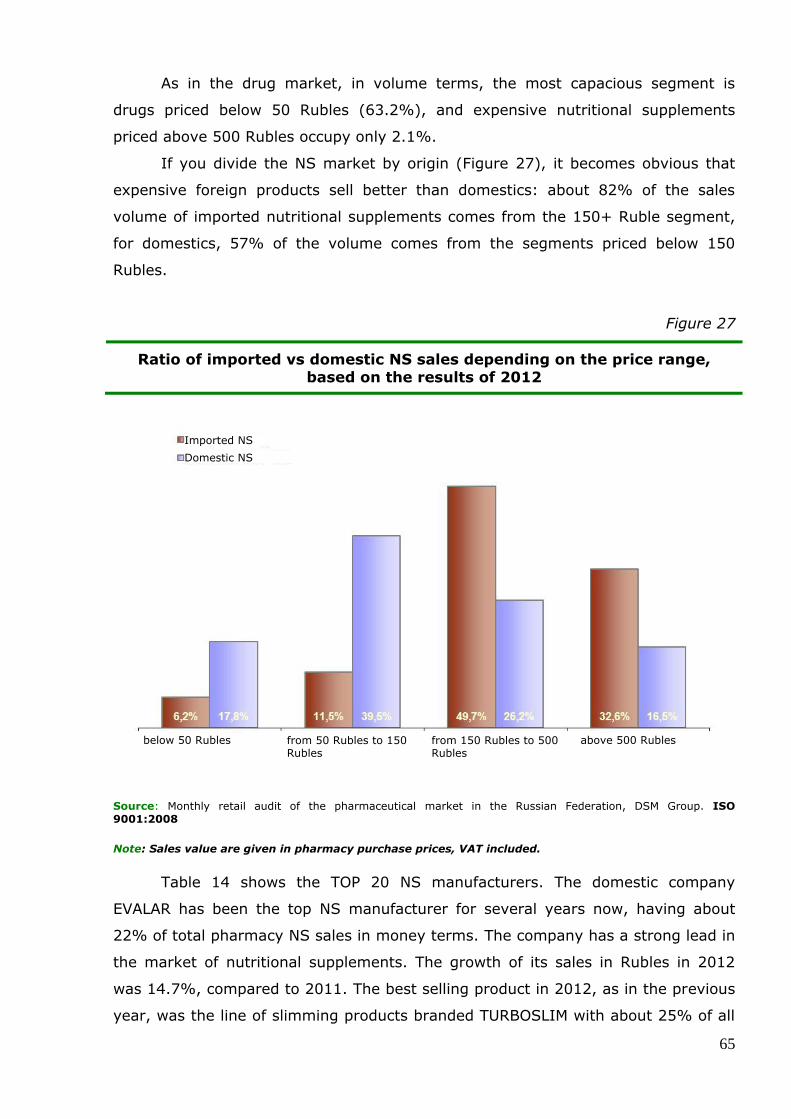
65
As in the drug market, in volume terms, the most capacious segment is
drugs priced below 50 Rubles (63.2%), and expensive nutritional supplements
priced above 500 Rubles occupy only 2.1%.
If you divide the NS market by origin (Figure 27), it becomes obvious that
expensive foreign products sell better than domestics: about 82% of the sales
volume of imported nutritional supplements comes from the 150+ Ruble segment,
for domestics, 57% of the volume comes from the segments priced below 150
Rubles.
Figure 27
Ratio of imported vs domestic NS sales depending on the price range,
based on the results of 2012
Source: Monthly retail audit of the pharmaceutical market in the Russian Federation, DSM Group. ISO
9001:2008 Note: Sales value are given in pharmacy purchase prices, VAT included.
Table 14 shows the TOP 20 NS manufacturers. The domestic company
EVALAR has been the top NS manufacturer for several years now, having about
22% of total pharmacy NS sales in money terms. The company has a strong lead in
the market of nutritional supplements. The growth of its sales in Rubles in 2012
was 14.7%, compared to 2011. The best selling product in 2012, as in the previous
year, was the line of slimming products branded TURBOSLIM with about 25% of all
Imported NS
Domestic NS
from 50 Rubles to 150 Rubles
from 150 Rubles to 500 Rubles
above 500 Rubles below 50 Rubles
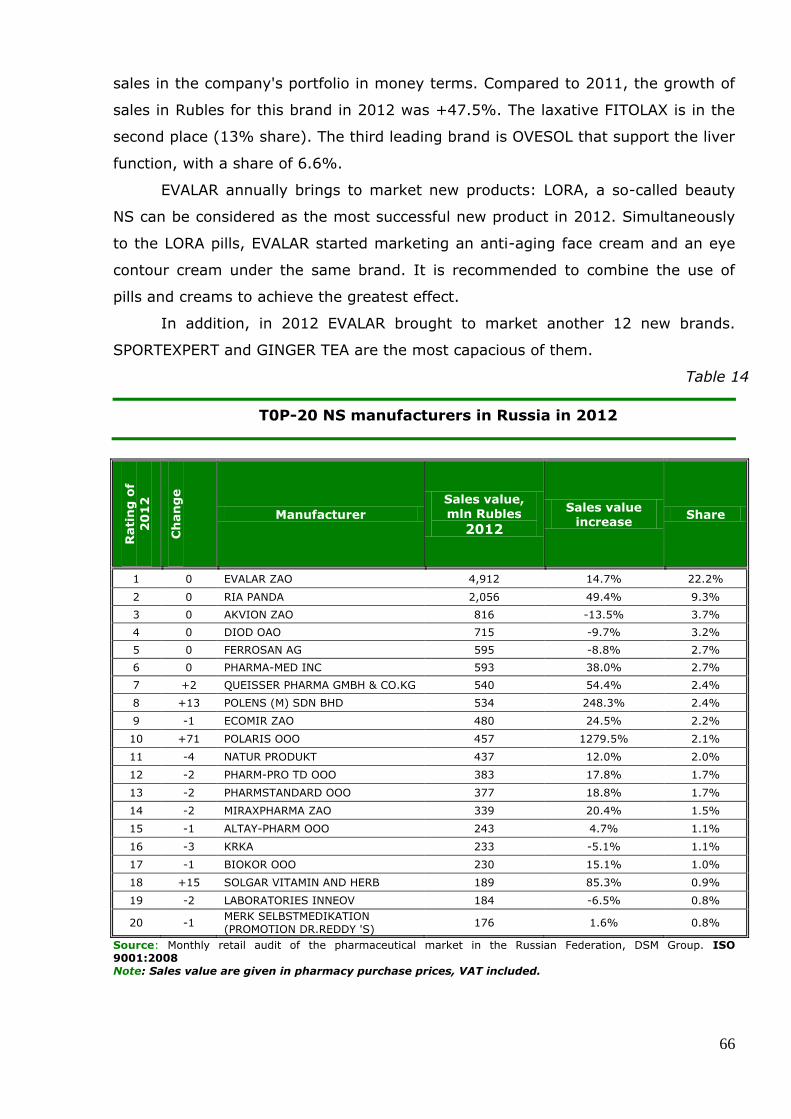
66
sales in the company's portfolio in money terms. Compared to 2011, the growth of
sales in Rubles for this brand in 2012 was +47.5%. The laxative FITOLAX is in the
second place (13% share). The third leading brand is OVESOL that support the liver
function, with a share of 6.6%.
EVALAR annually brings to market new products: LORA, a so-called beauty
NS can be considered as the most successful new product in 2012. Simultaneously
to the LORA pills, EVALAR started marketing an anti-aging face cream and an eye
contour cream under the same brand. It is recommended to combine the use of
pills and creams to achieve the greatest effect.
In addition, in 2012 EVALAR brought to market another 12 new brands.
SPORTEXPERT and GINGER TEA are the most capacious of them.
Table 14
T0P-20 NS manufacturers in Russia in 2012
Source: Monthly retail audit of the pharmaceutical market in the Russian Federation, DSM Group. ISO
9001:2008 Note: Sales value are given in pharmacy purchase prices, VAT included.
Rati
ng
of
20
12
Ch
an
ge
Manufacturer
Sales value,
mln Rubles
2012
Sales value increase
Share
1 0 EVALAR ZAO 4,912 14.7% 22.2%
2 0 RIA PANDA 2,056 49.4% 9.3%
3 0 AKVION ZAO 816 -13.5% 3.7%
4 0 DIOD OAO 715 -9.7% 3.2%
5 0 FERROSAN AG 595 -8.8% 2.7%
6 0 PHARMA-MED INC 593 38.0% 2.7%
7 +2 QUEISSER PHARMA GMBH & CO.KG 540 54.4% 2.4%
8 +13 POLENS (M) SDN BHD 534 248.3% 2.4%
9 -1 ECOMIR ZAO 480 24.5% 2.2%
10 +71 POLARIS OOO 457 1279.5% 2.1%
11 -4 NATUR PRODUKT 437 12.0% 2.0%
12 -2 PHARM-PRO TD OOO 383 17.8% 1.7%
13 -2 PHARMSTANDARD OOO 377 18.8% 1.7%
14 -2 MIRAXPHARMA ZAO 339 20.4% 1.5%
15 -1 ALTAY-PHARM OOO 243 4.7% 1.1%
16 -3 KRKA 233 -5.1% 1.1%
17 -1 BIOKOR OOO 230 15.1% 1.0%
18 +15 SOLGAR VITAMIN AND HERB 189 85.3% 0.9%
19 -2 LABORATORIES INNEOV 184 -6.5% 0.8%
20 -1 MERK SELBSTMEDIKATION
(PROMOTION DR.REDDY 'S) 176 1.6% 0.8%

67
For a second consecutive year, RIA-PANDA ranks second in the NS sales
rating. The share of this company increased from the previous year, amounting to
about 9.3%. The company had a high sales growth (+49.4%).
However, it is substantially behind the leading company EVALAR, so a change of
leadership in the coming years is unlikely.
Major sales of RIA PANDA (84% of the sales value in its portfolio) come from
two products for correcting erectile dysfunction - SEALEKS FORTE and ALI CAPS,
with shares of 52.4% and 31.6%, respectively, of the sales volume of the company.
In this case, as in the past year, these NS's were noted for high positive growth in
money: sales of ALI CAPS increased by 96.1%, and sales of SEALEX FORTE
increased by 30.2%. In addition, in 2012, RIA PANDA introduced 31 new brands,
with NABISS and ARTRODOK becoming the best sellers.
AKVION is in the third place. A drop in sales was noted for this company for a
second year in a row. At the end of 2011, AKVION was the only TOP-3
manufacturer with declining sales in money. In 2012, this manufacturer showed the
highest sales volume decline in value terms of the TOP-10 companies (-13.5%
compared to 2011). This situation is primarily due to the fact that the company had
previously produced only nutritional supplements, and in 2010 it moved a part of
the line of one of its core brands KUDESAN from NS to drugs. Because of this, the
company lost a share in the rating of the NS manufacturers. However, if we analyze
the total pharmacy sales of the products (drugs and NS's) manufactured by
AKVION, we will see that in value terms, the company's sales volume increased by
0.7%, compared to 2011, with the package sales falling 4% however. In general,
KUDESAN brand sales (drugs and nutritional supplements) also demonstrate
positive growth in monetary terms (+6.5%). However, the share loss in the NS
segment was not only due to the re-registration of KUDESAN, of the NS's offered by
the company, sales declined for such brands such as ALPHAVIT (-7.3%) and FOCUS
(-11%), as compared to 2011.
Returning to the TOP 20 manufacturers, we will note that the greatest
increase in money was observed for POLARIS OOO due to the dramatically
increased sales of the slimming NS REDUXIN LIGHT (+1955%, compared to 2011).
In 2012, the company also launched a new nutritional supplement that promotes
normalization of lipid metabolism - ATLANTINOL.
Let us consider the NS brand sales, based on the results of 2012 (Table 15).
Since the KAPILAR brand gave up its top place in the NS rating, the struggle for the
top spot has been on. In 2010, the TURBOSLIM line took this position. In 2011, the

68
situation changed again: NS SEALEX FORTE (RIA PANDA) had maximum sales
value, slightly ahead of TURBOSLIM. Based on the results of 2012, the TURBOSLIM
brand regained its sales leadership with a share of 5.5%.
The biggest sales growth (1,954.5% compared to 2011) of the TOP 20 brands
was noted for REDUXINE LIGHT, as a result of which the supplement moved 152
lines up compared with the previous year. High sales growth was also noted for the
SUPRADIN brand in the form of chewable vitamins and gel for children.
Table 15
T0P-20 NS brands by sales in Russia in 2012
Source: Monthly retail audit of the pharmaceutical market in the Russian Federation, DSM Group. ISO
9001:2008 Note: Sales value are given in pharmacy purchase prices, VAT included.
Manufacturers market the nutritional supplements as the means for the
prevention and/or treatment of various diseases. It is not very convenient to use
Rati
ng
of
20
12
Ch
an
ge
Brand name Manufacturer
Sales value, mln Rubles
2012
Sales value increase
Share
1 +1 TURBOSLIM EVALAR ZAO 1,212 47.5% 5.5%
2 -1 SEALEX FORTE RIA PANDA 1,077 30.2% 4.9%
3 +3 ALI CAPS RIA PANDA 649 96.1% 2.9%
4 0 FITOLAX EVALAR ZAO 637 14.3% 2.9%
5 -2 ALPHAVIT AKVION ZAO 541 -7.3% 2.4%
6 0 DOPPELHERZ QUEISSER PHARMA
GMBH & CO.KG 540 54.4% 2.4%
7 +20 TONGKAT POLENS (M) SDN
BHD 519 238.4% 2.3%
8 -3 HEMATOGEN Various
manufacturers 482 -3.3% 2.2%
9 +152 REDUXIN LIGHT POLARIS OOO 441 1954.5% 2.0%
10 -2 OVESOL EVALAR ZAO 324 11.1% 1.5%
11 -4 CI-CLIM EVALAR ZAO 306 3.5% 1.4%
12 +1 INDINOL MIRAXPHARMA ZAO 297 15.5% 1.3%
13 -4 MOTHERWORT Various
manufacturers 277 -3.8% 1.3%
14 -3 BIFIFORM FERROSAN AG 254 -3.9% 1.1%
15 0 LUTEIN Various
manufacturers 250 6.0% 1.1%
16 +61 SUPRADIN BAYER AG 244 305.3% 1.1%
17 -7 BLUEBERRY-FORTE EVALAR ZAO 232 -18.8% 1.0%
18 -4 CAPILAR DIOD OAO 228 -6.2% 1.0%
19 +4 MEN'S FORMULA PHARMA-MED INC 200 25.0% 0.9%
20 +4 NATURINO NATUR PRODUKT 193 21.0% 0.9%
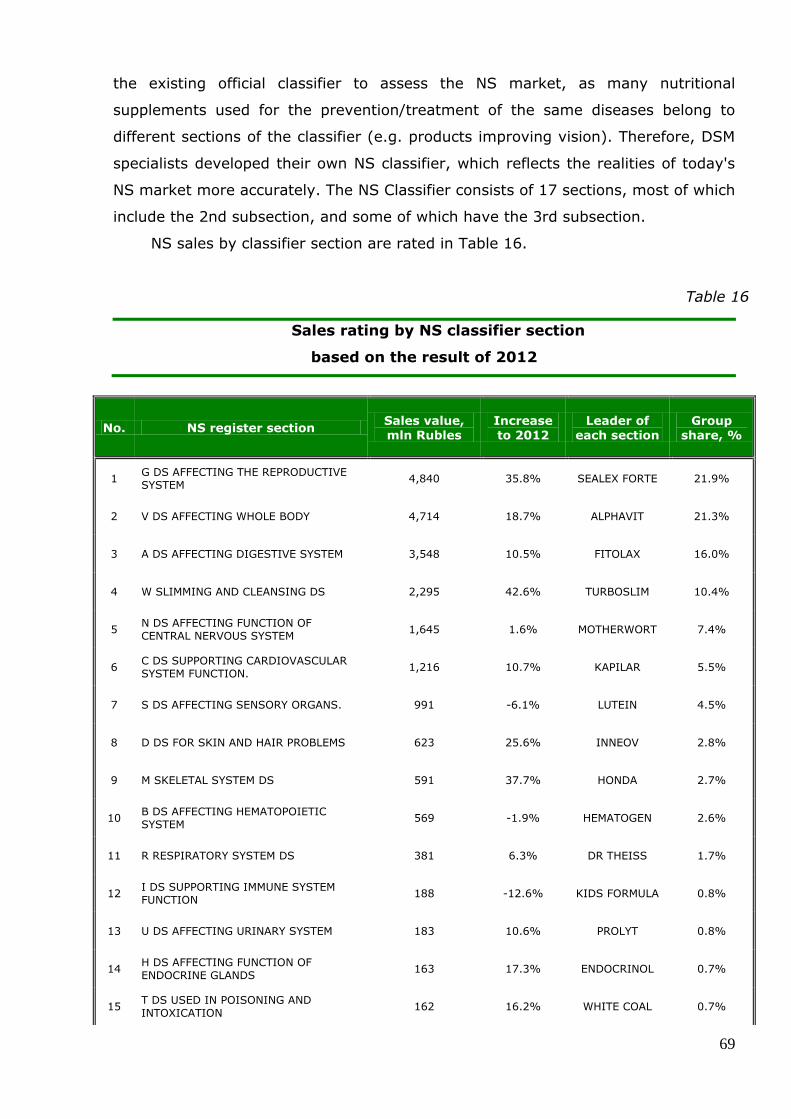
69
the existing official classifier to assess the NS market, as many nutritional
supplements used for the prevention/treatment of the same diseases belong to
different sections of the classifier (e.g. products improving vision). Therefore, DSM
specialists developed their own NS classifier, which reflects the realities of today's
NS market more accurately. The NS Classifier consists of 17 sections, most of which
include the 2nd subsection, and some of which have the 3rd subsection.
NS sales by classifier section are rated in Table 16.
Table 16
Sales rating by NS classifier section
based on the result of 2012
No. NS register section Sales value, mln Rubles
Increase to 2012
Leader of each section
Group share, %
1 G DS AFFECTING THE REPRODUCTIVE
SYSTEM 4,840 35.8% SEALEX FORTE 21.9%
2 V DS AFFECTING WHOLE BODY 4,714 18.7% ALPHAVIT 21.3%
3 A DS AFFECTING DIGESTIVE SYSTEM 3,548 10.5% FITOLAX 16.0%
4 W SLIMMING AND CLEANSING DS 2,295 42.6% TURBOSLIM 10.4%
5 N DS AFFECTING FUNCTION OF
CENTRAL NERVOUS SYSTEM 1,645 1.6% MOTHERWORT 7.4%
6 C DS SUPPORTING CARDIOVASCULAR
SYSTEM FUNCTION. 1,216 10.7% KAPILAR 5.5%
7 S DS AFFECTING SENSORY ORGANS. 991 -6.1% LUTEIN 4.5%
8 D DS FOR SKIN AND HAIR PROBLEMS 623 25.6% INNEOV 2.8%
9 M SKELETAL SYSTEM DS 591 37.7% HONDA 2.7%
10 B DS AFFECTING HEMATOPOIETIC
SYSTEM 569 -1.9% HEMATOGEN 2.6%
11 R RESPIRATORY SYSTEM DS 381 6.3% DR THEISS 1.7%
12 I DS SUPPORTING IMMUNE SYSTEM
FUNCTION 188 -12.6% KIDS FORMULA 0.8%
13 U DS AFFECTING URINARY SYSTEM 183 10.6% PROLYT 0.8%
14 H DS AFFECTING FUNCTION OF
ENDOCRINE GLANDS 163 17.3% ENDOCRINOL 0.7%
15 T DS USED IN POISONING AND
INTOXICATION 162 16.2% WHITE COAL 0.7%

70
No. NS register section Sales value, mln Rubles
Increase to 2012
Leader of each section
Group share, %
16
O DS USED FOR TREATMENT AND
PREVENTION OF ONCOLOGY DISEASES
(OTHER THAN REPRODUCTIVE SYSTEM
TUMORS)
38 30.3% PROMISAN 0.2%
17 J DS USED IN VIRUS, BACTERIAL,
FUNGOUS DISEASES 2 -18.2% TANAXOL 0.01%
Source: Monthly retail audit of the pharmaceutical market in the Russian Federation, DSM Group. ISO
9001:2008
If in 2011, at the top of the DS rating in the first DSM classifier level was
group [V] DS AFFECTING WHOLE BODY, in 2012 the situation changed: group [G]
DS AFFECTING THE REPRODUCTIVE SYSTEM is in the first place with 21.9%,
having displaced the previous year's leader to the 2nd place. The reason is
increased sales, as compared to 2011, of the brands SEALEX FORTE and ALI CAPS,
as well as TONGKAT (+238%), SPERMAPLANT (+309%), TESTOGENON (+613%),
etc. The last in the TOP 3 leaders is group [A] DS AFFECTING DIGESTIVE SYSTEM
with a share of 16%.
The largest increase (+42.6%) was observed for group [W] SLIMMING AND
CLEANSING DS, due to the contribution of brands such as TURBOSLIM, REDUXINE
LIGHT, etc.
Group [J] DS USED IN VIRUS, BACTERIAL, FUNGOUS DISEASES show the
greatest decline in sales (-18.2%). The volume decline is due reduced sales of,
largely, the antifungal DS CANDIMIN (-91.3%), the anti-parasitic agent PARAGON
(-88.8%) and the BLACK WALNUT brand (-76.7%) that provide anti-parasitic,
vermicidal, antibacterial and anti-inflammatory effects.

71
6. Beauty products
Gradually, modern buyers come to believe that they can and should buy
products other than drugs at pharmacies. In cities and regional centers, people
ever more often come to the pharmacy to buy beauty products for face, body and
hair care, and buying beauty products often turns from a secondary into a primary
goal of the visit. The reason for this is the high level of trust that people have for
the pharmacy as a whole and the pharmacist in particular. In other words, relying
on the pharmacist's advice in choosing the drug, the consumer expects high quality
advice as it comes to selecting a beauty product.
Pharmacies continue to search for new ways to attract and retain customers,
with the beauty segment being a particularly vivid example. Large networks
collaborate with manufacturers of cosmeceuticals, conducting joint consumer
campaigns.
Russian pharmacies also actively expand sales of skin care products, and
have been creating separate retail projects to this end. The Rigla pharmacy network
operates pharmacies with Centers of active beauty products. The 36.6 pharmacy
network opened up concept stores branded 36,6 Lab that offer exclusively beauty
products, nutritional supplements for beauty and hygiene products under the
network brand. The First Aid network opened up two outlets called Cosmetic Project
medicinal beauty product studios in Petersburg's shopping malls. The islands offer a
range of 600 titles, representing 15 brands of pharmaceutical beauty products.
Let us view the situation on the pharmaceutical beauty product market in
numbers.
At the end of 2012, pharmaceutical beauty products rank second (after
drugs) in the pharmacy sales mix and first in the parapharmaceutic product group
mix. This segment accounts for 5% of the total pharmacy sales.
In 2012, sales of pharmaceutical beauty products exceeded 22 billion Rubles
or 202 million packages.
The pharmaceutical beauty product market is slowly regaining its pre-crisis
level - the sales value in Rubles is almost as high as in 2009, however, the demand
for "beauty products from the pharmacy" shows far less dynamics than drug
consumption. The reason is the domestic consumer's conservatism - the pharmacy
is first of all visited to get a "medicine", beauty products are rarely the purpose

72
(buying a beauty product with the claimed therapeutic effect, accompanying
purchase, etc.) In cities, greater information awareness gradually destroys the
stereotype "pharmacies for drugs, hygiene products shop for beauty products".
For 2012, growth in sales of pharmaceutical beauty products in Rubles
amounted to 6.3%. In 2011, a 5.3% growth was registered, as compared to 2010.
Figure 28
Sales of beauty products in Russia in 2011-2012
21 033
22 368
207 202
2011 год 2012 год
Стоимостный объем, млн. руб. Натуральный объем, млн. уп
-2,5%
6,3%
Source: Monthly retail audit of the pharmaceutical market in the Russian Federation, DSM Group. ISO
9001:2008 Note: Sales value are given in pharmacy purchase prices, VAT included.
Russia does not have an official classification of beauty products, however,
depending on the purpose, effect and price, all beauty products can be divided into
three groups: active (medicinal) beauty products, MASS MARKET beauty products
and selective beauty products (Premium and Deluxe class). We have to note that
the division into these groups is conventional and subjective.
Active (medicinal) beauty products are used for treatment and prevention
of certain diseases, contain various biologically active substances. Medicinal beauty
products include such brands as Sophie (creams and balms), Boro Plus creams, etc.
Sales value, mln Rubles Real volume, mln packages

73
Mass market beauty products are beauty products available to most
consumers, designed for skin, hair and nail care. They are available both in
pharmacies and other retail outlets (supermarkets, specialized stores, etc.)
Such beauty products usually do not include any selective preparations
eliminating specific problems, such as acne. Mass market beauty products include
the goods of such manufacturers as, for example, Garnier Laboratories, Nivea.
Selective beauty products (Premium and Deluxe class) are elite,
prestigious beauty products which more often feature cosmetic lines intended for
certain skin or hair conditions. In general, these products are expensive
(approximately from 800 rubles per package) and are sold mostly by pharmacies.
For example, Vichy Laboratories is a manufacturer of selective beauty products.
Among the three types of goods, medicinal beauty products demonstrate
substantial growth both in money terms (+11%) and in packages (+2%).
Sustainable growth (+7%) in 2012 was also noted in the mass market beauty
product segment. The selective beauty product segment has seen declining
turnover and package sales for a third year in a row. The drop in the value and
sales value of premium and deluxe beauty products was -2% in Rubles, and -6% in
packages (Figure 29). It should be noted, however, that the dynamics of the
demand for selective beauty products gradually shifts toward more positive values
(thus, in 2010, premium beauty product sales fell by 9%, in 2011, by 4%, and
2012, already by 2%).
Beauty products sold through pharmacies have a wide price range - from
cheap ones priced 10-15 Rubles (soap, wet wipes, cheap domestic hand cream,
etc.) to very expensive ones which may be priced above 10,000 Rubles per
package. Based on the year results, the weighted average price of one package was
about 111 Rubles (+9.11% growth to the 2011 level). The mass market beauty
products experienced the most marked increase in the weighted average cost of a
package (from 63 Rubles to 73 Rubles). The medicinal beauty product segment
grew by 9% (the weighted average cost amounted to 95 Rubles, based on results
of 2012).
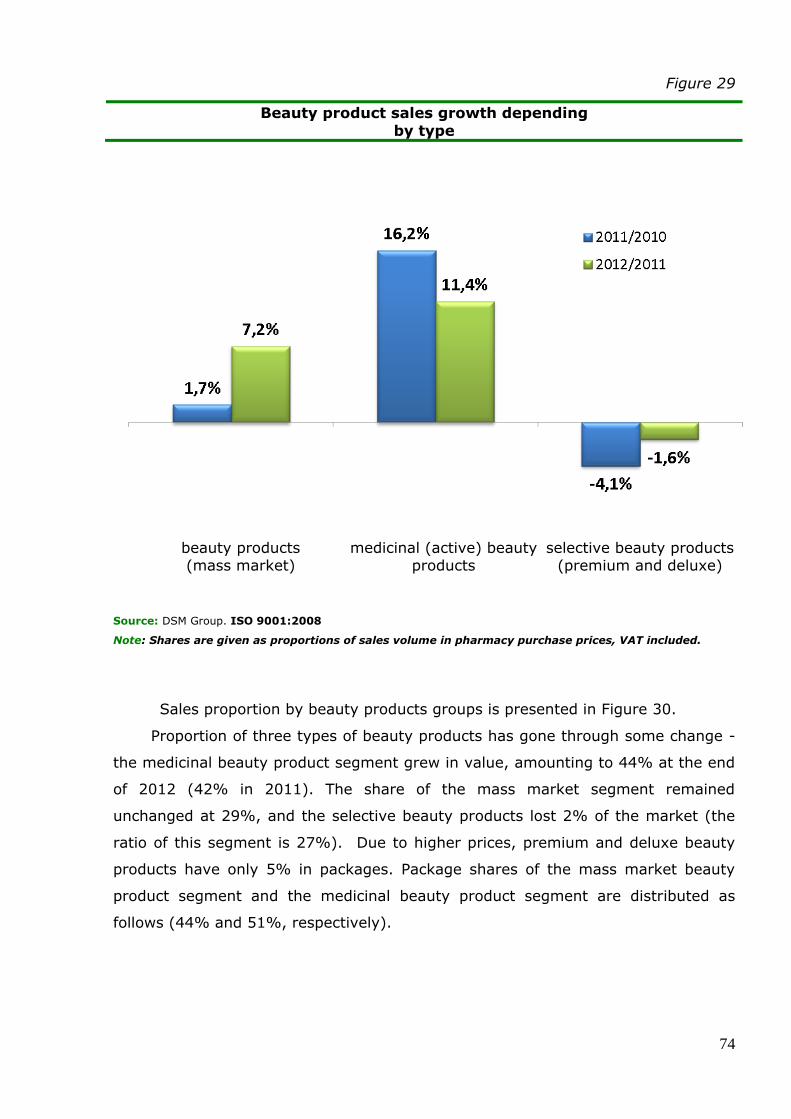
74
Figure 29
Beauty product sales growth depending
by type
Source: DSM Group. ISO 9001:2008
Note: Shares are given as proportions of sales volume in pharmacy purchase prices, VAT included.
Sales proportion by beauty products groups is presented in Figure 30.
Proportion of three types of beauty products has gone through some change -
the medicinal beauty product segment grew in value, amounting to 44% at the end
of 2012 (42% in 2011). The share of the mass market segment remained
unchanged at 29%, and the selective beauty products lost 2% of the market (the
ratio of this segment is 27%). Due to higher prices, premium and deluxe beauty
products have only 5% in packages. Package shares of the mass market beauty
product segment and the medicinal beauty product segment are distributed as
follows (44% and 51%, respectively).
beauty products (mass market)
medicinal (active) beauty products
selective beauty products (premium and deluxe)

75
Figure 30
Proportion of pharmacy beauty products sales by type, 2012
29%
44%
44%
51%
27%
5%
Объем, руб.
Объем, упак.
КОСМЕТИКА (MASS MARKET)
ЛЕЧЕБНАЯ (АКТИВНАЯ) КОСМЕТИКА
СЕЛЕКТИВНАЯ КОСМЕТИКА (ПРЕМИУМ И ЛЮКС КЛАСС)
Source: DSM Group. ISO 9001:2008
Note: Shares are given as proportions of sales volume in pharmacy purchase prices, VAT included.
Products of Russian manufacturers enjoy higher demand than those of foreign
companies, having nearly 66% of real sales volume. However, imported beauty
products are observed to prevail in sales value (the same 59% of sales).
Figure 31
Proportion of pharmacy beauty products sales by type, 2012
уп
руб
36%
64%
Лечебная косметика
24%
76%
100%
Селективная косметика
Импортные
Отечественные
100%
56%
44%
Косметика "масс-маркет"
39%
61%
уп
руб
Source: DSM Group. ISO 9001:2008
Note: Shares are given as proportions of sales volume in pharmacy purchase prices, VAT included.
beauty products (mass market)
medicinal (active) beauty products selective beauty products (premium and deluxe)
Value, Rubles
Volume, Packages
selective beauty products (premium and deluxe)
medicinal (active) beauty products
beauty products (mass market)
Imports
Domestics
Rubles
Packs Packs
Rubles
76
Within the segments, the domestic and foreign beauty products ratio is
different (Figure 31).
In 2012, selective beauty products are 100% imported cosmetics. Domestic
companies are not yet able to compete with foreign manufacturers in this segment.
In the mass market segment, as in the past year, the domestic beauty
products are ahead of the imported ones by the number of packages sold (61%).
Foreign brands retained the advantage by sales value (56%).
In the segment of medicinal beauty products domestic brands are leaders both
by sales value (64%) and sales value (76%).
Mostly, pharmacies sell "universal" beauty products designed for any
consumer - in sales value, it occupies 73% in money and 79% in packages. The
second place goes to beauty products for children, 9% in sales and 15% in real
volume. Beauty products for the "middle age (after 25)" are in the third place. In
this category, expensive beauty products somewhat dominate (the segment share
is 7% in money and a mere 2% in packages) - over 80% of the volume in this
category comes from selective beauty products. Beauty products for people older
than 45 are in the fourth place (5% in consumption value, and 1% in real volume).
According to the results of 2012, the share of male beauty products amounted to
only 1% in Rubles and 0.4% in packages. Besides, in comparison with the last year,
the share of the male beauty products noticeably decreased.
As in previous years, VICHY brand tops the selective beauty products rating
(Figure 32). Although compared to 2009 this brand's sales declined by 3%, and its
share lost 1%. Of the TOP 10 brands, LIERAC (-21%), ROC (-61%), FILORGA (9%)
and CAUDALIE (-5%) showed negative dynamics. Other brands grew both in
volume and in share. We note the increase in sales and share of LA ROCHE-POSAY
- this trademark is owned by L`OREAL (like VICHY). So in aggregate, the 2 brands
occupy 64% of the sales value of the market, which is 1% higher than the share
occupied by the brands in 2011. Note that LA ROCHE-POSAY ranked second for a
second consecutive year, and according to the results of 2012, the gap between the
third line occupied by LIERAC increased to reach 9% in share.
Of the brands occupying places from 4th to 10th, noteworthy are BIODERMA,
AVENE, URIAGE - compared to 2011, sales of these brands grew by 14%, 20% and
9%, respectively. DUCRAY demonstrated the record growth of the selective beauty
product brands (+38% to the sales level of the previous year).

77
The 2012 rating is different from the 2011 rating in one player. Due to high
growth rates, DUCRAY was able to take the 9th place. While NUXE left the rating -
its volumes decreased by 3% during the year.
Figure 32
TOP-10 selective beauty product brands (Premium and Deluxe class)
48%
15%
10%6% 5% 4%
2% 1% 1% 3%
47%
17%
8% 7% 6% 5%
1% 1% 1% 1%
-3%
14%
-21%
14%9%
20%
-9%-5%
38%
-61%
Доля, 2011 Доля, 2012 Прирост, руб.
Source: DSM Group. ISO 9001:2008
Note: Shares are given as proportions of sales volume in pharmacy purchase prices, VAT included.
In the mass market beauty product rating, JOHNSON BABY, a baby beauty
products line, is firmly in the first place (Figure 33). The LOSHADINAYA SILA brand
is in the second place. NIVEA ranks third in the mass market rating. The domestic
brands in the mass market ranking is presented only by the NATURA SIBERICA
brand which shows an impressive 96% increase in sales (this brand had 2x sales
growth in the past year, when it was new to the parapharmaceutical pharmacy
segment). NATURA SIBERICA produces beauty products, part of which are certified
natural beauty products. The LOSHADINAYA SILA brand demonstrated the
maximum market growth (from 1% in the past year to 8% according to the results
of 2012). Pharmacy sales of the brand grew more than 8-fold, helped by the
expansion of the product line (in addition to the earlier products for body and
joints, they added shampoos and hair conditioners) and a large-scale advertising
campaign. Drops were noted for the brands UMNAYA EMAL (-6% to the sales level
in 2011), STYX (-3%) and FLORESAN (-8%).
Share 2011 Share 2012 Growth, Rubles
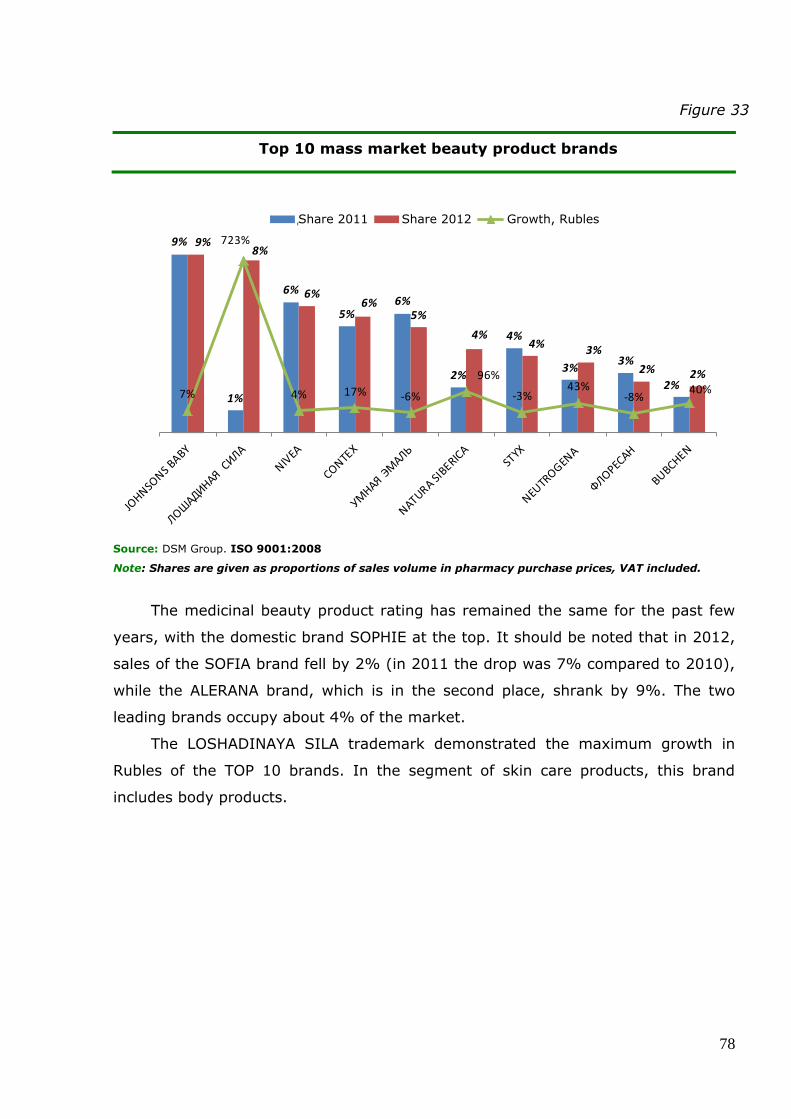
78
Figure 33
Top 10 mass market beauty product brands
9%
1%
6%
5%6%
2%
4%
3%3%
2%
9%8%
6%6%
5%
4%4%
3%
2% 2%
7%
723%
4% 17% -6%
96%
-3%43%
-8%40%
Доля, 2011 Доля, 2012 Прирост, руб.
Source: DSM Group. ISO 9001:2008
Note: Shares are given as proportions of sales volume in pharmacy purchase prices, VAT included.
The medicinal beauty product rating has remained the same for the past few
years, with the domestic brand SOPHIE at the top. It should be noted that in 2012,
sales of the SOFIA brand fell by 2% (in 2011 the drop was 7% compared to 2010),
while the ALERANA brand, which is in the second place, shrank by 9%. The two
leading brands occupy about 4% of the market.
The LOSHADINAYA SILA trademark demonstrated the maximum growth in
Rubles of the TOP 10 brands. In the segment of skin care products, this brand
includes body products.
Share 2011 Share 2012 Growth, Rubles

79
Figure 34
TOP-10 medicinal (active) beauty product brands
5%
4%
2%
2%
3%
3%
0%
2%
3%
2%
4%
4% 3%3%
3% 3%
2% 2% 2% 2%
-2% -9%
67%
112%
19%-2%
442%
10%-20% -8%
Доля, 2011 Доля, 2012 Прирост, руб.
Source: DSM Group. ISO 9001:2008
Note: Shares are given as proportions of sales volume in pharmacy purchase prices, VAT included.
For the beauty product department of a pharmacy, 2012 was a period of new
"outstanding" brands (for example, LOSHADINAYA SILA, NATURA SIBERICA) and a
time of market leaders already known to the consumer consolidating their positions
(Vichy, Avene, Uriage, Bioderma in the "conservative" selective beauty product
sector, and Sophie, Doliva, Mustelle in the medicinal beauty product segment).
Share 2011 Share 2012 Growth, Rubles

80
7. Drug Import
To encourage domestic production, the government is preparing to limit
government purchases of imported drugs. Suppliers of foreign drugs will not be
allowed to participate in bidding for public procurement, if the Russian register of
drugs has two or more of the same drugs, with the exception of drugs from
Belarus. This provision is contained in two documents being developed (the draft
order of the Ministry of Economic Development "On the conditions of admission of
goods originating from foreign countries for the purpose of placing orders for the
supply of goods for the needs of customers" and the draft government resolution
"On the establishment of additional requirements to bidders when placing orders for
the supply of drugs" prepared by the Industry and Trade Ministry).
Also the definition of a "locally manufactured" drug is being prepared. Prior to
January 1, 2014 local drugs will mean drugs packaged or marked in Russian,
according to a draft order of the Industry and Trade Ministry, after this date, local
drugs will only mean drugs entirely manufactured in Russia (including from
imported substances).
Adoption of such legislative instruments can dramatically change the Russian
market, including with regard to the RTU drug imported to Russia. It will also
provide an additional stimulus for foreign manufacturers to "speed up" localization
in Russia.
Discrimination of foreign drugs in the public procurement field will particularly
benefit the domestic producers when in 2014, the import duties on drugs will be
reduced: from 15-5% to 6.5-5% during the transitional period, and simultaneously,
at even faster rate, the duties on medical equipment and medical substances will be
reduced (down to 2-3%). Such rules have been adopted upon Russia's WTO
accession.
In the meantime, Russian consumers cannot do without imported foreign-
made drugs. And the import of drugs into Russia has been steadily increasing.
Figure 35 shows RTU drug import value in Russia in 2012.

81
Figure 35
Import value, mln Dollars
Source: Diamond Vision
The drug import value in Russia in 2012 amounted to 14.4 billion Dollars (in
customs prices), which is 9% higher than that in 2011. Furthermore, in the national
currency (in ruble terms), the import value is slightly over +15% (about 450 billion
Rubles). In volume terms, the imported drugs volume is 16% higher than in 2011.
Table 17 shows the shares of different groups of RTU drug importers in Russia
(by import sales value of a certain group in 2011 and 2012).
Import growth 2012/2011
Direct import
companies
Representative offices
of foreign companies
Domestic RTU drug manufacturers
Distributors
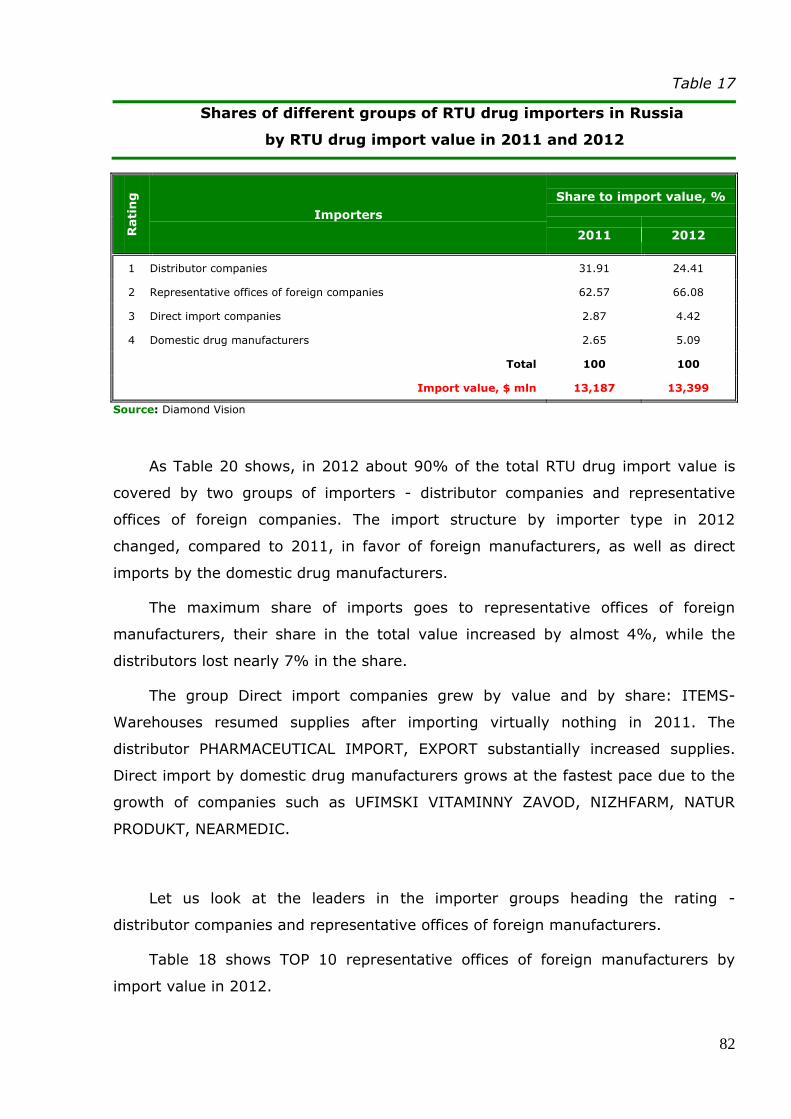
82
Table 17
Shares of different groups of RTU drug importers in Russia
by RTU drug import value in 2011 and 2012
Rati
ng
Importers
Share to import value, %
2011 2012
1 Distributor companies 31.91 24.41
2 Representative offices of foreign companies 62.57 66.08
3 Direct import companies 2.87 4.42
4 Domestic drug manufacturers 2.65 5.09
Total 100 100
Import value, $ mln 13,187 13,399
Source: Diamond Vision
As Table 20 shows, in 2012 about 90% of the total RTU drug import value is
covered by two groups of importers - distributor companies and representative
offices of foreign companies. The import structure by importer type in 2012
changed, compared to 2011, in favor of foreign manufacturers, as well as direct
imports by the domestic drug manufacturers.
The maximum share of imports goes to representative offices of foreign
manufacturers, their share in the total value increased by almost 4%, while the
distributors lost nearly 7% in the share.
The group Direct import companies grew by value and by share: ITEMS-
Warehouses resumed supplies after importing virtually nothing in 2011. The
distributor PHARMACEUTICAL IMPORT, EXPORT substantially increased supplies.
Direct import by domestic drug manufacturers grows at the fastest pace due to the
growth of companies such as UFIMSKI VITAMINNY ZAVOD, NIZHFARM, NATUR
PRODUKT, NEARMEDIC.
Let us look at the leaders in the importer groups heading the rating -
distributor companies and representative offices of foreign manufacturers.
Table 18 shows TOP 10 representative offices of foreign manufacturers by
import value in 2012.

83
Table 18
TOP 10 representative offices of foreign manufacturers
by import value in 2012
Rati
ng
Representative office of foreign manufacturers
Share in the import
value of the group "Representative
offices...", %
Increase to 2011, USD
2011 2012
1 SANOFI 10.7% 10.6% 12%
2 NOVARTIS 14.0% 9.7% -22%
3 BAYER 4.0% 7.8% 118%
4 ABBOTT 6.1% 6.7% 24%
5 JOHNSON & JOHNSON 4.5% 5.8% 45%
6 TEVA 5.9% 5.6% 6%
7 BOEHRINGER INGELHEIM 0.0% 5.2% new
8 TAKEDA 5.0% 4.6% 2%
9 GLAXOSMITHKLINE 5.8% 4.5% -13%
10 MSD PHARMACEUTICALS 1.7% 4.1% 177%
Total 64.6%
Source: Diamond Vision
The group Representative offices of foreign companies increased by 15% in
2012. The trend of the previous years continued: manufacturers wish to have more
control over their drug supplies to Russia, independently develop their pricing policy
in accordance with the market reality and react to changes of market situation
more promptly. Concentration in the importer group Representative offices of the
foreign companies was 65%.
As in the previous years, SANOFI and NOVARTIS are the leaders of the
importer group Representative offices of foreign companies. The representative
office of BAYER is the last of the three leaders. In 2012, it took the third place,
moving up from the ninth place; the company showed some of the strongest
growth (+118%). It can be stated that the manufacturer switched to its own
supplies to Russia. The rating also has a "new" manufacturer - BOEHRINGER that
had virtually imported nothing until 2012.
Of the companies that have shown 2-fold or stronger growth, it is worth noting
the representative offices of MSD, USB PHARMA. Manufacturers are also switching
to their own supplies.

84
Table 19 shows TOP 10 distributors by RTU drug import value in Russia.
Table 19
TOP 10 distributors by RTU drug import value
in Russia in 2011 and 2012
Rati
ng
Distributor
Share in the import value of the group
"Distributors", % Increase to 2011
2011 2012
1 CV Protek 17.5% 17.1% -15%
2 R-PHARM 17.5% 16.3% -19%
3 KATREN 9.3% 11.3% 5%
4 SIA INTERNATIONAL 18.1% 10.2% -51%
5 BIOTEK 5.8% 9.0% 34%
6 ROSTA 8.3% 8.6% -10%
7 EUROSERVICE 3.2% 4.4% 22%
8 Oriola 3.6% 4.4% 5%
9 Alliance Healthcare Russia 4.8% 3.9% -26%
10 FC PULS 2.1% 2.7% 12%
Total 88.0%
Source: Diamond Vision
As can be seen from Table 22, three companies are the largest distributors
by import value in the Distributors group in 2012: PROTEK, R-PHARM, KATREN.
With the exception of KATREN, in 2012, the leaders' imports declined in dollar
terms.
The value of drugs imported by SIA International fell by almost two times,
which reflects this distributor's dynamics on the Russian pharmacy market. As a
result, the company was only the forth of the importer distributors.
The share of the 10 largest importer distributors in the total import value me
of the Distributors group shrank by 2% and amounts to about 88% in 2012.
In the reporting year, as in 2011, BIOTEK demonstrated the strongest
growth, having increased its imports by 34%. Specialized suppliers increasingly
make it to the T0P-10 importer distributors. 2012 was not an exception.
EUROSERVICE ranking seventh is a distributor specializing in hospital and tender
market, its growth is above the import growth, which allowed the company to move
up two positions.

85
Of companies down the rating list, it is worth noting the distributor BSS,
whose imports rose by more than 2 times - in 2012, the company was in the 12th
place, with a share of 0.77%.
Table 20 shows TOP 20 drug manufacturers by RTU drug import value in
Russia with regard to all groups of importers.
Table 20
TOP 20 RTU drug manufacturers by RTU drug import volume
in Russia with regard to all groups of importers in 2012
Rating
Manufacturer
Share by import value, $, %
20
11
20
12
2011 2012
2 1 SANOFI 6.5% 6.7%
1 2 NOVARTIS 7.4% 5.5%
3 3 F.HOFFMANN-LA ROCHE 4.6% 5.0%
7 4 TEVA PHARMACEUTICAL 3.6% 4.4%
15 5 BAYER 2.1% 3.9%
6 6 ABBOTT 3.9% 3.9%
4 7 MERCK 4.1% 3.7%
9 8 TAKEDA 3.2% 3.3%
5 9 BERLIN-CHEMIE 4.1% 3.1%
8 10 GEDEON RICHTER 3.3% 2.9%
12 11 PFIZER 2.3% 2.8%
13 12 BOEHRINGER INGELHEIM 2.3% 2.5%
16 13 SERVIER 2.0% 2.3%
11 14 ASTRAZENECA 2.6% 2.2%
14 15 JANSSEN PHARMACEUTICA 2.2% 2.2%
10 16 GLAXOSMITHKLINE 2.8% 2.1%
18 17 KRKA 1.5% 1.7%
17 18 ASTELLAS PHARMA 2.0% 1.6%
19 19 DR.REDDY 'S LABORATORIES 1.5% 1.5%
23 20 BAXTER HEALTHCARE 1.1% 1.2%
Total: 62.3%
Source: Diamond Vision
The share of TOP 20 RTU drug manufacturers by import value in Russia in
2012 amounted to 62%. SANOFI, NOVARTIS and F.HOFFMANN-LA ROCHE are the
largest manufacturers by RTU drug import value in Russia in 2012.

86
8. Pharmacy networks
The pharmacy segment went through substantial changes in 2012.
The first thing to mention is "redistribution" in the pharmacy market. Based
on the results of 2012, the Rigla pharmacy network took the first place, with a
turnover of 17.4 billion Rubles (+18% increase in sales compared to 2011). The
network share amounted to 2.54%. In the past year, Rigla actively developed
numerically - it opened 143 new outlets. In addition, the pharmacy network
continued to develop pharmacies in the Be Healthy discounter format: outlets in
this format more than doubled, totaling 215 pharmacies.
Based on the results of 2012, the A5 network is in the second place (in 2011,
it combined the pharmacy networks A5, Mosoblpharmacia and Norma) Today, the
company is the largest pharmacy network by number of outlets.
36.6 pharmacy network, the former leader, ranks third in the pharmacy
network rating. Based on the year's results, the network's share was 2.41%, down
from 2.7% in 2011. This was because in 2012 the pharmacy network set itself the
task of reversing the negative customer traffic trend and increasing the network
profitability by changing its qualitative composition. To achieve this, in early 2012,
it launched a new brand of pharmacies in the economy segment - LEKO. By the end
of 2012, 181 pharmacies operated in the LEKO format. Also, in 2012 the company
set out to reduce the number of loss-making pharmacies. During the year, 212
pharmacies were shut down, and the number of active pharmacies fell more than
160 outlets, despite this, the company managed to achieve positive sales dynamics.
The revenue growth was 3%.
As can be seen, the discounter format is one of the success drivers for
pharmacy networks now. All market participants picked up this trend: A5 develops
the Norma brand, Pharmacor operates discounter pharmacies branded as
"Ekonom!" ("Save Up!"), Raduga uses the name "Raduga ekonom" ("Economy
Rainbow"), and Doctor Stoletov now has the brand "Khoroshaya apteka" ("Good
Pharmacy"), etc.
On the other hand, we should note development of the polar format -
pharmacy premium segment. The A.V.E. network was the pioneer in this field.
Since 2012, it has developed A.V.E-Luxury pharmacies. Of the conceptual

87
pharmacy projects of this year, we should note the Cosmetic Project medicinal
beauty product studios developed by the network “Pervaya pomosch” (“The first
aid”) in Petersburg, health lifestyle product shops of Farmacia OAO, also opened in
St. Petersburg, and the Active Beauty Product Studios by Rigla in Moscow.
Speaking of mergers and acquisitions, merger of the Moscow network
pharmacies Gorzdrav with A.v.e Group could be called the most important deal of
the year. For the Russian pharmacy retail, this is the first merger - previously,
market deals had followed the scenario of larger networks taking over smaller ones.
The Gorzdrav pharmacy name will be retained to include the rebranded A.v.e.
pharmacies of the "discount" format. As a result of the merger, A.v.e now has 184
pharmacies. In 2013, the partners intend to bring the number of pharmacies up to
400.
In 2012, instead of acquisitions, we should rather talk about divestitures. So,
in July 2012, the 36.6 pharmacy network sold its retail toy network Early Learning
Center (ELC) which included 19 stores in Moscow. Detski mir-tsentr OAO was the
buyer. It purchased 10% of the ELC franchisee in Russia - Kub-market OOO. Also,
36.6 is looking for a buyer for its production asset Veropharm. In November, the
possibility of this deal was confirmed - the Federal Antimonopoly Service of Russia
said that it granted AFK Sistema's request to purchase 100% of Veropharm subject
to certain regulations.
The pharmacy network Doctor Stoletov changed hands. The investment
company Haden SA which acted in the interest of the St. Petersburg distribution
company Imperia-Pharma was the buyer. The cost of the deal amounted to 70
million Dollars.
In the summer of 2012, the state pharmacy network Stolichnye apteki was
reorganized into two companies, one of which would remain a state-owned one
(about 70 outlets), while the second one will be privatized (165 outlets). So, in
2013 we can expect the purchase of this network by one of the market players.
In aggregate, the TOP 10 networks grew by 13% in 2012, compared to the
similar period of 2011. The TOP had a share of 15.9%. The top ten's turnover

88
growth (15%) was slightly below the turnover growth for the pharmacy market as a
whole (Figure 36).
Figure 36
Concentration of TOP 10 pharmacy networks
Source: DSM Group. ISO 9001:2008
Figure 37 shows the growth of turnover and number of outlets of the TOP 10
pharmacy networks in 2007-2012. In 2012, there was a slight increase in the
number of outlets, as the networks continue to streamline their business, and there
were no major mergers and acquisitions at the TOP 10 level. In 2012, it amounted
to 0.2%. Thus, the concentration on the market by this indicator did not grow.
TOP 10 share by turnover TOP 10 growth by turnover, Rubles
Market growth, Rubles

89
Figure 37
Dynamics of TOP-10 pharmacy networks growth of turnover and number
of outlets
Source: DSM Group. ISO 9001:2008
Table 21 shows pharmacy networks rating in the commercial sector including
quantitative and value growth parameters in 2012.
TOP 10 pharmacy networks dynamics (commerce)
Outlets Turnover, bln Rubles
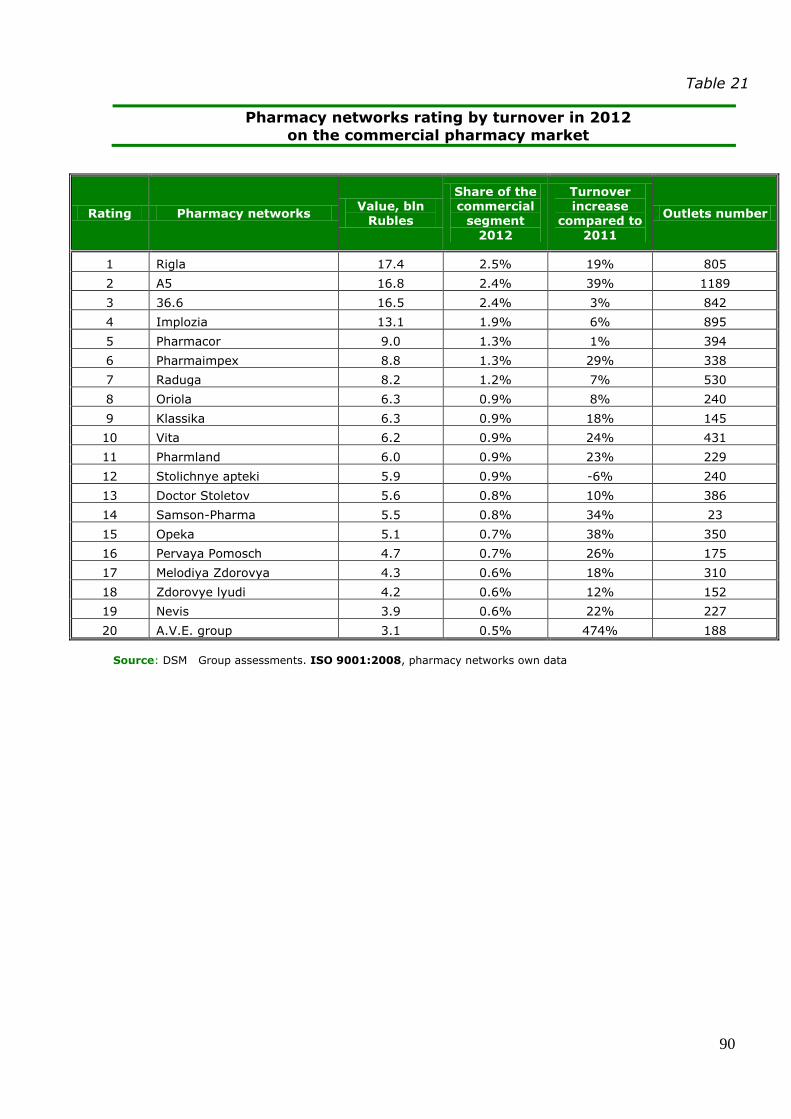
90
Table 21
Pharmacy networks rating by turnover in 2012
on the commercial pharmacy market
Rating Pharmacy networks Value, bln
Rubles
Share of the commercial
segment
2012
Turnover increase
compared to
2011
Outlets number
1 Rigla 17.4 2.5% 19% 805
2 A5 16.8 2.4% 39% 1189
3 36.6 16.5 2.4% 3% 842
4 Implozia 13.1 1.9% 6% 895
5 Pharmacor 9.0 1.3% 1% 394
6 Pharmaimpex 8.8 1.3% 29% 338
7 Raduga 8.2 1.2% 7% 530
8 Oriola 6.3 0.9% 8% 240
9 Klassika 6.3 0.9% 18% 145
10 Vita 6.2 0.9% 24% 431
11 Pharmland 6.0 0.9% 23% 229
12 Stolichnye apteki 5.9 0.9% -6% 240
13 Doctor Stoletov 5.6 0.8% 10% 386
14 Samson-Pharma 5.5 0.8% 34% 23
15 Opeka 5.1 0.7% 38% 350
16 Pervaya Pomosch 4.7 0.7% 26% 175
17 Melodiya Zdorovya 4.3 0.6% 18% 310
18 Zdorovye lyudi 4.2 0.6% 12% 152
19 Nevis 3.9 0.6% 22% 227
20 A.V.E. group 3.1 0.5% 474% 188
Source: DSM Group assessments. ISO 9001:2008, pharmacy networks own data

91
9. Distribution segment of the pharmaceutical
market
Over the past few years, the pharmaceutical market distribution sector has
developed along a clearly defined vector - business diversification. Virtually all
national distributors have a pharmacy network subordinate within the controlling
structure (Protek, Katren, Rosta, Oriola, etc.). The second actively developed area
is own production.
In 2012, it is worth noting the pharmaceutical distributor Imperia-Pharma
which took over the pharmacy network Doctor Stoletov that is one of the TOP 15
networks in Russia. The investment company Haden SA, acting on behalf of
Imperia-Pharma, acquired the company and its regional subsidiaries for 60 million
dollars. Imperia-Pharma now focuses on development not so much in the public
procurement sector, as in commerce, and formation of the retail division is quite
consistent with the new task. The company also actively develops its regional
network by opening new branches and representative offices. At year-end, Imperia-
Pharma has 7 branches and 33 representative offices.
The distributor R-Pharm continues to invest in its own production facilities. At
present, the company has ready manufacturing facilities in Novosibirsk, Kostroma
region, and a pharmaceutical plant in Yaroslavl, it is building a modern scientific-
industrial complex Pharmoslavl which will perform the full cycle of high-tech
pharmaceutical substance development. R-Pharm invested in the organization of
production of biopharmaceutical drugs on the basis of the FlexFactory production
line of Xcellerex, USA. This venture is the first step toward mass production of
biological products, including innovative products and biosimilars. The plant will be
simultaneously certified in the U.S. for FDA and GMP requirements, and will be the
first facility of its kind in Russia.
In 2012, bankruptcies continued to hit the distribution segment. In 2011,
Shreya was declared bankrupt. In the summer of 2012, Medico-Pharmaceutical
Firm Akonit OOO, which went after a spot in the TOP 10 Russian pharmaceutical
distributors four years ago, was declared bankrupt.

92
Genesis bankruptcy was announced back in 2008. In 2011, Genesis
announced a new partner Pharma Capital ZAO engaged to settle the accounts
payable, make a settlement and terminate the wholesaler bankruptcy procedure.
Pharma Capital ZAO has extensive development plans, in particular - it plans to
build a nation-wide distributor company based on Genesis. Thus, Genesis is now
considering a number of offers with respect to both merger with other wholesale
pharma market participants and acquisition of separate branches. But in 2012, no
activity was noted.
National distributors have lately preferred to avoid public procurements (the
program to provide subsidized drugs to people). Because of this, niche distributors
were afforded the possibility of further development. For example, in bidding for
2013 under the "7 nosologies" program, the interim public procurement market
leader - Intermedpharm OOO that participated in the bidding for the first time and
got most lots in INN Imatinib and offered supplies of Gleevec generics. Irvin-2 and
Pharmstandart also won large shares of the tenders.
And now let us look at the financial results of the distributors' work in 2012.
The valuation of listed companies is one of the performance indicators. In the
distribution segment, this is Protek, with its stock value gaining more than 67% in
2012. The reason for this rise lies in the good results that the company showed
during the year.
The concentration of distributors continues to grow (Figure 38). In 2012, the
share of the TOP 10 distributors amounted to 85%. At the same time, the share of
the TOP 3 distributors decreased from 46% to 44%. The aggregate share of the
three leaders fell due to SIA's reduced turnover.
At the same time, the distributors ranking 6th to 10th grow at a faster rate
than before.
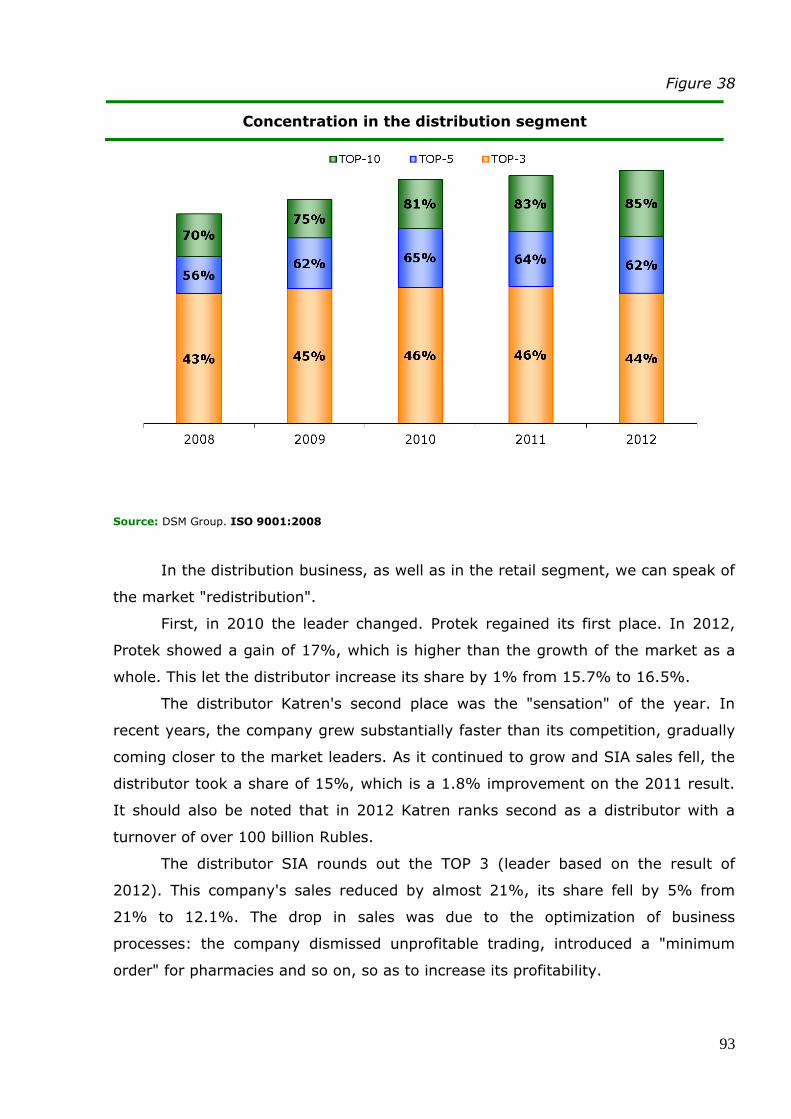
93
Figure 38
Concentration in the distribution segment
Source: DSM Group. ISO 9001:2008
In the distribution business, as well as in the retail segment, we can speak of
the market "redistribution".
First, in 2010 the leader changed. Protek regained its first place. In 2012,
Protek showed a gain of 17%, which is higher than the growth of the market as a
whole. This let the distributor increase its share by 1% from 15.7% to 16.5%.
The distributor Katren's second place was the "sensation" of the year. In
recent years, the company grew substantially faster than its competition, gradually
coming closer to the market leaders. As it continued to grow and SIA sales fell, the
distributor took a share of 15%, which is a 1.8% improvement on the 2011 result.
It should also be noted that in 2012 Katren ranks second as a distributor with a
turnover of over 100 billion Rubles.
The distributor SIA rounds out the TOP 3 (leader based on the result of
2012). This company's sales reduced by almost 21%, its share fell by 5% from
21% to 12.1%. The drop in sales was due to the optimization of business
processes: the company dismissed unprofitable trading, introduced a "minimum
order" for pharmacies and so on, so as to increase its profitability.
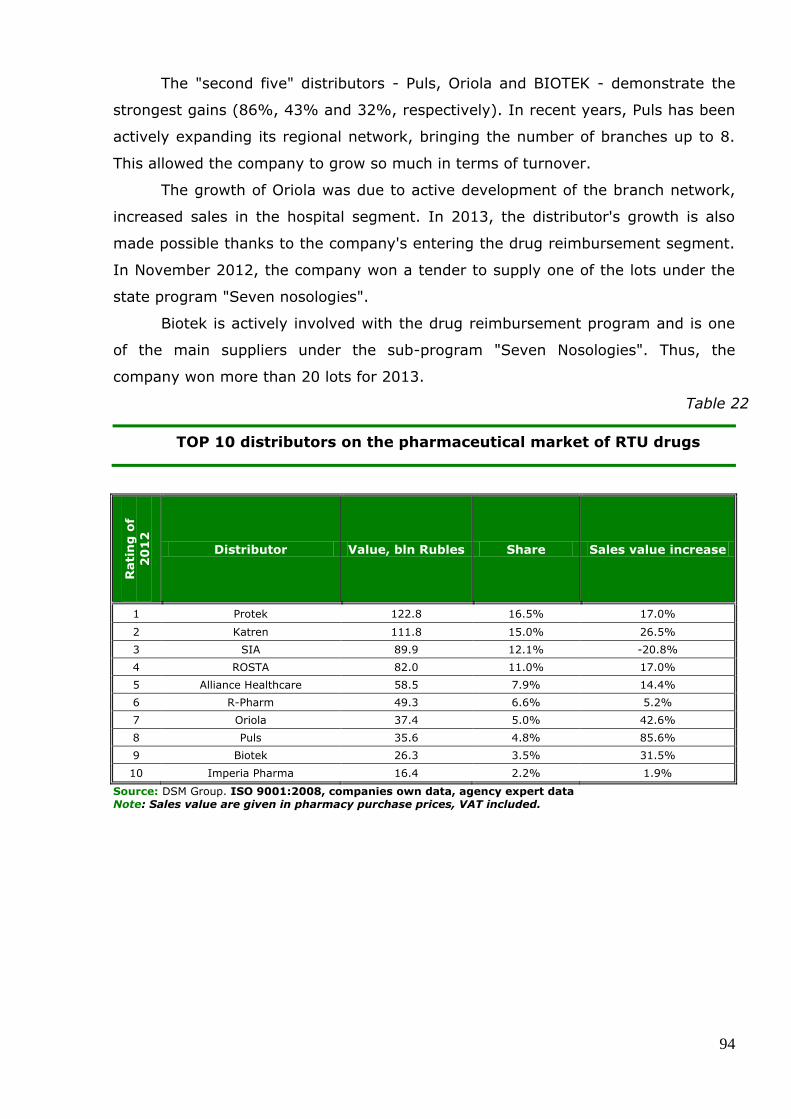
94
The "second five" distributors - Puls, Oriola and BIOTEK - demonstrate the
strongest gains (86%, 43% and 32%, respectively). In recent years, Puls has been
actively expanding its regional network, bringing the number of branches up to 8.
This allowed the company to grow so much in terms of turnover.
The growth of Oriola was due to active development of the branch network,
increased sales in the hospital segment. In 2013, the distributor's growth is also
made possible thanks to the company's entering the drug reimbursement segment.
In November 2012, the company won a tender to supply one of the lots under the
state program "Seven nosologies".
Biotek is actively involved with the drug reimbursement program and is one
of the main suppliers under the sub-program "Seven Nosologies". Thus, the
company won more than 20 lots for 2013.
Table 22
TOP 10 distributors on the pharmaceutical market of RTU drugs
Rati
ng
of
20
12
Distributor Value, bln Rubles Share Sales value increase
1 Protek 122.8 16.5% 17.0%
2 Katren 111.8 15.0% 26.5%
3 SIA 89.9 12.1% -20.8%
4 ROSTA 82.0 11.0% 17.0%
5 Alliance Healthcare 58.5 7.9% 14.4%
6 R-Pharm 49.3 6.6% 5.2%
7 Oriola 37.4 5.0% 42.6%
8 Puls 35.6 4.8% 85.6%
9 Biotek 26.3 3.5% 31.5%
10 Imperia Pharma 16.4 2.2% 1.9%
Source: DSM Group. ISO 9001:2008, companies own data, agency expert data Note: Sales value are given in pharmacy purchase prices, VAT included.

95
10. Manufacturing
For pharmaceutical manufacturers, a major issue in 2012, admittedly as in
previous years, was registration of the maximum ex-works prices for the drugs
from the vital and essential drug list (VED).
Russian manufacturers were to annually register prices with the Ministry of
Health in coordination with the Federal Tariff Service. Since 2010, this possibility
was never materialized - the FTS refused to allow the price raises even to match
the inflation rate. During the year, the industry organizations voiced the view that
many pharmaceutical companies were looking for a way to get off the VED supplier
list, as they did not see any reasonable motivation for continuing to be on the list.
In the second decade of November 2012, the Ministry of Justice registered the new
methodology for determining the VED prices, which will allow manufacturers to
annually increase the prices of these drugs to match the inflation rate - within 6%.
This only applies to domestic drugs, no indexation is provided for the imported
drugs.
Thus, the domestic manufacturers were able to have the prices for the VED's
indexed, for the first time in a long time. But there is one "BUT" - price re-
registration documents can only be submitted from January 1, 2013. This means
the prices can only be increased from 2014.
Another serious problem facing the domestic drug manufacturers is
introduction of GMP standards (Good Manufacturing Practice - GMP). The transition
to GMP should be completed by January 2014. There is a possibility that in the
absence of financial resources to adopt the GMP standards by the due date many
small Russian companies that currently produce low-priced drugs will be forced to
stop their production. Currently, only about 10% of the companies operate in full
compliance with the GMP standards. These are normally companies with mixed
capital, and enterprises built from the ground up in accordance with the
international quality standards. Another 40% of companies that currently have a
quality system and individual production sites that comply with the GMP standards
have a plan of the transition to the standards. The remaining 50% of
pharmaceutical companies have not started to adopt GMP and lack the quality
assurance system or the modernization program.

96
The past year was not the most abundant in terms of M&A deals in the
domestic pharmaceutical production. But still there was one record - the sums for
which the assets were put up for sale were higher than in previous years.
At the end of March 2012, it became known that GC Renova sells 100% of
CJSC Natur Produkt. Buyer - Canada's Valeant Pharmaceuticals International.
Transaction amount - 180 million Dollars Thus, this deal became the largest in the
Russian market - the largest previous purchase was of Masterlek by Pharmstandard
at 146 million Dollars.
Pharmstandard also showed activity in the past year - three transactions
totaling more than 80 million Dollars. In July, the company announced the
acquisition of 50.1% stake in Bigpearl Trading Limited, Cyprus. With its purchase,
Pharmstandard was able to determine the operation conditions of I.I. Mechnikov
Biomed OAO and Pharmapark OOO which are part of the same group. In
September 2012, the FAS issued Pharmstandard with a permit to purchase
Pharmaceutical Firm Lekko ZAO, with the respective deal closed in November.
It is worth noting that the German pharmaceutical holding company Stada
AG sold two production assets in Russia - the Moscow factory Makiz Pharma OOO
and Skopinsky pharmaceutical plant OOO located in Ryazan region. A contract with
the Russian company DMN Invest was signed in August 2012. Furthermore,
according to the plan, all products earlier manufactured on these plants will be
gradually moved to the company's other sites in Russia. The transfer will be
completed by 2015.
In 2013, another major transaction is possible. In the autumn, the US
pharma giant Abbott sent a request to the FAS of Russia to approved the purchase
of NPO Petrovax Pharm OOO. According to experts, the deal could be worth 140
million Dollars.
Of foreign deals, it is worth noting that Watson, a U.S. pharmaceutical
company, acquired Actavis Group for 4.25 billion Euros. After closing the deal,
Watson may become the third largest generics manufacturer in the world with
annual revenues of 8 billion Dollars.
In January 2012, STADA announced that the antimonopoly authorities gave it
approval to purchase a number of branded drugs from Grünenthal GmbH. The
declared transaction value is 152 million Euros. The acquired product portfolio
consists of 14 proprietary and licensed brands. This acquisition enabled the
company to move a few positions up in the rating of the TOP companies in the
pharmaceutical market of Russia.

97
The drug manufacturers rating in Russia is 95% foreign manufacturers. The
total share of imported drugs on the market is 75.9% in money and 40.5% in
packages. As mentioned above, the drug segment had a general growth of 11%,
while the increase in packages was 1.3%. This low growth in value terms was due
to a negative sales growth of domestic drugs in packages (the fall of -4%), while
sales of imported drugs grew by 11% in packages.
The TOP 20 manufacturers rating was quite stable, the movements within the
rating are within 1 or 2 positions. The overall share of the TOP 20 manufacturers in
2012 was 52.5%.
Three leaders in 2012 did not change compared to 2011. NOVARTIS is at the
top - in 2012 the share of segments publicly funded declined markedly, sales fell by
more than 30%. At the same time, high sales in the retail segment (77% share in
the total turnover) allowed the company to retain the top spot, despite the fact that
overall sales of the manufacturer did not change
SANOFI is in the second place. The manufacturer has about 30% of sales
from public purchases, but its value also declined in 2012 relative to 2011.
The domestic manufacturer PHARMSTANDARD is in the third place.
Compared to 2011, its sales remain virtually unchanged. This was because the
company's leading drug Arbidol fell sales.
Table 23
T0P 20 manufacturers by sales value on Russian pharmaceutical
market in 2012
Gain to
Ran
kin
g
20
12
Ch
an
ge
Manufacturer
Sales value, mln Rubles
2012
Sales value increase
Share
1 - NOVARTIS 42,373.4 0.6% 5.5%
2 - SANOFI 40,257.3 6.3% 5.2%
3 - PHARMSTANDARD 27,630.2 0.4% 3.6%
4 - F.HOFFMANN-LA ROCHE 23,674.5 10.1% 3.1%
5 - TEVA PHARMACEUTICAL 22,880.8 6.7% 3.0%
6 + 1 TAKEDA 22,249.4 16.7% 2.9%
7 + 4 ABBOTT 21,874.3 34.3% 2.8%
8 - BAYER 20,707.3 12.4% 2.7%
9 - 3 BERLIN-CHEMIE 20,702.9 2.0% 2.7%
10 - MERCK 18,188.0 7.5% 2.4%

98
11 + 2 PFIZER 17,577.2 18.8% 2.3%
12 - 3 GEDEON RICHTER 17,485.5 2.0% 2.3%
13 - 1 GLAXOSMITHKLINE 16,983.9 11.0% 2.2%
14 - SERVIER 15,688.2 7.9% 2.0%
15 - JANSSEN PHARMACEUTICA 15,373.8 8.5% 2.0%
16 + 2 STADA 13,305.2 14.1% 1.7%
17 - 1 BOEHRINGER INGELHEIM 13,282.7 11.6% 1.7%
18 + 1 KRKA 13,073.5 12.2% 1.7%
19 - 2 ASTRAZENECA 11,283.0 -3.5% 1.5%
20 - ASTELLAS PHARMA 10,903.7 27.2% 1.4%
Source: DSM Group. ISO 9001:2008 Note: the sales value shown is in final consumer prices with VAT included.
Manufacturers represented in the rating generate most sales in the
commercial segment - in general, the segment's share is 69.5%. Of the companies
with more than 70% of sales concentrated in public procurement, we can only note
F.HOFFMANN-LA ROCHE (85%).
ABBOTT (+34%) and ASTELLAS PHARMA (27%) demonstrate maximum
gains. ABBOTT increased its sales thanks to the hospital segment. This enabled the
company to move up 4 positions to take the 7th place (maximum change in the
rating). ASTELLAS PHARMA showed such significant increase thanks to the
commercial pharmacy sales segment, where sales grew by 30%.