russian real estate - edison investment · pdf filethe recovery of russian real estate from...
TRANSCRIPT
Market recovery, but value stagnation Russian real estate September 2012
Published by Edison Investment Research
© iStockphoto.com/Mordolff

The Edison financials team www.edisoninvestmentresearch.co.uk
Martyn King
Martyn graduated in economics from Cambridge University in 1983 and began his career in commodity and financial futures broking. After four years he moved into equity fund management and enjoyed considerable success with funds at MGM Assurance, Lloyds Investment Managers, and finally Kleinwort Benson which became RCM under the ownership of Allianz of Germany. For 12 years before joining Edison he was focused on company research within the European financial sector with RCM as a senior analyst and director. He has been a non-executive director of Independent Minds Research.
Jonathan Goslin
Jonathan started his career at Russell Investments as a portfolio analyst. After three years, and having completed all of his CFA exams, he left to work at the investment bank Altium Securities as a consumer sector analyst. Jonathan has a first class honour’s degree in finance and econometrics from the University of Canterbury (NZ).
Mark Cartlich
Mark joined Baring Securities in 1993 to cover construction and infrastructure across global emerging markets, after graduating in international relations from Cambridge University. After the takeover by ING he covered a range of basic materials sectors across the Latin American and EMEA regions, including steel, pulp and paper, building materials and construction. From 2005 he built up a top-rated real estate team in the EMEA region. During three years at Nomura and Religare he broadened his geographical and sectoral coverage to cover the wider property and infrastructure sectors across global emerging markets.
Roger Leboff
Roger has covered the real estate industry in various capacities since the early 1980s. Over the last few years he has covered the UK’s leading real estate companies, niche investors and a number of specialist funds in the UK, Asia, Eastern Europe and India. An initial career in property lending was followed by periods as an investment analyst at Hoare Govett and James Capel, and as a financial journalist.
Matthew Read
Matthew graduated in economics from the University of York in 1995 and, following a period working in the Insurance broking industry, gained his MSc in Finance from Cass Business school in 2000. Matthew’s career as a closed end fund analyst began 12 years ago when he then joined Teather & Greenwood, subsequently moving to Hardman and Co. before joining Edison in 2008.
Mark Thomas
Mark started his career with 10 years in NatWest, where his appointments included branch lending, balance sheet management, PA to the group finance director, trading risk and investor relations. This was followed by 12 years as a highly rated stockbroking analyst covering banks and financial institutions in the UK and across Europe. This record combines experience from the inside of how financial companies work, with identifying and communicating what is important to investors.
James Carthew
James started his career with M&G Investments in 1984. He completed the ACCA exams in 1992, the IIMR exams in 1994 and from 1995 to 2000, managed a number of UK equity funds as well as the M&G Fund of Investment Trusts. In 2001 he joined Progressive Asset Management and was responsible for the investment management of a number of funds, including Advance UK Trust, an activist fund of closed-end funds with a global remit. He left Progressive after managing the liquidation of Advance UK in 2010 and established an independent research company, Sapient Research. He is a director of Greenwich Loan Income Fund Limited, a judge on the Investment Trust of the Year Awards and writes a weekly column on investment companies for Citywire.

Russian real estate values have rebounded strongly from the lows in
2009, supported by positive fundamentals; however, quoted real
estate valuations are still a fraction of their peaks, which we believe
looks too punitive, given financial and operational improvements.
Russian real estate Market recovery, but value stagnation
Market recovery looks set to continue The recovery of Russian real estate from the financial crisis continues, with strong
demand, tight supply, falling vacancy levels, rising rental rates, improving prices
and falling yields across most segments. With the economy forecast to grow
steadily, supported by strong commodity prices, we anticipate continued market
recovery, which should improve yields and valuations in the sector further.
Asset recovery not reflected in valuations While asset valuations for commercial developments are now 65% of their
previous heights, quoted stock market valuations are just 8% of the 2006 peaks,
leaving sector multiples at a fraction of their former highs. This is a function of a
number of factors, including general market weakness, investor risk aversion and
mid-cap stocks being out of favour. Corporate governance has historically been
viewed as weak by investors, but recently there has been much improvement.
Retail and warehouse are our preferred segments We believe the most attractive segments of the sector in Russia, especially
Moscow, are retail and warehouses, based on the supply and demand dynamics,
occupancy levels and improving rental rates. Generally, we prefer companies that
have a diversified portfolio, blending residential with commercial, to spread the
risk profile. Generally, delivery times are shorter for residential, cash flow is more
immediate, reducing the need for external finance and planning regulations are
less onerous. The commercial segments can benefit from the long-term cash
flows provided by good quality tenants, the ability to finance projects without
recourse to the parent, and an institutional market for potential secondary sales.
Raven is our preferred, RGI and MLD also offer upside Raven Russia has been rewarded for leading the way in its segmentally-focused
strategy, cash returns to investors and corporate governance efforts. It thus
provides the model for others to emulate if they want to reach the same level of
valuation. We still see some upside for Raven, but see more for the likes of RGI
International and MirLand Development, which should benefit from project
progress and other catalysts. AFI Development (AFID) continues to suffer from
uncertainty about some of its Moscow projects but looks relatively undervalued,
while PIK looks fairly valued at current levels.
Sector research
13 September 2012 Analysts Mark Cartlich +44 (0)20 3077 5700 Martyn King +44 (0)20 3077 5745 [email protected]
For institutional enquiries contact: Gareth Jones +44 (0)20 3077 5704 Arun George +44 (0)20 3077 5706 Zsolt Mester +44 (0)20 3077 5746 [email protected]
Companies in this report AFI Development MirLand Development PIK Group Raven Russia RGI International
Priced as at 7 September 2012

2 | Edison Investment Research | Sector research | Russian real estate | September 2012
Contents
Investment summary: Key themes & recommendations .............................................................. 3 Investment thesis: Asset recovery not yet in valuations ................................................................ 4 Industry analysis: Continued recovery? ....................................................................................... 9
Macro forecasts: Steady growth expected ............................................................................ 9 Commercial segment: Falling vacancies to boost rental rates .............................................. 11 Retail segment: Expanding consumption ............................................................................. 15 Warehouse segment: Back to peak levels already ............................................................... 18 Residential segment: Fundamentals remain in favour ........................................................... 21
Company profiles ...................................................................................................................... 27 AFI Development ................................................................................................................. 28 MirLand Development ......................................................................................................... 32 PIK Group ........................................................................................................................... 36 Raven Russia ...................................................................................................................... 40 RGI International ................................................................................................................. 44

3 | Edison Investment Research | Sector research | Russian real estate | September 2012
Investment summary: Key themes & recommendations
Investor concerns appear overdone An improving sector backdrop has translated into a steady improvement in asset values, but this
has not yet been reflected in the market valuations of the listed companies, due to risk aversion in
respect of the Russian market and the sector in the wake of the European sovereign debt crisis.
We believe that investor concerns have been overdone:
• The macro outlook remains positive.
• Each real estate segment is seeing tightening supply, falling vacancies, rising rental rates
and falling yields, as investment volumes recover.
• Corporate governance issues have largely been addressed.
• Financing concerns have eased.
This report analyses the macro backdrop and key drivers for each of the main property sectors:
commercial, retail, warehouse and residential. We believe the most attractive segments of the
sector in Moscow/Russia are retail and warehouses, but generally we prefer companies that have a
diversified portfolio, with a mixture of two or more segments to spread the risk profile.
Key recommendations
We would not apply a blanket target multiple to the sector, but from a stock point of view we
regard some current valuations as overly cautious. Our preference would be for Raven Russia as a
pure play on warehouse, the most attractive segment in the sector, plus MirLand and RGI, as they
are mixed developers and both have a major residential project that will drive growth over the next
few years.
Exhibit 1: Russian comparative valuations
Price (local)
Market cap (£m)
FV local
P/NAV (x) 2011
P/NAV (x) 2012e
Yield (%) 2011
AFI Development $0.39 257 $0.55 0.20 0.22 0.0 MirLand 102p 106 160p 0.50 0.49 0.0 Raven Russia 65.8p 385 73.5p 0.91 0.94 4.5 RGI International $1.60 157 $2.40 0.55 0.54 0.0 PIK Group $2.20 692 $2.16 0.84 0.84 0.0 Average/total
1,598 0.59 0.60
Source: Company data, Edison Investment Research, Bloomberg. Note: AFID, PIK and RGI are quoted in US$.
AFI Development: AFID is the largest of the London-listed developers, with large-scale commercial
(office and retail) and residential projects in Moscow and the regions, although its segmental and
geographical diversification has not prevented it suffering from project revisions and impairments
MirLand: Diversified exposure to office, retail and residential in Moscow and the regions.
PIK Group: One of the largest residential developers in Russia, with a huge portfolio and strong
national brand, but still rebuilding its balance sheet after the financial crisis.
Raven Russia: A pure play on our preferred property segment and the quality stock in the sector.
RGI International: Niche residential and retail developer, now shifting towards the mid-market
segment from its previous focus on high-end projects.

4 | Edison Investment Research | Sector research | Russian real estate | September 2012
Investment thesis: Asset recovery not yet in valuations
Sector recovery increasingly evident The Russian real estate sector has seen a significant and widespread rebound from the crisis
induced lows of 2009. This is true to varying degrees across all market segments. From office to
retail, industrial and residential, the overriding picture is of strong demand, tightening supply, falling
vacancies, rising rents and/or prices and falling investment yields. This theme is most evident in
Moscow, the dominant market, but is also becoming as true in other regional markets, including St
Petersburg.
This has been reflected in rising asset values… The improving sector backdrop has been translated into consistent improvement in asset values
since 2009, as prices have risen and yields have fallen. Since the low of US$3.2bn in 2009, the
aggregate NAV for the four main commercial developers has rebounded by 13% and is back to
65% of its 2007 peak level. This is a recovery that we expect to continue for the foreseeable future,
as the strength of the market feeds through into appraisal values.
Exhibit 2: Aggregate sector NAV (US$m)
Source: Company data, Edison Investment Research
…but not yet in market valuations However, this has not yet been reflected in the market valuations of the listed companies. The main
four commercial developers are currently valued at just 8% of their peak 2006 market capitalisation,
even though share prices have bounced approximately 40% from the 2008 lows. There was a
significant rebound during 2009 for most developers, but this faltered in 2010-11 and market
valuations have since more than halved again, in spite of the continued improvement in asset
values, as investors have become more risk averse about the Russian market and the sector, in the
wake of the European sovereign debt crisis.
0
1,000
2,000
3,000
4,000
5,000
6,000
2006 2007 2008 2009 2010 2011 2012e

5 | Edison Investment Research | Sector research | Russian real estate | September 2012
Exhibit 3: Aggregate market valuation (US$m)
Source: Bloomberg
This is evident from the market multiples With asset values picking up and market valuations slumping recently, market multiples have
dropped sharply, from more than 2x NAV in 2007 and c 0.9x NAV at the close of 2009, to 0.38x at
year end 2011 and slightly lower again currently. This is a reflection of investors’ risk perceptions,
which have deteriorated since the hope of improving economic conditions induced a market
recovery in 2009. While we would not expect market multiples to return to the inflated levels of over
2x NAV that we saw in 2007, P/NAVs of lower than 0.2x in one case are clearly sending a message
that investors are not comfortable with the risks of the sector.
Exhibit 4: Sector P/NAV (x)
Source: Bloomberg, company data
We believe that investor concerns have been overdone. The macro outlook remains positive,
corporate governance issues have largely been addressed and financing concerns have eased.
We would not apply a blanket target multiple to the sector, but from a stock point of view we
regard some current valuations as overly cautious.
Macro outlook remains positive The macro outlook suggests that the asset recovery in the sector should continue. Oil and metals
prices recovered very strongly from the lows of 2008-9, which has enabled the Russian economy
to rebound sharply in 2010 and 2011. Steady c 4% growth is expected to continue for the next few
years according to consensus forecasts, given the continued strength of commodity prices and
improving domestic fundamentals, including falling inflation and unemployment.
0
2,000
4,000
6,000
8,000
10,000
12,000
14,000
16,000
18,000
2006 2007 2008 2009 2010 2011 2012e
0.0
0.5
1.0
1.5
2.0
2.5
2006 2007 2008 2009 2010 2011 2012e

6 | Edison Investment Research | Sector research | Russian real estate | September 2012
In this context we believe the most attractive segments of the sector in Moscow/Russia are retail
and warehouses, given the supply and demand dynamics, occupancy levels and improving rental
rates. Generally, we prefer companies that have a diversified portfolio, with a mixture of two or
more segments to spread the risk profile.
Corporate governance issues have largely been addressed Good corporate governance is largely an issue of perception and it is difficult to link share price
performance directly to good practice. Nevertheless, we have tried to compile a checklist of
investors’ requirements and useful indicators in Exhibit 5. For example, it is generally better
received to be listed on the Main board of the LSE than on AIM. A larger free float and smaller
stake held by a controlling shareholder would often imply more protection for minority shareholders
and compliance with the UK Combined Code of corporate governance, and having a majority of
independent directors and all the requisite committees in place would normally be regarded as
positives. In most cases, the main corporate governance issues have been addressed by the
companies featured in this report, but in some cases they may still be hindered by having a
dominant controlling shareholder, or a less favourable listing.
Exhibit 5: Corporate governance checklist
AFID MirLand PIK Raven RGI
Listing GDR (A) AIM GDR LSE AIM
LSE Premium (B) Free float 36% 19% 62% 92% 60%
Controlling shareholder 64% 81% 38% 8% 40%
Disclosure of shareholdings 3% 3% N/A 3% 3%
UK Combined Code Compliant Compliant Compliant Compliant Compliant
UK Takeover Code ? No No Yes No
Independent directors 5/8 5/9 3/9 4/8 6/11
Audit committee Yes Yes Yes Yes Yes
Remuneration committee Yes Yes Yes Yes Yes
Nominations committee Yes Yes N/A Yes Yes
Dedicated IR executive Yes No Yes Yes Yes
Country of registration Cyprus Cyprus Cyprus Guernsey Guernsey
Source: Company data
Financing concerns have eased While it would be an exaggeration to say that financing is straightforward in Russia, there is no
doubt the backdrop has improved significantly from 2008-9. There are a number of large state-
owned lenders, such as Sberbank and VTB, who have substantial lending capacity and have been
increasing their loan books recently. Commercial property, especially investment-grade space in
Moscow or St Petersburg, which is rented out to top-quality tenants, is generally regarded as
attractive collateral for the banks. Land sites are generally acquired with equity and residential
development tends to be financed via pre-sales, so it is commercial construction financing that is
the most challenging, but even then financing does not tend to be the brake on a project that could
take at least two years to achieve all the required approvals and be ready to break ground.

7 | Edison Investment Research | Sector research | Russian real estate | September 2012
Exhibit 6: Debt structure
2011 data AFID (US$m)
MLD (US$m)
PIK (US$m)
Raven (US$m)
RGI (US$m)
ST debt 99 132 607 96 57 LT debt 528 218 857 466 0 Pref stock
218
Total debt 627 351 1,465 779 57 Cash 85 34 89 182 41 Net debt 542 317 1,375 598 16 Net gearing 29% 91% N/A 89% 4% LTV 23% 52% 55% 63% 10% Average debt cost 9% 6% 12% 7% 10% EBITDA cover 0.4 0.3 0.9 1.0 (22.0) Main lenders VTB/Sber Sber/EBRD Sber/Nomos Unicredit/IFC Sberbank
Source: Company data
Generally, the companies in this report are not particularly highly geared. The average net
debt/equity ratio is 85%, which may sound high, but the average LTV (loan-to-value) – the more
useful ratio, especially for commercial developers, is 44%. The only exception is PIK, which not only
has net debt of US$1.38bn but also had its equity base wiped out during the crisis, so the gearing
ratio is meaningless. However, even PIK’s average LTV is 55%, which is not the highest in the
sample. More importantly perhaps, the average debt costs have fallen significantly, to below 10%
on average (for all but PIK) and should be covered by EBITDA on average this year.
The market rewards focus and yield Two factors that appear to have an observable impact on valuations are a clearly-articulated
business model, with exposure to a particular segment of the market, and a clear intention to return
cash to shareholders. Raven Russia, for example, has been rewarded for its single-minded focus
on the warehouse segment, dividend pay-out and good corporate governance record, with a
premium rating. While the warehouse segment is perhaps the most attractive within the sector, we
believe it is the combination of this and the visibility of returns from the stock’s yield that has
produced the premium rating.
Combining business models not being rewarded In the past, company valuations benefited from developing a range of flagship projects and
producing high-development margins. The market preference now seems to have shifted towards
maximising the return from existing assets and focusing on a core segment. Raven Russia has
focused on letting out its existing space, adding capacity through bolt-on acquisitions at attractive
valuations and only developing new schemes where it has clear tenant demand.
Exhibit 7: Companies’ sector exposure
AFI MirLand PIK Raven RGI Office \ \ Hotel \ Residential \ \ \ \
Retail \ \ \
Warehouse \ Source: Company data

8 | Edison Investment Research | Sector research | Russian real estate | September 2012
Most of the other companies do not have this luxury, so continue to develop a number of large
projects. Only two of the companies, Raven and PIK, are specialists. All the others are multi-
segment, using the up-front cash flows, faster paybacks and easier financing of their residential
projects to offset the longer-term development risks of their commercial portfolios. This strategy
has not been rewarded by the market, as evidenced by the relative valuation disparity between
Raven and its peers (see Exhibit 1 on page 2).
Valuations appear to compensate for the risks We would not be comfortable applying a blanket target multiple to the sector, but from a stock
point of view we would regard some current valuations as excessively cautious. Nobody expects
former inflated multiples to be repeated any time soon, but by the same token there seems little
reason for excessive discounts to become the ‘new normal’.
For AFID to trade at less than 0.2x NAV for this year, while its peers, which have similar levels of
risk, trade on ratings of at least double, seems to penalise the stock unduly, despite the recent
profit warning. Raven trades on a discount to NAV of just 6% for this year, but deserves its
premium rating in our view. With its steady dividend yield of 5%, we see further upside to our fair
value.
MirLand and RGI have significant discounts to NAV (51% and 46% respectively for 2012e), which
may well be justified, but we do see some upside for both from current levels, as project progress
assists the former and the resolution of the shareholder dispute with Synergy benefits the latter. As
a pure residential developer, we value PIK differently from the rest of the sector (we look at the
group’s profit per m2 rather than NAV), but we do not see any upside from current valuations.
Exhibit 8: Russian comparative valuations
Price (local)
Mkt cap (£m)
FV (local)
P/NAV (x) 2011
P/NAV (x) 2012e
Yield (%) 2011
AFI Development $0.39 257 $0.55 0.20 0.22 0.0 MirLand 102p 106 160p 0.50 0.49 0.0 Raven Russia 65.8p 385 73.5p 0.91 0.94 4.5 RGI International $1.60 157 $2.40 0.55 0.54 0.0 PIK Group $2.20 692 $2.16 0.84 0.84 0.0 Average/total
1,598 0.59 0.60
Source: Company data, Edison Investment Research, Bloomberg. Note: AFID, PIK and RGI are quoted in US$.
Economic and political risks The sector is exposed to a number of economic and political risks, on top of the country risks in
relation to the macro backdrop and its effect on the supply and demand of real estate. The
availability and affordability of financing is a key risk, which, as discussed above, we believe is
largely mitigated by the companies in this report. We believe the political process remains stable,
despite the developing protest movement recently. However, political interference by local
government is another risk, because of the need for planning and permitting approvals, which has
had an impact on Moscow-based developers after the change of mayor last year.
Foreign exchange movements usually offset by valuation changes As far as currency is concerned, the companies tend to match their assets and income to their
liabilities, so PIK has 90% of its debt in RUB, whereas Raven has all its debt in US$ to match its
rental income. Given that their currency of operation is RUB and they all report in US$, they are
prone to foreign exchange gains and losses from movements in asset valuation, which are at least
partially offset by the valuation movement on the balance sheet.

9 | Edison Investment Research | Sector research | Russian real estate | September 2012
Industry analysis: Continued recovery? There is a clear theme dominating the Russian real estate sector: strong demand and tight supply
producing higher rents across all segments. The commercial office segment still has further
recovery to come, especially in rentals, as vacancies fall further. Retail space is expected to be so
tight in Moscow that rentals are likely to be squeezed further, as developers focus more on the
regions, where the regulations are less onerous. Warehouse rents may not rise that much more,
especially as development of new space increases, but yields look set to fall further. With residential
demand recovering even more quickly than for commercial schemes and pricing back to pre-crisis
levels, the attractions for developers are clear.
The recovery in real estate asset values so far looks to be justified and more is likely, as yields
continue to compress, especially in the warehouse segment. At some point, this should be
reflected in share prices, when investors are more convinced of the validity of the companies’
strategies.
Macro forecasts: Steady growth expected As Russia is a resource-based economy, it tends to grow strongly when commodity prices are
high. Oil and metals prices have recovered very strongly from the lows of 2008-9, which, together
with the problems in the banking sector, brought about the crisis in Russia. This enabled the
economy to rebound sharply in 2010 and show consistent GDP growth subsequently. This steady
c 4% growth is expected (by Rosstat and market forecasts) to be maintained for the next few
years, given the continued strength of commodity prices and improving domestic fundamentals,
including falling inflation and unemployment. Russian economic performance is so tightly correlated
to the oil price that the strength of the Ruble over the past three years closely tracks the recovery of
the Urals oil price, as the inverse correlation in Exhibit 9 shows. The Ruble’s recent appreciation (a
downward move in the chart) suggests continuing strength in the economy.
Exhibit 9: Correlation of oil price and exchange rate
Source: Bloomberg
24
26
28
30
32
34
60
70
80
90
100
110
120
2008 2009 2010 2011 2012e 2013e 2014e
(RU
B/U
S$)(U
S$/
bbl)
Average Urals price RUB/US$ exchange rate

10 | Edison Investment Research | Sector research | Russian real estate | September 2012
With the oil price at approximately US$110/bbl, the government is generating revenues in excess of
its budget estimate, which explains why GDP forecasts of c 4% have not been revised down for
2012-14, despite the weakness in the EU and the slower growth in industrial production since the
2010 recovery. This growth has continued into 2012, with GDP and industrial production growing
4.1% and 5% respectively in Q112. This was in part due to the extreme cold in the first few months
of the year, which produced significant demand for energy resources and was the main driver of
industrial production growth.
Exhibit 10: Macro forecasts
Source: Rosstat, Ministry for Economic Development
One macro indicator that had not seen much improvement until recently is inflation, mainly owing to
weather-related factors. Nevertheless, it has been falling consistently since 2009 and was just 1.5%
y-o-y in Q112, although this was partly distorted by delayed increases in utility prices. The forecast
is for inflation to fall to 5% in 2012 and to settle in the 5-6% range in 2012-14. As a result, the
refinancing rate has fallen from 13% at the end of 2008 to about 6% in the past year, while debt
markets have become more accessible, mainly due to the activity of the leading local banks.
Unemployment is also expected to continue its downward trajectory in the wake of the growth in
GDP, falling to 7% in 2012 and below in 2013-14. All of which is positive for both demand and
funding across all segments of the property sector.
Exhibit 11: Inflation and unemployment
Source: Rosstat, Ministry for Economic Development
Falling inflation and unemployment, combined with growing consumer lending, rising wage growth
and disposable income has fed through into growth in consumer spending. Real wages increased
by nearly 12% in January and February 2012 and disposable income grew by close to 3%. As a
result of this, and a preference for spending over saving among Russian citizens, retail trade
turnover grew by 7.3% in the first two months of 2012, after a more than 5% rise in 2011.
-10%
-8%
-6%
-4%
-2%
0%
2%
4%
6%
8%
2008 2009 2010 2011 2012e 2013e 2014e
GDP growth Industrial production
0%
2%
4%
6%
8%
10%
12%
14%
2008 2009 2010 2011 2012e 2013e 2014eInflation Unemployment

11 | Edison Investment Research | Sector research | Russian real estate | September 2012
With growth of 5-6% in real wages forecast in 2012-14 and c 5% in disposable income in 2013-14,
the retail sector is expected to continue its recent strong performance, which should help to sustain
investment in retail real estate.
Exhibit 12: Real wage and disposable income growth
Source: Rosstat, Ministry for Economic Development
Commercial segment: Falling vacancies to boost rental rates Commercial supply remains limited, especially in the wake of tighter planning restrictions brought in
by the new Mayor of Moscow in the last year, and demand has recovered well to drive down
vacancy levels, but this has not yet been fully reflected in office rental rates and investment
volumes, despite a fall in initial yields.
Moscow has among the lowest level of office stock per capita relative to other European capitals,
with just 1.2m2 per head, compared with 5m2 in London, 6m2 in Paris and as high as 17m2 in
Frankfurt (see Exhibit 13 below).
Exhibit 13: Office stock per capita (m2)
Source: JLL
Total office stock in Moscow is approximately 12.3m m2, with another 350,000m2 expected to be
delivered this year, taking the total to 12.65m m2. The trend of new delivery has been downward,
with Cushman & Wakefield (C&W) estimating that 600,000m2 was completed in 2011, compared
with 914,000m2 during 2010. A class property (the highest-quality investment grade space)
represents only about 22% of the total stock, and much of this is not centrally located. Despite new
restrictions brought in by the new mayor on large-scale commercial projects, especially in the
central administrative district, there is still a pipeline of almost 2.2m m2 of new space for delivery
over the next three years, but in reality this is likely to be delivered over a longer timescale.
-4%
-2%
0%
2%
4%
6%
8%
10%
12%
14%
2008 2009 2010 2011 2012e 2013e 2014e
Real disposable income Real wage growth
02468
1012141618
Mos
cow
Pra
gue
Bud
apes
t
War
saw
Mad
rid
Dub
lin
Lond
on
Am
ster
dam
Par
is
Fran
kfur
t
(m2/
capi
ta)

12 | Edison Investment Research | Sector research | Russian real estate | September 2012
Exhibit 14: Moscow office stock (million m2)
Source: C&W, MirLand
The improvement in the macroeconomic backdrop has led to a marked recovery in business
confidence and hence the demand for commercial space. After halving in 2009, demand
rebounded sharply in 2010 to nearly 1.5m m2. Jones Lang LaSalle (JLL) estimates there was a
further improvement in 2011 to 1.75m m2, with only 0.6m m2 added to supply last year. In Q112,
office take-up reached 300,000m2. Although this was less than 20% of total demand in 2011, Q1
is generally the quietest quarter seasonally, suggesting the year has started well.
Exhibit 15: Moscow office take-up (000’s m2)
Source: Jones Lang LaSalle
With demand almost back to the peak levels of 2007-8, the average vacancy rate for Class A
space overall has only fallen slightly from over 20% at the start of last year to 18% by year end,
owing to the amount of supply under construction when the crisis struck. However, the rate for
Class A space in the central business district fell to just 5% in 2011 from 11% in 2009. While this is
still above the lows of 2005-8, it underlines the added attraction of the best quality space in the
centre of the capital.
0
2
4
6
8
10
12
14
2005 2006 2007 2008 2009 2010 2011 2012e
Class A Class B
0
400
800
1,200
1,600
2,000
2000
2001
2002
2003
2004
2005
2006
2007
2008
2009
2010
2011
Q11
2

13 | Edison Investment Research | Sector research | Russian real estate | September 2012
Exhibit 16: Moscow office vacancy
Source: JLL, AFID, C&W
According to Cushman & Wakefield, there is only 0.4m m2 of the 2.8m2 of A class space currently
vacant, so if total market demand in 2012 reaches the same level as last year (1.75m m2) and only
0.35m m2 of new A class space is added, then vacancy rates should fall quickly and a shortage
could even emerge in the next year. Even the total vacant space of 1.86m m2 would be significantly
reduced if demand reached the same level as last year, given the lack of new supply expected this
year.
Exhibit 17: Moscow office supply split (million m2) 2012e
Source: MirLand, C&W
After slumping sharply in 2009, A Class rental rates have recovered well, rising 11% in 2010 and
another 10% in 2011. Although rents are still only just over half the former peak, they rose as much
in Q1 as most forecasters were expecting for the whole year. With prime rents in the Central
Business District now back at US$1,000/m2 per year, excluding operating expenses and VAT, the
spread over the average rates for A class properties has narrowed to US$200/m2. Class B rental
rates have recovered much less, because demand is lower and vacancy levels are higher.
0%
5%
10%
15%
20%
2005 2006 2007 2008 2009 2010 2011
Class A vacancy CBD class A vacancy
Class A occupied16%
Class B occupied71%
Class A vacant3%
Class B vacant10%
14 | Edison Investment Research | Sector research | Russian real estate | September 2012
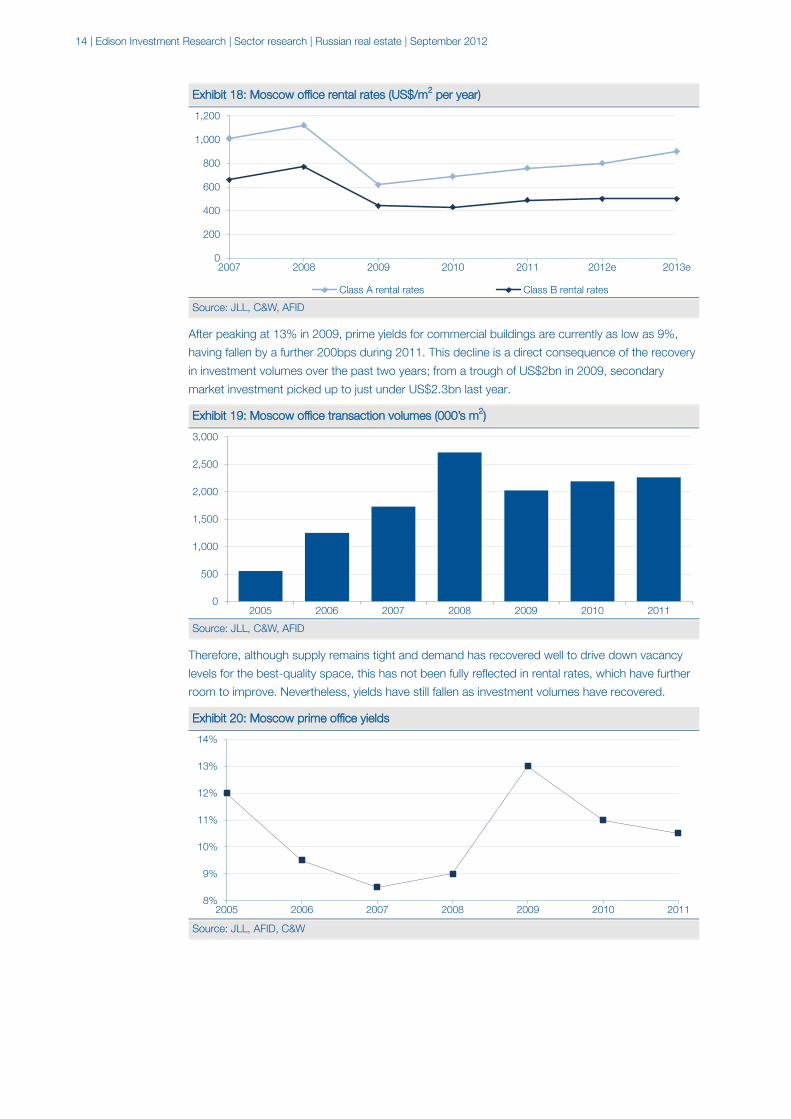
Exhibit 18: Moscow office rental rates (US$/m2 per year)
Source: JLL, C&W, AFID
After peaking at 13% in 2009, prime yields for commercial buildings are currently as low as 9%,
having fallen by a further 200bps during 2011. This decline is a direct consequence of the recovery
in investment volumes over the past two years; from a trough of US$2bn in 2009, secondary
market investment picked up to just under US$2.3bn last year.
Exhibit 19: Moscow office transaction volumes (000’s m2)
Source: JLL, C&W, AFID
Therefore, although supply remains tight and demand has recovered well to drive down vacancy
levels for the best-quality space, this has not been fully reflected in rental rates, which have further
room to improve. Nevertheless, yields have still fallen as investment volumes have recovered.
Exhibit 20: Moscow prime office yields
Source: JLL, AFID, C&W
0
200
400
600
800
1,000
1,200
2007 2008 2009 2010 2011 2012e 2013e
Class A rental rates Class B rental rates
0
500
1,000
1,500
2,000
2,500
3,000
2005 2006 2007 2008 2009 2010 2011
8%
9%
10%
11%
12%
13%
14%
2005 2006 2007 2008 2009 2010 2011
15 | Edison Investment Research | Sector research | Russian real estate | September 2012
Retail segment: Expanding consumption With continued growth in retail turnover attracting more international and domestic retailers to
expand their presence in the country, pressure on retail space should continue. Rental rates are
thus likely to be squeezed higher, owing to a lack of new supply to meet the demand, especially in
Moscow. Current development activity is focused more on the regions, where planning
requirements are less onerous than in Moscow. Yields in Moscow may therefore fall further as
investment volumes recover.
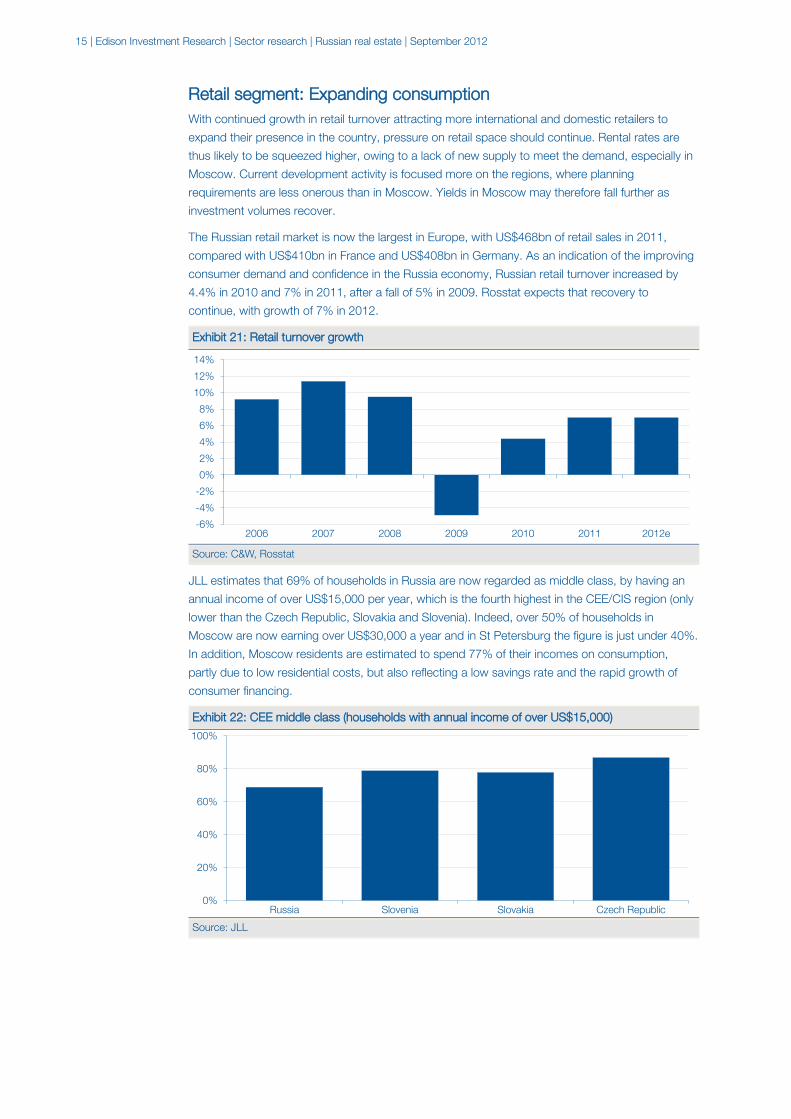
The Russian retail market is now the largest in Europe, with US$468bn of retail sales in 2011,
compared with US$410bn in France and US$408bn in Germany. As an indication of the improving
consumer demand and confidence in the Russia economy, Russian retail turnover increased by
4.4% in 2010 and 7% in 2011, after a fall of 5% in 2009. Rosstat expects that recovery to
continue, with growth of 7% in 2012.
Exhibit 21: Retail turnover growth
Source: C&W, Rosstat
JLL estimates that 69% of households in Russia are now regarded as middle class, by having an
annual income of over US$15,000 per year, which is the fourth highest in the CEE/CIS region (only
lower than the Czech Republic, Slovakia and Slovenia). Indeed, over 50% of households in
Moscow are now earning over US$30,000 a year and in St Petersburg the figure is just under 40%.
In addition, Moscow residents are estimated to spend 77% of their incomes on consumption,
partly due to low residential costs, but also reflecting a low savings rate and the rapid growth of
consumer financing.
Exhibit 22: CEE middle class (households with annual income of over US$15,000)
Source: JLL
-6%
-4%
-2%
0%
2%
4%
6%
8%
10%
12%
14%
2006 2007 2008 2009 2010 2011 2012e
0%
20%
40%
60%
80%
100%
Russia Slovenia Slovakia Czech Republic
16 | Edison Investment Research | Sector research | Russian real estate | September 2012
Retail supply
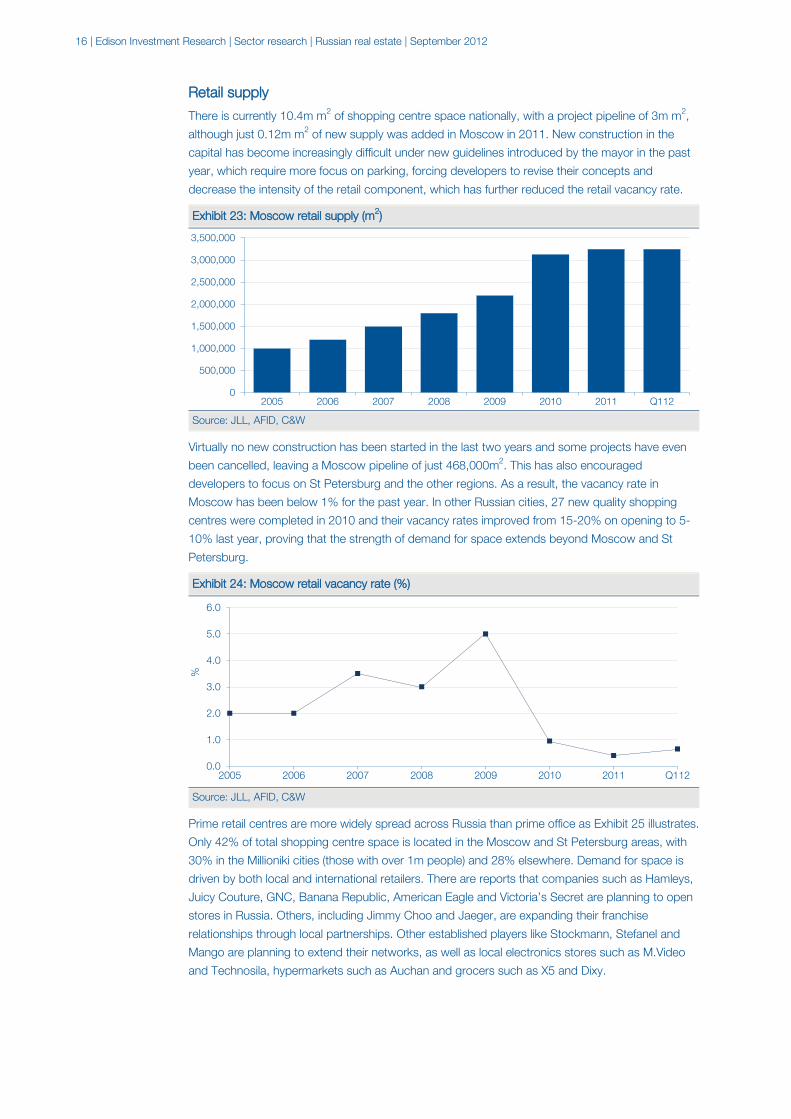
There is currently 10.4m m2 of shopping centre space nationally, with a project pipeline of 3m m2,
although just 0.12m m2 of new supply was added in Moscow in 2011. New construction in the
capital has become increasingly difficult under new guidelines introduced by the mayor in the past
year, which require more focus on parking, forcing developers to revise their concepts and
decrease the intensity of the retail component, which has further reduced the retail vacancy rate.
Exhibit 23: Moscow retail supply (m2)
Source: JLL, AFID, C&W
Virtually no new construction has been started in the last two years and some projects have even
been cancelled, leaving a Moscow pipeline of just 468,000m2. This has also encouraged
developers to focus on St Petersburg and the other regions. As a result, the vacancy rate in
Moscow has been below 1% for the past year. In other Russian cities, 27 new quality shopping
centres were completed in 2010 and their vacancy rates improved from 15-20% on opening to 5-
10% last year, proving that the strength of demand for space extends beyond Moscow and St
Petersburg.
Exhibit 24: Moscow retail vacancy rate (%)
Source: JLL, AFID, C&W
Prime retail centres are more widely spread across Russia than prime office as Exhibit 25 illustrates.
Only 42% of total shopping centre space is located in the Moscow and St Petersburg areas, with
30% in the Millioniki cities (those with over 1m people) and 28% elsewhere. Demand for space is
driven by both local and international retailers. There are reports that companies such as Hamleys,
Juicy Couture, GNC, Banana Republic, American Eagle and Victoria’s Secret are planning to open
stores in Russia. Others, including Jimmy Choo and Jaeger, are expanding their franchise
relationships through local partnerships. Other established players like Stockmann, Stefanel and
Mango are planning to extend their networks, as well as local electronics stores such as M.Video
and Technosila, hypermarkets such as Auchan and grocers such as X5 and Dixy.
0
500,000
1,000,000
1,500,000
2,000,000
2,500,000
3,000,000
3,500,000
2005 2006 2007 2008 2009 2010 2011 Q112
0.0
1.0
2.0
3.0
4.0
5.0
6.0
2005 2006 2007 2008 2009 2010 2011 Q112
%

17 | Edison Investment Research | Sector research | Russian real estate | September 2012
Exhibit 25: Shopping centre distribution
Source: JLL
Retail rents proved more resilient than the commercial segment in the 2008/9 downturn and so
have rebounded less over the past two years. Nevertheless, Moscow rental rates rose by 10-15%
in 2010, were flat in 2011 and have increased by another 5% in Q112, in line with market forecasts
for a 6-7% rise for the full year. Despite already being among the highest in Europe, this increase
results from tight supply and continued strong demand. Rental rates are now 12.5% off the 2008
peak, with prime rates of US$2,700-4,000/m2 and average rates of US$500-1,350/m2.
Exhibit 26: Moscow retail rates (US$/m2 per year)
Source: JLL, AFID, C&W
The level of secondary transactions in the retail segment in Moscow collapsed from US$1.5bn in
2008 to just US$370-380m in 2009-10 and even zero in Q111. However, for the full year 2011
there was a startling recovery to US$1.7bn, as investors responded to the pick-up in the market
and once again began to appreciate the apparently attractive long-term fundamentals.
Moscow25%
Moscow region4%
St Petersburg13%
Millioniki30%
Other cities28%
0
1,000
2,000
3,000
4,000
5,000
6,000
2005 2006 2007 2008 2009 2010 2011 2012
Prime rents Base rents

18 | Edison Investment Research | Sector research | Russian real estate | September 2012
Exhibit 27: Secondary investment in retail assets (US$m)
Source: JLL, AFID, C&W
It is, therefore, less clear what drove the yield compression in 2010 to 11%, given the lack of
transactions, but the lack of space available for sale and a few one-off deals are likely to have
driven up sales values. Market yields have since declined to 10.5% and look likely to fall further if
the level of transactions is maintained this year.
Exhibit 28: Retail prime yields
Source: JLL, AFID, C&W
We conclude that regional shopping centres will continue to be a priority for developers and that
new supply in Moscow is likely to remain limited, partly due to tight planning restrictions. Even if all
the currently planned projects in Moscow are completed this year, supply would only reach 294m2
per 1,000 inhabitants, up from 276m2 currently, still lower than many other smaller Russian cities.
This is likely to maintain pressure on vacancy levels and drive up rental rates in the 2013-14 period.
Warehouse segment: Back to peak levels already Further recovery in warehouse rental rates looks likely, with vacancy rates already so low in
Moscow, a lack of new construction and the strength of demand. This should result in a further fall
in yields, but for these to reach the former lows, a recovery in investment volumes may well be
required. There are currently too few transactions available to establish a meaningful market level.
Russia’s lack of supply in the industrial segment is startling. In the capital city there is currently 7m
m2 of A and B class warehouse space, but Moscow still has among the lowest level of modern
warehouse space per capita in Europe, as Exhibit 29 shows.
0
200
400
600
800
1,000
1,200
1,400
1,600
1,800
2005 2006 2007 2008 2009 2010 2011
8%
9%
10%
11%
12%
13%
14%
2005 2006 2007 2008 2009 2010 2011

19 | Edison Investment Research | Sector research | Russian real estate | September 2012
Exhibit 29: Modern warehouse stock per capita (m2)
Source: Raven Russia
New supply fell to just over 400,000m2 in 2010 and dropped to just 150,000m2 in 2011, 76,000m2
of which was delivered in Q111. New construction volumes have fallen so much that a shortage of
supply of high-quality warehouse space that is ready for tenants to occupy, is expected this year.
The majority of the current stock was built speculatively, as the level of vacancy meant that pre-lets
were relatively rare, but now that it has fallen developers are expecting a growing demand for pre-
lets and projects that are built to suit.
Exhibit 30: Annual change in A class supply
Source: Colliers, Raven Russia
Although supply additions are expected to pick up this year to over 600,000m2, take up is forecast
to reach 1m m2 and will therefore exceed new supply by over 300,000m2, so the market situation
is anticipated to become even tighter. Tenant demand is still dominated by retail and distribution
companies, but the share of manufacturing tenants has also increased recently.
0.0
2.0
4.0
6.0
8.0
10.0
12.0
Paris Prague Warsaw London Budapest Berlin Moscow
(m²)
0%
5%
10%
15%
20%
25%
30%
2007 2008 2009 2010 2011 2012e
%

20 | Edison Investment Research | Sector research | Russian real estate | September 2012
Exhibit 31: Warehouse supply and demand (m2)
Source: Colliers, Raven Russia
In the year 2009-10 alone, the Moscow vacancy rate fell from 18% to 7% on the back of strong
demand and modest construction volumes. Indeed, after a record quarter in Q410, with take-up of
0.5m m2, demand remained high going into 2011. As a result, the vacancy rate fell further to 3.7%
in Q111 and as demand continues to improve, the remaining net space is expected to be
absorbed in 2012.
Exhibit 32: Moscow class A vacancy rate
Source: Colliers, Raven Russia
Rental rates for Class A space suffered from oversupply and lower occupancy rates in 2009, but
recovered in 2010-11 to approximately US$125-135/m2/year, plus operating expenses of c
US$40/m2. Rents for B class property are US$15-20/m2 lower at US$110-115/m2, while prime
rents are even higher. Despite the expectation of tight supply and demand, Moscow already has
the second highest rents in Europe, so is unlikely to see significant further rises from current levels.
0
200,000
400,000
600,000
800,000
1,000,000
1,200,000
1,400,000
1,600,000
2007 2008 2009 2010 2011 2012e
(m²)
Annual addition Annual take-up
0%
2%
4%
6%
8%
10%
12%
2006 2007 2008 2009 2010 2011 2012e

21 | Edison Investment Research | Sector research | Russian real estate | September 2012
Exhibit 33: Warehouse rents and opex (US$ m2 per year)
Source: JLL, Raven Russia
Yields have come down from their financial crisis induced peaks of 14-15% in 2009, but are still
some 20% above their nine-year lows, at levels of 11-12%. However, to reach the former troughs
of 9-10%, investment volumes may need to recover more strongly.
Exhibit 34: Moscow prime industrial yields
Source: C&W
We conclude that market yields and therefore asset valuations still have some way to go to reach
former peaks, in spite of the tight market fundamentals and the rebound in rental rates. Unless
there is a significant increase in new supply in the next year, the market backdrop in this segment is
probably the most favourable within the overall real estate space and supports those companies
with exposure, explaining the premium rating Raven Russia currently commands.
Residential segment: Fundamentals remain in favour Residential projects are less restricted in terms of financing and planning approvals, and benefit
from attractive long-term fundamentals. Many commercial developers have diversified into
residential projects, because this can provide more immediate cash flows and a faster payback on
land sites. This is especially so in Moscow and the surrounding area, due to a simpler regulatory
and planning regime. With demand recovering even more quickly than for commercial schemes
and pricing back to pre-crisis levels, the attractions for developers are obvious.
Russia suffers from an acute lack of quality housing stock, with just 22m2 per capita on a national
basis, compared with 66m2 in the US; even in China the level is 50% higher, at 31m2. The situation
is not helped by the lack of mortgage penetration in Russia, with housing debt to GDP at just 3%
last year, compared with 86% in the UK and 13% in China.
0
50
100
150
200
2001 2002 2003 2004 2005 2006 2007 2008 2009 2010 2011e 2012e
Rent Opex
8%
9%
10%
11%
12%
13%
14%
15%
2005 2006 2007 2008 2009 2010 2011 2012

22 | Edison Investment Research | Sector research | Russian real estate | September 2012
Exhibit 35: Housing stock per capita (m2)
Source: Rosstat, Euromonitor, UNECE
Mortgage lending rallied sharply throughout 2010 and 2011, growing at over 100% per quarter, but
remains approximately 40% below the 2008 peak. Despite the growth of mortgage lending over
the past two years, it started from such a low base that, with GDP also rebounding, its share of
GDP remains the lowest of any comparable country.
Exhibit 36: Housing debt to GDP
Source: Rosstat, Euromonitor, UNECE
The growth of mortgage lending since the trough in the financial crisis, whether measured by the
number or value of loans, has a lot to do with the steady fall in mortgage rates over the last two
years, both in local and foreign currency terms, which has substantially increased mortgage
affordability for ordinary people.
Exhibit 37: Average mortgage rates
Source: LSR Group
2225 31 32
36 37 38 39 4344 52
66
0
10
20
30
40
50
60
70
Rus
sia
Latv
ia
Chi
na
Hun
gary
Cze
ch R
epub
lic UK
Finl
and
Aus
tria
Ger
man
y
Fran
ce
Den
mar
k
US
(m²/
capi
ta)
3%13% 15%
25% 28%
40%46%
54% 54%66%
86% 92%
0%
20%
40%
60%
80%
100%
Rus
sia
Chi
na
Hun
gary
Cze
ch
Aus
tria
Fran
ce
Ger
man
y
Finl
and
Latv
ia
US
UK
Den
mar
k
9%
10%
11%
12%
13%
14%
15%
Q109 Q209 Q309 Q409 Q110 Q210 Q310 Q410 Q111 Q211 Q311 Q411 Q112 Q212
RUB loans Foreign currency

23 | Edison Investment Research | Sector research | Russian real estate | September 2012
This has in turn fed through into secondary transactions (Exhibit 38), which in Moscow picked up
sharply in 2010, rising at an average quarterly rate of 56% after turning positive in Q409. Looking at
y-o-y comparisons, transactions were ahead of the previous two years in each quarter to Q111 (the
latest for which data is available).
Exhibit 38: Secondary market transactions in Moscow (units)
Source: PIK Group
Another key driver of residential demand has been the growth in disposable income, which has
rebounded very strongly from the low in mid-2009. As the chart below shows, real disposable
income growth has significantly outpaced GDP growth in the past two years and this has been a
significant factor in the ability as well as the desire of people to invest in residential property. This
has reinforced the impacts of falling mortgage rates and other demographic factors, including
household creation.
Exhibit 39: Disposable income growth (Q107=100)
Source: Rosstat, EIU
Affordability in Russia has improved significantly, as a result of falling mortgage rates and rising
incomes and by 2010 was at the best level since before the crisis. We believe the trend has
continued. Although Moscow remains more expensive on this measure, it is now less so than it
was in 2008.
0
5,000
10,000
15,000
20,000
25,000
30,000
Q10
8
Q20
8
Q30
8
Q40
8
Q10
9
Q20
9
Q30
9
Q40
9
Q11
0
Q21
0
Q31
0
Q41
0
Q11
10
20
40
60
80
100
120
140
160
Q10
8
Q20
8
Q30
8
Q40
8
Q10
9
Q20
9
Q30
9
Q40
9
Q11
0
Q21
0
Q31
0
Q41
0
Q11
1
Q21
1
Real disposable income growth y-o-y Real GDP growth y-o-y

24 | Edison Investment Research | Sector research | Russian real estate | September 2012
Exhibit 40: Affordability (% of average income spent on mortgage financing)
Source: Rosstat, EIU
Affordability has improved, despite the fact that residential prices have rallied since the mid-crisis
trough. As an example, PIK’s realised prices were up 10% on average across Russia in both 2010
and 2011, with gains of over 11% in Moscow and the Moscow region being partially offset by lower
gains elsewhere. This recovery continued in Q112, as PIK saw prices rise another 5% in Moscow
and 3% on average across Russia in local terms. Prices are now on average 20% above the 2009
low in Moscow and 21% higher on average across Russia.
Exhibit 41: Average realised prices (RUB000’s/m2)
Source: PIK
Indeed, the index of average Moscow residential prices was just 12% below the 2008 peak in local
terms by the end of 2011, after an increase of 20% during 2010-11 to RUB140,000/m2 (US$5,000)
offset the sharp 27% drop during the market slump in 2009.
Exhibit 42: Moscow average residential prices
Source: IRN index
51%57%
67%64% 60%55% 58% 56% 55%
48%
0%
10%
20%
30%
40%
50%
60%
70%
80%
2006 2007 2008 2009 2010
Moscow Russian average
0
20
40
60
80
100
120
140
2009 2010 2011 Q112Moscow Moscow region Other regions
0
20
40
60
80
100
120
140
160
180
2002 2003 2004 2005 2006 2007 2008 2009 2010 2011
(RU
B00
0's/
m²)

25 | Edison Investment Research | Sector research | Russian real estate | September 2012
Beyond Moscow the correction in residential prices after the 2008/9 crisis was less severe. Even
so, prices in St Petersburg have picked up a little, gaining 7% in the elite market from the low in
2009. However, prices in the mass market segment have recovered only marginally, rising
approximately 2% to RUB73,000/m2 (US$2,600).
Exhibit 43: St Petersburg residential prices (RUB000’s/m2)
Source: SPb Realty
Overall, commercial space is clearly more attractive to foreign institutional investors than residential
property, given its stable, high-quality tenants, greater access to financing, better transparency,
superior market statistics and more widely-available forecasts. This is especially the case in a
market like Moscow, where international investors are attempting to reduce risk and volatility.
However, the residential segment has huge attractions for developers too, as a result of the ability
to self-finance projects, less restrictive planning policies, lack of supply, stable demand dynamics
and prices that were quick to rebound in the prime segment and generally held up well in the
economy and business segments. As a result, developers are often keen to combine the two
segments within their portfolios, even if they are not currently being rewarded for the diversification
strategy by investors, as residential business models seem less well understood than commercial
and have shown more volatility in the past.
0
50
100
150
200
250
2002 2003 2004 2005 2006 2007 2008 2009 2010 2011
Elite Mass market

26 | Edison Investment Research | Sector research | Russian real estate | September 2012

27 | Edison Investment Research | Sector research | Russian real estate | September 2012
Company profiles
28 | Edison Investment Research | AFI Development | September 2012
AFI Development
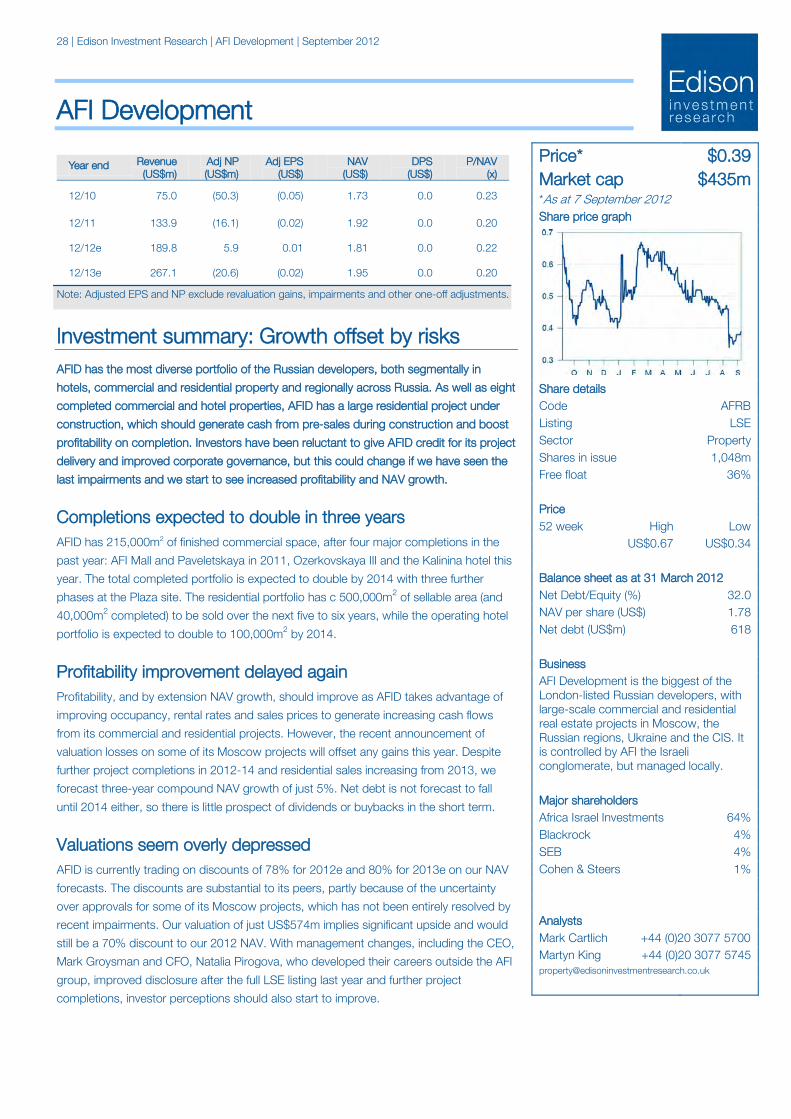
Investment summary: Growth offset by risks AFID has the most diverse portfolio of the Russian developers, both segmentally in
hotels, commercial and residential property and regionally across Russia. As well as eight
completed commercial and hotel properties, AFID has a large residential project under
construction, which should generate cash from pre-sales during construction and boost
profitability on completion. Investors have been reluctant to give AFID credit for its project
delivery and improved corporate governance, but this could change if we have seen the
last impairments and we start to see increased profitability and NAV growth.
Completions expected to double in three years AFID has 215,000m2 of finished commercial space, after four major completions in the
past year: AFI Mall and Paveletskaya in 2011, Ozerkovskaya III and the Kalinina hotel this
year. The total completed portfolio is expected to double by 2014 with three further
phases at the Plaza site. The residential portfolio has c 500,000m2 of sellable area (and
40,000m2 completed) to be sold over the next five to six years, while the operating hotel
portfolio is expected to double to 100,000m2 by 2014.
Profitability improvement delayed again Profitability, and by extension NAV growth, should improve as AFID takes advantage of
improving occupancy, rental rates and sales prices to generate increasing cash flows
from its commercial and residential projects. However, the recent announcement of
valuation losses on some of its Moscow projects will offset any gains this year. Despite
further project completions in 2012-14 and residential sales increasing from 2013, we
forecast three-year compound NAV growth of just 5%. Net debt is not forecast to fall
until 2014 either, so there is little prospect of dividends or buybacks in the short term.
Valuations seem overly depressed AFID is currently trading on discounts of 78% for 2012e and 80% for 2013e on our NAV
forecasts. The discounts are substantial to its peers, partly because of the uncertainty
over approvals for some of its Moscow projects, which has not been entirely resolved by
recent impairments. Our valuation of just US$574m implies significant upside and would
still be a 70% discount to our 2012 NAV. With management changes, including the CEO,
Mark Groysman and CFO, Natalia Pirogova, who developed their careers outside the AFI
group, improved disclosure after the full LSE listing last year and further project
completions, investor perceptions should also start to improve.
Year end Revenue (US$m)
Adj NP (US$m)
Adj EPS (US$)
NAV (US$)
DPS (US$)
P/NAV (x)
12/10 75.0 (50.3) (0.05) 1.73 0.0 0.23
12/11 133.9 (16.1) (0.02) 1.92 0.0 0.20
12/12e 189.8 5.9 0.01 1.81 0.0 0.22
12/13e 267.1 (20.6) (0.02) 1.95 0.0 0.20
Note: Adjusted EPS and NP exclude revaluation gains, impairments and other one-off adjustments.
Price* $0.39 Market cap $435m *As at 7 September 2012 Share price graph
Share details Code AFRB Listing LSE Sector Property Shares in issue 1,048m Free float 36% Price 52 week High Low US$0.67 US$0.34 Balance sheet as at 31 March 2012 Net Debt/Equity (%) 32.0 NAV per share (US$) 1.78 Net debt (US$m) 618 Business AFI Development is the biggest of the London-listed Russian developers, with large-scale commercial and residential real estate projects in Moscow, the Russian regions, Ukraine and the CIS. It is controlled by AFI the Israeli conglomerate, but managed locally.
Major shareholders Africa Israel Investments 64% Blackrock 4% SEB 4% Cohen & Steers 1% Analysts Mark Cartlich +44 (0)20 3077 5700 Martyn King +44 (0)20 3077 5745 [email protected]

29 | Edison Investment Research | AFI Development | September 2012
Potential portfolio of over two million m2 AFID has completed 12 commercial and residential projects in Russia and has 215,000m2 of
commercial space, with over 90% occupancy, after four completions in the past year. It has a
potential pipeline of more than 20 projects, with in excess of two million m2 of potential space,
which is expected to be completed over the next five to seven years. The residential portfolio is
dominated by the 478,000m2 Odintsovo/Otradnoye project, which is now in the construction
and pre-sales phase. AFID is majority owned by Africa Israel Group, an Israeli conglomerate
with real estate, construction and infrastructure operations globally.
Limited NAV growth expected after the Q212 impairment losses Jones Lang Lasalle valued AFID’s property assets at US$2.4bn as at June 2012, a decrease of
14% since December, but still 4% up YoY, as the AFI Mall completion in H111 was offset by
impairments. There have been two completions this year totaling 60,000m2, so we expect to
see further value uplift from these projects, although this will be offset by the US$240m of
valuation and impairment losses that were pre-announced for Q212, mainly resulting from
changes to the Moscow government’s master planning and development policies. Therefore,
we forecast NAV to grow at a three-year compound rate of 5%, starting with a 4% fall this year.
Portfolio gearing remains low AFID had total debt of US$701m and cash and equivalents of US$128m as at H112, so net
debt was only US$573m and net gearing was just 35%. The group has sufficient secured debt
financing to complete the short-term commercial pipeline, using only financing secured against
the individual projects, without recourse to the group. Most projects also have low loan to value
ratios. Indeed the current LTV of the portfolio has increased just 3% in a year to 30%.
Now trading at a substantial discount to NAV We estimate a valuation of US$1.6bn for the portfolio, approximately 33% below the JLL figure,
incorporating only completed projects. Completed investment property is valued at US$1.5bn,
on yields of 10.5-11%, excluding projects under development, or in the land bank with no
defined start dates. The residential projects are valued at just US$22m, despite the completion
value of US$1.3bn, because of their long timelines (three to five years). With US$84m of
completed hotels, we reach a fair value of US$574m (still a 70% discount to our 2012 NAV).
The stock is currently trading at discounts of 78% and 80% to 2012e and 2013e NAVs.
Corporate governance concerns addressed, but risks remain Corporate governance is often cited as a reason for negative investor perceptions around AFID.
This is largely a hangover from the poorly-handled IPO, especially the over-inflated valuations
and the poor share price performance subsequently, which was partly attributable to the
financial crisis. With a full listing on the LSE, a new CEO and CFO, compliance with the UK
corporate governance code, a board with a majority of independent directors and all the
required committees, the company has gone a long way to meeting investor concerns. Further
details on the board are available on the company’s website.
However, with a free float of just 36%, there are always likely to be concerns over the
protection of minorities. The main risk, other than sector development and funding issues, is
revisions to the Moscow government’s planning policies. Catalysts include further improving
investor perceptions of the group, which seem not to have changed despite the LSE move.
Some form of compensation for the city’s takeover of the Tverskaya Zastava project is also
expected.

30 | Edison Investment Research | AFI Development | September 2012
Exhibit 44: Valuation (US$m)
SOTP valuation GLA (m2) Rental income Yield Completion date Discount rate Project (NPV)
Four Winds Plaza Office 22,043 16.4 10.5% 12.8% 153.6
Ozerkovskaya IV 1,545 0.5 11.0%
12.8% 4.6
H2O 8,996 2.5 11.0% 12.8% 21.9
AFI Mall City 107,080 130.0 10.5% 12.8% 1,217.6
Paveletskaya 14,035 4.2 11.0%
12.8% 37.6
Berezhkovskaya 10,259 4.7 11.0% 12.8% 30.7
Plaza II 35,030 29.8 11.0% 2013-14
Plaza IIa 4,321 3.8 11.0% Jun 12 Plaza IV 80,397 68.5 11.0% 2013-14 Ozerkovskaya Phase III 46,394 18.6 11.0% Mar 12
Investment properties 366,403 335 1,466
Total Hotels 134,599 50.7
85.8
Residential portfolio GSA (m2) Sales income Profit Completion date Discount rate Project (NPV)
Otradnoye 477,980 1,371 584 Dec 17 Botanic Garden 67,181 423 208 N/A
Plaza I Residential 51,256 666 476 Dec 14 Ozerkovskaya III Residential 5,108 15 12 Mar 12 Properties under development
601,525 2,475 1,280
Four Winds Residential 18,272 12 11 Dec 08 12.8% 3.7
Ozerkovskaya Phase II 16,711 30 27 Dec 08 12.8% 18.5
Completed properties 34,983 43 38
22.2
Portfolio total 1,137,510
1,574
Net current assets 116
Net debt & minorities (1,074)
Other liabilities
(72)
Adjusted NAV 544
Mid-year adjustment
1.05
Fair value at year end 574
Fair value per share (US$) 0.55
Source: Company data, Edison Investment Research
Exhibit 45: Corporate governance checklist
Listing GDR (A shares)
Premium (B shares)
Free float 36%
Controlling shareholder 64%
Disclosure of shareholdings 3%
UK Corporate Governance Code Compliant
Independent directors 5/8
Audit committee Yes
Remuneration committee Yes
Nomination committee Yes
Registration Cyprus
Source: Company data
For further information see the corporate governance page on the company’s website.

31 | Edison Investment Research | AFI Development | September 2012
Exhibit 46: Financial summary
Source: Company data, Edison Investment Research. Note: Adjusted EPS and net income exclude revaluation gains, impairments and other one-off adjustments.
US $ m 2008 2009 2010 2011 2012e 2013 eDec IFR S IFR S IFR S IFR S IFR S IFR SPR OFIT & LOS S R evenue 113 6 3 75 13 4 19 0 26 7Cost of Sales (73) (29) (39) (8 2) (76) (122)Gross Profit 40 34 36 51 114 145EB ITDA 26 26 15 20 79 105Opera ting Prof i t (be fore amort. and except.) 26 26 15 20 79 105Intangible Amortisation 0 0 0 1 0 0Revaluations (155) 23 76 269 (116) 168Other 0 (0) (18 ) (1) 0 0Opera ting Prof i t (129 ) 49 73 28 8 (3 7) 273Net Interest 3 (4) (3) (41) (71) (133)Prof i t B e fore Tax ( IFR S ) (126 ) 45 70 248 (108 ) 141Tax 18 (47) (44) (75) 26 (34)Minority interests (1) (1) (0) (1) 0 (0)Net income (Adj NP) 46 (27) (50) (16 ) 6 (21)Net income ( IFR S ) (109 ) (4) 26 172 (8 2) 106
Average Number of Shares Outstanding (m) 1,047.7 1,047.7 1,047.7 1,047.7 1,047.7 1,047.7EPS - adjus ted (US $ ) 0.04 (0.03 ) (0.05) (0.02) 0.01 (0.02)EPS - adjus ted and fu l ly di luted (US $ ) 0.04 (0.03 ) (0.05) (0.02) 0.01 (0.02)EPS - ( IFR S ) (US $ ) (0.10) (0.00) 0.02 0.16 (0.08 ) 0.10Dividend (US$) 0.00 0.00 0.00 0.00 0.00 0.00
Gross Margin (%) 35.2 54.7 48 .2 38 .4 60.1 54.3EBITDA Margin (%) 22.9 41.6 20.4 14.6 41.6 39.5Operating Margin (before GW and except.) (%) 22.9 41.6 20.4 14.6 41.6 39.5
B ALANCE S HEETFixed As s ets 1,429 1,6 06 1,9 6 5 2,48 5 2,58 9 3 ,457Intangible Assets 0 0 0 0 0 0Tangible Assets 1,401 1,533 1,956 2,479 2,58 3 3,452Investments 28 73 9 5 5 5Current As s ets 772 741 46 4 400 6 6 3 6 75Stocks 271 214 197 208 451 571Debtors 228 127 137 107 190 107Cash 272 211 130 8 5 21 (3)Other 1 190 1 1 1 1Current L iabi l i t ies (3 07) (275) (18 2) (276 ) (3 8 1) (46 0)Creditors (167) (18 1) (148 ) (177) (18 9) (104)Short term borrowings (140) (94) (34) (99) (192) (356)Long Term Liabi l i t ies (16 5) (3 6 7) (516 ) (742) (1,08 5) (1,78 2)Long term borrowings (159) (322) (434) (528 ) (8 99) (1,556)Other long term liabilities (6) (45) (8 1) (214) (18 6) (226)Net As s ets 1,729 1,706 1,73 2 1,8 6 7 1,78 6 1,8 9 2
CAS H FLOWOperating Cas h F low 27 (15) 23 41 (23 7) (10)Net Interest (31) (40) (50) (59) (71) (133)Tax 0 0 0 (13) 0 0Capex (250) (123) (159) (190) (220) (701)Acquisitions/disposals 13 41 11 10 0 0Financing 0 0 0 0 0 0Dividends (200) 0 0 0 0 (0)Net Cash Flow (440) (136) (175) (212) (528 ) (8 44)Opening net debt/(cas h) (48 0) 26 205 3 3 8 542 1,070Other (67) (43) 42 8 0 0Clos ing net debt/(cas h) 26 205 3 3 8 542 1,070 1,9 15

32 | Edison Investment Research | MirLand Development | September 2012
MirLand Development
Investment summary: Focus shifts to residential MirLand’s focus is shifting from being a pure play commercial developer with a small
yielding portfolio and a huge land bank of projects, to becoming a medium-sized
commercial investor with a substantial residential development, the pre-sales from which
should provide a steady stream of cash flows for years to come. Not only should this
boost earnings and NAV from 2013, as the first phase is delivered, increasing the NAV
discount to nearly 60% next year, it could also enable the group to start paying
dividends, once debt levels have been further reduced.
Business focus has shifted to development MirLand has a mixture of commercial, retail and residential projects in Moscow, St
Petersburg and across Russia. With c 130,000m2 of yielding commercial space, the
development of the 630,000m2 Triumph Park residential project in St Petersburg is now
starting to be sold in phases. Although further commercial projects will continue to be
delivered, it is clear that residential development has become more important.
Both commercial & residential to support NAV growth The company currently has six completed income-producing commercial properties, with
potential annual rental income of US$47m. Completed commercial space is expected to
grow nearly fivefold by 2017 (CAGR 24%). It also has a potential 696,000m2 of residential
gross sellable area, currently under development in phases over the next seven years, on
which sales have already started.
Trading at a large discount after recent sell off The shares performed poorly in the wake of the market correction over the past year and
after a recent recovery now trade at a 51% discount to this year’s NAV and a 59%
discount to 2013. We estimate a fair value of US$273m (160p) using a sum-of-the-parts
model, which heavily discounts the entire portfolio, (for example the Triumph Park
residential project is valued at half the JLL appraisal value), but would imply significant
upside from current levels. With residential sales starting to drive the growth in profitability
and NAV, we would expect to see this being reflected in the share price.
Year end Revenue (US$m)
Adj NP (US$m)
Adj EPS (US$)
DPS (US$)
NAV (US$)
P/NAV (x)
12/10 21.6 (6.5) (0.06) 0.0 3.4 0.49
12/11 47.5 (4.0) (0.04) 0.0 3.4 0.50
12/12e 58.6 (6.4) (0.06) 0.0 3.4 0.49
12/13e 134.4 18.5 0.18 0.0 4.1 0.41
Note: Adjusted NP and EPS exclude revaluations, impairments and other one-offs.
Price* 102p Market cap £106m *As at 7 September 2012 Share price graph
Share details Code MLD Listing AIM Sector Property Shares in issue 103.6m Free float 12% Price 52 week High Low 220p 212.5p Balance sheet as at 31 December 2011 Net Debt/Equity (%) 91.0 NAV per share (US$) 3.4 Net borrowings (US$m) 317 Business MirLand is an internally-managed real estate developer, operating in Russia since 2004. It is controlled by the Israeli developer Fishman Group with over 30 years' experience in real estate development internationally.
Major shareholders Industrial Buildings Corp 40% Jerusalem Eco. Corp 31% Darban Investments 14% Clal Ins Ent Holdings 4% Capital Venture W’wide 3% Analysts Mark Cartlich +44 (0)20 3077 5700 Martyn King +44 (0)20 3077 5745 [email protected]
33 | Edison Investment Research | MirLand Development | September 2012
A 1.4m m2 portfolio across Russia MirLand Development Corporation is an internally-managed, Cypriot-domiciled real estate
developer, which is controlled by the Fishman Group, the Israeli developer with over 30 years'
experience in real estate development internationally. MirLand has a portfolio of 14 projects on
175 hectares of land across Russia, with potential completed space of 1.4m m2. Management is
a mixture of international Israeli executives with domestic experience and local directors
Commercial space to grow at a compound rate of 24% The company currently has six completed income-producing commercial properties, with
approximately 130,000m2 of space and potential annual rental income of US$47m. Completed
commercial space is expected to grow nearly fivefold by 2017 (CAGR 33%), starting with the
completion of the Triumph House in Kazan next year. It also has a potential 696,000m2 of
residential gross sellable area under development, on which sales have already started this year.
No longer reliant on parental support Current project debt is just US$71m, although total debt was US$351m at year end 2011 and
net debt was US$317m. Net debt/equity was 91% at year end, but the LTV on balance sheet
valuations, which were below Cushman’s appraisal values, was just 52%. Although MirLand
should still be able to draw on Fishman support, the reliance on parental guarantees has fallen
from 77% of the total in 2006 and 43% last year to zero in 2011.
NAV growth expected to resume in 2012 MirLand calculates an adjusted NAV, using the group’s share of the market value of its assets of
US$5.2 per share. We are forecasting NAV growth on a sector-consistent basis of 1% in 2012
and 23% 2013 and a three-year CAGR of 26% with no forecast revaluation gains other than on
project completions. This year’s growth is likely to be held back by higher debt costs, offsetting
the revaluation gains, but residential profits should start to drive growth from next year onwards.
No longer trading at a premium to peers The shares halved in value in the wake of the market correction in the past year and are currently
trading at a discount of 51% to our sector-consistent 2012 forecast NAV and 59% for 2013. This
valuation has slumped from a slight premium to the rest of the sector, which we do not believe is
justified given the NAV growth profile. We calculate a sum of the parts valuation of US$273m,
equating to a fair value of 160p, which implies significant upside from current levels.
Corporate governance could be improved by a full LSE listing The shares have been hit more by market weakness than by stock-specific factors, but there are
still corporate governance improvements that could be made. The shares are still listed on AIM,
which does not help investors’ perceptions, although a change will not be possible while the free
float remains under 20% (the threshold for the LSE is 25%). Management is local and the board
is a mixture of local, international and Fishman group directors; please see their website for
further information.
MirLand has all the required committees, complies with the Corporate Governance Code and
has a majority of independent directors, but does not have a dedicated IR executive like most of
its peers. Other than the usual macro-related and sector risks, the main risk is securing financing
for development. Although project debt is low and parental support is likely to be forthcoming,
there is a refinancing requirement of US$40-45m per year over the next few years.
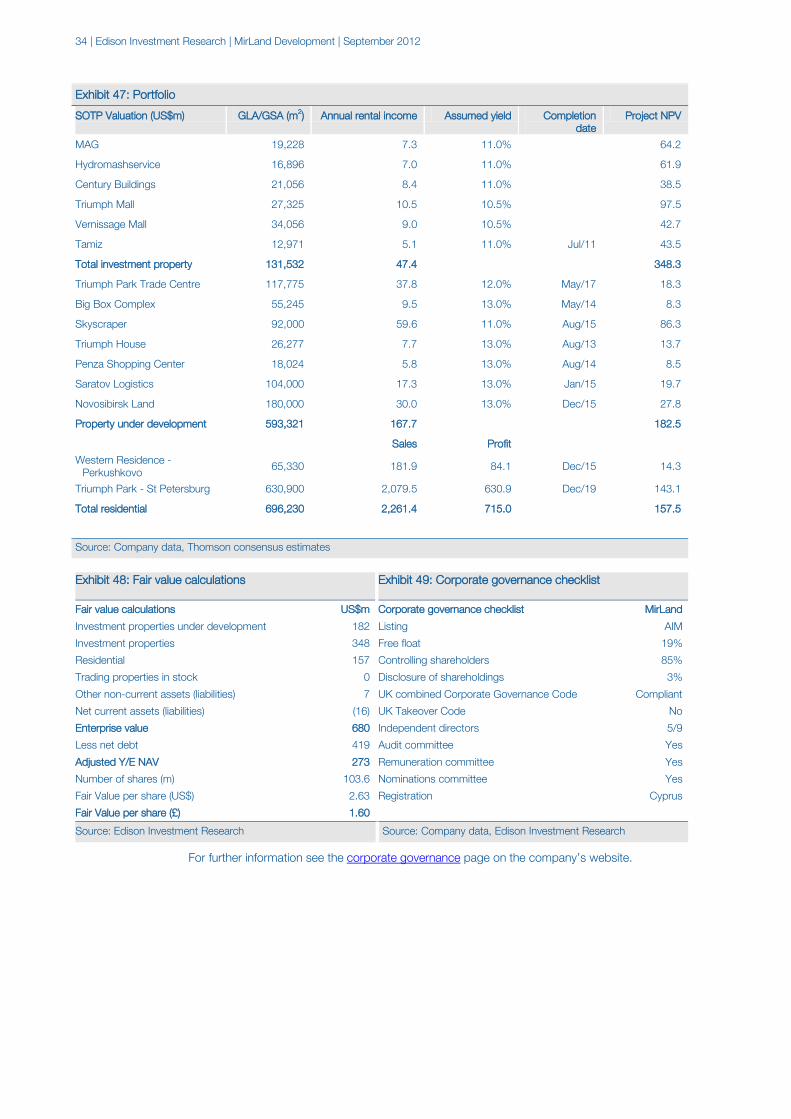
34 | Edison Investment Research | MirLand Development | September 2012
Exhibit 47: Portfolio
SOTP Valuation (US$m) GLA/GSA (m2) Annual rental income Assumed yield Completion date
Project NPV
MAG 19,228 7.3 11.0% 64.2
Hydromashservice 16,896 7.0 11.0% 61.9
Century Buildings 21,056 8.4 11.0% 38.5
Triumph Mall 27,325 10.5 10.5% 97.5
Vernissage Mall 34,056 9.0 10.5% 42.7
Tamiz 12,971 5.1 11.0% Jul/11 43.5
Total investment property 131,532 47.4 348.3
Triumph Park Trade Centre 117,775 37.8 12.0% May/17 18.3
Big Box Complex 55,245 9.5 13.0% May/14 8.3
Skyscraper 92,000 59.6 11.0% Aug/15 86.3
Triumph House 26,277 7.7 13.0% Aug/13 13.7
Penza Shopping Center 18,024 5.8 13.0% Aug/14 8.5
Saratov Logistics 104,000 17.3 13.0% Jan/15 19.7
Novosibirsk Land 180,000 30.0 13.0% Dec/15 27.8
Property under development 593,321 167.7 182.5
Sales Profit Western Residence -
Perkushkovo 65,330 181.9 84.1 Dec/15 14.3
Triumph Park - St Petersburg 630,900 2,079.5 630.9 Dec/19 143.1
Total residential 696,230 2,261.4 715.0
157.5
Source: Company data, Thomson consensus estimates
Exhibit 48: Fair value calculations Exhibit 49: Corporate governance checklist
Fair value calculations US$m
Investment properties under development 182
Investment properties 348
Residential 157
Trading properties in stock 0
Other non-current assets (liabilities) 7
Net current assets (liabilities) (16)
Enterprise value 680
Less net debt 419
Adjusted Y/E NAV 273
Number of shares (m) 103.6
Fair Value per share (US$) 2.63
Fair Value per share (£) 1.60
Corporate governance checklist MirLand
Listing AIM
Free float 19%
Controlling shareholders 85%
Disclosure of shareholdings 3%
UK combined Corporate Governance Code Compliant
UK Takeover Code No
Independent directors 5/9
Audit committee Yes
Remuneration committee Yes
Nominations committee Yes
Registration Cyprus
Source: Edison Investment Research Source: Company data, Edison Investment Research
For further information see the corporate governance page on the company’s website.

35 | Edison Investment Research | MirLand Development | September 2012
Exhibit 50: Financial summary
Source: Company data, Edison Investment Research. Note: Adjusted EPS and net income exclude revaluations, impairments and other one-off items.
US $ m 2008 2009 2010 2011 2012e 2013 eDec IFR S IFR S IFR S IFR S IFR S IFR SPR OFIT & LOS S R evenue 20 17 22 48 59 13 4Cost of Sales (7) (7) (12) (27) (26) (60)Gross Profit 13 10 10 20 33 75EB ITDA (10) (4) (3 ) 5 14 55Opera ting Prof i t (be fore amort. and except.) (10) (4) (3 ) 5 14 55Intangible Amortisation 0 0 0 1 1 1Revaluation of investment properties (59) (16) 30 33 14 49Other 0 0 (1) (6) 0 0Opera ting Prof i t (6 9 ) (21) 25 3 3 29 105Net Interest (35) 3 0 (16) (23) (31)Prof i t be fore tax ( IFR S ) (104) (18 ) 25 17 6 73Tax (1) (5) (2) 12 (1) (18 )Minority interests 0 0 0 0 0 0Net income (Adj NP) (46 ) (7) (6 ) (4) (6 ) 19Net income ( IFR S ) (105) (23 ) 23 3 0 4 56
Average Number of Shares Outstanding (m) 103.6 103.6 103.6 103.6 103.6 103.6EPS - adjus ted (US $ ) (0.44) (0.06 ) (0.06 ) (0.04) (0.06 ) 0.18EPS - adjus ted and fu l ly di luted (US $ ) (0.44) (0.06 ) (0.06 ) (0.04) (0.06 ) 0.18EPS - ( IFR S ) (US $ ) (1.01) (0.22) 0.22 0.29 0.04 0.54Dividend per share (p) 0.0 0.0 0.0 0.0 0.0 0.0
Gross Margin (%) 64.2 56.8 45.7 42.8 55.8 55.5EBITDA Margin (%) -50.2 -25.8 -15.5 10.5 23.7 40.6Operating Margin (before GW and except.) (%) -50.2 -25.8 -15.5 10.5 23.7 40.6
B ALANCE S HEETFixed As s ets 3 6 8 445 48 4 53 3 6 21 8 6 1Intangible Assets 0 0 0 0 0 0Tangible Assets 28 6 396 460 515 602 8 42Investments 8 2 50 25 18 18 18Current As s ets 16 2 171 224 207 246 254Stocks 144 140 178 158 193 166Debtors 1 3 4 7 6 9Cash 10 21 11 34 40 71Other 6 6 31 7 7 7Current L iabi l i t ies (8 2) (126 ) (158 ) (16 4) (19 8 ) (248 )Creditors (20) (42) (70) (32) (44) (61)Short term borrowings (62) (8 4) (8 8 ) (132) (154) (18 6)Long Term Liabi l i t ies (106 ) (171) (210) (228 ) (3 18 ) (46 0)Long term borrowings (8 0) (126) (18 5) (218 ) (305) (435)Other long term liabilities (26) (44) (25) (10) (13) (25)Net As s ets 3 42 3 19 3 41 3 47 3 52 407
CAS H FLOWOperating Cas h F low (70) (3 3 ) (29 ) 8 (7) 9 0Net Interest (5) (8 ) (12) (23) (23) (31)Tax 0 0 0 (1) 0 0Capex (78 ) (52) (40) (15) (73) (190)Acquisitions/disposals 38 1 22 7 0 0Financing 0 0 0 0 0 0Dividends 2 3 4 5 6 7Other 6 31 (4) (37) 0 0Net Cash Flow (107) (58 ) (59) (57) (96) (124)Opening net debt/(cas h) (3 5) 13 2 19 0 26 2 3 17 419Other (73) 0 (12) 3 (6) (7)Other cash adjustments 13 (1) (2) (2) (0) 0C los ing net debt/(cas h) 13 2 19 0 26 2 3 17 419 550

36 | Edison Investment Research | PIK Group | September 2012
PIK Group
Investment summary: Returning to profitability PIK Group is emerging from nearly four years of balance sheet reconstruction, write-
downs and losses in the wake of the financial crisis, assisted by the recovery in the
residential market, especially in Moscow. The group’s gearing remains high as the equity
base has yet to be rebuilt, but the LTV was 55% at year-end, while debt costs have been
reduced and should be covered by EBITDA this year. Nevertheless, the stock’s risks
remain and in our view there is not much upside at current levels.
A leading residential developer in Russia PIK is one of the leading residential real estate developers in Russia, with a strategic
focus on the Moscow Metropolitan Area (MMA). The main business is the development,
construction, sale and management of mass-market residential properties. As at
year-end 2011, PIK had a portfolio of 6.9m m2 of unsold net sellable area across Russia
valued at US$2.7bn by CBRE, 88% of which is in the MMA.
Earnings remain weak, but returns are improving Earnings before exceptionals are expected to recover steadily from this year and PIK is
starting to generate a decent return on capital now (13-15% in 2012-13), partly because
of the low equity base. However, there are still risks in the level of gearing and the extent
of debt service costs, although they should be covered by basic EBITDA this year – for
the first time since 2007.
Valuation based on potential profit per m2 As PIK is a residential developer and it currently has such a low book value, we have
valued it differently to the other stocks in this report. Although PIK is trading at a small
discount to NAV, this is less relevant for a residential developer and so is the premium
P/E ratio, which is a function of high debt interest costs and depressed earnings. We use
a three-year average after tax profit per m2 to reach a valuation of US$1.1bn, which is
equivalent to US$2.2 per share, similar to current trading levels.
Year end Revenue (US$m)
Adj NP (US$m)
Adj EPS (US$)
NAV (US$)
DPS (US$)
P/E (x)
12/10 1,258 (172.2) (0.34) 2.17 0.0 N/A
12/11 1,564 (10.1) (0.02) 2.29 0.0 N/A
12/12e 1,752 8.6 0.02 2.31 0.0 126.8
12/13e 1,951 36.7 0.07 2.38 0.0 29.5
Note: Adjusted NP and EPS exclude revaluation gains, impairments and other exceptional items. PIK’s actual reporting currency is RUB.
Price* US$2.2 Market cap $1.1bn *As at 7 September 2012 Share price graph
Share details Code PIK LI Listing GDR Sector Property Shares in issue 493.1m Free float 62% Price 52 week High Low US$3.6 US$3.64 Balance sheet as at 31 December 2011 Loan to value (%) 55.3 NAV per share (US$) 2.29 Net debt (US$m) 1,375 Business One of the leading residential real estate developers in Russia, with a strategic focus on developing and selling mass-market residential properties in the Moscow Area.
Major shareholders Holborner Services 20% Brigantia Ltd 17% VTB 9% Artertesia Consulting 7% Lacero Trading 2% Analysts Mark Cartlich +44 (0)20 3077 5700 Martyn King +44 (0)20 3077 5745 [email protected]

37 | Edison Investment Research | PIK Group | September 2012
2011 showed market recovery feeding through The 2011 results showed further evidence of the market recovery feeding through into the
numbers, with all the profit lines turning positive for the first time since the downturn. PIK’s
realised prices were up 10% on average across Russia in 2011, with a gain of 11% in Moscow
partially offset by lower gains in other regions. Moscow residential prices are now only marginally
below the 2008 peak in local terms. Basic EBITDA (normalised operating profit plus depreciation)
went from a negative US$42m in 2010 to US$172m last year, cash collections were up 31% and
new sales contracts increased 30% to exceed 500,000m2 for the first time since 2007.
Demand recovery has continued in H112 The recovery has continued in 2012, with net cash collections up 26% y-o-y in H112 and cash
collections from the sale of apartments to individuals increasing 53% on the back of higher
volumes and a rise in prices. PIK launched 20 new projects in H112, 16 of which were in the
MMA and new sales contracts to customers improved 18% to 270,000m2, of which 87% were
to retail customers, a gain of 50%. The average realised price saw a rise of 16% y-o-y, which
also helped to drive the rise in cash collections.
Debt refinancing process now largely completed While PIK still has significant debt outstanding, it has managed to shift the majority to long term,
restructure the more expensive facilities, cancel all fines and penalties for late payment and
diversify its sources of finance. Average debt costs are 12.2%, interest cover is now positive and
the trend is downward for the loan-to-value and net debt/EBITDA ratios. PIK had been planning
a secondary offering of approximately US$350-400m to complete the refinancing. This is now off
the agenda, removing the potential overhang for the stock.
Housing statistics point to long-term growth trends Russia still suffers from an acute lack of quality housing stock, with just 22m2 per capita on a
national basis, compared with 66m2 in the US. This is not helped by the lack of mortgage
penetration in Russia, with housing debt to GDP at just 3% last year. However, mortgage lending
rebounded sharply in 2010, growing at over 100% per quarter as lending rates fell, a trend that
has continued, with developers teaming up with lenders.
Valuations look fair at these levels On our estimates for 2012 and 2013, the stock is currently trading on ratios of 12.7x and 10x
EV/EBITDA and 1.5x and 1.3x sales respectively. Although P/NAV is less relevant for a residential
developer like PIK, the stock is trading at discounts of 16% this year and 19% for 2013. The
P/BV is irrelevant, as PIK’s equity was wiped out by impairment losses in 2008-10. We reach our
valuation from the potential profitability of the existing portfolio over three years and our fair value
of US$2.2 is in line with where the shares are currently trading.
Corporate governance, catalysts and stock risks PIK ticks most of the corporate governance boxes. Its directors are a mix of local and foreign,
but the board includes directors from the major shareholders, including the bank VTB. It is the
only company to report in RUB, but this reflects its business. The main catalysts are further
operational and pricing recovery, potential land acquisitions or project sales and debt refinancing.
The main non-operational risk is the balance sheet, which remains undercapitalised, so the need
to raise capital to bolster the equity base remains.

38 | Edison Investment Research | PIK Group | September 2012
Exhibit 51: Portfolio
PIK Portfolio 2006 2007 2008 2009 2010 2011
Portfolio value (US$m) 8,802 12,324 2,900 2,500 2,405 2,676
Unsold land bank NSA (m m2) 8.8 14.2 14.9 11.6 10.6 6.9
Portfolio value (US$/m2) 1,000 867 195 216 227 387
Source: PIK Group
Exhibit 52: Valuation
Profit/m2 valuation 2011 2012e 2013e 2014e Ave 2012-14
Profit/m2 336 392 451 512 452
Post tax 255 298 343 389 343
Unsold land bank NSA m m2 6.9 6.8 6.6 6.4
6.9
EV 1,768 2,017 2,262 2,497 2,376
Source: Edison Investment Research
Exhibit 53: Fair value calculations Exhibit 54: Corporate governance checklist
Fair value calculations US$m
Trading Properties Under Development 2,376
Enterprise value 2,376
Less net debt 1,375
Less minority interest 16
Adjusted NAV 985
Mid-year adjustment 1.08
Fair value at year end 1,071
Number of shares (m) 493.1
NAV per share (US$) 2.2
Corporate governance checklist PIK
Listing GDR
Free float 62%
Directors & Employee Trust 38%
Disclosure of shareholdings N/A
UK combined Corporate Governance code Compliant
UK Takeover Code No
Independent directors 3/9
Audit committee Yes
Remuneration committee Yes
Nominations committee Yes
Registration Cyprus
Source: Edison Investment Research Source: Company data, Edison Investment Research
For further information on the board of directors and corporate governance see the company’s
website.
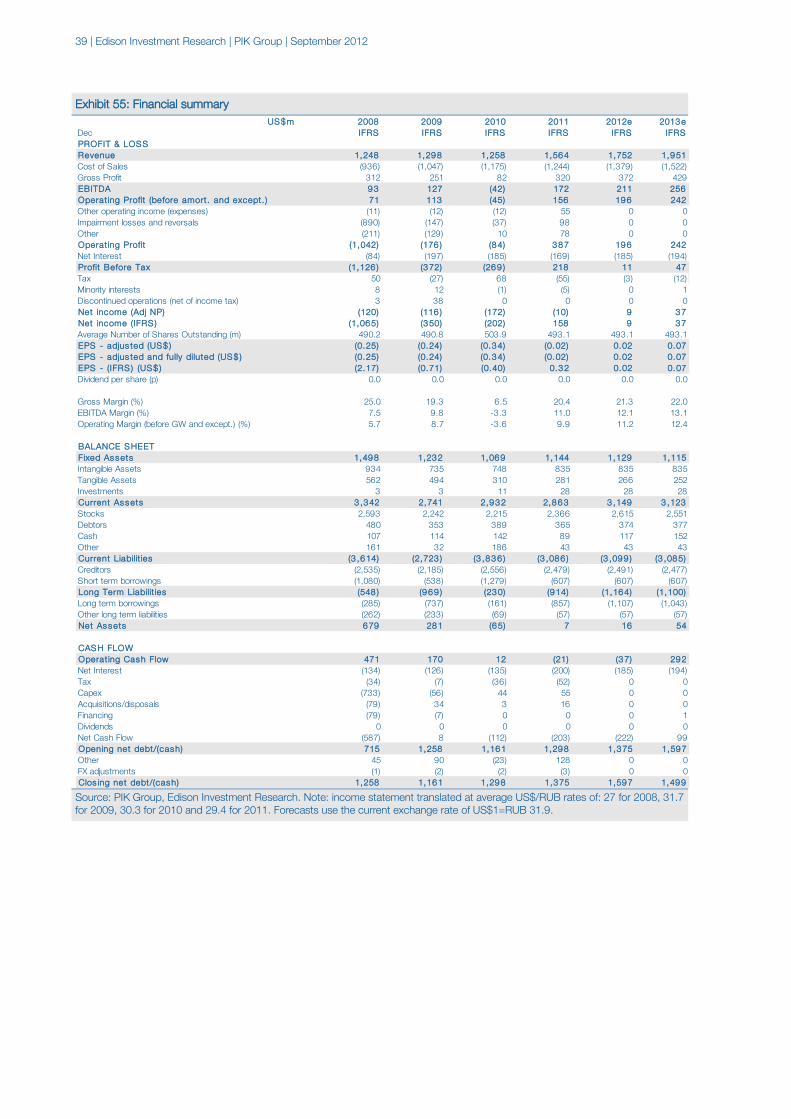
39 | Edison Investment Research | PIK Group | September 2012
Exhibit 55: Financial summary
Source: PIK Group, Edison Investment Research. Note: income statement translated at average US$/RUB rates of: 27 for 2008, 31.7 for 2009, 30.3 for 2010 and 29.4 for 2011. Forecasts use the current exchange rate of US$1=RUB 31.9.
US$m 2008 2009 2010 2011 2012e 2013eDec IFRS IFRS IFRS IFRS IFRS IFRSPROFIT & LOS S Revenue 1,248 1,298 1,258 1,564 1,752 1,951Cost of Sales (936) (1,047) (1,175) (1,244) (1,379) (1,522)Gross Profit 312 251 82 320 372 429EBITDA 93 127 (42) 172 211 256Operat ing Profit (before amort. and except. ) 71 113 (45) 156 196 242Other operating income (expenses) (11) (12) (12) 55 0 0Impairment losses and reversals (890) (147) (37) 98 0 0Other (211) (129) 10 78 0 0Operat ing Profit (1,042) (176 ) (84) 387 196 242Net Interest (84) (197) (185) (169) (185) (194)Profit Before Tax (1,126 ) (372) (269 ) 218 11 47Tax 50 (27) 68 (55) (3) (12)Minority interests 8 12 (1) (5) 0 1Discontinued operations (net of income tax) 3 38 0 0 0 0Net income (Adj NP) (120) (116 ) (172) (10) 9 37Net income (IFRS ) (1,065) (350) (202) 158 9 37Average Number of Shares Outstanding (m) 490.2 490.8 503.9 493.1 493.1 493.1EPS - adjus ted (US$ ) (0.25) (0.24) (0.34) (0.02) 0.02 0.07EPS - adjus ted and fully diluted (US$ ) (0.25) (0.24) (0.34) (0.02) 0.02 0.07EPS - (IFRS ) (US $ ) (2.17) (0.71) (0.40) 0.32 0.02 0.07Dividend per share (p) 0.0 0.0 0.0 0.0 0.0 0.0
Gross Margin (%) 25.0 19.3 6.5 20.4 21.3 22.0EBITDA Margin (%) 7.5 9.8 -3.3 11.0 12.1 13.1Operating Margin (before GW and except.) (%) 5.7 8.7 -3.6 9.9 11.2 12.4
BALANCE SHEETFixed Assets 1,498 1,232 1,069 1,144 1,129 1,115Intangible Assets 934 735 748 835 835 835Tangible Assets 562 494 310 281 266 252Investments 3 3 11 28 28 28Current Assets 3 ,342 2,741 2,932 2,863 3 ,149 3 ,123Stocks 2,593 2,242 2,215 2,366 2,615 2,551Debtors 480 353 389 365 374 377Cash 107 114 142 89 117 152Other 161 32 186 43 43 43Current Liabilit ies (3 ,614) (2,723 ) (3 ,836 ) (3 ,086 ) (3 ,099 ) (3 ,085)Creditors (2,535) (2,185) (2,556) (2,479) (2,491) (2,477)Short term borrowings (1,080) (538) (1,279) (607) (607) (607)Long Term Liabilit ies (548 ) (969 ) (230) (914) (1,164) (1,100)Long term borrowings (285) (737) (161) (857) (1,107) (1,043)Other long term liabilities (262) (233) (69) (57) (57) (57)Net Assets 679 281 (65) 7 16 54
CASH FLOWOperat ing Cash Flow 471 170 12 (21) (37) 292Net Interest (134) (126) (135) (200) (185) (194)Tax (34) (7) (36) (52) 0 0Capex (733) (56) 44 55 0 0Acquisitions/disposals (79) 34 3 16 0 0Financing (79) (7) 0 0 0 1Dividends 0 0 0 0 0 0Net Cash Flow (587) 8 (112) (203) (222) 99Opening net debt/(cash) 715 1,258 1,161 1,298 1,375 1,597Other 45 90 (23) 128 0 0FX adjustments (1) (2) (2) (3) 0 0Clos ing net debt/(cash) 1,258 1,161 1,298 1,375 1,597 1,499

40 | Edison Investment Research | Raven Russia | September 2012
Raven Russia
Investment summary: The quality sector play Raven Russia has proved successful in improving transparency and maximising returns
recently, via internalising management, moving all three classes of stock from AIM to the
main board of the LSE, consistently paying dividends and buying back shares. With
secure funding, limited refinancing needs, a good shareholder base, low tax structure,
customer-led development plans and a wide margin between property yields and debt
costs, the company is well placed to benefit from continued market recovery.
Potential portfolio of over 3m m2 across Russia and the CIS Raven is an internationally-managed commercial property investment company, with
over 1.2m m2 of completed space, predominantly warehouses, at 12 projects in Russia,
with a potential 2m m2 in the project pipeline. Moscow accounts for 67% of the
completed space, while 70% of the land bank is in the regions and 16% in the rest of the
CIS. With limited plans to develop the land bank, management remains focused on
increasing occupancy (currently 94%) and maximising rental rates.
A simple business model Raven has a different business model to its peers in Russia in that it has been
deliberately set up to develop into a REIT-like entity, using the tax benefits of its
Guernsey registration to pay out all excess cash, over administration and finance costs,
to shareholders. The turbulence of the past few years has delayed the achievement of
that objective, but it is now in sight. Management would rather deliver a 10-11% yield on
its income-producing portfolio every year, than a 20-25% one-off development margin
every few years, as it enables a consistent payout ratio to be maintained.
Valuation still offers upside The shares trade at a justifiably small discount to our forecast NAV of just 6% for 2012
and 2013, given the strength of the warehouse segment in Russia, Raven’s leading
position in it, the recent success of management’s vacancy-reduction strategy, its ability
to add bolt-on acquisitions at reasonable yields and raise capital at attractive rates, as
well as the potential growth in the portfolio and the dividend yield. Our fair value of
US$693m suggests approximately 11% upside, which would leave the shares trading at
a small premium to NAV.
Year end NOI (US$m)
Adj NP (US$m)
Adj EPS (US$)
DPS (US$)
P/NAV (x)
Yield (%)
12/10 61.1 (17.5) (0.04) 0.03 1.03 6.5
12/11 91.7 (10.1) (0.02) 0.05 0.91 4.5
12/12e 131.5 13.2 0.02 0.05 0.94 4.5
12/13e 148.7 23.4 0.04 0.05 0.94 4.5
Note: Adjusted NP and EPS exclude revaluation gains, impairments and other one-offs. NOI is net operating income from property assets.
Price* 65.8p Market cap £385m *As at 7 September 2012 Share price graph
Share details Code RUS Listing LSE Sector Property Shares in issue 586.4m Free float 92% Price 52 week High Low 67.5p 48.75p Balance sheet as at 31 December 2011 Net Debt/Equity (%) 89.4 NAV per share (US$) 1.19 Net borrowings (US$m) 598 Business Raven Russia was founded in 2005 to invest in class A warehouse complexes in Russia to be leased to Russian and international tenants. International management combines with an in-house team of Russian professionals.
Major shareholders Invesco Perpetual 29% Schroder Investment 14% Mackenzie Cundill Inv. 10% F&C Asset Management 5% Directors 4% Analysts Mark Cartlich +44 (0)20 3077 5700 Martyn King +44 (0)20 3077 5745 [email protected]

41 | Edison Investment Research | Raven Russia | September 2012
The largest warehouse developer in Russia After the recent Pushkino acquisition (for US$215m cash) the group’s portfolio is now over
1.2m m2 across Russia, with another 2m m2 in the pipeline, to be developed as the warehouse
sector, which is already the most attractive market segment in Russia, continues its recovery.
Management has pursued both selective organic growth and acquisitions over the past year,
taking advantage of both tight supply and strong market demand, as well as the travails of
some over-indebted competitors, to pick up new assets at reasonable prices.
Raven’s strategy now looks to be bearing fruit The strategy has been clear since the financial crisis erupted. Firstly, to let out the remaining
space in the existing warehouses and take advantage of rising rental rates where possible.
Secondly, to stabilise the capital structure and reduce debt costs. Thirdly, to sell down the
residential portfolio to raise cash and finally, to look for earnings-enhancing acquisitions in the
warehouse sector in Russia, especially in Moscow. With the Moscow warehouses fully let,
rental rates increasing, occupancy averaging over 90%, two acquisitions this year and a further
issue of preference shares, the strategy is clearly paying dividends.
Latest acquisitions to add >US$30m to NOI The acquisition of the 213,000m2 Pushkino site was completed in June, adding US$25m to
NOI. Raven has also announced the acquisition of a 45,000m2 Class A warehouse at
Sholokhovo, to the north of Moscow, for US$49.8m with two tenants generating c US$6m, at
an initial yield on the deal of 11.75%. The group is also acquiring 38 hectares of land, with
zoning at Padikovo, to the north-west of Moscow, at a cost of US$23m.
Debt costs should be covered for the first time this year At year end the group had gross debt of US$779m, including US$218m of irredeemable
preference stock and net debt of US$598m, which has since been increased by the US$101m
preference share issue (used to part-fund Pushkino). We forecast it reaching US$893m by year
end. The remaining debt is mainly bank loans and supra-national finance (EBRD, IFC) at the
project level, with an LTV of 63% in 2011. Raven has two unencumbered assets, limited
refinancing needs until 2013 and pays an average rate of just 7%. Even so, on our forecasts,
this year will be the first time interest costs have been covered by NOI.
Valuation enhanced by payout on ordinary and preference shares The shares trade at a discount of just 6% to our 2012 forecast NAV and 11% to our fair value
of the completed space, which in our view reflects the strength of both the company and its
market segment. This is a premium to its peers, which we believe is justified by a simple
strategy that is being delivered by a sound management team, which communicates regularly
and openly with its investors. On top of the valuation discount is the yield on both the ordinaries
and the 194m outstanding preference shares. The ordinary shares yield 4.5%, while the
preference stock has a fixed cumulative payout of 12% and is currently yielding over 9%.
Stock catalysts, risks and corporate governance The main short-term catalysts are likely to be continued improvements in occupancy rates,
additional acquisition opportunities, further increases in rental rates and in appraisal values as
results are released. The main risks we see are macro rather than micro orientated, relating to
demand for warehouse space in Russia, the availability and cost of financing and any big
change in the warehouse supply backdrop. Raven ticks all the corporate governance boxes on
our checklist below and has a good mix of local and international management. Further
information on the board of directors can be read on the company’s website.

42 | Edison Investment Research | Raven Russia | September 2012
Exhibit 56: Portfolio
City Project Land (hectares) Gross lettable area (m2)
Moscow Southern 2 14,000 Moscow Krekshino 22 118,000 St Petersburg Constanta 1 16,000 Moscow Istra phases 1-5 33 199,000 St Petersburg Shushary 1-4 26 142,000 Moscow Noginsk 1 22 123,000 St Petersburg Pulkovo 1 5 36,000 Moscow EG Lobnya 10 53,000 Moscow Klimovsk 1 9 54,000 Moscow Klimovsk 2 9 54,000 Moscow Pushkino 0 213,000 Moscow Sholokhovo 0 45,000 Rostov on Don Rostov 1 19 100,000 Novosibirsk Novosibirsk 18 120,000 Completed space
175 1,287,000
St Petersburg Pulkovo 2 10 67,400 Moscow Noginsk 2 40 180,300 Moscow Padikovo 38 200,000 Rostov on Don Rostov 2 27 126,500 Khabarovsk Khabarovsk 27 140,000 Chelyabinsk Chelyabinsk 59 295,000 Omsk Omsk 19 230,000 Omsk Omsk 2 9 45,000 Saratov Saratov 29 159,000 Ufa Ufa 48 240,000 Nizhniy Novgorod Nizhniy Novgorod 44 220,000 Minsk Minsk 45 225,000 Development projects 403 2,182,200 Total projects 578 3,469,200
Source: Company data
Exhibit 57: Fair value calculations Exhibit 58: Corporate governance checklist
Fair value calculations US$m
Completed properties 1,295
Land and expansion sites 102
LT inventory 40
Roslogistics 13
Warrant conversion/deferred tax 70
Enterprise value 1,521
Less net debt and minorities (893)
NAV 629
12-month adjustment 1.10
Adjusted NAV 693
Number of shares (millions) 579.2
Adjusted NAV per share (US$) 1.20
Fair value (p) 73
Corporate governance checklist Raven
Listing LSE
Free float 92%
Directors & Employee Trust 8%
Disclosure of shareholdings 3%
UK combined Corporate Governance Code Compliant
UK Takeover Code Compliant
Independent directors 4/8
Audit committee Yes
Remuneration committee Yes
Nominations committee Yes
Registration Guernsey
Source: Edison Investment Research Source: Company data, Edison Investment Research
For further information see the corporate governance page on the company’s website.

43 | Edison Investment Research | Raven Russia | September 2012
Exhibit 59: Financial summary
Source: Company data, Edison Investment Research. Note: Adjusted net income and EPS exclude revaluation gains, impairments and other one-offs.
US$m 2008 2009 2010 2011 2012e 2013eDecember IFRS IFRS IFRS IFRS IFRS IFRSPROFIT & LOS S Revenue 71 112 131 163 203 225Cost of Sales (32) (62) (70) (71) (72) (76)Net Operating Income (Gross Profit) 40 50 61 92 132 149EBITDA 9 16 42 63 100 118Operat ing Profit (before amort. and except. ) 9 16 42 63 100 118Revaluation of investment properties (39) (58) 63 133 0 0Exceptionals (31) (51) 16 11 0 0Stock Expense/Other (68) 0 (6) (6) (6) (6)Operat ing Profit (129 ) (92) 115 201 94 112Net Interest (61) (56) (59) (72) (80) (86)Profit Before Tax (189 ) (148 ) 56 129 15 26Tax 19 9 (14) (41) (1) (3)Minority interests 0 0 0 0 0 0Net income (Adj NP) (39 ) (37) (18 ) (10) 13 23Net income (IFRS ) (170) (139 ) 41 88 13 23
Average Number of Shares Outstanding (m) 439.2 488.9 493.1 528.2 567.2 567.2EPS - adjus ted (USD) (0.09 ) (0.08 ) (0.04) (0.02) 0.02 0.04EPS - adjus ted and fully diluted (USD) (0.09 ) (0.08 ) (0.03 ) (0.02) 0.02 0.04EPS - (IFRS ) (US D) (0.39 ) (0.28 ) 0.08 0.17 0.02 0.04Dividend (USD) 0.05 0.02 0.03 0.05 0.05 0.05
Gross Margin (%) 55.4 44.9 46.8 56.3 64.8 66.2EBITDA Margin (%) 13.2 14.7 32.1 38.9 49.5 52.4Operating Margin (before GW and except.) (%) 13.2 14.7 32.1 38.9 49.5 52.4
BALANCE S HEETFixed Assets 1,090 1,081 1,147 1,339 1,579 1,579Intangible Assets 0 13 13 13 13 13Tangible Assets 902 988 1,056 1,253 1,470 1,470Investments 188 80 77 72 95 95Current Assets 191 310 199 277 213 211Stocks 0 61 56 51 40 32Debtors 83 69 35 44 56 63Cash 108 128 108 182 117 116Other 0 52 0 0 0 0Current Liabilit ies (133 ) (213 ) (139 ) (166 ) (171) (173 )Creditors (53) (115) (50) (71) (49) (51)Short term borrowings (80) (98) (90) (96) (121) (121)Long Term Liabilit ies (413 ) (632) (626 ) (781) (985) (985)Long term borrowings (357) (567) (560) (684) (888) (888)Other long term liabilities (56) (65) (66) (97) (97) (97)Net Assets 735 546 580 669 637 633
CAS H FLOWOperat ing Cash Flow 22 15 36 84 47 113Net Interest 1 2 (29) (38) (80) (86)Tax (4) (1) (3) (3) 0 0Capex (465) (139) (36) (80) (217) 0Acquisitions/disposals (92) 74 68 10 0 0Financing 0 88 (33) (31) (17) 0Dividends (51) (4) (4) (16) (28) (28)Net Cash Flow (589) 35 (1) (73) (295) (1)Opening net debt/(cash) (377) 329 537 542 598 893Other (138) (252) (3) 27 0 0FX adjustments 20 9 (2) (10) 0 (0)Clos ing net debt/(cash) 329 537 542 598 893 893

44 | Edison Investment Research | RGI International | September 2012
RGI International
Investment summary: Synergy resolution RGI is currently trading at a 46% discount to our forecast 2012 NAV, but more than 50%
to 2013 when residential profits start to feed through and boost NAV growth. It has been
perceived as riskier than its peers, as it is less diversified, both geographically and
sectorally, but also because it is developing fewer projects and as the main one is
residential, the cash flows will not recur. Now that the dispute with Synergy, its second
largest shareholder, is resolved, further project progress could change that perception.
Moscow-based retail and residential developer RGI currently has six developments with potential gross lettable/sellable area of close to
1.2m m2, but two projects dominate. The Tsvetnoy project, which was completed last
year, is now growing revenues very strongly, but may be sold during the next year and
the biggest residential project, V Lesu (1.3m m2), is under construction, with 36% of the
first phase already sold. RGI’s assets are appraised semi-annually by DTZ and at year-
end 2011 RGI’s share of the assets in the portfolio was valued at US$686m.
NAV growth set to recover We expect reported NAV growth to accelerate as residential projects start to generate
cash in 2012-13. We see our sector-consistent NAV calculation increasing from
US$528m last year to US$613m in 2013 and NAVPS from US$3.11 to US$3.47, with
potentially a four-year CAGR of 18% to 2015, as other commercial and residential
projects reach the delivery phase.
Discount may narrow now that Synergy dispute resolved With the stock trading at a 48% discount to NAV for 2012e and 51% for 2013e, after the
poor performance over the past year, the shares appear undervalued, especially now that
the year-long dispute with Synergy, its second largest shareholder, has ended. The
board has a majority of independent directors, with significant international experience,
which helped it to defend itself in the dispute. The end of attempts by Synergy to control
the board and direct strategy could be the positive catalyst the stock has been looking
for, with significant potential upside to our sum-of-the-parts fair value of US$394m.
Year end Revenue (US$m)
Adj NP (US$m)
Adj EPS (US$)
NAV (US$)
DPS (US$)
P/NAV (x)
12/10 3.1 (19.7) (0.14) 3.29 0.0 0.52
12/11 1.5 (48.3) (0.30) 3.11 0.0 0.55
12/12e 0.0 (13.5) (0.08) 3.07 0.0 0.52
12/13e 81.9 5.0 0.03 3.30 0.0 0.49
Note: Adjusted NP and EPS exclude revaluation gains, impairments and other one-off items.
Price* US$1.6 Market cap $259m *As at 7 September 2012 Share price graph
Share details Code RGI Listing AIM Sector Property Shares in issue 161.8m Free float 60% Price 52 week High Low US$2.07 US$0.93 Balance sheet as at 31 December 2011 Net Debt/Equity (%) 3.6 NAV per share (US$) 3.11 Net borrowings (US$m) 16.4 Business RGI is a property development and management company focusing on high-end residential developments and retail properties within Moscow and mid-class residential in the surrounding areas.
Major shareholders DES (Boris Kuzinets) 40% Synergy and Petr Shura 24% Sigrun 20% Rencap 4% Prosperity 4% Analysts Mark Cartlich +44 (0)20 3077 5700 Martyn King +44 (0)20 3077 5745 [email protected]

45 | Edison Investment Research | RGI International | September 2012
The portfolio is dominated by two projects Of RGI’s six developments with a potential gross building area of nearly 1.6m m2, Tsvetnoy,
(now revenue generating) and V Lesu, a 1.3m m2 project now under construction, comprise
84% of the portfolio value. Most projects are 100% owned, the exceptions being V Lesu, which
is 82% controlled and Khilkov, in which RGI has a 50% stake. RGI is controlled and managed
by Boris Kuzinets, who owns an approximately 40% stake through his company DES Holding.
Q2 trading update showed encouraging residential sales RGI recently announced that cash collections in Q212 were 35% higher than in Q1, owing to
positive sales momentum at the V Lesu residential development, where 36% of Phase 1 has
now been sold, generating over US$90m. The Tsvetnoy Central market also performed well,
with sales up 82% y-o-y to over US$18m. Sales of over US$37m in H112 were more than
double the H111 when it opened. Management confirmed it is in discussions with a number of
parties over the potential sale of the asset, although no agreement has been agreed.
NAV growth to be driven by residential delivery We expect NAV growth to recover as residential projects (V Lesu and Khilkov) start to generate
cash in 2013-14. We calculate a sector consistent NAV, that we use for all the companies. On
this basis, we see a four-year compound growth rate of 18% and NAVPS increasing from
US$3.11 last year to over US$6.0 in 2015.
Funding strategy is very conservative RGI’s financial strategy is conservative, both in terms of funding and valuations. Management
has committed to keeping the balance sheet liquid, with a debt-to-equity ratio of no higher than
50%, compared with the current level of 13%. The company also had cash of US$41m at year
end. The Synergy capital (US$97m) can now be treated as equity and part funding the
residential business with pre-sales means that debt needs are generally lower.
Synergy dispute is now resolved In July RGI finally reached agreement with its 24% shareholder Synergy Classic and another
shareholder, Synergy director Petr Shura, after their claims against the company were
dismissed by London and Guernsey courts in December, ending their attempts to control the
board and direct strategy. The non-monetary settlement states that all remaining claims
between RGI and its directors and Synergy/Petr Shura will be withdrawn, as will claims
between DES Commercial Holdings (RGI’s main shareholder) and Synergy. The parties also
agreed not to make any future allegations relating to these claims.
Valuation looks attractive With the stock trading at a 51% discount to 2013e NAV after the weak performance over the
past year, the shares appear undervalued, now that the Synergy dispute is resolved. Although
RGI is more dependent on fewer projects than its peers, it has a fraction of their debt levels, so
it is not necessarily more risky. We estimate fair value at US$394m, using a sum-of-the-parts
model, which suggests significant upside from current levels.
The main risk was the long term presence of an unsettled shareholder calling EGMs and
bidding for RGI’s assets. The main catalyst was also a resolution with Synergy, so now that the
dispute has been resolved, the main drivers are likely to be project progress at V Lesu and
Khilkov, as well as the potential sale of Tsvetnoy.

46 | Edison Investment Research | RGI International | September 2012
Exhibit 60: Portfolio Project portfolio Asset type GBA (m2) GLA/GSA (m2) Ownership Completion Development
costs (US$m)
Tsvetnoy Retail 36,527 15,097 100% completed 106
V Lesu (Kingston) Residential 1,325,607 1,054,401 82% 2012-2017 1,512
Khilkov Residential 27,258 14,470 50% 2013 129
Victory Park Residential/hotel 25,000 18,991 100% 2013 37
Chelsea Mixed use 7,600 5,908 100% 2014 34
Ostozhenka Residential 1,000 1,000 100% 2013 6
New Site near Kingston Mixed use 150,000 63,000 100%
1,570,865 1,172,867 1,816
Source: Company data
Exhibit 61: SOTP valuation
GLA m2 Rental income
(US$m) Development costs (US$m)
End yield Completion Project NPV
Tsvetnoy 15,097 23.4 106.3 N/A Dec 10 247
Chelsea 3,805 3.5 16.3 10.2% Dec 14 22
Victory Park Hotel 8,600 7.6 37.0 12.0% Dec 13 17
Commercial portfolio 27,502 34.5 159.6 286
Residential GSA Sales income Cost of Sales Margin Completion Project NPV
V Lesu (Kingston) 1,054,401 2,232 1,512 32% Dec 17 208
Ostozhenka 1,000 25 6 75% Dec 13 9
Khilkov 14,470 321 129 60% Dec 13 41
Victory Park Residential 8,000 87 27 69% Dec 13 29
Victory Park parking 2,391 13 100% Dec 13 13
Chelsea Residential 2,103 36 9 75% Dec 14 13
Residential portfolio 1,082,365 2,714 1,684 313
Total portfolio 1,109,867
1,843
598
Net current assets (173)
Net debt (19)
Minorities (33)
Adjusted NAV
373
Mid-year adjustment 1.06
Fair value at year end 394
FV per share (US$) 2.40
Source: Company data, Edison Investment Research
Exhibit 62: Corporate governance checklist
Free float 60%
Controlling shareholder 40%
Disclosure of shareholdings 3%
UK combined Corporate Governance Code Compliant
UK Takeover Code No
Independent directors 6/11
Audit committee Yes
Remuneration committee Yes
Nomination committee Yes
Registration Guernsey
Source: Company data, Edison Investment Research
For further information about the directors see the company’s website.

47 | Edison Investment Research | RGI International | September 2012
Exhibit 63: Financial summary
Source: Company data, Edison Investment Research forecasts. Note: Adjusted net income and EPS exclude revaluation gains, impairments and other exceptional items.
US$m 2008 2009 2010 2011 2012e 2013eDec IFRS IFRS IFRS IFRS IFRS IFRSPROFIT & LOSS Revenue 1 85 3 2 0 82Cost of Sales (7) (24) 0 (2) 0 (56)Gross Profit (5) 62 3 (1) 0 26EBITDA (16 ) 99 (6 ) (16 ) (16 ) 11Operat ing Profit (before amort. and except. ) (16 ) 99 (6 ) (16 ) (16 ) 11Intangible Amortisation 0 0 0 1 1 8Revaluation of investment properties (900) (177) 46 (32) 6 33Other 0 22 7 (29) 0 0Operat ing Profit (915) (55) 46 (76 ) (8 ) 52Net Interest (17) 2 (10) 12 (3) (12)Profit before tax (IFRS ) (932) (54) 36 (65) (11) 39Associated company (16) (6) (1) (20) 0 0Tax 233 26 (6) 7 3 (9)Minority interests 86 9 (4) (0) (0) 0Net income (Adj NP) 271 152 (20) (48 ) (13 ) 5Net income (IFRS ) (629 ) (25) 26 (78 ) (9 ) 30Average Number of Shares Outstanding (m) 125.8 125.8 142.6 161.8 161.8 161.8EPS - adjus ted (US$ ) 2.16 1.21 (0.14) (0.30) (0.08 ) 0.03EPS - adjus ted and fully diluted (US$ ) 2.16 1.21 (0.14) (0.30) (0.08 ) 0.03EPS - (IFRS ) (US $ ) (5.00) (0.20) 0.18 (0.48 ) (0.05) 0.19Dividend per share (p) 0.0 0.0 0.0 0.0 0.0 0.0
Gross Margin (%) N/A 72.5 100.0 N/A N/A 32.3EBITDA Margin (%) N/A N/A N/A N/A N/A 12.9Operating Margin (before GW and except.) (%) N/A N/A N/A N/A N/A 12.9
BALANCE SHEETFixed Assets 736 568 435 158 179 243Intangible Assets 0 0 0 0 0 0Tangible Assets 664 494 368 108 130 193Investments 72 74 67 50 50 50Current Assets 63 46 320 589 560 755Stock & Assets held for sale 37 15 245 531 525 712Debtors 2 3 1 17 0 14Cash 22 27 55 41 35 28Other 2 0 19 0 0 0Current Liabilit ies (95) (9 ) (20) (244) (237) (290)Creditors (95) (9) (8) (186) (177) (189)Short term borrowings 0 0 (12) (57) (59) (101)Long Term Liabilit ies (189 ) (174) (278 ) (51) (60) (236 )Long term borrowings (70) (107) (106) 0 (7) (175)Other long term liabilities (120) (67) (172) (51) (53) (61)Net Assets 514 431 457 452 443 473
CASH FLOWOperat ing Cash Flow (9 ) (15) (21) (40) 2 (181)Net Interest (0) (8) (10) 0 (3) (12)Tax 0 0 0 (19) 0 0Capex (118) (35) (69) (46) (15) (22)Acquisitions/disposals (27) 27 28 (18) 0 0Financing 0 (1) 89 51 0 (0)Dividends 2 3 4 5 6 7Net Cash Flow (152) (29) 20 (68) (9) (209)Opening net debt/(cash) (130) 48 79 63 16 31Other (55) (3) (3) 133 (6) (7)Other cash adjustments (FX & discontinued operations) 28 0 (1) (18) 0 0Clos ing net debt/(cash) 48 79 63 16 31 247

46 | Edison Investment Research | Sector research | Russian real estate | September 2012
EDISON INVESTMENT RESEARCH LIMITED Edison Investment Research is a leading international investment research company. It has won industry recognition, with awards both in Europe and internationally. The team of 95 includes over 60 analysts supported by a department of supervisory analysts, editors and assistants. Edison writes on more than 400 companies across every sector and works directly with corporates, fund managers, investment banks, brokers and other advisers. Edison’s research is read by institutional investors, alternative funds and wealth managers in more than 100 countries. Edison, founded in 2003, has offices in London, New York and Sydney and is authorised and regulated by the Financial Services Authority (www.fsa.gov.uk/register/firmBasicDetails.do?sid=181584). DISCLAIMER Copyright 2012 Edison Investment Research Limited. All rights reserved. This report has been prepared and issued by Edison Investment Research Limited for publication in the United Kingdom. All information used in the publication of this report has been compiled from publicly available sources that are believed to be reliable, however we do not guarantee the accuracy or completeness of this report. Opinions contained in this report represent those of the research department of Edison Investment Research Limited at the time of publication. The research in this document is intended for professional advisers in the United Kingdom for use in their roles as advisers. It is not intended for retail investors. This is not a solicitation or inducement to buy, sell, subscribe, or underwrite securities or units. This document is provided for information purposes only and should not be construed as an offer or solicitation for investment. A marketing communication under FSA Rules, this document has not been prepared in accordance with the legal requirements designed to promote the independence of investment research and is not subject to any prohibition on dealing ahead of the dissemination of investment research. Edison Investment Research Limited has a restrictive policy relating to personal dealing. Edison Investment Research Limited is authorised and regulated by the Financial Services Authority for the conduct of investment business. The company does not hold any positions in the securities mentioned in this report. However, its directors, officers, employees and contractors may have a position in any or related securities mentioned in this report. Edison Investment Research Limited or its affiliates may perform services or solicit business from any of the companies mentioned in this report. The value of securities mentioned in this report can fall as well as rise and are subject to large and sudden swings. In addition it may be difficult or not possible to buy, sell or obtain accurate information about the value of securities mentioned in this report. Past performance is not necessarily a guide to future performance. This communication is intended for professional clients as defined in the FSA’s Conduct of Business rules (COBs 3.5). Registered in England, number 4794244. Edison Investment Research is authorised and regulated by the Financial Services Authority. www.edisoninvestmentresearch.co.uk
London +44 (0)20 3077 5700 Lincoln House, 296-302 High Holborn London, WC1V 7JH, UK
New York +1 212 551 1118 380 Lexington Avenue, Suite 1724 NY 10168, New York, US
Sydney +61 (0)2 9258 1162 Level 33, Australia Square, 264 George St Sydney, NSW 2000, Australia


Level 33
Australia Square
264 George Street
Sydney
NSW 2000
Australia
+61 (0)2 9258 1162
Lincoln House
296-302 High Holborn
London
WC1V 7JH
United Kingdom
+44 (0) 20 3077 5700
Edison Investment Research
www.edisoninvestmentresearch.co.uk
Level 15, HP Tower
171 Featherston Street
Wellington 6011
New Zealand
+64 (0)4 894 8555