russians in germany - friedrich-naumann-stiftung … · the boris nemtsov foundation conducted the...
TRANSCRIPT

1
RUSSIANS IN GERMANY BORIS NEMTSOV FOUNDATION
OCTOBER, 2016
© 2016 Ipsos. All rights reserved. Boris Nemtsov Foundation

2
MAIN FINDINGS
METHODOLOGY
SOCIAL INTE-GRATION AND
MEDIA USE
ATTITUDE TO AND PERCEPTION OF
DEMOCRACY
RUSSIAN FOREIGN AFFAIRS
ATTITUDES TOWARDS EUROPE
ATTITUDES TO MINORITY GROUPS
AGENDA RUSSIANS IN GERMANY
1 2 3 4 5 6 7

3
MAIN FINDINGS RUSSIANS IN GERMANY

4
MAIN FINDINGS RUSSIANS IN GERMANY
The Boris Nemtsov Foundation conducted the survey “Russians in Germany” in August and September 2016. 606 residents with Russian background took part in the research. The survey provides insights in respondents’ attitudes, norms, values and perceptions concerning social integration, media use, democracy, foreign affairs, Europe and minority groups. The aim of the Boris Nemtsov Foundation is to support the development of democracy and freedom in Russia and to promote the Russian-European-dialogue.
95 percent of respondents were born outside Germany. The majority (94 percent) came to Germany between 1990 and 2009. Family reunification was the main motivation to migrate. Four out of five feel integrated in German society. 44 percent of respondents define themselves as German, nearly one fifth define themselves as Europeans. Those respondents who are able to speak German are most likely to identify themselves as Germans. Language skills are key to social integration.
Respondents consume media in Russian and German language. Despite this, they have more trust in Russian media than in Western media.

5
62 percent of respondents are satisfied with democracy in Germany. In contrast, only 17 percent are satisfied with democracy in Russia. Only every tenth person holds the view, that human rights are taken serious in Russia, while every third person thinks the same about Germany.
The three biggest threads to Russia are corruption, conflict with the West and economic uncertainty. Nearly every second respondent believes that the West has prejudice towards Russia. 44 percent say that Russia is a source of international political stability.
Close to one quarter believes that Russian values are unique. 18 percent say that Russian values are based on a mix of European and Eastern influences. The majority of respondents (61 percent) believe that Russia and Europe should share a common ground for social norms and values.
Most respondents believe that boarders should be closed to refugees. The majority does not believe that refugees can be successfully integrated and half think that there is a strong link between immigration and crime. Despite this, close to 40 percent believe that immigration enriches German culture.
MAIN FINDINGS RUSSIANS IN GERMANY

6
METHODOLOGY RUSSIANS IN GERMANY
7
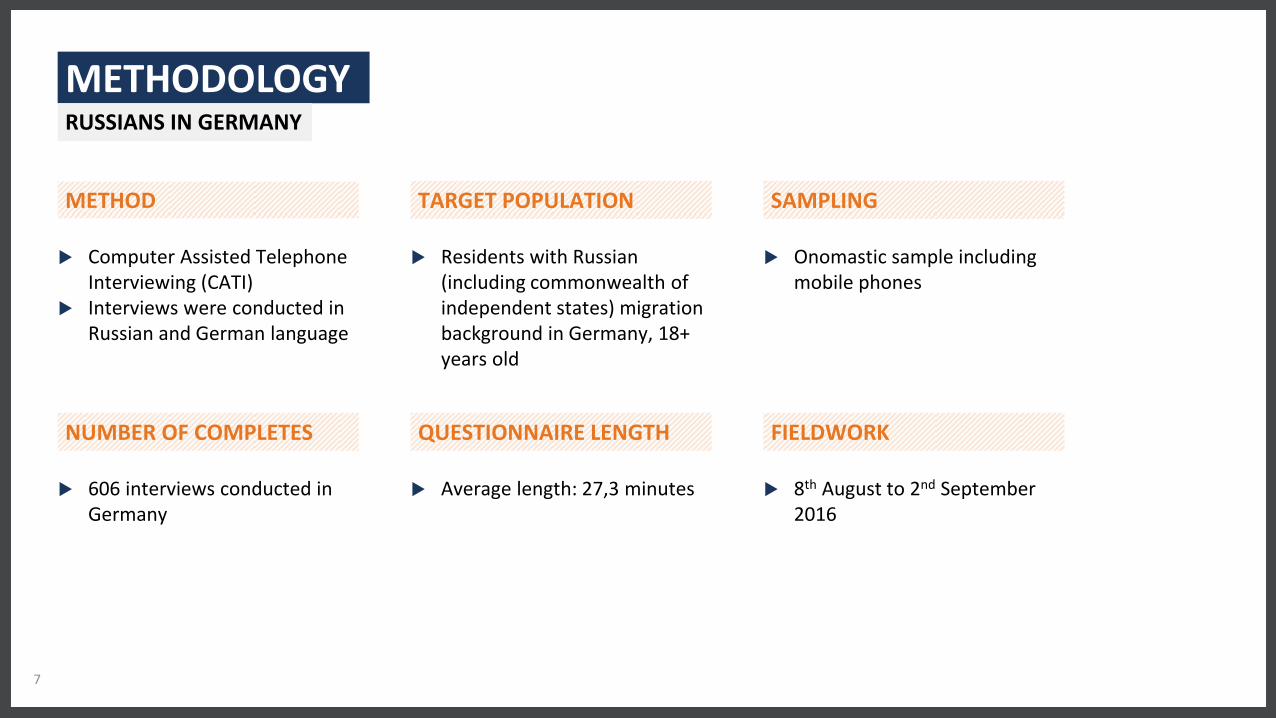
METHOD TARGET POPULATION SAMPLING
Computer Assisted Telephone Interviewing (CATI)
Interviews were conducted in Russian and German language
Residents with Russian (including commonwealth of independent states) migration background in Germany, 18+ years old
Onomastic sample including mobile phones
NUMBER OF COMPLETES QUESTIONNAIRE LENGTH FIELDWORK
606 interviews conducted in Germany
Average length: 27,3 minutes 8th August to 2nd September 2016
METHODOLOGY RUSSIANS IN GERMANY

8
DEMOGRAPHICS.
GENDER, AGE AND PLACE OF BIRTH KEY FINDINGS
More woman than men took part in the survey.
Respondents are aged between 18 and 88 years. The mean age is 51 years.
Almost all respondents (95 percent) are first generation immigrants and only 5 percent have been born in Germany.
32% 38%
30%
18-35 years old
36-54 years old
55+ years old
AGE GROUPS
57%
GENDER
43%
Base: n=606 // Question: S2 Please tell me how old are you?; S3 Gender; S4 Were you born in Germany?
5%
PLACE OF BIRTH
born in Germany
95% not born in Germany
AVERAGE AGE OF RESPONDENTS: 51 YEARS

9
DEMOGRAPHICS.
COUNTRY OF ORIGIN AND YEARS OF RESIDENCE IN GERMANY KEY FINDINGS
The majority comes from Russia and Kazakhstan.
Around two thirds of respondents came first to Germany in the 1990’s.
Around 30 percent of respondents arrived in Germany between 2000 and 2009.
HOME COUNTRY – TOP 4
Base: n=578 // Question: S5: In which country were you born?; S6: What year did you first come to live in Germany?
YEAR THEY FIRST CAME TO
LIVE IN GERMANY
40%
39%
9%
4%
Russia
Kazakhstan
Ukraine
Kyrgyzstan
3%
65%
29%
1%
1980-1989
1990-1999
2000-2009
2010-2016

10
FAMILY REUNIFICATION IS THE MAIN MOTIVATION TO COME TO GERMANY. MOST RESPONDENTS ARE GERMAN RESETTLERS.
MOTIVATION FOR MIGRATION AND IMMIGRATION RULE KEY FINDINGS
Half of the respondents came to Germany to be reunited with their family.
One quarter immigrated for economic reasons.
Every tenth person came to Germany because of the political situation in their home country.
Around 80 percent used the immigration rule “German resettlers / Russian Germans (Spätaussiedler)“ to move to Germany.
IMMIGRATION RULE
Base: n=578 // Question: S9: What emigration rule did you or your family use to reside in Germany? S10: What was your or your family's main motivation to migrate to Germany?
78% German
resettlers
11%
Jewish quota refugees
48%
24%
9%
To reunite withthe family
Economicsituation in thehome country
Political situationin the home
country
MAIN MOTIVATION FOR MIGRATION TOP 3 ANSWERS

11
SOCIAL INTEGRATION AND MEDIA USE RUSSIANS IN GERMANY

12
THE MAJORITY SPEAKS EITHER RUSSIAN OR A MIX OF RUSSIAN AND GERMAN AT HOME. MOST HAVE VERY GOOD RUSSIAN LANGUAGE SKILLS.
SPOKEN LANGUAGE AT HOME AND LANGUAGE SKILLS KEY FINDINGS
More than 60 percent are Russian native speakers.
21 percent are native German speakers.
Only 7 percent consider their German language skills as basic.
Nearly one third use both, Russian and German language at home.
42%
LANGUAGE WHICH IS MOST
OFTEN SPOKEN AT HOME
Base: n=606 // Question: Q1: What language do you speak most often at home?; Q2: How good do you think is your German?; Q3: And how good is your Russian?
Russian
32%
Russian & German
24%
German
LANGUAGE SKILLS RUSSIAN AND GERMAN LANGUAGE
21%
43% 28%
7% 0% 1%
Native Fluent Intermediate Basic I do notspeak
German
Don't know/refuse
GERMAN LANGUAGE SKILLS
61%
27%
9% 2% 0% 0%
Native Fluent Intermediate Basic I do notspeak
German
Don't know/refuse
RUSSIAN LANGUAGE SKILLS

13
28%
19% 11%
41%
1%
62% 6%
6%
20%
6%
0
1-3
4-6
More than 6
Don't know
39%
19% 9%
32%
2%
RESPONDENTS RETAIN A SOCIAL NETWORK IN THEIR HOME COUNTRY, VISITS ARE RARE, HOWEVER
SOCIAL NETWORK IN THE HOME COUNTRY KEY FINDINGS
More than 40 percent have 6 or more close relatives in their home country.
One third have 6 or more close friends.
70 percent indicate to visit friend and relative in their home country less than every two years.
However, 40 percent contact their friends and relatives at least once a week or more often.
Base: n=606 // Question: Q4: How many close friends / relatives / colleagues do you currently have in your motherland?; Question Q5: How often do you visit your close friends / relatives / colleagues in your motherland?; Q6: How often do you contact your close friends / relatives / colleagues in your motherland?
FREQUENCY OF VISITS TO HOME
COUNTRY
4% 8% 8%
70%
9%
At leastevery sixmonths
At leastonce a year
At leastonce everytwo years
Less thanevery two
years
Don'tknow/refuse
Close friends
NUMBER OF […] IN THE
HOME COUNTRY
Close relatives
Close col-leagues
SIZE OF THE SOCIAL NETWORK IN THE HOME COUNTRY
FREQUENCY OF CONTACTS WITH PEOPLE IN
HOME COUNTRY
8% 6% 26% 30%
14% 10% 6% 1%
Every day Almostevery day
At leastonce aweek
At leastonce amonth
At leastonce everysix month
Onceevery year
or less
Never Don'tknow/refuse

14
15%
44%
28%
8%
4%
6%
33%
36%
21%
5%
All
More than half
Less than half
None are German
Don't know/ refuse
Native/fluent
Intermediate or lower
12%
40% 31%
13% 5%
31%
37%
14%
8% 9%
AllMore than half
Less than halfNone are German
Don't know/ refuse
IN GERMANY, GERMANS MAKE UP HALF OF THE SOCIAL NETWORK FOR NEARLY 40 PERCENT.
SOCIAL NETWORK IN GERMANY KEY FINDINGS
12 percent have only German friends. 31 percent have only German colleagues.
40 percent have an equal share of German and Russian friends.
13 percent have no German friends.
Respondents with good German language skills are most likely to have a cross cultural social network.
Base: n=606 // Question: Q7: Among your close friends and people you work with in Germany: how many are German?
Close friends
People you work
with
SOCIAL NETWORK IN GERMANY NUMBER OF PEOPLE WHO ARE GERMAN
NUMBER OF PEOPLE WHO ARE GERMAN SPLIT BY GERMAN LANGUAGE SKILLS
37%
39%
10%
4%
10%
20%
34%
22%
17%
7%
All
More than half
Less than half
None are German
Don't know/ refuse
Native/fluent
Intermediate or lower

15
43%
40%
13% 2%
1%
2%
Very integratedIntegratedNeither / norNot integratedNot at all integratedDon't know/ refuse
FOUR OUT OF FIVE FEEL INTEGRATED. THE LEVEL OF INTEGRATION DEPENDS ON RESPONDENTS’ AGE AND LANGUAGE SKILLS.
LEVEL OF INTEGRATION KEY FINDINGS
83 percent of our respondents say to feel integrated in German society. Only 3 percent feel not integrated.
German language skills as well as respondents’ age have a big influence on the level perceived integration.
People who speaks German feel much more integrated.
Older people feel less integrated.
Base: n=606 // Question: Q8: How integrated do you feel in German society? Do you feel.
LEVEL OF INTEGRATION
IN GERMANY
LEVEL OF INTEGRATION IN GERMANY SPLIT BY GERMAN LANGUAGE SKILLS
LEVEL OF INTEGRATION IN GERMANY SPLIT BY AGE GROUPS
55%
34%
9%
1%
1%
1%
21%
49%
21%
4%
1%
4%
Veryintegrated
Integrated
Neither /nor
Notintegrated
Not at allintegrated
Don't know/refuse
Native/fluent
Intermediate or lower
58%
30%
11%
0%
1%
0%
43%
42%
10%
2%
0%
3%
26%
47%
20%
3%
2%
2%
Veryintegrated
Integrated
Neither /nor
Notintegrated
Not at allintegrated
Don't know/refuse
18-35 years old
36-54 years old
55+ years old

16
MORE THAN HALF OF OUR RESPONDENTS IDENTIFY AS GERMAN OR EUROPEAN.
PERSONAL IDENTITY KEY FINDINGS
44 percent of respondents identify as German.
19 percent suggest to have a European identity.
One fifth see themselves as Russian.
The data suggest that self identification may depend on German language skills and the level of integration.
Base: n=606 // Question: Q29: How would you personally define your identity? Are you either.
DEFINITION OF
PERSONAL IDENTITY
PERSONAL IDENTITY SPLIT BY GERMAN LANGUAGE SKILLS
PERSONAL IDENTITY SPLIT BY INTEGRATION LEVEL
49%
12%
20%
0%
1%
6%
7%
4%
34%
28%
18%
1%
3%
5%
0,07
0,04
German
Russian
European
Belarussian
Ukrainian
Other
I cannot identifywith any of these
Don't know/refuse
Native/fluent
Intermediate orlower
47%
14%
21%
0%
2%
5%
8%
4%
31%
35%
11%
2%
1%
11%
0,03
0,05
German
Russian
European
Belarussian
Ukrainian
Other
I cannot identifywith any of these
Don't know/refuse
Very integrated/integrated
Not integrated
44%
18%
19%
1%
2%
6%
7%
4%
German
Russian
European
Belarussian
Ukrainian
Other
I cannot identifywith any of these
Don't know/refuse

17
16%
83%
1%
37%
59%
4%
Russian language German languageEnglish language
RESPONDENTS USE GERMAN AND RUSSIAN INTERNET AND TV TO INFORM THEMSELVES ABOUT CURRENT AFFAIRS.
MEDIA USE KEY FINDINGS
Two thirds of respondents use the Internet and TV every day.
Most respondents inform themselves about current affairs from both, German and Russian language sources.
37 percent of Internet users only look at Russian speaking sites.
40 percent of TV users only watch Russian TV.
Base: n=606 // Question: Q10: On average, how often do you use the following media to inform yourself about politics and current affairs? You use it.? Q11: And in which language do you use the media? Please estimate for every media you use the share of German, Russian, English language media?
FREQUENCY OF MEDIA USE TO GET INFORMATION ABOUT POLITICS AND CURRENT AFFAIRS
68%
14% 2% 3%
13% 0%
66%
18%
3% 4% 8% 1%
24% 34%
5% 8%
28%
0%
53%
10% 3% 7%
27%
0%
Daily At least once a week At least once a month Less than once amonth
Never Don't know/ refuse
Internet
TV
Newspaper
Radio
IN WHICH LANGUAGE DO YOU USE THE MEDIA?
40%
59%
1% 8%
91%
1%

18
9%
12%
32% 10%
14%
23% 15%
17%
35%
12%
10%
11% 5% 12%
25%
10% 14%
34%
4% 4%
15%
7%
20%
51%
RESPONDENTS HAVE MORE TRUST IN RUSSIAN MEDIA THAN IN WESTERN MEDIA. RUSSIAN TV IS CONSIDERED THE MOST TRUSTWORTHY SOURCE OF INFORMATION.
TRUST IN MEDIA KEY FINDINGS
32 percent of respondents consider Russian TV as the most trustworthy source for politics and current affairs.
Russian radio is the least trusted – 27 percent do not believe that it is trustworthy.
The trust in Russian media is considerably higher than in Western media.
Only 19 percent trust Western media compared to 30 percent who trust Russian media.
Base: n=606 // Question: Q12: How much do you trust Russian media to portray politics and current affairs in a truthful way? Q13: How much do you agree with the following statement: Western media is more trustworthy than Russian media.
TRUST IN RUSSIAN MEDIA
WESTERN MEDIA IS MORE TRUSTWORTHY THAN RUSSIAN MEDIA
8% 11%
39% 12%
18%
12% Totally agree
Agree
Neither agree not disagree
Disagree
Totally disagree
Don't know/ refuse

19
ATTITUDE TO AND PERCEPTION OF DEMOCRACY RUSSIANS IN GERMANY

20
FOR MOST RESPONDENTS IT IS ESSENTIAL TO LIVE IN A DEMOCRACY. SATISFACTION WITH GERMAN DEMOCRACY IS HIGHER THAN SATISFACTION WITH RUSSIAN DEMOCRACY.
DEMOCRACY KEY FINDINGS
For 84 percent it is important to live in a democracy.
More than 60 percent are satisfied with democracy in Germany. Only 17 percent are satisfied with democracy in Russia.
29 percent of our respondents are dissatisfied with democracy in Russia.
However, nearly one third are not confident to evaluate democracy in Russia.
Base: n=606 // Question: Q19: For you personally, how important is it to live in a country that is governed democratically?; Q20: On the whole, how satisfied are you with the way democracy works in Germany?; Q21: On the whole, how satisfied are you with the way democracy works in Russia?
84%
12% 1% 3%
(10) Very important - (8)
(7) - (4)
(3) - (1) Not important at all
Don't know/ refuse
SATISFACTION WITH DEMOCRACY IN
GERMANY AND RUSSIA
2% 15%
24% 18% 11%
31%
Extremelysatisfied
Satisfied Neithersatisfied nordissatisfied
Dissatisfied Extremelydissatisfied
Don't know/refuse
9%
53%
22% 9% 3% 3%
Extremelysatisfied
Satisfied Neithersatisfied nordissatisfied
Dissatisfied Extremelydissatisfied
Don't know/refuse
IMPORTANCE TO LIVE IN
A DEMOCRACY

21
EVALUATION OF DEMOCRACY IN GERMANY DEPENDS ON RESPONDENTS’ AGE AND ON THE DEGREE OF INTEGRATION.
DEMOCRACY IN GERMANY KEY FINDINGS
Older respondents are rating German democracy higher than younger respondent.
Those who have a higher degree of integration are most likely to say they are satisfied with democracy in Germany.
Base: n=606 // Question: Q20: On the whole, how satisfied are you with the way democracy works in Germany?
SATISFACTION WITH DEMOCRACY IN GERMANY
9%
53%
22%
9%
3%
3%
Extremely satisfied
Satisfied
Neither satisfied nordissatisfied
Dissatisfied
Extremely dissatisfied
Don't know/ refuse
4%
52%
27%
11%
7%
0%
9%
52%
25%
9%
3%
2%
15%
56%
13%
8%
0%
8%
Extremely satisfied
Satisfied
Neither nor
Dissatisfied
Extremely dissatisfied
Don't know/ refuse
18-35 years old
36-54 years old
55+ years old
10%
56%
21%
7%
3%
2%
6%
40%
25%
18%
3%
8%
Extremely satisfied
Satisfied
Neither nor
Dissatisfied
Extremely dissatisfied
Don't know/ refuse
Very integrated/ integrated
Not integrated

22
81%
75%
74%
63%
64%
12%
16%
13%
20%
19%
4%
3%
3%
7%
3%
3%
6%
10%
10%
14%
(10) Very important - (8)
(7) - (4)
(3) - (1) Not important at all
Don't know/ refuse
EQUALITY BETWEEN WOMAN AND MEN IS THE MOST IMPORTANT CHARACTERISTIC OF DEMOCRACY.
CHARACTERISTICS OF DEMOCRACY KEY FINDINGS
All characteristic of democracy are important.
Gender equality is considered to be the most important. 81 percent say that gender equality is important.
An independent legal system is considered to be the least important characteristic of democracy.
Base: n=606 // Question: Q14: In the following I will read common characteristics of democracy. What do you think: how important are each of the following things for a democratic society?
IMPORTANCE OF CHARACTERISTICS OF DEMOCRACY
WOMEN HAVE EQUAL RIGHTS AS MEN
PEOPLE CHOOSE THEIR LEADERS IN FREE ELECTIONS
CIVIL RIGHTS PROTECT PEOPLE FROM STATE OPPRESSION
HAVING AN OPPOSITION THAT CAN FREELY EXPRESS ITS VIEWS
THE LEGAL SYSTEM SHOULD BE INDEPENDENT FROM THE GOVERNMENT

23
COMPLIANCE WITH HUMAN RIGHTS IN GERMANY IS HIGHER THAN IN RUSSIA. RATINGS DEPEND ON AGE, DEGREE OF INTEGRATION AND IMMIGRATION RULE.
HUMAN RIGHT KEY FINDINGS
Of those asked, every third person believes that Germany adheres to human rights.
Only every tenth person says the same about Russia.
Older people and Jewish quota refugees are most likely to be critical about human rights in Russia.
Respondents with a high degree of integration think most positively about human rights in Germany.
Base: n=606 // Question: Q15: Thinking about RUSSIA today, would you say that in general human rights are followed. Q16: And how about GERMANY today, would you say that in general human rights are followed.
11%
59%
12%
18%
36%
52%
4% 7%
Completely
Partly
Not at all
Don't know/ refuse
COMPLIANCE OF HUMAN RIGHT IN RUSSIA AND GERMANY
SPLIT: AGE GROUPS
14%
73%
6%
7%
12%
57%
11%
20%
7%
48%
19%
26%
Completely
Partly
Not at all
Don't know/refuse
18-35 years old
36-54 years old
55+ years old
11%
60%
11%
19%
15%
52%
23%
11%
Completely
Partly
Not at all
Don't know/refuse
German resettlers/Russian Germans
Jewish quota refugees
38%
53%
4%
6%
24%
52%
8%
15%
Completely
Partly
Not at all
Don't know/refuse
Very integrated/integrated
Not integrated
33%
54%
5%
7%
54%
37%
3%
6%
Completely
Partly
Not at all
Don't know/refuse
German resettlers/Russian Germans
Jewish quota refugees
RUSSIA SPLIT: EMI-
GRATION RULE
RUSSIA
SPLIT: INTE-GRATION LEVEL
GERMANY SPLIT: EMI-
GRATION RULE
GERMANY

24
59%
23%
14%
15%
14%
14%
7%
16%
14%
6%
17%
20%
3%
17%
26%
10%
13%
12%
(1) Strongly agree (2) Agree (3) Neither nor
(4) Disagree (5) Strongly disagree Don't know/ refuse
FOR MORE THAN EVERY FOURTH PERSON IT IS ACCEPTABLE THAT PERSONAL INFORMATION IS RETAINED IF THE POLITICAL LEADERSHIP IS CRITICIZED.
SURVEILLANCE KEY FINDINGS
Three out of four accept the retention of personal information, if it will help to prevent extremism.
28 percent of respondents agree with retention of personal information, if the leadership is criticized.
37 percent of respondents disagree with the retention of personal information under all circumstances.
Base: n=606 // Question: Q17: In which situations do you believe should a state be allowed to gather or retain personal information?
SITUATION IN WHICH THE STATE SHOULD BE ALLOWED TO
GATHER OR RETAIN PERSONAL INFORMATION
THE STATE SHOULD BE ALLOWED TO GATHER OR RETAIN PERSONAL INFORMATION FROM PEOPLE WHO ARE SUSPECTED EXTREMISTS
THE STATE SHOULD NEVER BE ALLOWED TO SECRETLY GATHER OR RETAIN ANY PERSONAL INFORMATION
THE STATE SHOULD BE ALLOWED TO GATHER OR RETAIN PERSONAL INFORMATION FROM PEOPLE WHO CRITICIZE THE POLITICAL LEADERSHIP

25
90%
81%
57%
52%
20%
1%
8%
25%
29%
37%
2%
3%
7%
8%
29%
7%
8%
12%
11%
15%
(1) Always be allowed
(2) Sometimes be allowed
(3) Never be allowed
Don't know/ refuse
PEOPLE ARE MORE LIKELY TO SUPPORT THE RESTRICTION OF ONLINE CHILD-PORNOGRAPHY THAN WEBPAGES PROPAGATING TERRORISM.
ACCESS TO WEBPAGES KEY FINDINGS
90 percent support restricting access to certain webpages if this helps to prevent child-pornography.
81 percent of our respondents are in favor of restricting webpages in support of terrorism.
One fifth thought it should always be allowed to restrict access to websites which undermine government. 29 percent thought this should never be allowed.
Base: n=606 // Question: Q18: In which situations do you believe should governments be allowed to restrict access to certain websites:
SITUATIONS IN WHICH THE GOVERNMENT SHOULD BE
ALLOWED TO RESTRICT THE ACCESS TO CERTAIN WEBSITES
PREVENT THE DISTRIBUTION OF CHILDREN PORNOGRAPHY
BLOCK THE SPREAD OF TERRORISM
BLOCK INFORMATION INCITING ETHNICAL AND RELIGIOUS HATRED
PROTECT SOMEONE'S PERSONAL PRIVACY
PREVENT THE SPREAD OF INFORMATION WHICH UNDERMINES THE GOVERNMENT

26
RUSSIAN FOREIGN AFFAIRS RUSSIANS IN GERMANY

27
59%
37%
31%
24%
17%
53%
28%
25%
17%
15%
Corruption
Conflict with the West
Economic uncertainty
Religious Extremism
EU enlargement inEastern Europe
Native/ fluent
Intermediate or lower
CORRUPTION IS THE BIGGEST THREAT TO RUSSIA. FOLLOWED BY CONFLICT WITH THE WEST.
THREATS OF RUSSIA KEY FINDINGS
57 percent of our respondents say that corruption is the biggest threat to Russia.
About every third respondent believes that conflict with the West is a real danger to Russian security.
By contrast, EU enlargement is considered least threatening.
For younger respondents “conflict with the West” and “economic uncertainty” are significant bigger threats than for older respondents.
Base: n=606 // Question: Q24: In your opinion, what are the 3 biggest threats Russia is facing at the moment?
57% 34% 29% 21% 16%
Corruption Conflict with theWest
Economicuncertainty
ReligiousExtremism
EU enlargement inEastern Europe
BIGGEST THREATS WHICH RUSSIA IS FACING AT THE MOMENT
58%
45%
36%
27%
21%
56%
31%
25%
16%
17%
56%
27%
25%
22%
10%
Corruption
Conflict with the West
Economic uncertainty
Religious Extremism
EU enlargement inEastern Europe
18-35 years old
36-54 years old
55+ years old

28
71%
34%
26%
21%
9%
18%
18%
16%
5%
15%
23%
20%
1%
7%
9%
11%
2%
8%
6%
11%
12%
18%
19%
22%
(1) Strongly agree (2) Agree (3) Neither nor (4) Disagree (5) Strongly disagree Don't know/ refuse
A LARGE MAJORITY IS OF THE OPINION THAT RUSSIA SHOULD COOPERATE WITH THE WEST TO DEFEAT TERRORISM.
RUSSIA EXTERNAL AFFAIRS 1/2 KEY FINDINGS
80 percent believe that the West and Russian should work together to defeat terrorism.
More than half has the opinion that the West has prejudice towards Russia.
44 percent think that Russia is a source of international political stability.
37 percent of our respondents agree that Russia should do more to protect ethnic Russian living abroad.
Base: n=606 // Question: Q23: Do you strongly agree, agree, neither agree nor disagree, disagree or strongly disagree with the following statements?
RUSSIA SHOULD COOPERATE WITH THE WEST TO DEFEAT TERRORISM
THE WEST REFERS WITH PREJUDICE TOWARDS RUSSIA
RUSSIA IS A SOURCE OF INTERNATIONAL POLITICAL STABILITY
RUSSIA SHOULD DO MORE TO PROTECT ETHNIC RUSSIANS LIVING OUTSIDE RUSSIA

29
20%
19%
13%
9%
13%
12%
9%
5%
27%
26%
24%
17%
9%
13%
13%
16%
10%
7%
15%
26%
22%
23%
26%
27%
(1) Strongly agree (2) Agree (3) Neither nor (4) Disagree (5) Strongly disagree Don't know/ refuse
MOST RESPONDENTS BELIEVE THAT RUSSIA SHOULD NOT INFLUENCE UKRAINIAN AFFAIRS.
RUSSIA EXTERNAL AFFAIRS 2/2 KEY FINDINGS
One third thinks, that Russia should pursue it’s interests even if they are in conflict with the interests of other countries.
31 percent believe that Russia is too focused on external politics.
22 percent suggest that Russia should invest more in its armed forces.
42 percent believe that Russia should not intervene in Ukrainian affairs but 14 percent believe it should do so. Base: n=606 // Question: Q23: Do you strongly agree, agree, neither agree nor disagree, disagree or strongly disagree with the following statements?
RUSSIA SHOULD PURSUE ITS NATIONAL INTEREST EVEN IF THIS IS IN CONFLICT WITH THE INTEREST OF OTHER COUNTRIES
RUSSIAN GOVERNMENT IS RATHER CONCENTRATED ON EXTERNAL POLITICS THAN INTERNAL PROBLEMS
RUSSIA SHOULD INVEST MORE INTO ITS ARMED FORCES TO FACE CURRENT SECURITY RISKS
RUSSIA HAS THE RIGHT TO INFLUENCE EXTERNAL AND INTERNAL DECISIONS IN UKRAINE

30
ATTITUDES TOWARDS EUROPE RUSSIANS IN GERMANY

31
KNOWLEDGE ABOUT THE EU IS LIMITED. GERMANY SHOULD STAY IN THE EU.
KNOWLEDGE ABOUT EU AND GERMANY'S LONG-TERM STRATEGY KEY FINDINGS
More than half of our respondents have very limited knowledge about the EU.
45 percent have the opinion that Germany should stay in the EU. However the same respondents also wish to reduce the EU’s influence.
13 percent would consolidate more power within a single EU government, while only 16 percent wish to leave the EU.
Base: n=606 // Question: Q25: And what about the European Union? How much do you feel do you know about the European Union?; Q26: Membership in the European Union and the Eurozone is currently polarizing citizens. In your opinion what should be Germany's long-term strategy? Should it be...
8%
34%
48%
6% 4%
A great dealA fair amountNot very muchNothing at allDon't know/ refuse
GERMANY'S LONG-TERM STRATEGY KNOWLEDGE ABOUT
THE EUROPEAN UNION
13%
6%
45%
16%
20%
To consolidate more powerwithin a single European
government.
To change nothing.
To stay in the EU and try toreduce the EU's influence on the
country.
To leave the European Union.
Don't know/ refuse

32
MEANING OF RUSSIAN VALUES IS AMBIGUOUS BUT APPROXIMATELY EVERY FOURTH PERSON THINKS THEY ARE UNIQUE.
RUSSIAN VALUES KEY FINDINGS
Close to one quarter believes that Russian values are unique.
18 percent say that Russian values are based on a mix of European and Eastern influences.
16 percent believe that Russian values are close to European values.
The majority of respondents (61 percent) say that Russia and Europe should have a common ground for social norms and values.
Base: n=606 // Question: Q27: Do you believe that people's values in Russia are.; Q28: Some people say that it would be positive for Russia to embrace European social norms and values, other people suggest Europe should embrace Russian social norms and values. You personally, what do you believe?
VALUES IN RUSSIA
16%
7%
23%
18%
36%
Closer to European values
Closer to Eastern values, or
Unique and are neither close toEuropean nor Eastern values
Mix of European and Easternvalues
Don't know/ refuse
SHOULD VALUES IN RUSSIA BE CHANGED?
15%
61%
6%
19%
Russia should embrace Europeansocial norms and values
Russia and Europe should have amutual exchange of social norms
and values
Europe should embrace Russiansocial norms and values
Don't know/ refuse

33
64%
17%
19%
40%
17%
43%
Native/ fluent
Intermediate orlower
THE FREE MARKET ECONOMY IS SEEN TO BE THE MOST EFFECTIVE ONE.
ECONOMIC MODELS KEY FINDINGS
56 percent think that a free market economy is the most effective economic model.
17 percent believe that a state-run economy is the most effective model.
The level of agreement depends on respondents’ age. 74 percent of people age 18 to 35 years believe in a free market economy, while only 42 percent of the 55+ year olds believe the same.
Base: n=606 // Question: Q30: What do you think, which of the following economic models is most effective for economic development?
56%
17% 28%
Free market economyin which everyone isfree to do business
A state-run economy Don't know/ refuse
MOST EFFECTIVE ECONOMIC MODELS
74%
14%
12%
51%
19%
30%
42%
17%
41%
Free market economyin which everyone isfree to do business
A state-run economy
Don't know/ refuse
18-35 years old
36-54 years old
55+ years old
60%
17%
23%
37%
15%
48%
Very integrated/integratedNot integrated

34
ATTITUDES TO MINORITY GROUPS RUSSIANS IN GERMANY
35
54%
35%
10%
18%
13%
9%
11%
22%
29%
5%
11%
22%
2%
7%
21%
10%
12%
8%
(1) Strongly agree (2) Agree (3) Neither nor
(4) Disagree (5) Strongly disagree Don't know/ refuse
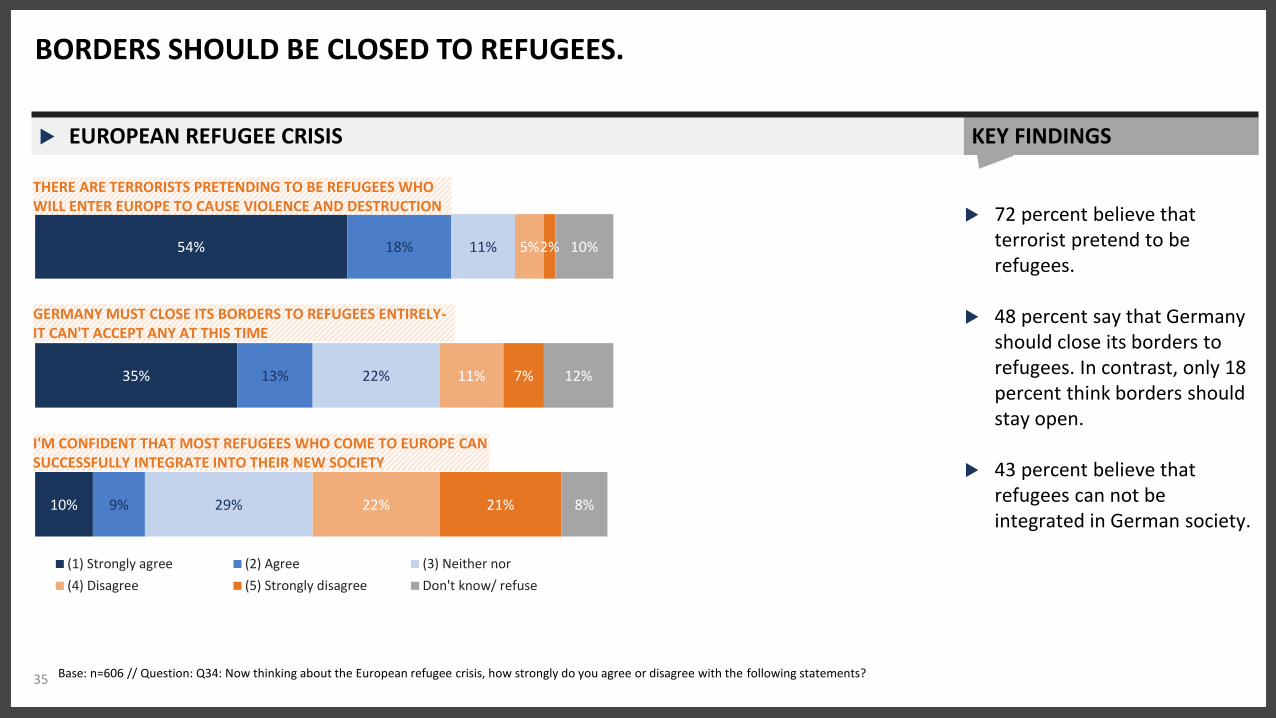
BORDERS SHOULD BE CLOSED TO REFUGEES.
EUROPEAN REFUGEE CRISIS KEY FINDINGS
72 percent believe that terrorist pretend to be refugees.
48 percent say that Germany should close its borders to refugees. In contrast, only 18 percent think borders should stay open.
43 percent believe that refugees can not be integrated in German society.
Base: n=606 // Question: Q34: Now thinking about the European refugee crisis, how strongly do you agree or disagree with the following statements?
THERE ARE TERRORISTS PRETENDING TO BE REFUGEES WHO WILL ENTER EUROPE TO CAUSE VIOLENCE AND DESTRUCTION
GERMANY MUST CLOSE ITS BORDERS TO REFUGEES ENTIRELY-IT CAN'T ACCEPT ANY AT THIS TIME
I'M CONFIDENT THAT MOST REFUGEES WHO COME TO EUROPE CAN SUCCESSFULLY INTEGRATE INTO THEIR NEW SOCIETY

36
29%
19%
18%
9%
21%
17%
21%
7%
27%
25%
30%
22%
11%
14%
11%
25%
4%
15%
8%
28%
8%
10%
12%
8%
(1) Strongly agree (2) Agree (3) Neither nor
(4) Disagree (5) Strongly disagree Don't know/ refuse
RESPONDENTS BELIEVE THAT THERE IS A LINK BETWEEN IMMIGRANTS AND CRIME.
IMMIGRANTS KEY FINDINGS
50 percent believe that immigrants make crime problems worse.
Nearly 40 percent think that immigrations will enrich German culture.
Only 16 percent suggest that immigrants take away jobs from natives while 53 percent think the opposite.
39 percent believe that immigrants do the hard and unpleasant work.
Base: n=606 // Question: Q33: Please consider the following statements:
IMMIGRANTS MAKE CRIME PROBLEMS WORSE
IMMIGRANTS COULD ENRICH THE CULTURE OF THE COUNTRY
IMMIGRANTS DO THE HARD AND UNPLEASANT WORK FOR THE COUNTRY
IMMIGRANTS TAKE JOBS AWAY FROM NATIVES IN A COUNTRY

37
76%
70%
54%
18%
9%
18%
22%
41%
76%
86%
6%
8%
6%
6%
5%
(1) Acceptable (2) not acceptable Don't know/ refuse
MORE THAN THREE OF FOUR DO NOT HAVE A PROBLEM LIVING NEXT TO MUSLIMS.
ACCEPTANCE OF DIFFERENT SOCIAL GROUPS KEY FINDINGS
Base: n=606 // Question: Q32: Could you accept living next to members of the following social groups?
COULD YOU ACCEPT LIVING NEXT TO MEMBERS OF THE FOLLOWING SOCIAL GROUPS?
PEOPLE WHO ARE MUSLIMS
IMMIGRANTS/ FOREIGN WORKERS
HOMOSEXUALS
HEAVY DRINKERS
DRUG ADDICTS
74%
63%
62%
38%
Immigrants/ foreignworkers
HomosexualsNative/ fluent
Intermediate or lower
78%
67%
67%
50%
64%
43%
Immigrants/ foreignworkers
Homosexuals18-35 years old36-54 years old55+ years old
73%
59%
53%
31%
Immigrants/ foreignworkers
Homosexuals
Very integrated/integratedNot integrated
ANSWER OPTION ACCEPTABLE
76 percent of our respondents accept Muslims as neighbors.
70 percent accept immigrants as neighbors.
Only 41 percent say that they have no problem to live next to homosexuals.
Young respondents, respondents with good German skills and respondents with a high level of integration are most likely to accept minority groups as neighbors.