rwanda: financing for manufacturing - set€¦ · rwanda can maximise financing opportunities,...
TRANSCRIPT

RWANDA: FINANCING FOR MANUFACTURING
Linda Calabrese, Phyllis Papadavid and Judith Tyson
June 2017

RWANDA: FINANCING FOR MANUFACTURING
ii
© SUPPORTING ECONOMIC TRANSFORMATION. The views presented in this publication are those of the author(s) and do not necessarily represent the views of DFID or ODI.
Acknowledgements This paper has been authored by Phyllis Papadavid (ODI, Team Leader – International Macroeconomics), Judith Tyson (Research Fellow) and Linda Calabrese (Research Fellow). The authors thank Dirk Willem te Velde for his comments and David Booth for peer review, and gratefully acknowledge the UK Department for International Development (DFID) for its financial support for the paper. All views expressed are those of the authors alone and do not reflect DFID or ODI views. For further information about ODI’s SET Programme please contact Sonia Hoque ([email protected]), Programme Manager of SET, or visit http://set.odi.org/

RWANDA: FINANCING FOR MANUFACTURING
iii
TABLE OF CONTENTS List of figures, tables and boxes __________________________________________________ iv Acronyms ___________________________________________________________________ v Executive summary ____________________________________________________________ vi 1. Introduction ________________________________________________________________ 1 2. Economic constraints and opportunities __________________________________________ 2
2.1 Current performance ________________________________________________ 2
2.2 Favourable trends and remaining challenges _____________________________ 3
2.2.1 A good business environment and incentives to invest ________________________ 3 2.2.2 A committed leadership and low levels of corruption __________________________ 4 2.2.3 A trainable workforce __________________________________________________ 5 2.2.4 Good market opportunities ______________________________________________ 6 2.2.5 A remaining challenge: Infrastructure and utilities ____________________________ 7 2.2.6 A further remaining challenge: Rwanda’s real effective exchange rate ____________ 8
2.3 Managing the constraints and exploiting the opportunities ___________________ 9
2.3.1 Special economic zones and industrial parks in Rwanda as a key investment opportunity _______________________________________________________________ 9 2.3.2 Promoting investment more broadly ______________________________________ 10 2.3.3 Fostering export competitiveness ________________________________________ 11
2.4 Why manufacturing in Rwanda: conclusion _____________________________ 11
3. Financial constraints and opportunities __________________________________________ 12
3.1 The domestic financial sector ________________________________________ 12
3.2 Favourable trends and remaining challenges: Rwanda’s financial flows _______ 13
3.3 Managing the constraints and exploiting the opportunities __________________ 15
3.4 Rwanda private investment flows: conclusion ___________________________ 18
4. Policy suggestions _________________________________________________________ 19 4.1 Managing Rwanda’s economic constraints __________________________________ 19 4.2 Managing Rwanda’s financial constraints ___________________________________ 19
5. Conclusion _______________________________________________________________ 20 References _________________________________________________________________ 21

RWANDA: FINANCING FOR MANUFACTURING
iv
LIST OF FIGURES, TABLES AND BOXES Figure 1. Exports to GDP – Rwanda relative to other landlocked economies (% share) ................ 2 Figure 2. Rwanda’s exports (million $) ............................................................................................ 7 Figure 3. Rwanda’s real and nominal effective exchange rate indices (Index, 2000=100) ............. 9 Figure 4. Rwanda’s private credit to GDP (%) .............................................................................. 13 Figure 5. Rwanda’s financing stock by sector ($ millions) ............................................................ 14 Figure 6. Rwanda’s financing stock for manufacturing ($ millions) ............................................... 15 Figure 7. Rwanda’s financing flows for manufacturing ($ millions) ............................................... 15 Table 1. Ease of doing business rankings for selected countries in East Africa, 2017 ................... 3 Table 2. Selected corruption indicators, 2011 (Rwanda) and various years (other) ....................... 5 Table 3. Road freight charges on the Northern Corridor, September 2016 ($) ............................... 7 Table 4. Cost of electricity and water across East Africa ................................................................ 7 Box 1. Beyond business environment……………………………………………………………………4 Box 2. Coordinating industrial policy in Rwanda………………………………………………………..5 Box 3. Kigali special economic zone……………………………………………………………………10 Box 4. C&H garments…………………………………………………………………………………….10 Box 5. Manufacturing opportunities from China?...........................................................................18

RWANDA: FINANCING FOR MANUFACTURING
v
ACRONYMS ADB Asian Development Bank AfDB African Development Bank AGOA African Growth and Opportunity Act CFA Communauté Financière d'Afrique CMA Capital Markets Authority DFI Development Finance Institution DRC Democratic Republic of Congo EAC East African Community EBA Everything but Arms EDPRS Economic Development and Poverty Reduction Strategy EU European Union FDI Foreign direct investment GDP Gross domestic product GoR Government of Rwanda ICT Information and communication technology IFC International Finance Corporation IMF International Monetary Fund MINEACOM Ministry of Trade, Industry and EAC Affairs MINECOFIN Ministry of Finance and Economic Planning MINICOM Ministry of Trade and Industry NISR National Institute of Statistics of Rwanda NBR National Bank of Rwanda RDB Rwanda Development Board REER Real effective exchange rate SEZ Special economic zone SEZAR Special Economic Zones Authority of Rwanda SMEs Small and medium-sized enterprises SSA Sub-Saharan Africa UN United Nations UNECA UN Economic Commission for Africa US United States WDA Workforce Development Authority

RWANDA: FINANCING FOR MANUFACTURING
vi
EXECUTIVE SUMMARY Rwanda is one of Africa’s “rising stars”. The country’s economy has seen solid rates of economic growth since the civil conflict in the mid-1990s. Strength in investment flows has followed in the path of this macroeconomic and institutional stability. As this paper highlights, a large part of Rwanda’s success has been the result of proactive policies undertaken by the government of Rwanda in facilitating a good domestic investment climate, which have been conducive to strong rates of growth in foreign direct investment (FDI) into the economy. Despite the country’s successes, though, developments in manufacturing have not been as encouraging: the sector’s share of the economy and exports is still small. This paper aims to analyse Rwanda’s financial backdrop, and the composition of its investment flows into manufacturing, with a view to exploring constraints and opportunities in manufacturing. In terms of the recent past, with approximately 8% gross domestic product (GDP) growth, Rwanda’s macroeconomic backdrop has largely reflected the continuing and solid state of the economy. However, at 15% of total merchandise exports, its manufacturing exports remain low. In Section 2, this paper first analyses Rwanda’s macroeconomic and financial backdrop with regard to developments in manufacturing, and how this has been influenced by the exchange rate and financial sector developments. We find that the elevated level of the real effective exchange rate may pose a constraint to manufacturers and a risk to the overall external position of the economy. Thereafter, the paper examines government policies that have made Rwanda an attractive investment location, which has boosted Rwanda’s World Bank ease of doing business rankings. The paper then turns to an analysis of the investment inflows into Rwanda, with a particular focus on the share of investment and finance being channelled to manufacturing. At 24% of GDP, Rwanda has seen higher than average investment than the average in other low- and middle-income sub-Saharan African countries. Much of this investment has not been committed to the manufacturing sector. Section 3 conducts a brief analysis of Rwanda’s domestic financial sector, which has a largely underdeveloped domestic capital market but, at the same time, has also seen an expansion in banking. Thereafter, Section 3 explores the composition of Rwanda’s investment flows into manufacturing; these have largely been dominated by FDI. Section 4 then explores constraints and opportunities in finance, as well as in investing in Rwanda’s manufacturing sector. The paper asserts that, as Rwanda’s continues to develop its financial market, the opportunities for financing investment will grow and that the government of Rwanda can maximise financing opportunities, including through mobilising further domestic sources of capital and deepening elements of its financial markets, such as its insurance and pension markets. In the manufacturing sector too, both constraints and opportunities exist. Some of Rwanda’s key constraints continue to stem from utility and transport costs, as well as infrastructure challenges, though a key strategy to exploit opportunities should continue to be through special economic zones (SEZs). The final section of the paper discusses forward-looking policy options to facilitate finance, enhance competitiveness and promote exports in relation to Rwanda’s manufacturing sector. Section 5 briefly puts forward three areas of policy area for discussion to further mitigate constraints and optimise opportunities in Rwanda’s manufacturing sector. The first area of policy reform pertains to financial sector deepening, with a focus on enhancing investment into the manufacturing sector in particular. This is followed by policy suggestions to promote Rwanda’s export competitiveness, through lowering the real effective exchange rate. Finally, we explore policies oriented towards export promotion, particularly through SEZs and through trade facilitation, with a view to boosting manufacturing export performance.

1
1. INTRODUCTION Rwanda is one of Africa’s rising stars, having seen solid rates of economic growth since its civil conflict in the mid-1990s. A large part of its economic success has been a result of the proactive policies put in place by the Government of Rwanda (GoR) in facilitating a good domestic investment climate, which has been conducive to strong rates of growth in foreign direct investment (FDI). Despite the country’s successes, though, developments in manufacturing have not been as encouraging: the sector’s share of the economy, and in exports, remains small. This section briefly examines Rwanda’s economic backdrop, followed by the importance of foreign investment as well as that of recent developments in the country’s manufacturing sector. By most measures, Rwanda can be considered a success story in terms of its ability to generate and sustain high levels of economic growth. Four particular features stand out in relation to its economic success. First, the government has played a driving role in the economy’s reconstruction since the civil conflict in the mid-1990s, and in facilitating a favourable investment climate. Second, there have been signs of a transition from a situation of low-productivity jobs into one of higher-productivity activities – that is, economic transformation. Third, the government has succeeded in partnering with the international community to facilitate increased FDI. Finally, services exports, agro-processing, information and communication technology (ICT) and selective labour-intensive manufactures are becoming key growth drivers (Ggombe and Newfarmer, 2017). GoR has actively encouraged the growth of private investment. A new investment code and one-stop investment promotion centre, the Rwanda Development Board (RDB), were established in 1998 to improve the investment environment. Forms of technical and financial assistance were also initiated, including loan guarantees and liberalisation of selected economic sectors to attract private investment. The privatisation campaign reached its peak in the period 1998–2000, when 55 state enterprises were earmarked; among these were coffee and tea factories, public utilities and the state-owned telecommunications company, Rwandatel. GoR is increasingly cognisant of the importance of the manufacturing sector for job creation, skills development and growth. It is looking at both increasing the country’s exports and producing for the domestic market, through the Domestic Market Recapturing Strategy developed by the then-Ministry of Trade and Industry (MINICOM; now the Ministry of Trade, Industry and EAC Affairs, MINEACOM).
Compared with the services sector and its economic success, Rwanda’s manufacturing sector has remained relatively weak. The fact that policy-makers invested in services in advance of manufacturing has meant that the former has become a leading sector in growth for much of the past two decades. This is indicative of challenges to Rwanda’s future growth prospects. One aspect of this challenge is that the country tends to have a lower export-to-gross domestic product (GDP) ratio than other low- and lower-middle-income developing countries that are also landlocked. The significant part of its export growth owed to the global commodity boom, which pushed up mineral prices to historic levels. With goods imports three times the size of exports, and imports also growing at about 20% per annum, at 16.6% of GDP, Rwanda’s external deficit is likely to continue to grow.
The weakness in Rwanda’s manufacturing sector and its relatively moderate export contribution underscore the importance of tackling the obstacles in the economy’s growth trajectory. The majority of the challenges to manufacturing growth and manufacturing exports are real constraints (such as transport costs and Rwanda’s landlocked geography). However, economic and financial constraints are also important in the Rwandan context, and therefore represent a focus of this paper. Section 2 analyses Rwanda’s economic constraints and opportunities. Section 3 then examines the country’s financial sector constraints and opportunities. Section 4 briefly presents policy options for managing the economic and financial constraints in Rwanda’s manufacturing sector, drawing in part on Sections 2 and 3. Section 5 concludes.

2
2. ECONOMIC CONSTRAINTS AND OPPORTUNITIES
2.1 Current performance With an average 8% annual growth rate1 for the past two decades, Rwanda has been one of the fastest growing economies in sub-Saharan Africa (SSA). However, compared with agriculture and services, its manufacturing sector has struggled to gain a strong place in the country’s economy. In recent years, manufacturing value-added in GDP has remained stagnant, at around 5%, according to the World Bank. This is reflected in the country’s low levels of manufacturing exports. While exports are becoming more diversified (English et al., 2016), Rwanda’s export share is low compared with other landlocked economies (Figure 1). Additionally, manufacturing provides a small contribution: manufactures were only 15% of total merchandise exports in 2015 (for Uganda and Tanzania this figure is much higher, at around 25%, according to the World Bank).
Figure 1: Exports to GDP – Rwanda relative to other landlocked economies (% share)
Source: English et al. (2016). Rwanda’s manufacturing sector is largely undiversified, and is concentrated in seven subsectors: food; beverages and tobacco; textiles and clothing; wood, paper and printing; chemicals, rubber and plastics; non-metallic minerals; and furniture. Food, beverages and tobacco products account for more than 70% of total manufacturing output (World Bank, 2015). By far the strongest rise has occurred in food output, which has seen its share in manufacturing increase from 23.25% in 2000 to 43.79% in 2012. Rwandan microenterprises comprise the majority, 94.27%, of manufacturing firms. However, the share of exporting firms is small, accounting for only 14% of all manufacturers. For large firms (more than 100 employees), 40% have some form of foreign ownership; for small and medium-sized enterprises (SMEs) (10–100 employees), this figure is at 13%. At 15% of total merchandise exports, manufacturing exports remain low. Rwanda has scope to invest in its industry in order to improve the overall growth and geographical reach of its exports. The Democratic Republic of Congo (DRC) accounts for 32% of Rwanda’s exports, which largely are re-exports of fuel products (World Bank, 2016). As a commodity importer, meanwhile, Rwanda has benefited from lower commodity prices. Therefore, weakness in imports rather than export growth has accounted for the moderate improvement in its 16.6% current account deficit. Manufacturing exports and merchandise trade have seen muted growth, and this situation has
1 Statistic taken from the World Bank World Development Indicator database.

3
been linked, in part, to relatively weak FDI into the country’s manufacturing sector, as Section 3 notes.
2.2 Favourable trends and remaining challenges Rwanda is often presented as a good destination for investment. In recent years, the country has been singled out as having a good business environment and zero tolerance for corruption, thus making investment smoother there than in other places in SSA. In addition, Rwanda presents other less-known advantages. Despite Rwanda’s efforts to promote investment, certain constraints remain. This section summarises the main issues, and introduces the discussion on opportunities. 2.2.1 A good business environment and incentives to invest One of Rwanda’s strengths lies in its business environment. GoR has worked painstakingly to improve and streamline the country’s business registration process. This progress is shown by Rwanda’s improvement in the World Bank’s Doing Business rankings, from 143rd in 2009 to 56th in 2017 – the as second SSA economy after Mauritius. Rwanda performs well in its business environment compared with its regional neighbours, as Table 1 and Box 1 illustrate.2 The most striking results have been in the investment registration process, which has been streamlined. Registering a company takes only a few hours, and permits and documents can be obtained at the RDB, which acts as a one-stop shop.
Table 1: Ease of doing business rankings for selected countries in East Africa, 2017 Rwanda Kenya Uganda Tanzania
Ease of doing business 56 92 115 132
Starting a business 76 116 165 135
Dealing with construction permits 158 152 151 136
Getting electricity 117 106 161 87
Registering property 4 121 116 132
Paying taxes 59 125 75 154
Trading across borders 87 105 136 180
Enforcing contracts 95 87 64 59
Resolving insolvency 73 92 111 100
Source: World Bank Doing Business Indicators. The Investment Promotion Law (2015) provides fiscal and non-fiscal incentives to investors in priority sectors, including export-oriented activities and industrial manufacturing. These are given after an investment certificate is obtained (issued within two days). They include i) a preferential income tax rate (at zero or 15%); ii) a corporate income tax holiday of up to seven years; iii) exemption from customs tax for products used in export processing zones; iv) exemption from
2 However, Ansu et at. (2016) point out how the recent literature on industrial policy indicates the need to balance an improved investment climate with targeted sectoral interventions, implying that cross-cutting measures targeting the broader business environment are unlikely to be sufficient.

4
capital gains tax; v) value-added tax refunds; vi) accelerated depreciation at a rate of 50% for the first year for new and used assets; and vii) immigration incentives, such as issuance of residence permits to investors and dependants.
2.2.2 A committed leadership and low levels of corruption Rwanda’s leadership is engaged in development initiatives, and it has been active in addressing cross-cutting issues such as improving the business environment and the infrastructure network. It appears that GoR is increasingly responding to private sector concerns, through its increased efforts at coordinating and facilitating investment (Box 2). The case of C&H Garments is emblematic (Manson, 2015a). GoR has also signed memoranda of understanding with companies, pledging to support them through various activities in exchange for their commitment to export targets (Ntirenganya, 2016). In addition to this, the former Ministry of the East African Community (EAC) has organised quarterly meetings with the private sector so it can hear and address their concerns about trade in the EAC.3 GoR follows principles of transparency and accountability, with its objectives set up in performance contracts (imihigo) that are used to define targets and coordinate institutions.
3 Interview with senior officials, Ministry of EAC, May 2016.
Box 1: Beyond business environment A good domestic business environment is important to attract investors, but there are many other factors that are important investment determinants, and that foreign investors take into account when making investment decisions. These factors are related to the availability, cost and quality of electricity and water, transport and logistics, telecommunications, and labour. Calabrese et al. (2017) compares a set of low income countries in Africa and Asia across these factors, to assess their desirability as investment destinations. This box summarises the findings of these papers related to Rwanda.
• Electricity: Rwanda and East Africa region compares poorly with other developing regions. Access, reliability and cost of power supply fare poorly in Rwanda compared to the other developing regions, especially in Asia. This is discussed further in section 2.5.
• Water: The East African region and Rwanda score better than their counterparts in Africa in terms of access and reliability (but there is no extensive dataset on costs).
• Transport and logistics: the road and rail coverage in East Africa is relatively low compared to other regions. Rwanda has higher road coverage than its regional neighbours but no railroads. In terms of transport times and costs, East Africa compares poorly with the rest of Africa and with Asia. Rwanda is an average performer in the East African region.
• Telecommunications: in terms of costs and quality, East Africa is the best performer in Africa. Rwanda is an average performer in East Africa for telephone connection and costs, but the cost of internet services is relatively high.
• Labour and skills: East Africa does not compare well with other regions in terms of literacy rates, but Rwanda performs well in the region. Wages in East Africa are higher than in certain countries in Asia, Rwanda has the second highest remuneration per worker in East Africa after Kenya.
Source: Calabrese et al. (2017).
5
The transparency and accountability embodied by the leadership is reflected in Rwanda’s very low level of corruption (Table 2). In 2016, Rwanda ranked 50th on the Corruption Perceptions Index ranking compiled by Transparency International, and was the third least corrupt SSA country, on a par with Mauritius. The Enterprise Survey conducted in 2011 by the World Bank looks specifically at what firms experience and perceive in Rwanda, and reported that levels of corruptions for businesses were much lower not only than those of its SSA counterparts but also than the global average. 2.2.3 A trainable workforce Rwandan businesses have seen recruiting skilled staff as a challenge (GoR, 2011). Cognisant of this, GoR is intensifying efforts to ensure more workers enter the job market with the necessary skill set. The Workforce Development Authority (WDA) was set up in 2008 to promote skills development. The recently established Capacity Development and Employment Services Board aims to harmonise capacity-building programmes with the demands of the private sector. Other initiatives cover various aspects of skills development; for example, the Workplace Learning Policy promotes learning on the job. The recent experience of new investors in the garment sector has shown that Rwandan workers are disciplined and trainable (Manson, 2015b). In the case of C&H Garments, training programmes have been set up with the collaboration of GoR, which has tasked the WDA to arrange training and to prepare a training manual together with the employer (Asaba, 2016).
Box 2: Coordinating industrial policy in Rwanda The GoR’s commitment to the industrialisation agenda is reflected in its efforts to coordinate ministries and agencies to achieve these goals. Booth et al. (2017) analyse the coordination mechanisms currently in place. They find that by regional standards, Rwandan policy is well coordinated. Ministries and agencies are run under a well-functioning cabinet, coordinated by an Economic Cluster and several inter-agency coordinating bodies, including the Industrial Development and Export Council. However, the authors argue, these inter-agency bodies fall short of the likely requirements for success in implementing industrial policy, be it from lack of adequate engagement with the private sector, lack of in-depth sectoral knowledge or issues in dealing with investment coordination. International experience suggests that the most effective way to promote industrialisation is to endow a super-ministry or autonomous agency with the ability to set policies as well as enforce them. In Rwanda, the RDB has played a crucial role in facilitating investments. As a one-stop shop, the RDB has managed to effectively streamline investment registration. However, it has not been responsible for setting or coordinating the industrial policy agenda, and this has reduced its ability to influence the processes. In addition, RDB has shown its ability to work on cross-cutting topics, but may lack the sectoral experience that is necessary not only to address, but also to anticipate the problems investors might face. Strengthening RDB’s policy making role and sectoral capabilities may be two key ingredients to guarantee its future success in investment promotion. Source: Booth et al. (2017).

6
Table 2: Selected corruption indicators, 2011 (Rwanda) and various years (other) Economy Rwanda SSA All
countries
Bribery incidence (% of firms experiencing at least one bribe payment request)
6.9 22.7 17.8
Bribery depth (% of public transactions with gift or informal payment request)
4.1 17.4 13.9
% of firms expected to give gifts in meetings with tax officials 4.5 17.2 13.0
% of firms expected to give gifts to secure government contract 11.3 33.8 29.2
Value of gift expected to secure a government contract (% of contract value)
0.3 2.1 1.7
% of firms expected to give gifts to get an operating licence 0.0 16.1 14.4
% of firms expected to give gifts to get an import licence 2.9 16.8 14.6
% of firms expected to give gifts to get a construction permit 14.0 25.9 23.3
% of firms expected to give gifts to get an electrical connection 0.0 22.5 16.3
% of firms expected to give gifts to get a water connection 7.0 23.3 16.0
% of firms expected to give gifts to public officials ‘to get things done’
6.2 25.9 22.1
% of firms identifying corruption as a major constraint 15.4 41.3 33.0
% of firms identifying the courts system as a major constraint 10.3 18.7 14.8
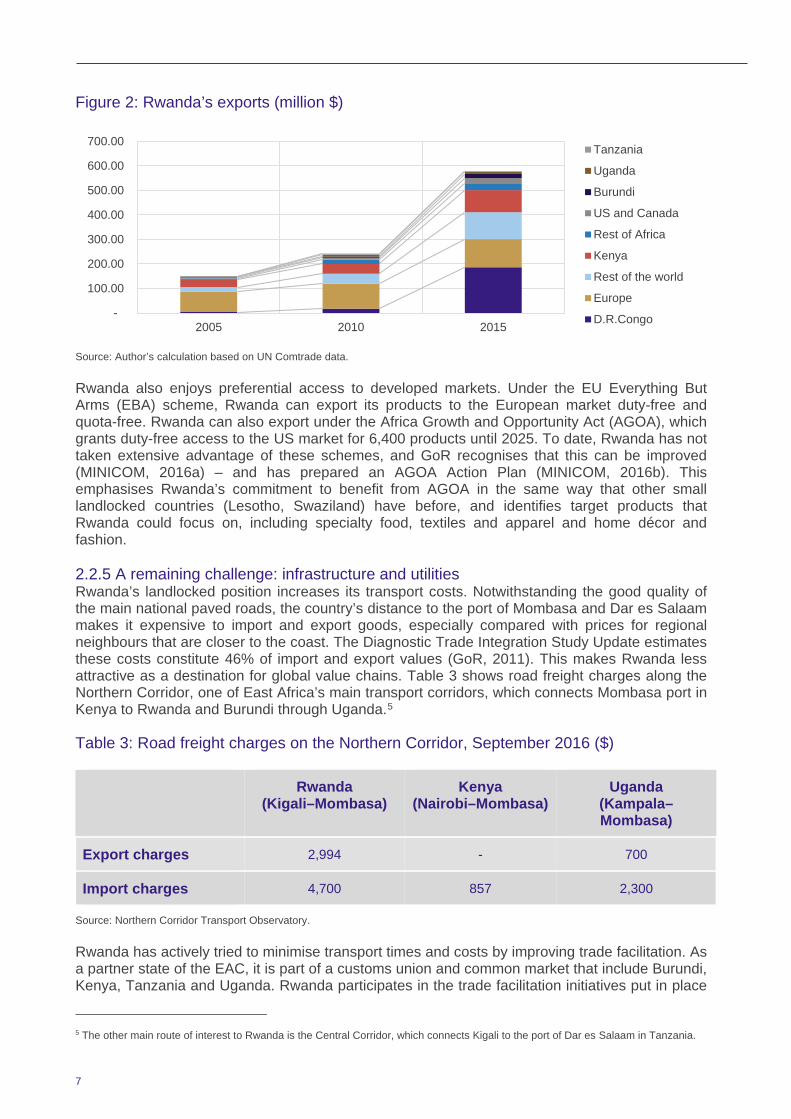
Source: World Bank Enterprise Survey. 2.2.4 Good market opportunities Investing in Rwanda provides good market opportunities, especially in relation to its regional neighbours. In recent years, Rwanda’s exports to DRC have boomed, especially those towards the eastern part of the country (Figure 2). In 2015, 32.2% of Rwanda’s exports went to DRC, which became the country’s first export destination, ahead of Europe and Kenya.4 The second National Export Strategy and the Economic Development and Poverty Reduction Strategy II (EDPRS2) highlights the importance of eastern DRC and Burundi as export destinations for Rwanda (MINICOM, 2015b; MINECOFIN, 2013).
4 UN Comtrade database, various years.
7
Figure 2: Rwanda’s exports (million $)
Source: Author’s calculation based on UN Comtrade data. Rwanda also enjoys preferential access to developed markets. Under the EU Everything But Arms (EBA) scheme, Rwanda can export its products to the European market duty-free and quota-free. Rwanda can also export under the Africa Growth and Opportunity Act (AGOA), which grants duty-free access to the US market for 6,400 products until 2025. To date, Rwanda has not taken extensive advantage of these schemes, and GoR recognises that this can be improved (MINICOM, 2016a) – and has prepared an AGOA Action Plan (MINICOM, 2016b). This emphasises Rwanda’s commitment to benefit from AGOA in the same way that other small landlocked countries (Lesotho, Swaziland) have before, and identifies target products that Rwanda could focus on, including specialty food, textiles and apparel and home décor and fashion. 2.2.5 A remaining challenge: infrastructure and utilities Rwanda’s landlocked position increases its transport costs. Notwithstanding the good quality of the main national paved roads, the country’s distance to the port of Mombasa and Dar es Salaam makes it expensive to import and export goods, especially compared with prices for regional neighbours that are closer to the coast. The Diagnostic Trade Integration Study Update estimates these costs constitute 46% of import and export values (GoR, 2011). This makes Rwanda less attractive as a destination for global value chains. Table 3 shows road freight charges along the Northern Corridor, one of East Africa’s main transport corridors, which connects Mombasa port in Kenya to Rwanda and Burundi through Uganda.5
Table 3: Road freight charges on the Northern Corridor, September 2016 ($) Rwanda
(Kigali–Mombasa) Kenya
(Nairobi–Mombasa) Uganda
(Kampala–Mombasa)
Export charges 2,994 - 700
Import charges 4,700 857 2,300
Source: Northern Corridor Transport Observatory. Rwanda has actively tried to minimise transport times and costs by improving trade facilitation. As a partner state of the EAC, it is part of a customs union and common market that include Burundi, Kenya, Tanzania and Uganda. Rwanda participates in the trade facilitation initiatives put in place
5 The other main route of interest to Rwanda is the Central Corridor, which connects Kigali to the port of Dar es Salaam in Tanzania.
-
100.00
200.00
300.00
400.00
500.00
600.00
700.00
2005 2010 2015
Tanzania
Uganda
Burundi
US and Canada
Rest of Africa
Kenya
Rest of the world
Europe
D.R.Congo
8
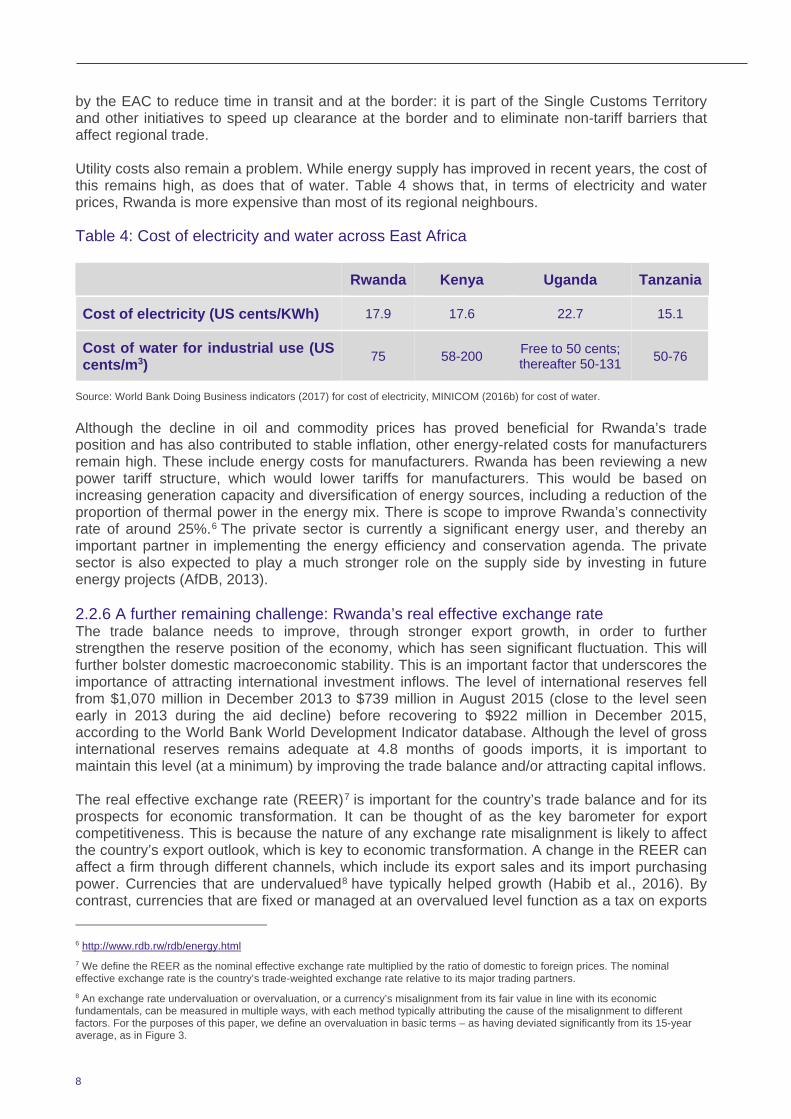
by the EAC to reduce time in transit and at the border: it is part of the Single Customs Territory and other initiatives to speed up clearance at the border and to eliminate non-tariff barriers that affect regional trade. Utility costs also remain a problem. While energy supply has improved in recent years, the cost of this remains high, as does that of water. Table 4 shows that, in terms of electricity and water prices, Rwanda is more expensive than most of its regional neighbours.
Table 4: Cost of electricity and water across East Africa Rwanda Kenya Uganda Tanzania
Cost of electricity (US cents/KWh) 17.9 17.6 22.7 15.1
Cost of water for industrial use (US cents/m3) 75 58-200 Free to 50 cents;
thereafter 50-131 50-76
Source: World Bank Doing Business indicators (2017) for cost of electricity, MINICOM (2016b) for cost of water. Although the decline in oil and commodity prices has proved beneficial for Rwanda’s trade position and has also contributed to stable inflation, other energy-related costs for manufacturers remain high. These include energy costs for manufacturers. Rwanda has been reviewing a new power tariff structure, which would lower tariffs for manufacturers. This would be based on increasing generation capacity and diversification of energy sources, including a reduction of the proportion of thermal power in the energy mix. There is scope to improve Rwanda’s connectivity rate of around 25%.6 The private sector is currently a significant energy user, and thereby an important partner in implementing the energy efficiency and conservation agenda. The private sector is also expected to play a much stronger role on the supply side by investing in future energy projects (AfDB, 2013). 2.2.6 A further remaining challenge: Rwanda’s real effective exchange rate The trade balance needs to improve, through stronger export growth, in order to further strengthen the reserve position of the economy, which has seen significant fluctuation. This will further bolster domestic macroeconomic stability. This is an important factor that underscores the importance of attracting international investment inflows. The level of international reserves fell from $1,070 million in December 2013 to $739 million in August 2015 (close to the level seen early in 2013 during the aid decline) before recovering to $922 million in December 2015, according to the World Bank World Development Indicator database. Although the level of gross international reserves remains adequate at 4.8 months of goods imports, it is important to maintain this level (at a minimum) by improving the trade balance and/or attracting capital inflows. The real effective exchange rate (REER)7 is important for the country’s trade balance and for its prospects for economic transformation. It can be thought of as the key barometer for export competitiveness. This is because the nature of any exchange rate misalignment is likely to affect the country’s export outlook, which is key to economic transformation. A change in the REER can affect a firm through different channels, which include its export sales and its import purchasing power. Currencies that are undervalued8 have typically helped growth (Habib et al., 2016). By contrast, currencies that are fixed or managed at an overvalued level function as a tax on exports 6 http://www.rdb.rw/rdb/energy.html 7 We define the REER as the nominal effective exchange rate multiplied by the ratio of domestic to foreign prices. The nominal effective exchange rate is the country’s trade-weighted exchange rate relative to its major trading partners. 8 An exchange rate undervaluation or overvaluation, or a currency’s misalignment from its fair value in line with its economic fundamentals, can be measured in multiple ways, with each method typically attributing the cause of the misalignment to different factors. For the purposes of this paper, we define an overvaluation in basic terms – as having deviated significantly from its 15-year average, as in Figure 3.

9
and a subsidy on imports. The volatility, or the size and uncertainty behind the changes in the exchange rate, is also important in that increased volatility tends to reduce investors’ incentives to invest in the economy. The trade-weighted Rwandan franc could be more competitive in order to help boost longer-term export competitiveness, particularly for goods that are more price-sensitive. This is notwithstanding its depreciation against the US dollar since 2008. Its REER has remained stable over the past five years at a relatively elevated level (Figure 3), which has helped keep import prices stable. However, the elevated level of the Rwandan franc REER suggests that the promotion of competitiveness and stability are important. Although overall consumer price inflation has declined, other costs for manufacturers remain high and are acting as a constraint on manufacturers’ competitiveness and productivity.
Figure 3. Rwanda’s real and nominal effective exchange rate indices (Index, 2000=100)
Source: Author’s calculations, World Bank World Development Indicators and IMF Direction of Trade Statistics. Competitiveness in the Rwandan franc is also important given plans for an EAC monetary union. West African economies’ experience with the CFA (Communauté Financière d'Afrique) monetary union is illustrative. Although the experience with the operation of the CFA franc system has been positive in establishing effective monetary institutions in member countries, there is a potential cost associated with the rigidities implied by a fixed exchange rate system (Gulde and Tsangarides, 2008); these have included a reduced ability to manage shocks such as falls in commodity prices for resource exporters. Additionally, although member countries have seen greater macroeconomic stability in the form of lower inflation, the CFA region has typically seen lower economic growth rates relative to non-CFA West African countries (Amin, 2000; Sy and Sow, 2016). This underscores the importance of Rwanda entering any monetary union at a carefully chosen, and competitively set, exchange rate.
2.3 Managing the constraints and exploiting the opportunities 2.3.1 Special economic zones and industrial parks in Rwanda as a key investment opportunity In order to promote development in manufacturing and to overcome its infrastructure challenges, Rwanda has established special economic zones (SEZs) and industrial parks, as highlighted in Boxes 3 and 4. SEZs in Rwanda are aimed at increasing domestic and foreign investment towards export growth and diversification. They alleviate Rwanda’s constraints in that they provide adequate infrastructure and trade facilitation for producers. In particular, they offer reliable power, water and sanitation; storage and warehousing facilities; ICT infrastructure; and good connections to main roads and airports (RDB, 2013). The zones are regulated under the

10
SEZ Law of 2011. The regulator is the Special Economic Zones Authority of Rwanda (SEZAR), based at the RDB. At a domestic level, future policy discussion should focus on developing further SEZs as a means of overcoming infrastructural and transport challenges. As with free trade zones, SEZs are a powerful tool to increase exports, employment and workers’ technical skills in manufacturing. GoR also has plans to develop further industrial parks to attract investments in areas outside Kigali, in Bugesera, Rusizi, Huye, Nyabihu, Rwamagana and Nyagatare. Musanze and Muhanga will be targeted as well (Tumwebaze, 2015).
2.3.2 Promoting investment more broadly The strengths and issues presented above shape the opportunities that Rwanda’s manufacturing sector can offer. Investors will need to make the most out of the opportunities while at the same time keeping the challenges in mind. In particular, a few points to highlight are as follows:
• Successful manufacturing investment will minimise transport and utilities costs. Given this, small high-value goods that are not energy-intensive are optimal. Some
Box 4: C&H Garments C&H Garments was set up in March 2014. Located in Kigali SEZ, the factory produces apparel ranging from police uniforms to fashion garments and even handmade pieces. Most of the production is destined for export to the US (under AGOA), China and Europe. The Chinese owners and management of C&H have previous experience in other African countries (Ethiopia, Kenya, Lesotho) and have chosen to set up shop in Rwanda because of the commitment of the country’s leadership and the quality of its workforce, but also because of the conditions offered in the SEZ. GoR is supporting C&H Garments in training its workers through the WDA. The training programme lasts six months, during which the trainees study the work of several departments, ranging from cutting and pattern-making to quality control. This will allow them to work in different departments in the factory. A training manual is also being prepared to ensure uniformity and consistency. The factory started with 200 workers and aims to employ 1,500, with further plans for expansion into a second factory in the SEZ. Source: Interview with factory managers, May 2016.
Box 3: Kigali Special Economic Zone Kigali SEZ originated as a merger of Kigali Free Trade Zone and Kigali Industrial Park. It is located in Gasabo (just outside the capital), and it has been designed for ‘mixed use’, which means it accommodates a variety of industries, including heavy and light manufacturing; chemicals, pharmacy and plastics; commercial wholesalers and warehousing; ICT; tourism; and service industries. The SEZ is serviced with roads, electricity, water, a fire-fighting system, a sewage system and fibre-optic cables. The SEZ was developed in two phases. The first phase, covering 98 ha of land, was operationalised in 2014. All plots developed under this phase have been allocated. Firms in the SEZ include those related to garments and apparel (C&H Garments), electric components and laptop assembly (Positivo BGH). Some firms in the SEZ were asked to relocate from the old industrial area in Gikondo (Behuria, 2017). The second phase, covering 178 ha of land, is nearly complete, and most of the plots are booked (ibid.). Land in the SEZ is acquired through the private developer, but the regulation is left to SEZAR. The price is $62 per cubic metre of land (minimum size is 1 ha). SEZAR also takes care of all licensing. Source: RDB (http://www.rdb.rw/departments/sez-and-exports/special-economic-zone.html).

11
producers mentioned that, for small goods, air transport is feasible, reducing costs linked to transport times.9
• Investments should focus on exports. Given the small size of the domestic market (less than 12 million people), investments should focus on exports. As discussed above, regional markets (in particular Burundi and eastern DRC) are increasingly important, and traditional markets offer opportunities through preferential trade agreements such as EBA and AGOA.
• Domestic investment opportunities are present, especially in areas where GoR aims to recapture the domestic market.
2.3.3 Fostering export competitiveness Continuing to maintain stable economic growth, steady inflation rates and healthy external accounts, will help maintain the external appetite to invest in Rwanda. Management of the REER is central to these aims. First, despite the decline in inflationary pressures, other intermediate costs of production remain high. These are acting as a constraint on manufacturers’ competitiveness and productivity and keeping the REER elevated. Tackling these costs could translate to an increase in competitiveness and particularly in the inflation-adjusted, or real, trade-weighted exchange rate. Second, although the Rwandan franc has become more competitive on a nominal basis as it has depreciated against the US dollar, the relatively high level suggests further gains in competitiveness are possible. Finally, the elevated REER has helped keep import prices stable; however, with Rwanda’s current account deficit at approximately 16% of GDP, enhancing competitiveness in the external sector is also of importance in supporting the country’s trade position.
2.4 Why manufacturing in Rwanda: conclusion Notwithstanding some of its economic obstacles, Rwanda has been singled out as a country with a good business environment compared with others in SSA. Its advantages include zero tolerance for corruption. Additionally, GoR has worked painstakingly to improve and streamline the country’s business registration process. And although some Rwandan businesses see recruiting skilled staff as challenging, the experience of new investors in the garment sector has shown that Rwandan workers are disciplined and trainable and that investing in Rwanda provides good market opportunities for investment, for both its regional neighbours and foreign investors. As discussed throughout this paper, trade facilitation and export promotion via SEZs are two ways in which key obstacles can be overcome to support Rwanda’s manufacturing sector. Fostering export competitiveness through a lower REER will also be important in supporting manufacturing.
9 Such as in the case of the handbags and the other products produced by Kate Spade in Masoro (Source: interviews with factory managers and Moller (2016)).

12
3. FINANCIAL CONSTRAINTS AND OPPORTUNITIES In recent years, Rwanda has been singled out as an economy that has a transparent and well-regulated business environment, with zero tolerance for corruption, which makes investment smoother there than in other parts of SSA. In addition to these benefits, Rwanda presents other less-known advantages. This section discusses some of them. Over the period 2000–15, foreign savings accounted for about 78% of investment finance.10 In the wake of the genocide, the international community provided about $400 million annually for the rest of the decade; this figure rose steadily to average $629 million in 2001–10; and then to $1.1 billion in 2011–14. What differentiates Rwanda from most other aid recipients is how well the country has used development assistance (English et al., 2016). Its low levels of corruption have meant that Rwanda has performed well in the World Bank Doing Business rankings and on the Transparency International Corruption Perceptions Index. It has demonstrated high capacity to implement a public investment programme and has thus successfully channelled most foreign investment into productive investment.
3.1 The domestic financial sector Stimulating the private sector, particularly with regard to the promotion of export competitiveness, is not achievable without broadening and deepening the financial sector. And here, part of Rwanda’s structural rigidity in lending rates owes to a lack of financial depth and weak financial intermediation; this is key given the productivity-enhancing effects of financial deepening (Beck et al., 2000). For instance, the current credit-to-GDP ratio in Rwanda is lower than in fast-growing developing countries like China, where credit growth was three to four times higher during comparable stages of its development (UNECA, 2015). Although Rwanda has made strides in terms of modernising its banking sector and its microfinance institutions, roughly 90% of its workforce is not served by a long-term saving scheme, which would provide a mechanism for longer-term investments (MINICOM, 2016c). Rwanda has an underdeveloped financial sector dominated by banking rather than capital markets: it is composed of 17 commercial banks that hold 66.5% of all financial sector assets. Private credit relative to GDP was a modest 28% in June 2016 compared with a regional average of 45.8% (Figure 4). Nevertheless, the banking sector, while still relatively small, has seen significant growth in the past decade, with credit nearly tripling since the early 2000s (Figure 4). This has included strong growth in access to finance, with 68% of adults in Rwanda having formal financial access (NISR, 2016). Institutions facilitating this include nearly 500 licensed microfinance institutions as well as a number of savings and credit cooperative organisations. These high levels of access have facilitated relatively high savings and deposit rates in the country (NBR, 2016).
10 According to the World Bank World Development Indicators.

13
Figure 4: Rwanda’s private credit to GDP (%)
Source: World Bank and NBR. Rwanda’s current indicators of financial stability are strong, with high levels of bank capitalisation and liquidity. And, although non-performing loans increased in 2016, they remained moderate. Foreign exchange exposure in banks is limited (NBR, 2016). Rwanda’s domestic capital markets are nascent, with low levels of capitalisation, issuance and turnover (CMA, 2016). On international capital markets, Rwanda issued a single Eurobond of $400 million in 2013. There has been no other financing from these markets outside of government (Tyson, 2015a).
3.2 Favourable trends and remaining challenges: Rwanda’s financial flows At 24% of GDP, Rwanda has seen higher than average investment rates compared with the average of other low- to middle-income countries. However, this has come predominantly from public financing and from official development assistance (World Bank, 2015). Private finance has, nevertheless, seen strong growth over the past decade. This has been a result partly of proactive policy to attract FDI led by the RDB, as well as the region’s good business environment. However, most of this private finance has gone to sectors other than manufacturing, including infrastructure, microfinance (households), construction and real estate, tourism and financial services. By contrast, only 12% of 2015 financing stock was in manufacturing (Figure 5). Nevertheless, financing for manufacturing has increased significantly in absolute terms, from under $40 million in 2006 to over $350 million by 2015. There has also been a relative shift in financing from bank lending to FDI with, by 2015, 61% of stock in FDI and 38% in bank lending.
0
5
10
15
20
25
30
Priv
ate
cred
it to
GD
P

14
Figure 5: Rwanda’s financing stock by sector ($ millions)
Source: Tyson (2017) (data sourced from NBR financial stability reports and investment reports, the World Bank database and The Financial Times). FDI has also been more stable than bank lending, seeing increases every year. This includes FDI from regional investors seeking to invest in manufacturing for exports within the EAC in products such as maize flour, beer, plastic, shoes and cement and other construction materials. There has also been one Chinese clothing manufacturer who has invested in the SEZ (English et al., 2016). By contrast, bank lending has been subject to some volatility, including a net contraction of lending in 2011. This reflects a reluctance of banks to lend to manufacturing because they see this as being of higher risk. This perception is driven by factors such as the need to lend over relatively long periods in order to finance the capital investments the manufacturing sector needs and the fact that repayment is reliant on the profitability of operations, which can be difficult to forecast and subject to uncertainty, rather than on concrete collateral. As a consequence, only 9.1% of lending has been to the manufacturing sector, with 74.1% going to real estate, hotels and short-term trading activities. Unlike manufacturing, these sectors offer advantages that lower the risk of lending. For example, real estate can be used as collateral and, for trading activities, loans have shorter terms and repayment is reliant on more predictable and shorter cash flow cycles (NBR, 2016). There has been a similar pattern in the microfinance sector, where, although lending is less concentrated than it is for commercial banks, with 20.6% of 2016 lending to agriculture, there is still a strong concentration in real estate, commerce and trade, which collectively account for 68.1% of 2016 microfinance institution lending (NBR, 2016). There were no capital markets flows into the manufacturing sector from either domestic or international capital markets between 2005 and 2015. This reflects the nascent state of the Rwanda’s domestic capital markets and the non-integration of its underdeveloped financial system with international markets (Figures 6 and 7).
-
500.0
1,000.0
1,500.0
2,000.0
2,500.0
3,000.0
3,500.0
2006 2007 2008 2009 2010 2011 2012 2013 2014 2015
Tourism
Manufacturing
Infrastructure
Household
Financial services
Construction & Real Estate

15
Figure 6: Rwanda’s financing stock for manufacturing ($ millions)
Source: Tyson (2017, forthcoming) (data sourced from NBR financial stability reports and investment reports, the World Bank database and The Financial Times).
Figure 7: Rwanda’s financing flows for manufacturing ($ millions)
Source: Tyson (2017) (data sourced from NBR financial stability reports and investment reports, the World Bank database and The Financial Times).
Such flows from equities and bonds potentially offer greater liquidity for recipient firms and encourage investment because of the presence of secondary trading markets. Longer-term, they may also encourage domestic savings by providing suitable investment instruments. Development of both domestic and international capital markets should be a long-term goal for Rwanda. However, in the near term, FDI and banking offer a more realistic opportunity to mobilise financing for the manufacturing sector.
3.3 Managing the constraints and exploiting the opportunities FDI offers the most attractive and potentially largest source of investment for manufacturing in Rwanda. It is stable and low cost and avoids the potential financial and macroeconomic stability concerns that reliance on portfolio flows might bring for the country’s relatively small financial sector. Policy is already broadly supportive of FDI inflows, with liberalised capital controls and a supportive investment environment and, as noted, this has already resulted in strong and steady FDI since 2011. This includes that from both private investors, including from China, and a
-
50.0
100.0
150.0
200.0
250.0
300.0
350.0
400.0
2006 2007 2008 2009 2010 2011 2012 2013 2014 2015
FDIBank lending - Domestic
(40.00)
(20.00)
-
20.00
40.00
60.00
80.00
100.00
2007 2008 2009 2010 2011 2012 2013 2014 2015
FDI
Bank lending - Domestic

16
number of development finance institutions (DFIs). For example, CDC Group and the International Finance Corporation (IFC) have made investments (equity and debt instruments) in food processing and breweries. Policy approaches have included establishing a SEZ and providing tax and export incentives. In addition, there is the possibility of mobilising investment for the sector through further development of domestic sources of capital. As discussed earlier, domestic sources of finance for manufacturing are currently constrained in Rwanda. This includes weak lending by banks and microfinance institutions and absent capital markets. However, domestic resource mobilisation in the form of household deposits has been reasonably successful for Rwanda’s level of per capita GDP: high levels of financial access have successfully mobilised deposits from households. Bank lending to Rwanda’s manufacturing sector remains weak. Currently, banks are not on-lending to manufacturing but instead have high levels of cash, or are lending to other sectors. Policy measures to address this could include prudential measures such as differential reserve or capital requirements across sectors, favouring manufacturing. The latter could also be integrated with macro prudential policy to disincentivise the currently high levels of lending to real estate, which, where excessive, can create financial fragility. Further deepening the insurance and pension markets could also enable the successful mobilisation of domestic deposits, and intermediation, into manufacturing investments. The sector is experiencing growth, with assets reaching 1.8% of GDP by 2016 (NBR, 2016). Much greater levels of assets have been mobilised by proactive policy elsewhere in the EAC, and this could be replicated in Rwanda. This includes encouraging foreign entry to allow greater scale and knowledge transfer, building distribution networks, including through mobile banking, and encouraging product innovation (Tyson, 2015b). Such policy approaches may also lead, in the longer term, to Rwanda developing domestic capital markets for manufacturing, as they will help establish a deeper investor base for such domestic products (Tyson, 2015b). Policy could also examine opportunities to mobilise international capital further. There is interest from international investors in the region, though FDI is currently concentrated in other countries such as Kenya and Nigeria, where FDI is more established (Tyson, 2017). However, the country’s relatively low levels of GDP and per capita income, reflected in a non-investment grade sovereign credit rating,11 as well as the small scale of the country, including its manufacturing base, makes it less attractive for international investors. If Rwanda is to gain a larger share of the ‘wallet’ then policy-makers need to develop deeper ‘soft’ relationships with investors to overcome these concerns. This includes through senior political engagement. Such relationships can be a significant factor in overcoming investors’ negative perceptions and risk concerns about investing in a country, as they seek partnerships with government to secure, for example, private property rights and commitments to provide public goods, such as in infrastructure and SEZs (McMillan et al., 2017; Tyson, 2017). Initiatives to proactively build such soft relationships between Rwandan senior politicians and civil service officials could be particularly effective because of the country’s strong ‘ease of business’ environment – including its reputation for zero tolerance in relation to corruption and for good governance – which gives credibility to GoR and thus provides ‘comfort’ to investors. Such initiatives could entail, for example, senior ministers holding meetings in global financial centres to discuss areas of mutual interest with manufacturing firms in global value chains, stock exchanges, international banks and private equity funds. This could include relationship-building with potential ‘lead firms’ that, elsewhere, have acted as coordinators of the chain development in the SSA region (ADB, 2012). 11 According to Fitch Ratings.

17
Policy instruments to reduce investors’ risk in financing the manufacturing sector could help with this problem. A range of such instruments could be considered. These include wholesale financing to service SMEs and small farmers, risk-sharing for venture capital projects and vanilla loans for larger companies. In addition, enterprise development could be supported through technical advice (Table 5). Such instruments could be operationalised through the RDB and partnership with DFIs. Indeed, the IFC has already partnered with KCB Bank Rwanda in relation to guarantees for lending for agricultural production and processing. Extending these types of programmes to manufacturing could crowd-in further financing.
Table 5: Policy instruments for manufacturing and agricultural processing
Instrument Typical structures Example market segment
Debt and equity financing
Debt and equity, including in local currency and for relatively long periods
Larger companies and value chains
‘Ring-fenced’ funds via financial intermediaries
Intermediaries are typically local banks or microfinance institutions serving small and microbusinesses
SMEs and small farmers
Venture capital funds Equity, quasi-equity and debt for new investments, including via fund-of-funds and risk-sharing with investors
Innovative businesses and greenfield sites
Raising and managing third-party funds
Including loan syndication and funds to provide diversification benefits to investors through risk-pooling
Funds in manufacturing; not used extensively to date
Advisory services and technical advice
Support for domestic financial institutions, private investors and firms; can be difficult to leverage because it is cost-intensive
Building a pipeline of ‘bankable firms’
Source: Tyson (2017). Finally, but of importance, is a role for ‘impact accelerator funds’, which provide venture capital (including ‘non-returnable capital’) to manufacturing and agricultural processing. Rwanda has already seen a number of such investments in agricultural processing, including from the UK’s CDC. These are of importance because transformational change often emerges from such economic experimentation (McMillan et al., 2017). Impact accelerator funds promise to deliver such transformational change through providing a forum for such ‘learning by doing’ and subsequent demonstration effects of new business models in Rwanda, and should be extended (Tyson, 2017). In relation to international capital markets and inward portfolio flows, it is less likely that this will develop in the short term compared with FDI. This is especially likely given the overall reduction in international capital flows to the region since 2015. Longer term, both overall investor risk appetite and Rwanda’s attractiveness may increase and allow this to become a source of financing for the sector. However, this is unlikely in the foreseeable future. The Investment Promotion Law offers incentives to foreign investors. These incentives may be particularly attractive for foreign manufacturers that are facing rising domestic labour costs, or slowing domestic demand, such as in China, and could be looking to relocate some of their production facilities (Box 5). The law identifies industrial manufacturing as one of its priority sectors, featuring prominently as one of the investment opportunities the RDB identifies on its website. Seven sub-sectors are mentioned, including construction materials, textiles and

18
garments, pharmaceutical products, packaging materials, soaps and detergents, motorcycle assembly and leather processing.12
3.4 Rwanda private investment flows: conclusion Rwanda has a relatively underdeveloped financial sector dominated by banking, which, though still relatively small, has seen significant growth in the past decade. Rwanda’s domestic capital markets still have low levels of capitalisation, issuance and turnover. In terms of investment inflows, private finance has seen strong growth over the past decade. This has been partly a result of proactive policy to attract FDI, led by the RDB. And yet most of this financing has gone to sectors other than manufacturing, though financing for manufacturing has increased significantly in absolute terms. Bank lending to the manufacturing sector has not seen as steady flows and has been more volatile compared with FDI – a reflection of risk aversion to lend on a longer-term basis. A large part of managing these constraints could include domestic resource mobilisation, developing domestic capital markets and cultivating ‘soft’ relationships with international investors.
12 http://www.rdb.rw/rdb/manufacturing.html
Box 5: Manufacturing opportunities from China? Chinese manufacturers of labour-intensive products face pressure emerging from slowing domestic growth, labour force shortages and rising labour costs. These pressures may be a good opportunity for low income countries, as manufacturers could decide to reduce their production costs by investing in countries with lower labour costs. However, other cost-saving strategies could include relocating investment within China or upgrading technology in order to reduce the need for labour. Hou et al. (2017) analyses employment and wages in light manufacturing in China and concludes that while manufacturing employment has declined in the coastal regions of China, the causes are still unclear. The reasons could be due to relocation or a decline in demand due to economic slowdown. Source: Hou et al. (2017)

19
4. POLICY SUGGESTIONS In light of some of the constraints and opportunities examined in this paper, this section briefly summarises policy areas for discussion, drawing on Sections 2.3 and 3.3, to highlight options for mitigating financial and economic constraints and for optimising opportunities in Rwanda’s manufacturing sector. The first area of policy reform that this section touches on relates to economic constraints and opportunities, and the second pertains to financial sector development. 4.1 Managing Rwanda’s economic constraints
• SEZs should be a focus. At a domestic level, future policy discussion should focus on developing further SEZs as a means of overcoming infrastructural and transport challenges and boosting skills and employment in manufacturing.
• Minimise transport and utilities costs. Small high-value goods that are not energy-
intensive are optimal as targets for investment. With small goods, air transport becomes feasible, reducing costs linked to transport times.
• Investments should focus on the export sector. Given the small size of the domestic
market, policy-makers should focus on exports and on boosting trade with regional markets (Burundi and eastern DRC) and with international markets through preferential trade agreements.
• Realign the REER to boost competitiveness. Intermediate costs to production remain
high. Tackling these would lead to price competitiveness and declines in the inflation-adjusted, or real, trade-weighted exchange rate.
4.2 Managing Rwanda’s financial constraints
• Prudential measures to favour manufacturing, such as differential reserve or capital requirements across sectors, could be put in place and integrated with macro prudential policy to disincentivise currently high levels of lending to real estate.
• Deepening insurance and pension markets could also encourage successful
mobilisation of domestic deposits, and intermediation, into manufacturing investments. Additionally, mobile banking would encourage foreign entry, allowing for greater scale and knowledge transfer.
• Further mobilising international capital through strengthening ‘soft’ relationships can
be a significant factor in overcoming investors’ risk concerns about investing in Rwanda. Such initiatives could include senior ministers holding meetings in global financial centres to discuss areas of mutual interest with manufacturing firms.
• Reducing investors’ risk through wholesale financing to SMEs and small farmers, risk-
sharing for venture capital projects and vanilla loans for larger companies can be extended to manufacturing. Enterprise development can also be supported through technical advice.
• Greater usage of ‘impact accelerator funds’ will provide venture capital (including ‘non-
returnable capital’) to manufacturing and agricultural processing. These funds promise to deliver such transformational change through providing a forum for such ‘learning by doing’.

20
5. CONCLUSION After exploring the financing landscape of Rwanda’s manufacturing sector, it is evident that government policies and initiatives have enhanced the country’s position as an attractive investment destination. The growth in FDI in the country, despite a relatively underdeveloped financial market, is a testament to this success. However, notwithstanding Rwanda’s above-average investment rates, it is problematic that most flows have been into the non-manufacturing sector. This owes in part to the constraints highlighted in this paper, pertaining to the country’s underdeveloped financial market. The real non-financial constraints in Rwanda’s manufacturing sector, such as utility and transport costs, as well as its landlocked geography, have been even more significant in hampering the sector’s development. Although Rwanda’s macroeconomic and institutional backdrop has improved, obstacles remain. These include a largely undiversified manufacturing sector, rigidity in lending rates and an elevated REER. Overall, macroeconomic stability in the economy has contributed to the fact that Rwanda has been singled out as a country with a good business environment, compared with others in SSA. GoR’s institutional reforms, its zero tolerance for corruption and initiatives to streamline inward investment have been instrumental. And, although some Rwandan businesses see recruiting skilled staff as challenging, the experience of new investors in the garment sector has shown that Rwandan workers are disciplined and trainable. In terms of promoting manufacturing exports, Rwanda also enjoys preferential access to developed markets that could aid in its effort. Investing in Rwanda provides good market opportunities for investment, for both its regional neighbours and foreign investors. In assessing the financing landscape in Rwanda, it is evident that one of the key obstacles relates to domestic capital market development. Rwanda has a relatively underdeveloped financial sector that has been dominated by banking, although it has still seen significant growth in the past decade. Rwanda’s domestic capital markets still have low levels of capitalisation, issuance and turnover. Much of the country’s inward investment has been concentrated in FDI. This in turn has been the result of proactive policy to attract FDI, led by the RDB. And yet most of this investment has gone to sectors other than manufacturing, though financing for manufacturing has increased significantly in absolute terms. Bank lending to the manufacturing sector has not seen as steady flows and has been more volatile than FDI – a reflection of risk aversion to lend on a longer-term basis. We have assessed constraints and opportunities, in relation both to finance and to investing in Rwanda’s manufacturing sector. Encouragingly, Rwanda’s liberalised investment policy is already broadly supportive of FDI inflows and a generally supportive investment environment. However, policy could be extended further through senior politicians developing deeper ‘soft’ relationships with investors. Additionally, mobilising investment for the sector through further development of domestic sources of capital would be preferable, given the weakness in lending by banks and microfinance institutions. Equally for the manufacturing sector, certain constraints remain: these include Rwanda’s landlocked position and its high transport and utility costs. Given this, investment in small, non-energy-intensive, high-value goods would be optimal, as would a focus on promoting exports. This paper concludes by presenting three potential areas for policy discussion. The first policy area is linked to financial deepening – in particular, options for further facilitating finance could include mobilising investment through development of domestic sources of capital, with increased credit provision to manufacturing firms. Additional measures could include differential reserve or capital requirements that favour manufacturing. The second area for policy discussion pertains to Rwanda’s macroeconomic stability and management of the REER, which is central to its competitiveness, to foster healthy external accounts and inward investment. The third area of policy pertains to trade facilitation and export promotion through regional trade agreements and places particular importance on the catalytic role for Rwanda’s manufacturing sector of developing further SEZs.

21
REFERENCES AfDB (Africa Development Bank) (2013) ‘Rwanda Energy Sector Review and Action Plan’. Tunis: AFDB. Amin, A. A. (2000) ‘Long-term growth in the CFA Franc Zone countries’. Research in Progress 25. Helsinki: UN WIDER. Ansu, Y., Booth, D., Kelsall, T. and te Velde, D.W. (2016) Public and private sector collaboration for economic transformation. Paper presented at the African Transformation Forum 2016, Kigali (14-15 March). Supporting Economic Transformation paper. London: Overseas Development Institute (ODI). Asaba, S. (2016) ‘600 to secure training, jobs from C&H garments’. The New Times, 16 February. ADB (Asian Development Bank) (2012) Support for agricultural value chain development. Manila: ADB. Beck, T., Levine, R. and Loayza, N. (2000) ‘Finance and the sources of growth’. Journal of Financial Economics 58: 261–300. Behuria, P. (2017) The political economy of import substitution in the 21st century: The challenge of recapturing the domestic market in Rwanda. International Development Working Paper 17-182. London: LSE. Booth, D., Calabrese, L. and Golooba-Mutebi, F. (2017) Coordinating public and private action for export manufacturing: international experience and issues for Rwanda. Supporting Economic Transformation paper. London: ODI. Calabrese L., Gelb, S. and Hou, J. (2017) What drives Chinese outward manufacturing investment? A review of enabling factors in Africa and Asia. Supporting Economic Transformation paper. London: ODI. CMA (Capital Markets Authority) (2016) ‘Annual report 2015-2016’. Kigali: CMA. English, P., McSharry, P. and Ggombe, K. (2016) Raising exports and attracting FDI in Rwanda. Policy Brief 38402. London: International Growth Centre. Ggombe, K. and Newfarmer, R. (2017) From devastation to services-first transformation. Working Paper 2017/84. Helsinki: UNU WIDER. GoR (Government of Rwanda) (2011) Diagnostic trade integration study update. Kigali: GoR. Gulde, A.M. and Tsangarides, C.G. (2008) The CFA franc zone: Common currency, uncommon challenges. Washington, DC: IMF. Habib, M. M., Mileva, E. and Stracca, L. (2016) The real exchange rate and economic growth: Revisiting the case using external instruments. Working Paper 1921. Frankfurt: ECB. Hou, J., Gelb, S. and Calabrese, L. (2017) The shift of manufacturing employment in China. Supporting Economic Transformation paper. London: ODI. Manson, K. (2015a) ‘Businesses relocate to Rwanda’s new Special Economic Zone’. The Financial Times, 24 April. Manson, K. (2015b) ‘Chinese manufacturers look to Rwanda’. The Financial Times, 6 May.

22
McMillan, M., Page, J., Booth, D. and te Velde, D. (2017) Supporting economic transformation: An approach paper. Supporting Economic Transformation paper. London: ODI. MINEACOM (Ministry of Trade, Industry and EAC Affairs) (2016) ‘Budget framework paper 2016/2017-2018/2019’. Kigali: MINEACOM. MINECOFIN (Ministry of Finance and Economic Planning) (2013) Economic Development and Poverty Reduction Strategy 2013–2018. Kigali: MINECOFIN. MINICOM (Ministry of Trade and Industry) (2015a) Domestic Market Recapturing Strategy. Kigali: GoR. MINICOM (Ministry of Trade and Industry) (2015b) National Export Strategy II. Kigali: GoR. MINICOM (2016a). National Export Strategy II. Kigali: GoR. MINICOM (2016b). Rwanda AGOA Action Plan. Kigali: GoR. MINICOM (2016c) ‘Unleashing the private sector in Rwanda: Rwanda Private Sector Development Strategy’. Kigali: GoR. Moller, J. (2016) ‘From Kigali to New York on purpose’. The Accelerator Magazine (http://accelerator-magazine.com/from-kigali-to-new-york-on-purpose/) NBR (National Bank of Rwanda) (2016) ‘Quarterly economic and financial report: Developments and prospects, second quarter 2016’. Kigali: NBR. NISR (National Institute of Statistics of Rwanda) (2016) ‘FinScope Survey 2016’. Kigali: NISR. (http://www.statistics.gov.rw/publication/finscope-rwanda-2016) Ntirenganya, E. (2016) ‘Government, exporters pledge to revitalise exports’. The New Times, 25 November. RDB (Rwanda Development Board) (2013). Rwanda special economic zones: Accelerating Rwanda’s economic growth and development. Kigali: GoR. Sy, A. and Sow, M. (2016) ‘Four questions on the state of the West African Economic Monetary Union and implications for other regional economic communities’. Brookings Africa in Focus, 15 March. Tumwebaze, P. (2015) ‘Industrial parks get managers’. The New Times, 31 March. Tyson, J. (2015a) ‘Sub-Saharan Africa international sovereign bonds’. London: ODI. Tyson, J. (2015b) ‘Life insurance markets in Sub-Saharan Africa’. London: ODI. Tyson, J. (2017) Mobilising private finance for manufacturing in sub-Saharan Africa. London: ODI. UNECA (UN Economic Commission for Africa) (2015) ‘Country profile: Rwanda’. Addis Ababa: UNECA. World Bank (2015) ‘Financing development: The role of a deeper and more diversified financial sector’. Rwanda Economic Update, June. Washington, DC: World Bank. World Bank (2016) ‘Rwanda at work’. Rwanda Economic Update, February. Washington, DC: World Bank.