rwandaprivimpact v1.0r mcherif nov03
TRANSCRIPT
7/29/2019 RwandaPrivImpact v1.0R MCherif Nov03
http://slidepdf.com/reader/full/rwandaprivimpact-v10r-mcherif-nov03 1/22
Economic Impact of the Privatisation Programme inRwanda: 1996-2003
By Moëz Cherif 1
The privatisation programme in Rwanda is an integral part of the government’s policyof economic liberalisation. It is implemented through a comprehensive set of reformsand policies undertaken by the Government of National Unity after the tragic eventsof 1994, under the guidance of the World Bank and the IMF. The pre-war Rwandanformal economy was dominated by the public sector. The war and genocide resultedin the destruction of the infrastructure of numerous state owned companies, but evenmore damaging was the loss of human capital through the death, flight or imprisonment of qualified employees and managers of these companies.
This paper assesses the impact of the privatisation programme in Rwanda between1996 and 2003, in the context of post-conflict reconstruction of the Rwandaneconomy. We first outline the historical and legal background of the programme, itsobjectives, methods and degree of realisation. Then we attempt to quantify the impactof the programme on public finances. The next section assesses the impact of the
programme on the performance of privatised companies; case studies are used tocomplement a partial quantitative analysis. Finally, we draw conclusions andrecommendations for public policy from our analysis.
Background to the Privatisation Programme
Legal backgroundThe privatisation programme was established by a law dated 11 March 1996 onPrivatisation and Public Investment. The Presidential Decree dated 3 May 1996 put in
place the institutions to implement this programme. In October 1997, thePrivatisation Secretariat actually started its work.
In addition to the privatisation programme, the government decreed other laws withthe aim of reviving and strengthening economic activities in Rwanda, including theTax Law of 1996, the Investment Code of 1998, and the measures to liberalise foreignexchange put in place in 1996 and 1997.
Why privatise?
Here are some of the main objectives of the privatisation policy in Rwanda:
1. To reduce the shares held by government in public companies, thus alleviatingthe financial burden on its resources (through the elimination of subsidies andstate investments) and reducing its administrative obligations in theseenterprises;
1
The author is an ODI Fellow at the Privatisation Secretariat, Rwanda. Views expressed in this paper are those of the author. They do not represent the official position of the Privatisation Secretariat or theOverseas Development Institute (ODI).
1

7/29/2019 RwandaPrivImpact v1.0R MCherif Nov03
http://slidepdf.com/reader/full/rwandaprivimpact-v10r-mcherif-nov03 2/22
2. To generate revenues for the government through the sale or lease of stateowned enterprises (SOEs);
3. To ensure better management and financial discipline in privatised companies;
4. To restructure and rehabilitate public companies, particularly those damaged by the war of 1994;
5. To attract foreign investment in Rwanda and the accompanying transfer of technology and know how; and
6. To encourage Rwandan citizens to invest in the private sector and to stimulatetheir entrepreneurial spirit.
How are companies privatised?
In almost all cases, the objective of the government is to withdraw completely from
the management and ownership of state-owned enterprises (SOEs). Most companiesare sold to a private owner, but some are also leased, particularly when the activity of the company involves the direct exploitation of natural resources, e.g. KigembeFishery, Rubirizi Grazing Fields. Regardless of the size of the company,
privatisations are usually realised through a public call for tender, followed by thesubmission of technical and financial bids by interested buyers. Only those bidderswho meet minimum technical requirements are retained and the highest bidder amongthem usually wins. One can however distinguish between several main types of
privatisation:
1. Small and medium SOEs (mainly in the agri-business sector or small hotels):the call for tender is usually advertised in the national media only and thecompany is sold to a single entrepreneur, company, cooperative or association;
2. Mixed ownership companies (only partly owned by the State): shares owned by the State are sold to other shareholders in priority if they have pre-emptionrights or to other private investors, e.g. BCK (food retailing) and Tabarwanda(cigarette manufacturing);
3. Larger companies: international consultants are hired to advise thegovernment on a privatisation strategy and to evaluate the company’s market
value. Then the call for tender is published in both national and internationalmedia, and a detailed contract is negotiated with the successful bidder, e.g.Rwandatel, tea production units;
4. Companies that are in difficulties but not bankrupt can be restructured before being privatised and the government can take over responsibility for some of their long term debts, e.g. BCR, a commercial bank, where the Government isinjecting fresh capital before privatising it;
5. Bankrupt companies are liquidated. A liquidator is appointed who is in chargeof selling assets and repaying debts that can be repaid. Any money left after
all debts are repaid is transferred to the shareholders (including the State)
2

7/29/2019 RwandaPrivImpact v1.0R MCherif Nov03
http://slidepdf.com/reader/full/rwandaprivimpact-v10r-mcherif-nov03 3/22
before the company ceases to exist. E.g. Air Rwanda, Petrorwanda (oil product distribution);
6. Electrogaz, the water and electricity utility, is a special case. The governmenthas signed a five year management contract with a private company in
September 2003. After those five years, the government will decide whether to keep the company under state ownership or to privatise its ownership.
How advanced is the privatisation programme?
Out of a total of 74 companies to be privatised, 30 have already been transferred tothe private sector, 3 others have reverted temporarily to State control after the buyersfailed to comply with their obligations, 6 are being liquidated, 10 are at an advancedstage in the process of privatisation and 25 are yet to be privatised.
The first company to be privatised in 1997 was Kabuye Sugar Works, the only sugar manufacturer in the country, which was sold to the Madhvani Group. In 1998, eight
companies were privatised: three in the agri-business sector, two hotels, threeindustrial companies and Petrorwanda’s petrol stations were sold to Shell. In 1999,only five companies were privatised out of which there were two coffee processingfactories. In 2000 also five companies were privatised, the largest of which wasSopyrwa, a pyrethrum processing and exporting company. The pace of privatisation
picked up again in 2001 with the sale of seven more companies, plus thegovernment’s 31% share in Tabarwanda, which was sold for $1.5Mn. Another fivecompanies were sold in 2002.
No company has been sold in 2003, but some of the largest companies are in the
process of being privatised. The management contract with a private company for Electrogaz was signed in September 2003. Two tea estates and a bank (BCR) are being sold. In addition, Rwandatel, the national fixed telephony company, is in the process of being brought to market, with 80% of the shares to be sold to a strategicinvestor.
Impact on public finance
Before privatisation, the government invests in and subsidises SOEs. In exchange, itreceives dividends and fiscal revenues. After privatisation, the government receives aone off payment if the company is sold (or an annual income if it is leased).
Investment from the government and dividends cease, but fiscal revenues remain. Inorder to assess the impact of privatisation on public finance, we must analyse theimpact of that policy on these various elements shown in Figure 1. It is, however,difficult, to isolate the impact of privatisation from that of other government policiesand general macroeconomic conditions.
3

7/29/2019 RwandaPrivImpact v1.0R MCherif Nov03
http://slidepdf.com/reader/full/rwandaprivimpact-v10r-mcherif-nov03 4/22
Figure 1 – Fiscal impact of privatisation
-
Privatised companyState-owned enterprise (SOE)
Government
Other things being equal, we expect privatisation to increase transfers from the productive sector to the government. There is first the direct impact of privatisation proceeds and the reduction in transfers from the government (there is also an oppositeimpact as dividends from SOEs are expected to fall). But, because the private sector is usually more efficient than the public sector, we also expect tax revenues to riseafter privatisation as sales and profits increase.
Table 1 – Financial transfers between Government and productive sector (Bn Rwf )2
1998 1999 2000 2001 2002
Profit taxes on corporations 20.10 12.40 15.20 17.30 18.20Turnover/VAT taxes 18.10 20.30 20.10 28.00 29.70
Dividends from SOE 0.86 0.86 0.86 1.69 1.60
Net revenue from privatisation 1.62 0.24 0.34 1.11 0.27
Total transfers from productive sector 40.67 33.79 36.50 48.10 49.77
Gvt trasfers to productive sector 36.11 32.57 30.13 43.32 43.39
Net transfers from productive sector 4.56 1.22 6.37 4.78 6.37
Source: Ministry of Finance and Economic Planning, Rwanda
In practise, the direct impact of privatisation has been rather small and unexpected.
Privatisation proceeds over the last five years have reached a total of some 3.57 BnFrw (approx. $7 Mn), less than 4% of total transfers from the productive sector to thegovernment in any one year. Dividends from SOEs have also been small, but theyhave approximately doubled between 2000 and 2002, despite privatisation. Theincrease in dividends can be attributed to economic growth and improved
performance from SOEs, which more than compensated for the fall in dividends from privatised companies.
2
Dividends for 1998 and 1999 were not available, so it was assumed that they were atthe same level as in 2000.
4

7/29/2019 RwandaPrivImpact v1.0R MCherif Nov03
http://slidepdf.com/reader/full/rwandaprivimpact-v10r-mcherif-nov03 5/22
It is therefore taxes on companies, both public and private, that had the largest impacton transfers from the productive sector. Profit taxes on corporations dropped slightly
between 1998 and 2002, from 20Bn Frw to 18Bn Frw, but that was more thancompensated for by the increase turnover and value-added taxes (VAT), which rose
by 11Bn Frw between 1998 and 2002. This is mainly due to the introduction of VAT
in October 2000, which replaced the less systematic turnover tax. The overallincrease in tax revenue and therefore total transfers to the government was quiteindependent from the privatisation programme, given the relative small scale of thelatter.
Figure 2 – Financial transfers between the government and the productive sector
0.00
10.00
20.00
30.00
40.00
50.00
60.00
1998 1999 2000 2001 2002
B n F r w
Total transfers from productive sector Gvt trasfers to productive sector Net transfers from productive sector
Source: Ministry of Finance and Economic Planning, Rwanda
Transfers to the productive sector, or economic services as defined by the WorldBank, comprise support for economic activities, such as agriculture, industry,commerce and infrastructure3. Surprisingly, these have also risen in tandem with
privatisation, from 36Bn Frw in 1998 to 43Bn Frw in 2002. This is not so surprising,however, when one considers the modest size of privatisation so far and the fact that
Rwanda, after the war of 1994, had a low level of government expenditure on productive activities. So, regardless of the privatisation programme, there was a needto increase expenditure on these services, particularly in the field of infrastructure;and since the private sector is still under-developed, there is a need for thegovernment to shoulder part of those expenses.
Thus, the overall impact of the privatisation programme on public finance has beenquite small so far. It is dwarfed by other policies such as taxation and rehabilitationof the country’s productive sector. This is quite normal, given that none of the major state-owned utilities, Electrogaz and Rwandatel, had been privatised by 2002.
Nevertheless as shown in Table 1 and in Figure 2, there has been a steady net flow of
financial resources from the productive sector to the government between 1998 and3 The other types of government expenditure being military/security, social and administrative services.
5

7/29/2019 RwandaPrivImpact v1.0R MCherif Nov03
http://slidepdf.com/reader/full/rwandaprivimpact-v10r-mcherif-nov03 6/22
2002, as transfers from the productive sector to the government exceeded transfers inthe other direction, which is consistent with the overall policy of liberalising and
privatising the economy.
Revenues and costs of the privatisation programme
Table 2 – Revenue and expenditure of the privatisation programme
Expenditure
(Mn Frw)
%
Experts and consultants 178 4%Restructuring and payment of company debts 1753 44%State investment in companies 739 18%Advance to the State 1114 28%Other privatisation activities 230 6%
Total 4014 100%
Source: Privatisation Secretariat, Rwanda
Table 1 shows the break-down of expenditure of the revenue from privatisation.Considering that the costs of consultants, restructuring and payment of debts andother privatisation activities, such as advertising, are necessary for the privatisationoperations and enhance the value of the companies to be sold, we have a totaloperational cost of 2,161 Mn Frw. Other expenditures, State investments andadvances to the State, can be considered as transfers of funds to the Treasury. Totalrevenue from privatisation between 1997 and 2002 is 4,021Mn Frw. Subtracting total
operational cost from total revenue, we have net revenue of 1,860 Mn Rwf, which isequivalent to about $3.7Mn (46% of total revenue).
Out of total earmarked revenue from privatisation of 4021Mn Frw, as of September 2003, there were 694 Mn Frw left to be paid by the new owners of privatisedcompanies, which represents a recovery rate of 85%.
Impact on the performance of companies
In order to assess the impact of privatisation on the performance of companies, ideallyone would have to develop performance indices showing the performance of these
companies before and after privatisation, as in Boubakri and Cosset (1998). Due tothe difficulty of collecting data on the performance of Rwandan companies before
privatisation4, a more pragmatic approach had to be adopted. We rely on case studieswhere we explore the impact of privatisation on a number of companies from varioussectors. Nevertheless, it is still illuminating to start by looking at performance indicesafter privatisation.
Out of 30 privatised companies so far, 20 are in operation (representing a success rateof 66.7%), 7 are not operational and 3 have been liquidated as they were bankrupt
before privatisation. This compares favourably with the situation of those 30companies before privatisation, where 15 only were in operation.
4 This problem is related to the human and physical destruction of the war in 1994, particularly of company records and archives.
6

7/29/2019 RwandaPrivImpact v1.0R MCherif Nov03
http://slidepdf.com/reader/full/rwandaprivimpact-v10r-mcherif-nov03 7/22
The current failures are concentrated in the small agro-industry (4 companies) and thehotel sector (2 companies).
We now look at a sample of 13 companies for which we have collected performance
data. This sample is biased in that it contains mostly companies in operation, sincedata was generally not available for companies that are not operational. In order notto reveal any commercially sensitive information, the names of companies have beenreplaced by code names taking the form of Ci, which are used consistently for theremainder of this paper.
Performance indices
Table 3 – Company performance indices for 20025
Company
code name
Status before
privatisation
Year
of
sale
Status now % of
purchase
price paid
Sales per
employee
(Mn Rwf)
Profitability6
(%)
C1 Leased, slowmotion
2000 In operation 100 85.2 -17
C2 Stopped 1998 In operation 100 1.8 44
C3 Rented, slowmotion
1998 In operation 50 0.3 53
C4 In operation 1998 In operation 100 12.0 0
C5 Rented, inoperation
1998 In operation 23 n/a n/a
C6 Stopped 2001 Refurbishment 100 n/a n/a
C7 Destroyed 2000 In operation 100 1.9 -39
C8 In operation 1997 In operation(temporary
refurbishment)
100 4.1 -21
C9 In operation 2002 In operation 50 n/a n/a
C10 In operation 1998 In operation 100 8.1 -26
C11 Stopped 1999 In operation 100 10.4 5
C12 In operation 2000 In operation 50 4.7 -3
C13 In operation 2001 In operation 100 37.3 0
Source: Privatisation Secretariat, Rwanda
The table above shows that for the 13 sample companies, 9 of the new owners havefully paid, three have paid 50% and one company has only paid 23% of the purchase
price. Only two of the companies, C3 and C5 run the risk of being confiscated fromthe current owners, due to their difficulties in repaying the full purchase price.
Using profitability as a measure of success of the privatised companies, the picturethat emerges is rather bleak. Out of the 13 companies, only 3 have positive profitsand all three are small companies with turnovers of less than 150 Mn Frw each($300,000). Two companies are breaking even in accounting terms. Two companieshave not provided profit accounts. (Lack of accounts in small companies is a serious
problem that has repercussions on tax collection and the general monitoring of their performance.) Five companies are showing profit losses, which is rather worryingsince these include the four largest companies in the sample by annual sales (exceptfor C13). In the case of C12, it made a small loss in 2002, after a very good profit
5 Or 2001 if 2002 is not available.6 Net profit as a percentage of sales.
7
7/29/2019 RwandaPrivImpact v1.0R MCherif Nov03
http://slidepdf.com/reader/full/rwandaprivimpact-v10r-mcherif-nov03 8/22
rate of 33% in 2001. For some analysis of the reasons for these losses, see the casestudies below.
We also calculated annual sales per employee (turnover divided by the number of permanent employees) as a measure of the commercial efficiency of the companies in
the sample. Out of 13 companies, four companies had sales per employee of morethan 10Mn Frw ($20,000), 6 were below that threshold and three did not supply salesfigures. Strangely, there does not appear to be any positive correlation between sales
per employee and profitability. On the contrary, some of the most commerciallyefficient companies had negative or nil profitability. This could indicate that profitfigures are not very reliable, in the absence of generally applied accounting standardsin Rwanda. It could be that some of the more successful companies commercially arealso able to show under-estimated profit figures in order to minimise their tax burden.
Employment
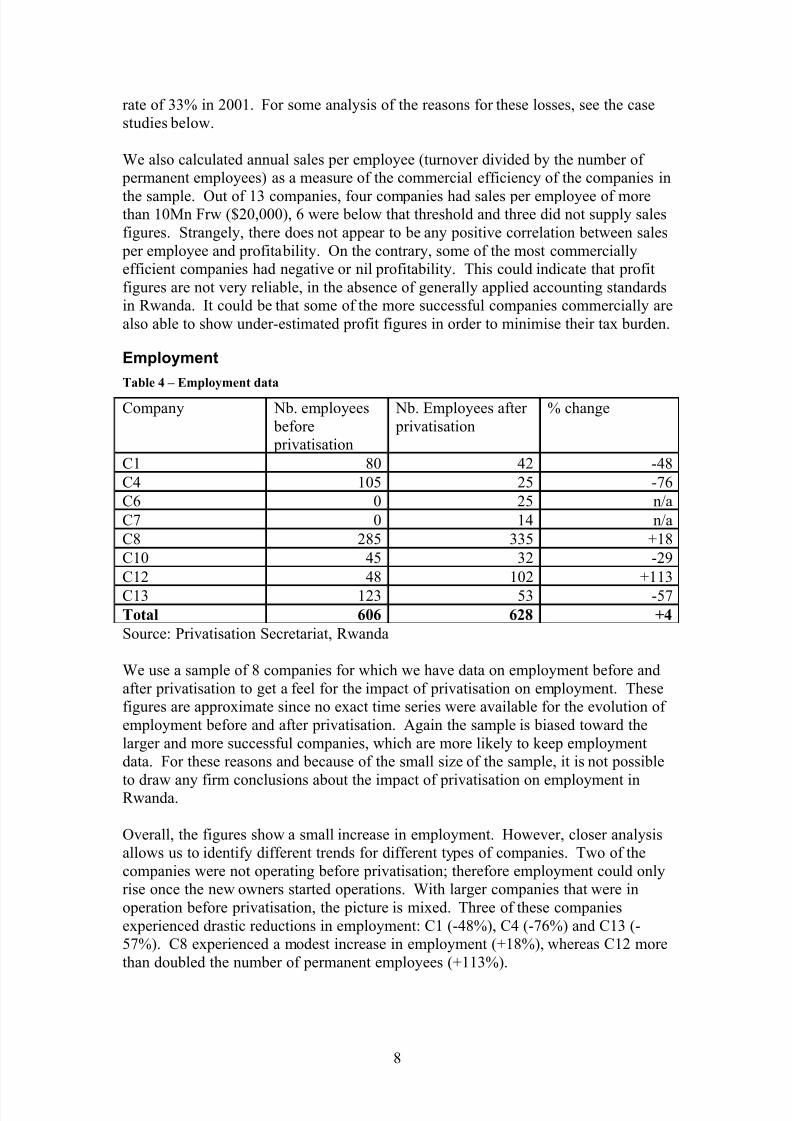
Table 4 – Employment data
Company Nb. employees before privatisation
Nb. Employees after privatisation
% change
C1 80 42 -48
C4 105 25 -76
C6 0 25 n/a
C7 0 14 n/a
C8 285 335 +18
C10 45 32 -29
C12 48 102 +113
C13 123 53 -57
Total 606 628 +4
Source: Privatisation Secretariat, Rwanda
We use a sample of 8 companies for which we have data on employment before andafter privatisation to get a feel for the impact of privatisation on employment. Thesefigures are approximate since no exact time series were available for the evolution of employment before and after privatisation. Again the sample is biased toward thelarger and more successful companies, which are more likely to keep employmentdata. For these reasons and because of the small size of the sample, it is not possible
to draw any firm conclusions about the impact of privatisation on employment inRwanda.
Overall, the figures show a small increase in employment. However, closer analysisallows us to identify different trends for different types of companies. Two of thecompanies were not operating before privatisation; therefore employment could onlyrise once the new owners started operations. With larger companies that were inoperation before privatisation, the picture is mixed. Three of these companiesexperienced drastic reductions in employment: C1 (-48%), C4 (-76%) and C13 (-57%). C8 experienced a modest increase in employment (+18%), whereas C12 morethan doubled the number of permanent employees (+113%).
8
7/29/2019 RwandaPrivImpact v1.0R MCherif Nov03
http://slidepdf.com/reader/full/rwandaprivimpact-v10r-mcherif-nov03 9/22
Case studies
In order to complement the quantitative analysis presented above, we will add somemore details about a number of the companies that were visited and asked to fill in aquestionnaire for the purpose of this study. Case studies enable us to presentqualitative information that makes up for the lack of quantitative data and shed some
light on the factors that influence the success or failure of privatised companies.
In each case, we first look at the situation of the company before privatisation. Wethen describe the privatisation process and the business plan (if any) presented by thenew owners at the time of privatisation. Finally, we look at the current situation of the company and the extent to which the business plan has been realised.
Seven companies were selected for these case studies. The choice was guided by twoconsiderations: representing the various sectors in Rwanda and particularly thestrategic sectors with a good potential for growth and export. The selected companiesare also those for which we have the most complete data; therefore, they also tend to
be the larger and more successful privatised companies:
• C1 operates in coffee bean trading and packaging. Coffee is the second largestexport of Rwanda after tea and was identified by the government as a prioritysector for development;
• C4, a printing company;
• C6, a metal smelting factory;
• C7, a hotel: the tourism sector was identified by the government as a prioritysector for development;
• C8, a sugar refining company;
• C12, a pyrethrum processing and exporting company; and
• C13, a tobacco manufacturing company, was a mixed-ownership company before privatisation
C1
C1 was part of Ocir-café, the parastatal in charge of the coffee sector in Rwanda before privatisation. It buys, packages and exports raw coffee beans.
Several attempts at leasing the factory were made before privatisation. In 1996, Aforeign investor signed a lease contract with the Government for C1 and invested anestimated 471Mn Frw. If we exclude investments during the lease period, C1’s valuewas estimated at 274Mn Frw. The foreign investor was the only company to bid: theyoffered to pay 190.5Mn Frw and invest 463Mn Frw in the company. The salecontract was signed in 2000. However, it is unclear whether the investment was
meant to be over and above what had already been invested during the lease period or not.
9
7/29/2019 RwandaPrivImpact v1.0R MCherif Nov03
http://slidepdf.com/reader/full/rwandaprivimpact-v10r-mcherif-nov03 10/22
Post privatisation, it appears that the foreign investor only invested 34Mn Frw. In2001, the company had a turnover of 2.3Bn Frw. The company, however, has madenet losses in both 2000 and 2001, though it had been breaking even in 1998 and 1999.It had been repaying their debts to a commercial bank on a regular basis.
The explanations offered for losses made are:
• The fall in coffee prices;
• The lack of reputation of the new owner as a relative newcomer to Rwanda;
• Crops of coffee beans are too small and because of seasonality, the company isidle most of the year; and the
• Cost of finance in Rwanda. C1 is currently paying 16% interest on itscommercial bank debt.
During the leasing phase, C1 employed 80 people on a permanent basis. After privatisation, that number was reduced to 42, a 48% drop.
C4
C4, a printing company, was evaluated before privatisation at 510 Mn Frw. After bidding, the company was awarded to Investor 1 for 350Mn Frw (part of a building belonging to C4 was sold separately for 70 Mn Frw) in 1999. The sale pricerepresented 82% of the reference price.
In July 2002, Investor 1 sold its shares to two Rwandan companies, one in the metalsector and the other an investment company. It is not clear whether the contractual
obligations, including the investment plan, have been transferred to the new owners.
Part of the privatisation conditions were to invest 120 Mn Frw in renovating andrehabilitating the company and to buy new machines within one year. So far, C4 hasinvested only 60Mn Frw in renovation and rehabilitation.
Despite its good sales figures, C4 has been showing negative profits in the last fiveyears. This is attributed by the company to:
• Failure to invest sufficiently. Due to its lack of colour printing machinery, potential customers have to go abroad. C4 was planning to invest an extra 120
Mn Frw to buy colour printing machines;
• Expensive finance: all the company’s long term loans are from theshareholders as a result of high interest rates; and
• Lack of technicians in Rwanda to repair machines when needed. As a result,the company uses Belgian technicians who are expensive.
C4 is facing competition from four Rwandan companies and from foreign companies based in Uganda, Kenya and South Africa.
10

7/29/2019 RwandaPrivImpact v1.0R MCherif Nov03
http://slidepdf.com/reader/full/rwandaprivimpact-v10r-mcherif-nov03 11/22
The new owners were expected to keep current employees whenever possible, but thegovernment took responsibility for indemnifying any employees who were maderedundant as a result of the privatisation. In practice, most of the employees lost their
jobs during the renovation and rehabilitation phase. After that, C4 recruited a newand much smaller workforce.
C6
Before its privatisation, C6, a tin smelting factory, belonged to Redemi, the Stateowned mining company. It had been started in 1986 by another Rwandan company,Somirwa, with a processing capacity of 3000 tonnes of cassiterite. In 1985, Somirwawent bankrupt and C6 was bought by the government for 269Mn Frw andincorporated into Redemi.
In 2001, the government decided to privatise C6 ahead of the other Redemi assets.Two foreign companies took part in the tendering process. The reference price was446Mn Frw, but the government accepted a price of $300,000 (133Mn Frw at the
time) from the highest bidder and a pledge to invest $4Mn (some 2Bn Frw) inrenovating the company and expanding its capacity.
The new owner’s investment plan includes the following:
• Rehabilitate the tin smelting plant;
• Build a lab for metal analysis;
• Build a metal processing plant; and
• Build a plant to produce ferro-niobium.
All these investments were estimated at $2.5Mn, plus $1.5Mn as a cash injection intothe business.
The tin smelting plant rehabilitation was completed in November 2002 and the lab inFebruary 2003. The metal processing and ferro-niobium plants, however, were notready yet in June 2003. It is now estimated that these latter developments will requirean extra $1Mn and an extra 6-9 months compared to original plans.
The company has not started commercial operations yet. In 2002, about $1Mn wasinvested in the C6 and it is ready to start producing processed tin before the end of 2003.
The main problem encountered by C6 was the fact that import duties were higher thanexpected.
C7
C7, a small hotel, was built as a cooperation project between the Rwandan andBelgian governments to facilitate access by tourists to the mountain gorillas, in theRuhengeri region. It had become a property of the Rwandan tourism agency(ORTPN). During the war in 1990-94, it had been gradually abandoned and hadfallen into disrepair.
The reference price of 19.6Mn Frw corresponded to the expropriation compensationfee requested by ORTPN. When it was brought to market in 2000, two offers were
11

7/29/2019 RwandaPrivImpact v1.0R MCherif Nov03
http://slidepdf.com/reader/full/rwandaprivimpact-v10r-mcherif-nov03 12/22
made for C7. The highest bidder was a Rwandan association working for the benefitof women and children, with an offer of 10.2Mn Frw; so C7 was attributed to them.
The new owner presented a detailed business plan for rehabilitating and modernisingexisting buildings and buying new equipment, for a total cost of 167Mn Frw and
within one year. The targets of the business plan have been achieved by theassociation. In addition, the new owners have had a positive social impact on thesurrounding villages. They have:
• Organised local groups of women and attributed plots of land to them. Their produce is then sold to C7;
• Provided water supply points for the population; and
• Created folk dance groups associated with the hotel.
C7 appears to be well managed. It made a loss in 2001, but the profit made in 2002almost balanced it out. The new owner being an association, it is expected that their
primary objective is not profit making. They make regular monthly repayments of their long term debt and they have paid the full balance on the purchase price of thehotel. The guest house now has 15 employees.
The main problem facing C7 is lack of access to the electricity grid due to their remote location. Using a small generator is very costly. The other problem is the badstate of the unpaved road from Ruhengeri to the guest house.
C8
C8, a sugar refining factory, was created in 1969. In 1987, it was granted the legalstatus of a régie, which means that it under direct management of the Ministry of Industry. It was looted during the war of 1994. Operations only restarted briefly in1995 and the company was then on hold until its sale to a multinational company,which has extensive experience in the sugar industry in Africa, in November 1997.The factory was sold for $1,5Mn, subject to the following conditions:
• Up to 20% of the share capital should be sold to Rwandan investors at a futureunspecified date. This has still not been done;
• Equipment should be repaired within 6 months and capacity should beexpanded from 200 to 550 tonnes/day. In March 2003, they had reached acapacity of 350 tonnes/day.
• C8 also undertook to meet 100% of national sugar consumption, but so far they have only achieved 40% of that.
The Government also granted a 50 year lease for a total of 2735 hectares of land for the cultivation of sugar cane. So far, C8 has only paid 50% of the purchase price;they have the money to pay the balance, but the title deeds have not been prepared yet
by the Ministry of Land.
12
7/29/2019 RwandaPrivImpact v1.0R MCherif Nov03
http://slidepdf.com/reader/full/rwandaprivimpact-v10r-mcherif-nov03 13/22
The factory crushes and processes sugar cane into refined sugar. C8 facescompetition from imported sugar from Malawi, Swaziland and Brazil.
In the last two years, C8 has made heavy losses. This is mainly as a result of floods in2000-01 that affected about 31% of sugar cane planted areas. Nevertheless, C8 has
managed to increase cane prices paid to out-growers as well as the price of refinedsugar.
Apart from the 370 permanent employees, C8 employs 4000 labourers on a casual basis.
C12
C12 buys dried flowers from peasant growers; these are then processed into raw pyrethrum extract, which is used as an insecticide.
It was created in 1978 as a SOE under supervision from the Ministry of Agriculture.
During the 1994 war, the buildings and equipment were not significantly damaged.
It was sold in December 2000 to a private Rwandan company for 550 Mn Frw. Sofar, the new owner has only repaid 50% of the sale price.
The main points in the business plan were to:
• Rehabilitate the buildings and machinery of the factory;
• Increase the purchase price of dried flowers; and
• Increase dried flower production by providing assistance to peasant growers.
C12 has fulfilled all conditions above through significant investment of 140 Mn Frwin 2001 and 162 Mn Frw in 2002. Recently, C12 has branched out into a secondaryactivity by opening a hotel in the same region.
The company has significant long term debts towards BRD, a Rwandan development bank, but these are repaid regularly, despite the high interest rate (17%). Thecompany made very significant profit in 2001 of 254 Mn Frw, but it made a loss of 15Mn Frw in 2002, which is mainly due to:
• A rise in the price of dried flowers (the input);
• A fall in the world market price of raw pyrethrum (the output) from $64/kgin 2001 to $49/kg in 2003; and
• A fall in production.
A major problem facing C12 is that it sells all its production to the US market throughone wholesaler (Sumitomo), with whom it has little bargaining power. The solutionto this problem would be to start refining pyrethrum at the factory. C12 could theneither export refined pyrethrum at a better price or sell the end products (pesticides) tothe local market.
Machines for refining were bought by C12 in the 1980s, but have never been operatedcommercially. It is reported that these machines had been sabotaged before 1994
13

7/29/2019 RwandaPrivImpact v1.0R MCherif Nov03
http://slidepdf.com/reader/full/rwandaprivimpact-v10r-mcherif-nov03 14/22
under instruction from South African refiners. The rehabilitation of the refinerywould cost some one million US$, but there is a strong will from the government andthe private owners that this should happen. C12 has been informed that in the future
buyers will only be interested in refined pyrethrum and not in raw extract.
C13C13, a tobacco manufacturing company, was created in 1975 as a joint-venture
between the Rwandan State and a Belgian company. The ownership of the companywas as follows:
• State 23.55%;
• Belgian company 47.88%;
• BRD 21.43%;
• Ocir-café 7.14%.
When C13 was put on the market, the Belgian company, having itself been acquired by a multinational company, requested to exercise its pre-emption right. After negotiations, the government decided to sell its direct shares as well as those held bythe coffee parastatal, Ocir-café, to the multinational for a total sum of $1.5Mn; BRD,a State-owned development bank, retained its shares. The contract was signed inSeptember 2001.
In addition, the Government granted C13 the exclusive right to manufacture tobaccoin Rwanda for a 5-year period, in exchange for $50,000 and the commitment todevelop tobacco agriculture in Rwanda.
C13 never developed tobacco agriculture in Rwanda, as it was estimated to be cheaper to carry on importing tobacco leaves. The government, therefore, allowed other tobacco manufacturers in Rwanda.
For its long term debts, C13 managed to obtain a slightly lower interest rate than other companies: namely 13.75% from a local commercial bank. In 2001 and 2002, C13invested 356Mn Frw and 218Mn Frw respectively in expanding its own operations.
In the case of C13 we have some sales and profit figures for the period before privatisation, which allows us to compare the company’s performance before andafter privatisation. Sales per employee in the years 1997-1999 were below 20Mn
Frw, but by 2002 they had reached 37Mn Frw (this is before the large number of redundancies in 2003). Profitability, however, was positive in 1998-99 but dropped tozero in 2001-02.
Out of the 123 employees before privatisation, 70 were made redundant in 2003 inorder to enhance the efficiency of the company. Those made redundant were
provided with training so that they can become self-employed.
Conclusions
Out of a total of 74 companies, the Privatisation Secretariat has sold 30 companies tothe private sector and it is liquidating another six companies, whereas three
14

7/29/2019 RwandaPrivImpact v1.0R MCherif Nov03
http://slidepdf.com/reader/full/rwandaprivimpact-v10r-mcherif-nov03 15/22
companies have reverted temporarily to State-control. So far, the privatisedcompanies have been of a small or medium size. However, the state-owned water andelectricity (and potentially gas) utility Electrogaz will be managed by a privateinternational utility for a five-year period from October 2003. In addition, Rwandatel,the fixed telecommunication company, is expected to be sold to a strategic investor in
the second quarter of 2004. Beyond that, the companies left to be privatised aremainly in the agri-business and financial sectors.
So has the privatisation programme achieved its objectives so far? What has been itsimpact on the Rwandan economy? To answer these questions we have consideredtwo areas of impact: public finance and the performance of the privatised companies.
With respect to public finance, the impact has been rather small. The total proceedsfrom privatisation between 1998 and 2002 have reached $7Mn, which is less than 4%of financial transfers from the productive sector to the government. In fact, the largestincrease to government revenues from the productive sector came from a large rise in
Value Added Tax (VAT) that affected both public and private companies.Simultaneously, transfers from the government to the productive sector rose due tothe need for rehabilitation after the 1994 war, particularly in the case of infrastructure.Overall, there has been a net flow of income from the productive sector to thegovernment of some 23Bn Frw ($46Mn) between 1998 and 2002, which is consistentwith the liberalisation and privatisation policies. Crucially, the sale of Rwandatel in2004 is likely to have a much larger impact on public finance than all the other
privatisations so far.
As far as the performance of companies is concerned, it is difficult to quantify theimpact of privatisation due to the lack of data on the performance of these companies
prior to their sale to the private sector. Nevertheless, we have developed performanceindices for a sample of companies post-privatisation. With respect to the pre-
privatisation period, we had to rely on a qualitative case study approach.
Out of 30 privatised companies so far, 20 are in operation (representing a success rateof 66.7%), seven are not operational and three have been liquidated as they were
bankrupt before privatisation. This compares favourably with the situation of those30 companies before privatisation, where 15 only were in operation. With regard to
payment of the transfer prices, the Privatisation Secretariat has recovered 85% of due payments. However, several companies were sold for less than the reference price.
This either means that the reference price was over-estimated7
or that the governmentsold these companies at less than their market values.
Despite the fact that our sample of companies was biased toward the larger and moresuccessful cases, only 23% of the companies made a profit and 15% broke even in2001-02. Sales per permanent employee, which were used as a measure of efficiency,ranged between 0.3 and 85.2 Mn Frw ($600-170,000), the average being 16.6Mn Frw(about $32,000) per year.
With regard to the impact on employment, the sample of companies used shows anoverall slight increase in employment after privatisation, but that trend hides a great
7 This could be because the valuation studies prior to privatisation under-estimated the damage to thecompanies’ assets, market and access to human resources after the war of 1994.
15

7/29/2019 RwandaPrivImpact v1.0R MCherif Nov03
http://slidepdf.com/reader/full/rwandaprivimpact-v10r-mcherif-nov03 16/22
variation between companies. At one extreme, we have a reduction of 76% of theworkforce by C4 and, at the other extreme, we have an increase of 113% at C12.Some of the companies were not operating before privatisation, which explains whythe workforce could only increase once the new owners restarted operations.
The case studies allow us to identify common causes for the relative success or failureof privatised companies. These are some of the common themes behind theimprovement in the performance of privatised companies:
1. The significance of investments into rehabilitation of buildings and buyingnew machinery by the private owners (e.g. C6, C8, C12, C13);
2. Respect for the business and investment plans presented by the companies before privatisation (e.g. C7, C12)
3. Reduction in the workforce when these were unnecessarily inflated prior to
privatisation; and
4. Introduction of new technology (e.g. C6, C12) and better management – whichis harder to measure.
As to the recurrent difficulties experienced by companies and, in some case, cited bythem as reasons for their poor performance, these were the main ones:
1. Lack of investments or respect of the business plans by the new owners (e.g.C1, C4);
2. Fall in the prices of the products of the company; this is particularly the casewith exported commodities, such as coffee and pyrethrum;
3. The high cost of medium/long term finance in Rwanda; loans fromcommercial banks have typical annual interest rates of 16%;
4. Delays in obtaining title deeds from the Ministry of Land even when theinvestors have enough cash to settle the entire purchase price of the company 8;
5. Unreliable and insufficient production of raw materials used as inputs in some
factories, such as sugar cane, pyrethrum flowers and coffee beans. This is partly due to inefficient farming techniques; and
6. Higher than expected tariffs on imported goods and machinery, e.g. C6.
Lessons learnt and recommendations for the remainder of the programme
The first lesson of this impact study is that privatisation in Rwanda does work.Despite all the problems encountered by private investors and a certain number of failures, overall privatisation has allowed 6 companies that were idle to restart
8 The lack of property titles hinders the company’s access to credit, as the former could be used ascollateral.
16
7/29/2019 RwandaPrivImpact v1.0R MCherif Nov03
http://slidepdf.com/reader/full/rwandaprivimpact-v10r-mcherif-nov03 17/22
operations (one company that was operating before privatisation has stoppedoperating afterwards) and, as the case studies suggest, it has led to significantinvestments into and improved the performance of former SOEs. In some companies,it has led to job losses; but there is no evidence that it has led to an overall drop inemployment. It has also provided the government with a small non-fiscal source of
income, which is likely to increase significantly in 2004 with the sale of Rwandatel.
The case-studies, through the collection of data and opinions from companymanagers, enable us to draw some recommendations as to how to improve the
privatisation process in the future:
1. Investors have to be screened carefully for their experience in the sector of thecompany to be privatised and for their financial ability to pay the agreed sale
price and to make necessary investments.
2. Investors of agri-business companies have to be screened for their ability to
move up the quality ladder and the value added chain. Exporting rawcommodities only is risky for the country due to falling prices.
3. The Privatisation Secretariat should play a more active role in monitoringinvestors’ respect for their own investment and business plans. There has to
be sanctions against those investors that fail to honour their pledges. Somesteps have already been taken in this direction through the hiring of a member of staff in charge of monitoring privatised companies and the creation of adata-base of SOEs and privatised companies.
4. The government should impose Generally Accepted Accounting Practices(GAAP) on Rwandan companies and the tax authorities should monitor moreclosely the way profit figures are calculated.
5. The financial sector should be liberalised and privatised, so that interest ratescan fall through increased competition between banks. So far, the cost of finance has been a hindrance to investment into privatised companies.
6. Capacity and motivation has to be reinforced at the Ministry of Land so thattitle deeds can be provided for new owners at a faster pace.
7. Policies for increasing the productivity of farmers should be stepped up, particularly for those crops that are used as inputs in agri-business, e.g. coffee,tea, pyrethrum, sugar cane.
8. The government should clarify, through the Rwandan Investment PromotionAgency, its policy on tariff reductions on imported capital goods for newinvestors and make sure that it is applied by customs officers.
References
Abt Associates, under contract to USAID (1999), Assessing the Impacts of
Privatisation: the Experience of Morocco
17

7/29/2019 RwandaPrivImpact v1.0R MCherif Nov03
http://slidepdf.com/reader/full/rwandaprivimpact-v10r-mcherif-nov03 18/22
Asian Development Bank (2001), Special Evaluation Study on the Privatisation of Public Sector Enterprises: Lessons for Developing Member Countries
Boubakri, N. and Cosset, J.-C. (1998), ‘Privatization in Developing Countries: AnAnalysis of the Performance of Newly Privatized Firms’, in Public Policy for the
Private Sector , Note No. 156, World Bank
Boubakri, N., Cosset, J.-C. and Guedhami, O. (2001), ‘Liberalization, CorporateGovernance and the Performance of Newly Privatized Firms’, William Davidson
Institute Working Papers Series No. 419, December 2001
Nellis, J. (2003), ‘Privatization in Africa: What has happened? What is to be done?’,Center for Global Development Working Paper
18

7/29/2019 RwandaPrivImpact v1.0R MCherif Nov03
http://slidepdf.com/reader/full/rwandaprivimpact-v10r-mcherif-nov03 19/22
Annex – List of companies to be privatised in Rwanda
Company Sector of
activity
% State
ownershipfor mixedownershipcompanies9
Privatisation
status
1. Gishwati Dairy Agri- business
Advanced
2. Lake KivuFishery -Kibuye
Agri- business
Advanced
3. Scieries de Nyungwe (2) Agri- business Advanced
4. BCR Finance 80.0% Advanced
5. Mulindi Tea plantationsand factories
Advanced
6. Pfunda Tea plantationsand factories
Advanced
7. Sorwathé Tea plantations
and factories
23.5% Advanced
8. Rwandex Trading 51.0% Advanced
9. Rwandatel Utility Advanced
10. Centre Nationalde Petit Elevage(5)
Agri- business
Advanced (4 out of 5)
11. ETIRU Agri- business
Liquidated
12. Sopab Agri- business
Liquidated
13. Bunep Services Liquidated.
14. Bugarama RiceMill
Agri- business
Not yet
15. Butare RiceMill
Agri- business
Not yet
16. Couvoir National deRubirizi(Hatchery)
Agri- business
Not yet
17. RwamaganaRice Mill
Agri- business
Not yet
18. Soproriz Agri- Not yet9 Other companies are/were 100% State-owned.
19

7/29/2019 RwandaPrivImpact v1.0R MCherif Nov03
http://slidepdf.com/reader/full/rwandaprivimpact-v10r-mcherif-nov03 20/22
Company Sector of activity
% Stateownershipfor mixedownership
companies
Privatisationstatus
business
19. Bacar Finance 33.0% Not yet
20. Banque deKigali.
Finance 50.0% Not yet
21. BRD Finance 55.0% Not yet
22. CaisseHypothécaire
Finance Not yet
23. Sonarwa Finance 80.0% Not yet
24. GîteTouristiqueItuze
Hotel Not yet
25. Bralirwa Industry 30.0% Not yet
26. Imprisco Industry Not yet
27. Papeterie duRwanda
Industry Not yet
28. Magerwa Services 50.0% Not yet
29. Gisakura Tea plantationsand factories
Not yet
30. Gisovu Tea plantationsand factories
Not yet
31. Kitabi Tea plantationsand factories
Not yet
32. Mata Tea plantationsand factories
Not yet
33. Nyabihu Tea plantationsand factories
Not yet
34. Rubaya Tea plantationsand factories
Not yet
35. Shagasha Tea plantationsand factories
Not yet
36. Onatracom Not yet
37. REDEMI Mining Partly (KarurumaSmelting Factory
privatised)38. Kigembe Agri- Reverted to State
20

7/29/2019 RwandaPrivImpact v1.0R MCherif Nov03
http://slidepdf.com/reader/full/rwandaprivimpact-v10r-mcherif-nov03 21/22
Company Sector of activity
% Stateownershipfor mixedownership
companies
Privatisationstatus
Fisheries business ownership
39. Hotel desDiplomates
Hotel Reverted to Stateownership (with
private managementcontract)
40. Hotel Izuba Hotel Reverted to Stateownership (with
private managementcontract)
41. Sodeparal Agri- business
Under liquidation
42. Caissed'Epargne DuRwanda
Finance Under liquidation
43. OPROVIA Retailing Under liquidation
44. Petrorwanda Retailing Under liquidation
45. Air Rwanda Transport Under liquidation
46. Stir Transport Under liquidation
47. Rwantexco Industry 49.7% Ownership under
litigation48. Coffee Factory
– NkoraAgri-
businessYes
49. Lake IhemaFishery
Agri- business
Yes
50. Minoterie deGatare
Agri- business
Yes
51. MukamiraMaize Mill
Agri- business
Yes
52. Hotel Akagera Hotel Yes
53. Hotel Kiyovu Hotel Yes
54. Projet Chaux(PVC)
Mining Yes
55. Abattoir de Nyabugogo
Agri- business
Yes
56. Coffee Factory – Gikondo
Agri- business
Yes
57. Coffee Factory – Masaka
Agri- business
Yes
58. Dairy Plant- Nyabisindu
Agri- business
Yes
21

7/29/2019 RwandaPrivImpact v1.0R MCherif Nov03
http://slidepdf.com/reader/full/rwandaprivimpact-v10r-mcherif-nov03 22/22
Company Sector of activity
% Stateownershipfor mixedownership
companies
Privatisationstatus
59. Dairy Plant- Nyagatare
Agri- business
Yes
60. Kabuye Sugar Works
Agri- business
Yes
61. Lake KivuFishery -Gisenyi
Agri- business
Yes
62. Lake KivuFishery(Cyangugu)
Agri- business
Yes
63. OPYRWA Agri- business
Yes
64. Sonafruit Agri- business
88.4% Yes
65. Guest HouseKibuye
Hotel Yes
66. Hotel Régina Hotel Yes
67. Kinigi GuestHouse
Hotel Yes
68. Briqueterie deRuliba
Industry Yes
69. Imprimerie Nationale duRwanda
Industry Yes
70. Ovibar Industry Yes
71. Sorwal Industry 29.5% Yes
72. Tabarwanda Industry 30.7% Yes
73. BCK Retailing 29.0% Yes
74. Electrogaz Utility Yes (managementcontract signed)
Source: Privatisation Secretariat, Rwanda