rx15 tt tues_1230_1_carnevale_2green_3paone-tuazon
TRANSCRIPT

Trending Topics Track:Data-Driven Trends
Presenters:• John Carnevale, Carnevale Associates, LLC• Sherry L. Green, Sherry L. Green & Associates,
LLC• Denise Paone, New York City Department of
Health and Mental Hygiene• Ellenie Tuazon, New York City Department of
Health and Mental Hygiene
Moderator: Nancy Hale, Operation UNITE

Disclosures
• John T. Carnevale, PhD; Sherry L. Green, JD; Denise Paone, EdD; Ellenie Tuazon, MPH; and Nancy Hale have disclosed no relevant, real, or apparent personal or professional financial relationships with proprietary entities that produce health care goods and services.

Disclosures
• All planners/managers hereby state that they or their spouse/life partner do not have any financial relationships or relationships to products or devices with any commercial interest related to the content of this activity of any amount during the past 12 months.
• The following planners/managers have the following to disclose:– Kelly Clark – Employment: Publicis Touchpoint Solutions;
Consultant: Grunenthal US– Robert DuPont – Employment: Bensinger, DuPont & Associates-
Prescription Drug Research Center– Carla Saunders – Speaker’s bureau: Abbott Nutrition

Learning Objectives
1. Chart national trends in the Rx drug diversion method known as doctor shopping.
2. Evaluate the effectiveness of state laws, policies and programs targeted to reduce doctor shopping.
3. Describe a data-driven, collaborative approach that has reduced overdose deaths in NYC.
4. Outline the technical assistance manual that jurisdictions may use to replicate the NYC RxStat initiative.

Prescription Drug Abuse Data Trendsand Policy/Program Responses
Presentation to the National Rx Drug Abuse Summit
April 7, 2015
John T. Carnevale, Ph.D.President, Carnevale Associates, [email protected]

John T. Carnevale, Ph.D., has disclosed no relevant, real orapparent personal or professional financial relationshipswith proprietary entities that produce health care goods And services.

Today’s National Drug Problem• U.S. Federal drug control policy targets illicit drug use, illegal drug use (underage use
of alcohol and tobacco), non-medical use of prescription drugs, and synthetic drugs.
– In 2013, an estimated 24.6 million Americans aged 12 or older were current (past month) illicit drug users—this represents 9.4 percent of the population aged 12 or older. Marijuana remains the most commonly used illicit drug, with 19.8 million users.
• Non-medical use of prescription drugs is the second largest category of drugs abused 6.5 million or 2.5 percent were nonmedical users of prescription drugs (the number in 2013 is similar to the number of users in 2002 to 2012 (ranging from 6.1 million to 7.1 million).
• Attention is now focused on the (re)emergence of heroin, which appears to be increasing in use (particularly in the Northeast) because it is a relatively cheaper and more plentiful alternative to pain medication—we are entering what may be described as an opioid epidemic.
[7]Source: SAMHSA, National Survey on Drug Use and Health, 2014.

Illicit Drug Use, 2013
Illicit Drugs
Marijuana
Cocaine
Heroin
Hallucinogens
Prescription Drugs
0 5,000 10,000 15,000 20,000 25,000 30,000
24,573
19,810
1,549
289
1,333
6,484
Number of Users in Thousands, 2013
[8]Source: SAMHSA, National Survey on Drug Use and Health, 2014.
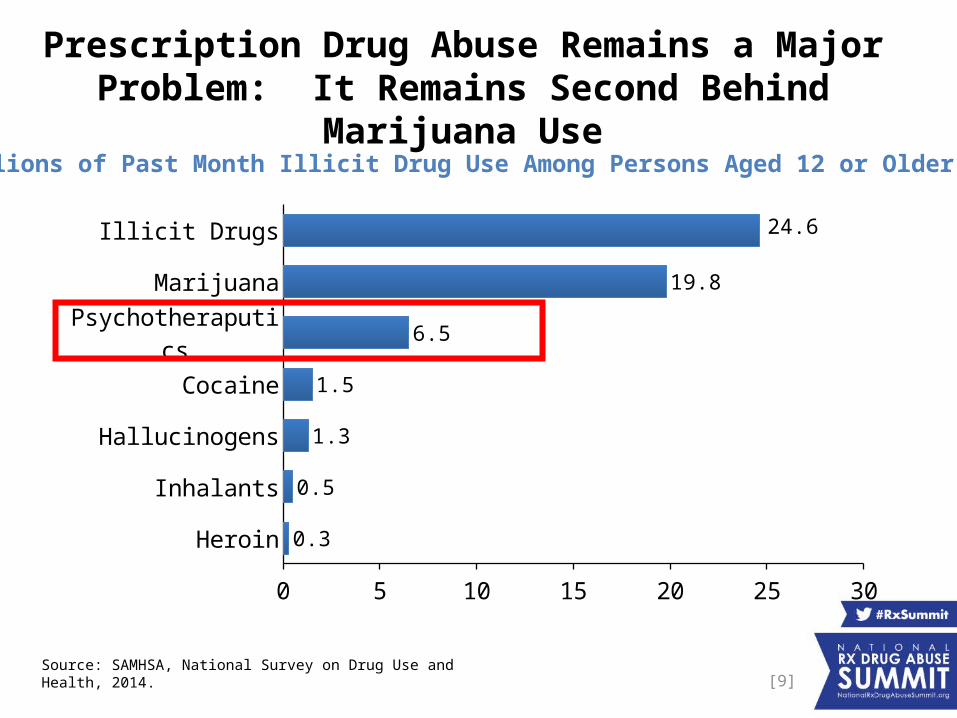
Prescription Drug Abuse Remains a Major Problem: It Remains Second Behind Marijuana Use
[9]
Heroin
Inhalants
Hallucinogens
Cocaine
Psychotheraputics
Marijuana
Illicit Drugs
0 5 10 15 20 25 30
0.3
0.5
1.3
1.5
6.5
19.8
24.6
(Millions of Past Month Illicit Drug Use Among Persons Aged 12 or Older: 2013)
Source: SAMHSA, National Survey on Drug Use and Health, 2014.

Pain Relievers Used the Most: 4.5 Million of the 6.5 Million Prescription Drug Abusers Use Pain Meds
[10]Source: SAMHSA, National Survey on Drug Use and Health, 2014.

Past Year Initiates of Specific Illicit Drugs: 2013
[11]
Heroin
Cocaine
Stimulants
Tranquilizers
Pain Relievers
Marijuana
0 500 1,000 1,500 2,000 2,500 3,000
169
601
603
1,180
1,539
2,427
(Numbers in Thousands)
Source: SAMHSA, National Survey on Drug Use and Health, 2014.

Pain Reliever Initiation is Declining
[12]Source: SAMHSA, National Survey on Drug Use and Health, 2014.
2002 2003 2004 2005 2006 2007 2008 2009 2010 2011 2012 20130
500
1000
1500
2000
2500
3000
Nu
mb
ers
in T
ho
usa
nd
s
2,456
2,193
1,539

Overdoses and ER visits Remain a Significant Consequence of Prescription Drug Abuse
[13]
• Drug overdose was the leading cause of injury-related death in 2013 – more than motor vehicle crashes.1
Drug overdoses: 38,851
Motor vehicle crashes: 33,804
• The drug overdose death rate more than doubled from 1999 through 2013.2
• In 2011, more than 1.4 million emergency visits were related to pharmaceuticals compared to 1.2 million visits for illicit drugs.3
Sources:1. Centers for Disease Control and Prevention. Web-based Injury Statistics Query and Reporting System (WISQARS) [online]. (2014)2. Centers for Disease Control and Prevention. National Vital Statistics System mortality data.3. Substance Abuse and Mental Health Services Administration. Highlights of the 2011 Drug Abuse Warning Network (DAWN) findings on drug-related emergency department visits. The DAWN Report. Rockville, MD: US Department of Health and Human Services, Substance Abuse and Mental Health Services Administration; 2013 and CDC National Hospital Ambulatory Medical Care Survey: 2011 Emergency Department Summary Tables

Drugged Driving is Increasing and Prescription Drug Use is a Factor
[14]
• NHTSA recently completed (2014) the National Roadside Survey (NRS) for the first time since 2007.1
• The NRS found: About 20.0% of drivers tested positive for at least one drug in
2014, up from 16.3% in 2007. Presence of Rx drugs for weekend drivers was 4.9% in 2014, up
from 3.9% in 2007. Some 12.6% of drivers had evidence of marijuana use in their
systems, up from 8.6% in 2007.
Source: Results of the 2013–2014 National Roadside Survey of Alcohol and Drug Use by Drivers NHTSA’s Office of Behavioral Safety Research Berning, Compton, and Wochinger.1. Note: The NRS was conducted during 2013 and 2014 at a representative sample of 300 locations across the country. More than 9,000 drivers participated in the voluntary and anonymous survey. This was the fifth such survey on driver alcohol use conducted since 1973. This is the second such survey (last was in 2007) that has collected information on the use of drugs that could affect driving, including both illegal and legal drugs.

Opioid Poisoning Deaths Remain High, But Are Stabilizing; Heroin Poisoning Deaths are Increasing (39% increase in 2013)
Source: CDC/NCHS, National Vital Statistics System, Mortality File.Note: Deaths are classified using the International Classification of Diseases, Tenth Revision (ICD–10). Approximately 25% of drug-poisoning deaths lack information on the specific drugs involved. Some of these deaths may have involved heroin, opioid analgesics, or both.
Nu
mb
ers
In T
ho
usa
nd
s
Number of drug-poisoning deaths involving opioid analgesics and heroin
1999 2000 2001 2002 2003 2004 2005 2006 2007 2008 2009 2010 2011 2012 20130
5,000
10,000
15,000
20,000
25,000
30,000
35,000
40,000
45,000
50,000
All Opioid Analgesics Heroin

Where do Rx Drug Abusers Get Their drugs?The data say they get them from friends
16
Source: SAMHSA, NSDUH 2014
Note: Totals may not sum to 100% because of rounding or because suppressed estimates. The Other category includes the sources: “Wrote Fake Prescription,” “Stole from Doctor’s Office/Clinic/Hospital/Pharmacy,” and “Some Other Way.”

Media/Communication– Social marketing campaigns – Pharmacy and “point of sale” advertising campaigns– Media advocacy campaigns– General public education and information dissemination
Enforcement– Enforcement of prescriber and pain clinic laws– Tip and Reward Programs– Law Enforcement Training– Drug testing
Institutional Practices– Prescriber education – Patient education and brief interventions– Pain Management/Pain Clinic standards and best practices– Electronic health records initiatives– Protocols for pharmaceutical care at hospital discharge– Online Rx management accounts
Policy Options for Rx Drug Abuse: A Sampling of Numerous Strategies
Regulations/Laws– Prescription Drug Monitoring Program (PMPs)– Drug manufacturer requirements regarding prescriber
education– Patient review and restriction programs– Physical exam prior to prescribing laws– Requiring proper identification before dispensation– Model pain clinic regulations– Restricted internet access to Rx Drugs– Doctor shopping laws– Rx limits of sale– Prescriber requirements to regularly see patients using
controlled substances– Advertising restrictions for scheduled drugs– Naloxone access– DEA guidelines for communicating controlled substances Rx to
pharmacies– DEA prescriber licensing requirements– Parental liability laws
Structural– “Take-Back” Locations (including disposals and drop boxes)– Altering the physical environment– Abuse-Deterrent Formulation and packaging of medications

Are the Policy Strategies Effective: Evidence is Generally Spotty
• Rates of Dr. Shopping are declining since 2008, although the cause of this decline is not statistically determined. 1
• Two studies have demonstrated the effectiveness of PMPs and best practices:– Simeone and Holland (2006): found that PDMPs reduce the per capita supply of prescription pain relievers
and stimulants and in so doing reduce the probability of abuse for these drugs. It was the first study to show that states which are proactive in their approach to regulation are more effective in reducing the per capita supply of prescription pain relievers and stimulants than states which are reactive in their approach to regulation.
– Brandeis Center of Excellence (2012): found that states with PMPs were less likely to experience diversion; states with “proactive” PMPs had less availability of pain relievers compared to states that were not proactive.
• A 2011 Carnevale Associates, LLC study analyzed prescription drug Take-Back Programs and found:
– No evidence to date suggesting that take-back programs are effective in limiting access to prescription drugs by those who are at the heart of the epidemic.
– Research is needed to determine whether take-back programs achieve environmental or substance abuse outcomes.
– Limited data strongly indicate that ongoing bin-based (ongoing drop-off) programs appear to be the most cost efficient; event-based programs and mailbacks are costly.
• Research is needed about the effectiveness of other public policy options.1. Doctor Shopping Behavior and the Diversion of Opioid Analgesics: 2008-2012. Ron Simeone, Simeone Associates, Inc. and
IMS Government Solutions. August 14, 2014

The Current Policy Debate: Are Pain Medication Abusers are Switching to Heroin?
• The past year heroin incidence rate was 19 times higher among those who reported prior nonmedical pain reliever use than among those who did not.1
• Data on heroin initiation rates do not (yet?) reflect a large switching effect.
2004 2005 2006 2007 2008 2009 2010 2011 2012 20130
500
1000
1500
2000
2500
3000
Pain Relievers Heroin
Nu
mb
ers
In
Th
ou
sa
nd
s
1. Based on pooled 2002-2011 NSDUH Data. Associations of Nonmedical Pain Reliever Use and Initiation of Heroin Use in the United States Pradip K. Muhuri, Joseph C. Gfroerer, M. Christine Davies
Initiation of Heroin Use and Nonmedical Use of Pain Relievers
Source: SAMHSA, NSDUH 2014

2023
John T. Carnevale, Ph.D.President, Carnevale Associates, LLC

Data Driven Trends
A Closer Look at Selected Policies/Programs
Sherry L. Green
CEO and Manager
Sherry L. Green & Associates, LLC
National Rx Drug Abuse Summit
April 7, 2015
Atlanta, Georgia

Sherry L. Green, J.D., has disclosed no relevant, real orapparent personal or professional financial relationshipswith proprietary entities that produce health care goods and services.

Learning Objectives
1. Chart national trends in the Rx drug diversion method known as doctor shopping, overdoses, drugged driving, opioid and heroin overdose deaths.
2. Evaluate the effectiveness of and describe state laws, policies and programs targeted to reduce doctor shopping and respond to overdoses.

Data on State Policy and Systems-Level Interventionson Prescription Drug Overdose*
Limited and inconsistent
Critical need to improve evidence base, BUT. . .
* Haegerich, T.M., et al., What we know, and don’t know, about the impact of state policyand systems-level interventions on prescription drug overdose. Drug Alcohol Depend.(2014), http://dx.doi.org/10.1016/j.drugalcdep.2014.10.001

Promising Strategies
Reduce inappropriate prescribing
Reduce use of multiple prescribers
Focus on overdose response

Prescribing Practices
More informed prescribing
More appropriate prescribing
Changes in types and amounts of drugs prescribed

Make state Prescription Drug Monitoring Program (PMP)data more actionable
Timely, efficient access within electronic health recordat time of treatment decisions
Provide proactive alerts and analysis tools for PMP data
Provide easily understood and applied risk assessment tools
Screening, Brief Intervention and Referral to Treatment (SBIRT)
Develop clinical indicators for drug and alcohol abuse
Request medication by name
Multiple visits for some complaints

Train on alternatives to controlled substances for painmanagement
Educate on diagnosing signs and symptoms of abuseand addiction
Create awareness of available services for addictiontreatment, pain management, mental health

Implement clinical guidelines
Adopt pain clinic legislation

Overdose Death Prevention
Save people from dying
Opportunity to treat their addiction

Allow first responders, families, friends and appropriateothers to possess and administer Naloxone
Co-prescribe Naloxone when prescribe opioids
Adopt “Good Samaritan” protections for summoningaid
Eliminate fear of arrest and prosecution

Linkages to Treatment
Stop continued abuse and addiction
Stop social and economic consequences of abuse andaddiction
Provide addict access to treatment with proper intensityand length of stay

ERs – prioritize assessment for overdose victims; involuntarycommitments
Drug Courts
Pre-trial diversion – prioritize diversion shortly after arrest
Employee assistance programs (EAPs)

Student assistance programs (SAPs)
At-risk youth programs

Treatment
Provide full continuum of evidence-based treatmentservices
Diversify funding
Appropriations
Medicaid, insurance

CONTACT INFORMATION
Sherry L. GreenCEO and Manager
Sherry L. Green & Associates, LLCP.O. Box 2530
Santa Fe, NM [email protected]
505-692-0457 (cell)

RxSummit: Data-Driven Trends
Denise Paone, EdDEllenie Tuazon, MPH
New York City Department of Health and Mental Hygiene

Disclosures• Denise Paone has disclosed no relevant, real,
or apparent personal or professional financial relationships with proprietary entities that produce health care goods and services.
• Ellenie Tuazon has disclosed no relevant, real, or apparent personal or professional financial relationships with proprietary entities that produce health care goods and services

Learning objectives
• Outline the technical assistance manual that jurisdictions may use to replicate the NYC RxStat initiative
• Describe a data-driven, collaborative approach that has reduced overdose deaths in NYC

Outline
• Principles of RxStat• Data sources• Success of multi-pronged approach in Staten
Island• Overdose prevention: naloxone• Summary

PRINCIPLES OF RXSTAT

RxStat: Central focus and unifying goal
Reduce Overdose
Deaths

RxStat
• Public health & public safety collaboration– Housed at NYC Department of Health & Mental
Hygiene (DOHMH); leverages expertise and infrastructure
• “Real-time” (enhanced) surveillance• Participants and stakeholders at city, state,
and federal organizations • Monthly RxStat data meetings• Received funding from two BJA grants in 2013
and 2014 + ONDCP supplemental funds

RxStat: Core principles• Public health approach
– Track drug use and associated health consequences at a population level
• Timely, accurate analysis of drug misuse indicators from multiple sources (e.g., mortality, EDs, PMP, drug treatment, law enforcement, etc.)
• Data-driven initiatives• Rapid deployment of public health and public safety
resources to high priority areas• Rigorous follow-up to ensure strategies are effective

Common goal, different approaches
Public health Public safety
Population level Individual case level
Analysis of risk factors Identification of risky individuals
Demand-side behavior modification Supply-side behavior modification

Diverse approaches to existing data: Prescription drug monitoring
• Prevention of problem drug use• Address population level factors
that increase risk of overdose
PMP as a public health tool PMP as a law enforcement tool
• Prevention of drug-related crime• Address individuals who
facilitate or participate in illegal drug distribution
Policy Responses
• Opioid analgesic judicious prescribing guidelines
• Staten Island public health detailing campaign
• Focus on aberrant prescribers and street distributors
Policy Responses

Technical Assistance manual• Reviews key elements of RxStat
– Basics– Getting started– Building content (data, resources)– Managing process– Moving forward
• Details each of the RxStat datasets, including analytic code
• Available to download:http://www.pdmpassist.org/pdf/RxStat.pdf

DATA SOURCES

Data Sources
Reduce Overdose
Deaths
PMPData
Treatment Admissions
Poison Control
Drug Prosecutions
Hospitalizations
JailData
Mortality
DEA ARCOS
Pharmacy Crime
Price/Purity
Qualitative Research
Medicaid Fraud Data
Syndromic
Mortality
PMPData

PHARMACY CRIMES

Pharmacy crimes data: Rx Crimes• To track, investigate, and report on robberies
and burglaries of doctors’ offices and pharmacies targeting CPDs
• Since Rx Crimes launched in 2012– 550,000 pills reported stolen in NY and NJ
• 76% Painkillers
– Not a significant source of supply for illegal pill market

MORTALITY

Real-time mortality
• NYC receives mortality data monthly and reports data quarterly
• Prior to 2013 data was received annually and reported with a 1.5 year lag
• NYC published preliminary 2013 mortality data in July 2014– Time lag for the CDC is currently > 1 year

2000 2001 2002 2003 2004 2005 2006 2007 2008 2009 2010 2011 2012 20130
100
200
300
400
500
600
700
800
900
0
2
4
6
8
10
12
14
638
792723
769722
796838
695618 593
541630
730788
10.2
12.2
11.5 12.211.5
12.5
13.3
10.9
9.69.1
8.2
9.4
10.9
11.6
Number of unintentional opioid analgesic poisoning deaths Age-adjusted rate per 100,000Year
Nu
mb
er
Ag
e-a
dju
ste
d m
ort
alit
y r
ate
pe
r 1
00
,00
0
Unintentional drug poisoning deaths, NYC, 2000–2013
Source: New York City Office of the Chief Medical Examiner & New York City Department of Health and Mental Hygiene 2000-2013

Rate of unintentional drug poisoning deaths by drug type, NYC 2000–2013
(Drugs not mutually exclusive)
Source: New York City Office of the Chief Medical Examiner & New York City Department of Health and Mental Hygiene 2000-2013
2000 2001 2002 2003 2004 2005 2006 2007 2008 2009 2010 2011 2012 20130
1
2
3
4
5
6
7
8
9 HeroinCocaineMethadoneBenzodiazepinesOpioid Analgesics
Year
Ag
e-A
dju
ste
d R
ate
pe
r 1
00
,00
0

Rate of unintentional drug poisoning deaths by borough of residence
2000 2001 2002 2003 2004 2005 2006 2007 2008 2009 2010 2011 2012 20130
5
10
15
20
25 Staten IslandBronxManhattanBrooklynQueens
Year
Ag
e-A
dju
ste
d R
ate
pe
r 1
00
,00
0
Source: New York City Office of the Chief Medical Examiner & New York City Department of Health and Mental Hygiene 2000-2013
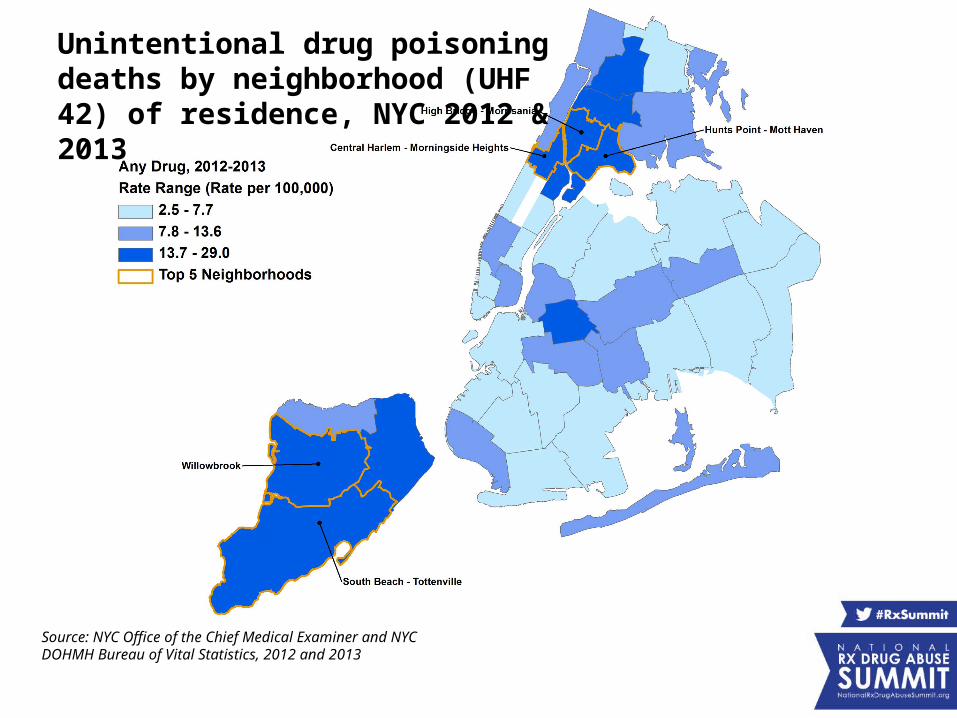
Unintentional drug poisoning deaths by neighborhood (UHF 42) of residence, NYC 2012 & 2013
Source: NYC Office of the Chief Medical Examiner and NYC DOHMH Bureau of Vital Statistics, 2012 and 2013

PRESCRIPTION MONITORING PROGRAM

PMP for public health surveillance
• To understand population level prescription use trends over time– Historically, used as law enforcement tool– NYC DOHMH developed key indicators to evaluate
data using the PMP• To inform data-driven initiatives

Key public health PMP indicators• Number of prescriptions, patients, prescriber,
pharmacies
• Rate of opioid analgesic prescriptions filled overall and by drug type
• Median day supply
• Rate of patients filling opioid analgesic prescriptions
• Rate of high dose opioid analgesic prescriptions filled

15% of prescribers wrote 83% of opioid analgesic prescriptions
Prescribers Prescriptions0%
10%
20%
30%
40%
50%
60%
70%
80%
90%
100%
48%
2%
37%
15%
14%
49%
1%
34%
Very Frequent Prescribers530-10,185 Rx/year
Frequent Pre-scribers50-529 Rx/year
Occasional Prescribers4-49 Rx/year
Rare Prescribers1-3 Rx/year
Prescribing frequency
Prescriptions filled by NYC residents, 2012
15%
83%
Per
cen
t
Source: New York State Department of Health, Bureau of Narcotic Enforcement, Prescription Drug Monitoring Program, 2012 62
Note: Schedule II opioid analgesics
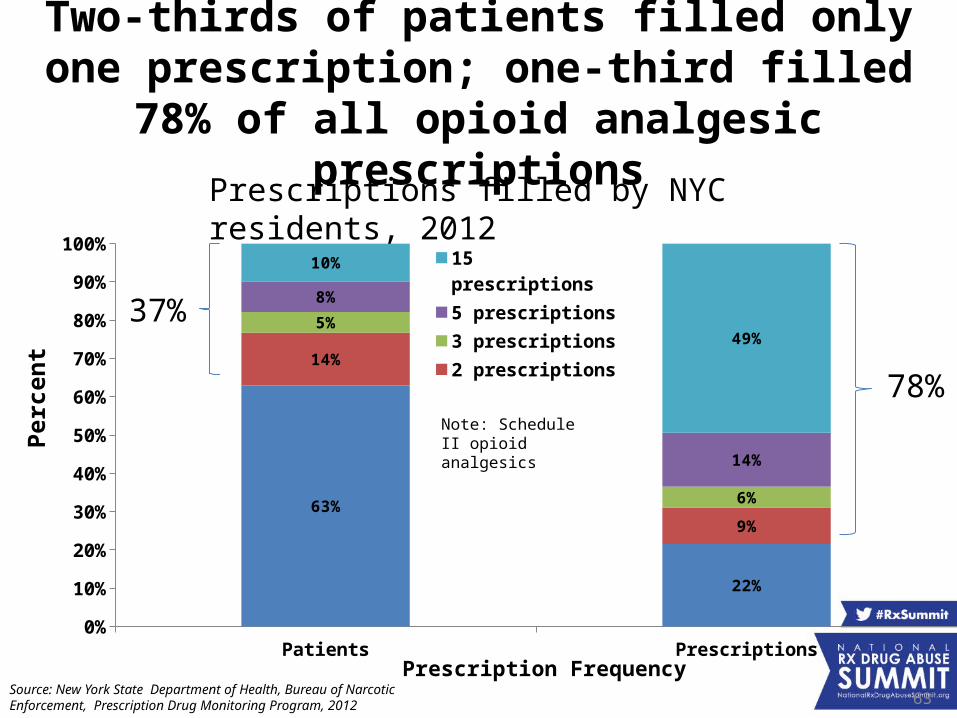
Two-thirds of patients filled only one prescription; one-third filled 78% of all opioid analgesic
prescriptions
Patients Prescriptions0%
10%
20%
30%
40%
50%
60%
70%
80%
90%
100%
63%
22%
14%
9%
5%
6%
8%
14%
10%
49%
15 prescriptions
5 prescriptions
3 prescriptions
2 prescriptions
1 prescription
Prescription Frequency
Prescriptions filled by NYC residents, 2012
Per
cen
t
Source: New York State Department of Health, Bureau of Narcotic Enforcement, Prescription Drug Monitoring Program, 2012 63
37%
78%Note: Schedule II opioid analgesics

Patients visiting multiple prescriber and multiple pharmacies are rare
• In 2012, 1.2% (9,137) of patients visited 4+ prescribers and 4+ pharmacies– Filled 7.9% (170,282) of all prescriptions– Visited 15,042 unique prescribers– Visited 2,913 unique pharmacies
Source: New York State Department of Health, Bureau of Narcotic Enforcement, Prescription Drug Monitoring Program, 2012

Oxycodone filled more than hydrocodone
NYC Bronx Brooklyn Manhattan Queens Staten Island0
50
100
150
200
250
300
350
400
450
5002013 Opioid Analgesics
2013 Oxycodone
2013 Hydrocodone
Borough of Residence
Ag
e-a
dju
ste
d r
ate
of
pre
sc
rip
tio
ns
fill
ed
p
er
1,0
00
re
sid
en
ts
Source: New York State Department of Health, Bureau of Narcotic Enforcement, Prescription Drug Monitoring Program, 2013
Note: Schedule II opioid analgesics
Rates are adjusted to 2000 US Standard population

Median day supply varies across New York City
NYC Bronx Brooklyn Manhattan Queens Staten Island0
5
10
15
20
25
30
Borough of Residence
Med
ian
Supp
ly, D
ays
Source: New York State Department of Health, Bureau of Narcotic Enforcement, Prescription Drug Monitoring Program, 2013
Note: Schedule II opioid analgesics Median day supply is calculated from day supply of each prescription filled in the year.

Staten Island residents fill more high dose opioid analgesic prescriptions
NYC Bronx Brooklyn Manhattan Queens Staten Island0
20
40
60
80
100
120
140
Borough of Residence
Ra
te o
f p
res
cri
pti
on
s f
ille
d p
er
1,0
00
re
sid
en
ts
Note: Schedule II opioid analgesics + hydrocodone
High dose is any opioid analgesic prescription with a calculated morphine equivalent dose (MED) greater than 100. Among patients receiving opioid prescriptions, overdose rates increase with increasing doses of prescribed opioids.
Source: New York State Department of Health, Bureau of Narcotic Enforcement, Prescription Drug Monitoring Program, 2013
Rates are adjusted to 2000 US Standard population

QUALITATIVE COMPONENT

Objectives of qualitative research
• In-depth understanding
• Focus on behaviors and practices
• Adds context
• Utilizes interviews and observational
techniques

Specific aims• Focus on three key areas:
- Circumstances of opioid analgesic (OA)
initiation
- Trajectory of use (including transitions to heroin)
- Mechanisms of diversion from medical to non-medical use

Enhancing surveillance using qualitative methods
• Opioid study – three key aims:- Circumstances of opioid analgesic (OA) initiation- Trajectory of use (including transitions to heroin)- Mechanisms of diversion from medical to non-
medical use
• Three-phase study included focus groups (n=5) and in-depth interviews (n=110)
• Currently analyzing data and writing up findings

Key findings from qualitative research
• Identified heterogeneous groups of opioid initiates– Recreational– Medical – Experienced opioid users
• Levels of prescribing oversight exist on a continuum
aberrant → loose → routine → judicious• Participants who transitioned to heroin were
entrenched OA users– Many new heroin initiates were not in touch with harm
reduction services

Elements of multipronged data approach
• Timely data collection• Public health population level approach to
data analysis• Qualitative data adds nuance to interpretation
of quantitative data

Summary• Public health/public safety collaborations can
work well• Continuing data access difficulties despite
collective buy-in– PMP– Treatment data
• Real-time data presents new challenges for response

DATA DRIVEN APPROACHES: STATEN ISLAND 2011–2013

Neighborhoods with high rates of OA prescriptions have high rates of unintentional (overdose) deaths
involving opioid analgesics
*Paone D, Bradley O’Brien D, Shah S, Heller D. Opioid analgesics in New York City: misuse, morbidity and mortality update. Epi Data Brief. April 2011. Available at http://www.nyc.gov/html/doh/downloads/pdf/epi/epi-data-brief.pdf .
OA PRESCRIPTION RATES OA MORTALITY RATES

Data-driven initiatives
Reduce Overdose
Deaths
MAT Access
Emergency Action Plan
Naloxone Access
Staten Island
Detailing
Overdose PreventionPrograms
Opioid Prescribing Guidelines
Media Campaigns
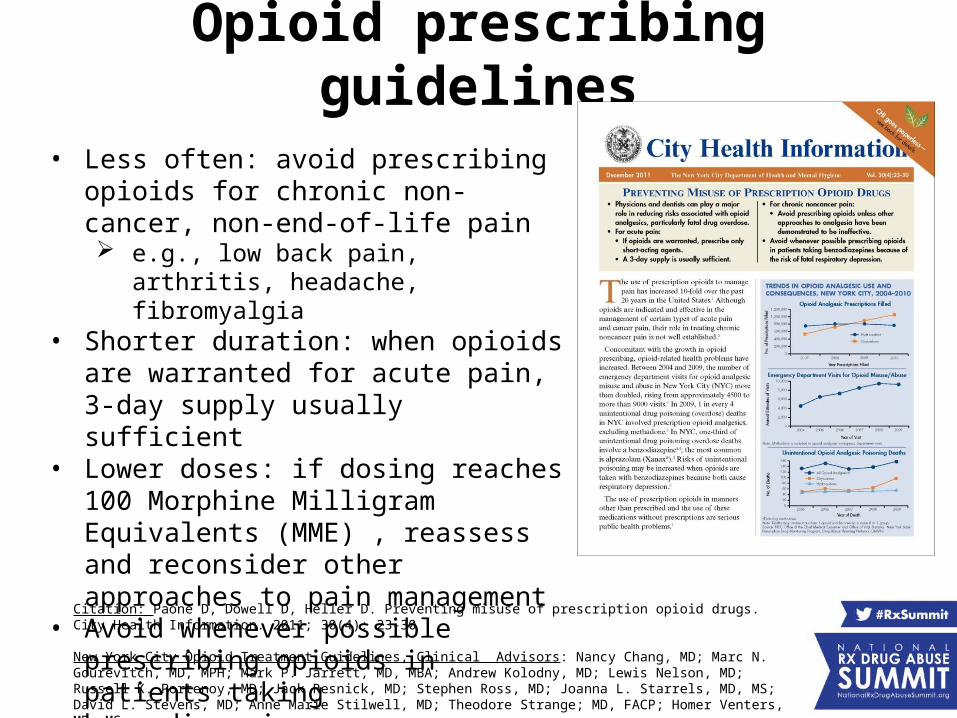
Opioid prescribing guidelines
• Less often: avoid prescribing opioids for chronic non-cancer, non-end-of-life pain e.g., low back pain, arthritis, headache,
fibromyalgia• Shorter duration: when opioids are
warranted for acute pain, 3-day supply usually sufficient
• Lower doses: if dosing reaches 100 Morphine Milligram Equivalents (MME) , reassess and reconsider other approaches to pain management
• Avoid whenever possible prescribing opioids in patients taking benzodiazepines
Citation: Paone D, Dowell D, Heller D. Preventing misuse of prescription opioid drugs. City Health Information. 2011; 30(4): 23-30
New York City Opioid Treatment Guidelines, Clinical Advisors: Nancy Chang, MD; Marc N. Gourevitch, MD, MPH; Mark P. Jarrett, MD, MBA; Andrew Kolodny, MD; Lewis Nelson, MD; Russell K. Portenoy, MD; Jack Resnick, MD; Stephen Ross, MD; Joanna L. Starrels, MD, MS; David L. Stevens, MD; Anne Marie Stilwell, MD; Theodore Strange; MD, FACP; Homer Venters, MD, MS

New York City Emergency Department Discharge Opioid Prescribing Guidelines Clinical Advisory Group: Jason Chu, MD, Brenna Farmer, MD, Beth Y. Ginsburg, MD, Stephanie H. Hernandez, MD, James F. Kenny, MD, MBA, FACEP, Nima Majlesi, DO, Ruben Olmedo, MD, Dean Olsen, DO, James G. Ryan, MD, Bonnie Simmons, DO, Mark Su, MD, Michael Touger, MD, Sage W. Wiener, MD.
Emergency Department guidelines
Released January, 2013
Adopted by 38 NYC emergency departments

Staten Island public health “Detailing” campaign
• 1-on-1 “detailing” visits from Health Department representatives
• Deliver key prescribing recommendations, clinical tools, patient education materials
• ~1,000 Staten Island physicians, nurse practitioners, physicians assistants
• June–August 2013


Morphine Milligram Equivalent (MME) calculator
• A tool to calculate total MME per day• Gives alert for dosages >100 MME• Quick and easy to use• Web-based application
– Search for “NYC MME Calculator”http://www.nyc.gov/html/doh/html/mental/MME.html
• Smartphone app

Media campaigns• Campaign One:
– Goal: Increase awareness of risk of opioid analgesic overdose
– Ran twice (2012, 2013)
• Campaign Two: – Goal: Reduce stigma and raise awareness of opioid analgesic misuse– 2 testimonials
• Mom lost son to opioid analgesic overdose• NYC resident in recovery
– Ran 2013 and 2014

Staten Island opioid-analgesic poisoning mortality decreased 29% from 2011 to 2013
0.0
2.0
4.0
6.0
8.0
10.0
12.0Staten Island All other boroughs
Ag
e-A
dju
ste
d R
ate
pe
r 1
00
,00
0 12 3 4 5
67
891. May 2011: EDB: Staten Island mortality and PMP analyses highlighted
2. November 2011: CHI: opioid prescribing guidelines3. August 2012: I-STOP passed4. Late 2012 and 2013: media campaign 15. January 2013: ED opioid prescribing guidelines6. June 2013: NYC COH Staten Island town hall7. June-August 2013: Staten Island detailing campaign8. August 2013: I-STOP in effect9. Late 2013 and 2014: media campaign 2
Source: New York City Office of the Chief Medical Examiner & New York City Department of Health and Mental Hygiene 2000-2013

Rates of high dose prescriptions filled decreased in Staten Island by 9%
NYC Bronx Brooklyn Manhattan Queens Staten Island0
20
40
60
80
100
120
140
160
2012 2013
Borough of Residence
Ra
te o
f p
res
cri
pti
on
s f
ille
d p
er
1,0
00
re
s-id
en
ts
Note: Schedule II opioid analgesics + hydrocodone
High dose is any opioid analgesic prescription with a calculated morphine equivalent dose (MED) greater than 100. Among patients receiving opioid prescriptions, overdose rates increase with increasing doses of prescribed opioids.
Source: New York State Department of Health, Bureau of Narcotic Enforcement, Prescription Drug Monitoring Program, 2012 and 2013
Rates are adjusted to 2000 US Standard population

OVERDOSE (OD) PREVENTION: NALOXONE

Overdose education and naloxone distribution
• 2006: New York State law enables lay people to train to respond to an overdose and administer naloxone
• 2011: New York State Good Samaritan Law• 2014: Standing order legislation:
– Allow for individuals other than MDs, PAs, and NPs to dispense a medication requiring a prescription
• 61 registered overdose prevention programs in NYC
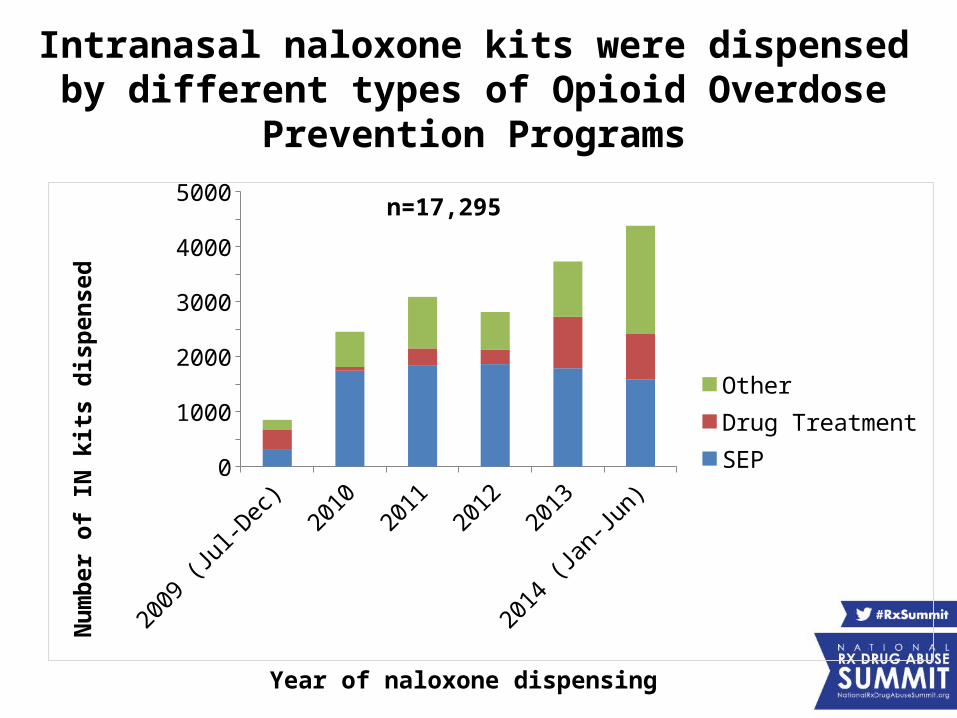
Intranasal naloxone kits were dispensed by different types of Opioid Overdose Prevention Programs
2009 (Jul-D
ec)2010
20112012
2013
2014 (Jan-Ju
n)0
500100015002000250030003500400045005000
OtherDrug TreatmentSEP
Nu
mb
er o
f IN
kit
s d
isp
ense
d
n=17,295
Year of naloxone dispensing

Naloxone distribution in NYC• NYC Department of Homeless Services (DHS)
– More than half DHS Peace Officers are trained and carry naloxone in all city shelters
• NYC Department of Corrections– Rikers Island Visit House
• NYPD – NYPD officers trained to carry and dispense naloxone– Started as pilot in response to high opioid overdose
rates in Staten Island

Summary• Opioid overdose deaths are preventable • RxStat is a collaboration between NYC public health
and public safety toward one unifying goal: Reduce overdose deaths in NYC
• Population level approach addresses overall risk factors– Doctor shopping is a rare event– Important to use PMP metrics that can be applied across a
jurisdiction• Multi-pronged data driven approaches have
demonstrated success– Measurable and replicable
Trending Topics Track:Data-Driven Trends
Presenters:• John Carnevale, Carnevale Associates, LLC• Sherry L. Green, Sherry L. Green & Associates,
LLC• Denise Paone, New York City Department of
Health and Mental Hygiene• Ellenie Tuazon, New York City Department of
Health and Mental Hygiene
Moderator: Nancy Hale, Operation UNITE