ryanair holdings plc company report§alves.m_2018.pdf · we are bullish on the stock with a target...
TRANSCRIPT
THIS REPORT WAS PREPARED EXCLUSIVELY FOR ACADEMIC PURPOSES BY MANUEL GONÇALVES, A MASTERS IN FINANCE STUDENT OF
THE NOVA SCHOOL OF BUSINESS AND ECONOMICS. THE REPORT WAS SUPERVISED BY A NOVA SBE FACULTY MEMBER, ACTING IN A
MERE ACADEMIC CAPACITY, WHO REVIEWED THE VALUATION METHODOLOGY AND THE FINANCIAL MODEL. (PLEASE REFER TO THE DISCLOSURES AND DISCLAIMERS AT END OF THE DOCUMENT)
Page 1/28
MASTERS IN FINANCE
▪ Ryanair is our preferred structural play in the European
airline sector. We are bullish on LCCs penetration in Europe to be
50% by the end of the decade.
▪ Recent headwinds related to pilot strikes and flight
cancellations provide an attractive entry point for equity investors.
We disregard brand awareness as long as Ryanair keeps
providing the lowest fares in the market.
▪ Strong economic momentum should boost air travel
demand - strongly related to GDP, according to our findings.
▪ Amid industry consolidation, the company can leverage
market share in countries where its seat overlap with distressed
carriers is high.
▪ By focusing on the digital, the company will boost
ancillary revenues and may bring the case of multiple expansion to
the table.
▪ We are bullish on the stock with a target price of €23.18,
representing a 1-year upside potential of 59%.
Company description
Ryanair Holdings plc is a Low-Cost Carrier (LCC) founded in 1984
by Christopher Ryan, Liam Lonergan and Tony Ryan.
Headquartered in Dublin, Ireland, Ryanair is currently the largest
European airline, carrying over 120 million passengers per year.
RYANAIR HOLDINGS PLC COMPANY REPORT
LOW COST AIRLINES 03 JANUARY 2018
STUDENT: MANUEL GONÇALVES [email protected]
Ryanair still flying high
Getting ahead of labour turbulence
Recommendation: BUY
Price Target FY17: 23.18 €
Price (as of 3-Jan-18) 15.36 €
Reuters: RYA.I, Bloomberg: RYA.ID
52-week range (€) 13.3-19.78
Market Cap (€m) 17,796.14
Outstanding Shares (m) 1,182.86
Other (…)
Source:
Source: Bloomberg
(Values in € millions) 2016 2017E 2018F
Revenues 6647.8 6883.6 7633.1
EBITDA 2030.8 2127.6 2313.4
EBITDA Margin 31% 31% 30%
Net Profit 1315.9 1340.1 1476.9
EPS 1.05 1.07 1.18
P/E 14 15.3 16
ROIC Adj. 28% 24% 26%
Invested Capital Adj. 4290.4 5116.5 5295.1
Profit Pax 12.8 12.2 12.4
Source: Ryanair 2017 Annual Report and Estimates
RYANAIR HOLDINGS PLC COMPANY REPORT
PAGE 2/28
Table of Contents
Company Overview ...................................... Error! Bookmark not defined.
Company Description ...................................... Error! Bookmark not defined.
Business Strategy .............................................................................................. 4
Shareholder Structure ....................................................................................... 5
Business Structure ............................................................................................. 6
Recent Developments ............................................................................. 9
The Labour “Crisis” ............................................................................................ 9
Going Digital...................................................................................................... 10
The Sector ..............................................................................................11
Comparables ..................................................................................................... 13
▪ Relative Valuation ...................................................................... 14
Macroeconomic Environment ......................................................................... 15
Valuation .................................................................................................17
Revenue Drives ................................................................................................ 17
▪ Scheduled ................................................................................... 17
▪ Ancillary ....................................................................................... 18
Cost Structure ................................................................................................... 18
Cost of Capital .................................................................................................. 21
Discounted Cash Flow Analysis ..................................................................... 22
Sensitivity Analysis .......................................................................................... 23
Appendix ................................................................................................24
RYANAIR HOLDINGS PLC COMPANY REPORT
PAGE 3/28
Company overview
Ryanair Holdings plc is a Low-Cost Carrier (LCC) founded in 1984 by Christopher
Ryan, Liam Lonergan and Tony Ryan. Headquartered in Dublin, Ireland, Ryanair
is currently the largest European airline, carrying over 120 million passengers per
year.
Company description
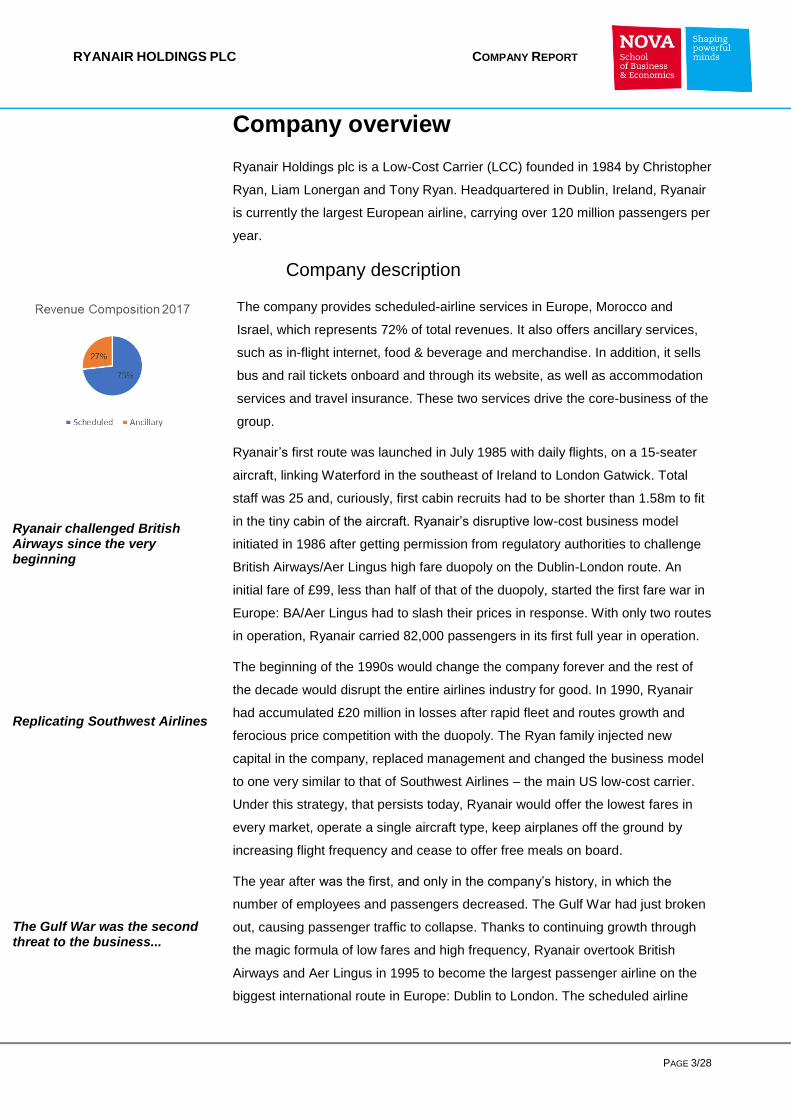
The company provides scheduled-airline services in Europe, Morocco and
Israel, which represents 72% of total revenues. It also offers ancillary services,
such as in-flight internet, food & beverage and merchandise. In addition, it sells
bus and rail tickets onboard and through its website, as well as accommodation
services and travel insurance. These two services drive the core-business of the
group.
Ryanair’s first route was launched in July 1985 with daily flights, on a 15-seater
aircraft, linking Waterford in the southeast of Ireland to London Gatwick. Total
staff was 25 and, curiously, first cabin recruits had to be shorter than 1.58m to fit
in the tiny cabin of the aircraft. Ryanair’s disruptive low-cost business model
initiated in 1986 after getting permission from regulatory authorities to challenge
British Airways/Aer Lingus high fare duopoly on the Dublin-London route. An
initial fare of £99, less than half of that of the duopoly, started the first fare war in
Europe: BA/Aer Lingus had to slash their prices in response. With only two routes
in operation, Ryanair carried 82,000 passengers in its first full year in operation.
The beginning of the 1990s would change the company forever and the rest of
the decade would disrupt the entire airlines industry for good. In 1990, Ryanair
had accumulated £20 million in losses after rapid fleet and routes growth and
ferocious price competition with the duopoly. The Ryan family injected new
capital in the company, replaced management and changed the business model
to one very similar to that of Southwest Airlines – the main US low-cost carrier.
Under this strategy, that persists today, Ryanair would offer the lowest fares in
every market, operate a single aircraft type, keep airplanes off the ground by
increasing flight frequency and cease to offer free meals on board.
The year after was the first, and only in the company’s history, in which the
number of employees and passengers decreased. The Gulf War had just broken
out, causing passenger traffic to collapse. Thanks to continuing growth through
the magic formula of low fares and high frequency, Ryanair overtook British
Airways and Aer Lingus in 1995 to become the largest passenger airline on the
biggest international route in Europe: Dublin to London. The scheduled airline
The Gulf War was the second threat to the business...
Ryanair challenged British Airways since the very beginning
Replicating Southwest Airlines
RYANAIR HOLDINGS PLC COMPANY REPORT
PAGE 4/28
business consummated its disruption in 1996, when the European Union
completed the “Open Skies” deregulation, enabling LCCs to freely compete in
routes and prices with Legacy Carriers.
In 1997, Ryanair goes public for the first time being quoted on the Dublin and
NASDAQ stock exchanges and, in 2000, launches Europe’s largest booking
website. This allowed customers to acquire other services such as low-cost
accommodation and car hire, travel insurance or rail tickets. In just three months,
the company started to register 50,000 online bookings per week.
A second airport base in Continental Europe, after Brussels, was launched in
2002 - in Frankfurt Hahn - bringing an end, after disputes in Germany Courts, to
the high fare monopoly of the Legacy Carrier Lufthansa. Also, the company
announced a long-term partnership with Boeing which would translate into the
acquisition of more than 150 new Boeing 737-800 until 2010.
Passenger growth continued to boom, and Ryanair was named number 1 in
customer service, beating all European airlines for least lost bags, fewer
cancellations and best punctuality. As of today, the company operates a fleet of
over 400 aircrafts used in more than 2,000 daily flights, employs over 13,000
skilled professionals, provides scheduled services to more than 120 million
passengers a year and connects 33 countries. Ryanair has faced some
headwinds recently, related to pilot strikes, who demand a higher pay, and a
decline in customer satisfaction. About 700,000 customers were affected by flight
cancellations.
Business strategy
Ryanair inspired its core strategy on the operational model of the most successful
discounter of all time – the Dallas-based Southwest Airlines. The company has a
strong focus on cost savings and operating efficiencies, and combines it with
aggressive fare promotions and marketing to stimulate demand.
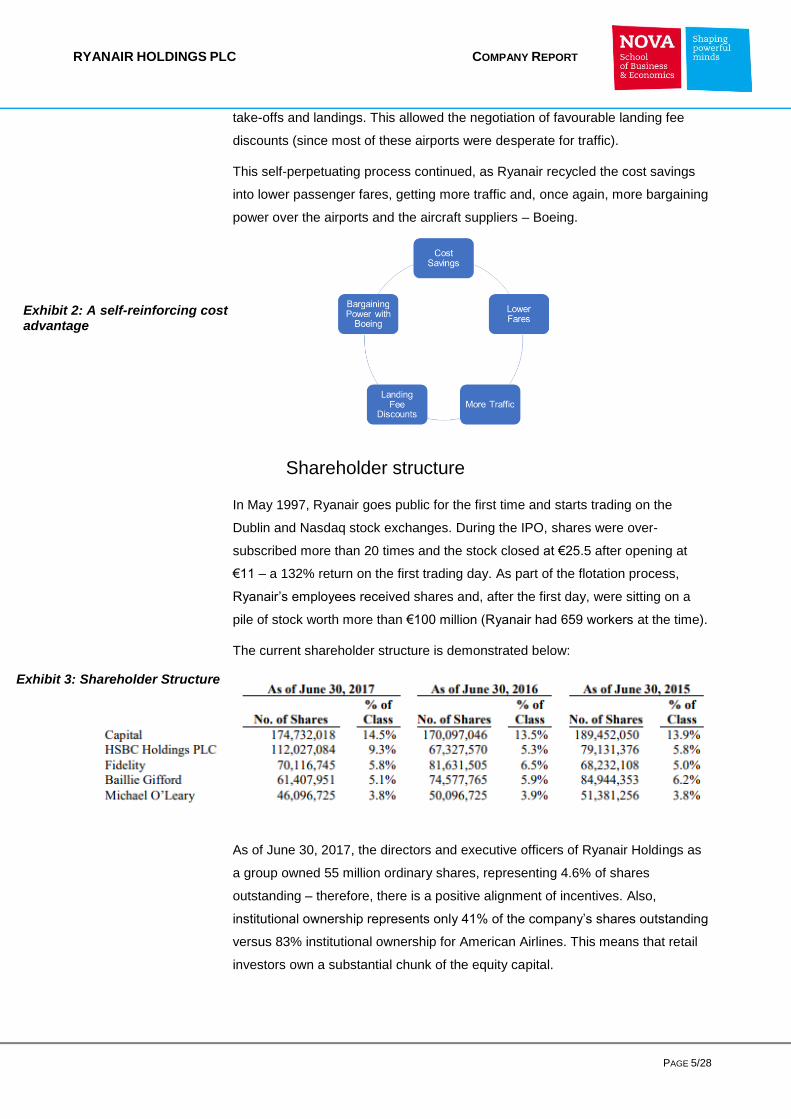
Over the last decade, they have shown great bargaining power over its
stakeholders because of “a self-reinforcing cost advantage” that continuously
fosters lower unit costs. By operating a single aircraft model – Boeing 737-800 –
Ryanair could significantly reduce training costs and achieve speedier repairs,
compared to other airlines. Also, they often ordered aircrafts in bulk from Boeing,
getting huge price discounts. By operating a single class and unassigned seating,
they could accelerate onboarding and through a no-meal policy, the company
could decrease time-consuming clean-up. The strategy, mostly in the beginning,
was also to concentrate on uncongested, secondary airports to enable faster
Going Public
Ryanair Today
Challenging Lufthansa
RYANAIR HOLDINGS PLC COMPANY REPORT
PAGE 5/28
take-offs and landings. This allowed the negotiation of favourable landing fee
discounts (since most of these airports were desperate for traffic).
This self-perpetuating process continued, as Ryanair recycled the cost savings
into lower passenger fares, getting more traffic and, once again, more bargaining
power over the airports and the aircraft suppliers – Boeing.
Shareholder structure
In May 1997, Ryanair goes public for the first time and starts trading on the
Dublin and Nasdaq stock exchanges. During the IPO, shares were over-
subscribed more than 20 times and the stock closed at €25.5 after opening at
€11 – a 132% return on the first trading day. As part of the flotation process,
Ryanair’s employees received shares and, after the first day, were sitting on a
pile of stock worth more than €100 million (Ryanair had 659 workers at the time).
The current shareholder structure is demonstrated below:
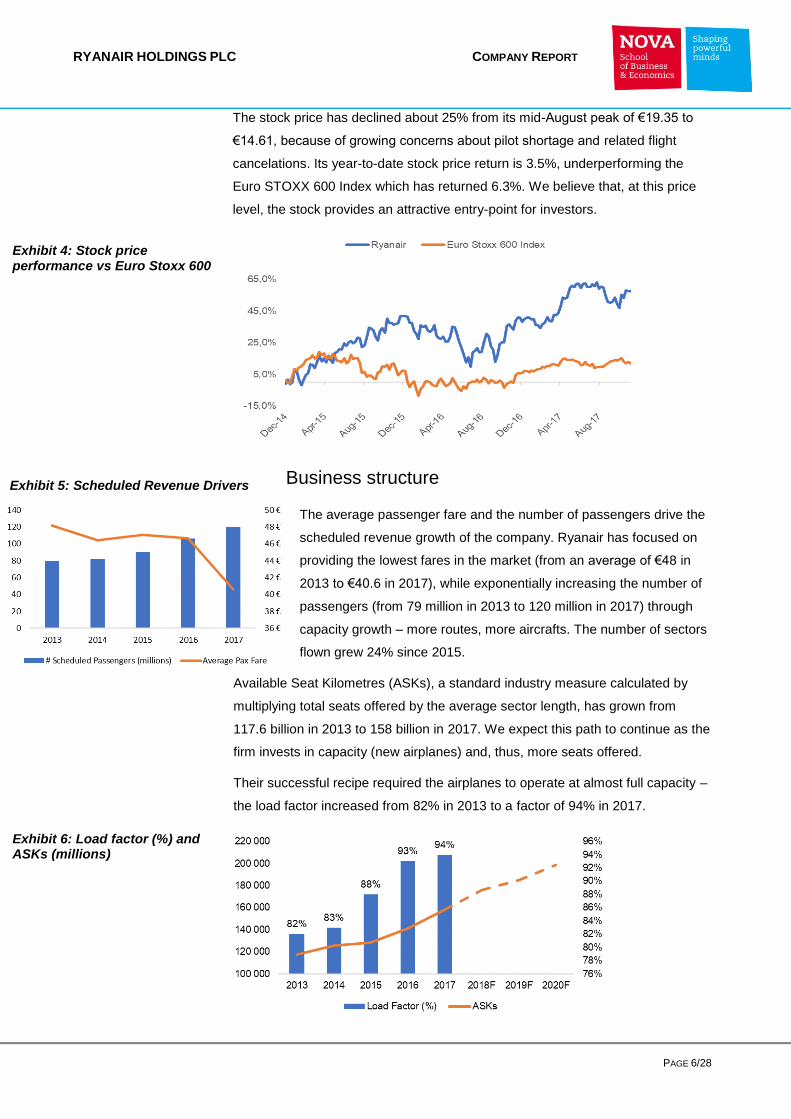
As of June 30, 2017, the directors and executive officers of Ryanair Holdings as
a group owned 55 million ordinary shares, representing 4.6% of shares
outstanding – therefore, there is a positive alignment of incentives. Also,
institutional ownership represents only 41% of the company’s shares outstanding
versus 83% institutional ownership for American Airlines. This means that retail
investors own a substantial chunk of the equity capital.
Exhibit 2: A self-reinforcing cost advantage
Exhibit 3: Shareholder Structure
RYANAIR HOLDINGS PLC COMPANY REPORT
PAGE 6/28
The stock price has declined about 25% from its mid-August peak of €19.35 to
€14.61, because of growing concerns about pilot shortage and related flight
cancelations. Its year-to-date stock price return is 3.5%, underperforming the
Euro STOXX 600 Index which has returned 6.3%. We believe that, at this price
level, the stock provides an attractive entry-point for investors.
Business structure
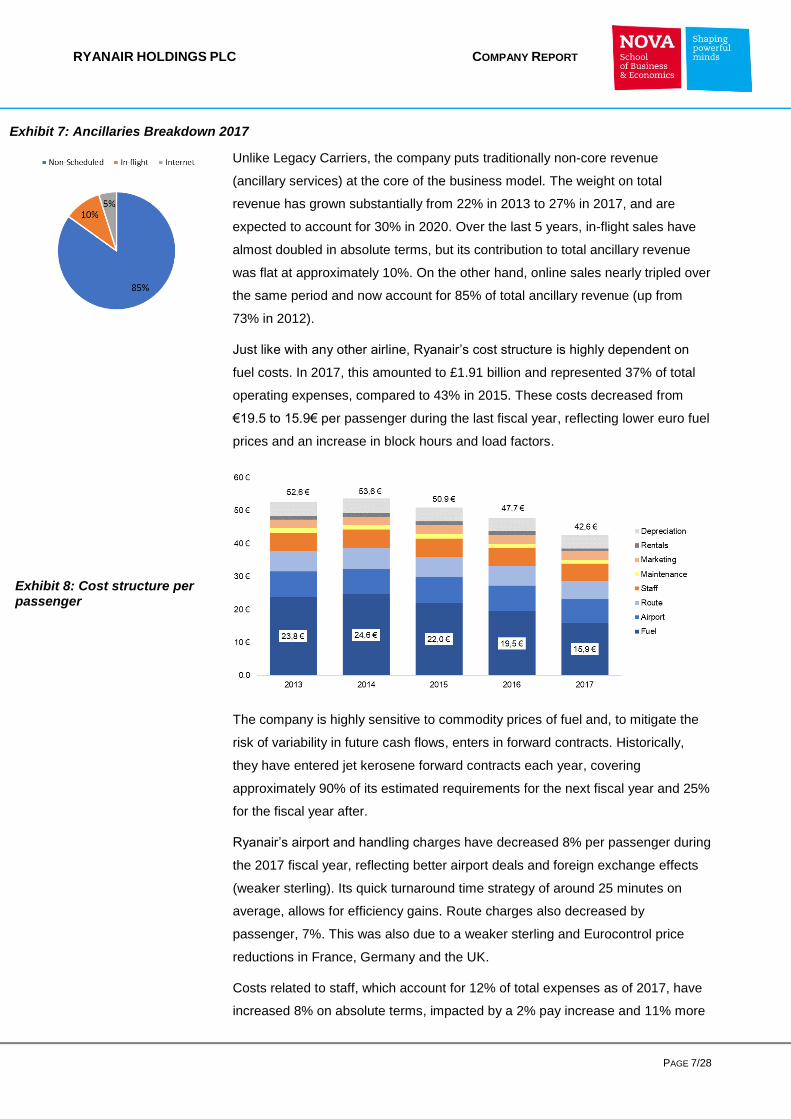
The average passenger fare and the number of passengers drive the
scheduled revenue growth of the company. Ryanair has focused on
providing the lowest fares in the market (from an average of €48 in
2013 to €40.6 in 2017), while exponentially increasing the number of
passengers (from 79 million in 2013 to 120 million in 2017) through
capacity growth – more routes, more aircrafts. The number of sectors
flown grew 24% since 2015.
Available Seat Kilometres (ASKs), a standard industry measure calculated by
multiplying total seats offered by the average sector length, has grown from
117.6 billion in 2013 to 158 billion in 2017. We expect this path to continue as the
firm invests in capacity (new airplanes) and, thus, more seats offered.
Their successful recipe required the airplanes to operate at almost full capacity –
the load factor increased from 82% in 2013 to a factor of 94% in 2017.
Exhibit 4: Stock price performance vs Euro Stoxx 600
Exhibit 5: Scheduled Revenue Drivers
Exhibit 6: Load factor (%) and ASKs (millions)
RYANAIR HOLDINGS PLC COMPANY REPORT
PAGE 7/28
Exhibit 7: Ancillaries Breakdown 2017
Unlike Legacy Carriers, the company puts traditionally non-core revenue
(ancillary services) at the core of the business model. The weight on total
revenue has grown substantially from 22% in 2013 to 27% in 2017, and are
expected to account for 30% in 2020. Over the last 5 years, in-flight sales have
almost doubled in absolute terms, but its contribution to total ancillary revenue
was flat at approximately 10%. On the other hand, online sales nearly tripled over
the same period and now account for 85% of total ancillary revenue (up from
73% in 2012).
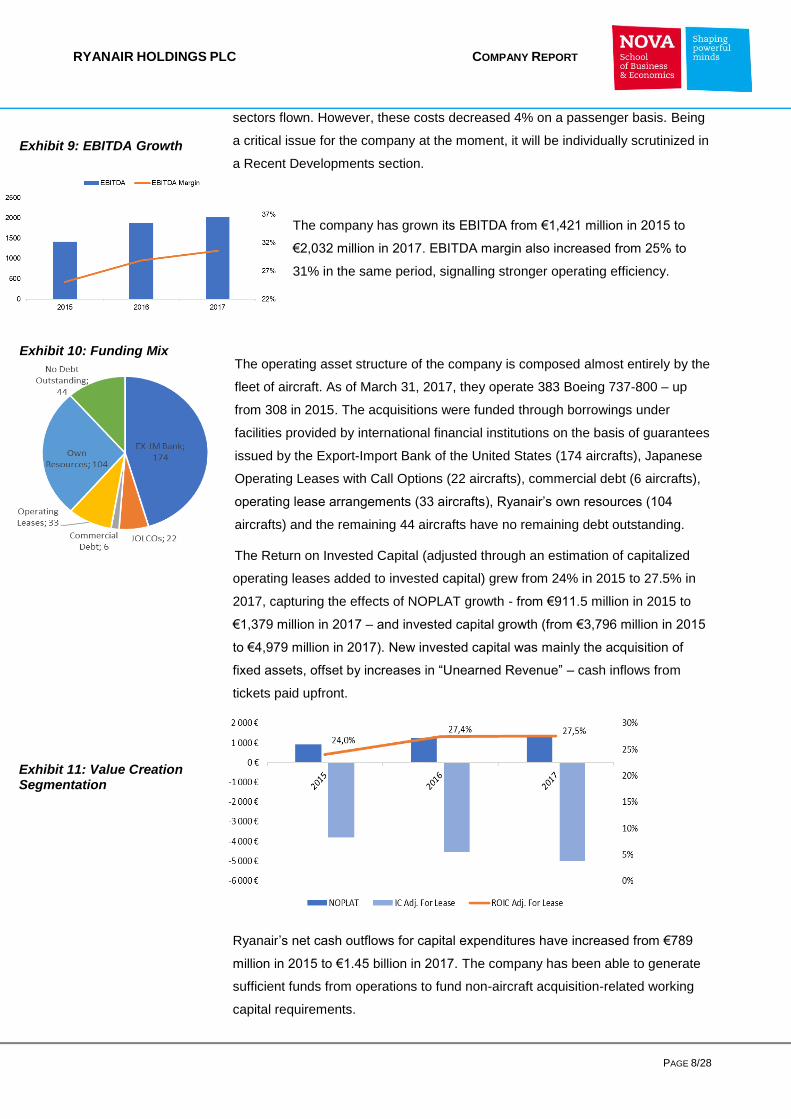
Just like with any other airline, Ryanair’s cost structure is highly dependent on
fuel costs. In 2017, this amounted to £1.91 billion and represented 37% of total
operating expenses, compared to 43% in 2015. These costs decreased from
€19.5 to 15.9€ per passenger during the last fiscal year, reflecting lower euro fuel
prices and an increase in block hours and load factors.
The company is highly sensitive to commodity prices of fuel and, to mitigate the
risk of variability in future cash flows, enters in forward contracts. Historically,
they have entered jet kerosene forward contracts each year, covering
approximately 90% of its estimated requirements for the next fiscal year and 25%
for the fiscal year after.
Ryanair’s airport and handling charges have decreased 8% per passenger during
the 2017 fiscal year, reflecting better airport deals and foreign exchange effects
(weaker sterling). Its quick turnaround time strategy of around 25 minutes on
average, allows for efficiency gains. Route charges also decreased by
passenger, 7%. This was also due to a weaker sterling and Eurocontrol price
reductions in France, Germany and the UK.
Costs related to staff, which account for 12% of total expenses as of 2017, have
increased 8% on absolute terms, impacted by a 2% pay increase and 11% more
Exhibit 8: Cost structure per passenger
RYANAIR HOLDINGS PLC COMPANY REPORT
PAGE 8/28
sectors flown. However, these costs decreased 4% on a passenger basis. Being
a critical issue for the company at the moment, it will be individually scrutinized in
a Recent Developments section.
The company has grown its EBITDA from €1,421 million in 2015 to
€2,032 million in 2017. EBITDA margin also increased from 25% to
31% in the same period, signalling stronger operating efficiency.
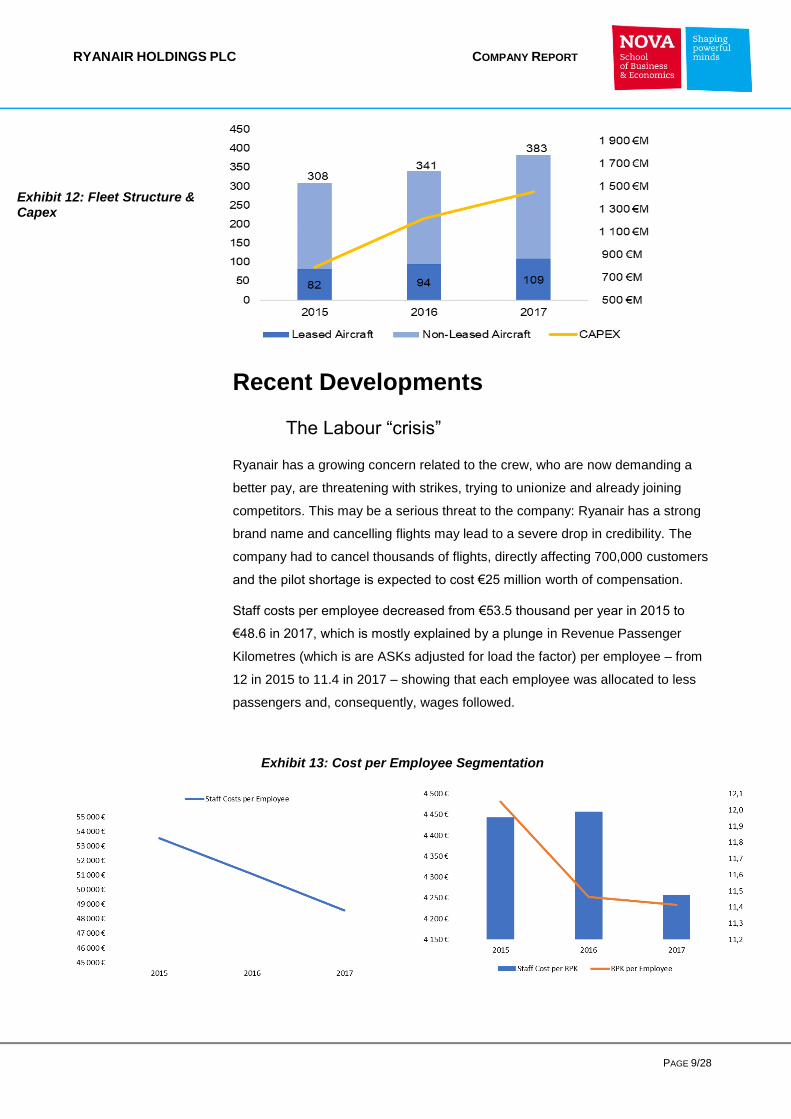
The operating asset structure of the company is composed almost entirely by the
fleet of aircraft. As of March 31, 2017, they operate 383 Boeing 737-800 – up
from 308 in 2015. The acquisitions were funded through borrowings under
facilities provided by international financial institutions on the basis of guarantees
issued by the Export-Import Bank of the United States (174 aircrafts), Japanese
Operating Leases with Call Options (22 aircrafts), commercial debt (6 aircrafts),
operating lease arrangements (33 aircrafts), Ryanair’s own resources (104
aircrafts) and the remaining 44 aircrafts have no remaining debt outstanding.
The Return on Invested Capital (adjusted through an estimation of capitalized
operating leases added to invested capital) grew from 24% in 2015 to 27.5% in
2017, capturing the effects of NOPLAT growth - from €911.5 million in 2015 to
€1,379 million in 2017 – and invested capital growth (from €3,796 million in 2015
to €4,979 million in 2017). New invested capital was mainly the acquisition of
fixed assets, offset by increases in “Unearned Revenue” – cash inflows from
tickets paid upfront.
Ryanair’s net cash outflows for capital expenditures have increased from €789
million in 2015 to €1.45 billion in 2017. The company has been able to generate
sufficient funds from operations to fund non-aircraft acquisition-related working
capital requirements.
Exhibit 9: EBITDA Growth
Exhibit 10: Funding Mix
Exhibit 11: Value Creation Segmentation
RYANAIR HOLDINGS PLC COMPANY REPORT
PAGE 9/28
Recent Developments
The Labour “crisis”
Ryanair has a growing concern related to the crew, who are now demanding a
better pay, are threatening with strikes, trying to unionize and already joining
competitors. This may be a serious threat to the company: Ryanair has a strong
brand name and cancelling flights may lead to a severe drop in credibility. The
company had to cancel thousands of flights, directly affecting 700,000 customers
and the pilot shortage is expected to cost €25 million worth of compensation.
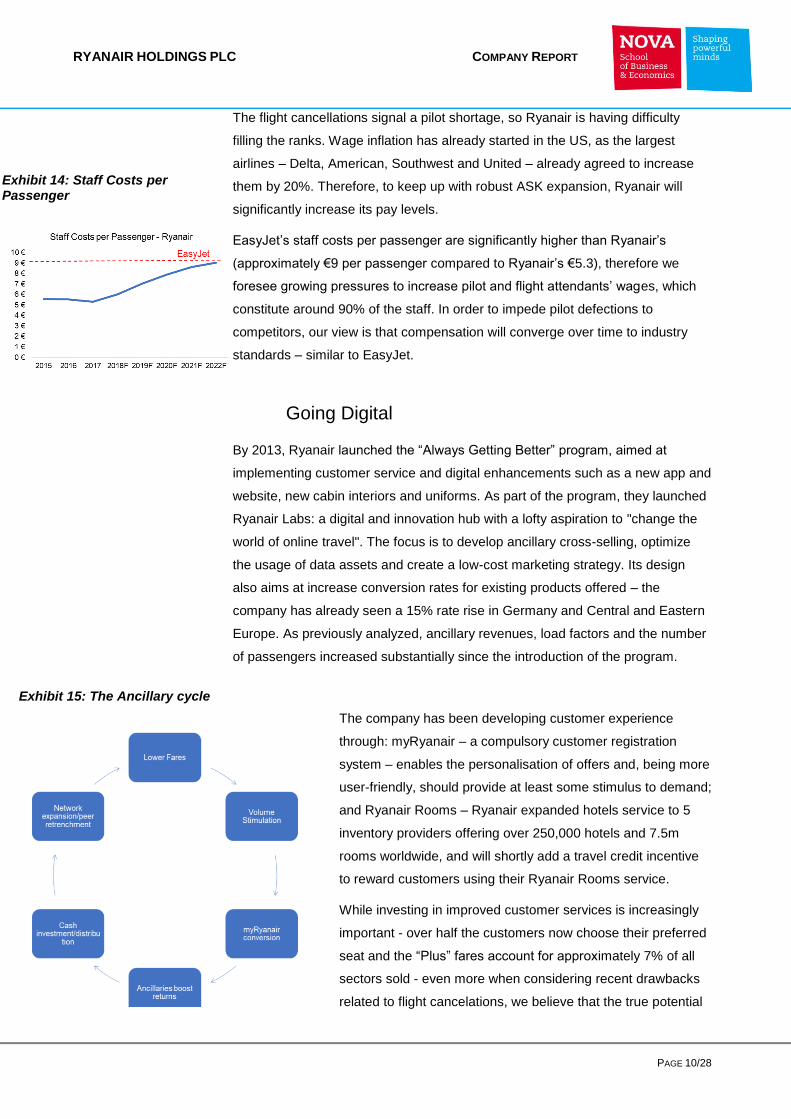
Staff costs per employee decreased from €53.5 thousand per year in 2015 to
€48.6 in 2017, which is mostly explained by a plunge in Revenue Passenger
Kilometres (which is are ASKs adjusted for load the factor) per employee – from
12 in 2015 to 11.4 in 2017 – showing that each employee was allocated to less
passengers and, consequently, wages followed.
Exhibit 12: Fleet Structure & Capex
Exhibit 13: Cost per Employee Segmentation
RYANAIR HOLDINGS PLC COMPANY REPORT
PAGE 10/28
The flight cancellations signal a pilot shortage, so Ryanair is having difficulty
filling the ranks. Wage inflation has already started in the US, as the largest
airlines – Delta, American, Southwest and United – already agreed to increase
them by 20%. Therefore, to keep up with robust ASK expansion, Ryanair will
significantly increase its pay levels.
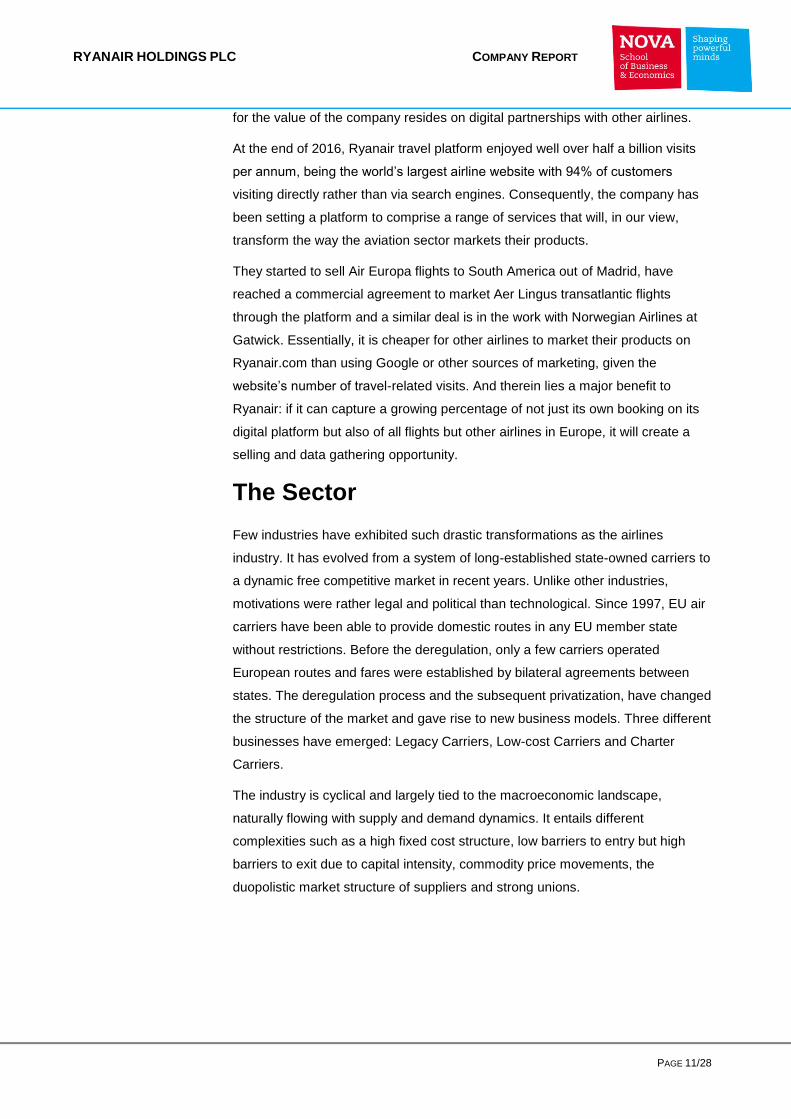
EasyJet’s staff costs per passenger are significantly higher than Ryanair’s
(approximately €9 per passenger compared to Ryanair’s €5.3), therefore we
foresee growing pressures to increase pilot and flight attendants’ wages, which
constitute around 90% of the staff. In order to impede pilot defections to
competitors, our view is that compensation will converge over time to industry
standards – similar to EasyJet.
Going Digital
By 2013, Ryanair launched the “Always Getting Better” program, aimed at
implementing customer service and digital enhancements such as a new app and
website, new cabin interiors and uniforms. As part of the program, they launched
Ryanair Labs: a digital and innovation hub with a lofty aspiration to "change the
world of online travel". The focus is to develop ancillary cross-selling, optimize
the usage of data assets and create a low-cost marketing strategy. Its design
also aims at increase conversion rates for existing products offered – the
company has already seen a 15% rate rise in Germany and Central and Eastern
Europe. As previously analyzed, ancillary revenues, load factors and the number
of passengers increased substantially since the introduction of the program.
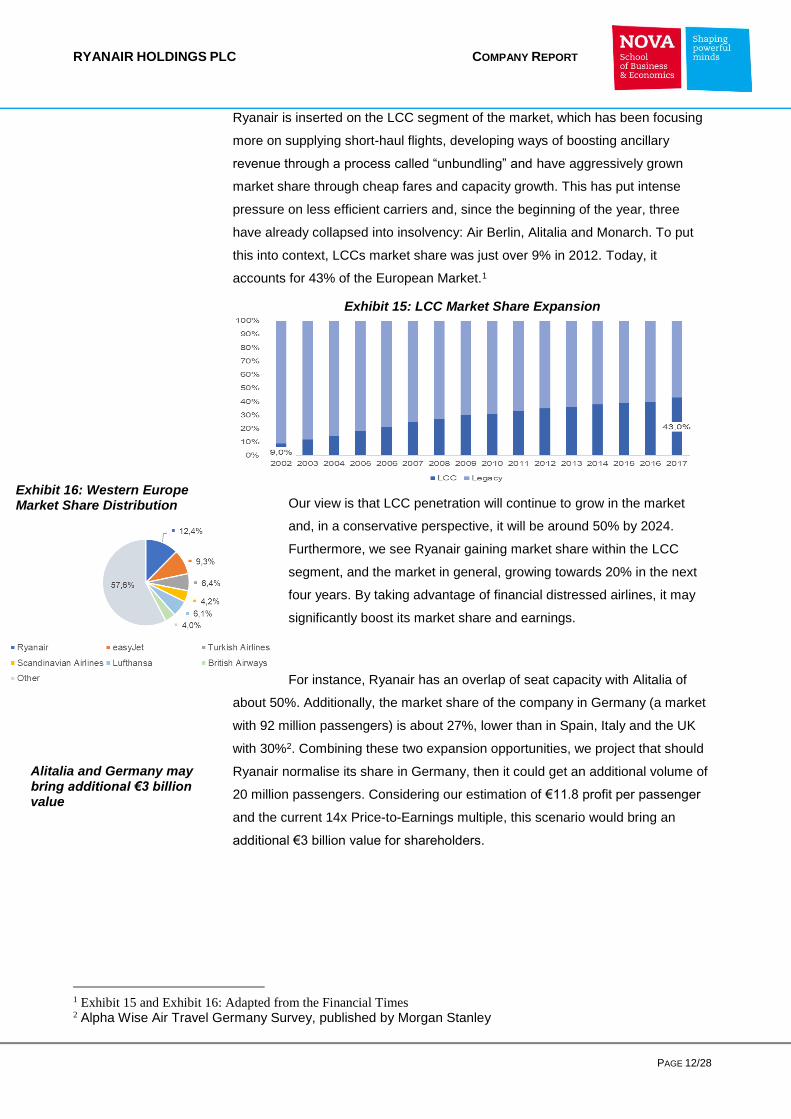
The company has been developing customer experience
through: myRyanair – a compulsory customer registration
system – enables the personalisation of offers and, being more
user-friendly, should provide at least some stimulus to demand;
and Ryanair Rooms – Ryanair expanded hotels service to 5
inventory providers offering over 250,000 hotels and 7.5m
rooms worldwide, and will shortly add a travel credit incentive
to reward customers using their Ryanair Rooms service.
While investing in improved customer services is increasingly
important - over half the customers now choose their preferred
seat and the “Plus” fares account for approximately 7% of all
sectors sold - even more when considering recent drawbacks
related to flight cancelations, we believe that the true potential
Exhibit 14: Staff Costs per Passenger
Exhibit 15: The Ancillary cycle
RYANAIR HOLDINGS PLC COMPANY REPORT
PAGE 11/28
for the value of the company resides on digital partnerships with other airlines.
At the end of 2016, Ryanair travel platform enjoyed well over half a billion visits
per annum, being the world’s largest airline website with 94% of customers
visiting directly rather than via search engines. Consequently, the company has
been setting a platform to comprise a range of services that will, in our view,
transform the way the aviation sector markets their products.
They started to sell Air Europa flights to South America out of Madrid, have
reached a commercial agreement to market Aer Lingus transatlantic flights
through the platform and a similar deal is in the work with Norwegian Airlines at
Gatwick. Essentially, it is cheaper for other airlines to market their products on
Ryanair.com than using Google or other sources of marketing, given the
website’s number of travel-related visits. And therein lies a major benefit to
Ryanair: if it can capture a growing percentage of not just its own booking on its
digital platform but also of all flights but other airlines in Europe, it will create a
selling and data gathering opportunity.
The Sector
Few industries have exhibited such drastic transformations as the airlines
industry. It has evolved from a system of long-established state-owned carriers to
a dynamic free competitive market in recent years. Unlike other industries,
motivations were rather legal and political than technological. Since 1997, EU air
carriers have been able to provide domestic routes in any EU member state
without restrictions. Before the deregulation, only a few carriers operated
European routes and fares were established by bilateral agreements between
states. The deregulation process and the subsequent privatization, have changed
the structure of the market and gave rise to new business models. Three different
businesses have emerged: Legacy Carriers, Low-cost Carriers and Charter
Carriers.
The industry is cyclical and largely tied to the macroeconomic landscape,
naturally flowing with supply and demand dynamics. It entails different
complexities such as a high fixed cost structure, low barriers to entry but high
barriers to exit due to capital intensity, commodity price movements, the
duopolistic market structure of suppliers and strong unions.
RYANAIR HOLDINGS PLC COMPANY REPORT
PAGE 12/28
Ryanair is inserted on the LCC segment of the market, which has been focusing
more on supplying short-haul flights, developing ways of boosting ancillary
revenue through a process called “unbundling” and have aggressively grown
market share through cheap fares and capacity growth. This has put intense
pressure on less efficient carriers and, since the beginning of the year, three
have already collapsed into insolvency: Air Berlin, Alitalia and Monarch. To put
this into context, LCCs market share was just over 9% in 2012. Today, it
accounts for 43% of the European Market.1
Our view is that LCC penetration will continue to grow in the market
and, in a conservative perspective, it will be around 50% by 2024.
Furthermore, we see Ryanair gaining market share within the LCC
segment, and the market in general, growing towards 20% in the next
four years. By taking advantage of financial distressed airlines, it may
significantly boost its market share and earnings.
For instance, Ryanair has an overlap of seat capacity with Alitalia of
about 50%. Additionally, the market share of the company in Germany (a market
with 92 million passengers) is about 27%, lower than in Spain, Italy and the UK
with 30%2. Combining these two expansion opportunities, we project that should
Ryanair normalise its share in Germany, then it could get an additional volume of
20 million passengers. Considering our estimation of €11.8 profit per passenger
and the current 14x Price-to-Earnings multiple, this scenario would bring an
additional €3 billion value for shareholders.
1 Exhibit 15 and Exhibit 16: Adapted from the Financial Times 2 Alpha Wise Air Travel Germany Survey, published by Morgan Stanley
Alitalia and Germany may bring additional €3 billion value
Exhibit 15: LCC Market Share Expansion
Exhibit 16: Western Europe Market Share Distribution
RYANAIR HOLDINGS PLC COMPANY REPORT
PAGE 13/28
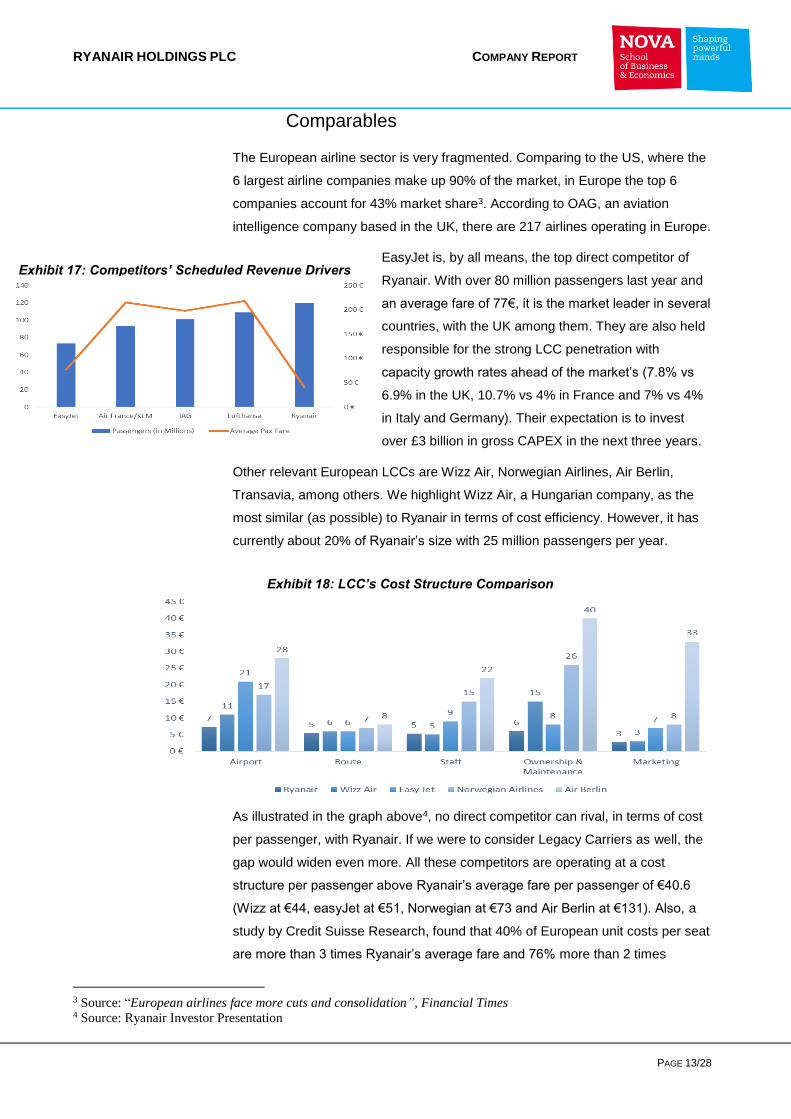
Comparables
The European airline sector is very fragmented. Comparing to the US, where the
6 largest airline companies make up 90% of the market, in Europe the top 6
companies account for 43% market share3. According to OAG, an aviation
intelligence company based in the UK, there are 217 airlines operating in Europe.
EasyJet is, by all means, the top direct competitor of
Ryanair. With over 80 million passengers last year and
an average fare of 77€, it is the market leader in several
countries, with the UK among them. They are also held
responsible for the strong LCC penetration with
capacity growth rates ahead of the market’s (7.8% vs
6.9% in the UK, 10.7% vs 4% in France and 7% vs 4%
in Italy and Germany). Their expectation is to invest
over £3 billion in gross CAPEX in the next three years.
Other relevant European LCCs are Wizz Air, Norwegian Airlines, Air Berlin,
Transavia, among others. We highlight Wizz Air, a Hungarian company, as the
most similar (as possible) to Ryanair in terms of cost efficiency. However, it has
currently about 20% of Ryanair’s size with 25 million passengers per year.
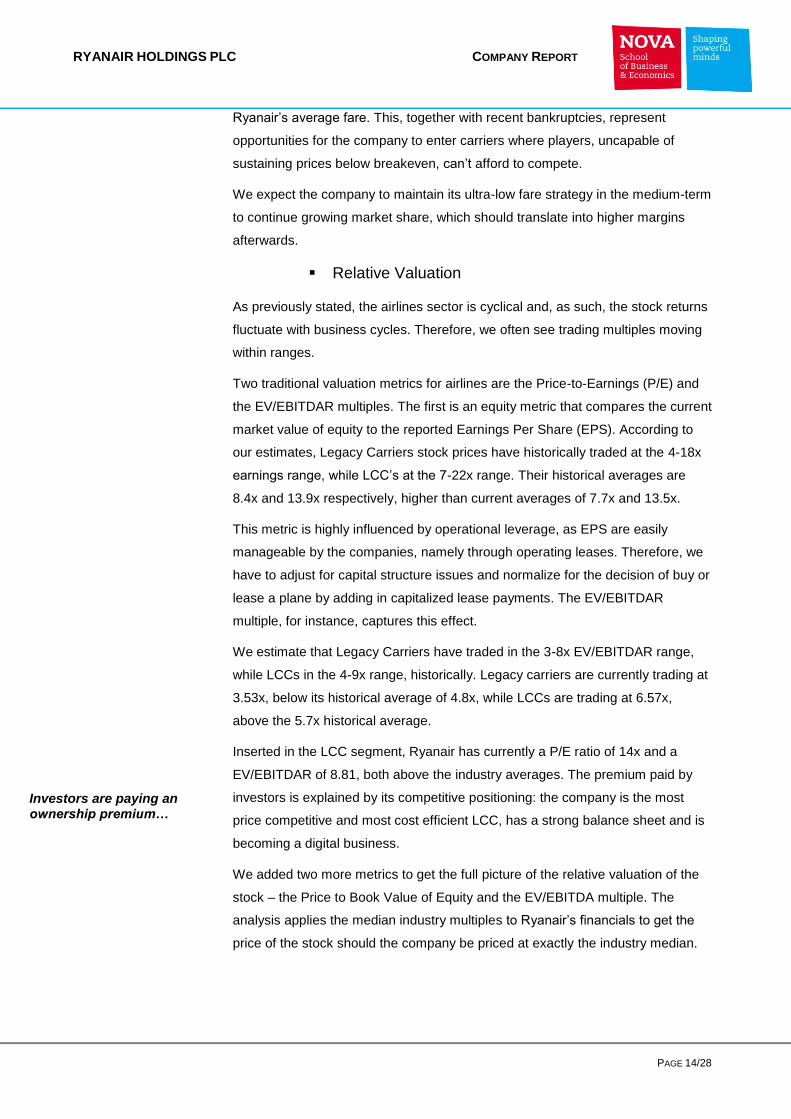
As illustrated in the graph above4, no direct competitor can rival, in terms of cost
per passenger, with Ryanair. If we were to consider Legacy Carriers as well, the
gap would widen even more. All these competitors are operating at a cost
structure per passenger above Ryanair’s average fare per passenger of €40.6
(Wizz at €44, easyJet at €51, Norwegian at €73 and Air Berlin at €131). Also, a
study by Credit Suisse Research, found that 40% of European unit costs per seat
are more than 3 times Ryanair’s average fare and 76% more than 2 times
3 Source: “European airlines face more cuts and consolidation”, Financial Times 4 Source: Ryanair Investor Presentation
Exhibit 17: Competitors’ Scheduled Revenue Drivers
Exhibit 18: LCC’s Cost Structure Comparison
RYANAIR HOLDINGS PLC COMPANY REPORT
PAGE 14/28
Ryanair’s average fare. This, together with recent bankruptcies, represent
opportunities for the company to enter carriers where players, uncapable of
sustaining prices below breakeven, can’t afford to compete.
We expect the company to maintain its ultra-low fare strategy in the medium-term
to continue growing market share, which should translate into higher margins
afterwards.
▪ Relative Valuation
As previously stated, the airlines sector is cyclical and, as such, the stock returns
fluctuate with business cycles. Therefore, we often see trading multiples moving
within ranges.
Two traditional valuation metrics for airlines are the Price-to-Earnings (P/E) and
the EV/EBITDAR multiples. The first is an equity metric that compares the current
market value of equity to the reported Earnings Per Share (EPS). According to
our estimates, Legacy Carriers stock prices have historically traded at the 4-18x
earnings range, while LCC’s at the 7-22x range. Their historical averages are
8.4x and 13.9x respectively, higher than current averages of 7.7x and 13.5x.
This metric is highly influenced by operational leverage, as EPS are easily
manageable by the companies, namely through operating leases. Therefore, we
have to adjust for capital structure issues and normalize for the decision of buy or
lease a plane by adding in capitalized lease payments. The EV/EBITDAR
multiple, for instance, captures this effect.
We estimate that Legacy Carriers have traded in the 3-8x EV/EBITDAR range,
while LCCs in the 4-9x range, historically. Legacy carriers are currently trading at
3.53x, below its historical average of 4.8x, while LCCs are trading at 6.57x,
above the 5.7x historical average.
Inserted in the LCC segment, Ryanair has currently a P/E ratio of 14x and a
EV/EBITDAR of 8.81, both above the industry averages. The premium paid by
investors is explained by its competitive positioning: the company is the most
price competitive and most cost efficient LCC, has a strong balance sheet and is
becoming a digital business.
We added two more metrics to get the full picture of the relative valuation of the
stock – the Price to Book Value of Equity and the EV/EBITDA multiple. The
analysis applies the median industry multiples to Ryanair’s financials to get the
price of the stock should the company be priced at exactly the industry median.
Investors are paying an ownership premium…
RYANAIR HOLDINGS PLC COMPANY REPORT
PAGE 15/28
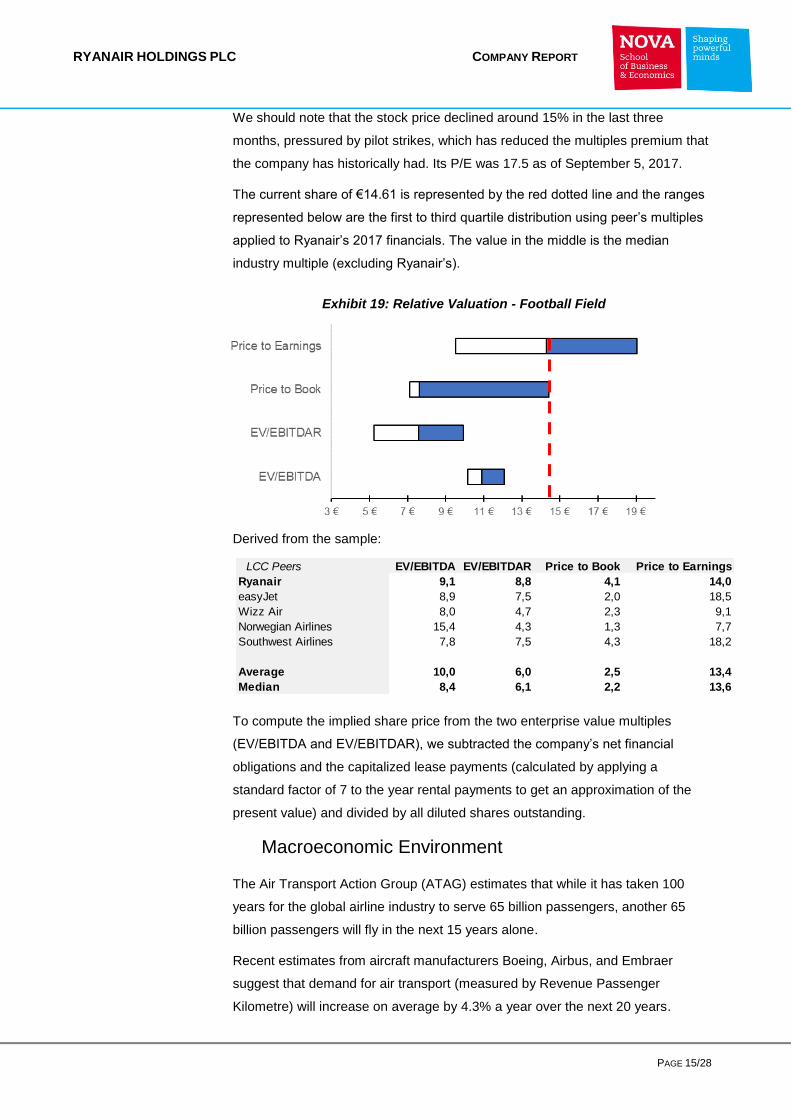
LCC Peers EV/EBITDA EV/EBITDAR Price to Book Price to Earnings
Ryanair 9,1 8,8 4,1 14,0
easyJet 8,9 7,5 2,0 18,5
Wizz Air 8,0 4,7 2,3 9,1
Norwegian Airlines 15,4 4,3 1,3 7,7
Southwest Airlines 7,8 7,5 4,3 18,2
Average 10,0 6,0 2,5 13,4
Median 8,4 6,1 2,2 13,6
We should note that the stock price declined around 15% in the last three
months, pressured by pilot strikes, which has reduced the multiples premium that
the company has historically had. Its P/E was 17.5 as of September 5, 2017.
The current share of €14.61 is represented by the red dotted line and the ranges
represented below are the first to third quartile distribution using peer’s multiples
applied to Ryanair’s 2017 financials. The value in the middle is the median
industry multiple (excluding Ryanair’s).
Derived from the sample:
To compute the implied share price from the two enterprise value multiples
(EV/EBITDA and EV/EBITDAR), we subtracted the company’s net financial
obligations and the capitalized lease payments (calculated by applying a
standard factor of 7 to the year rental payments to get an approximation of the
present value) and divided by all diluted shares outstanding.
Macroeconomic Environment
The Air Transport Action Group (ATAG) estimates that while it has taken 100
years for the global airline industry to serve 65 billion passengers, another 65
billion passengers will fly in the next 15 years alone.
Recent estimates from aircraft manufacturers Boeing, Airbus, and Embraer
suggest that demand for air transport (measured by Revenue Passenger
Kilometre) will increase on average by 4.3% a year over the next 20 years.
Exhibit 19: Relative Valuation - Football Field
RYANAIR HOLDINGS PLC COMPANY REPORT
PAGE 16/28
The International Air Transport Association (IATA) expects 1% of world GDP to
be spent on air transport in 2018, totalling $861 billion and representing a 9.4%
change from 2017. Passenger departures are also expected to grow by 5.6%, to
4.31 billion a year. They forecast an encouraging near-term economic outlook:
strengthening GDPs and increased passenger and demand should be substantial
enough to offset expected rises in oil prices (they expect an average 2018 price
of $60/b for the Brent crude oil), culminating in the highest global aviation profits
in history – over $35 billion in 2018.
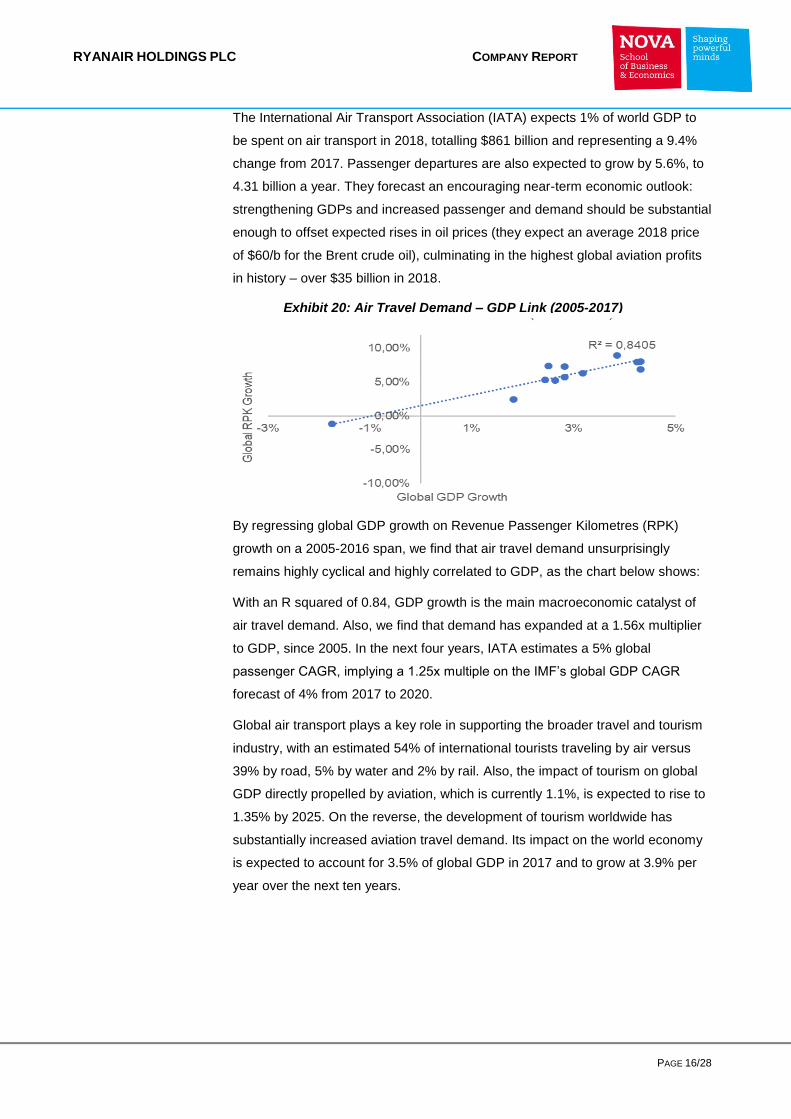
By regressing global GDP growth on Revenue Passenger Kilometres (RPK)
growth on a 2005-2016 span, we find that air travel demand unsurprisingly
remains highly cyclical and highly correlated to GDP, as the chart below shows:
With an R squared of 0.84, GDP growth is the main macroeconomic catalyst of
air travel demand. Also, we find that demand has expanded at a 1.56x multiplier
to GDP, since 2005. In the next four years, IATA estimates a 5% global
passenger CAGR, implying a 1.25x multiple on the IMF’s global GDP CAGR
forecast of 4% from 2017 to 2020.
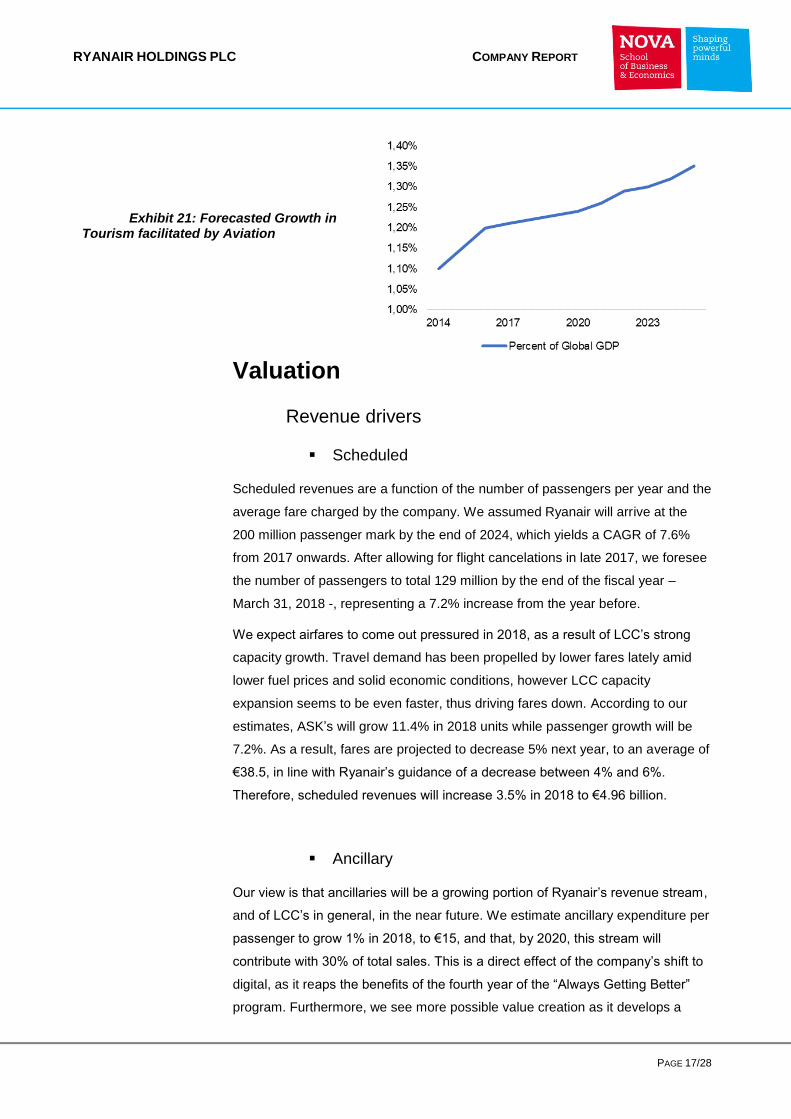
Global air transport plays a key role in supporting the broader travel and tourism
industry, with an estimated 54% of international tourists traveling by air versus
39% by road, 5% by water and 2% by rail. Also, the impact of tourism on global
GDP directly propelled by aviation, which is currently 1.1%, is expected to rise to
1.35% by 2025. On the reverse, the development of tourism worldwide has
substantially increased aviation travel demand. Its impact on the world economy
is expected to account for 3.5% of global GDP in 2017 and to grow at 3.9% per
year over the next ten years.
Exhibit 20: Air Travel Demand – GDP Link (2005-2017)
RYANAIR HOLDINGS PLC COMPANY REPORT
PAGE 17/28
Valuation
Revenue drivers
▪ Scheduled
Scheduled revenues are a function of the number of passengers per year and the
average fare charged by the company. We assumed Ryanair will arrive at the
200 million passenger mark by the end of 2024, which yields a CAGR of 7.6%
from 2017 onwards. After allowing for flight cancelations in late 2017, we foresee
the number of passengers to total 129 million by the end of the fiscal year –
March 31, 2018 -, representing a 7.2% increase from the year before.
We expect airfares to come out pressured in 2018, as a result of LCC’s strong
capacity growth. Travel demand has been propelled by lower fares lately amid
lower fuel prices and solid economic conditions, however LCC capacity
expansion seems to be even faster, thus driving fares down. According to our
estimates, ASK’s will grow 11.4% in 2018 units while passenger growth will be
7.2%. As a result, fares are projected to decrease 5% next year, to an average of
€38.5, in line with Ryanair’s guidance of a decrease between 4% and 6%.
Therefore, scheduled revenues will increase 3.5% in 2018 to €4.96 billion.
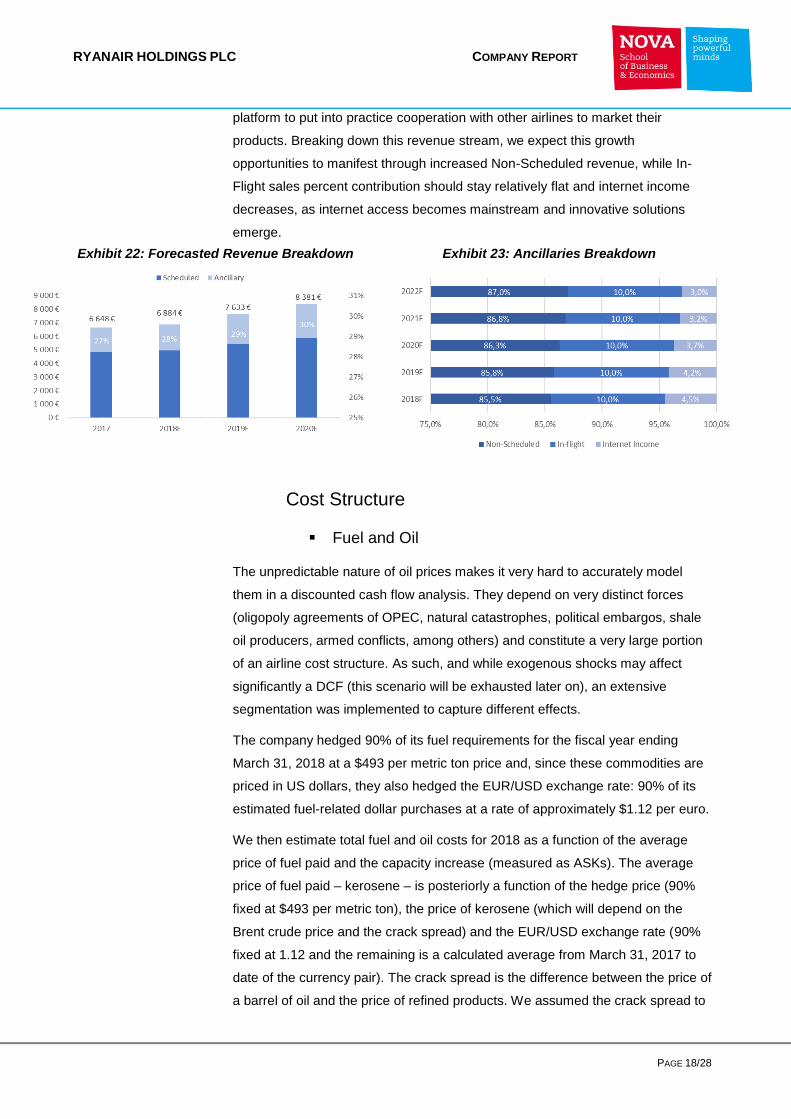
▪ Ancillary
Our view is that ancillaries will be a growing portion of Ryanair’s revenue stream,
and of LCC’s in general, in the near future. We estimate ancillary expenditure per
passenger to grow 1% in 2018, to €15, and that, by 2020, this stream will
contribute with 30% of total sales. This is a direct effect of the company’s shift to
digital, as it reaps the benefits of the fourth year of the “Always Getting Better”
program. Furthermore, we see more possible value creation as it develops a
Exhibit 21: Forecasted Growth in Tourism facilitated by Aviation
RYANAIR HOLDINGS PLC COMPANY REPORT
PAGE 18/28
platform to put into practice cooperation with other airlines to market their
products. Breaking down this revenue stream, we expect this growth
opportunities to manifest through increased Non-Scheduled revenue, while In-
Flight sales percent contribution should stay relatively flat and internet income
decreases, as internet access becomes mainstream and innovative solutions
emerge.
Cost Structure
▪ Fuel and Oil
The unpredictable nature of oil prices makes it very hard to accurately model
them in a discounted cash flow analysis. They depend on very distinct forces
(oligopoly agreements of OPEC, natural catastrophes, political embargos, shale
oil producers, armed conflicts, among others) and constitute a very large portion
of an airline cost structure. As such, and while exogenous shocks may affect
significantly a DCF (this scenario will be exhausted later on), an extensive
segmentation was implemented to capture different effects.
The company hedged 90% of its fuel requirements for the fiscal year ending
March 31, 2018 at a $493 per metric ton price and, since these commodities are
priced in US dollars, they also hedged the EUR/USD exchange rate: 90% of its
estimated fuel-related dollar purchases at a rate of approximately $1.12 per euro.
We then estimate total fuel and oil costs for 2018 as a function of the average
price of fuel paid and the capacity increase (measured as ASKs). The average
price of fuel paid – kerosene – is posteriorly a function of the hedge price (90%
fixed at $493 per metric ton), the price of kerosene (which will depend on the
Brent crude price and the crack spread) and the EUR/USD exchange rate (90%
fixed at 1.12 and the remaining is a calculated average from March 31, 2017 to
date of the currency pair). The crack spread is the difference between the price of
a barrel of oil and the price of refined products. We assumed the crack spread to
Exhibit 22: Forecasted Revenue Breakdown Exhibit 23: Ancillaries Breakdown
RYANAIR HOLDINGS PLC COMPANY REPORT
PAGE 19/28
be equal to the average crack spread of the last 7 years, since it is very hard to
predict its future movements, given its volatility and very few future quotes
outstanding. Also, kerosene is measured in metric tons, while Brent crude is
measured in barrels, so we assumed a factor of 7.9 barrels per metric ton, in line
with the average density of kerosene of 0.81g/cm3.
We forecast a 5.2% decrease in total fuel costs to $1.81 billion in 2018, as a
consequence of a 15% decrease in the average price of fuel paid to €444 (the
hedge price offset the increase in Brent crude prices) and an 11.4% ASK
expansion. On a per passenger basis, these costs reduced from €15.9 in 2017 to
€14.1.
We expect this situation to reverse in March 2019, since the company only
hedged 25% at a price of €484 and the Brent crude futures curve suggests a
$63.3 price, which translates into a €615 price of kerosene. However, this
increase in the price of oil will be offset by an increase in the EUR/USD to 1.24,
as suggested by the futures curve, translating into an average price of fuel paid
of €504.
▪ Airport and Route charges
We forecast airport and route charges to decrease 5% on a per passenger basis
in 2018 to €881 million and €668 million, respectively. Our projection is that the
company will continue to benefit from competitive agreements and landing fees
with airports, using its traffic growth to gain bargaining power, and the trend of
declining Eurocontrol prices in Europe.
▪ Maintenance, Marketing & Other
Marketing and distribution costs are expected to stay relatively constant in the
next two years at €2.7 per passenger. We included a one-off €25 million
provision, as the company addressed the needs of affected passengers to
recover the rostering failure.
Maintenance and repairs costs will stay flat over the years at €390,000 per
aircraft per year. These will be €169 million in 2018, up from €141 million in 2017,
translating into an 11.6% increase per passenger to 1.31€. This reflects a higher
fleet growth and passenger growth.
▪ Aircraft Rentals
Aircraft rentals refer to operating leases: fixed rental payments for aircrafts that
Ryanair operates, but does not own. The arrangement is usually a lessor that
purchases the aircraft and leases it to the company under a 7-year sale-and-
leaseback.
RYANAIR HOLDINGS PLC COMPANY REPORT
PAGE 20/28
Fiscal year ends in March 2017 2018F 2019F 2020F 2021F 2022F 2023F 2024F
Opening Fleet 341 383 427 448 481 516 540 575
Deliveries under 2013 Boeing Contract 52 50 29
Deliveries under 2014 Boeing Contract 39 19 21 20 11
Option Aircraft under 2014 Boeing Contract 8 25 28 25 14
Planned returns or disposals -10 -6 -8 -14 -9 -25 -10 -15
Total Fleet 383 427 448 481 516 540 575 585
For the last two years, Ryanair paid around $2.6 million a year, for each
operating leased aircraft under aircraft rentals. It is hard to estimate accurately
the level of operating leases in the future, since the decision is based on very-
short term needs – usually in high seasons during the summer and winter.
With a new accounting standard ‘IFRS 16 Leases’ being launched in January
2019, we believe the level of leases on the airline industry will likely decrease.
This new standard requires companies to report all kinds of leases on the
balance sheet, thus reducing its capacity to have artificially low operating profits
and artificially high return on capital. Therefore, estimate the level of total leased
aircraft to decrease as a percentage of total fleet – from 28% in 2017 to 18% in
2022. Also, we expect operating leases to remain at the same 30% level of total
leased aircraft going forward. Therefore, total aircraft rentals will decrease from
€86 million in 2017 to €76 million in 2020.
▪ Depreciation
Ryanair’s Property, Plant & Equipment (PP&E) is composed by aircrafts, hangar
and buildings, plant & equipment, fixture & fittings and motor vehicles. As of
2017, aircrafts constituted more than 98% of gross PP&E. However, they all
contribute to total depreciation and have different rates of depreciation. Aircrafts
have a useful life of 23 years, hangar and buildings depreciate at 5% per year,
plant & equipment between 20% and 33.3%, fixture & fittings at 20%, while motor
vehicles depreciate at 33%. Total depreciation was 4.87% of gross PP&E in 2017
and we expect this percentage to remain constant overtime with yearly
depreciation growing at the same rate as fixed assets.
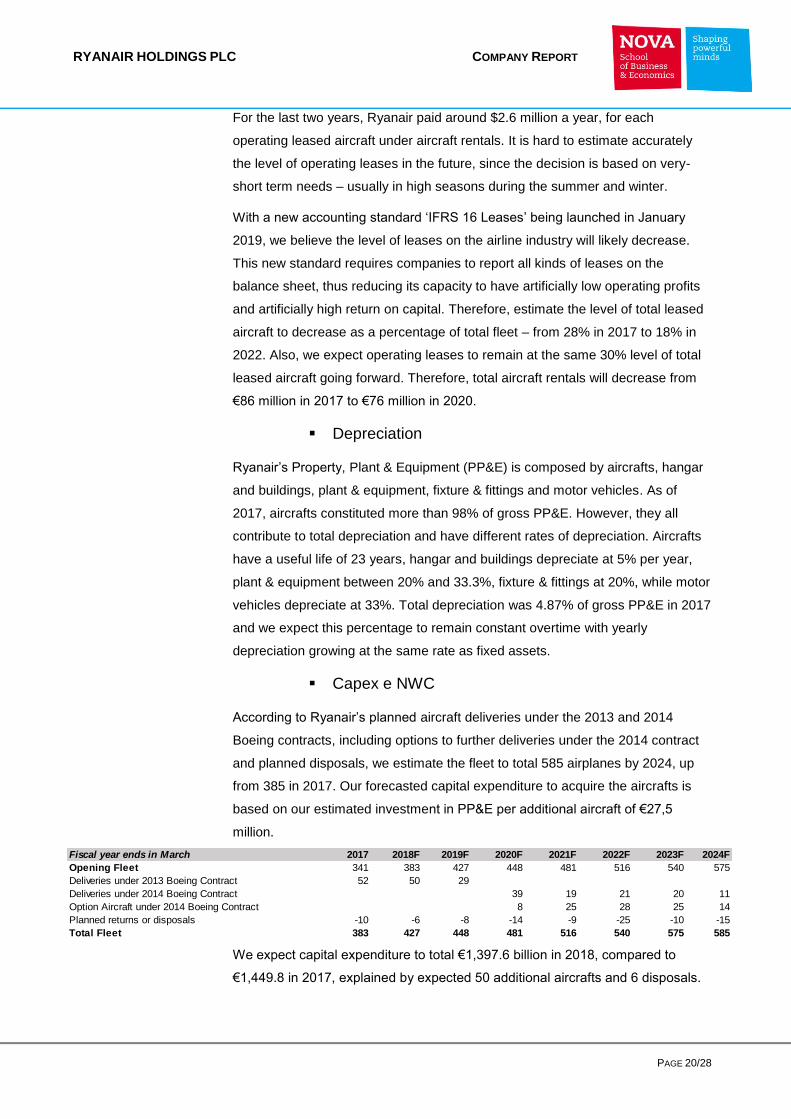
▪ Capex e NWC
According to Ryanair’s planned aircraft deliveries under the 2013 and 2014
Boeing contracts, including options to further deliveries under the 2014 contract
and planned disposals, we estimate the fleet to total 585 airplanes by 2024, up
from 385 in 2017. Our forecasted capital expenditure to acquire the aircrafts is
based on our estimated investment in PP&E per additional aircraft of €27,5
million.
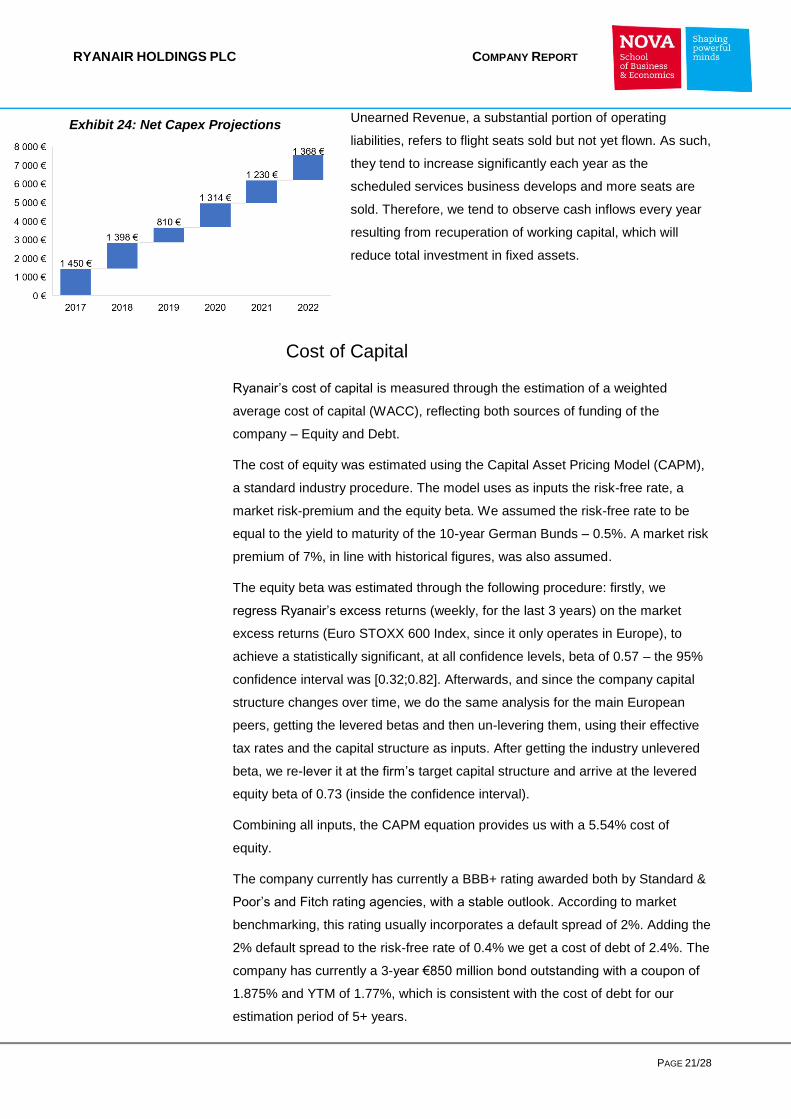
We expect capital expenditure to total €1,397.6 billion in 2018, compared to
€1,449.8 in 2017, explained by expected 50 additional aircrafts and 6 disposals.
RYANAIR HOLDINGS PLC COMPANY REPORT
PAGE 21/28
Unearned Revenue, a substantial portion of operating
liabilities, refers to flight seats sold but not yet flown. As such,
they tend to increase significantly each year as the
scheduled services business develops and more seats are
sold. Therefore, we tend to observe cash inflows every year
resulting from recuperation of working capital, which will
reduce total investment in fixed assets.
Cost of Capital
Ryanair’s cost of capital is measured through the estimation of a weighted
average cost of capital (WACC), reflecting both sources of funding of the
company – Equity and Debt.
The cost of equity was estimated using the Capital Asset Pricing Model (CAPM),
a standard industry procedure. The model uses as inputs the risk-free rate, a
market risk-premium and the equity beta. We assumed the risk-free rate to be
equal to the yield to maturity of the 10-year German Bunds – 0.5%. A market risk
premium of 7%, in line with historical figures, was also assumed.
The equity beta was estimated through the following procedure: firstly, we
regress Ryanair’s excess returns (weekly, for the last 3 years) on the market
excess returns (Euro STOXX 600 Index, since it only operates in Europe), to
achieve a statistically significant, at all confidence levels, beta of 0.57 – the 95%
confidence interval was [0.32;0.82]. Afterwards, and since the company capital
structure changes over time, we do the same analysis for the main European
peers, getting the levered betas and then un-levering them, using their effective
tax rates and the capital structure as inputs. After getting the industry unlevered
beta, we re-lever it at the firm’s target capital structure and arrive at the levered
equity beta of 0.73 (inside the confidence interval).
Combining all inputs, the CAPM equation provides us with a 5.54% cost of
equity.
The company currently has currently a BBB+ rating awarded both by Standard &
Poor’s and Fitch rating agencies, with a stable outlook. According to market
benchmarking, this rating usually incorporates a default spread of 2%. Adding the
2% default spread to the risk-free rate of 0.4% we get a cost of debt of 2.4%. The
company has currently a 3-year €850 million bond outstanding with a coupon of
1.875% and YTM of 1.77%, which is consistent with the cost of debt for our
estimation period of 5+ years.
Exhibit 24: Net Capex Projections
RYANAIR HOLDINGS PLC COMPANY REPORT
PAGE 22/28
Fiscal year ending March, in millions 2016 2017 2018 2019 2020 2021 2022
Operating Cash Flow 1 671,3 € 1 867,5 € 1 960,1 € 2 127,2 € 2 285,9 € 2 373,5 € 2 470,0 €
% Change 11,7% 5,0% 8,5% 7,5% 3,8% 4,1%
Total Investment in Fixed Assets 1 120,8 € 1 173,5 € 1 391,6 € 781,5 € 1 034,1 € 1 086,1 € 1 245,1 €
% Change 4,7% 18,6% -43,8% 32,3% 5,0% 14,6%
Free Cash Flow 550,5 € 693,9 € 568,5 € 1 345,7 € 1 251,9 € 1 287,3 € 1 224,9 €
% Change 26,1% -18,1% 136,7% -7,0% 2,8% -4,9%
PV Free Cash Flow 540,96 € 1 218,40 € 1 078,51 € 1 055,31 € 955,44 €
The WACC calculation also requires an estimation of the market value of debt
(the market capitalization can be taken directly from diverse sources, since it’s a
function of the current stock price). The market value of debt differs from the
book value because it represents how much investors would be willing to pay to
own the debt of the company at any moment. Our estimation methodology was to
treat all debt as single coupon bond, with all interest expenses (finance expenses
and leases) being the coupons and discount them using the calculated weighted
average maturity at the cost of debt. We arrive at a market value of debt of
€3,173 billion. Concluding, using the calculated rates and weights, we get a
5.02% WACC
Discounted Cash Flows Analysis
After describing the behaviour of all relevant inputs, assumptions and
methodology, we now progress to the intrinsic valuation model. We applied a
Gordon Growth Model, in which we discount all future unlevered free cash flows
from the core business at the WACC discount rate to account for risk and capital
structure decisions.
We estimate cash flows on a 5-year horizon, until 2022, applying a growing
perpetuity subsequently. This is consistent with our ROIC analysis, as we see a
stabilization at 28% from 2021. Also, we estimate NOPLAT at a 2% CAGR
between 2020 and 2022, which indicates the company is in a steady growth state
and thus suitable for the application of a terminal value calculation.
The growth rate was calculated by applying a discount factor to the European
Union GDP CAGR of 1.74%. We believe the recent sector consolidation and
capacity investment will mature the market and that, being low-cost a defensive
business, it will grow less than GDP during bull markets and be residually
harmed during bear markets on its steady state form. Therefore, we applied a
factor equal to the industry beta of 0.63 to the previous growth rate, getting a
model growth rate of 1.1% (conservative).
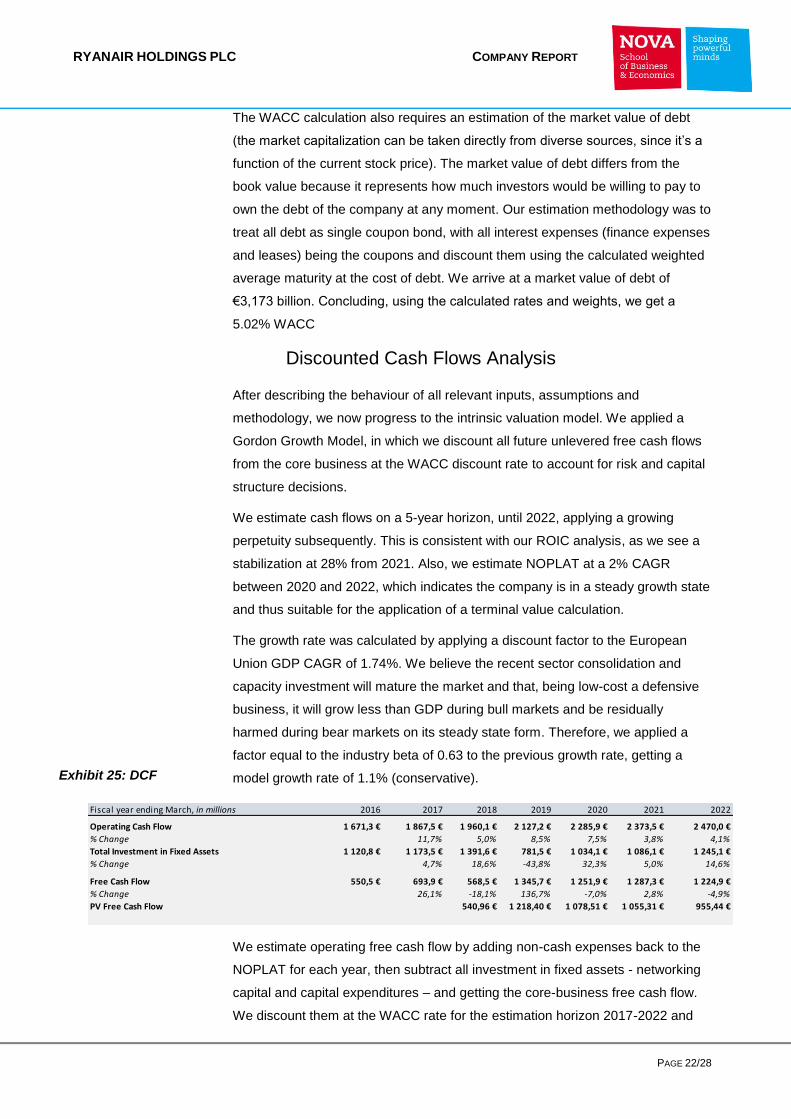
We estimate operating free cash flow by adding non-cash expenses back to the
NOPLAT for each year, then subtract all investment in fixed assets - networking
capital and capital expenditures – and getting the core-business free cash flow.
We discount them at the WACC rate for the estimation horizon 2017-2022 and
Exhibit 25: DCF
RYANAIR HOLDINGS PLC COMPANY REPORT
PAGE 23/28
calculate the terminal value by applying a perpetuity with growth to the free cash
flow of 2022. We get an Enterprise Value of €29,021.93 million and, after
subtracting Non-Financial Assets of €2,779 million adding back Non-Core Assets
of €2,911 million, we get an Equity Value of €29,154.58 million.
Since the company has 1,257.5 million shares outstanding, we get a target price
per share of €23.18. This presents a 59% upside potential at current price levels
of €14.61.
We studied the scenario where the company converges, during the steady state,
to the competitive position of its peers and, consequently, to the same multiples.
This simulation was performed through the application of a factor equal to
median LCC EV/EBITDAR multiple as of 2017 of 7.49 to Ryanair’s 2022
forecasted EBITDAR. This conservative scenario yields a 15% upside potential at
current stock price levels, with a target price of €16.76. The implied EBITDAR
exit multiple of the first model was 11x.
Additionally, in the extreme, and equally unlikely, scenario in which the company
gets financially distressed, the estimated Net Asset Value can serve as a bottom-
line for valuation purposes. At an average acquisition price of €27.54 per aircraft,
the fleet market value is approximately €10.55 billion in 2017 and, after adjusting
for the other assets and liabilities, we get a NAV of €7.98 per share.
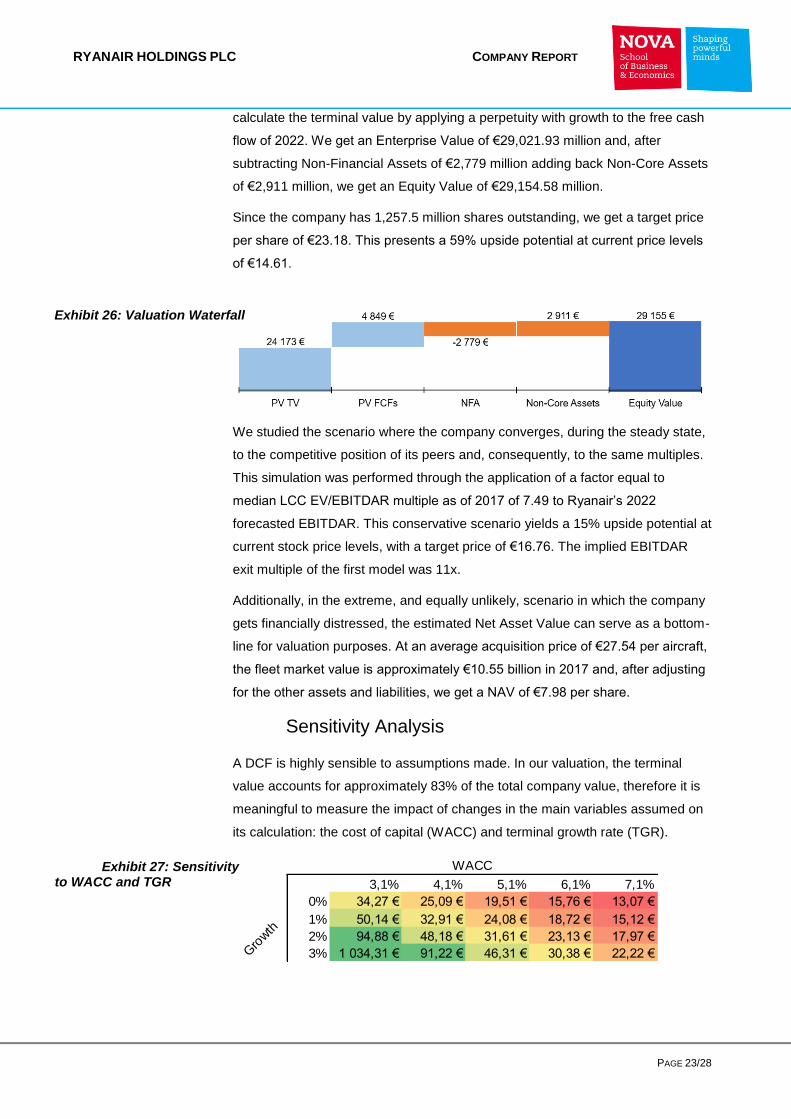
Sensitivity Analysis
A DCF is highly sensible to assumptions made. In our valuation, the terminal
value accounts for approximately 83% of the total company value, therefore it is
meaningful to measure the impact of changes in the main variables assumed on
its calculation: the cost of capital (WACC) and terminal growth rate (TGR).
WACC
##### 3,1% 4,1% 5,1% 6,1% 7,1%
0% 34,27 € 25,09 € 19,51 € 15,76 € 13,07 €
1% 50,14 € 32,91 € 24,08 € 18,72 € 15,12 €
2% 94,88 € 48,18 € 31,61 € 23,13 € 17,97 €
3% 1 034,31 € 91,22 € 46,31 € 30,38 € 22,22 €Gro
wth
Exhibit 26: Valuation Waterfall
Exhibit 27: Sensitivity to WACC and TGR
RYANAIR HOLDINGS PLC COMPANY REPORT
PAGE 24/28
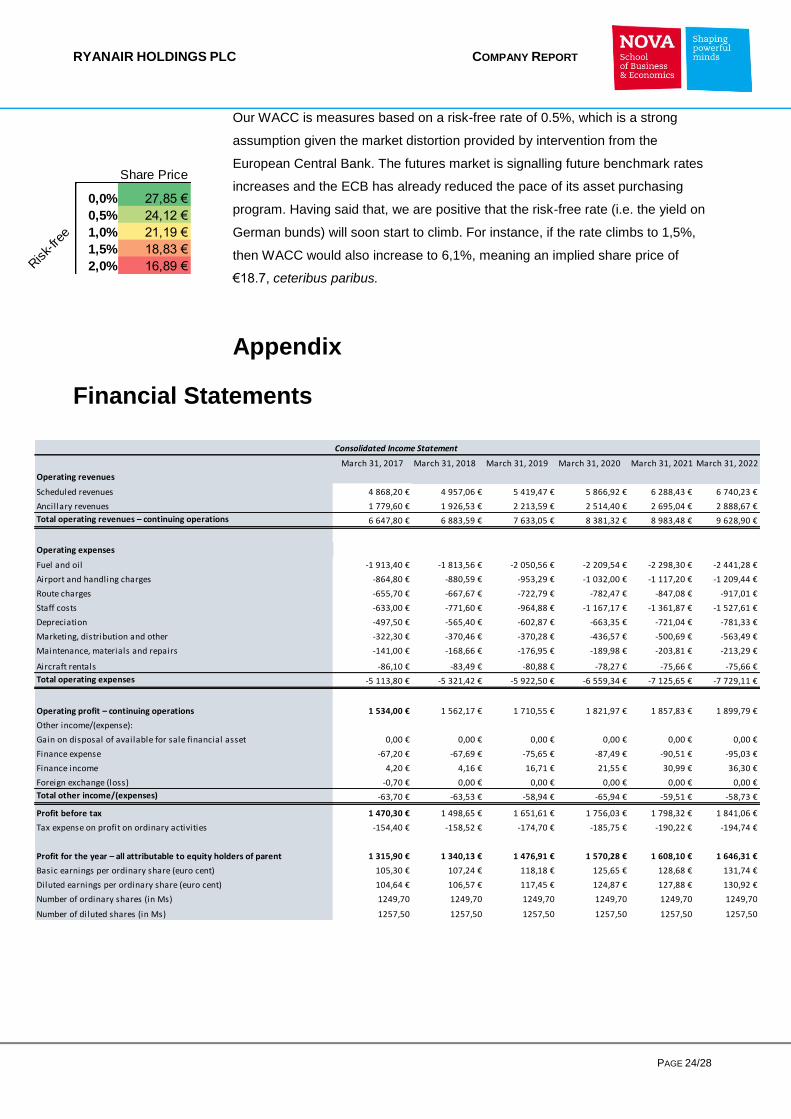
Share Price
0,0% 27,85 €
0,5% 24,12 €
1,0% 21,19 €
1,5% 18,83 €
2,0% 16,89 €Risk-
free
March 31, 2017 March 31, 2018 March 31, 2019 March 31, 2020 March 31, 2021 March 31, 2022
Operating revenues
Scheduled revenues 4 868,20 € 4 957,06 € 5 419,47 € 5 866,92 € 6 288,43 € 6 740,23 €
Ancillary revenues 1 779,60 € 1 926,53 € 2 213,59 € 2 514,40 € 2 695,04 € 2 888,67 €
Total operating revenues – continuing operations 6 647,80 € 6 883,59 € 7 633,05 € 8 381,32 € 8 983,48 € 9 628,90 €
Operating expenses
Fuel and oil -1 913,40 € -1 813,56 € -2 050,56 € -2 209,54 € -2 298,30 € -2 441,28 €
Airport and handling charges -864,80 € -880,59 € -953,29 € -1 032,00 € -1 117,20 € -1 209,44 €
Route charges -655,70 € -667,67 € -722,79 € -782,47 € -847,08 € -917,01 €
Staff costs -633,00 € -771,60 € -964,88 € -1 167,17 € -1 361,87 € -1 527,61 €
Depreciation -497,50 € -565,40 € -602,87 € -663,35 € -721,04 € -781,33 €
Marketing, distribution and other -322,30 € -370,46 € -370,28 € -436,57 € -500,69 € -563,49 €
Maintenance, materials and repairs -141,00 € -168,66 € -176,95 € -189,98 € -203,81 € -213,29 €
Aircraft rentals -86,10 € -83,49 € -80,88 € -78,27 € -75,66 € -75,66 €
Total operating expenses -5 113,80 € -5 321,42 € -5 922,50 € -6 559,34 € -7 125,65 € -7 729,11 €
Operating profit – continuing operations 1 534,00 € 1 562,17 € 1 710,55 € 1 821,97 € 1 857,83 € 1 899,79 €
Other income/(expense):
Gain on disposal of available for sale financial asset 0,00 € 0,00 € 0,00 € 0,00 € 0,00 € 0,00 €
Finance expense -67,20 € -67,69 € -75,65 € -87,49 € -90,51 € -95,03 €
Finance income 4,20 € 4,16 € 16,71 € 21,55 € 30,99 € 36,30 €
Foreign exchange (loss) -0,70 € 0,00 € 0,00 € 0,00 € 0,00 € 0,00 €
Total other income/(expenses) -63,70 € -63,53 € -58,94 € -65,94 € -59,51 € -58,73 €
Profit before tax 1 470,30 € 1 498,65 € 1 651,61 € 1 756,03 € 1 798,32 € 1 841,06 €
Tax expense on profit on ordinary activities -154,40 € -158,52 € -174,70 € -185,75 € -190,22 € -194,74 €
Profit for the year – all attributable to equity holders of parent 1 315,90 € 1 340,13 € 1 476,91 € 1 570,28 € 1 608,10 € 1 646,31 €
Basic earnings per ordinary share (euro cent) 105,30 € 107,24 € 118,18 € 125,65 € 128,68 € 131,74 €
Diluted earnings per ordinary share (euro cent) 104,64 € 106,57 € 117,45 € 124,87 € 127,88 € 130,92 €
Number of ordinary shares (in Ms) 1249,70 1249,70 1249,70 1249,70 1249,70 1249,70
Number of diluted shares (in Ms) 1257,50 1257,50 1257,50 1257,50 1257,50 1257,50
Consolidated Income Statement
Our WACC is measures based on a risk-free rate of 0.5%, which is a strong
assumption given the market distortion provided by intervention from the
European Central Bank. The futures market is signalling future benchmark rates
increases and the ECB has already reduced the pace of its asset purchasing
program. Having said that, we are positive that the risk-free rate (i.e. the yield on
German bunds) will soon start to climb. For instance, if the rate climbs to 1,5%,
then WACC would also increase to 6,1%, meaning an implied share price of
€18.7, ceteribus paribus.
Appendix
Financial Statements
RYANAIR HOLDINGS PLC COMPANY REPORT
PAGE 25/28
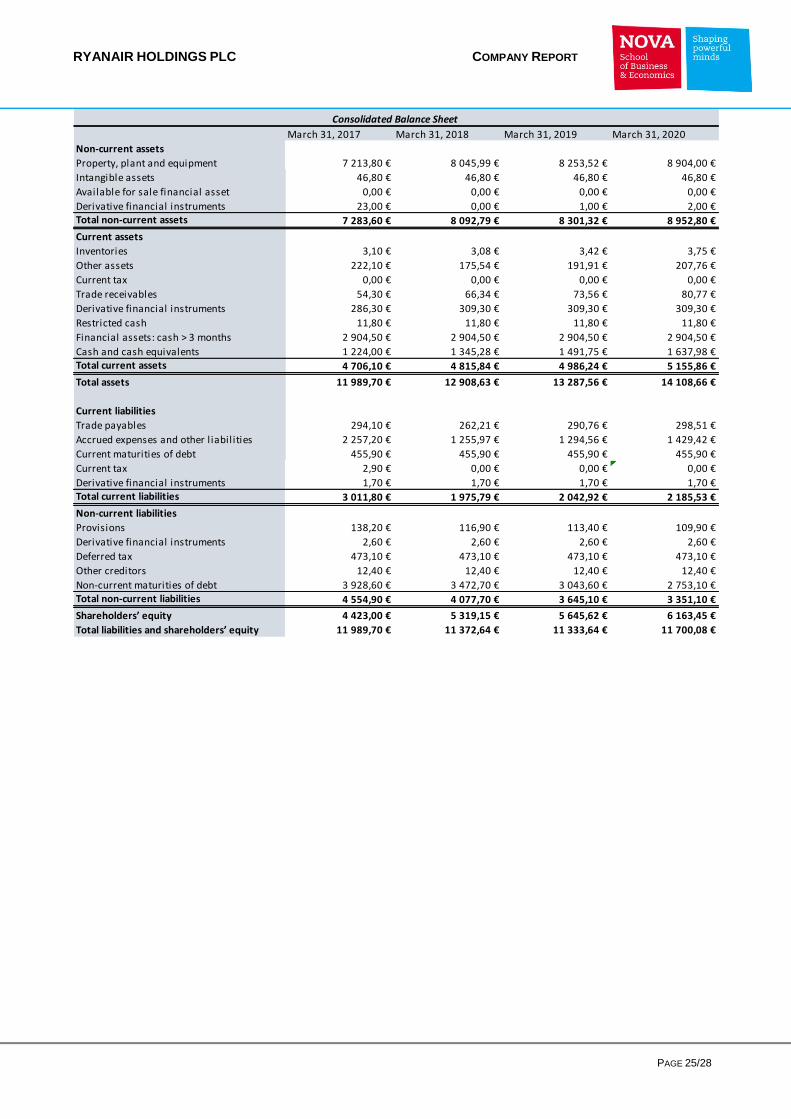
March 31, 2017 March 31, 2018 March 31, 2019 March 31, 2020
Non-current assets
Property, plant and equipment 7 213,80 € 8 045,99 € 8 253,52 € 8 904,00 €
Intangible assets 46,80 € 46,80 € 46,80 € 46,80 €
Available for sale financial asset 0,00 € 0,00 € 0,00 € 0,00 €
Derivative financial instruments 23,00 € 0,00 € 1,00 € 2,00 €Total non-current assets 7 283,60 € 8 092,79 € 8 301,32 € 8 952,80 €
Current assets
Inventories 3,10 € 3,08 € 3,42 € 3,75 €
Other assets 222,10 € 175,54 € 191,91 € 207,76 €
Current tax 0,00 € 0,00 € 0,00 € 0,00 €
Trade receivables 54,30 € 66,34 € 73,56 € 80,77 €
Derivative financial instruments 286,30 € 309,30 € 309,30 € 309,30 €
Restricted cash 11,80 € 11,80 € 11,80 € 11,80 €
Financial assets: cash > 3 months 2 904,50 € 2 904,50 € 2 904,50 € 2 904,50 €
Cash and cash equivalents 1 224,00 € 1 345,28 € 1 491,75 € 1 637,98 €Total current assets 4 706,10 € 4 815,84 € 4 986,24 € 5 155,86 €
Total assets 11 989,70 € 12 908,63 € 13 287,56 € 14 108,66 €
Current liabilities
Trade payables 294,10 € 262,21 € 290,76 € 298,51 €
Accrued expenses and other l iabilities 2 257,20 € 1 255,97 € 1 294,56 € 1 429,42 €
Current maturities of debt 455,90 € 455,90 € 455,90 € 455,90 €
Current tax 2,90 € 0,00 € 0,00 € 0,00 €
Derivative financial instruments 1,70 € 1,70 € 1,70 € 1,70 €Total current liabilities 3 011,80 € 1 975,79 € 2 042,92 € 2 185,53 €
Non-current liabilities
Provisions 138,20 € 116,90 € 113,40 € 109,90 €
Derivative financial instruments 2,60 € 2,60 € 2,60 € 2,60 €
Deferred tax 473,10 € 473,10 € 473,10 € 473,10 €
Other creditors 12,40 € 12,40 € 12,40 € 12,40 €
Non-current maturities of debt 3 928,60 € 3 472,70 € 3 043,60 € 2 753,10 €Total non-current liabilities 4 554,90 € 4 077,70 € 3 645,10 € 3 351,10 €
Shareholders’ equity 4 423,00 € 5 319,15 € 5 645,62 € 6 163,45 €
Total liabilities and shareholders’ equity 11 989,70 € 11 372,64 € 11 333,64 € 11 700,08 €
Consolidated Balance Sheet
RYANAIR HOLDINGS PLC COMPANY REPORT
PAGE 26/28
Disclosures and Disclaimers
Report Recommendations
Buy Expected total return (including expected capital gains and expected dividend yield)
of more than 10% over a 12-month period.
Hold Expected total return (including expected capital gains and expected dividend yield)
between 0% and 10% over a 12-month period.
Sell Expected negative total return (including expected capital gains and expected
dividend yield) over a 12-month period.
This report was prepared by [insert student’s name], a Master in Finance’s student of Nova School of
Business & Economics (“Nova SBE”), within the context of the Field Lab – Equity Research.
This report is issued and published exclusively for academic purposes, namely for academic evaluation and
masters graduation purposes, within the context of said Field Lab – Equity Research. It is not to be construed
as an offer or a solicitation of an offer to buy or sell any security or financial instrument.
This report was supervised by a Nova SBE faculty member, acting merely in an academic capacity, who
revised the valuation methodology and the financial model.
Given the exclusive academic purpose of the reports produced by Nova SBE students, it is Nova SBE
understanding that Nova SBE, the author, the present report and its publishing, are excluded from the
persons and activities requiring previous registration from local regulatory authorities. As such, Nova SBE, its
faculty and the author of this report have not sought or obtained registration with or certification as financial
analyst by any local regulator, in any jurisdiction. In Portugal, the author of this report is not registered with or
qualified under COMISSÃO DO MERCADO DE VALORES MOBILIÁRIOS (“CMVM”, the Portuguese Securities Market
Authority) as a financial analyst. Rosário André - as the academic supervisor of the author - is registered as a
financial analyst with CMVM. No approval for publication or distribution of this report was required and/or
obtained from any local authority, given the exclusive academic nature of the report.
The additional disclaimers also apply:
USA: Pursuant to Section 202 (a) (11) of the Investment Advisers Act of 1940, neither Nova SBE nor the
author of this report are to be qualified as an investment adviser and, thus, registration with the Securities and
Exchange Commission (“SEC”, United States of America’s securities market authority) is not necessary.
Neither the Author nor Nova SBE receive any compensation of any kind for the preparation of the Reports.
RYANAIR HOLDINGS PLC COMPANY REPORT
PAGE 27/28
Germany: Pursuant to §34c of the WpHG (Wertpapierhandelsgesetz, i.e., the German Securities Trading
Act), this entity is not required to register with or otherwise notify the Bundesanstalt für
Finanzdienstleistungsaufsicht (“BaFin”, the German Federal Financial Supervisory Authority). It should be
noted that Nova SBE is a fully-owned state university and there is no relation between the student’s equity
reports and any fund raising programme.
UK: Pursuant to section 22 of the Financial Services and Markets Act 2000 (the “FSMA”), for an activity to be
a regulated activity, it must be carried on “by way of business”. All regulated activities are subject to prior
authorization by the Financial Conduct Authority (“FCA”). However, this Report serves an exclusively
academic purpose and, as such, was not prepared by way of business.The author - a Masters’ student - is
the sole and exclusive responsible for the information, estimates and forecasts contained herein, and for
the opinions expressed, which exclusively reflect his/her own judgment at the date of the report. Nova SBE
and its faculty have no single and formal position in relation to the most appropriate valuation method,
estimates or projections used in the report and may not be held liable by the author’s choice of the latter.
The information contained in this report was compiled by students from public sources believed to be reliable,
but Nova SBE, its faculty, or the students make no representation that it is accurate or complete, and accept
no liability whatsoever for any direct or indirect loss resulting from the use of this report or of its content.
Students are free to choose the target companies of the reports. Therefore, Nova SBE may start covering
and/or suspend the coverage of any listed company, at any time, without prior notice. The students or Nova
SBE are not responsible for updating this report, and the opinions and recommendations expressed herein
may change without further notice.
The target company or security of this report may be simultaneously covered by more than one student.
Because each student is free to choose the valuation method, and make his/her own assumptions and
estimates, the resulting projections, price target and recommendations may differ widely, even when referring
to the same security. Moreover, changing market conditions and/or changing subjective opinions may lead to
significantly different valuation results. Other students’ opinions, estimates and recommendations, as well as
the advisor and other faculty members’ opinions may be inconsistent with the views expressed in this report.
Any recipient of this report should understand that statements regarding future prospects and performance
are, by nature, subjective, and may be fallible.
This report does not necessarily mention and/or analyze all possible risks arising from the investment in the
target company and/or security, namely the possible exchange rate risk resulting from the security being
denominated in a currency either than the investor’s currency, among many other risks.
The purpose of publishing this report is merely academic and it is not intended for distribution among private
investors. The information and opinions expressed in this report are not intended to be available to any
person other than Portuguese natural or legal persons or persons domiciled in Portugal. While preparing this
report, students did not have in consideration the specific investment objectives, financial situation or
particular needs of any specific person. Investors should seek financial advice regarding the appropriateness
of investing in any security, namely in the security covered by this report.
RYANAIR HOLDINGS PLC COMPANY REPORT
PAGE 28/28
The author hereby certifies that the views expressed in this report accurately reflect his/her personal opinion
about the target company and its securities. He/ She has not received or been promised any direct or indirect
compensation for expressing the opinions or recommendation included in this report.
[If applicable, it shall be added: “While preparing the report, the author may have performed an internship
(remunerated or not) in [insert the Company’s name]. This Company may have or have had an interest in the
covered company or security” and/ or “A draft of the reports have been shown to the covered company’s
officials (Investors Relations Officer or other), mainly for the purpose of correcting inaccuracies, and later
modified, prior to its publication.”]
The content of each report have been shown or made public to restricted parties prior to its publication in
Nova SBE’s website or in Bloomberg Professional, for academic purposes such as its distribution among
faculty members for students’ academic evaluation.
Nova SBE is a state-owned university, mainly financed by state subsidies, students tuition fees and
companies, through donations, or indirectly by hiring educational programs, among other possibilities. Thus,
Nova SBE may have received compensation from the target company during the last 12 months, related to its
fund raising programs, or indirectly through the sale of educational, consulting or research services.
Nevertheless, no compensation eventually received by Nova SBE is in any way related to or dependent on
the opinions expressed in this report. The Nova School of Business & Economics does not deal for or
otherwise offer any investment or intermediation services to market counterparties, private or intermediate
customers.
This report may not be reproduced, distributed or published, in whole or in part, without the explicit previous
consent of its author, unless when used by Nova SBE for academic purposes only. At any time, Nova SBE
may decide to suspend this report reproduction or distribution without further notice. Neither this document
nor any copy of it may be taken, transmitted or distributed, directly or indirectly, in any country either than
Portugal or to any resident outside this country. The dissemination of this document other than in Portugal or
to Portuguese citizens is therefore prohibited and unlawful.