s-72.2205 digital transmission methods · 10 p4 a discrete memoryless source has an alphabet of...
TRANSCRIPT

1S-72.2205 Digital transmission methods P1 Determination of duplex frequency in a transceiver
Parameters: � Ptx = 1W � Srx = –96 dBm � Ac = 25 dB � tx oscillator phase noise specification: p.s.d. at duplex frequency
better tban No = –140 dBc/Hz � Receiver filter 4th order Butterworth filter, amplitude response
�
� �� �2_
1( )
1n
c rx
A ff f B
�
� �
� Signal bandwidth W = 40 MHz � Amplitude distortion (tx+rx) inside the signal bandwidth less than 1
dB Task:
a) Determine the duplex spacing so that the signal to disturbance ratio at receiver sensitivity level is at least 20 dB
b) What is the minimum n-value if the duplex spacing is 340 MHz
Tx
Rx
Ac
ftx frx
f
rx filter amplitude response,
Butterworth nth order
tx oscillator phase noise p.s.d. = No = - 140 dBc
= circulator isolation = 25 dBtx carrier 0 dBc
tx filter amplitude response,
Butterworth nth order

2 The signal to disturbance ratio should be 1020/10 = 100 as absolute value The disturbance is the sum of tx oscillator phase noise passing through the rx filter and tx carrier leakage into the receiver
� � � � � �
_
2 2 2
0
100pn c dpx
txo tx tx rx rx rx
c
SSDR
P P
S
PN H f f H f f df H f
A��
� � ��
�� � �� � � �� �� �
(1) The necessary filter bandwidth is determined by the amplitude distortion requirement divided uniformly between tx and rx:
� �0.05 8
81 1
10 0.891 0.650 26.02 MHz1 0.891 1 21 2
WB W
W B�� � � � � �
��
(2) Insertion of the filter power response gives the phase noise power in the receiver input
2 2
0
2 2
0.5
1 1
2
1 1rx
on n nc tx rx
on nc tx rx
f f
N dfP
A f f f fB B
N dfA f f f f
B B
������
������
� �
�� �� �� �� � � �� �� �� � � �
� � � �� �� �� �� �
�� �� �� �� � � �� �� �� � � �
� � � �� �� �� �� �
(3)

3
Insertion of 0.5rxf f fx
B� � �
� gives
2 2
0
2 2
0
2
0.5 0.51 1
1.30
0.769 0.7691 1
1.30
on n nc
on nc
o
c
N B dxP z
A f fx x
B B
N W dxA f f
x xW W
N BI
A
������
������
�� �� �� �� � � � � �� �� �� � � �
� � � �� �� �� �� �
�� �� �� �� � � � � �� �� �� � � �
� � � �� �� �� �� �
� �
(4)
The last part of the expression is obtained by inserting Eq.(2) into Eq.(3) Unfortunately the integral I seems not to be integrable by analytical means Insertion of Eq.(4) into Eq.(1) gives
� �� �2_100
1.30
c
pn c dpx o tx rx
S SASDR
P P N W I P H f� � � �
� � � �
(5) Numerical SDR-results with the above system parameters are shown as function of �f/W for different n-values in the graph below a) For n=4 we get 20.8 20.8 40 832f W f MHz� � � � � � � for SDR =
100 b) When 340 , 340 40 8.5 7f MHz f W n� � � � � � � for SDR = 100
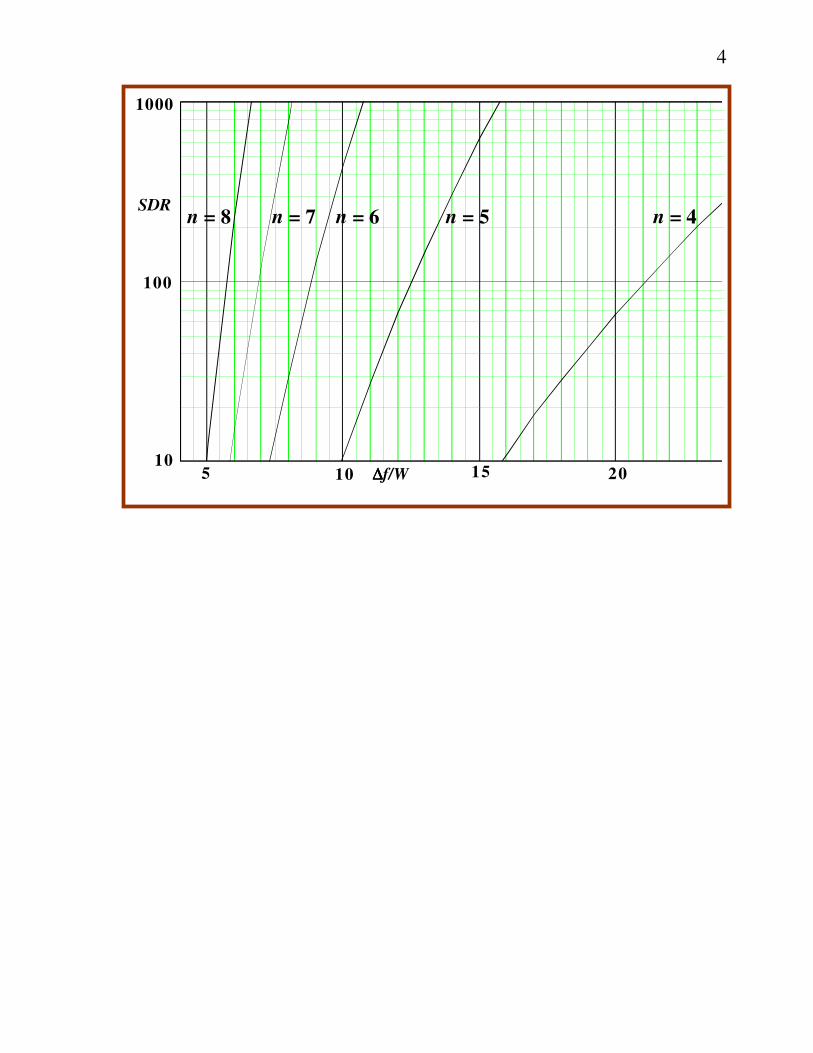
4
5 10 15 2010
100
1000
n = 4n = 5n = 6n = 7n = 8SDR
����f/W

5P2 A FM-audio broadcast superheterodyne receiver should be able to
receive signal in the band 87.5…108 MHz. a) Determine the minimum value of the intermediate frequency so that
no transmitter in this band could be on the mirror frequency. b) A tunable pre-mixer filter of 1st order Butterworth type with a 250 kHz
bandwidth is used to attenuate out of band mirror frequency signals. How large is the attenuation in dB with the IF-value obtained in part a?
SOLUTION a) When c lof f� , the requirement gives
� �� �
,max ,min ,max ,min2 0.5
0.5 108 87.5 10.25 MHz
m c IF c IF c cf f f f f f f� � � � � �
� � �
When c lof f� , the requirement gives
� �� �
,min ,max ,max ,min2 0.5
0.5 108 87.5 10.25 MHz
m c IF c IF c cf f f f f f f� � � � � �
� � �
c) The amplitude response of a band-pass Butterworth filter is
1101009080
1101009080
fm
fm
flo
flofc
fc
fc<flo
fc>flo
Mirror_freq_signals.dsf

6
2
1( )
1/ 2
nc
A ff fB
��� � � �
� �
Thus the loss in dB of a first order Butterworth filter at the mirror frequency is
� �� �
2
2 2
220log 20log 1
/ 2
2 2 10.2510log 1 10log 1 44.30 dB
/ 2 0.125
c c IF c
m
IF
A f f f fL
A f B
fB
� � � �� � �� � �� � � �� �� �� � � �
� � �� � � � � � �� � � �� � � �� � � �� � � �� � � �
1101009080 fmflo fc
Mirror_freq_signals.dsf
A( f )

7 P3 Derive the upper and lower bounds for the rate distortion function for a
uniformly (-a, a) distributed signal producing independent samples
when� 20 xD �� � ��Draw the bounds for� � �210 log x D� -values in the
range 0…100 dB.� SOLUTION
The upper bound is given by � 2
2( ) log xGR D
D��
� � �� �� ��
�Next we express the p.d.f. in terms of the variance of the signal amplitude.
� �
� �
22 2 2 2
0
1 13
2 3
112 12
aa a
x xa a
x x
ax p x dx x dx x dx a
a a
xp x rect
� �
� �
�� ���� � � �
� � � � � � �
� � � � �
� �
�The differential entropy is
�
� � � �
3
2
0
3
0
1 1( ) 2 log
11212
ln 12 ln 122ln(2) ln(2)12
x
x
xx
x x
x
H s dx
dx
�
�
��
� �
�
���
����
� � �� ��� �� �� �
� �
�
�
�
� � � � � �
� � � �
2 2 2
22
2 2 2
1 1( ) ( ) log 2 e log 12 log 2 e
2 2
61 1 1log 12 log 2 e log
2 2 2 e
lwr x
xx
R D H s D D
DD
�
��
� � � �
� � � � � �� �
� �
�

8
� �2
2 21 1 6 1
log log ( ) 0.25462 2 e 2
xGR D
D�
� � � � � �� � � �� � � �� ��
� �
As the figure shows there is very small difference between the entropy bounds of a Laplacian and uniform signal.
0 10 20 30 40 50 60 70 80 90 1005
0
5
10
15
20
25
30
35
R(s)bit/s/Hz
���� ����210log x D����Rate_dist_function.dsf
dB
Shannon upper bound
Shannon lower bound, Laplacian signal
Shannon lower bound, uniform signal

9P4 a) How large is the capacity of a telephone voice channel with a 3.1 kHz
bandwidth having a 25 dB signal to noise ratio? b) What is the minimum SNR (dB) required to obtain error free
transmission of the 56 kbit/s modem in this voice channel? c) Derive an expression of the capacity of a channel with infinite
bandwidth? SOLUTION a) The channel capacity is given by Shannon’s capacity theorem, also
called the Hartley-Shannon law. It is essential to change the SNR given in dB to a absolute value.
� � � � � �25 1025 10
2 2ln 1 10
log 1 3100log 1 10 3100ln(2)
25759 bit/s 25.759 kbit/s
C B !�
� � � � � �
� �
b) Now we solve the signal to noise ratio from the capacity theorem
56 3.12 1 2 1 274130 10 log 274130
54.38 dB
R B SNR! � � � � � " �
�
c) This can be solved by inserting the Taylor series of ln(1+!)
2
2
1ln 1 ...
2lim lim
ln(2) ln(2)
1...
2lim
ln(2) ln(2)
o o o
B B
o o
B o
P P PN B N B N B
C B B
P PN B N P
N
� �
�
# $# $� � % %� � �% %� � � �% %% %� � � �� �& ' & '% % % %% % % %( ) ( )
# $� % %� �� �% %� �� �& '% %% %( )

10P4 A discrete memoryless source has an alphabet of five symbols with
probabilities of occurrence {.55, .15,.15,.10,.05}. Design two different Huffman codes for this source. In the first case move a combined symbol as high as possible and in the second as low as possible. Find the average code-word length and its variance for both cases. Calculate code efficiency for both cases. Which code is better?
Procedure for Huffman code with placing a combined symbol as low as
possible
The resulting source code is
0
1
2
3
4
011
10010101011
s
s
s
s
s
The average code-word length is
4
01.9k k
kL p l
�� �*
� �42
01.29k k
kp l L�
�� � �*
The code efficiency is defined as ratio of the source entropy to its average code length:
42
0
1log
( )0.97
kkk
ppH s
L L+ �
*� � �

11Procedure for Huffman code with placing a combined symbol as high as
possible The resulting code is
0
1
2
3
4
0100101110111
s
s
s
s
s
The average code length is the same as calculated for the first case. The variance is calculated to be 0.99. Because of lower variance the code with placing the combined symbol higher is better.

12P 6 Encode with Lempel-Ziv algorithm the sequence TOBEORNOTTOBEORTOBEORNOT using 6 bit code words. The initial
dictionary contains of capital letters. What is the compression gain. Initial dictionary in binary form: A = 000001 B = 000010 C = 000011 . . . Z = 011000 The encoding procedure is the following, first encode then store a new
symbol in the dictionary by adding one letter to the matching old symbol:
Symbol Binary Output New Dictionary Entry T 20 = 010100 O 15 = 001111 27:TO B 2 = 000010 28:OB E 5 = 000101 29: BE O 15 = 001111 30: EO R 18 = 010010 31: OR N 14 = 001110 32: RN O 15 = 001111 33: NO T 20 = 010100 34: OT TO 27 = 011101 36: TT BE 29 = 011101 37: TOB OR 31 = 011111 37: BEO TOB 36 = 100100 38: ORT EO 30 = 011110 39: TOBE RN 32 = 100000 40: EOR OT 34 = 100010 41: RNO
42: RNOT Encoded output is 16 * 6 = 96 bits instead of 24 * 5 = 120 bits. The compression gains is 24 bits or 20%.

13 P7 In a four-symbol digital system with equally probable symbols the pulses shown in the figure are used in transmission over a AWGN-channel.
t
s (t)
t
s (t)
t
s (t)
t
s (t)
T
T T
T
E_T
E_T
E_T
E_T
E_T
_ _
1 2 3 4
a) Convert the pulse wave forms into signal vectors using rectangular
pulses as basis functions. b) Sketch the optimum receiver using matched filters. Draw the filter
impulse responses. c) Using the vector representation draw the signal constellation in the r1
-r2-coordinate system and derive the SEP-expression. d) Derive the exact BEP-expression when Gray-coding is used. SOLUTION: a) One can immediately see that two separate rectangular pulses form a
minimum-dimensioned orthonormal function set.
t
(t)
t
2T
T/2
_,1 2
T_
T/2 T
(t),2
The basis function amplitude is determined fron the normalization
condition
2( ) 1i t dt, �-
Vectorization:
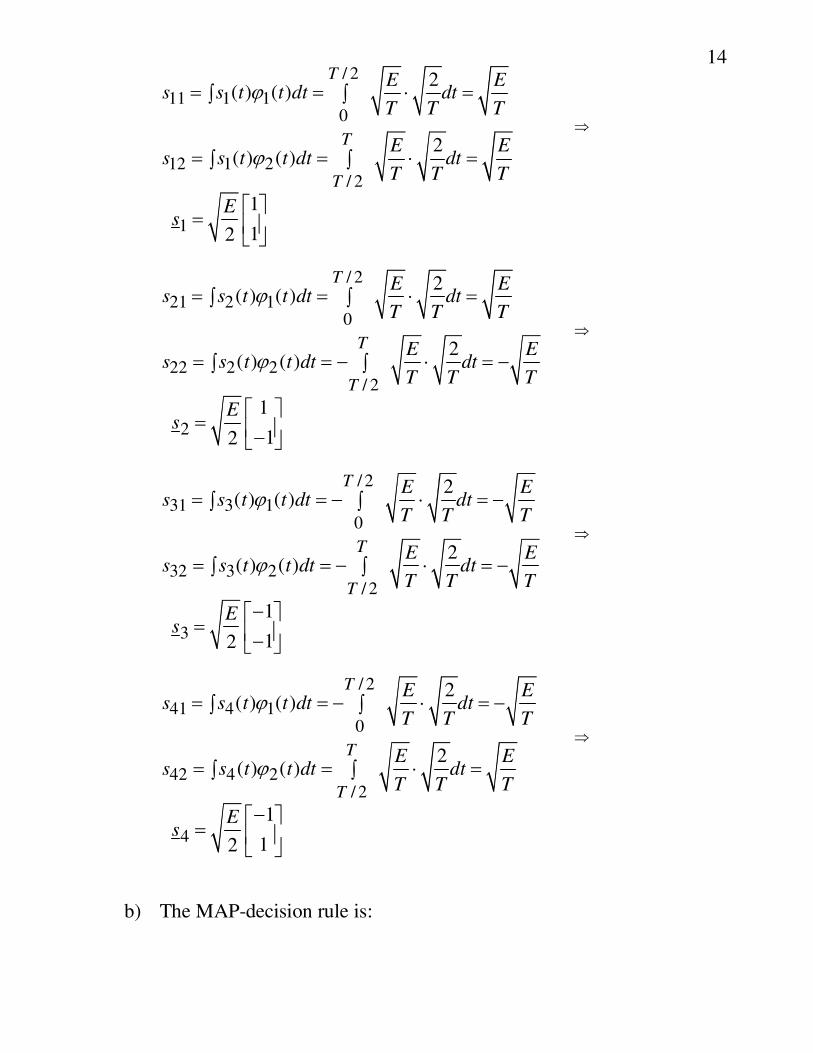
14
/ 211 1 1
0
12 1 2/ 2
2( ) ( )
2( ) ( )
T
T
T
E Es s t t dt dt
T T T
E Es s t t dt dt
T T T
,
,
� � � �- -
� � � �- -
.
1112
Es
� �� � �
� �
/ 221 2 1
0
22 2 2/ 2
2( ) ( )
2( ) ( )
T
T
T
E Es s t t dt dt
T T T
E Es s t t dt dt
T T T
,
,
� � � �- -
� � � � � �- -
.
2112
Es
� �� � ��� �
/ 231 3 1
0
32 3 2/ 2
2( ) ( )
2( ) ( )
T
T
T
E Es s t t dt dt
T T T
E Es s t t dt dt
T T T
,
,
� � � � � �- -
� � � � � �- -
.
3112
Es
�� �� � ��� �
/ 241 4 1
0
42 4 2/ 2
2( ) ( )
2( ) ( )
T
T
T
E Es s t t dt dt
T T T
E Es s t t dt dt
T T T
,
,
� � � � � �- -
� � � �- -
.
41
12E
s�� �
� � �� �
b) The MAP-decision rule is:

15
� �� �
� �� �
K K 2
k=1 k=1
K
k=1
: MAX ln 0.52
MAX ( ) ( ) ln 0.52
oi k ik i ik
ok ik i i
Nm r s P m s
Nr t t dt s P m E,
# $� �* *& '
( )
# $. � � �* -& '
( )
As all symbols are equiprobable and all symbol energies equal, the
two last terms need not to be considered, and a sufficient decision rule is:
� �
K
k=1
K
k=1
: MAX ( ) ( )
MAX ( ) ( )
i k ik
ik k
m r t t dt s
s r t T t
,
,
# $. �* -& '
( )
# $� � / �*& '
( )
The second version is the matched filter solution. Remembering that
the signal components sik takes only the values +1 and -1, the block diagram of the optimum receiver is the one given in the figure.
r(t)
+
+
+
+
_
_
_
_
Select
largest

16c) The signal constellation and the borders between the decision
areas are given in the figure below.
The borders are half-way between the constellation points when the symbols are equiprobable. Due to symmetry all conditional SEP:s are equal, and e.g.
Average SEP is calculated in the following manner:
d) Gray-coding can be realized e.g. as in the figure below.
Also with respect to bit errors the situation is symmetrical and the error situation of one symbol gives the average BEP. We will again investigate symbol m3.
Starting with the conditional BEP.s when the received vector is on a given decision area.
0 1 1 21
11 01 ,2 2 2
11 Q Q
2
b
o o
E EP E P n n
E EN N
# $� � � �& '
( )
� � � � �� �� � � �� �� � � �� �
0001
11 10

17
0 1 1 21
11 10 ,2 2 2
1Q 1 Q
2
b
o o
E EP E P n n
E EN N
# $� � � �& '
( )
� � � � �� �� � � �� �� � � �� �
0 1 1 2
2
211 00 ,
2 2 2
Q
b
o
E EP E P n n
EN
# $� � � �& '
( )
� � � �
� �
The number in front of the probability tells the fraction of error bits in
a given error event. Because the error events are separate, the total probability conditioned on a certain symbol is obtained by summing the BEP:s of the separate error events:
0 1 0 1 0 1 0 1
2
11 11 01 11 11 11 00
11 Q Q
2
1Q 1 Q
2
Q
Q
b b b b
o o
o o
o
bo
P E P E P E P E
E EN N
E EN N
EN
EP
N
� � � � � �
� � � � �� �� � � �� �� � � �� �
� � � � �� �� � � �� �� � � �� �
� � � �
� �
� � �� �
� �

18P8 In baseband binary transmission the symbol values -1 and +1 are
equiprobable. The decision circuit input noise is Laplace-distributed (symmetrically exponentially distributed):
21
( ) exp2
np n
��
� � � �� �
� �
where � is the r.m.s. noise amplitude. a) Derive the BEP-expression when the signal samples are 2s. b) Calculate how many dB better the signal to noise ratio must be in the
Laplace-channel than in the Gaussian channel on the BEP-levels 10 10 103 6 9� � �, and .
Note! 3 6 9(3.09) 10 , (4.75) 10 , (6.00) 10Q Q Q� � �� � � SOLUTION: a)
s
P p (r-s)P p (r s) 1-1 nn +
r-s P(E 1)P(E -1)
Because the symbol values are equiprobable the conditional BEP:s are
equal and the application of the total probability formula gives:
P E P E s p r s dr p r drn ns
( ) ( ) ( ) ( )� � � � �� � �
10
� �������� � � � � �
������
� �������
12
2 12 2
2
12
2
� � ��
�
�
exp exp
exp
rdr
r
s
s s

19b)
P E
sP E
s
s P E
( ) exp ln ( )
ln ( )
� ������� . � � � �
. � �� �
12
22
2
22
� �
�
Numerical calculations: The Laplace-channel requires higher SNR:s than the Gaussian
channel. The difference is larger on smaller BEP-values.
P(E) s/� �SNR 10-3 4.39 � �20lg 4.39 3.09 3.1dB�
10-6 9.28 � �20lg 9.28 4.75 5.2dB�
10-9 14.16 � �20lg 14.16 6.00 7.5dB�
20 P9 Investigate how many dB a ML-reference receiver is degraded
compared to a MAP-reference receiver as a function of the occurrence probability of a binary 0 in the AWGN-channel. Give numerical results for the bit error probabilities 10-3 and 10-6.
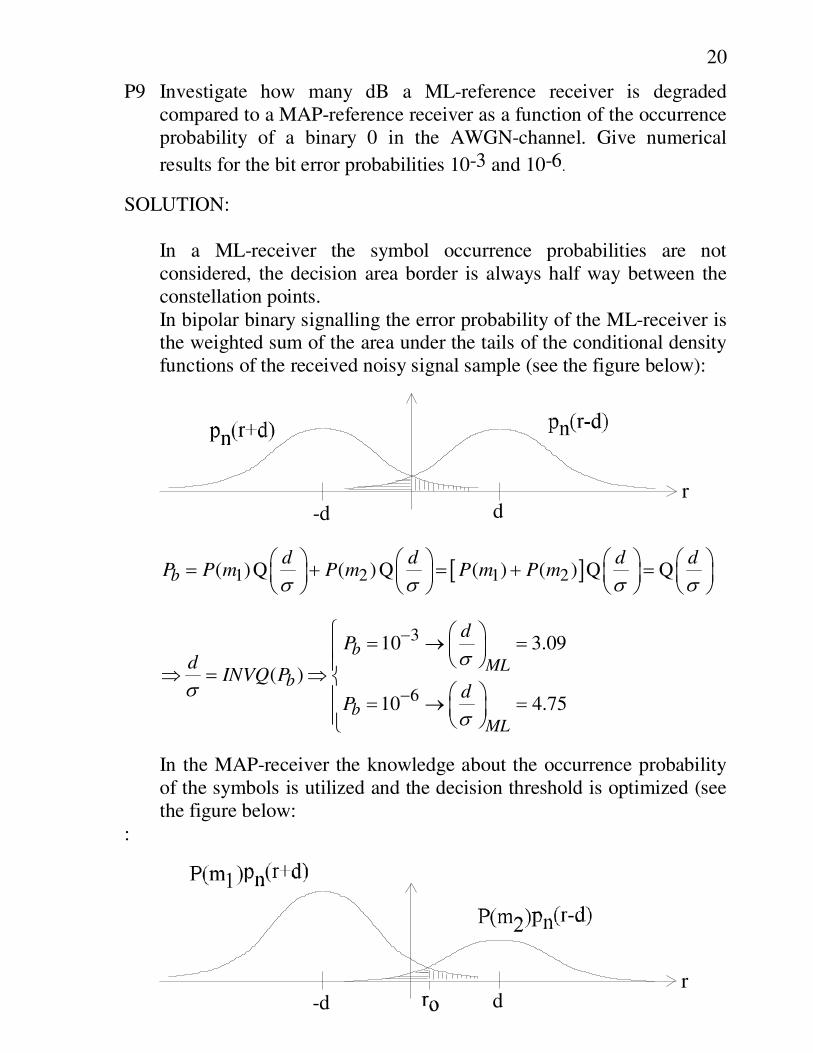
SOLUTION: In a ML-receiver the symbol occurrence probabilities are not
considered, the decision area border is always half way between the constellation points.
In bipolar binary signalling the error probability of the ML-receiver is the weighted sum of the area under the tails of the conditional density functions of the received noisy signal sample (see the figure below):
rd-d
3 41 2 1 2( )Q ( ) Q ( ) ( ) Q Qbd d d d
P P m P m P m P m� � � �� � � � � � � � �� � � � � � � �� � � � � � � �
3
6
10 3.09
( )10 4.75
bML
b
bML
dP
dINVQ P
dP
��
�
�
�
# � � � �� �% � �%. � . &
� % � � �� �% � �(
In the MAP-receiver the knowledge about the occurrence probability
of the symbols is utilized and the decision threshold is optimized (see the figure below:
:
rd-d

21
1 2( ) Q ( ) Qo ob
d r d rP P m P m
� �� �� � � �� � � �
� � � �
Optimikynnys ro lasketaan kaavasta:
� � � �1 2( ) ( )n o n oP m p r d P m p r d� � �
In the AWGN-channel:
� � � �2 2
2 22 21 21 1
( ) e ( ) e2 2
o or d r d
P m P m� � � �
� �� �
�
Taking the logarithm of both sides gives:
� � � �2 2
1 22 2ln ( ) ln ( )
2 2o or d r d
P m P m� �
� �� � �
from which the next expression is obtained:
� � � �2 2 2 2 2 21 22 ln ( ) 2 2 ln ( ) 2o o o oP m r r d d P m r r d d� �� � � � � � �
or 1
2
( )ln
( )or P m
d P m�
��
Insertion into the above error probability expression gives:
1 21
1 22
ln ( ) ( )( )Q 1
ln ( ) ( )( )Q 1
bP m P m
P P m
P m P mP m
!!
!!
� � � �� �� �� �� �� �� �
� � � �� �� �� �� �� �� �
where 2 2d! ��
Solving ! from this expression is not an easy task. By a trial and error method the required !-values for the different P(m1)-values are obtained. The results are given in a table and also graphically

22
P(m1)
d
MAP�����
20lg
d
dML
MAP
�
�
��������
�
�
����
�
�
����
d
MAP�����
20lg
d
dML
MAP
�
�
��������
�
�
����
�
�
����
Pb=10-3
Pb=10-6
0.50 3.09 0 4.75 0 0.55 3.09 0 4.75 0 0.60 3.08 0.02 4.75 0 0.65 3.07 0.06 4.74 0.02 0.70 3.06 0.08 4.74 0.02 0.75 3.04 0.14 4.72 0.06 0.80 3.02 0.20 4.71 0.07 0.85 2.98 0.31 4.68 0.13 0.90 2.92 0.49 4.64 0.20 0.95 2.80 0.86 4.57 0.34 0.99 2.45 2.02 4.39 0.68 0.995 2.26 2.72 4.30 0.86 0.998 1.90 4.22 4.18 1.11 0.999 4.09 1.30
From the results it can be observed that there should be a considerable
unbalance in the occurrence of the binary values before the ML-receiver shows a significant degradation when compared with the MAP-receiver.

23P10 In a bipolar binary optimum PAM-system the decision threshold
wanders as function of time as given in the figure below.
The constellation points are +d and �d. a) Derive the expression of the average BEP. b) Calculate the largest allowable value of the parameter a, if degrada-
tion caused by decision threshold wandering must be less than 1 dB on the BEP-level 10-9.
Usable formulas:
2 2e
Q( ) Q( )2
xx dx x x C
�
�� � �- , Q(6.00)=10-9
2 2
2 4e 1 3
Q( ) 1 ...2
xx x
x x
� � �� � � �� �
� �
SOLUTION: a) On a given time instant the decision situation is as depicted in the figure:
The BEP-expression conditioned on a normalized threshold wander y
is:
� � � � � �1 1Q 1 Q 1
2 2d d
P y y y5� �� � � � � �� � � �� � � �
The average BEP is obtained by integrating the conditional BEP
weighted with the wander density function:

24
� � � � � � � �1 1 1( ) Q 1 Q 1
2 2 2
a
a
d dP p y P y dy y y dy
a5 5
� ��
� �� � � � � � � �- - � � � �� �� � � �� �
Changing the integration variable � �1d
x y�
� 2 , gives dy dxd�
� 2 ,
and
� � � � � �
� �2
(1 ) (1 )
(1 ) (1 )
(1 )(1 ) 2
(1 ) (1 )
1 1 1 1Q Q
2 2 2 2
1 1 eQ Q( )
2 2 2
d da a
d da a
dd aa x
d da a
P x dx x dxa d a d
x dx x xa d a d
� �
� �
��
� �
� �5
� �
� �
� �
�� �
� �
� � � � � � �- - � �� �
� �� �� � �-� �� �
2
2 22 2
2 2
(1 )2
2(1 )
(1 ) (1 )2 2
2 2
1 1 e2 2
1 1 1 e2 2 2
(1 ) (1 )
da
x
da
d da a
a d x
ea d d d
a a
�
�
� �
�
�
� �
��
�
� � � �
� �� �� �� �� �
� �� �� �� �� �� � � �� �� � � �� �� � � �� �
22
2(1 )
2
31 1 e2 2
(1 )
da
aa d
a
�
�
� ��
� �� �� �� �
The approximations are valid only on small BEP-values. b) As threshold wandering may cause a 1 dB degradation, we have:

25
1 2010 6.00 6.73d�� � �
The a-value giving the 1 dB degradations is obtained by trial: a =
0.172. Checking the second term give the value 8.57�10-17, which can be neglected compared to the first term (10-9). Investigation of the leading term is sufficient.