s anandakrishnan, e kirby penn state university · climate-cryosphere-tectonics* ! s...
TRANSCRIPT
Climate-Cryosphere-Tectonics* !
S Anandakrishnan, E Kirby Penn State University
1
* Change and Interactions among Climate, Hydrology, Surface Processes, and Tectonics:!
Sean Gulick (co-chair), Kelin Whipple, Beatrice Magnani
2
SEISMOLOGICAL GRAND CHALLENGES
IN UNDERSTANDING EARTH’S DYNAMIC
SYSTEMS
JANUARY 2009
LONG-RANGE SCIENCE PLAN FOR SEISMOLOGY WORKSHOP
SEPTEMBER 18–19, 2008, DENVER, CO
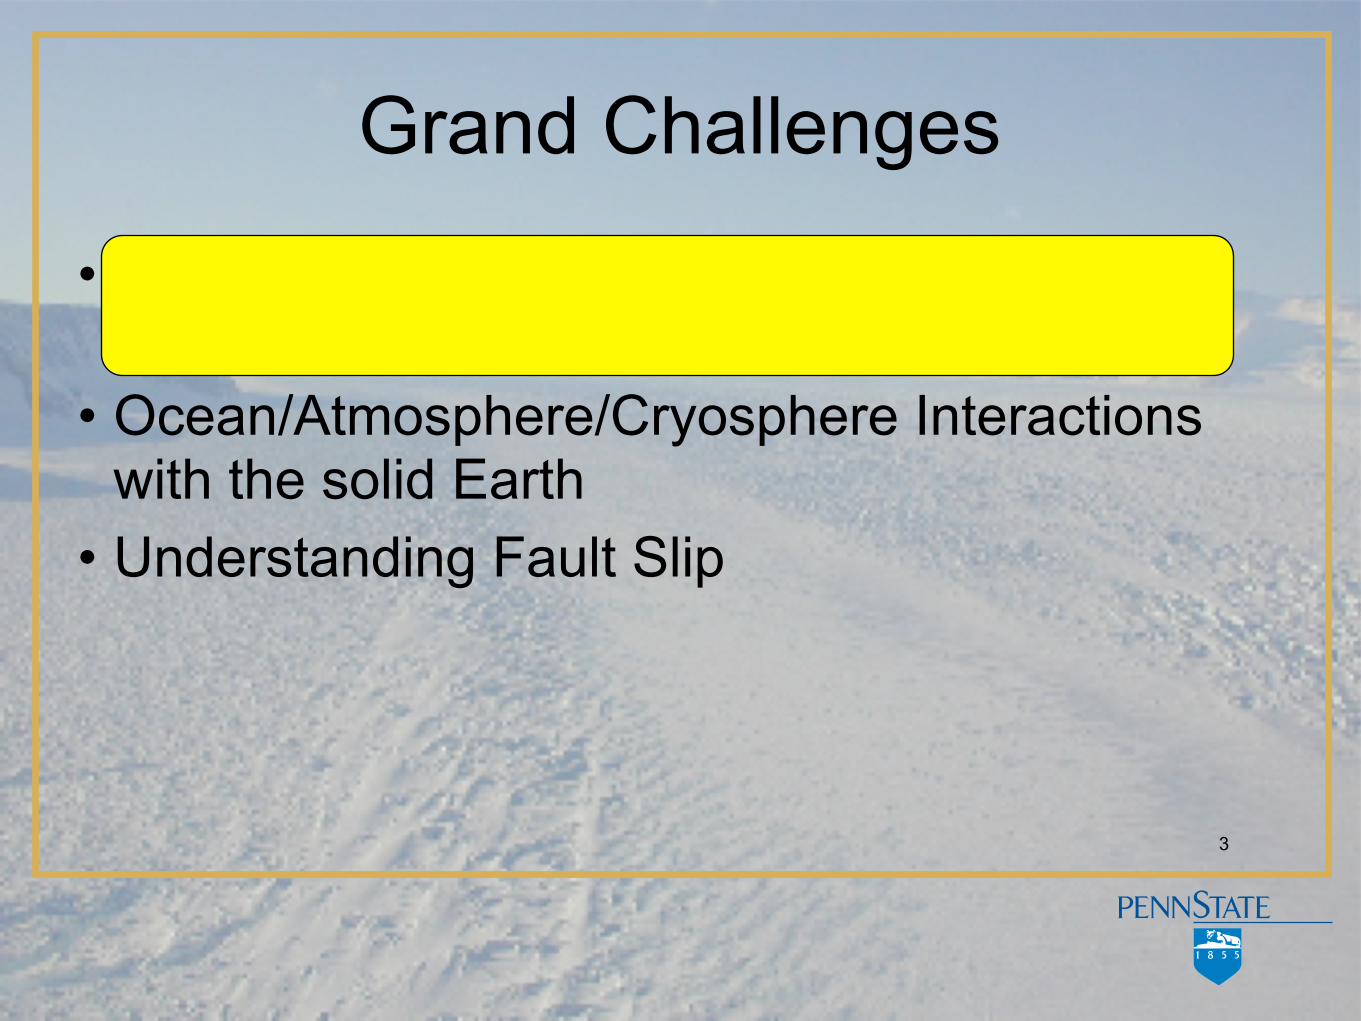
Grand Challenges
• Near-surface effects on Natural Hazards and Resources
• Ocean/Atmosphere/Cryosphere Interactions with the solid Earth
• Understanding Fault Slip
3
4
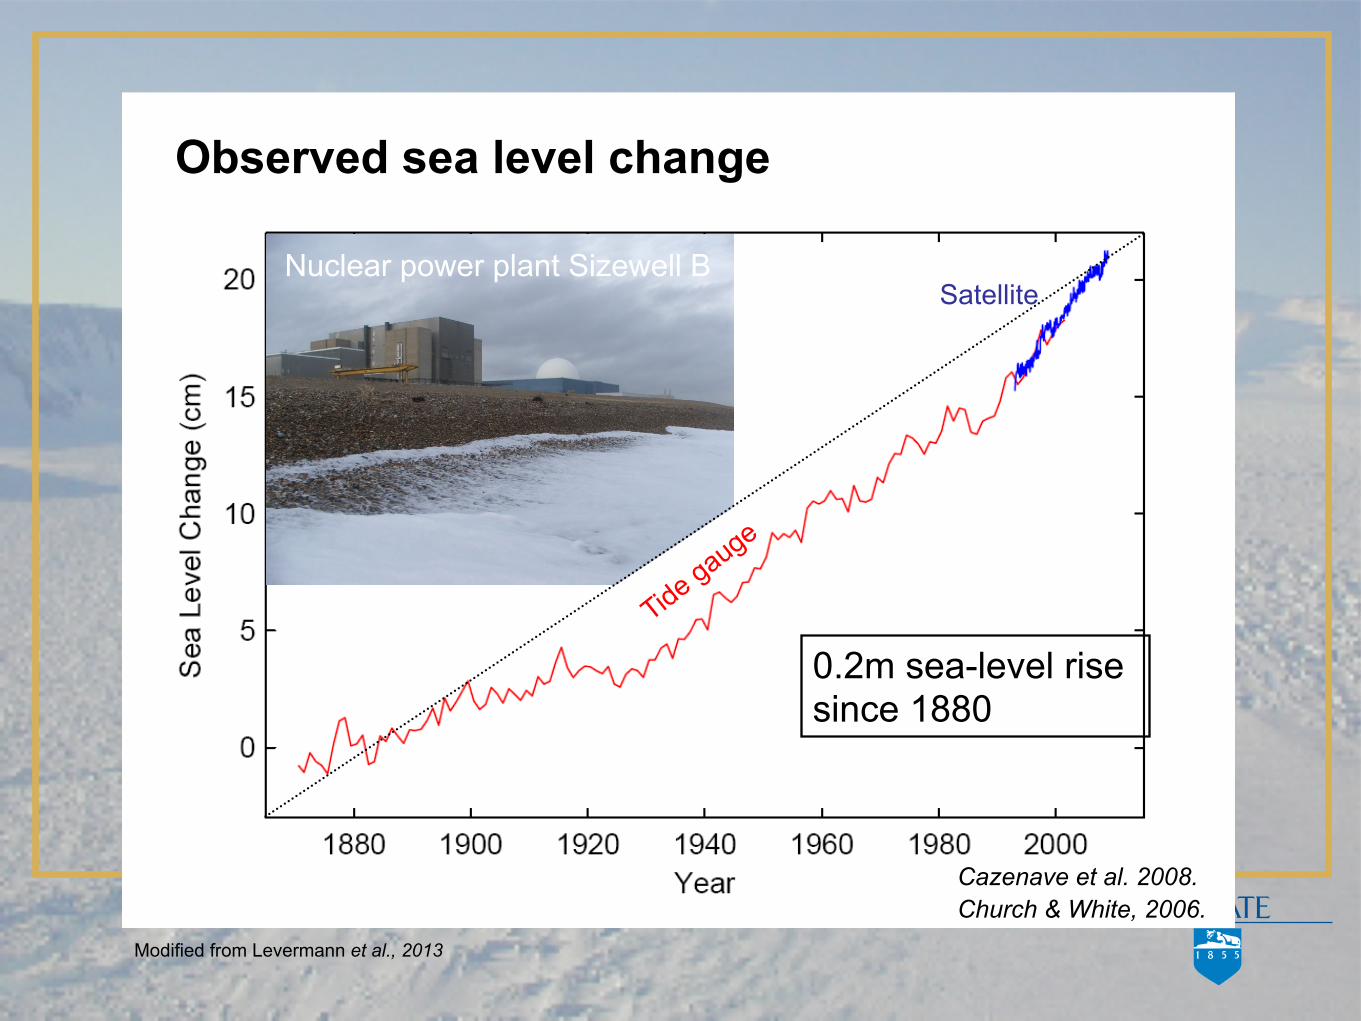
Satellite
Tide gauge
0.2m sea-level rise since 1880
Observed sea level change
Nuclear power plant Sizewell B
Cazenave et al. 2008. Church & White, 2006.
Modified from Levermann et al., 2013
5
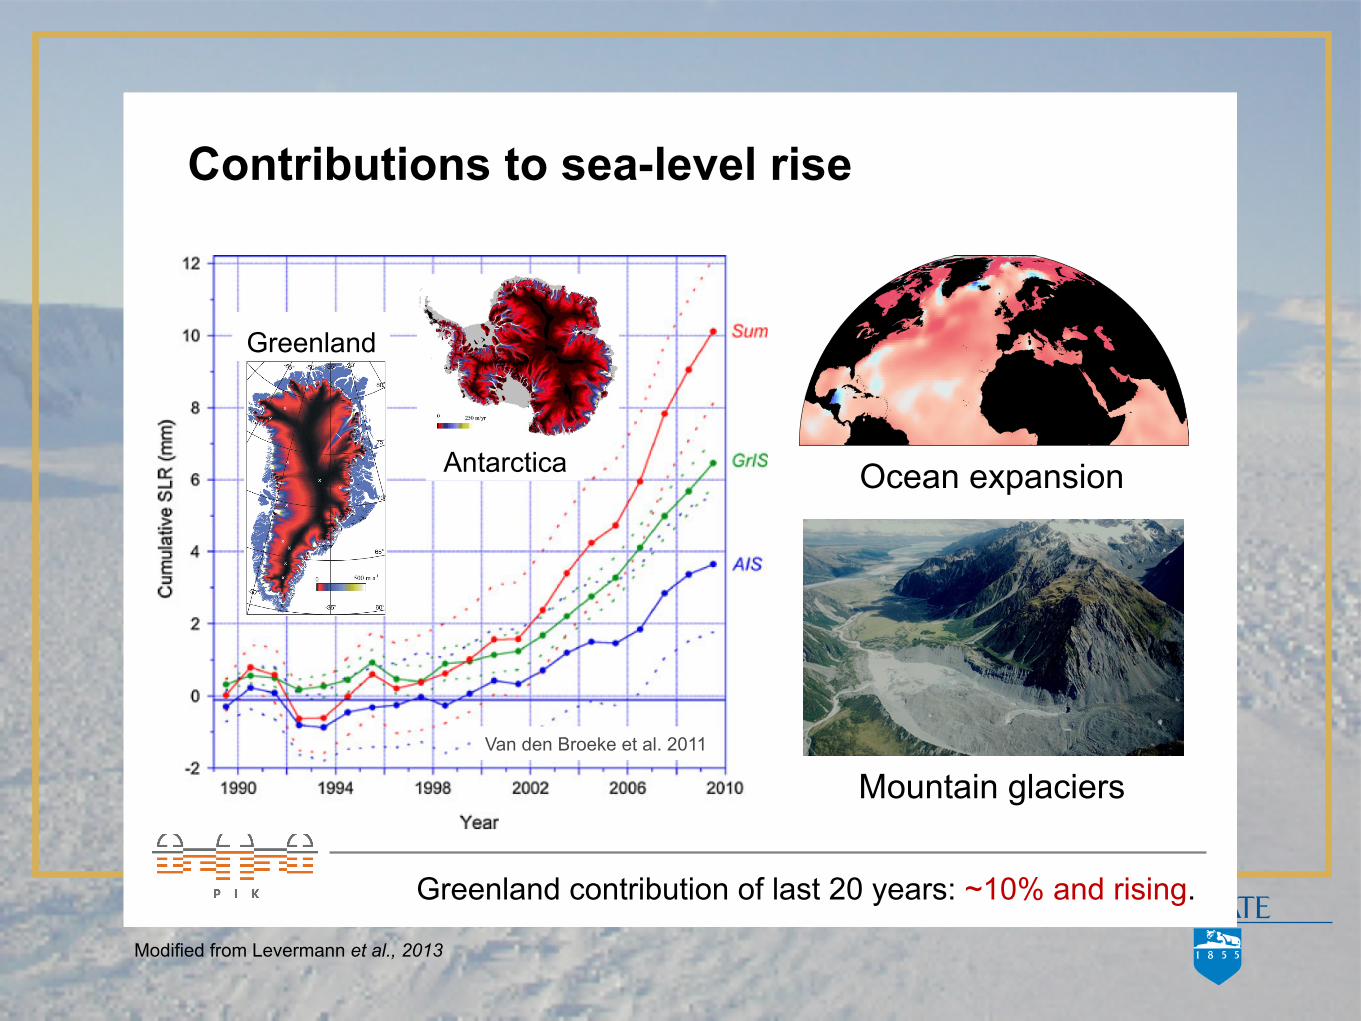
Contributions to sea-level rise
Greenland contribution of last 20 years: ~10% and rising.
Van den Broeke et al. 2011
Ocean expansion
Mountain glaciers
Antarctica
Greenland
Modified from Levermann et al., 2013
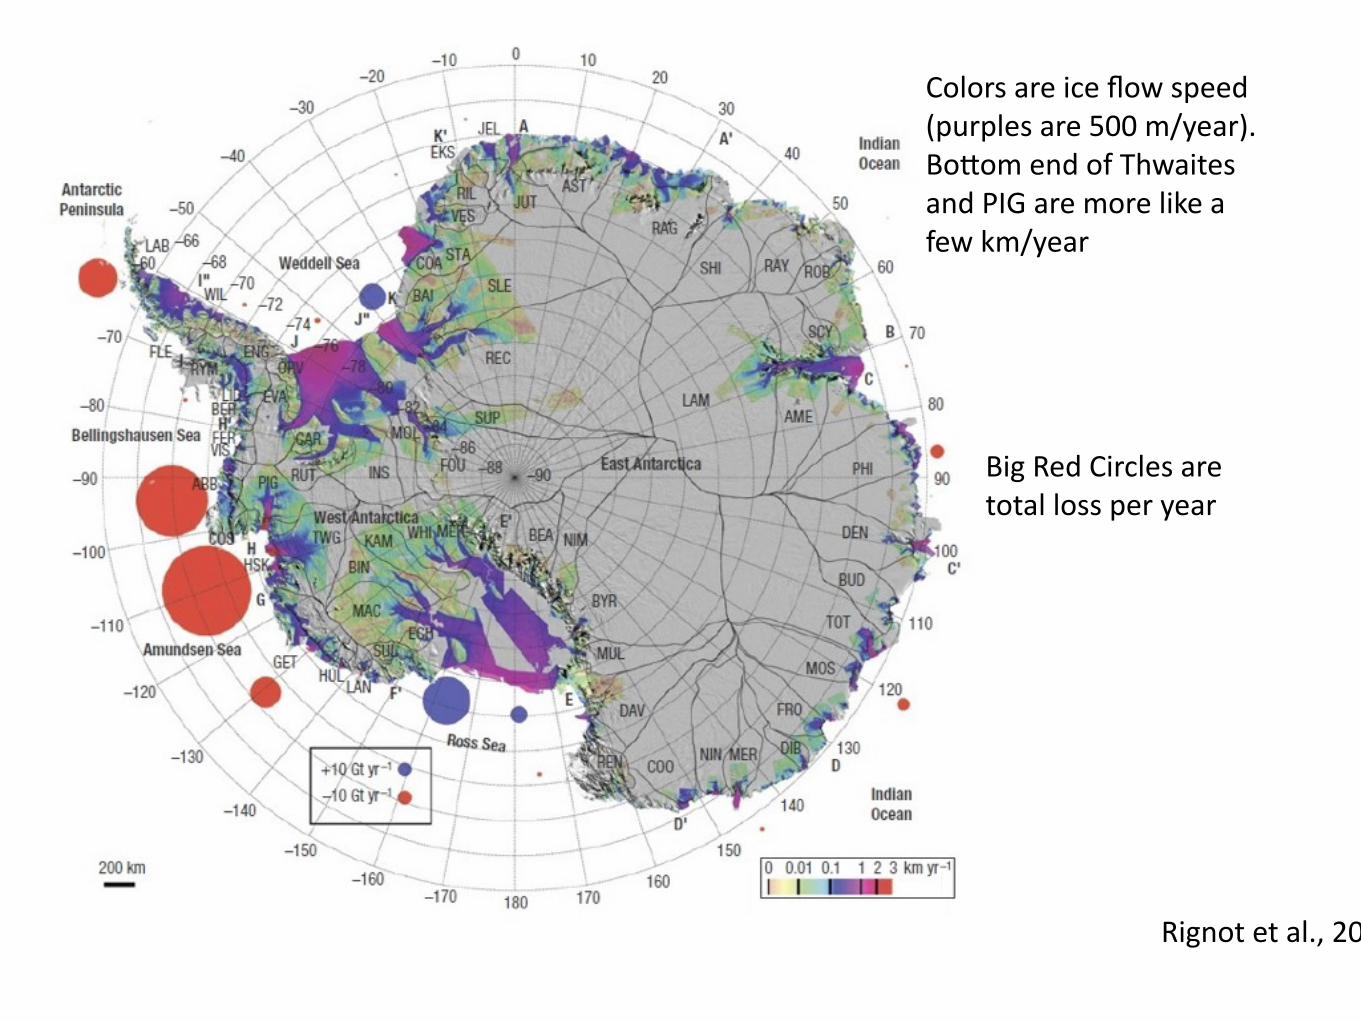
Rignot et al., 2008
Colors are ice flow speed (purples are 500 m/year). Bo@om end of Thwaites and PIG are more like a few km/year
Big Red Circles are total loss per year
8
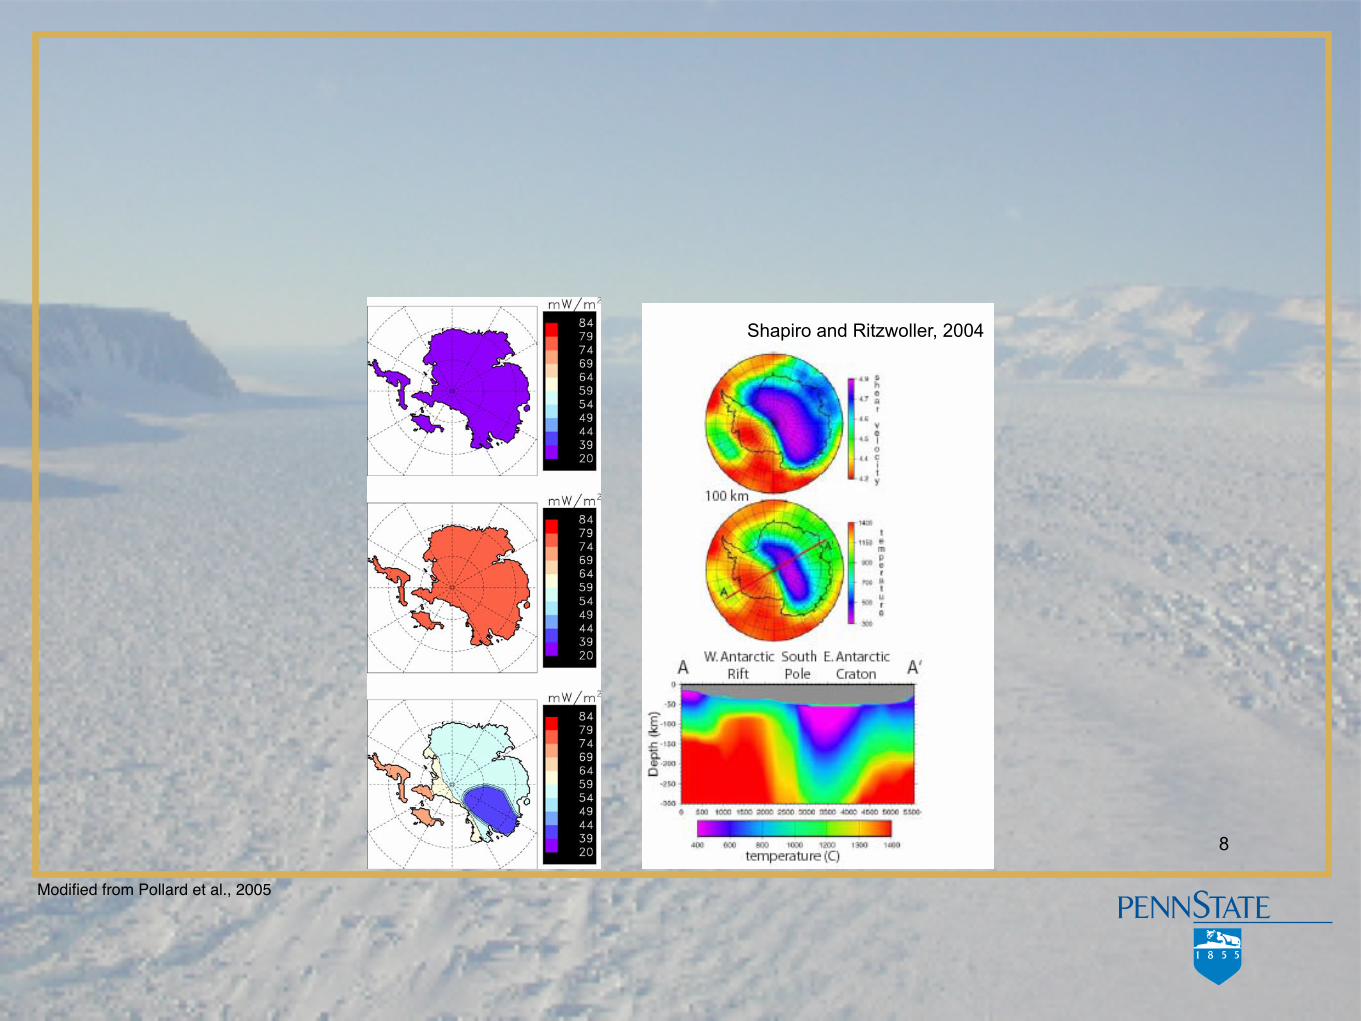
Shapiro and Ritzwoller, 2004
Modified from Pollard et al., 2005
Grand Challenges
• Near-surface effects on Natural Hazards and Resources
• Ocean/Atmosphere Interactions with the solid Earth
• Understanding Fault Slip
9
Double Click Here
10
Double Click Here
11
Grounding Zone FeaturesThe Siple Coast Grounding Zone
Observations
MCDW
ICE SHELF
ICE ADVANCE
WINDS
SEA ICEWRSSW AASW
CDW
MELTING
FREEZING
GROUNDING LINE
CONTINENTAL SHELF
CONTINENTALSLOPE
HSSW ( + LSSW )
HSSW ( + LSSW )
ISWISW
Location of vertical section (Fig. 2)
C
T
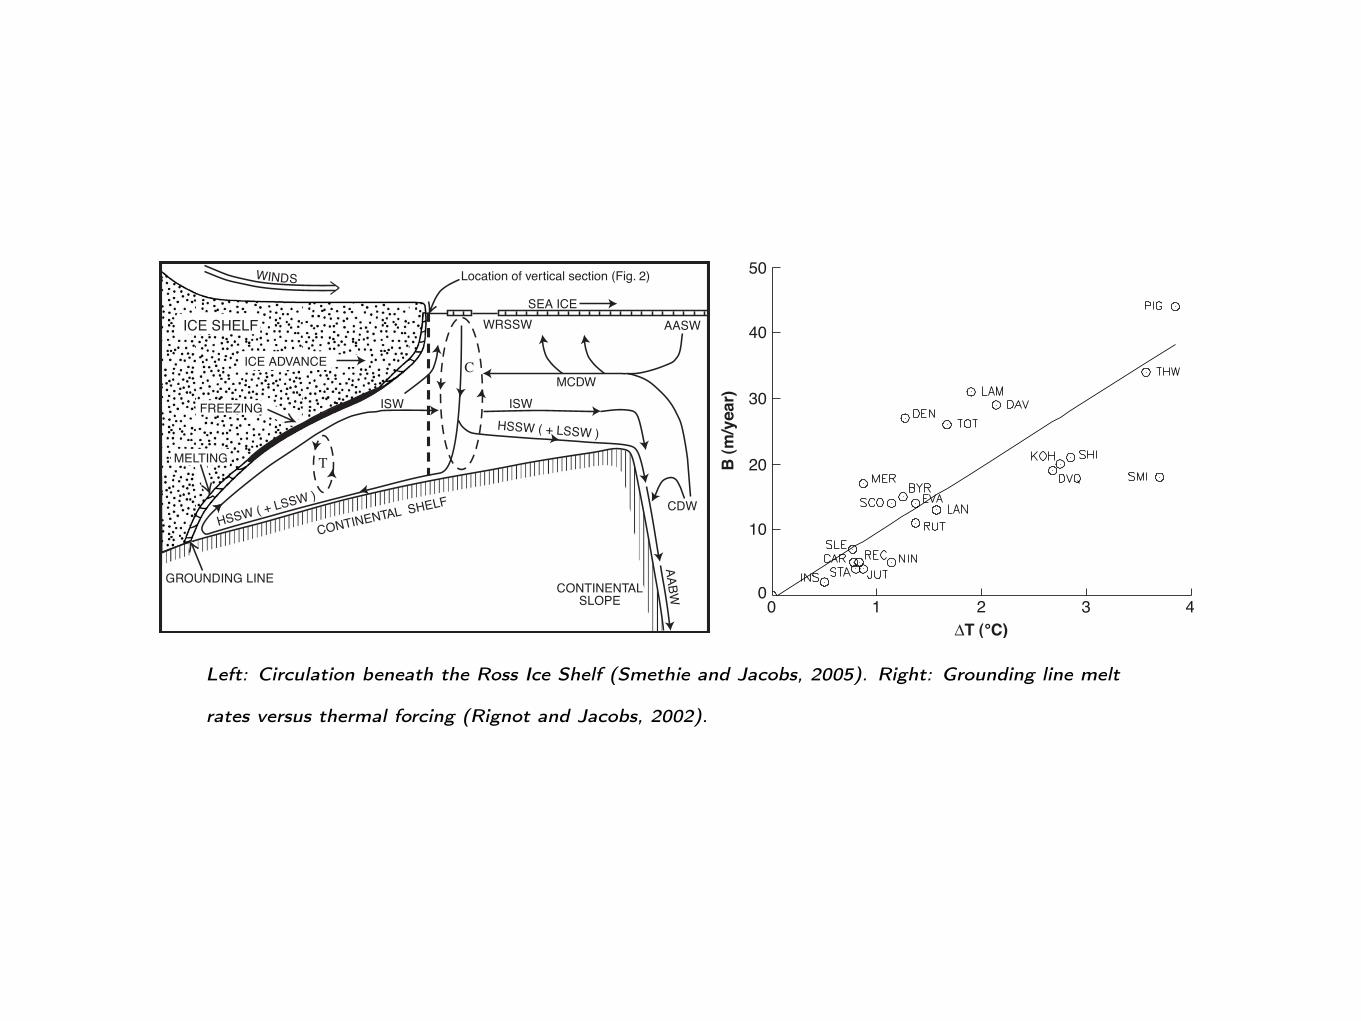
AABWLeft: Circulation beneath the Ross Ice Shelf (Smethie and Jacobs, 2005). Right: Grounding line melt
rates versus thermal forcing (Rignot and Jacobs, 2002).
Horgan and others Whillans Ice Stream Grounding Zone
Ocean/ice interactions
• Ice shelf calving rates & mechanisms • Ice shelf cavity geometry • Ocean circulation and temperature structure
13
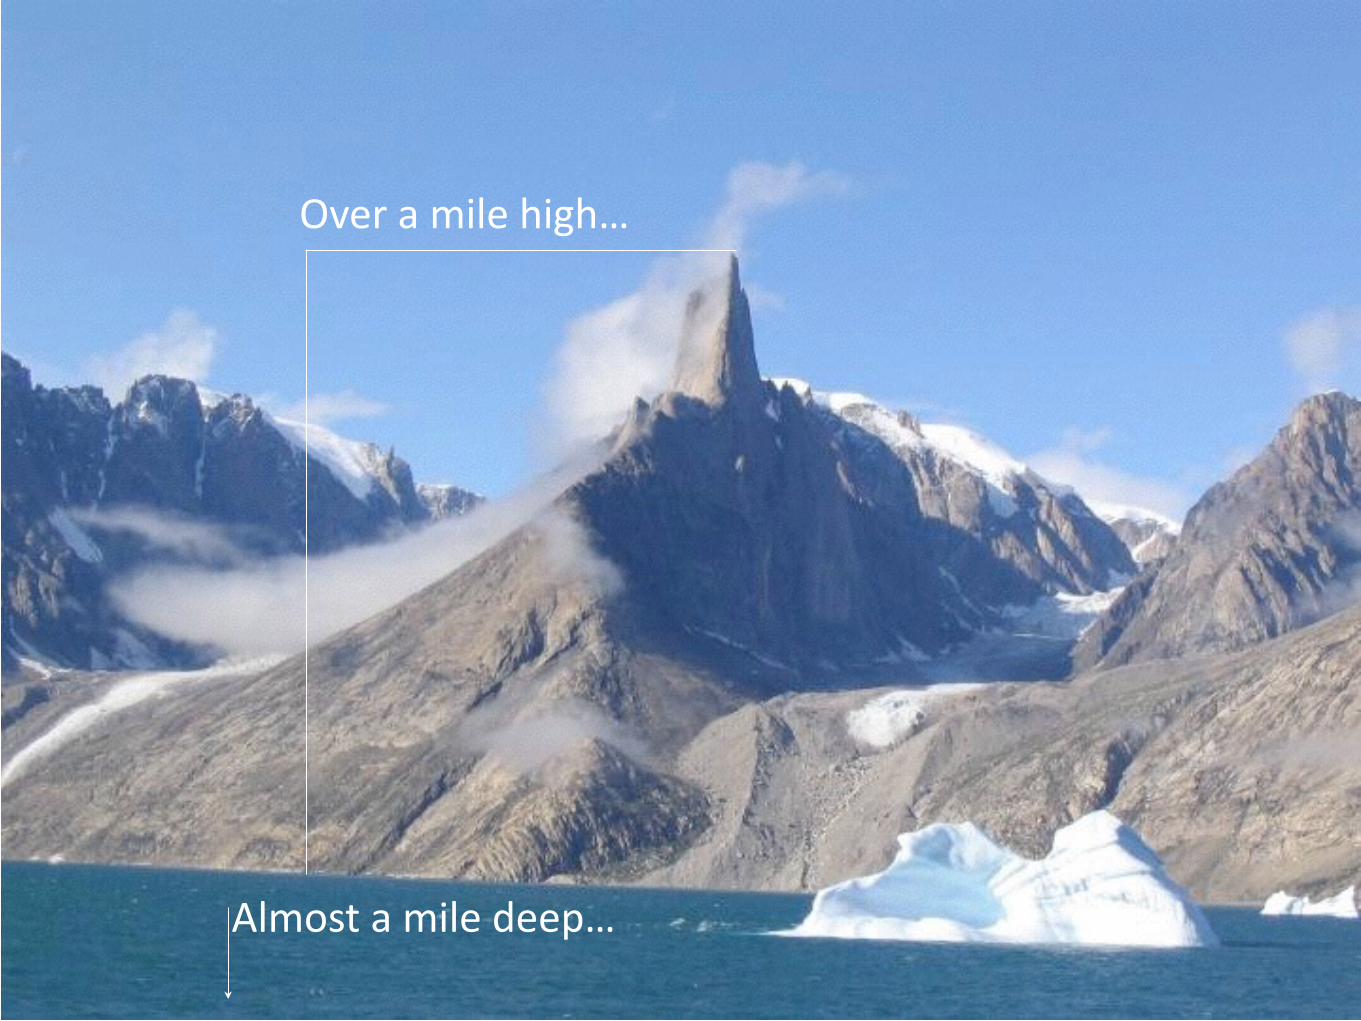
Over a mile high…
Almost a mile deep…
Glaciers matter
• Glaciers make spectacular features • Glaciers can modify their beds faster than
rivers can • Numbers range from m/yr (Taku, Nolan et al.,
1995; Hallet; Powell) to... • Zero (observations of parts of Laurentide; parts
of Antarctica)
15
Grand Challenges
• Near-surface effects on Natural Hazards and Resources
• Ocean/Atmosphere/Cryosphere Interactions with the solid Earth
• Understanding Fault Slip
16
17
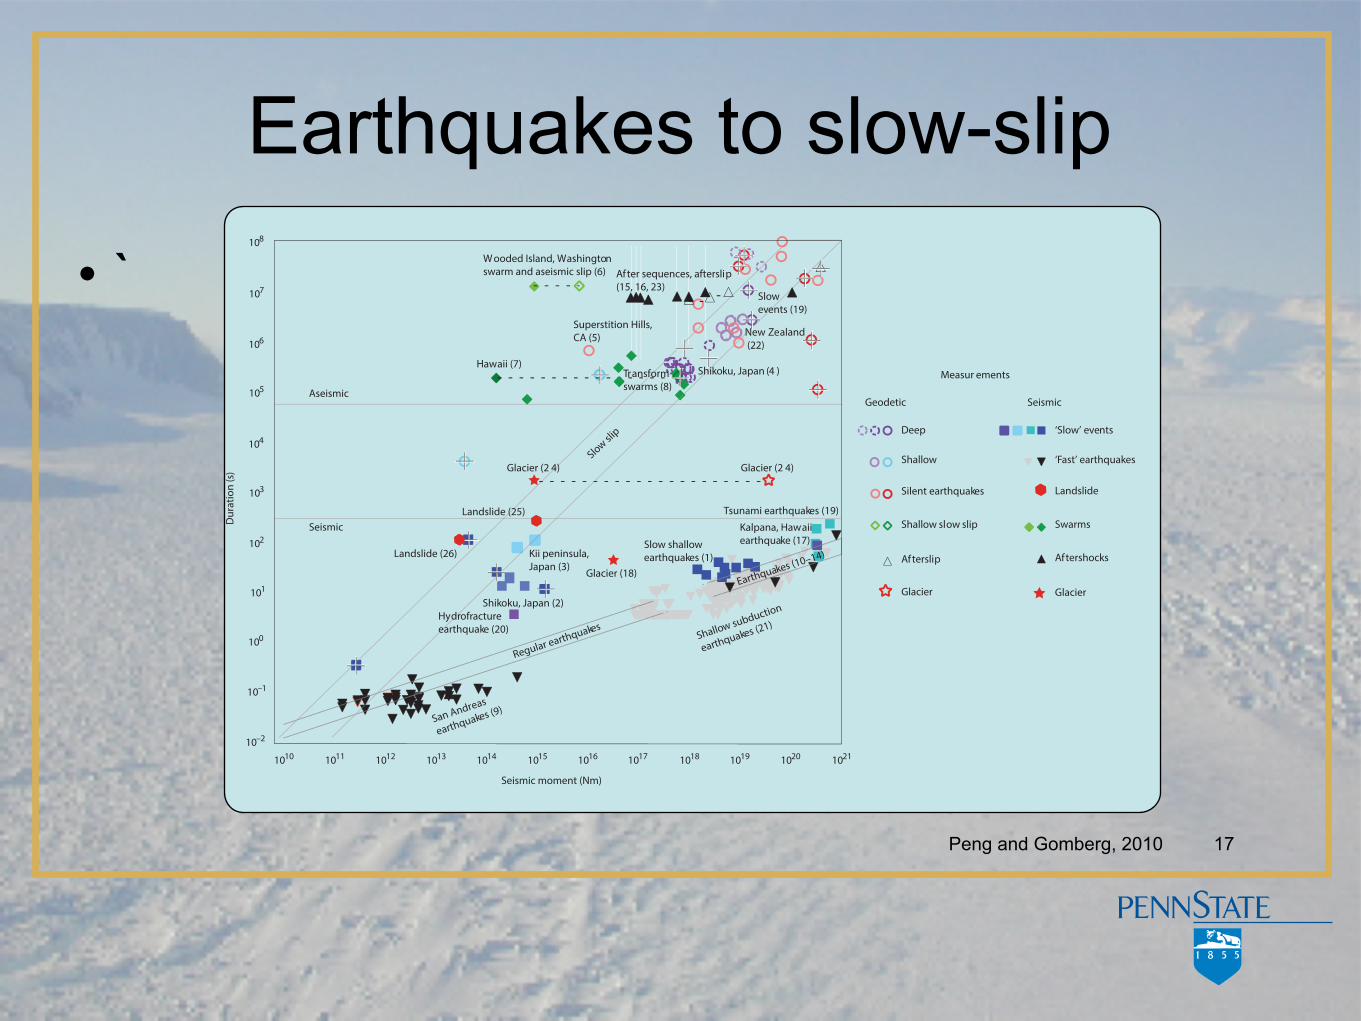
Earthquakes to slow-slip
• `108
1010 1011 1012 1013 1014 1015 1016 1017 1018 1019 1020 1021
107
106
105
104
103
102
101
100
10–1
10–2
Dur
atio
n (s
)
Aseismic
Seismic
Slow slip
Regular earthquakes
Seismic moment (Nm)
San Andreas
earthquakes (9)
Shallow subduction
earthquakes (21)
Earthquakes (10–14)
Glacier (18)
Kii peninsula, Japan (3)
Shikoku, Japan (2)Hydrofractureearthquake (20)
Slow shallow earthquakes (1)
Kalpana, Hawaiiearthquake (17)
Landslide (26)
Landslide (25)
Glacier (2 4) Glacier (2 4)
Tsunami earthquakes (19)
Hawaii (7)
Superstition Hills, CA (5)
Transform swarms (8)
Shikoku, Japan (4 )
W ooded Island, Washingtonswarm and aseismic slip (6) After sequences, afterslip
(15, 16, 23)
New Zealand (22)
Slow events (19)
Geodetic
Deep
Shallow
Silent earthquakes
Shallow slow slip
Afterslip
Glacier
Seismic
‘Slow’ events
‘Fast’ earthquakes
Swarms
Aftershocks
Glacier
Landslide
Measur ements
Peng and Gomberg, 2010
18
50
¬5¬101.00.50.0
¬0.5
1086420
¬2¬4¬6¬8
E018
VNDA
a
Disp
lace
men
t (+
m)
Time (s)
10
¬1.0
Disp
lace
men
t (+
m)
40 60 80 100 120 140 160 180 200Time (min)
02202
0 5 10 15 20 25 30 35
600
500
400
300
200
100
0
b
c
Freq
uenc
y
Inter-event time (min)10 20 30 40 50 60 70 80 90
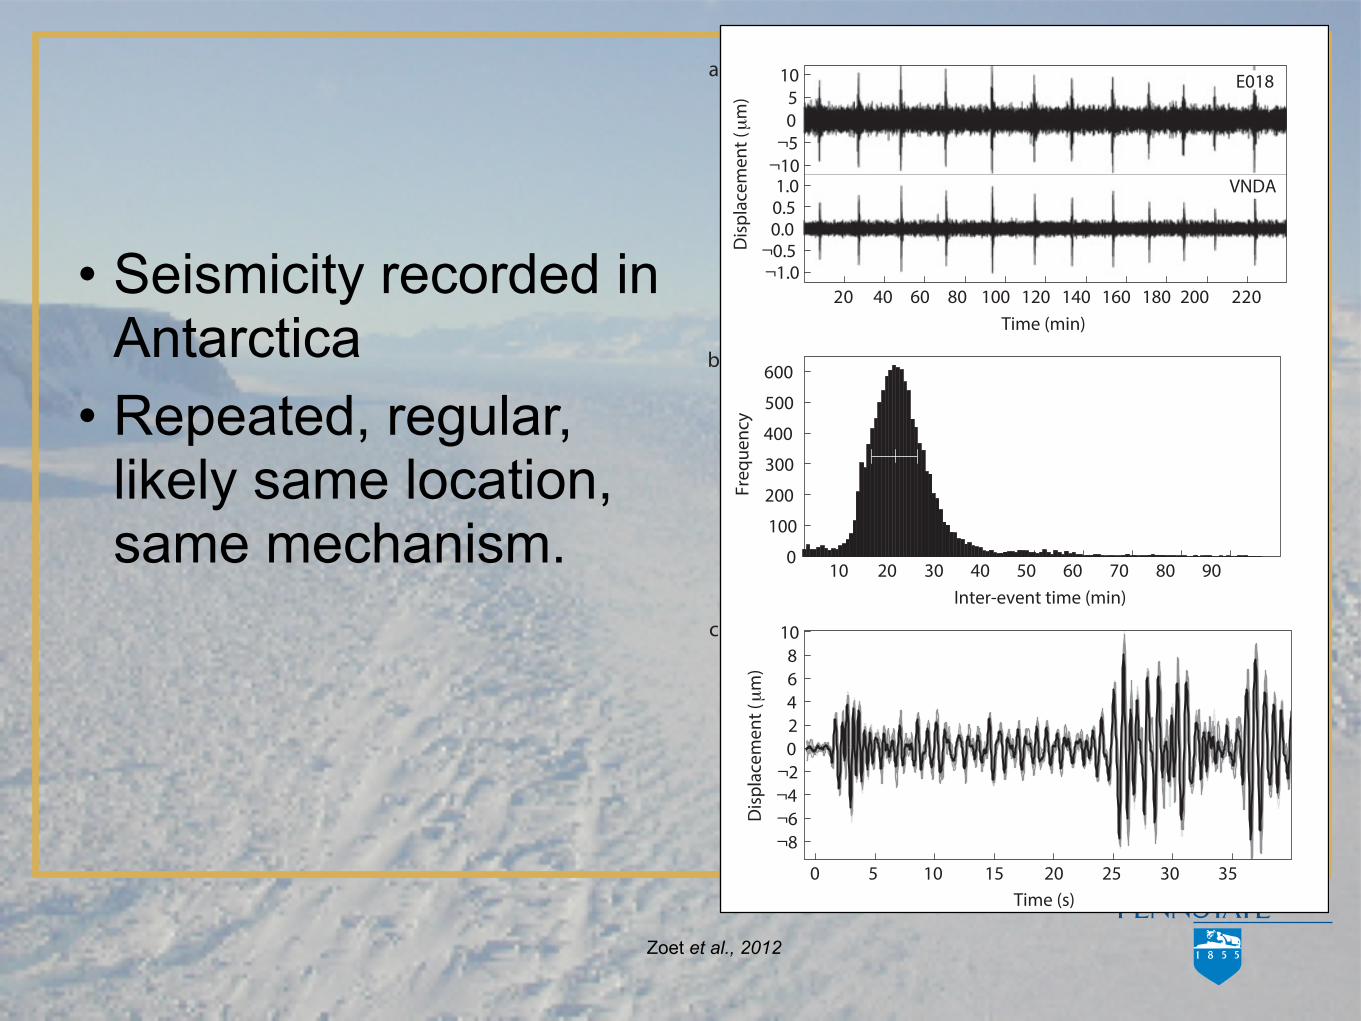
• Seismicity recorded in Antarctica
• Repeated, regular, likely same location, same mechanism.
Zoet et al., 2012
19
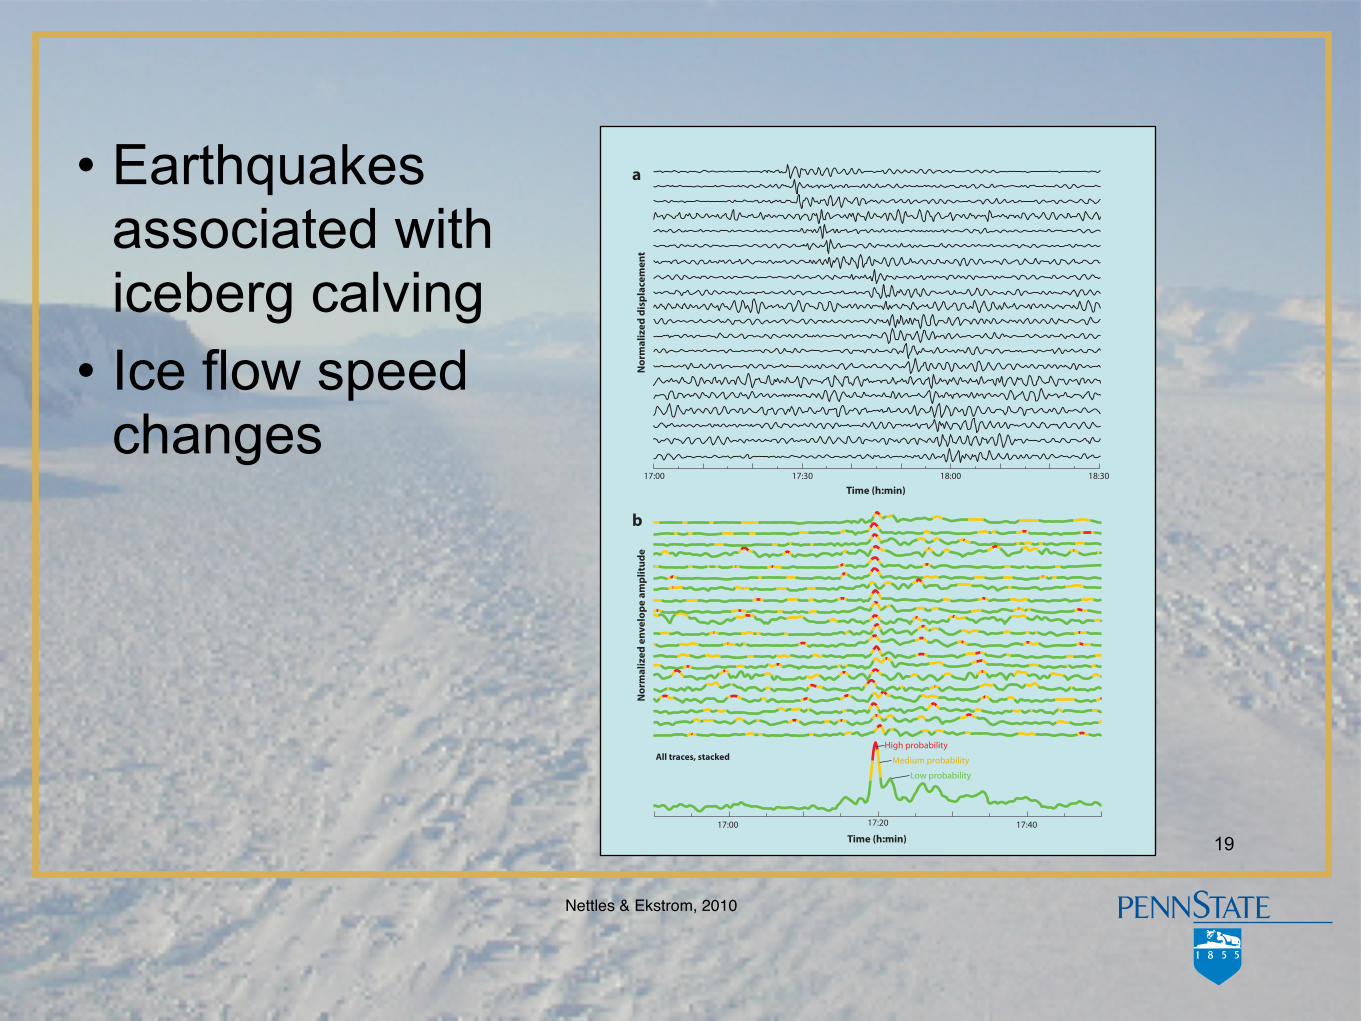
Nettles & Ekstrom, 2010
EA38CH18-Nettles ARI 29 March 2010 14:38
17:20
High probability
Medium probability
Low probability
17:3017:00 18:3018:00
17:00 17:40
Time (h:min)
Time (h:min)
All traces, stacked
Nor
mal
ized
env
elop
e am
plitu
de
Nor
mal
ized
dis
plac
emen
t
a
b
470 Nettles · Ekstrom
Ann
u. R
ev. E
arth
Pla
net.
Sci.
2010
.38:
467-
491.
Dow
nloa
ded
from
ww
w.a
nnua
lrevi
ews.o
rgby
Pen
nsyl
vani
a St
ate
Uni
vers
ity o
n 04
/18/
11. F
or p
erso
nal u
se o
nly.
• Earthquakes associated with iceberg calving
• Ice flow speed changes
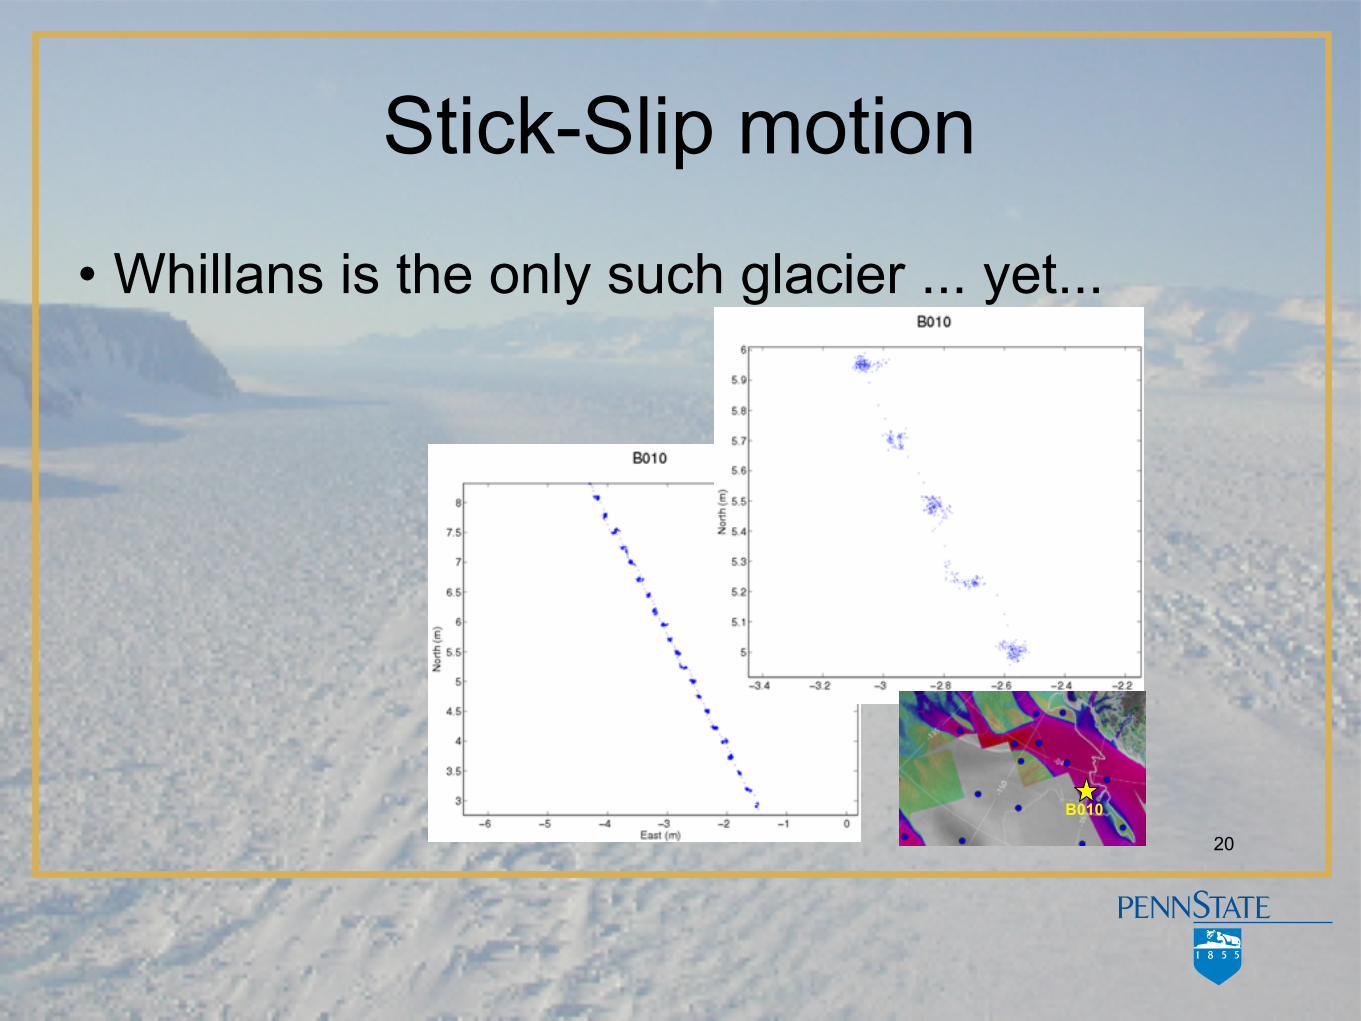
Stick-Slip motion
• Whillans is the only such glacier ... yet...
20
B010
21
IRIS contributions
• Englacial and subglacial properties using active source methods
• Dynamics of flow (in collaboration with UNAVCO)
• Polar earth structure for mantle viscosity • Polar earth structure for heat flow • Glacier flow as a fault-rupture process • Poles as a low-noise observing “platform”
Looking forward
• Expand Polar broadband networks/arrays • Improve instrumentation for polar deployments. • Improve 3D active-source imaging capability • Glaciers as laboratories for understanding fault
processes
22