s. bergeson final report evaluation of the chemical ... · evaluation of the chemical durability...
TRANSCRIPT

S. Schlorholtz, K.L. Bergeson
Final Report
Evaluation of the Chemical Durability of Iowa Fly Ash Concretes
March 1993
Sponsored by the Iowa Department of Transportation, Highway Division, the
Iowa Highway Research Board and the
Iowa Fly Ash Affiliate Research Group
Iowa Dot Project HR-327 ERI Project 3295
ISU-ERI-Ames 93-41 1
e e Iowa Department 'w. )ow& of Transportation
lowa Fly Ash Affiliate Research Group
L College of Engineering
lowa State University

S. Schlorholtz, K.L. Bergeson
Final Report
Evaluation of the Chemical Durability of Iowa Fly Ash concretes
Sponsored by the Iowa Department of Transportation, Highway Division, the
Iowa Highway Research Board and the
Iowa Fly Ash Affiliate Research Group
Iowa Dot Project HR-327 ERI Project 3295
ISU-ERI-Ames 93-411
Civil and Construction Engineering Department
engineering research institute
iowa state university
"The opinions, findings, and conclusions expressed in this publication are those of the authors and not necessarily those of the Highway Division of the Iowa Department of Transportation, or of the Iowa Ry Ash Affiliate Research Group."

TABLE OF CONTENTS
... ABSTRACT ........................................................................................................................................ IU
INTRODUCTION ............................................................................................................................. 1
.............................................................. BACKGROUND AND DEFINITION OF THE PROBLEM 1
............................................................................................................................ Sulfate Attack 4
Alkali-Aggregate Reactions .................................................................................................... 10
RESEARCH APPROACH. ................................................................................................................. 17
Sampling Scheme .............................................................................. ..................................... 17 Testing Scheme for Sulfate Attack ......................................................................................... 19
Testing Scheme for Alkali Attack ........................................................................................... 21
............. ......................................................................................... Chemical Testing Scheme ; 21 RESULTS AND DISCUSSION ......................................................................................................... 22
Chemical Tests ........................................................................................................................ 22
Fly Ashes ..................................................................................................................... 22
Portland Cements ........................................................................................................ 26
Aggregates ................................................................................................................... 29 Reagent and Technical Grade Materials ..................................................................... 29 . .
Abbreviation Summary ........................................................................................................... 30
Sulfate Durability Tests . Mortar Bar Specimens ................................................................... 31
Curing Study ............................................................................................................... 43
Concentration Study .................................................................................................... 46 Sulfate Durability Testing . Paste Study ................................................................................. 47
Sulfate Durability Tests . Concrete Study ............................................................................... 51
Alkali Reactivity Tests . Mortar Bar Studies .......................................................................... 60 SUMMARY AND CONCLUSIONS .................................................................................................. 79 RECOMMENDATIONS .................................................................................................................... 83
ACKNOWLEDGMENTS ................................................................................................................... 84
REFERENCES .................................................................................................................................... 85
APPENDIX A (Fly Ash Data)
APPENDIX B (Cement Data)
APPENDIX C (Aggregates & Misc . Materials) APPENDIX D (Mortar Chemistry)

iii
ABSTRACT
The major objective of this research project was to investigate how Iowa fly ashes influenced
the chemical durability of portland cement based materials. Chemical durability has become an area
of uncertainty because of the winter application of deicer salts (rock salts) that contain a significant
amount of sulfate impurities.
The sulfate durability testing program consisted of monitoring portland cement-fly ash paste,
mortar and concrete test specimens that had been subjected to aqueous solutions containing various
concentsations of salts (both sulfate and chloride). The paste and mortar specimens were monitored
for length as a function of time. The concrete test specimens were monitored for length, relative
dynamic modulus and mass as a function of time.
The alkali-aggregate reactivity testing program consisted of monitoring the expansion of
ASTM C311 mortar bar specimens that contained three different aggregates (Pyrex glass, Oreapolis
and standard Ottawa sand).
The results of the sulfate durability study indicated that the paste and concrete test specimens
tended to exhibit surface spalling but only very slow expansive tendencies. This suggested that the
permeability of the test specimens was controlling the rate of deterioration. Concrete specimens are
still being monitored because the majority of the test specimens have expanded than 0.05 percent; hence, this makes it difficult to estimate the service life of the concrete test specimens or to
quantify the performance of the different fly ashes that were used in the study. The results of the
mortar bar studies indicated that the chemical composition of the various fly ashes did have an
influence on their sulfate resistance. Typically, Clinton and Louisa fly ashes performed the best,
followed by the Ottumwa, Neal 4 and then Council Bluffs fly ashes. Council Bluffs fly ash was the
only fly ash that consistently reduced the sulfate resistance of the many different mortar specimens
that were investigated during this study. None of the trends that were observed in the mortar bar
studies have yet become evident in the concrete phase of this project.
The results of the alkali-aggregate study indicated that the Oreapolis aggregate is not very
sensitive to alkali attack. Two of the fly ashes, Council bluffs and Ottumwa, tended to increase the
expansion of mortar bar specimens that contained the Oreapolis aggregate. However; it was not
clear if the additional expansion was due to the alkali content of the fly ash, the periclase content of
the fly ash or the cristobalite content of the fly ash, since all three of these factors have been found to
influence the test results.

INTRODUCTION
The following report summarizes research activities conducted on Iowa Department of
Transportation Project HR-327. The purpose of this research project was to investigate how fly ash
influences the chemical durability of portland cement based materials. The goal of this research was
to utilize the empirical information obtained from laboratory testing to better estimate the durability
of portland cement concrete pavements (with and without fly ash) subjected to chemical attack via
the natural environment or the application of deicing salts.
This project was jointly sponsored by the Iowa Department of Transportation (IDOT) and by
the Iowa Fly Ash Affiliate Research group. The research work was conducted cooperatively by
Iowa State University and Iowa Department of Transportation research personnel. Researchers at
Iowa State University conducted the chemical testing and the paste and mortar studies. Researchers
at the Iowa Department of Transportation conducted the concrete study.
BACKGROUND AND DEFINITION OF THE PROBLEM
Concrete is a composite material. It consists of a mixture of several different materials that
are held together by a binder (normally portland cement). Once the concrete has solidified and
hardened, it is commonly regarded as a static'building material. However, this is simply not true
except in some specific instances. Rather, concrete should be considered a dynamic construction
material because its physical and chemical properties change with time, and also with environmental
conditions. The "dynamic" idealization of a concrete system is illustrated in Figure 1. Any
environmental condition that causes an extreme change in the internal stability (or volume stability)
of a hardened concrete structure can lead to severe degradation. The degradation may (or many not)
cause a decrease in the service life of the structure. It would be impossible in a single report to
describe in detail all of the factors that can influence the durability of concrete materials. Volumes
of books have been written on the subject, and our intent is not to delve into the details of the
mechanics of slowly deteriorating systems. However, it is important to understand that three major

PORE STRUCTURE
(OF MATERIALS. ELECTRICITY, nEAT)
Figure 1. Simplified interrelationships between the environmental effects and internal changes that cause concrete to deteriorate (from reference 1).
items normally conuol the durability of field concrete. They &e as follows.
materials characteristics
exposure conditions
physical and chemical properties of the hardened concrete
Of course, this assumes that the concrete has been properly placed, consolidated and cured, because
without proper field construction practices it would be impossible to treat the concrete srmcture as

isotropic or homogeneous.
The exposure condition of greatest interest to this research project consisted of a simulated
deicer salt solution. This was because the rock salt that is commonly placed on Iowa pavements
during the winter months consists of a mixture of sodium chloride and calcium sulfate (anhydrite),
plus a variety of other minor and/or trace constituents. The concentration of anhydrite in the rock
salt is rather small (roughly about 0.5 percent to 6 percent by weight 121 ), and typically the salt
meets the requirements for deicing salts that are listed in ASTM D 632 [3]. However, the
concentration of anhydrite in the rock salt is definitely large enough to be of concern. Also, it is
important to point out that the test method used to determine the NaCl content of the rock salt is
rather approximate because it is based on a volumetric test method. The test method, which is based
on a titration with a standard silver nitrate solution, is very reliable. However, the test method really
only determines the amount of C1 present in the sample; and hence, to express all the C1 as NaCl
makes little sense since there may also be KC1, CaC12 or MgC12 present in the sample. This test
method should be updated to give a better indication of the elements that are present in the rock salt.
The application of rock salt to a concrete pavement could aggravate two different forms of
chemically induced deterioration that are not normally encountered in Iowa, namely sulfate attack
and alkali-aggregate reaction. Also, the wide spread use of Class C fly ash in concrete mixes needs
to be re-evaluated because some researchers have questioned the performance of similar fly ashes
when subjected to sulfate durability testing [4 ,5 ,6 ,7 ,8 ,9] and alkali-silicate reactivity testing [lo,
11, 121. Many of the test results presented in the various articles have already been summarized and
discussed by the authors in a previous report [13], and there is not need to repeat that process here.
Instead, the following sections will give only a brief overview of the nature in which sulfates and
alkalis attack portland cement based materials. These chemical reactions occur slowly; and hence,
researchers have generally adopted accelerated (laboratory) testing methods to estimate field
performance. However, be aware that the performance of laboratory specimens often cannot be
directly related to field performance. This point has been voiced by many authors but perhaps

R. C. Mielenz has said it best [14]:
"The value of any accelerated test lies in the degree to which the SERVICE CONDITION is simulated and the extent to which the physical, chemical, and mechanical responses of the concrete in the service condition are reproduced in the method of test. Any substantial departure from reality in these respects is likely to produce erroneous decisions in the approval or rejection of the proposed concrete mixture or the treatment that is under investigation.
The need for accelerated tests will be minimized as fundamental research allows quantitative evaluation of those properties that control the response of concrete to its environment."
Ponland cement based materials are typically not very durable when subjected to an
environment that contains soluble sulfates. In fact, much of the early incentive for creating the
different "types" of ponland cement was based on the need for solving this recumng durability
problem. Today many of the basic questions still remain unanswered. However, for the purpose of
this repon, we will simply define the two major mechanisms that are commonly attributed to sulfate
attack - The f is t mechanism is commonly referred to as sulfoaluminate corrosion [15]. In this
process the monosulfoaluminate that is present in the hardened concrete product is convened into
etmngite by the action of sulfate bearing solutions. This reaction (see Table 1) produces expansion
because the solid volume of the product (etmngite) greatly exceeds the solid volume of the reactant
(monosulfoalurninate). The expansion eventually leads to cracking and this allows the sulfate
bearing solution to penetrate more deeply into the concrete product. Ultimately the concrete
disintegrates.
The second sulfate attack mechanism is referred to as gypsum corrosion [15]. In this process
calcium hydroxide (a normal by-product of cement hydration) is converted into gypsum by the
action of sulfate bearing solutions. This reaction (see Table 1) typically does not produce large
expansive pressures. In fact, some researchers question if it produces any expansion at all [16];
however, most field observations indicate that the concrete is substantially "softened" by gypsum

5
Table 1. Sulfate attack mechanisms.
corrosion. Please note in Table 1, that anhydrite (CaS04) was used as a reactant in the top set of
equations because it is the major comminant present in the rock salts of interest to this research
project. The same equations could be written with a variety of different cations (e.g., ~ a ' , K', 2' ~ g ~ ' , etc.) and anions (e.g., C03 , Cr, etc.) without a major change in the ultimate response of the
Type of Attack
Sulfoaluminate corrosion
Cement nomenclature
Process
Gypsum Corrosion
Cement nomenclature
Process
concrete structure (i.e., deterioration). However, the rate of deterioration may change significantly
depending on the ionic species present in the pore solution of the concrete.
The chemical reactions listed in Table 1 suggest several methods of improving the sulfate
General Reaction in Aqueous Sulfate Solution
3CaO[A12(0H)61 fCaS041 .6H2&2CaS04+19H20 -i 3CaO[&(OH)6] [3CaS041 .25H20
C ~ A S H ~ ~ + 2CS + 18H -i c ~ A S ~ H ~ ~
monosulfoaluminate + sulfate solution -, emingite
Ca(0H)z + SO: + 2H20 -i CaS04 . 2H20 + 2(OH)-
CH + s0:-(aq) -i + 20H'
calcium hydroxide + sulfate solution -i gypsum + alkali solution
resistance of portland cement based materials. Fist, you can reduce the concentration of
monosulfoaluminate present in the concrete. This normally done by reducing the amount of
tricalcium aluminate (Ca3A1206; C3A) that is present in the portland cement (i.e., use ASTM Type I1
and V cements). Tricalcium aluminate is the anhydrous cement mineral which hydrates to produce
the etmngite and (ultimately) the monosulfoaluminate that is present in the concrete.
Secondly, you can attempt to stabilize the ettringite phase in the pore solution (i.e., similar to
expansive cements). However, excessive amounts of sulfate in the cement can reduce the
compressive strength of the concrete and could lead to construction related problems such as false
set.

Finally, you can attempt to reduce the amount of calcium hydroxide present in the concrete.
This is normally done by incorporating a pozzolan, such as fly ash or silica fume, into the concrete
mix design. The pozzolanic reaction consumes calcium hydroxide and produces additional calcium
silicate hydrate, this helps to reduce the porosity of the concrete. The major problem with pozzolans
is that they are available in a wide variety of different compositions and it is difficult to predict their
performance prior to detailed (long-term) laboratory testing [16, 171. Also, since pozzolans are
typically by-products from different industries their composition, and perhaps their sulfate-resistance
properties, is sensitive to process related changes in any particular manufacturing plant. However,
the benefits gained from the use of reactive pozzolans are typically greatly in excess of those
obtained by changing the type of cement used on any given project (see Figure 2).
Other methods can also be used to increase the sulfate-resistance of concrete. Significant
gains in sulfate resistance can be made by decreasing he porosity of the concrete mix. This is
normally done by lowering the waterlcement ratio of the mixture; however, it could also be
accomplished by improving the uniformity of the vibration and consolidation of the plastic concrete
mix, or by incorporation of a surface treatment that minimizes the penetration of aggressive
solutions into the concrete. Figure 3 illustrates the importance of porosity on the predicted life of
laboratory concrete pipe specimens subjected to sulfate solutions [17]. In this experiment, the
porosity was estimated by using a five hour boilihg test and the measured expansion of the test
specimens was used to predict the life of any given specimen. It is obvious in Figure 3, that small
changes in porosity can drastically influence the durability of the specimens, especially at low
porosity values.
One of the major problems that has plagued the study of the sulfate-resistance of portland
cement based materials is the lack of standardized test methods. Researchers at different
laboratories have adopted different test procedures to better simulate their particular environments.
Th~s has been good because it has helped engineers to adapt their concrete mix formulations to a
particular set of environmental conditions but it has been bad because it is nearly impossible to
compare test results obtained in different parts of the United States (let alone attempting to compare

TIME TO FAILURE. YR. ( C A L C )
180
160
I40
- a 4 120- (L
I- % W .... a
100-
W a 3 =! 4 LL 00-
0 e
Ld ;I - e 60-
50
10-
20-
Figure 2. Life expectancies of various concretes in a sodium sulfate environment (from reference 17).
- I I
X
Type v cement - 0 Type Il cement I
I 0 A
x Glossy -phose pozro lon - A C r y s t o l l ~ n e I
V Colcined 0 S l o g
I I - I
x X
- I I
x v I
X
- X I A I I I - I
X
o L - - -_ - -&x- - --
- vv X X X x x v
X v D 0
- X x v
I
- - - - - - - -- - a 0 0
a e
*a I a no O I
- I . 0.
C I
0 0 I I
- I I
I I I I 20 4 0 50 60 8 0 100 170 140
1 1 1 1 1 L

h 2 25 a, -3 20 W U- 15
e l o I- 0 5 t3
E 0 a
6 7 8 9 10 11 12 13 ABSORPTION (%)
Figure 3. Predicted life versus specimen absorption for concrete pipe (data from reference 17).
results from different countries). Hence, little has been done to really probe the fundamental aspects
of this recurring durability problem [16].
The most common tests used for estimating the sulfate-resistance of portland cement based
materials are summarized in Table 2. In general, the tests are based on soaking test specimens in a
sulfate-bearing solution and measuring an appropriate specimen response (such as length change,
weight-loss, strength-loss, etc.). However, many different varieties of each test method have been
proposed, tested and may currently be in use in different laboratories. Even the ASTM test (C 1012)
leaves the test solution unspecified. Hence, Cohen and Mather 1161 cut directly to the root of the
problem when they suggested that it would be a good time to standardize testing methods before we
embark on new sulfate attack studies. After all, how can we accurately predict specimen lifetimes

Table 2. T
est methods for sulfate attack.
Specimen
Type
Pastes
Mortars
Concretes
Dim
ensions (inches)
Varies
(typically 1
x1
x11.25)
1 x 1 x 11.25
Varies
(from beam
s to cylinders)
Measured
Response
Length change
Chem
istry change V
isual rating M
ass loss
Length change
Length change
Mass loss
Strength loss V
isual rating
Test
Method
Not specified
AST
M C
1012
Most m
ethods are sim
ilar to B
ureau of ~
~~
l~
~~
~i
~~
test procedure.
Solution T
ype
Varies
Varies
(suggest 5%
Sodium
Varies
(micaU
y sodium
sulfate from
2 to 10%
by wt.)
Com
ments
Good for researeh w
ork but pratical use is limited
because of lack of aggregate interface area.
Wetting-hying varieties of this test can he
performed. G
ood chemical testing inform
ation can be obtained from
the test specimens. C
orrelation to concrete service lie
undefined.
Wetting-D
rying varieties of this test can be perform
ed. B
ureau of Reclam
ation has developed rough correlations to service lie.

when we do not even have a consensus on what defines failure?
Some types of concrete aggregates react with the alkaline pore solution in concrete to
produce a gel-like material. This gel-lie material has the potential to sweli; and hence, produce
cracks that can disrupt the integrity of the concrete. Such behavior is commonly referred to as an
alkali-aggregate reaction (AAR). Alkali-aggregate reactions are normally classified into three
different categories: { 1 ] alkali-silica reactions; (2) alkali-silicate reactions; and {3) alkali-
carbonate reactions. However, as with any complex natural process, the different AAR categories
may act independently or in unison with the other processes that cause concrete to deteriorate
prematurely (i.e., freeze-thaw attack, sulfate attack, etc.).
Much research has been conducted to investigate both the fundamental and practical aspects
of AAR. In fact, a recent literature review [18] gives an excellent overview of the literature
pertaining to alkali-silica (and silicate) reactions. The number of published papers that discuss AAR
has been increasing substantially over the past two decades (see Figure 4). This can be attributed to
a heightening awareness of concrete durability problems. The awareness has, in part, been generated
by the scientific community because of international conferences on AAR (held in 1975, 1976,1978,
1981, 1983, 1987 and 1989 - these correspond roughly to the "spikes" in the number of publications
shown in Figure 4). However, research is often driven by the observation of poor field performance.
Poor field performance of concrete can be attributed to recent changes in cement manufacturing
processes (i.e., dry process kilns tend to increase alkali content), depletion of high-quality (proven
service record) aggregate reserves and the routine application of deicer salts (typically NaC1). Also,
recent investigations have indicated that nearly all siliceous aggregates are to some degree alkali-
sensitive; however, the reactivity may be so slow that it may not significantly influence the design
life of the concrete product [19].
Alkali-carbonate reactivity (ACR) is normally used to describe the reaction of alkalis (Na
and K, typically from the cement) with dolomite crystals in fine-grained calcitic dolomites and

. . . , . . . . . .
. . . . . . . .
. . . . . . . . . .
. . . . . . . . . . . . . . . . . . . . . . .
1940 1950 1960 1970 1980 1990 2000 TIME (years)
Figure 4. Number of publications concerning alkali-silica reactivity vs. time (data from reference 18).
dolomitic limestones [12,20]. The exact mechanism of this reaction is not fully understood. Hence,
ACR will not he discussed in detail in this report.
Alkali-silica and alkali-silicate reactions are often discussed together because they are
fundamentally quite similar. The difference between the two categories of attack is based simply on ,
the fact that alkali-silica attack refers to the reaction of alkalis with the polymorphs of silica (i.e.,
chemical formula Si02, such as quartz, tridyrnite, cristobalite, etc.), while alkali-silicate attack refers
to the various silicate minerals that may decompose in the presence of a strongly alkaline pore
soiution (i.e., feldspars, argillites, etc.). The alkali-silica reaction (ASR) is probably the most
commonly observed form of AAR [19].

The mechanism of ASR can briefly be summarized as follows [21,22,23]. First, consider
the concrete system shown in Figure 5. The concrete system that is shown has been greatly
magnified to illustrate on a microscopic scale, the various constituents that are comnionly present.
I 1
Figure 5. A magnified view of a typical concrete system (from reference 22).
These consist of { 1 ) aggregate (infinitely large in this instance, note how the surface has been
hydrated; 12) cement hydration products (calcium hydroxide, calcium silicate hydrate plus some
umeacted cement grains); and ( 3 ) pore solution (mostly water). A very simplistic set of chemical
reactions for ASR are listed in Table 3. ASR tends to occur when mass transfer across the
aggregate-pore solution boundary is consmcted [21, 221, this leads to a buildup of alkali silica gel
at the interface. The alkali-silica gel is unstable relative to its surroundings and may swell

13
Table 3. Alkali-silica reaction mechanisms.
through imbibition or it may be further altered by the pore solution (mostly Ca2+ exchange). The
imbibition of water by the gel is highly variable and appears to depend on both the composition and
the rigidity of the gel. Expansion (swelling) pressures exceeding 600 psi have been reported in the
literature [24,25]. Obviously, pressures (tensile stresses) of this magnitude can cause deformation
and subsequent cracking of the concrete product.
There are many strategies that can be employed to minimize AAR. A recent flow chart
published by the Portland Cement Association [I21 is reproduced in Figure 6. This chart is useful
because it defines a practical thought process that can be used by engineers to specify better concrete
mixes. For instance, if a concrete mix is to be designed for a humid environment and it incorporates
an alkali-reactive aggregate, then the flow chart immediately suggests a series of options that can be
used to minimize the potential AAR problem. However, the diagram fails to mention some of the
technical difficulties that are commonly encountered when attempting to distinguish "reactive"
aggregates from "non-reactive" aggregates, or "reactive" mineral admixtures from "non-reactive"
mineral admixtures. Such distinctions are normally made on the basis of accelerated laboratory tests
(i.e., screening studies) and/or field service records. Hence, materials testing again plays a central
role in defining "reactivity."
A summary of the different test methods that are available for measuring the AAR potential
of concrete aggregates is given in Table 4. Modifications of these different test methods are also
commonly used to assess the effectiveness of different mineral admixtureslcement combinations in
Mechanism
Acid-base neutralization
Siloxane attack
SimpIified Reactions (from reference 21)
--Si--OH + NaOH -+ - - Si - - 0-Na+ + Hz0
hydrated surface of particle + alkalis -+ gel + water
- - S i - - 0 - - S i - - + 2NaOH -+ --Si--0-Na+ +Na+O---Si-- +Hz0
Qloxane bridge + alkalis -+ gel +water

Figure 6. Flow chart that can be used to minimize AAR problems (from reference 12).
mitigating the effect of AAR. Table 4 was adapted from reference 26 (only slight modifications) to
indicate the wide variety of test methods that have evolved during the study of the AAR problem
(i.e., since about 1940! ). No attempt will be made to outline the details, assumptions or deficiencies
of the various test methods. Interested readers should consult the original source [26] for such
details. The types of tests listed in Table 4 have been denoted as fundamental (F) or secondary (S).
The fundamental tests are normally conducted on the individual aggregate sources to assess
their innate reactivity. This may consist of identifying a reactive constituent through petrographic
work or may consist of reacting an aggregate with a strongly alkaline solution to see if it dissolves or
expands. Hence, these tests can be conducted quite rapidly.

15
Table 4. Test methods for alkali-aggregate reactivity.
Secondary tests employ mixtures of portland cement and other materials. Normally only a
single variable is monitored, namely expansion. Hence, these tests depend both on the materials
characteristics (i.e., alkali content of the cement, reactivity of the pozzolan, gradation of the
aggregate, etc.) and the experimental procedure that is employed (i.e., types of containers used to
store specimens, type of accelerating medium such as temperature, pressure or concentration, etc.).
Attempts are often made to correlate specimen performance (expansion) to field service performance
- Type
F
F
F
S
S
Test Method
Petrographic Investigation ASTM C 295
ASTMC 586 (Rock Cylinder Method for alkali carbonate reactivity)
Chemical Test Methods ASTM C 289 Modified ASTM C 289 (run on acid-insoluble residue) German Dissolution Test Osmotic CeU Test Gel Pat Test Chemical Shrinkage Method
MomBar Methods ASTM C 227 and C 441, same 1 AFNOR P 18-585 Method CCA Method Danish Accelerated Method NBRI or ASTM C 9-P~oposal-P214 Autoclave methods (Chinese, Japanese, Canadian)
Concrete Prism Methods CAN/CSA ,423.2-14A Method AFNOR P 18-587 Method South Africa Method BSI 812 Method CCA Method Accelerated Method (used in Quebec) Autoclave Methods ASTM C 1105 (alkali carbonate reactivity)
Approximate Time Required
days for detailed work
at least 1 month
2 01 3 days 2or3days
1 day less than 40 days
about 1 week 1 day
at least 6 months 6 months 6 months 5 months
at least 2 weeks about 3 days
1 ye= 8 months
about 3 weeks 1 ye=
6 months 1 month
a few days at least 3 months

and/or the fundamental testing methods. This is generally done because the secondary tests may take
several months (or even a year in some instances) to complete.
Mineral admixtures, such as pozzolans or slags, are often used to improve the performance of
concretes that contain alkali-sensitive aggregates. The beneficial effects of pozzolans are difficult to
pinpoint; however, they are often attributed to the fact that { 1 ) they tend to release alkalis to the pore
solution much slower than portland cements (i.e., low soluble alkali content); and ( 2 ) they contain a
considerable amount of reactive silica and alumina that can react with the pore solution to create
more calcium silicate hydrates (i.e., the pozzolanic reaction). For these two reasons concretes
containing pozzolans tend to have pore solutions with lower hydroxyl ion concentrations and mortar
fractions with lower permeabilities than conventional portland cement concretes. Obviously, both
hydroxyl ion concentration and permeability play significant roles in AAR.
Taylor [23] has noted similarities between the pozzolanic reaction and the chemistry that is
normally associated with ASR. In fact, he has proposed that they are both essentially the same
chemical reaction but that the local environment dictates the expansivity of the mixture. His
reasoning is as follows [23].
"In the pozzolanic reaction, the alkali silicate gel is formed in an environment rich in Ca2' and, except in a narrow zone close to the reacting surface, is quickly converted into C-S-H. In ASR, it is form@ in an environment that is poor in ca2+, and massive outflows of gel may result. The cement paste cannot supply ca2' fast enough to prevent much of this gel from persisting for periods. This situation is especially marked if the akali silicate gel forms within the aggregate particles, as is the case with opal."
This also helps to explain why even the most alkali-sensitive aggregates tend to behave as pozzolans
when they 'are ground into fine powders. It also helps to explain why both aggregates and pozzolans
tend to exhibit "pessimum" type behavior when they are used in portland cement mortars or
concretes.
The "pessimum" effect is illustrated in Figure 7. Plots of linear expansion versus reactive
component concentration (either aggregate or pozzolan) often exhibit this behavior because the
expansion process can be controlled by the alkali content of the pore solution py the reactive silica

Figure 7. An illustration of pessimum effect in laboratory test specimens (from reference 21).
+
concentration of the mixture. If the aggregate (or pozzolan) is very reactive then it quickly removes
ill the alkali from the pore solution and expansion decreases with increasing aggregate content
because of a dilution effect. Note, that the pessimum conditions apply to a closed system. The
introduction of alkalis to the system via an external source (i.e., deicer salts, etc.) drastically
complicate the pessimum effect.
8 1.8-
RESEARCH APPROACH
Age 224 dogs
Fly ashes from Council Bluffs (unit #3), Louisa, Port Neal (unit #4) and Ottumwa generating
stations were selected to represent the range of Class C fly ashes available in Iowa. Fly ash from
M.L. Kapp generating station (Clinton) was selected to represent the Class F fly ashes available in
Iowa. The general locations and ash production rates of the various power plants are illustrated in
Figure 8. Details concerning the various power plants are summarized in Appendix A.
~ / ~ o / i (0s NO, 01 = a 98% - of cemenf wf
/: 2 morfor bar
C (O 0.4 4,
Grams Opal (18-52 Mesh) Grams Alkali As Na20

Neal 4 100,000 tpy
100,000 tpy
100,000 tPY
Figure 8. General location and amount of fly ash produced at power plants studied in this project. (tpy = tons per year)
The fly ash sample from a given power plant was taken on a single day (i.e., the samples
were not composite samples). Enough sample was taken from each power plant to approximately fill
two 55 gallon drums (i.e., roughly 500 pounds of fly ash). The fly ash samples were then delivered
to the Materials Analysis and Research Laboratory (MARL) at Iowa State University where they
were sub-sampled, labeled and dated. The MARL personnel then delivered one barrel of each source
of fly ash to the Iowa Department of Transportation (Iowa DOT) Materials Laboratory for use in the
concrete portion of the research project.
Three different sources of portland cement were chosen for use in the project. Two of the
sources produced Type I portland cement, while the remaining source produced Type V (sulfate
resistant) portland cement.

The Type I portland cements consisted of a low alkali cement (Dundee) from Mason City,
Iowa, and a moderate alkali cement from Davenport, Iowa. The Type V cement was obtained from
Rapid City, South Dakota. All of the cements were delivered to the laboratory in standard (94 lb)
bags.
Many different criteria can be used to estimate the sulfate resistance of portland cement
products. For this research project specimen growth (or linear expansion) was the major property
that was used to evaluate the durability of portland cement-fly ash pastes, mortars and concretes
immersed in sulfate bearing solutions. Concrete specimens were also monitored for weight change
and dynamic modulus of elasticity (sonic modulus). The typical response that was expected
from any given specimen is illustrated in Figure 9. Failure can be defined as some predetermined
value of growth or the experiment can be continued until the specimen physically disintegrates.
A delayed expansion A
A0 - E o normal
8 expansion/swelling
t
TIME
Figure 9. Diagram illustrating the response of test specimens to sulfate attack. (adopted from reference 16).
Concrete specimens for sulfate durability testing were prepared at the Iowa DOT. The
concrete mixes employed two sources of cement (Type I and Type V), four sources of fly ash

(Council Bluffs, Louisa, Ottumwa, and Clinton), and four different coarse aggregates (Jabens,
Lamont, Montour, and Early Chapel). The fine aggregate used for the mixes was from near
Bellevue, Iowa. All of the concrete mixes were proportioned using Iowa DOT C-3 mix
specifications. Fly ash was replaced for cement on a 1 to 1 weight basis throughout this study.
Waterlcement ratio was adjusted to meet the slump criterion for C-3 mixes. Fly ash replacements of
7.5, 15 and 30 percent (by weight) were used in this study. Concrete beams with nominal
dimensions of 4" x 4 x 18" were molded for sulfate durability testing. Two cylinders (4.5" x 9")
were also molded from the mix to evaluate the 28 day compressive strength of the concrete. All of
the beam specimens were moist cured for at least 28 days before immersion in the sulfate solution.
Aqueous solutions with two different concentrations of sulfate were used in the concrete
study. The first solution contained 10 percent Na2S04 (by weight), this solution has been used by
other researchers [9], and has proven to be quite aggressive to ponland cement concretes. The
second solution contained 10 percent mixed salt (by weight). The composition of the mixed salt was
95 percent NaCl and 5 percent Na2S04, this was used to simulate a "worse case" deicing salt.
Hence, the second solution ultimately contained 9.5 percent NaCl and 0.5 percent Na2S04.
Technical grade (or better) purity Na2S04 and NaCl were used to make both solutions.
Mortar specimens for sulfate durability testing were prepared in accordance with ASTM C
1012 [3], with two notable exceptions. First, the accelerated curing method described in ASTM C
1012 was not used. Instead, specimens were demolded after one day of moist curing and then placed
in saturated lime water until they reached a minimum strength of 2850 psi. The strength versus time
relationship was established using two inch cube specimens that were molded, cured and tested as
described in ASTM C 109 [3]. Secondly, only two specimens (rather than the four suggested by the
ASTM) were molded for each mixture. Four different replacements of fly ash for cement (7.5, 15,
22.5 and 30 percent, by weight) were studied in this project.
The mortar specimens were subjected to aqueous solutions containing two different
concentrations of sulfate. The first solution contained 5 percent NazS04 (by weight). The second
solution contained 9.5 percent NaCl and 0.25 percent Na2S04 (by weight). Reagent grade NaCl and

Na2S04 were used in the m o m phase of this study. A tank containing lime water was used to
assess the expansive potential of many of the mortar mixes.
Paste specimens for sulfate durability testing were mixed using a procedure developed in our
earlier studies [27]. Since paste specimens are homogenous on a small scale, a preliminary
experiment was performed to see if small cylindrical test specimens (13/16 diameter by 3" long)
could be substituted for the larger (1" x 1" x 11.25") prismatic specimens. Only one concentration of
sulfate solution (5 percent Na2S04) was used to assess durability of the paste specimens.
The preliminary results of the small cylindrical specimens indicated that there were severe
experimental constraints involved when using the small specimens. Hence, the experiment was
repeated using 1" x 1" x 11.25" primatic specimens. The paste mixtures were composed of one type
of cement (Dundee), two different fly ashes (Council Bluffs and Clinton), and replacement levels of
15 percent and 30 percent (by weight) of fly ash for cement. A waterlcement of 0.35 was used in the
study. All of the specimens were exposed to a 5 percent solution of sodium sulfate.
Mortar specimens for alkali attack were made in accordance with ASTM C 31 1131, except
that only two specimens were prepared from each mix rather than the three specimens dictated by the
specification. This study used two Type I poitland cements, all five of the fly ash samples
mentioned earlier in this report, and three different fine aggregates @yrex glass, standard ASTM C
109 sand, and a Class V aggregate from Oreapolis, Iowa). Five different levels of fly ash
replacement (7.5, 15,22.5,30 and 50 percent) were used in this research project.
All of the raw materials were subjected to chemical tests. Typically, x-ray analysis was used
to define both the bulk composition and the minerals present in a given material.
X-ray diffraction (XRD) was used to identify the major and minor crystalline constituents
present in each material. A Siemens D 500 x-ray diffractometer was used throughout this study.

The diffractometer was controlled by a PDP 11/23 computer via an LC500 interface. A copper x-ray
tube was used for all diffractior! work. The diffractometer was equipped with a diffracted beam
monochrometer and medium resolution slits.
X-ray fluorescence (XRF) analysis was used to quantify the major, minor, and selected trace
elements in the various materials. A Siemens SRS 200 sequential x-ray spectrometer was used for
all of the analyses. The spectrometer was fully computer controlled. A chrome x-ray tube was used
throughout the study.
A Beckman DU-2 flame photometer was used to determine the available alkali content (Na
and K expressed as equivalent Na20) of the various fly ashes. An oxygen-hydrogen flame was used
for all analyses.
Thermogravimehic analysis (TG or TGA) was performed on selected mortar specimens. A
TA Instrument (previously known as DUPONT) 2000 thermal analysis system was used throughout
this study. The system utilizes a TA Hi-Res. TGA module equipped with a 16 sample carousel. A
typical experiment used the following experimental parameters: { 1 ] a scanning rate of 40' per
minute, resolution = 5; ( 2 ) a sample mass of about 10 milligrams; (3) a dynamic nitrogen
atmosphere purged at 100 ml per minute; and 14) test specimens were heated from ambient (about
25' C) to 970' C.
RESULTS AND DISCUSSION
l ? k k i b s
The chemical compositions of the five fly ash samples used in this project are listed in Table
5. The fly ashes were also subjected to a physical testing program similar to that suggested in ASTM
C 618. The results of the physical testing program are listed in Appendix A. Overall, the five fly
ashes chosen for the research program exhibited a good range of chemical and physical pr~perties.
The five fly ashes were also subjected to x-ray diffraction analysis. The compounds
identified in the various diffractograms are summarized in Table 6. Please note that some of the
compounds listed in Table 6 are not diiectly evident in the diffractograms of the bulk fly ashes;

Table 5. Summary of bulk chemistry of the fly ash samples.
however, additional treatments (i.e., acid extraction, particle size separation, heat treatment, etc.)
were used to verify the presence of the various compounds. The various diffractograms are located in
Appendix A.
Currently it is not possible to accurately estimate the amounts of the various compounds
present in the fly ashes. However, due to the influence of tricalcium aluminate on sulfate attack, the
amount of tricalcium aluminate present in each fly ash was estimated using quantitative x-ray

24
Table 6. Compounds identified in the five fly ash samples.
M = Major component m = minor component T = trace component '7 . - - question
Lime (CaO, JCPDS #4-777)
Ferrite Spinel [(Mg, Fe) (Fe, ~12041
Mullite (AlgSi2013, JCPDS #15-776)
Tricalcium Aluminate (Ca3Al206, JCPDS #38-1429)
Hematite (Fe203, JCPDS #33-664)
Tetracalcium Trialuminate Sulfate (JCPDS #33-256)
Cristobalite (Si02, JCPDS #11-695)
diffraction. The tricalcium aluminate estimate was made by spiking the raw fly ash samples with
known amounts of pure tricalcium aluminate (cubic structure, XRD pattern matched JCPDS#38-
1429). Note in Table 5, that all of the fly ash samples had mcalcium aluminate contents of less than
8 percent (by weight).
All of the diffractograms indicated that a large amount of a given fly ash was amorphous to
x-rays (i.e., glassy). Each of the Class C fly ashes exhibited a glass scattering halo that reached a
maximum intensity at about 30 degrees 2-theta (Cu Ka radiation). The Class F fly ash (Clinton)
exhibited a glass scattering halo that reached a maximum intensity at about 23 degrees 2-theta. This
indicated that the Class C fly ashes contained a different type of glass than the Class F fly ash.
m
M
M
?
T
m
m
M
T
rn
rn
m
M
T
m
m
m
m
m
M
T
m
m
m
m
M
T
m
m

To obtain additional information about the glass phases and minor components present in the
five fly ash samples, the raw fly ashes were digested in hot acid (HCI) using a procedure described
in an earlier Iowa DOT report [27]. The acid insoluble residue was then subjected to x-ray analysis.
Also, the acid insoluble residue was ignited at 950' C to recrystallize the glass portion of the residue.
The minerals identified in this phase of the study have already been summarized in Table 6 . X-ray
diffractograms of the various treatments can be found in Appendix A. However, there are a couple
of findings that must be emphasized. First, the acid insoluble residue from all five fly ashes
contained very similar mineral assemblages. Even the glass portion of the fly ashes appeared to be
similar. And secondly, the recrystallization process had little influence on the glass present in the
Clinton and the Louisa samples, but it caused cristobalite to crystallize from the remaining fly ashes
(Neal 4, Ottumwa and Council Bluffs). This was important because cristobalite is an alkali-sensitive
material and it has the potential to influence the ASR tests that will be discussed later in this report.
The results of XRF analysis on the acid insoluble fraction of the five fly ash samples are
listed in Table 7. In general, the XRF results were in excellent agreement with the XRD results. The
acid insoluble residue is primarily composed of siliceous material.
A study was conducted to assess the amount of alkalis (Na and K) that could be leached from
the various samples of raw fly ash. This study should be applicable to the alkali durability portion of
this research project. Briefly, the available alkali test procedure (see ASTM C 31 1 131) was used to
extract and measure the amount of alkalis (expressed as equivalent Na20) that were leached in to the
solution after various curing times. The results of this study are illustrated in Figure 10. Note that
the dissolution rate of fly ash alkalis was quite rapid for the first 14 to 28 days, then it decreased
significantly. However, as is apparent in Figure 10, a considerable amount of alkalis were still being
released into solution after 28 days of curing. Also, the Louisa and Neal 4 fly ashes, which have
relatively low available alkali values at 28 days, either exceed or approach the ASTM C 618
available alkali specification limit (maximum = 1.50 percent equivalent Na2O) after longer curing
times. Figure 10 indicates that it takes about 60 days to reach the plateau in the alkali dissolution
curves for the Class C ashes and about 30 days for the Class F ash. These test results for the Class C

26
Table 7. Summary of acid insoluble fraction of the fly ash samples.
ashes are in conflict with earlier studies at this laboratory [28], that indicated that all of the alkalis
should eventually be released to the pore solution. We are still trying to resolve this conflicting
information.
. .
- The portland cements used in this study have been subjected to a series of physical and
Na20
Ti02
SrO
BaO
Loss on Ignition
chemical tests. The cement tests were conducted in accordance with the ASTM methods specified
for portland cements [29].
The chemical compositions of the three cements are summarized in Table 8. These assays
were obtained by using the XRF techniques discussed earlier in this report. The amount of cement
minerals present in each source of cement were calculated using the Bogue equations listed in ASTM
C 150 [29]. Note that the Davenport cement had a chemical composition similar to a Type I1
0.2
0.98
0.02
0.07
0.98
0.8
1.42
0.13
1.07
1.75
1.9
1.43
0.22
2.40
1.89
1.5
1.28
0.13
1.39
1.92
2.2
1.31
0.15
1.85
1.21

n s w
AVAILABLE ALKALI STUDY \ X 2.5
2 2 0 E 1.5 3 E 1 0 u> 0.5 > - 0 3 a W
0 20 40 60 80 100 120 140 160 TIME (days)
- - - -- - -- -- - -- - - I=CLI NE4 * LOUsCBF *OTT
Figure 10. Available alkali content versus time for the five fly ashes used in this study.
cement; however, its C3S + C3A content was slightly high which placed it in the Type I portland
cement category. The Davenport cement will be referred to as Type 1-11 cement throughout the rest
of this report.
X-ray diffractograrns of the three cements are located in Appendix B. The results of the
XRD tests were in good agreement with the XRF assays. The major compounds identified in the
cements were alite (substituted uicalcium silicate; subst. -C3S), belite (substituted dicalcium silicate;
subst. -C2S), a mineral close to tenacalcium aluminofenite (C4AF) and mcalcium aluminate (C3A).
Various sulfate bearing minerals were identified as minor constituents in the three cements. The

28
Table 8. Chemical and physical characteristics of the portland cements.
* = value from Iowa DOT test report

Davenport cement contained bassanite, anhydrite and perhaps some gypsum; while the remaining
two cements contained only gypsum and bassanite.
The physical properties of the three cements, namely normal consistency, compressive
strength (C 109 mortar cubes), fineness and set time are listed in the lower portion of Table 8.
Aggregates
X-ray diffractograms of the Jabens, Lamont, Montour and Early Chapel aggregates (crushed
stone for the concrete mixes) are located in Appendix C. The minerals identified in the
diffractograrns are listed in Table 9. The results of XRF analysis are summarized in Table 10.
The results of XRD and XRF analysis of the fine aggregates that were used in the alkali
reactivity study are listed in Tables 9 and 10, respectively. Diffractograms of the various fine
aggregates are located in Appendix C.
Table 9. Results of XRD analysis of the aggregate samples.
M =Major phase m = minor phase T = trace evident
Quartz (Si02)
Felds~ar
Pyrite
and Technical C-
The x-ray diffractograms of the sodium chloride, sodium sulfate and rock salt used during
this project are located in Appendix C. The major compounds identified in the various
diffractograms correspond to the desired material (i.e., sodium chloride or sodium sulfate); however,
the rock salt did contain a significant amount of anhydrite (CaS04). The results of XRF analysis are
summarized in Table 11. In general, the technical grade materials compared very well with the
T T T
T
m
- -
M
m
M

30
Table 10. Results of XRF analysis of the aggregate samples.
N h l = not measured * = average composition of two lots of Pyrex glass
reagent grade materials. The rock salt contained about 3 percent anhydrite plus a few other minor
elements.
The following abbreviations are used throughout the various figures and tables:
DUN = Dundee cement = Type I
DAV = Davenport cement = Type 1-11 SDV = South Dakota cement = Type V
CLI = Clinton fly ash (Class F) LOU = Louisa fly ash (Class C)
OTT = Ottumwa fly ash (Class C)
NE4 = Neal 4 fly ash (Class C)
CBF = Council Bluffs fly ash (Class C)
CON = Control Mortar = control

Table 11. Results of XRF analysis on reagent and technical grade chemicals. (all values in parts per million (ppm) unless noted otherwise)
N/M = not measured
s - Mortar Bar Soeclmens
Typical results obtained from the ASTM C 1012 mortar bar tests are shown in Figure 11.
Generally the specimens all exhibited delayed expansion; and hence, to reduce the number of graphs
needed to portray the information, a criterion of 0.10 percent expansion was defined as "failure."
The time required to reach 0.10 percent expansion can then be used to compare the sulfate resistance
of mortar bar specimens containing the various cements and fly ashes. A summary of the
information is listed in Tables 12 and 13. Not all of the test specimens have reached failure in either
of the two test solutions that were used in this study (i.e., 5 percent sodium sulfate and the synthetic
deicer solution). To date, 94 percent of the specimens in the 5 percent sodium sulfate solution have

5% SULFATE SOAK TEST PORTLAND CEMENT MORTARS
0.5
0.4
0.3
0.2
0.1
0 0 50 100 150 200 250 300 350 400 450 500
TlME (DAYS)
SYNTHETIC DEICER SOAK TEST PORTLAND CEMENT MORTARS
w
i! w 0.05
0 EXPOSURE ONL
0 100 200 300 400 500 600 -..
TlME (DAYS)
I 1 Figure 11. Typical test results that were obtained from the sulfate durability study.

33
Table 12. Time (in days) required for mortar bar specimens to reach 0.10 percent expansion.
* = test still in progress
Treatment = 5 percent
Fly Ash
None
Clinton
Louisa
Ottumwa
Neal 4
Council Bluffs
Na2S04 soak (as per ASTM C 1012)
% Replacement
0
7.5
15
22.5
30
7.5
15
22.5
30
7.5
15
22.5
30
7.5
15
22.5
30
7.5
15
22.5
30
$ > ~ , & . # ; ~ ~ # $ j @ @ @ ~ ~ ~ ~ @ g @ * ~ ; m $ i ~ . 2 s q y ~ s ? .n,......,,., ::.:;:.:.:.:<.:.: .,.> :.: .,.,.,...,. ...,.,..,
Type V
279
469
855
> 950*
> 950*
250
357
468
499
246
236
221
413
244
27 1
430
373
213
163
189
216
ti:*,: .......................... \:.:..i:.:.:.,.r ....,...,.~.,,.,.... .>
Type I
98
92
153
151
549
123
147
165
293
99
114
93
128
95
90
108
101
81
65
62
61
~ $ $ $ j $ ~ $ , ; ~ ~ ~ . ' ~ > ~ $ ~ ~ ~ ~ g ~ ~ ~ ~ ~ ~ ~ ~ ~ j ~ ~ # $ ~ ; ~ ~ ~ ~ ~ $ ...,.....
Type 1-11
174
32 1
553
> 950'
> 950*
144
213
265
292
124
141
196
188
132
144
194
142
132
116
119
100
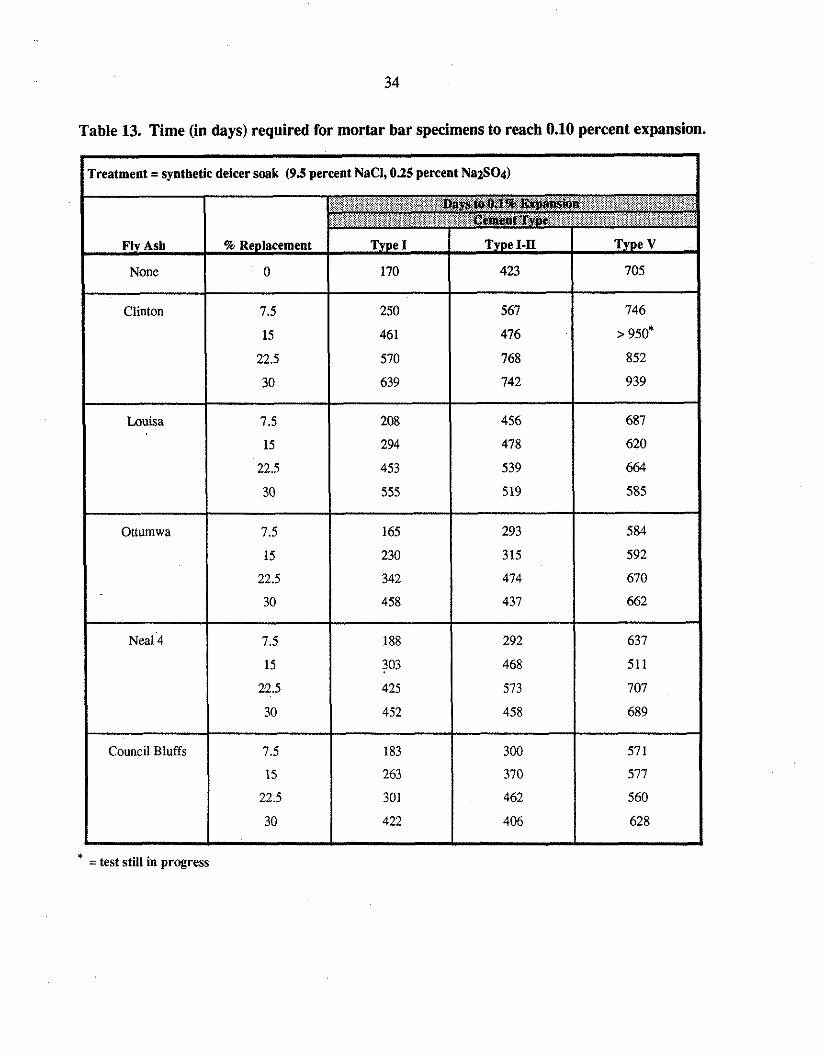
Table 13. Time (in days) required for mortar bar specimens to reach 0.10 percent expansion.
* = test still in progress
Clinton
Lou~sa
Ottumwa
Neal 4
Counc~l Bluffs
7.5
15
22.5
30
7.5
15
22.5
30
7.5
15
22.5
30
7.5
15
22.5
30
7.5
15
22 5
30
250
461
570
639
208
294
453
555
165
230
342
458
188
303
425
452
183
263
301
422
567
476
768
742
456
478
539
519
293
315
474
437
292
468
573
458
300
370
462
406
746
z 950*
852
939
687
620
664
585
584
592
670
662
637
511
707
689
57 1
577
560
628

failed, as have 98 percent of the specimens in the synthetic deicer solution. Only specimens
containing Clinton fly ash and Type I-II or Type V cements currently remain in the testing program,
these test specimens have been in the solution for more than 2.5 years.
Figures 12 through 16 depict the failure information in a graphical manner. All of the figures
were constructed by plotting the relative durability ratio (RDR) versus fly ash replacement.
The relative durability ratio (RDR) can be defined as:
time required for test specimen to reach 0.10% growth RDR = (time required for the Type I-II control specimen to reach 0.10% growth) x 100
The selection of the Type I-II cement control mortar as the divisor of the RDR equation was
arbitrary; however, it seems justifiable because it would be economically unrealistic to compare
the test mixtures to the Type V control mortar. Note from Tables 12 and 13, that some of the points
plotted on the various figures are only estimates because the specimens had not yet reached the 0.10
percent failure criterion.
Figures 12 through 16 make it easy to evaluate the influence of fly ash replacement on
relative durability ratio. The upper portion of each figure depicts the durability of specimens
exposed to the 5 percent sodium sulfate soak test, the bottom portion depicts specimens exposed to
the synthetic deicer soak test. Note, that the Type I and Type V control specimens that were exposed
to the 5 percent sodium sulfate soak solution had RDR values of 56 percent and 160 percent,
respectively. The Type I and Type V control specimens that were exposed to the synthetic deicer
solution had RDR values of 40 percent and greater than 142 percent, respectively. By definition, the
Type I-Il cement had a RDR of 100 percent in both instances. The various graphs were constructed
by plotting portland cement control points on the y-axis (i.e., at zero percent replacement) and then
extending a line from the control point horizontally across the figure. Each control line was then
labelled with its respective cement type. The control values are useful when comparing various
levels of f ly ash replacement in the test mortars. Fly ashes that exhibit trends with a negative slope

Clinton ASH -- 5% SULFATE SOAK
0 5 10 15 20 25 30 35 40 45 50 FLY ASH CONTENT (Wt. %)
Clinton ASH -- SYNTHETIC DEICER SOAK
FLY ASH CONTENT (Wt. %)
I I Figure 12. Relative durability ratio (RDR) versus fly ash replacement for Clinton fly ash (Class F).

Louisa ASH -- 5% SULFATE SOAK
300 250
g 200 z 150 8 100 Type 1-11
50
0 5 10 15 20 25 30 35 40 45 50 FLY ASH CONTENT (Wt. %)
I Louisa ASH -- SYNTHETIC DEICER SOAK I
0 j-l-++..+ -++ -,-+ -+--+-, - 1- -4 -4 --+--I - c-4
0 5 10 15 20 25 30 35 40 45 50 FLY ASH CONTENT (Wt. %)
3 200 V
rY 2 100
I I Figure 13. Relative durability ratio (RDR) versus fly ash replacement for Louisa fly ash (Class C).
-- A*
---__;t-------* Type v
A--- .--- I./ Type 1-11 /
9 __I-------
my Type 1

Ottumwa ASH -- 5% SULFATE SOAK
0 5 I 0 15 20 25 30 35 40 45 50 FLY ASH CONTENT (Wt. %)
Ottumwa ASH -- SYNTHETIC DEICER SOAK
0 -,--..,-... +.-I+ -.,.-. +-.- 4 0 5 10 15 20 25 30 35 40 45 50
FLY ASH CONTENT (Wt. %)
g 200 V
-
Figure 14. Relative durability ratio (RDR) versus fly ash replacement for Ottumwa fly ash (Class C ) .
-- A Type v
CL ____1.-4----
100 -1- /. 1
Type 1-11
\--*///- 9
/ A - - Type 1

Neal 4 ASH -- 5% SULFATE SOAK
0 5 10 15 20 25 30 35 40 45 50 FLY ASH CONTENT (Wt. %)
Neal 4 ASH -- SYNTHETIC DEICER SOAK
I Figure 15. Relative durability ratio (RDR) versus fly ash replacement for Neal 4 fly ash (Class
3 2 0 0 w
CL 100
0
--
P~ L--_.
1' n(pe v , ,A- - - 4e-b / Type 1-11
?,,----- I Type I
+ f I 1- -+--- 1+.-1-+-+-+- +. 6-1- I - - - + - - ,- /
0 5 10 15 20 25 30 35 40 45 50 FLY ASH CONTENT (Wt. %)

Council Bluffs ASH -- 5% SULFATE SOAK
300 250 . .. . .
3 200 150 T y p e v . .
100 T y p e 1-11
50
0 5 I 0 15 20 25 30 35 40 45 50 FLY ASH CONTENT (Wt. %)
CBF ASH -- SYNTHETIC DEICER SOAK
FLY ASH CONTENT (Wt. %)
g 2 0 0 w
CL
c Figure 16. Relative durability ratio (RDR) vs. fly ash replacement for Council Bluffs fly ash (Class C).
-- 1C
-. b- T y p e v 4- 2 100 T y p e 1-11
> 't T y p e I

tended to reduce the relative durability ratio of the mortar specimens with increasing fly ash
replacement. Conversely, fly ashes that exhibit trends with a positive slope tended to increase the
relative durability ratio of the mortar specimens as the fly ash content was increased.
The various figures (see Figures 12 through 16, top portion of each figure) indicate that
Clinton and Louisa fly ashes increased the sulfate resistance of the test mortars placed in
the 5 percent sodium sulfate solution. The Ottumwa and Neal 4 fly ashes produced mixed effects
(i.e., some positive and some negative), but overall they appear to have little influence on the relative
durability ratio. The Council Bluffs fly ash was the only fly ash that consistently reduced the relative
durability ratio of mortar bar specimens exposed to the 5 percent sodium sulfate solution. The RDR
reduction also appeared to be independent of the type of cement used in the mortar.
Test specimens that were submerged in the synthetic deicer solution exhibited trends that
were different from those observed with the 5 percent sodium sulfate soak test. In general, the
specimens submerged in the synthetic deicer solution took considerably longer to reach failure (0.10
percent expansion). Also, increasing fly ash content tended to increase the durability of most of the
test specimens (compare the top and bottom halves of Figures 12 through 16). This behavior was
most evident in the mortar specimens prepared using Type I portland cement. The Council Bluffs fly
ash again performed the worst among the five fly ashes used in this study. This test procedure (i.e., s
the synthetic deicer soak test) should be a mbre realistic simulation of field conditions; and
hopefully, a more realistic estimate of field performance.
Many of the mortar specimens were subjected to chemical analysis after they were removed
from the treatment tanks. Typically the test specimens were allowed to remain in the 5 percent
sodium sulfate solution until their length had increased by more than 0.5 percent; however, there are
two exceptions to this statement. First, some of the specimens, especially the specimens containing
Council Bluffs f l y ash, tended to expand so rapidly that they became very brittle and sensitive to
handling. Often these specimens broke after only 0.2 to 0.4 percent expansion. And secondly, the
ponland cement control mortar specimens were left in the 5 percent sodium sulfate solution until
they began to exhibit cracking, this usually occurred after a growth of about 1 to 1.5 percent. Test

specimens were removed from the synthetic deicer solution after they had expanded about 0.3
percent. These clarifications of testing procedure are important because the chemical testing was
only conducted on specimens that had been permanently removed from the sulfate tanks. Hence, the
samples subjected to chemical testing may be of drastically different ages but are roughly in the
same state of physical degradation.
The mortar specimens that had been removed from the sulfate baths were subjected to XRD
and TG analysis. These two test methods were used because they tend to complement one another.
However, TG analysis tends to be much more sensitive to minor changes in the concentration of the
various hydrates formed in the mortars. Also, it does not rely on the crystallinity of the material; and
hence, it can be used to identify and quantify compounds that are amorphous to x-rays.
The results of the XRD and TG study indicated that the mortars had experienced severe
sulfate attack. The test results have been summarized in Table 14. The x-ray diffractograms and TG
Table 14. Summary of results of XRD and TG investigations on the failed mortar specimens.
* mixed mode failure mechanism refers to a combination of both sulfoaluminate corrosion and gypsum corrosion
curves obtained from the various failed test specimens are located in Appendix D. Most of these test
results have been discussed in detail in a previous report [30] and, for brevity, will not be reiterated
here. The compounds that were identified in the many different specimens were quite similar (see
Table 14). Typically only the relative proportions of the various compounds differed between the
different mortar specimens. These differences should only be interpreted in a qualitative manner
because the process of removing a paste sample from any given mortar specimen may have an
Failure Mechanism
mixed mode*
sulfoaluminate corrosion
sulfoaluminate corrosion
sulfoaluminate corrosion
- Mortar
Test Specimens
Control (I, 1-11, V)
Fly Ashes
Connol (I. 1-11, V)
Fly Ashes
r
Solution Type
5% sulfate
5% sulfate
synthetic deicer
synthetic deicer
Compounds Identified
gypsum, ettringite, portlandite
emingite, monosulfoaluminate, gypsum, portlandite
enringite, portlandite, Eiedel's salt
Friedel's salt. emringite, portlandite

associated sampling error that should be dependent on the hardness of the cement matrix. However,
there are some specific trends in the test results that seem to suggest that the failure mechanism in
the fly ash mortars can be attributed to sulfoaluminate corrosion. This interpretation is strongly
linked to the failures of mortar specimens containing Council Bluffs fly ash. These particular
specimens failed rapidly and were immediately removed from the sulfate tanks for analysis. Most of
the other specimens failed slowly (over a time period measured in weeks or months, rather than
days); and hence, the mortar specimens may have been altered (i.e., more gypsum formation) during
the late stages of failure. The poor performance of the high-calcium fly ashes (especially Council
Bluffs ash) in the 5 percent sodium sulfate soak test appears to be directly related to the amount
monosulfoaluminate (an AF(rn) phase) that was formed in the mortar specimen.
Chemical analysis (XRD and TG) was also performed on mortar bar specimens that had been
submerged in the synthetic deicer solution. Visual inspection of these mortar bar specimens
indicated little evidence of any physical deterioration; however, all of the test specimens had
expanded well over 0.1 percent. The phases identified in the specimens were similar to those that
were encountered in the sulfate soak test specimens. However there was one important difference.
The AF(m) phase (monosulfoaluminate) that was linked to the sulfoaluminate failure mechanism in
the 5 percent sulfate soak specimens was a present in any of the test specimens subjected to the
synthetic deicer solution. Instead, a different AF(m) phase, commonly referred to as Friedel's salt
(CaqA1206C12. 10H20), was present in the mortar bar specimens. The concentration of Friedel's salt
appeared to increase with increasing fly ash content (for Class C ashes only). Also, gypsum was
identified in any of the test specimens. Hence, since ettringite was present in the specimens, one
may conclude that the slow expansive reaction that occurred can be atmbuted to sulfoaluminate
corrosion. Other researchers have reported that chlorafuminate AF(m) phases tend to be stable and
do not deteriorate under the test environment that was used in this study [32].
The purpose of the curing study was to evaluate the sulfate resistance of mortar specimens
that had been subjected to different curing conditions. The following curing conditions were used

for this study: { I ) 7-day l i e water; {21 28-day lime water and (3) 2-day plastic bag. All of the
specimens were cured at room temperature (23 * 2OC). Only two types of cement (Type I and Type
1-11) and two sources of fly ash (Clinton and Council Bluffs) were used in the study. Fly ash
replacement was limited to 0, 15 and 30 percent (by weight). Test specimens were placed in the 5
percent sodium sulfate solution after they reached the end of their curing period.
Obviously, the compressive strength of the mortar specimens subjected to the different curing
methods varied significantly. ASTM C 109 mortar cubes [3] were used to evaluate the compressive
strength of the different mortar mixes. The results of the tests are summarized in Table 15.
Table 15. Compressive strength of C109 mortar cubes for various specimens in the curing stage.
The results of the curing study are summarized in Table 16. Again, many of the mortar specimens
exhibited delayed expansion due to the sulfate exposure. Hence, the time (in days) required to reach
failure (0.10 percent in this instance) was used as a measurement of sulfate resistance. The interesting
aspect of Table 16 is that the sulfate durability of the various specimens is only weakly linked to
compressive strength. In fact, the correlation appears to be slightly negative for mortars containing

45
Table 16. Results of the curing study sulfate durability tests.
* = test stiU in progress a = specimens broke at 50 and 65 days of exposure
Council Bluffs fly ash (i.e., strengths correspond to sulfate durability). At first this
seems odd; however, after some thought one can conclude that strength has little to do with sulfate
durability. Instead, one must concentrate on the chemistry and the porosity (permeability) of the
mortar specimens. Since neither of these two variables were specifically measured in this phase of the
study one may consider the following explanation for this behavior as speculative at this time.
First, the behavior of the series of control mortars suggests that the porosity of the lean mortar
specimens did not change drastically during the three different curing methods. Hence, the sulfate
solutions were able to penetrate into the mortar specimens at similar rates and this caused the
specimens that had been subjected to different curing methods to fail at similar ages.
Secondly, the chemical information that was discussed earlier in this report has indicated that
Council Bluffs fly ash tends to cause more monosulfoaluminate to form in the mortar specimens.
However, the monosulfoaluminate can not form immediately because the pore solution is typically
saturated with sulfate anions for about the first two days after mixing. This fact, coupled with the

speculation that the porosity of the lean mortar specimens did not change drastically during the
different curing processess, leads one to surmise that we have "set up" our test specimens for failure
because we have accentuated the formation of monosulfoaluminate in the test specimens by using a
lime-water curing process. It is pertinent to point out that all laboratory sulfate durability tests are
basically & test methods because they arbitrarily adopt a single curing regime for all of the test
specimens. The information listed in Table 16 suggests that these static tests may often oversimplify
the dynamic processes that are inate to the hydration reactions that dominate the chemistry of portland
cement based materials.
The purpose of the concentration study was to evaluate the sensitivity of the mortar test
specimens to different concentrations of aqueous salt solutions. The soluble salts that were used in the
study are summarized in Table 17. The mortar specimens were made using two different cements
Table 17. Summary of salts used in the concentration study.
(Type 1 and Type 1-11) and four different fly ashes (Clinton, Louisa, Ottumwa and Council Bluffs).
Only two different replacement levels, 15 and 30 percent (by weight), were used in the study. All the
test specimens were cured for three days (1 day humid cure, 2 days lime-saturated water) prior to being
placed in the various sulfate bearing solutions.
The results of the concentration study are listed in Table 18. Many of the test specimens have
not yet failed so it is difficult to make any quantitative statements concerning the influence of the
various solutions on sulfate durability. However, the general trend is as one would expect, increasing
Tank No.
1
2
3
4
5 7
Description of Solution
Lyons Rock Salt (road salt)
Lyons Rock Salt (road salt)
Sodium Sulfate (Reagent grade)
Sodium Sulfate + Sodium Chloride
Sodium Sulfate + Sodium Chloride
Concentration (weight %)
20%
10%
10%
5% Na2S04 + 1% NaCl
2.5% Na2S04 + 2.5% NaCl

Table 18. Results of the Concentration Study.
* = not available at current age ( 1200 days)
sulfate concentration tends to accelerate the degradation of the test specimens. This trend is illustrated
in Figure 17 for the Type I control cement. It is not currently possible to check the data listed in Table
17 to see if there is an interaction effect between sodium sulfate and sodium chloride. However, this
information will be available as soon as all the test specimens reach the failure criterion.
&Ifate Durabilitv Testing - P- Some of the results of the paste testing program are illustrated in Figure 18. Note that the

TYPE I CEMENT
0.4 n
8 -- 0.3 z 0 i?j 0.2 z a b 0.1 w
0 0 50 100 150 200 250
TIME (days)
Figure 17. Expansion vs. time for test specimens subjected to different concentrations of sulfate bearing solutions.
specimens only expanded slowly over the duration of the study. Also, note that the Council Bluffs
(high-calcium) Class C ash performed as well as the Clinton fly ash (Class F). This is in direct
contradiction of the mortar studies. The mortar studies indicated that the Council Bluffs ash tended to
cause failure to occur much earlier than the Clinton ash. However, this discrepancy can probably be
attributed to the fact that the paste specimens were molded at a low waterlcement ratio (wlc = 0.35).
This low waterlcement ratio drastically reduced the porosity of the test specimens and did not allow the
sulfate solution to penetrate deeply into the paste specimens. Evidence for this hypothesis is given in
Figure 19. Note the diffusion boundary that on the test specimen shown in Figure 19. Increasing the

PASTE STUDY -- CLINTON FLY ASH
...........................
0 50 100 150 '200 250 300 3 TlME (DAYS)
-- CONTROL --+ 15% CLI + 30% CLI
PASTE STUDY -- COUNCIL BLUFFS FLY ASH I
50 100 150 200 250 300 3 TlME (DAYS)
I -- CONTROL +-- 15% CBF -+ 30% CBF / I - A
Figure 18. Expansion vs. time for paste test specimens submerged in a five percent solution of sodium sulfate.

Secsndaq eiectron lmage of paste specimen.
Figure 19. Diffusion rim in a paste test specimen (Dundee cement, 30% Council Bluffs fly ash).

waterlcement ratio of the paste test specimens would also increase their porosity; and hence, test results
may approach those of the mortar studies. However, this is not possible from a practical standpoint
because the high waterlcement ratio test specimens tend to be extremely fluid and bleed excessively.
A summary of the details pertaining to the concrete mixes made by Iowa Department of
Transportation personnel is listed in Table 19. All of the concrete mixes had air contents of 6 i 1
percent and slumps of 2 it 0.5 inches. The 28-day compressive strengths of the different mixes
varied from a low of about 5000 psi (typically mixes containing Clinton ash, Class F ) to a high of
over 7000 psi for several of the moderate to high replacement mixes containing Class C ashes.
The current test results for the various concrete mixes that have been subjected to the sulfate
test solutions, 10 percent sodium sulfate and the synthetic deicer solution (containing 9.5 percent
sodium chloride plus 0.5 percent sodium sulfate), have been summarized in Table 20. The
parameters that have been listed include specimen growth (linear expansion) and relative dynamic
modulus of elasticity (RDM). The mass of the various test specimens was also monitored during the
study but all of the test specimens are currently within one percent of their initial mass.
Several details need to be discussed concerning Table 20. First, none of the test specimens
have yet reached the failure criterion of 0.1 percent ex~jansion. In fact, if the failure criterion was
reduced to 0.05 percent expansion then only two percent of the test specimens would have failed, and
they would all consist of Type I portland cement control specimens. Hence, all the discussion
that follows must be considered as "preliminary" and may be subject to significant change as the
tests progress. Secondly, the growth values and RDM values tend to be in agreement with one
another, and they tend to indicate reasonably sound concrete. Typically the growth values decreased
with increasing fly ash content. And finally, the growth and RDM values for the specimens
subjected to the 10 percent sulfate soak test are typically quite similar to the specimens that were
subjected to the synthetic deicer soak test. However, the visual appearance of these two different
groups of test specimens was very dramatic. The test specimens submerged in the synthetic deicer

52
Table 19. Summary of concrete mix parameters.
3
4
5
6
7
8
9
10
11
12
13
14
15
16
17
18
19
20
21
22
23
24
25
26 i
Dundee
Dundee
S . Dakota
S . Dakota
S Dakota
Dundee
S Dakota
C. Bluffs
Clinton
None
Ottumwa
C Bluffs
Clrnton
Loursa
Lou~sa
15
30
7.5
15
30
7.5
15
30
0
7.5
15
30
7.5
15
30
7.5
15
30
7.5
15
30
7 5
15
30
0.439
0.4 13
0.446
0.429
0.413
0.464
0.453
0.451
0.472
0.470
0.453
OA22
0 458
0 429
0418
0 464
0.453
0.446
0 458
0 434
0 422
0 458
0 448
0 432
5.9
5.8
6.0
5.8
6.3
6.1
5.7
5.6
6.0
6.0
5.9
6.0
6.1
5.8
6.5
6.4
6.3
5.7
6.2
6 0
6 0
5 9
6 0
6 0
1.75
2.25
2.00
2.00
1.75
2.25
1.75
1.75
2.00
2.25
2.00
1.75
2.00
1.75
1.75
2.25
2.25
2.00
1.75
2.00
2.25
2.25
2 25
2 00
143.2
143.6
143.6
144.8
143.2
142.0
143.6
143.6
143.6
143.2
144.0
143.6
143.2
144 4
142 8
143.2
141.6
142.2
143 6
144 0
144 0
143 2
143 2
144 0
6710
6480
7150
6440
6590
6130
6490
7130
6990
6880
6930
6580
6380
7040
7230
6550
7280

53
Table 19. Summary of concrete mix parameters (continued)
29
30
31
32
33
34
35
36
37
38
39
40
41
42
43 -
44
45
46
47
48
49
50
5 1
52
Dundee
Dundee
S Dakota
S. Dakota
S. Dakota
Dundee
S Dakota
C. Bluffs
Cilnton
None
Ottumwa
C Bluffs
Clmton
Lou~sa
Lou~sa
15
30
7.5
15
30
7.5
15
30
0
7.5
15
30
7.5
15
30
7.5
15
30
7.5
15
30
7 5
15
30
0.439
0.413
0.458
0.434
0.418
0.476
OA58
0.446
0.462
0.464
0.443
0.423
0.458
0.448
0.437
0 464
0 448
0 469
0 458
0.434
0 423
0 458
0 440
0 427
6.8
6.8
6.7
6.2
6.3
6.5
5.9
5.8
6.0
6.3
6.4
6.1
6.4
6.4
6.4
6.4
6.1
5.8
6.1
6 1
5.7
6 1
6 2
6 0
2.00
2.00
2.25
2.00
2.25
2.50
2.00
2.00
2.00
2.00
2.25
2.00
2.00
2.00
2.00
2.25
1.75
2.25
2.25
2.25
2.25
2 50
2 25
2.25
142.8
143.6
142.8
144.8
144.8
142.8
144.8
144.8
144.0
144.4
144.0
144.8
144.0
144.0
144.6
143.6
144.4
144.0
144.4
145.2
146 0
144 8
144 8
145 2
6210
6610
7370
6790
6330
6050
6950
7280
7750
7050
7130
6690
6690
7790
6650
7310
7450
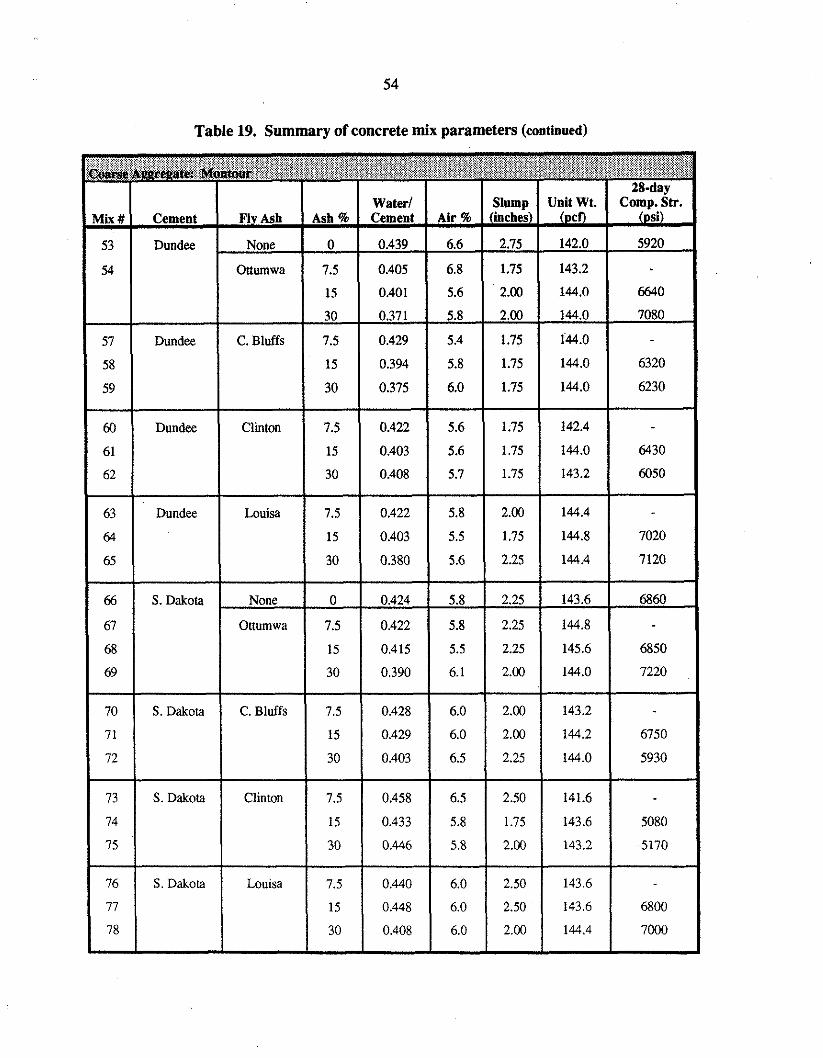
54
Table 19. Summary of concrete mix parameters (continued)
57
58
59
60
61
62
63
64
65
66
67
68
69
70
71
72
73
74
75
76
77
78
Dundee
Dundee
Dundee
S. Dakota
S . Dakota
S Dakota
S Dakota
C. Bluffs
Clinton
Loulsa
None
Onumwa
C. Bluffs
Clinton
Lou~sa
15
30
7.5
15
30
7.5
15
30
7.5
15
30
0
7.5
15
30
7.5
15
30
7.5
15
30
7.5
15
30
0.401
0.371
0.429
0.394
0.375
0.422
0.403
0.408
0.422
0.403
0.380
0 424
0.422
0415
0.390
0.428
0.429
0.403
0.458
0 433
0 446
0 440
0 448
0 408
5.6
5.8
5.4
5.8
6.0
5.6
5.6
5.7
5.8
5.5
5.6
5.8
5.8
5.5
6 1
6.0
6.0
6.5
6.5
5.8
5 8
6 0
6 0
6 0
2.00
2.00
1.75
1.75
1.75
1.75
1.75
1.75
2.00
1.75
2.25
2.25
2.25
2.25
2.00
2.00
2.00
2.25
2.50
1 75
2.00
2 50
2.50
2 00
144.0
144.0
144.0
144.0
144.0
142.4
144.0
143.2
144.4
144.8
144.4
143.6
144.8
145.6
144.0
143.2
144.2
144 0
141.6
143 6
143 2
143 6
143 6
144 4
6640
7080
6320
6230
6430
6050
7020
7120
- 6860
6850
7220
6750
5930
5080
5170
6800
7000

55
Table 19. Summary of concrete mix parameters (continued)
81
82
83
84
85
86
87
88
89
90
91
92
93
94
95
%
97
98
99
103
101
102
103
104
Dundee
Dundee
Dundee
S Dakota
S Dakota
S. Dakota
S Dakota
C. Bluffs
Clmon
Lou~sa
None
Ottumwa
C. Bluffs
Clinton
Lou~sa
15
30
7.5
15
30
7.5
15
30
7.5
15
30
'0
7.5
15
30
7.5
15
30
7.5
15
30
7 5
15
30
0.466
0.446
0.476
0.457
0.441
0.476
0.47 1
0.455
0 476
0.462
0431
0.466
0.458
0.448
0.436
0.458
0 462
0 436
0.476
0.476
0 469
0 476
0 453
0 436
5.5
5.6
5.7
5.3
6.2
5.5
5.7
5.6
6.1
5.4
5.4
5.5
5.6
5.5
6.1
6.1
5.8
6.5
5.9
5.5
5.9
6 1
5 4
5 5
2.00
2.00
2.25
1.75
2.00
2.W
1.75
2.00
2.00
2.00
1.75
1.75
1.75
2.25
2.25
1.75
1.75
2.00
2.25
2.00
2 25
1 75
1 75
1 75
144.0
143.2
143.2
144.0
142.0
142.4
142.4
141.6
142.4
143.2
144.4
143.6
142.8
143.6
143.2
143.2
143.6
142.8
142.8
143.2
141 6
142 8
143 6
143 6
5890
5680
5460
5770
5460
4900
5950
6360
6450
6030
5900
5960
6180
5420
4710
5750
6490

56
Table 20. Summary of concrete mix relative dynamic modulus (RDM) and growth.
3
4
5
6
7
8
9
10
11
12
13
14
15
16
17
18
19
20
2 1
22
23
24
25
26 1
Dundee
Dundee
S. Dakota
S. Dakota
S. Dakota
Dundee
S Dakota
C. Bluffs
Cl~nton
None
Ottumwa
C. Bluffs
Cl~nton
Loulsa
Lou~sa
15
30
7.5
15
30
7.5
15
30
0
7.5
15
30
7.5
15
30
7.5
15
30
7.5
15
30
7.5
15
30
104
106
101
101
106
104
109
109
102
103
106
107
103
103
111
108
107
110
105
108
108
103
110
114
0.033
0.028
0.038
0.030
0.027
0.02 1
0.022
0.018
0.028
0.025
0.027
0.039
0.025
0.021
0.019
0.016
0.014
0.013
0.03 1
0.027
0.018
0.021
0.016
0.016
99
105
99
100
104
99
103
110
100
101
102
104
102
104
105
104
103
109
100
102
107
102
103
111
0.037
0.0%
0.044
0.035
0.028
0.028
0.036
0.018
0.029
0.030
0.019
0.017
0.024
0.026
0.024
0.022
0.023
0.013
0.03 1
0.028
0.020
0.020
0.023
0 016

Table 20. Summary of concrete mix relative dynamic modulus (RDM) and growth (continued)
29
, 30
3 1
32
33
34
35
36
37
38
39
40
41
42
. 43
44
45
46
47
48
49
50
51
52
Dundee
Dundee
S. Dakota
S Dakota
S. Dakota
Dundee
S Dakota
C. Bluffs
Cllnton
None
Onumwa
C. Bluffs
Cl~nton
Lou~sa
LBulsa
15
30
7.5
15
30
7.5
15
30
0
7.5
15
30
7.5
15
30
7.5
15
30
7.5
15
30
7.5
15
30
111
110
108
109
111
108
114
111
107
110
107
108
110
111
115
116
114
119
109
109
112
110
112
114
0.024
0.021
0.030
0.027
0.032
0.017
0.015
0.015
0.025
0.018
0.016
0.017
0.017
0.014
0.018
0.012
0.009
0.014
0.028
0.023
0.021
0.019
0.014
0.015
104
110
102
106
107
106
106
109
103
105
107
109
102
104
109
107
107
113
107
109
112
106
107
112
0.029
0.021
0.028
0.027
0.024
0.029
0.022
0.016
0.028
0.023
0.0 18
0.016
0.019
0.020
0.019
0.092
0.016
0.010
0.026
0.023
0.016
0.020
0.027
0.017

Table 20. Summary of concrete mix relative dynamic modulus (RDM) and growth (continued)
63
64
65
66
67
68
69
70
7 1
72
73
74
75
76
77
78
Dundee
S. Dakota
S. Dakota
S. Dakota
S. Dakota
Louisa
None
Ottumwa
C. Bluffs
Clinton
Lou~sa
7.5
15
30
0
7.5
15
30
7.5
15
30
7.5
15
30
7.5
15
30
104
104
107
105
106
105
110
106
104
103
105
107
109
103
106
108
0.018
0.009
0.005
0.006
0.014
0.012
0.006
0.009
0.01 1
0.013
0.007
0.003
0.004
0.004
0.007
0.004
102
102
104
101
101
102
106
105
102
105
104
106
108
103
102
106
0.01 1
0.014
0006
0.009
0.014
0.038
0.006
0.009
0.01 1
0.013
0.007
0.005
0.008 - 0.006
0.009
0.003

Table 20. Summary of concrete mix relative dynamic modulus (RDM) and growth (continued)
81
82
83
84
85
86
87
88
89
90
9 1
92
93
94
95
96
97
98
99
100
101
102
103
104 =
Dundee
Dundee
Dundee
S. Dakota
S. Dakota
S. Dakota
S. Dakota
C. Bluffs
Clinton
Louisa
None
Onumwa
C. Bluffs
Clinton
Loulsa
15
30
7 5
15
30
7.5
15
30
7.5
15
30
0
7.5
15
30
7.5
15
30
7.5
15
30
7.5
15
30
108
107
109
106
109
109
110
I l l
109
108
111
109
109
110
110
107
108
110
114
112
115
108
109
110
0.014
0.012
0.020
0.016
0.010
0.004
0.007
0.007
0.01 1
0.019
0.006
0.004
0.002
0.003
0.004
0.002
0.006
0.005
0.008
0.002
0.007
0.005
0.004
0.002
105
106
102
103
103
98
105
108
104
106
110
107
109
108
109
104
105
105
104
108
109
102
106
106
0.014
0.011
0.016
0.019
0.013
0.012
0.010
0.006
0.014
0.008
0.013
0.006
0.002
0.010
0.005
0.017
0.01 1
0.009
0.009
0.004
0.004
0.009
0.011
0.006

solution had little or no apparent spalling or cracking. The specimens in the 10 percent sulfate
solution had suffered significant deterioration.
Figures 20 through 23 illustrate the typical condition of the specimens that had been
subjected to the 10 percent sodium sulfate solution. The concrete specimens containing Montour
coarse aggregate and Lamont coarse aggregate exhibited similar trends. In most cases, the
specimens appear to be spalling off the outside portion of the concrete. Hence, the beams tend to
loose edges f i s t and then they take on a "rounded appearance. The deterioration is visibly quite
evident but, as mentioned earlier, the specimens have lost a negligible amount of mass. Counting the
comers on the various test specimens gives a reasonable way to compare the relative level of
deterioration. Many of the specimens containing Type I cement and 30 percent fly ash appear to be
in better shape than the control specimen containing Type V cement.
Tests - Mort-
Typical results from the alkali reactivity tests are shown in Figures 24 and 25. These figures.
illustrate how the various mortar specimens expanded as a function of time. It is pertinent to
mention several important details that are evident in the figures.
First, the mortar bar specimens that contained Pyrex glass aggregate expanded more rapidly
and to a much greater magnitude than the specimens containing the other two aggregates (Class V or
standard sand). Hence, these tests were discontinued after one year of moist curing because the test
specimens had stopped expanding (note, in the top half of Figure 24, how flat the expansion-time
curves become after approximately three months of curing). This is in agreement with the available
alkali study, which indicated that the fly ashes conmbuted a significant amount of alkalis to the pore
solution for about the first three months of curing (compare Figures 10 and 24).
Secondly, test specimens containing the Class V aggregate and the standard (Ottawa) sand
aggregate exhibited very similar trends. However, the mortar bars containing the Class V aggregate
did tend to expand slightly more than those containing the standard sand. Note in the bottom half of
Figure 24, that the scale that was used has changed significantly from that used in the top half of the

Figure 20. Specimens subject to the 10 percent sulfate soak test; Type I cement, various fly ashes at 7 4 1 5 and 30 percent replacement, Jaben aggregate, age about 128 weeks.

Figure 21. Specimens subject to the 10 percent soak test; Type V cement, various fly ashes at 7.5,15 and 30 percent replacement, Jaben aggregate, age about 128 weeks.

Figure 22. Specimens subject to the 10 percent sulfate soak test; Type I cement, various fly ashes at 7.5,15 and 30 percent replacement, Early Chapel aggregate, age about 64 weeks.

Figure 23. Specimens subject to the 10 percent soak test; Type V cement, various fly ashes at 7.5,15 and 30 percent replacement, Early Chapel aggregate, age about 64 weeks.

65
Figure 24. Typical test results that were obtained from the ASR study.
PYREX GLASS AGGREGATE 0.8 h
P e 0.6
0 5 0.4 2 a
8 Oe2 ---- 0
0 2 4 6 8 I 0 12 14 TIME (months)
CLASS V AGGREGATE h 0.2 s w
z 0 5 0.1 Z a
8 o 0 2 4 6 8 10 12 14 16 18 20 22 24
TIME (months)
I-, DUN + DAV -F DAV+CBF -ge- DUN+CLI

Figure 25. Influence of time on the test results of the ASR study.
r -
PYREX -- LOUISA ASH -- DUNDEE 2 0.2 w
z 0 'i7j 0.1 f k 0
0 I 0 20 30 40 50 FLY ASH REPLACEMENT (%)
-- --
-+ 6 MONTH -.e 12 MONTH
CLASS V -- LOUISA ASH -- DAVENPORT 0.2 -
n
8 w
z 0 'i7j 0.1 2 a 1s
0 0 I 0 20 30 40 50
FLY ASH REPLACEMENT (%)
- -- - --
I[-= 3 MONTH + 6 MONTH -7- 12 MONTH -= 21 MON

figure. The expansion axis has been reduced by a factor of about 3 while the time axis has almost
been doubled. Hence, the measured response was small and the duration of the test was very long.
This fact was anticipated at the beginning of the research project. Since we are attempting to
distinguish small differences between test specimens that exhibited only a small response to the
treatment it is very important to know the precision of the test method. This has been estimated for
the control specimens by making duplicate test specimens on two different days (actually weeks
apart). It has been assumed that the specimens containing fly ash exhibit the same level of precision.
These test results are summarized in Table 21. Typically the test results were repeatable to about k
10 percent (relative error, coefficient of variation), this corresponds to an absolute error of about + 0.01 percent expansion.
Finally, we must remember that the goal of the project was to evaluate how fly ash influences
the AAR test results. Since all the testing information varies as a function of time we must pick
some arbitrary time for comparing expansion values. For the purpose of this report we have chosen
to compare expansion values at 6 months for specimens containing the Pyrex glass aggregate, and at
21 months when comparing the specimens containing the natural aggregates. These selections were
arbitrary and, as illustrated in Figure 25, had little influence on the trends exhibited by the test
specimens. Hence, future discussion will be limited to the data listed in Table 21.
The expansion values summarized in Table 21 make it easier to show how the various fly
ashes influence the alkali-reactivity tests.
Plots of linear expansion versus fly ash content are shown in Figures 26 through 28. These
figures illustrate how expansion varied with: { 1 ] the source of the fly ash; (21 the amount of the fly
ash that was present in any given mortar mix; and (3) the type of aggregate that was used. The
upper half of each figure denotes the test response that was observed when the moderate alkali
cement (Davenport, 0.76 percent equivalent sodium oxide) was used. The lower half of each figure
denotes the test response that was observed when the low alkali cement (Dundee, 0.39 percent
equivalent sodium oxide) was used.

Table 21. Results of alkali-aggregate reactivity tests conducted on the five fly ashes. All values listed as percent expansion.

Table 21. Results of alkali-aggregate reactivity tests conducted on the five fly ashes (continued) All values listed as percent expansion.
C t m V &aregate (Oreapolis), e x ~ t r s i o a vatues measured at 21 momhs I DUN cement (0.39% equivalent sodium oxide)
% Fly Ash
0
7.5
15
* based on n=4 and 0.062 t 0.006
** based on n=4 and 0.082 t 0.015
Clinton
0.06.
0.07
0.06
Louisa
0.06'
0.06
0.07
Neal 4
0.06.
0.07
0.06
Council Bluffs
0.06*
0.06
0.07
Ottumwa
0.06'
0.06
. 0.08

Table 21. Results of alkali-aggregate reactivity tests conducted on the five fly ashes (continued) All values listed as percent expansion.
* based on n=4 and 0.056 f 0.005
" based on n=4 and 0.065 f 0.006

Class V AGG. -- MOD. ALKALI CEMENT .... ..... ..... ... . - .. , ........ -- , ,
:.."-":...-..:.A ..% - .. . .
..... .... - . p. -
dc -. . .!I::... ..~ . :.,, 8 -.-,; .;;, - . ........... - .
0 10 20 30 40 50 FLY ASH CONTENT (wt. %)
Class V AGG. -- LOW ALKALI CEMENT ......... .... 0.15 h s
V
0.10 ..... - x- -- - ,- -,;=~Z-- ->*. ,"'
cn .- ...... g-';-- . .- - - ...... ......
0.05 . . . . ~ . ~. . . , . .
a X w
0.00 +- I F - . + - - - + - & - - t +
0 10 20 30 40 50 FLY ASH CONTENT (wt. %)
................................................
-* NE4 CBF OTT 1 Figure 26. Expansion versus fly ash replacement for the specimens containing Class V aggregate.

STD. SAND -- MOD. ALKALI CEMENT
w
-'+ t------i-- --
0 10 20 30 40 50 FLY ASH CONTENT (wt. %)
STD. SAND -- LOW ALKALI CEMENT
0 10 20 30 40 50 FLY ASH CONTENT (wt. %)
--- - -------- - ---- - - - -- - = C L I +LOU~NE~~.CBF*OTTI
Figure 27. Expansion vs. fly ash replacement for specimens containing standard sand aggregate.

PYREX GLASS -- MOD. ALKALI CEMENT ............... -- . ............
. . . . . . .
0 10 20 30 40 50 FLY ASH CONTENT (wt. %)
PYREX GLASS -- LOW ALKALI CEMENT ......-.-.-.-..-. ...........
>-- - - - :---. -x, w ..- --. .n. ... .......
. . . . . :.> \<, *:. .;. .. -
. - - . . . . . (. (.
.... . . . . . . , .. . . . .................. .. v-,- . -.
_ _ d
0 10 20 30 40 50 FLY ASH CONTENT (wt. %)
... . ............ . . . . . . . . . . . . . . . . . . .-...
* CLl -t LOU + NE4 o
Figure 28. Expansion versus fly ash content for the specimens containing Pyrex glass aggregate.

Figure 26 depicts the test results that were obtained when using the Class V aggregate. All
the values plotted in the figure were taken from Table 21; and hence, were the expansion values that
were measured at 21 months of curing. This particular aggregate does tend to show some expansive
behavior when used in combination with the moderate alkali cement and either Ottumwa or Council
Bluffs fly ashes. The failure criteria suggested by the ASTM for this test method are 0.02 percent
expansion at 14 days, 0.05 percent expansion at 3 months and 0.10 percent expansion at 6 months
[3]; hence, there is no direct limit stated that can be applied to these test results (i.e., measured at 21
months). These same test specimens @the ASTM expansion requirements at 14 days, 3 months
and 6 months. The test specimens that contained the low alkali cement did not expand as much as
the specimens that contained the moderate alkali cement.
Figure 27 depicts the test results that were obtained from the specimens containing the
standard sand as an aggregate. This series of mixtures were originally made to produce a "bland" or
"background measurement that could be used to assess the expansive potential of the other two
sources of aggregate. However, as is evident in Figure 27, the test specimens containing the standard
sand aggregate also exhibited a measurable response to the test procedure. The "background"
expansion of the test specimens was about 0.06 percent at 21 months. This expansion did not appear
to be significantly influenced by the alkali content of the two cements that were used in the study.
However, the test specimens that contained Louisa, Ottumwa or Council Bluffs fly ash tended to
exhibit trends of increasing expansion with increasing fly ash replacement. This trend was also
observed in the specimens made with the Class V aggregate (it is most evident in the mortar base
containing the low alkali cement). The remaining two fly ashes (Neal 4 and Clinton) did not exhibit
this type of behavior and produce nearly flat expansion versus fly ash content c w e s . This suggests
that we may be observing specimen expansion that is not related to ASR. Such a phenomenon has
already been suggested by Johnston 1311, who related the expansion to bulk MgO content. Our data,
which refers to measurements taken at 21 months, indicates that the effect may increase the
specimen expansion by about 0.03 to 0.04 percent by the time that you reach 50 percent fly ash
replacement. Hence, these effects are quite small but they are certainly measurable, and, as was the

case in this particular instance, they may make a significant contribution to the & test response.
Our test measurements were too imprecise to attempt a reliable correlation study but it is interesting
to note that the three fly ashes with the highest periclase (MgO) contents (see the diffractograms in
Appendix A) consistently exhibited this type of behavior.
Figure 28 depicts a "worst case" scenario because the mortar bars were made with an
extremely alkali-reactive aggregate (crushed Pyrex glass). All of the fly ashes exhibited a
"pesimum" percentage of fly ash replacement in the mixes containing the low alkali cement. This
percentage was normally in the range of about 15 to 35 percent replacement. However, this same
trend was not always evident in the mixes containing the moderate alkali cement. Hence, one can
conclude that the fly ashes did contribute a significant portion of alkalis to the pore solutions of the
mortars but that their influence is much greater when using low alkali cements than when using
cements with moderate (0.75 percent) alkali contents. This trend is much more apparent when the
expansion data is transformed from an absolute basis to a relative basis (i.e., expansion of the
ponland cement control specimens = 100 percent). This information is depicted in Figure 29. The
upper half of Figure 29 indicates that only one set of test specimens that were made with the
moderate alkali cement exceeded a relative expansion value of 120 percent (i.e., an increase in
expansion of 20 percent). In contrast, the bottom half of Figure 29 indicates that when the same fly
ashes were used with the low alkali cement nearly all of the specimens exceeded a relative expansion
value of 200 percent. Only the Clinton fly ash and low percentages of the Louisa fly ash were able
to reduce the expansion of the test specimens below the value that was observed for the low alkali
control specimens.
The performance of the different fly ashes with the Pyrex glass aggregate is difficult to
explain using an explanation based only on the alkali content of the fly ashes. Even when the cement
alkalis are included in the calculations it is difficult to explain why the Council Bluffs fly ash often
performs the same or even worse than the Ottumwa fly ash. Also, why did the Louisa and Neal 4 fly
ashes, which have very similar chemical compositions, behave so differently in the Pyrex ASR
study? And finally, why did the Class C fly ashes exhibit such broad pessimum curves? Perhaps a

PYREX AGG. - MOD. ALKALI CEMENT h
-- - . .- -. . . - .- - -. - . .- . .. . -.
0 10 20 30 40 50 FLY ASH REPLACEMENT (%)
h
PYREX AGG. - LOW ALKALI CEMENT
I 000 r- - - - -- - - - -- . . --- - -1
-:.*-::-:---1.. . .
0 10 20 30 40 50 FLY ASH REPLACEMENT (%)
~ -..--..- .....
/:+CLI + LOU + NE4 b- CBF * OTT I I I Figure 29. Relative expansion vs. fly ash content for specimens containing Pyrex glass aggregate.

partial explanation for these various questions can be ataibuted to the presence of cristobalite (or a
glass phase similar to cristobalite) in three of the Class C fly ashes (Neal 4, Ottumwa and Council
Bluffs). The concentration of cristobalite in these three fly ashes is rather small, probably only a few
percent, and its particle size is not known. Hence, one must question if such a material will behave
as a pozzolan (small particle size) or an aggregate (large particle size), but in either case the
cristobalite should produce alkali-silica gel. Due to the low concentration of cristobalite in the fly
ashes, it will take large fly ash replacements to push the cristobalite content of a test specimen over
the pessimum proportion. When relative performance ratings are assigned to the test specimens
(based on the graphical information in Figures 28 or 29) it is apparent that the cristobalite
concentration places the fly ashes in the proper order (see Table 22).
Table 22. Performance (negative basis) of the various fly ashes in the Pyrex glass study.
The Iowa DOT has already conducted several studies to identify the alkali-sensitive
aggregates that are present in Iowa. The first study was conducted by Moussalli and Riley and
reported in 1980 [33]. The purpose of this study was to evaluate how increasing cement alkali
contents would impact the integrity of concrete pavements and structures in Iowa. The study
investigated the alkali-reactivity of 31 different aggregates using the quick chemical test (ASTM C
289) and the mortar bar method (ASTM C 227). The results of the study indicated that of 31
aggregates that were tested could be definitely (conclusively) identified as alkali-sensitive.

The second study was conducted by Jones and reported in 1989 [34]. The objectives of the
study were to: ( I ] test the effectiveness of the new ASTM C 227 test containers; and (2) to study
the effect of three Iowa fly ashes on the alkali-silica reaction. Three different cements (high, low and
very low alkali), three different aggregates (Pyrex glass, Oreapolis and Cordova) and three different
fly ashes (Louisa, Ottumwa and Council Bluffs) were used in the study. The test results indicated
that neither the Oreapolis or Cordova aggregates exhibited an alkali-silica reaction problem
(although the Cordova aggregate did tend to perform slightly better than the Oreapolis aggregate).
However, Jones also expressed his concern about the expansive tendencies that were observed when
the Class C fly ashes were used in the mortar bar specimens. This behavior was most obvious in test
specimens that contained the Pyrex glass aggregate in combination with the Council Bluffs fly ash
and the low alkali cements, or test specimens that contained the Oreapolis aggregate in combination
with of the fly ashes and the high alkali cement. Few trends could be discerned in the specimens
that contained the Cordova aggregate. Hence Jones recommended that the Class C fly ashes should
be included in future testing programs.
Recently the Iowa DOT has turned to a new test method (ASTM P-214 to evaluate the alkali-
reactivity of a wide variety of Iowa sands. Preliminary results of this study have suggested that
many of the sands are alkali-sensitive [35]. In fact, of the thirty sources of sand that were evaluated,
only two sources were classified as innocuous. Seventeen of the sands produced in conclusive test
results and the remaining eleven sources were classified as reactive. The Oreapolis sand was
classified as alkali-reactive and it produced the fourth largest test response (expansion) that was
observed for the thirty different sands that were studied. Hence, we have learned a great deal about
the reactivity of Iowa sands since the early studies were conducted. Obviously, as was pointed out
by Jones [34], the early alkali-reactivity studies were plagued by experimental difficulties (i.e., H
shrinkage rather than expansion) and the accuracy of their test results must be questioned. ow ever, how can the difference between the study by Jones (Oreapolis non-reactive) and the new P-214 study
(Oreapolis reactive) be resolved?
The test results that have been presented in this research report have verified those that were

79
reported by Jones in 1989. In fact, this study includes observations that span a period of 21 months
(instead of the six month period used by Jones). After 21 months at 38' C, the test specimens that
contained the moderate alkali cement and the Oreapolis aggregate still did not exceed the six month
expansion criterion of 0.1 percent. Several of the test specimens containing Class C fly ashes
(Council Bluffs, Ottumwa and Neal 4) &J exceed the 0.1 percent expansion criterion; however, this
study has identified two additional factors that influence expansion, namely periclase content and
cristobalite content.
SUMMARY AND CONCLUSIONS
In summary, a detailed investigation has been made to assess how Iowa fly ashes influenced
the chemical durability of portland cement based products. This study was conducted to provide a
sound empirical database which can be used to predict how deicer salts that contain sulfate
impurities affect the integrity of Iowa pavements.
Sulfate durability tests were conducted on portland cement-fly ash pastes, mortars and
concretes. The mortar bar tests were conducted using a procedure similar to that described in ASTM
C 1012. The concrete tests were conducted using a procedure similar to that used by the U.S. Bureau
of Reclamation. Both studies investigated sulfate soak solutions and synthetic deicer soak solutions.
Several additional mortar studies were conducted to evaluate how the mortar bar studies were
influenced by the concentration of the sulfate and chloride solutions and the duration of curing
before immersion in the sulfate soak solutions.
Alkali-aggregate reactivity tests were conducted to assess how Iowa fly ashes influenced the
expansion of ASTM C 3 11 mortar bar specimens.
The results of this research effort, and the conclusions that have been made by careful
interpretation of these test results, can be summarized as follows.

1. The results of the ASTM C 1012 mortar bar studies (5 percent sodium sulfate soak test) indicated that:
Sulfate resistance of the control mortar specimens tended to increase with decreasing content of tricalcium aluminate (C3A content calculated via ASTM C 150).
Sulfate resistance of test specimens containing Clinton or Louisa fly ashes tended to increase with increasing fly ash replacement. This trend was consistent regardless which type of cement was used in the test specimens. In fact, test specimens containing thirty percent Clinton or Louisa fly ash easily outperformed the Type V control specimens.
Sulfate resistance of the test specimens containing Ottumwa or Neal 4 fly ashes was neither increased nor decreased relative to the appropriate control specimens.
Sulfate resistance of the test specimens containing the Council Bluffs fly ash was decreased with respect to the appropriate control specimens.
Sulfoaluminate corrosion was identified as the major failure mode for the mortar bar specimens. Most of the test specimens exhibited expansive tendencies that were relatively uniform throughout the mortar bar, with little evidence of surface spalling or comer breakage.
2. The results of the mortar bar specimens that were subjected to the synthetic deicer soak solution (9.5 percent NaCl + 0.25 percent Na2S04) indicated that:
All of the fly ashes tended to increase the sulfate durability of the test specimens that were made with thy Type I portland cement. Typically, sulfate durability increased with increasing fly ash replacement.
Many of the fly ashes (Clinton, Louisa and Neal 4) tended to increase the sulfate resistance of test specimens that were made with the Type 1-11 portland cement. The remaining two fly ashes (Ottumwa and Council Bluffs) had to be used at replacement levels above 15 percent to improve the sulfate resistance of the test specimens.
All of the fly ashes except the Clinton ash reduced the sulfate resistance of the test specimens that were made with the Type V portland cement.
Sulfoaluminate corrosion was identified as the major failure for the test specimens that were subjected to the synthetic deicer soak test. However, the improved sulfate resistance of the specimens containing Council Bluffs fly ash and Type I portland cement was attributed to the formation of Friedel's salt rather than monosulfoaluminate. Friedel's salt did not appear to be expansive in the synthetic deicer solution.

3. The results of the curing study that was conducted on the mortar bar specimens indicated that:
Compressive strength had little influence on the results of the sulfate durability tests. Instead, it appeared that porosity and specimen chemistry tended to dominate the sulfate resistance of the test specimens.
4. The results of the concentration study that was conducted on the mortar bar specimens indicated that:
Specimen distress and time to failure can be drastically altered by altering the concentration of the sulfates in the test solution. Typically, test specimens failed more rapidly in test solutions that contained higher concentrations of sulfates.
5. The results of the paste study (5 percent sulfate soak test) indicated that:
Test specimens containing Council Bluffs fly ash and Type I cement failed very slowly compared to the mortar bar test specimens. This suggests that specimen porosity may dominate the failure mechanism (sulfoaluminate corrosion) at low waterlcement ratios.
Scanning electron microscopy studies indicated the presence of diffusion rims in the test specimens. The rims tended to be enriched in sulfur when compared to the interior of the test specimen. This was in agreement with the failure mode exhibited by many of the specimens, which indicated that the specimens tended to spall off edges and corners.
6. The results of the concrete study indicated that:
The expansion rate of the concrete test specimens was very slow. In fact, at the time of writing this report, none of the concrete specimens had yet reached the 0.1 percent failure criterion. If this criterion was reduced to 0.05 percent expansion, only the Type I control concrete specimens would have failed the test.
Relative dynamic modulus readings and weight measurements were consistent with the expansion measurements. Hence, all three measurements indicated that the concrete test specimens were in a reasonably sound condition.
Visual inspection of the test specimens indicated a failure mode that was due to surface spalling at edges and corners. Typically, visual inspection suggested that sulfate resistance increased with increasing fly ash replacement (30 percent maximum replacement). Clinton fly ash appeared to perform the best; however, the four Class C fly ashes also appeared to be performing reasonably well.

Based on U.S. Bureau of Reclamation sulfate durability studies, which have indicated that one year of laboratory exposure (10 percent soak test) is equivalent to about six years of service life, the concrete mixes summarized in this report have endured:
Jabens aggregate (1 16 weeks exposure) e 13 years service life Lamont aggregate (104 weeks exposure) e 12 years service life Montour aggregate (64 weeks exposure) e 7 years service life Early Chapel aggregate (52 weeks exposure) = 6 years service life
Since of the concrete test specimens were on the brink of failure, one may conclude that the Iowa DOT C-3 concrete mixes exhibit good resistance to sulfate attack. The information listed in this report indicates that the failure due to sulfate attack should be slow (not catastrophic) and that in properly constructed projects the attack should be controlled by the permeability of the concrete (i.e., failure should progress from the outside (exposed side) to the inside of the member; comers and edges being the first indicators of sulfate induced degradation.
Concrete test specimens that were placed in the synthetic deicer soak solution have exhibited only minor deterioration over the course of this study. These test specimens have expanded about the same magnitude as the test specimens that were placed in the 10 percent sodium sulfate solution; however, a visual assessment of the various test specimens has yielded little evidence of surface spalling or comer breakage. Hence, the synthetic deicer soak specimens appear to be failing at a very slow rate.
7. The results of the alkali-reactivity mortar bar tests have indicated that:
The Oreapolis aggregate is not very sensitive to alkali-aggregate reaction. This experimental program has verified both the observations and conclusions reported in an earlier study conducted by Jones. The duration of the present study has exceeded 21 months of exposure to the test conditions and the measured expansions of the control test specimens were all less than 0.1 percent (the six month criterion set by the ASTM). This conclusion is based on the use of a moderate alkali cement (0.8 percent equivalent sodium oxide); however, the study by Jones incorporated a high-alkali cement and he reported identical conclusions.
Two additional factors have been identified that appear to influence the mortar bar test results. These two additional factors appear to be most commonly found in Class C (high-calcium) fly ashes. First, the periclase (MgO) content of the test specimens increases the expansion of test specimens at high (above 30 percent) fly ash replacements. Secondly, several of the Class C fly ashes contain a poorly crystalline material similar to cristobalite, and this tends to cause poor performance in the mortar bar tests. Obviously, these two factors act in unison with the alkalis released by the fly ash to cause expansion in the mortar bar specimens. These additional two factors tend to complicate the interpretation of the mortar bar test results, especially when the test response (expansion) is small.

All of the Class C fly ashes that were used in this study released large amounts of alkalis (primarily sodium) into the pore solution of the test specimens. This study indicated that the majority of the fly ash alkalis were released during the first two to three months of exposure to the test conditions. The single Class F ash that was used in this study also released alkalis (primarily potassium) into the pore solution but this release was nearly complete after about one month. Hence, the ASTM C 31 1 available alkali test only gives a reliable estimate of the alkalis that can be released from the Clinton (Class F) fly ash, it substantially underestimates the amount of alkalis that can be released from the Class C fly ashes.
No simple relationship was found between fly ash alkali content and mortar bar expansion. In fact, several anomalies were noted that tend to suggest that such a relationship may not be valid for a system as complex as Class C fly asti-portland cement mortars.
Clinton fly ash mitigated the alkali-silica reaction in nearly all of the test specimens that it was used in. In fact, it was the only fly ash that consistently reduced the expansion of test specimens that contained the Pyrex glass aggregate. The alkali content of the cement had only a small influence on the expansion of test specimens that contained Clinton fly ash.
The four Class C fly ashes that were used in this study all performed in a similar fashion.
When the fly ashes were used with the very low alkali cement the alkalis from the fly ashes tended to dominate the expansion of the mortar bar specimens, this tended to produce broad pessimum curves in the test specimens containing the Pyrex glass aggregate. Few significant trends were evidentin specimens containing the other two types of aggregates.
When the fly ashes were used with the moderate alkali cement the cement alkalis appeared to dominate the expansion of the mortar bar specimens containing the Pyrex glass aggregate. However, the specimens containing the Oreapolis aggregate appeared to be sensitive to the use of either the Council Bluffs or the Ottumwa fly ashes.
RECOMMENDATIONS
Based on the experimental findings reported or discussed in this document, the following
recommendations can be made.
1. A chemical testing program should be conducted on the various road salts that are
commonly used in the state. The testing program should be constructed to provide
information on a quality control basis.

2. A more conservative estimate of the alkali content of fly ashes should be adopted to replace the current "available alkali" test described in ASTM C 31 1. The available
alkali test tends to underestimate the amount of fly ash alkalis that can be released
into solution.
3. The concrete test specimens that are currently immersed in sulfate bearing solutions
should be monitored until they reach failure. This would provide a better estimate of
the service life of field concrete mixes containing Type I portland cements and
various sources of fly ash.
ACKNOWLEDGMENTS
We would like to thank all the people who helped to contribute to this project. A special
thanks to Iowa Department of Transportation personnel who have participated in this project and
who helped to make and monitor concrete specimens. Without their help this research project would
not have been possible. The Iowa Highway Research Board participation and support is gratefully
acknowledged.
We also acknowledge and thank the Iowa Fly Ash Affiliate research group for their support
of the project. Affiliate member utilities and company's are:
Midwest Fly Ash and Materials, Inc.
Iowa Public Service Company (Now Midwest Power Systems)
Iowa Power (Now Midwest Power Systems)
Iowa Southern Utilities
Iowa Elechic and Power Company
Ames Municipal Electric System
Interstate Power Company
Iowa-Illinois Gas & Electric Company

REFERENCES
1. Concrete Durabilitv: A Multi-billion Dollar Oouortunity, Report of the Committee on Concrete Durability: Needs and Opportunities, NMAB 437, National Academy Press, Washington,
D.C., 1986.
2. Pitt, J.M., R.A. Carnazzo, J. Vu and M. Seshadri, "Control of Concrete Deterioration Due to
Trace Compounds in Deicers," Final Report IHRB project HR-299, ISU-ERI-Ames-92229,
May 1992.
3. American Society for Testing and Materials, 1992 Annual Book of ASTM Standards, Vol. 4.02, ASTM, Philadelphia, PA, 1992.
4. Dunstan, E.R., "Performance of Lignite and Subituminous Fly Ash in Concrete - A Progress
Report," REC-ERC-76-1, January 1976.
5. Dunstan, E.R., "Ash-in-Concrete Model Development," Final Report, EPRI GS-6129, Project
2422-16, January 1989.
6. Tikalsky, P.J. and R.L. Carraqiullo, "Effect of Fly Ash on the Sulfate Resistance of Concrete
Containing Fly Ash," Research Report 481-5, Univ. Texas at Austin, August 1989.
7. Hartman, C. and E. Mangotich, "A Method for Predicting Sulfate Durability of Concrete," in
ACI SP-100, Vol. 2, 1987, pp. 2135-2151. - 8. Kosmatka, S.H., "Sulfate-Resistant Concrete," in Concrete Technology Today, Vol. 9, No. 3,
October 1988, pp. 3-4.
9. von Fay, K.F. and J.S. Pierce, "Sulfate Resistance of Concretes With Various Fly Ashes,"
ASTM Standardization News, December 1989, pp. 32-37.
10. Cmasquillo, R.L. and P.G. Snow, "Effect of Fly Ash on Alkali Aggregate Reaction in
Concrete," ACI Materials Journal, July-August 1987, pp. 299-305.
11. Carrasquillo, R.L. and J. Farbiarz, "Alkali-Aggregate Reaction in Concrete Containing Fly Ash: Final Report," Research Report 450 - 3F, Univ. of Texas at Austin, October 1989.

12. Kostmatka, S.H. and A.E. Fiorato, "Detecting and Avoiding Alkali-Aggregate Reactivity," in
Concrete Technology Today, Vol. 12, No. 3, November 1991, pp. 1-6.
13. Bergeson, K.L., S. Schlorholtz and K.L. Kilgour, "Durability of Fly Ash Concrete: A Literature Review," Iowa Fly Ash Affiliate Research Program, ERI-89-412, Iowa State University, December 1988.
14. Mielenz, R.C., "Significance of Accelerated Durability Tests of Concrete," Highway Reseatch
Record, No. 268, Washington, D.C., 1969, pp. 17-34.
15. Mindess, S. and J.F. Young, Concrete, Prentice Hall Publishing, New Jersey, 1981
16. Cohen, M.D. and B. Mather, "Sulfate Attack on Concrete - Research Needs," ACI Materials Journal, February 2, 1990.
17. Kalousek, G.L., L.C. Porter and E.M. Harboe, "Past, Present and Potential Developments of
Sulfate-Resisting Concretes," Journal of Testing and Evaluation, Vol. 4, No. 5, 1976,
pp. 347-354.
18. Diamond, S., Alkali A-te Reactions in Concrete: An Annotated Bibliozraohv 1939-1991,
SHRP-CW-92-601, Washington, D.C., 1992.
19. Swamy, R.N., " Alkali-Aggregate Reactions in Concrete: Material and Structural Implications,"
in Advances in Concrete Technola , Editor V.M. Malhotra, CANMET, Ottawa, Canada,
1992, pp. 533-582.
20. American Society for Testing and Materials, ASTM C 1105, in 1992 Annual Book of ASTM Standards, Vol. 4.02, ASTM, Philadelphia, PA, 1992.
21. Powers, T.C. and H.H. Steinour, "An Interpretation of Some Published Researches on the
Alkali-Aggregate Reaction. Part 1- The Chemical Reactions and Mechanism of Expansion,"
ACI, Vol. 26, No. 6,1955, pp. 497-516; "Part 2 - A Hypothesis Concerning Safe and Unsafe
Reactions with Reactive Silica in Concrete," ACI, Vol. 26, No. 8, 1955, pp. 785-812.
22. Glasser, F.P., "Chemistry of the Alkali-Aggregate Reaction," in The Alkali-Silica Reaction in Concrete, Edited by R.N. Swamy, Van Nostrand Reinhold, New York, 1992.

23. Taylor, H.F.W., Cement Chemisw, Academic Press Limited, London, 1990.
24. Dent Glasser, L.S. and N. Kataoka, "The Chemistry of the Alkali-Aggregate Reactions," in
Proceedings of the 5th International Conference on Alkali-Aggregate Reactions, paper 525123,1981.
25. Poole, A.B., "Inaoduction to Alkali-Aggregate Reaction in Concrete," in The Alkali-Silica
Reaction in Concrey, Edited by R.N. Swarny, Van Nostrand Reinhold, New York, 1992.
26. BCruM, M.A. and B. Fournier, "Accelerated Test Methods for Alkali-Aggregate Reactivity," in
Advances in Concrete Technoloer, Editor V.M. Malhotra, CANMET, Canada, 1992.
27. Bergeson, K.L., Schlorholtz, S., and Demirel, T., Development of a Rational Characterization
Method for Iowa Fly Ashes, Final Report for Iowa DOT Project HR-286, November 30, 1988.
28. Lee, C., and Schlorholtz, S., "Available Alkali in Fly Ash," Materials Research Society, Vol
29. American Society for Testing and Materials, 1992 Annual Book of ASTM Standara, Vol. 4.01,
ASTM, Philadelphia, 1992.
30. Schlorholtz, S., and K.L. Bergeson, "Evaluation of the Chemical Durability of Iowa Fly Ash
Concretes," Phase I1 Report, ISU-ERI-Ames 92-408, March, 1992.
31. Johnston, D., "Investigation of the Effects of Chemical Composition on Mortar Bar Expansion,"
Draft Report, South Dakota Department of Transportation, March, 1990.
32. Worthington, J.C., D.G. Bonner, and D.V. Nowell, "Influence of Cement Chemistry on Chloride
Attack of Concrete," Materials Science and Technology, Dec. 1987, pp. 305-313.
33. Moussalli, S., and R. Riley, "Special Report on Alkali-Aggregate Reactivity in Iowa," Office of
Materials, Iowa Department of Transportation, November, 1980.
34. Jones, K., "Fly Ash Affect on Alkali-Aggregate Reactivity," Final Report for MLR-88-7, Iowa
Department of Transportation, June, 1989.
35. Personal Communication, Wendell Dubberke, and Charnpak Narotom, Iowa Department of
Transportation concerning MRL-92-6, November, 1992.