· pdf file · 2013-11-27california’s coastal power plants: alternative...
TRANSCRIPT
California’s Coastal Power Plants: Alternative Cooling System Analysis
H. MANDALAY GENERATING STATION RELIANT ENERGY, INC—OXNARD, CA
Contents 1.0 GENERAL SUMMARY........................................................................................................H–1
1.1 Cost...................................................................................................................H–1 1.2 Environmental ..................................................................................................H–2 1.3 Other Potential Factors....................................................................................H–2
2.0 BACKGROUND ................................................................................................................H–3 2.1 Cooling Water System......................................................................................H–4 2.2 Section 316(b) Permit Compliance ................................................................H–5
3.0 WET COOLING SYSTEM RETROFIT......................................................................................H–5 3.1 Overview ...........................................................................................................H–5 3.2 Design Basis.....................................................................................................H–6 3.3 Conceptual Design........................................................................................ H–10 3.4 Environmental Effects .................................................................................. H–13
4.0 RETROFIT COST ANALYSIS ............................................................................................. H–24 4.1 Cooling Tower Installation ............................................................................ H–24 4.2 Other Direct Costs......................................................................................... H–24 4.3 Indirect and Contingency.............................................................................. H–25 4.4 Shutdown ...................................................................................................... H–26 4.5 Operations and Maintenance ...................................................................... H–26 4.6 Energy Penalty............................................................................................... H–27 4.7 Net Present Cost ........................................................................................... H–31 4.8 Annual Cost ................................................................................................... H–32 4.9 Cost-to-Gross Revenue Comparison ............................................................ H–32
5.0 OTHER TECHNOLOGIES ................................................................................................. H–34 5.1 Modified Ristroph Screens—Fine Mesh....................................................... H–34 5.2 Barrier Nets ................................................................................................... H–34 5.3 Aquatic Filtration Barriers............................................................................. H–34 5.4 Variable Speed Drives .................................................................................. H–34 5.5 Cylindrical Fine Mesh Wedgewire ................................................................ H–35
6.0 REFERENCES............................................................................................................... H–36
MANDALAY GENERATING STATION
H–ii California’s Coastal Power Plants: Alternative Cooling System Analysis
Tables Table H–1. Cumulative Cost Summary ................................................................................................... H–1 Table H–2. Annual Cost Summary........................................................................................................... H–2 Table H–3. Environmental Summary ...................................................................................................... H–2 Table H–4. General Information .............................................................................................................. H–3 Table H–5. Condenser Design Specifications......................................................................................... H–7 Table H–6. Surface Water and Ambient Wet Bulb Temperatures ......................................................... H–8 Table H–7. Wet Cooling Tower Design ..................................................................................................H–11 Table H–8. Cooling Tower Fans and Pumps .........................................................................................H–13 Table H–9. Full Load Drift and Particulate Estimates ..........................................................................H–15 Table H–10. 2005 Emissions of SOx, NOx, PM10 ..................................................................................H–15 Table H–11. Makeup Water Demand ...................................................................................................H–15 Table H–12. Design Thermal Conditions ..............................................................................................H–21 Table H–13. Summary of Estimated Heat Rate Increases ..................................................................H–22 Table H–14. Wet Cooling Tower Design-and-Build Cost Estimate.......................................................H–24 Table H–15. Summary of Other Direct Costs........................................................................................H–25 Table H–16. Summary of Initial Capital Costs ......................................................................................H–26 Table H–17. Annual O&M Costs (Full Load)..........................................................................................H–27 Table H–18. Cooling Tower Fan Parasitic Use ......................................................................................H–28 Table H–19. Cooling Tower Pump Parasitic Use...................................................................................H–29 Table H–20. Unit 1 Energy Penalty—Year 1 ..........................................................................................H–30 Table H–21. Unit 2 Energy Penalty—Year 2 ..........................................................................................H–31 Table H–22. Annual Cost .......................................................................................................................H–32 Table H–23. Estimated Gross Revenue ................................................................................................H–33 Table H–24. Cost-Revenue Comparison ...............................................................................................H–33
Figures Figure H–1. General Vicinity of Mandalay Generating Station .............................................................. H–3 Figure H–2. Site View ............................................................................................................................... H–4 Figure H–3. Cooling Tower Siting Locations..........................................................................................H–10 Figure H–4. Cooling Tower Locations....................................................................................................H–11 Figure H–5. Schematic of Intake Pump Configuration.........................................................................H–16 Figure H–6. Reclaimed Water Sources .................................................................................................H–19 Figure H–7. Condenser Inlet Temperatures..........................................................................................H–21 Figure H–8. Estimated Backpressures (Unit 1) ....................................................................................H–22 Figure H–9. Estimated Heat Rate Correction (Unit 1) ..........................................................................H–22 Figure H–10. Estimated Backpressures (Unit 2) ..................................................................................H–23 Figure H–11. Estimated Heat Rate Correction (Unit 2)........................................................................H–23 Figure H–12. Estimated Heat Rate Change (Unit 1) ............................................................................H–29 Figure H–13. Estimated Heat Rate Change (Unit 2) ............................................................................H–29
Appendices Appendix A. Once-Through and Closed-Cycle Thermal Performance...................................................H–38 Appendix B. Itemized Capital Costs .......................................................................................................H–39 Appendix C. Net Present Cost Calculation.............................................................................................H–42
MANDALAY GENERATING STATION
California’s Coastal Power Plants: H–1 Alternative Cooling System Analysis
1.0 GENERAL SUMMARY Retrofitting the existing once-through cooling system at Mandalay Generating Station (MGS) with closed-cycle wet cooling towers is technically and logistically feasible based on this study’s design criteria, and will reduce cooling water withdrawals from Channel Islands Harbor by approximately 95 percent. Impingement and entrainment impacts would be reduced by a similar proportion.
The preferred option selected for MGS includes 2 conventional wet cooling towers (without plume abatement), with individual cells arranged in an inline configuration to accommodate limited space at the site. Space limitations do not appear substantial enough to preclude plume-abated towers in the design if they were required to mitigate visual impacts. Initial capital costs for the towers would also increase by a factor of 2 or 3 and require a larger siting area.
Construction-related shutdowns are estimated to take approximately 4 weeks per unit (concurrent), although MGS is not expected to incur any financial loss as a result based on 2006 capacity utilization rates for all units.
The cooling tower configuration designed under the preferred option complies with all identified local use restrictions and includes necessary mitigation measures, where applicable.
1.1 COST
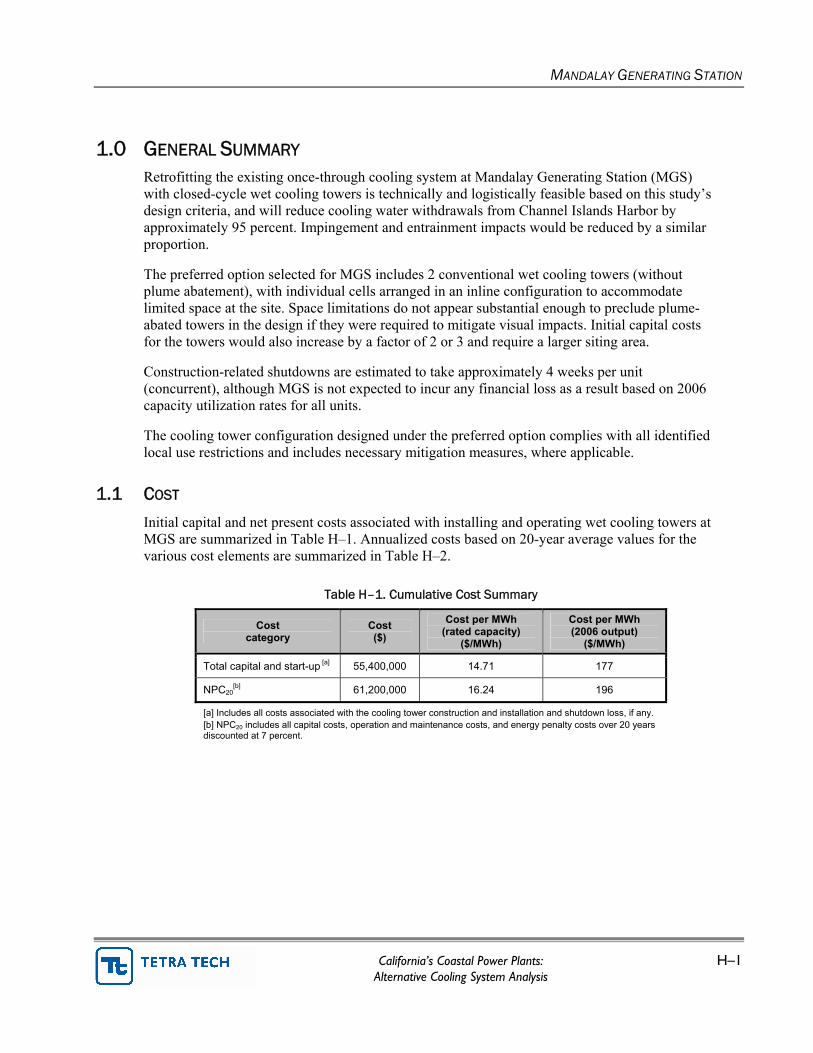
Initial capital and net present costs associated with installing and operating wet cooling towers at MGS are summarized in Table H–1. Annualized costs based on 20-year average values for the various cost elements are summarized in Table H–2.
Table H–1. Cumulative Cost Summary
Cost category
Cost ($)
Cost per MWh (rated capacity)
($/MWh)
Cost per MWh (2006 output)
($/MWh)
Total capital and start-up [a] 55,400,000 14.71 177
NPC20[b] 61,200,000 16.24 196
[a] Includes all costs associated with the cooling tower construction and installation and shutdown loss, if any. [b] NPC20 includes all capital costs, operation and maintenance costs, and energy penalty costs over 20 years discounted at 7 percent.

MANDALAY GENERATING STATION
H–2 California’s Coastal Power Plants: Alternative Cooling System Analysis
Table H–2. Annual Cost Summary
Cost category
Cost ($)
Cost per MWh (capacity) ($/MWh)
Cost per MWh (2006 output)
($/MWh)
Capital and start-up 5,200,000 1.38 16.65
Operations and maintenance 300,000 0.08 0.96
Energy penalty 300,000 0.08 0.96
Total MGS annual cost 5,800,000 1.54 18.57
1.2 ENVIRONMENTAL
Environmental changes associated with a cooling tower retrofit for MGS are summarized in Table H–3 and discussed further in Section 3.4.
Table H–3. Environmental Summary
Unit 1 Unit 2
Design intake volume (gpm) 83,700 83,700
Cooling tower makeup water (gpm) 4,600 4,600 Water use
Reduction from capacity (%) 95 95
Summer heat rate increase (%) 0.43 0.43
Summer energy penalty (%) 1.34 1.34
Annual heat rate increase (%) 0.73 0.73
Energy efficiency [a]
Annual energy penalty (%) 1.64 1.64
PM10 emissions (tons/yr) (maximum capacity) 48 48 Direct air
emissions [b] PM10 emissions (tons/yr) (2006 capacity utilization) 3.79 4.19
[a] Reflects the comparative increase between once-through and wet cooling systems, but does not account for any operational changes to address the change in efficiency, such as increased fuel consumption (see Section 4.6). [b] Reflects emissions from the cooling tower only; does not include any increase in stack emissions.
1.3 OTHER POTENTIAL FACTORS
Considerations outside this study’s scope may limit the practicality or overall feasibility of a wet cooling tower retrofit at Mandalay.
MGS may face wastewater discharge permit conflicts upon converting to wet cooling towers. Recent permit compliance history indicates effluent exceedances have occurred for some metals, principally copper, as a result of elevated levels in the intake water. If cooling tower makeup water is obtained from the current source (Channel Islands Harbor), compliance may become more difficult as a result of a wet cooling tower’s concentrating effects on certain pollutants, particularly metals. These conflicts may be mitigated or eliminated through the use of reclaimed water as the makeup source.

MANDALAY GENERATING STATION
California’s Coastal Power Plants: H–3 Alternative Cooling System Analysis
2.0 BACKGROUND MGS is a natural gas–fired steam electric generating facility located in the city of Oxnard, Ventura County, owned and operated by Reliant Energy, Inc. MGS currently operates two conventional steam turbine units (Units 1 and 2) and one gas combustion turbine unit (Unit 3) with a combined generating capacity of 560 MW. Unit 3 does not require cooling water and is used infrequently. For the purposes of this study, only Units 1 and 2 are considered, with a combined generating capacity of 230 MW. The facility occupies approximately 128 acres of a 205-acre industrial site south of McGrath State Beach on the Pacific Ocean, approximately 3.5 miles northwest of Channel Islands Harbor. (See Table H–4 and Figure H–1.)
Table H–4. General Information
Unit In-service year
Rated capacity
(MW)
2006 capacity utilization [a]
Condenser cooling water flow
(gpm)
Unit 1 1959 215 7.80% 83,700
Unit 2 1959 215 8.60% 83,700
MGS total 430 8.2% 167,400
[a] Quarterly Fuel and Energy Report—2006 (CEC 2006).
Figure H–1. General Vicinity of Mandalay Generating Station

MANDALAY GENERATING STATION
H–4 California’s Coastal Power Plants: Alternative Cooling System Analysis
2.1 COOLING WATER SYSTEM
MGS operates one cooling water intake structure (CWIS) to provide condenser cooling water to Units 1 and 2 (Figure H–2). Once-through cooling water is combined with low volume wastes generated by MGS and discharged through a single shoreline outfall to the Pacific Ocean. Surface water withdrawals and discharges are regulated by National Pollutant Discharge Eliminations System (NPDES) Permit CA0001180 as implemented by Los Angeles Regional Water Quality Control Board (LARWQCB) Order 01-057.1
Figure H–2. Site View
Cooling water is obtained from Channel Islands Harbor via the Edison Canal, a 2.5 mile man-made canal specifically constructed to provide cooling water to the station.
The Edison Canal was originally connected to Port Hueneme, located approximately 4.5 miles southeast of MGS, but was disrupted by the construction of the harbor in 1965, which largely consisted of expanding the existing Edison Canal for a marina and a new outlet to the Pacific Ocean. As a result, it is difficult to determine what constitutes the boundary between the Edison Canal and Channel Islands Harbor. Based on the Phase II rule, it is not entirely clear whether the source water for MGS is the harbor or the Pacific Ocean. For the purposes of this study, the harbor is referenced as the source water and the CWIS defined as the portion of Edison Canal extending northward from the West Channel Islands Boulevard overpass up to and including the intake screens at the facility.
1 LARWQCB Order #01-057 expired on May 10, 2006 but has been administratively extended pending adoption of a renewed order.

MANDALAY GENERATING STATION
California’s Coastal Power Plants: H–5 Alternative Cooling System Analysis
In addition to the Edison Canal, the CWIS comprises two angled intake bays, each approximately 12 feet wide. Each bay is fitted with a pair of vertical slide screens 11.5 feet wide by 21 feet high with ½-inch mesh panels and arranged parallel to each other (one in front of the other). Screens are alternately removed from the water and cleaned with a high pressure spray to remove any debris or fish that have become impinged on the screen face. Captured debris is collected in a dumpster for disposal in a landfill. MGS reports the approach velocity to the screens as 1.4 feet per second (fps), which translates to an approximate through-screen velocity of 2.8 fps.
Downstream of each screen is a circulating water pump rated at 44,000 gallons per minute (gpm), for a total facility capacity of 176,000 gpm, or 254 million gallons per day (mgd) (Reliant 2005). The majority of the cooling water is directed to the condensers, with a small portion used for bearing cooling water.
At maximum capacity, MGS maintains a total pumping capacity rated at 254 mgd, with a combined condenser flow rating of 241 mgd. On an annual basis, MGS withdraws substantially less than its design capacity due to its low generating capacity utilization (8.3 percent for 2006). When in operation and generating the maximum load, MGS can be expected to withdraw water from the Channel Islands Harbor at a rate approaching its maximum capacity.
2.2 SECTION 316(B) PERMIT COMPLIANCE
The CWIS currently in operation at MGS does not use technologies generally considered to be effective at reducing impingement mortality and/or entrainment. LARWQCB Order 01-057, adopted in 2001, states that “the design, construction and operation of the intake structures [at MGS] represents Best Available Technology (BAT) [sic] as required by Section 316(b) of the Clean Water Act” (LARWQCB, 2001. Finding 15). The order does not contain any numeric or narrative limitations regarding impingement or entrainment resulting from CWIS operation, but does require semi-annual monitoring of impingement at each intake structure (coinciding with scheduled heat treatments). Based on the record available for review, MGS has been compliant with this permit requirement.
The LARWQCB has notified MGS of its intent to revisit requirements under CWA Section 316(b), including a determination of BTA for minimization of adverse environmental impact, during the current permit re-issuance process. A final decision regarding any Section 316(b)-related requirements has not been made as of the publication of this study.
3.0 WET COOLING SYSTEM RETROFIT
3.1 OVERVIEW
This study evaluates saltwater cooling towers as a retrofit option at MGS, with the current source water (Channel Islands Harbor) continuing to provide makeup water to the facility. Converting the existing once-through cooling system to wet cooling towers will reduce the facility’s current intake capacity by approximately 95 percent; rates of impingement and entrainment will decline by a similar proportion. Use of reclaimed water was considered for MGS but not analyzed in detail because the available volume cannot serve as a replacement for once-through cooling

MANDALAY GENERATING STATION
H–6 California’s Coastal Power Plants: Alternative Cooling System Analysis
water. The proximity of available sources, however, may make reclaimed water an attractive alternative as makeup water for a wet cooling tower system when considering additional benefits its use may provide, such as avoidance of conflicts with effluent limitations or air emission standards.
The wet cooling towers’ configuration—their size, arrangement, and location—was based on best professional judgment (BPJ) using the criteria outlined in Chapter 5 and designed to meet the performance benchmarks in the most cost-effective manner. Information not available to this study that offers a more complete facility characterization may lead to different conclusions regarding the cooling towers’ physical configuration.
This study developed a conceptual design of wet cooling towers sufficient to meet each active generating unit’s cooling demand at its rated output during peak climate conditions. Cost estimates are based on vendor quotes developed using the available information and the various design constraints identified at MGS.
The overall practicality of retrofitting both units at MGS will require an evaluation of factors outside the scope of this study, such as each unit’s age and efficiency and its role in the overall reliability of electricity production and transmission in California, particularly the Los Angeles Region.
3.2 DESIGN BASIS
3.2.1 CONDENSER SPECIFICATIONS
For this study, the wet cooling tower conceptual design selected for MGS is based on the assumption that the condenser flow rate and thermal load to each will remain unchanged from the current system. Although no provision is included to re-optimize the condenser performance for service with a cooling tower, some modifications to the condenser (tube sheet and water box reinforcement) may be necessary to handle the increased water pressures that will result from the increased total pump head required to raise water to the cooling tower riser elevation.2 The practicality and difficulty of these modifications are dependent each unit’s age and configuration but are assumed to be feasible at MGS. Condenser water boxes for both units are located at grade level and appear to be readily accessible. Additional costs for condenser modifications are included in the discussion of capital expenditures (Section 4.0).
Information provided by MGS was largely used as the basis for the cooling tower design. In some cases, the data were incomplete or conflicted with values obtained from other sources. Where possible, questionable values were verified or corrected using other known information about the condenser.
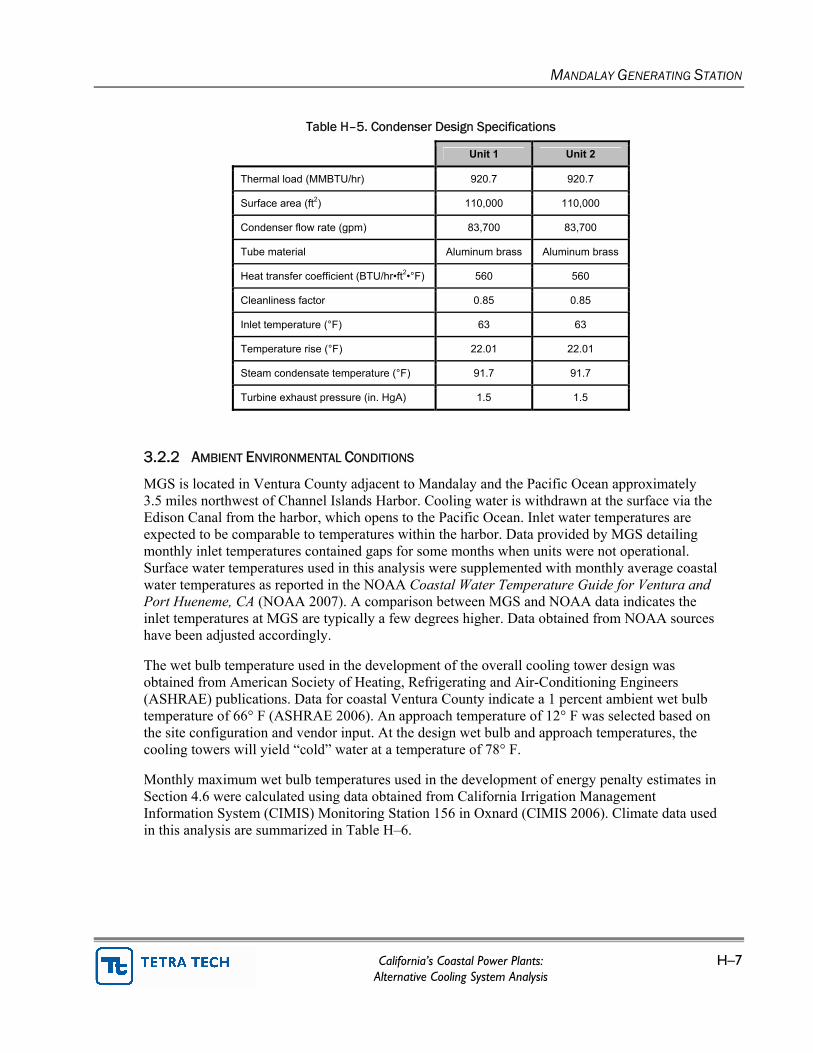
Parameters used in the development of the cooling tower design are summarized in Table H–5.
2 In this context, re-optimization refers to a comprehensive condenser overhaul that reduces thermal efficiency losses associated with a wet cooling tower’s higher circulating water temperatures. Modifications discussed in this study are generally limited to reinforcement measures that enable the condenser to withstand increased water pressures.
MANDALAY GENERATING STATION
California’s Coastal Power Plants: H–7 Alternative Cooling System Analysis
Table H–5. Condenser Design Specifications
Unit 1 Unit 2
Thermal load (MMBTU/hr) 920.7 920.7
Surface area (ft2) 110,000 110,000
Condenser flow rate (gpm) 83,700 83,700
Tube material Aluminum brass Aluminum brass
Heat transfer coefficient (BTU/hr•ft2•°F) 560 560
Cleanliness factor 0.85 0.85
Inlet temperature (°F) 63 63
Temperature rise (°F) 22.01 22.01
Steam condensate temperature (°F) 91.7 91.7
Turbine exhaust pressure (in. HgA) 1.5 1.5
3.2.2 AMBIENT ENVIRONMENTAL CONDITIONS
MGS is located in Ventura County adjacent to Mandalay and the Pacific Ocean approximately 3.5 miles northwest of Channel Islands Harbor. Cooling water is withdrawn at the surface via the Edison Canal from the harbor, which opens to the Pacific Ocean. Inlet water temperatures are expected to be comparable to temperatures within the harbor. Data provided by MGS detailing monthly inlet temperatures contained gaps for some months when units were not operational. Surface water temperatures used in this analysis were supplemented with monthly average coastal water temperatures as reported in the NOAA Coastal Water Temperature Guide for Ventura and Port Hueneme, CA (NOAA 2007). A comparison between MGS and NOAA data indicates the inlet temperatures at MGS are typically a few degrees higher. Data obtained from NOAA sources have been adjusted accordingly.
The wet bulb temperature used in the development of the overall cooling tower design was obtained from American Society of Heating, Refrigerating and Air-Conditioning Engineers (ASHRAE) publications. Data for coastal Ventura County indicate a 1 percent ambient wet bulb temperature of 66° F (ASHRAE 2006). An approach temperature of 12° F was selected based on the site configuration and vendor input. At the design wet bulb and approach temperatures, the cooling towers will yield “cold” water at a temperature of 78° F.
Monthly maximum wet bulb temperatures used in the development of energy penalty estimates in Section 4.6 were calculated using data obtained from California Irrigation Management Information System (CIMIS) Monitoring Station 156 in Oxnard (CIMIS 2006). Climate data used in this analysis are summarized in Table H–6.

MANDALAY GENERATING STATION
H–8 California’s Coastal Power Plants: Alternative Cooling System Analysis
Table H–6. Surface Water and Ambient Wet Bulb Temperatures
Surface (°F)
Ambient wet bulb (°F)
January 57.0 57.9
February 59.3 58.3
March 62.6 59.7
April 65.1 60.7
May 68.4 62.5
June 71.2 65.3
July 74.4 66.1
August 74.0 66.3
September 71.4 64.7
October 66.2 62.4
November 62.5 61.3
December 56.9 58.9
3.2.3 LOCAL USE RESTRICTIONS
3.2.3.1 NOISE Industrial development in the vicinity of MGS is covered by the City of Oxnard General Plan and the City of Oxnard Land Use Plan (LUP). General Plan Section 10 (Noise Element) outlines the broad policy related to noise impacts within the city’s different development zones. The plan outlines narrative criteria to be used as a guide for future development, but does not identify numeric noise limits for new construction (Oxnard 2006).
Land use within the general vicinity of MGS is primarily agricultural, although recent residential developments have encroached upon the area. Noise associated with the cooling towers is not expected to have any discernible impact upon these areas. The proximity to state beaches, however, may conflict with recreational standards set forth in the Ventura County Local Coastal Plan, but again, no numeric limits are specified.
In lieu of specific noise criteria, this study used an ambient noise limit of 65 dBA at a distance of 700 feet in selecting the design elements of the wet tower installation. Accordingly, the final design selected for MGS does not require any measures that specifically address noise, such as low-noise fans or barrier walls.
3.2.3.2 BUILDING HEIGHT MGS is located within the coastal energy facilities subzone (EC) of the City of Oxnard LUP, which encourages the expansion of energy-related activities within the existing site consistent with other plan provisions. The LUP does not establish specific criteria for building height and instead relies on conditional use permitting that evaluates each project independently. Given the
MANDALAY GENERATING STATION
California’s Coastal Power Plants: H–9 Alternative Cooling System Analysis
height of existing structures at MGS, this study selected a height restriction of 50 feet above grade level. The height of the wet cooling towers designed for MGS, from grade level to the top of the fan deck, is 44 feet.
3.2.3.3 PLUME ABATEMENT Local zoning ordinances do not contain any specific criteria for addressing any impact associated with a wet cooling tower plume. Using the selection criteria for this study, plume abatement measures were not considered for MGS; all towers are a conventional design. The plume from wet cooling towers at MGS is not expected to adversely impact nearby infrastructure.
Community standards for assessing the visual impact associated with a cooling tower plume cannot be determined within the scope of this study. Agricultural uses predominate in the general vicinity of MGS, but residential development continues to encroach upon the facility. The proximity of MGS to coastal recreational areas (McGrath State Beach) and the potential visual impact on those resources may require plume abatement measures. CEC siting guidelines and Coastal Act provisions evaluate the total size and persistence of a visual plume with respect to aesthetic standards for coastal resources; significant visual changes resulting from a persistent plume would likely be subject to additional controls.
Plume abatement towers for MGS, if necessary, would be a feasible alternative given the relatively small size of the generating units and available land on which to locate them. The principal difference would be an escalation of the total cost (approximately 2 to 3 times the capital cost of conventional towers). The additional height required for plume-abated towers (approximately 15-20 feet) may conflict with height restrictions under local zoning ordinances, but this cannot be precisely determined.
3.2.3.4 DRIFT AND PARTICULATE EMISSIONS Drift elimination measures that are considered best available control technology (BACT) are required for all cooling towers evaluated in this study, regardless of their location. State-of-the-art drift eliminators are included for each cooling tower cell at MGS, with an accepted efficiency of 0.0005 percent. Because cooling tower PM10 emissions are a function of the drift rate, drift eliminators are also considered BACT for PM10 emissions from wet cooling towers. This efficiency can be verified by a proper in situ test, which accounts for site-specific climate, water, and operating conditions. Testing based on the Cooling Tower Institute’s Isokinetic Drift Test Code is required at initial start-up on only one representative cell of each tower for an approximate cost of $60,000 per test, or approximately $120,000 for both cooling towers at MGS (CTI 1994). This cost is not itemized in the final analysis and is instead included as part of the indirect cost estimate (Section 4.3).
3.2.3.5 FACILITY CONFIGURATION AND AREA CONSTRAINTS The existing site’s configuration and relative locations of the two generating units does not present any obvious challenges to identifying a location for wet cooling towers at the facility. As shown in Figure H–3, sufficient space exists in the facility’s northern section. This area (Area 1) is currently unoccupied and lies approximately 700 feet south of McGrath Lake. The total size of this parcel, approximately 150,000 square feet, is sufficient to accommodate the two required cooling towers.

MANDALAY GENERATING STATION
H–10 California’s Coastal Power Plants: Alternative Cooling System Analysis
Figure H–3. Cooling Tower Siting Locations
3.3 CONCEPTUAL DESIGN
Based on the design constraints discussed above, two wet cooling towers were selected to replace the current once-through cooling system that serves Units 1 and 2 at MGS. Each unit will be served by an independently-functioning tower with separate pump houses and pumps. Both towers at MGS consist of conventional cells arranged in a multi-cell, inline configuration.
3.3.1 SIZE
Each tower is constructed over a concrete collection basin 4 feet deep. The basin is larger than the tower structure’s footprint, extending an additional 2 feet in each direction. The concrete used for construction is suitable for saltwater applications. The principal tower material is fiberglass reinforced plastic (FRP), with stainless steel fittings. These materials are more resistant to the higher corrosive effects of saltwater.
The size of each tower is primarily based on the thermal load rejected to the tower by the surface condenser and a 12° F approach to the ambient wet bulb temperature. The flow rate through each condenser remains unchanged.
General characteristics of the wet cooling towers selected for MGS are summarized in Table H–7.
N

MANDALAY GENERATING STATION
California’s Coastal Power Plants: H–11 Alternative Cooling System Analysis
Table H–7. Wet Cooling Tower Design
Tower 1
(Unit 1) Tower 2 (Unit 2)
Thermal load (MMBTU/hr) 920.7 920.7
Circulating flow (gpm) 83,700 83,700
Number of cells 7 7
Tower type Mechanical draft Mechanical draft
Flow orientation Counterflow Counterflow
Fill type Modular splash Modular splash
Arrangement Inline Inline
Primary tower material FRP FRP
Tower dimensions (l x w x h) (ft) 336 x 54 x 44 336 x 54 x 44
Tower footprint with basin (l x w) (ft) 348 x 66 348 x 66
3.3.2 LOCATION
The initial site selection for each tower was based on the desire to locate each tower as close as possible to its respective generating unit to minimize the supply and return pipe distances and any increases in pump head and brake horsepower. Tower 1, serving Unit 1, is located at an approximate distance of 550 feet. Tower 2, serving Unit 2, is located at approximate distance of 800 feet. (Figure H–4).
Figure H–4. Cooling Tower Locations
N

MANDALAY GENERATING STATION
H–12 California’s Coastal Power Plants: Alternative Cooling System Analysis
3.3.3 PIPING
The main supply and return pipelines to and from both towers will be located underground and made of prestressed concrete cylinder pipe (PCCP) suitable for saltwater applications. These pipes are sized at 72 inches in diameter. Pipes connecting the condensers to the supply and return lines are made of FRP and placed above ground on pipe racks. Above-ground placement avoids the potential disruption that may be caused by excavation in and around the power block. The condensers at MGS are located at grade level, enabling a relatively straightforward connection.
All riser piping (extending from the foot of the tower to the level of water distribution) is constructed of FRP.
Potential interference with underground obstacles and infrastructure is a concern, particularly at existing sites that are several decades old and have been substantially modified or rebuilt in the interim. Avoidance of these obstacles is considered to the degree practical in this study. Associated costs are included in the contingency estimate and are generally higher than similar estimates for new facilities (Section 4.3).
Appendix B details the total quantity of each pipe size and type for MGS.
3.3.4 FANS AND PUMPS
Each tower cell uses an independent single-speed fan. The fan size and motor power are the same for each cell in each tower.
This analysis includes new pumps to circulate water between the condensers and cooling towers. Pumps are sized according to the flow rate for each tower, the relative distance between the towers and condensers, and the total head required to deliver water to the top of each cooling tower riser. A separate, multilevel pump house is constructed for each tower and sized to accommodate the motor control centers (MCCs) and appropriate electrical switchgear. The electrical installation includes all necessary transformers, cabling, cable trays, lighting, and lightning protection. A 50-ton overhead crane is also included to allow for pump servicing.
Fan and pump characteristics associated with wet cooling towers at MGS are summarized in Table H–8. The net electrical demand of fans and new pumps is discussed further as part of the energy penalty analysis in Section Table H–8.
MANDALAY GENERATING STATION
California’s Coastal Power Plants: H–13 Alternative Cooling System Analysis
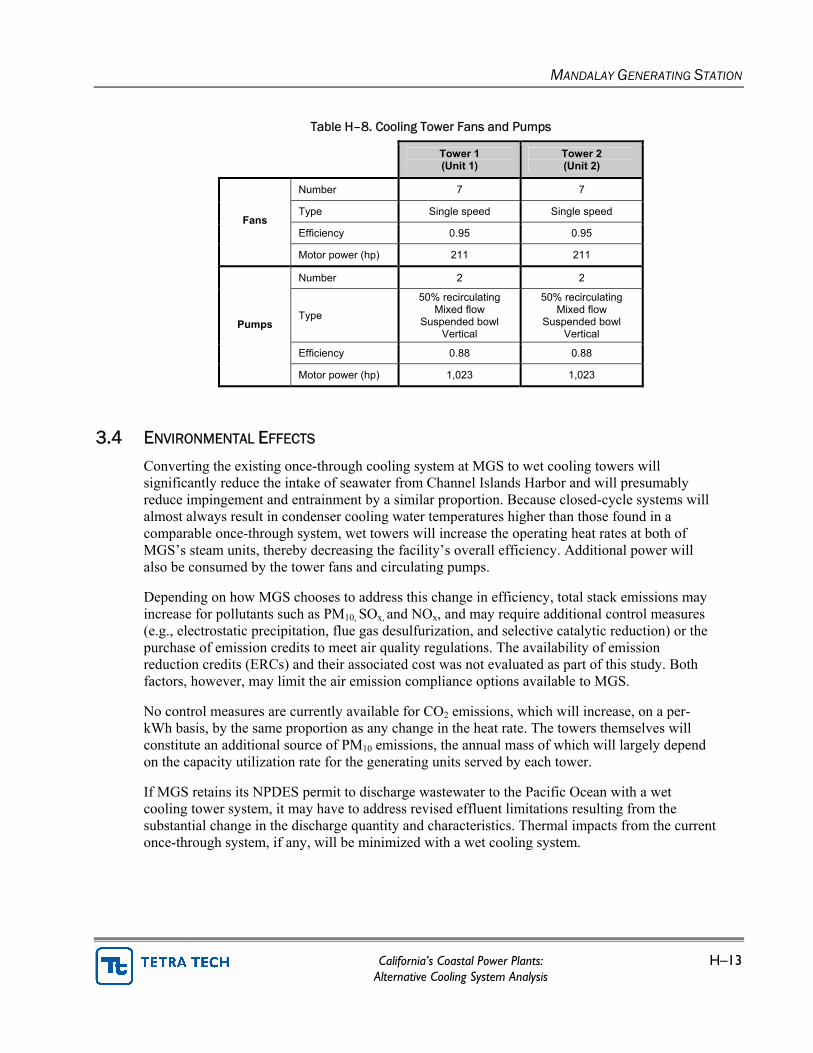
Table H–8. Cooling Tower Fans and Pumps
Tower 1 (Unit 1)
Tower 2 (Unit 2)
Number 7 7
Type Single speed Single speed
Efficiency 0.95 0.95 Fans
Motor power (hp) 211 211
Number 2 2
Type
50% recirculating Mixed flow
Suspended bowl Vertical
50% recirculating Mixed flow
Suspended bowl Vertical
Efficiency 0.88 0.88
Pumps
Motor power (hp) 1,023 1,023
3.4 ENVIRONMENTAL EFFECTS
Converting the existing once-through cooling system at MGS to wet cooling towers will significantly reduce the intake of seawater from Channel Islands Harbor and will presumably reduce impingement and entrainment by a similar proportion. Because closed-cycle systems will almost always result in condenser cooling water temperatures higher than those found in a comparable once-through system, wet towers will increase the operating heat rates at both of MGS’s steam units, thereby decreasing the facility’s overall efficiency. Additional power will also be consumed by the tower fans and circulating pumps.
Depending on how MGS chooses to address this change in efficiency, total stack emissions may increase for pollutants such as PM10, SOx, and NOx, and may require additional control measures (e.g., electrostatic precipitation, flue gas desulfurization, and selective catalytic reduction) or the purchase of emission credits to meet air quality regulations. The availability of emission reduction credits (ERCs) and their associated cost was not evaluated as part of this study. Both factors, however, may limit the air emission compliance options available to MGS.
No control measures are currently available for CO2 emissions, which will increase, on a per-kWh basis, by the same proportion as any change in the heat rate. The towers themselves will constitute an additional source of PM10 emissions, the annual mass of which will largely depend on the capacity utilization rate for the generating units served by each tower.
If MGS retains its NPDES permit to discharge wastewater to the Pacific Ocean with a wet cooling tower system, it may have to address revised effluent limitations resulting from the substantial change in the discharge quantity and characteristics. Thermal impacts from the current once-through system, if any, will be minimized with a wet cooling system.

MANDALAY GENERATING STATION
H–14 California’s Coastal Power Plants: Alternative Cooling System Analysis
3.4.1 AIR EMISSIONS
MGS is located in the South Central Coast air basin. Air emissions are permitted by the Ventura County Air Pollution Control District (VCAPCD) (Facility ID 13).
Drift volumes are expected to be within the range of 0.5 gallons for every 100,000 gallons of circulating water in the towers. At MGS, this corresponds to a rate of approximately 0.84 gpm based on the maximum combined flow both two towers. Agricultural operations lie within 0.25 mile to the north and 0.75 mile to the east. Given the direction of prevailing winds (from the west) some drift may carry to these areas, but the impact is not likely to be significant.
Total PM10 emissions from the MGS cooling towers are a function of the number of hours in operation, the overall water quality in the tower, and the evaporation rate of drift droplets prior to deposition on the ground. Makeup water at MGS will be obtained from the same source currently used for once-through cooling water (Channel Islands Harbor). This water is drawn through the harbor from the Pacific Ocean and is the same as marine water with respect to the total dissolved solids (TDS) concentration. At 1.5 cycles of concentration and assuming an initial TDS value of 35 parts per thousand (ppt), the water within the cooling towers will reach a maximum TDS level of roughly 53 ppt. Any drift droplets exiting the tower will have the same TDS concentration.
The cumulative mass emission of PM10 from MGS will increase as a result of the direct emissions from the cooling towers themselves. Stack emissions of PM10, as well as SOx, NOx, and other pollutants, will increase due to the drop in fuel efficiency, although the cumulative increase will depend on actual operations and emission control technologies currently in use. Maximum drift and PM10 emissions from the cooling towers are summarized in Table H–9.3
Data summarizing the total facility emissions for these pollutants in 2005 are presented in Table H–10 (CARB 2005). In 2005, MGS operated at an annual capacity utilization rate of 7.1 percent. Using this rate, the additional PM10 emissions from the cooling towers would increase the facility total by approximately 7 tons/year, or 150 percent. 4
3 This is a conservative estimate that assumes all dissolved solids present in drift droplets will be converted to PM10. Studies suggest this may overestimate actual emission profiles for saltwater cooling towers (Chapter 4). 4 2006 emission data are not currently available from the Air Resources Board website. For consistency, the comparative increase in PM10 emissions estimated here is based on the 2005 MGS capacity utilization rate instead of the 2006 rate presented in Table H-4. All other calculations in this chapter use the 2006 value.

MANDALAY GENERATING STATION
California’s Coastal Power Plants: H–15 Alternative Cooling System Analysis
Table H–9. Full Load Drift and Particulate Estimates Table H–10. 2005 Emissions of SOx, NOx, PM10
PM10 (lbs/hr)
PM10 (tons/year)
Drift (gpm)
Drift (lbs/hr)
Tower 1 11 48 0.42 209
Tower 2 11 48 0.42 209
Total MGS PM10 and drift emissions 22 96 0.84 418
Pollutant Tons/year
NOx 9.1
SOx 1.0
PM10 4.6
3.4.2 MAKEUP WATER
The volume of makeup water required by both cooling towers at MGS is the sum of evaporative loss and the blowdown volume required to maintain the circulating water in each tower at the design TDS concentration. Drift expelled from the towers represents an insignificant volume by comparison and is accounted for by rounding up evaporative loss estimates. Makeup water volumes are based on design conditions, and may fluctuate seasonally depending on climate conditions and facility operations. Wet cooling towers will reduce once-through cooling water withdrawals from Channel Islands Harbor by approximately 95 over the current design intake capacity.
Table H–11. Makeup Water Demand
Tower circulating flow
(gpm) Evaporation
(gpm) Blowdown
(gpm) Total
makeup water (gpm)
Tower 1 83,700 1,600 3,000 4,600
Tower 2 83,700 1,600 3,000 4,600
Total MGS makeup water demand 167,400 3,200 6,000 9,200
One circulating water pump, rated at 44,000 gpm, which is currently used to provide once-through cooling water to the facility, will be retained in a wet cooling system to provide makeup water to each cooling tower. The retained pump’s capacity exceeds the makeup demand by approximately 34,000 gpm. Any excess capacity will be routed through a bypass conduit and returned to the wet well at a point located behind the intake screens. Recirculating the excess capacity in this manner reduces additional cost that would be incurred if new pumps were required while maintaining the desired flow reduction. The intake of new water, measured at the intake screens, will be equal to the cooling towers’ makeup water demand. Figure H–5 presents a schematic of this configuration.
The existing once-through cooling system at MGS does not treat water withdrawn from Channels Islands Harbor, with the exception of screening for debris and larger organisms and periodic chlorination to control biofouling in the condenser tubes. Heat treatments are also periodically

MANDALAY GENERATING STATION
H–16 California’s Coastal Power Plants: Alternative Cooling System Analysis
used to control mussel growth on pipes and condenser tubes by raising the circulating water temperature to 125º F. Conversion to a wet cooling tower system will not interfere with chlorination or heat treatment operations.
Figure H–5. Schematic of Intake Pump Configuration
Makeup water will continue to be withdrawn from the Channels Islands Harbor.
The wet cooling tower system proposed for MGS includes water treatment for standard operational measures, i.e., corrosion inhibitors, biocides, and anti-scaling agents. An allowance for these additional chemical treatments is included in annual O&M costs. It is assumed that the current once-through cooling water quality will be acceptable for use in a seawater cooling tower (with continued screening and chlorination) and will not require any pretreatment to enable its use.
3.4.3 NPDES PERMIT COMPLIANCE
At maximum operation, wet cooling towers at MGS will result in an effluent discharge of 8.6 mgd of blowdown in addition to other in-plant waste streams—such as boiler blowdown, regeneration wastes, and cleaning wastes. These low volume wastes may add an additional 0.25 mgd to the total discharge flow from the facility. Unless an alternative discharge is considered, MGS will be required to modify its existing individual wastewater discharge (NPDES) permit.
Current effluent limitations for conventional and priority pollutants, as well as thermal discharge limitations, are contained in NPDES Permit CA0001180 as implemented by LAWRQCB Order 01-057. All wastewaters are discharged to the Pacific Ocean via a rock-lined canal at the
Intake Screen To Cooling
Tower
Inflow
Excess Flow
Circulating Water Pump

MANDALAY GENERATING STATION
California’s Coastal Power Plants: H–17 Alternative Cooling System Analysis
shoreline. The existing Order contains effluent limitations based on the 1997 Ocean Plan and the 1972 Thermal Plan.
MGS will be required to meet technology-based effluent limitations for cooling tower blowdown established under the Effluent Limitation Guidelines (ELGs) for Steam Electric Facilities (40 CFR 423.13(d)(1)). These ELGs set numeric limitations for chromium and zinc (0.2 mg/L and 1.0 mg/L, respectively) while establishing narrative criteria for priority pollutants (no detectable quantity). Because ELGs are technology-based limitations, mixing zones or dilution factors are not applicable when determining compliance; limits must be met at the point of discharge from the cooling tower prior to commingling with any other waste stream. ELGs for cooling tower blowdown target priority pollutants that are contributed by maintenance chemicals and do not apply when limits may be exceeded as a result of background concentrations or other sources. Further discussion can be found in Chapter 4, Section 3.6.
Conversion to wet cooling towers will alter the volume and composition of a facility’s wastewater discharge because wet towers concentrate certain pollutants in the effluent waste stream. The cooling towers designed for MGS operate at 1.5 cycles of concentration, i.e., the blowdown discharge will contain a dissolved solids concentration 50 percent higher than the makeup water.
Changes to discharge composition may affect compliance with water quality objectives included in the Ocean Plan. If compliance with these objectives becomes problematic, alternative treatment or discharge methods may be necessary. Compliance may be achieved by altering the discharge configuration in such a way as to increase dilution (e.g., diffuser ports), or by seeking a mixing zone and dilution credits as permissible under the Ocean Plan. Alternately, some low volume waste streams (e.g., boiler blowdown, laboratory drains) may be diverted, with necessary permits, for treatment at a POTW.
MGS has had an ongoing issue due to elevated levels of copper present in the intake water withdrawn from the Edison Canal. Reliant Energy, Inc has argued that high levels of copper within Channel Islands Harbor and the Edison Canal are a result of other activities in the area and that MGS does not contribute copper, at any significant level, to the final discharge. The SWRCB agreed with the latter point, but rejected the appeal for permit relief, citing the Ocean Plan’s definition of wastes as the “total discharge, of whatever origin” from the facility (SWRCB 2005). The SWRCB did note that MGS could modify its existing discharge structure to increase the level of dilution and thereby increase the monthly effluent limitations.
In addition to copper, data submitted by MGS in support of its NPDES renewal application demonstrates a reasonable potential to exceed effluent limitations for cadmium, chromium, and zinc (Reliant 2004). These assessments reflect the existing once-through cooling system and are primarily driven by the elevated concentrations of these pollutants detected in the intake water at MGS.
If more pollutant-specific treatment methods, such as filtration or precipitation technologies, become necessary to meet WQBELs, the initial capital cost may range from $2 to $5.50 per 1,000 gallons of treatment capacity, with annual costs of approximately $0.5 per gallon of capacity, depending on the method of treatment (FRTR 2002). Hazardous material disposal fees and permits would further increase costs.

MANDALAY GENERATING STATION
H–18 California’s Coastal Power Plants: Alternative Cooling System Analysis
This evaluation did not include alternative discharge or effluent treatment measures in the conceptual design because the variables used to determine final WQBELs, which would be used to determine the type and scope of the desired compliance method, cannot be quantified here. Likewise, the final cost evaluation (Section 4.0) does not include any allowance for these possibilities.
Use of reclaimed water as the cooling tower makeup source has the potential to reduce or eliminate conflicts with effluent limitations.
Thermal discharge standards are based on narrative criteria established for coastal discharges under the Thermal Plan, which requires that existing discharges of elevated-temperature wastes comply with effluent limitations necessary to assure the protection of designated beneficial uses. The LARWQCB has implemented this provision by establishing a maximum discharge temperature of 106º F during normal operations in Order 01-057 (LARWQCB 2001). Information available for review indicates MGS has consistently been able to comply with this requirement. Because cooling tower blowdown will be taken from the “cold” side of the tower, conversion to a wet cooling system will significantly reduce the discharge temperature (to less than 80º F) and the size of any related thermal plume in the receiving water.
3.4.4 RECLAIMED WATER
Reclaimed or alternative water sources used in conjunction with wet cooling towers could eliminate all surface water withdrawals at MGS. Doing so would completely eliminate impingement and entrainment concerns, and might enable the facility to avoid possible effluent quality and permit compliance issues, depending on the quality of reclaimed water available for use. In addition, wet cooling towers using reclaimed water would be expected to have lower PM10
emissions due to the lower TDS levels. The California State Water Resources Control Board (SWRCB), in 1975, issued a policy statement requiring the consideration of alternative cooling methods in new power plants, including reclaimed water, over the use of freshwater (SWRCB 1975). There is no similar policy regarding marine waters, but the clear preference of state agencies is to encourage alternative cooling methods, including reclaimed water, wherever possible.
The present volume of available reclaimed water within a 15-mile radius of MGS (50 mgd) does not meet the current once-through cooling demand; thus, reclaimed water is only applicable as a source of makeup water for a wet cooling tower system. This study did not pursue a detailed investigation of reclaimed water’s use because the conversion of MGS’s once-through cooling system to saltwater cooling towers meets the performance benchmarks for impingement and entrainment impact reductions discussed in the 2006 California Ocean Protection Council (OPC) Resolution on Once-Through Cooling Water (see Chapter 1).
To be acceptable for use as makeup water in cooling towers, reclaimed water must meet tertiary treatment and disinfection standards under California Code of Regulations (CCR) Title 22. If the reclaimed water is not treated to the required levels, MGS would be required to arrange for sufficient treatment, either onsite or at the source facility, prior to its use in the cooling towers.
An additional consideration for reclaimed water is the presence of any ammonia or ammonia-forming compounds in the reclaimed water. All the condenser tubes at MGS contain copper

MANDALAY GENERATING STATION
California’s Coastal Power Plants: H–19 Alternative Cooling System Analysis
alloys (aluminum brass) and can experience stress-corrosion cracking as a result of the interaction between copper and ammonia. Treatment for ammonia may include adding ferrous sulfate as a corrosion inhibitor or require ammonia-stripping towers to pretreat reclaimed water prior to use in the cooling towers (EPA 2001).
Four publicly owned treatment works (POTWs) were identified within a 15-mile radius of MGS, with a combined discharge capacity of 50 mgd. Figure H–6 shows the relative locations of these facilities to MGS.
Figure H–6. Reclaimed Water Sources
City of Ventura Water Reclamation Facility (VWRF)—Ventura Discharge volume: 14 mgd Distance: 2.5 miles NW Treatment level: Tertiary
All wastewater at VWRF is treated to tertiary standards. Approximately 1.0 mgd is currently used for irrigation purposes in the vicinity. Facility staff indicated that demand is increasing as the area is developed and future uses may limit any capacity available to MGS as a makeup water source. Based on the current available capacity, however,

MANDALAY GENERATING STATION
H–20 California’s Coastal Power Plants: Alternative Cooling System Analysis
VWRF could provide most of the makeup water (5–8 mgd) for freshwater cooling towers at MGS.
City of Oxnard Wastewater Treatment Plant—Oxnard Discharge volume: 31 mgd Distance: 4 miles SE Treatment level: Secondary
No information available. The existing capacity is sufficient to supply enough makeup water (5–8 mgd) for freshwater cooling towers at MGS, although arrangements for tertiary treatment would have to be made prior to its use.
Two other wastewater treatment plants—Ojai Valley and Santa Paula—lie within 10-15 miles of MGS. The combined capacity of these facilities (approximately 8 mgd) is equivalent to the total makeup demand required in freshwater towers at MGS, but would require transmission pipelines to all four facilities. If reclaimed water sources are pursued, the most practical options are the Ventura and Oxnard facilities.
The costs associated with installing transmission pipelines (excavation/drilling, material, labor), in addition to design and permitting costs, are difficult to quantify in the absence of a detailed analysis of various site-specific parameters that will influence the final configuration. The nearest facility with sufficient capacity to satisfy MGS’s freshwater tower makeup demand (5–8 mgd) is located approximately 2.5 miles from the site (Ventura WRF). The area between the two facilities is not heavily developed. Installing a transmission pipeline would not face any significant obstacles in terms of infrastructure or right of way.
Based on data compiled for this study and others, the estimated installed cost of a 24-inch prestressed concrete cylinder pipe, sufficient to provide 8 mgd to MGS, is $250 per linear foot, or approximately $1.3 million per mile. Additional considerations, such as pump capacity and any required treatment, would increase the total cost.
Regulatory concerns beyond the scope of this investigation, however, may make reclaimed water (as a makeup water source) comparable or preferable to saltwater from the Pacific Ocean. Reclaimed water may enable MGS to eliminate potential conflicts with water discharge limitations or reduce PM10 emissions from the cooling tower, which is a concern given the South Coast air basin’s current nonattainment status.
Use of freshwater (reclaimed water) as the makeup water source might enable MGS to avoid conflicts with effluent limitations that will likely result from installing wet cooling towers. The proximity of the Ventura WRF would appear to make this an attractive alternative combined with wet cooling towers, although MGS may choose to address effluent limitations in a different manner, such as pretreatment or discharge alteration (dilution).
At any facility where wet cooling towers are a feasible alternative, reclaimed water may be used as a makeup water source. The practicality of its use, however, depends on the overall cost, availability, and additional environmental benefit that may occur.

MANDALAY GENERATING STATION
California’s Coastal Power Plants: H–21 Alternative Cooling System Analysis
3.4.5 THERMAL EFFICIENCY
Wet cooling towers at MGS will increase the condenser inlet water temperature by a range of 3 to 16° F above the surface water temperature, depending on the ambient wet bulb temperature at the time. The generating units at MGS are designed to operate at the conditions described in Table H–12. The resulting monthly difference between once-through and wet cooling tower condenser inlet temperatures is described in Figure H–7.
Table H–12. Design Thermal Conditions
Unit 1 Unit 2
Design backpressure (in. HgA) 1.5 1.5
Design water temperature (°F) 63 63
Turbine inlet temp (°F) 1,050 1,050
Turbine inlet pressure (psia) 2,150 2,150
Full load heat rate (BTU/kWh) [a] 9,375 9,450
[a] CEC 2002.
50
55
60
65
70
75
80
85
January
Februa
ryMarc
hApril
May June July
August
Septem
ber
October
November
December
Deg
rees
F
Once-through Wet Cooling Tower
Figure H–7. Condenser Inlet Temperatures
Backpressures for the once-through and wet cooling tower configurations were calculated for each month using the design criteria described in the sections above and ambient climate data. In general, backpressures associated with the wet cooling tower were elevated by 0.3 to 0.8 inches HgA compared with the current once-through system (Figure H–8 and Figure H–10).

MANDALAY GENERATING STATION
H–22 California’s Coastal Power Plants: Alternative Cooling System Analysis
Heat rate adjustments were calculated by comparing the theoretical change in available energy that occurs at different turbine exhaust backpressures, assuming the thermal load and turbine inlet pressure remain constant, i.e., at the full load rating.5 The relative change at different backpressures was compared with the value calculated for the design conditions (i.e., at design turbine inlet and exhaust backpressures) and plotted as a percentage of the full load operating heat rate to develop estimated correction curves (Figure H–9 and Figure H–11).
The difference between the estimated once-through and closed-cycle heat rates for each month represents the approximate heat rate increase that would be expected when converting to wet cooling towers.
Table H–13 summarizes the annual average heat rate increase for each unit as well as the increase associated with the peak demand period of July-August-September. Monthly values were used to calculate the monetized value of these heat rate changes (Section 4.6). Month-by-month calculations are presented in Appendix A.
Table H–13. Summary of Estimated Heat Rate Increases
Unit 1 Unit 2
Peak (July-August-September) 0.43% 0.43%
Annual average 0.73% 0.73%
1.0
1.5
2.0
2.5
3.0
JAN
FEBMAR
APRMAY
JUN
JUL
AUGSEP
OCTNOV
DEC
inch
es H
gA
Once Through Closed Cycle
Design Point, 1.50
-1%
0%
1%
2%
3%
0.0 0.5 1.0 1.5 2.0 2.5 3.0
Backpressure (inches HgA)
% C
hang
e in
Hea
t Rat
e
Figure H–8. Estimated Backpressures (Unit 1) Figure H–9. Estimated Heat Rate Correction (Unit 1)
5 Changes in thermal efficiency estimated for MGS are based on the design specifications provided by the facility. This may not reflect system modifications that might influence actual performance. In addition, the age of the units and the operating protocols used by MGS might result in different calculations.

MANDALAY GENERATING STATION
California’s Coastal Power Plants: H–23 Alternative Cooling System Analysis
1.0
1.5
2.0
2.5
3.0
JAN
FEBMAR
APRMAY
JUN
JUL
AUGSEP
OCTNOV
DEC
inch
es H
gA
Once Through Closed Cycle
Design Point, 1.50
-1%
0%
1%
2%
3%
0.0 0.5 1.0 1.5 2.0 2.5 3.0
Backpressure (inches HgA)
% C
hang
e in
Hea
t Rat
e
Figure H–10. Estimated Backpressures (Unit 2) Figure H–11. Estimated Heat Rate Correction (Unit 2)
MANDALAY GENERATING STATION
H–24 California’s Coastal Power Plants: Alternative Cooling System Analysis
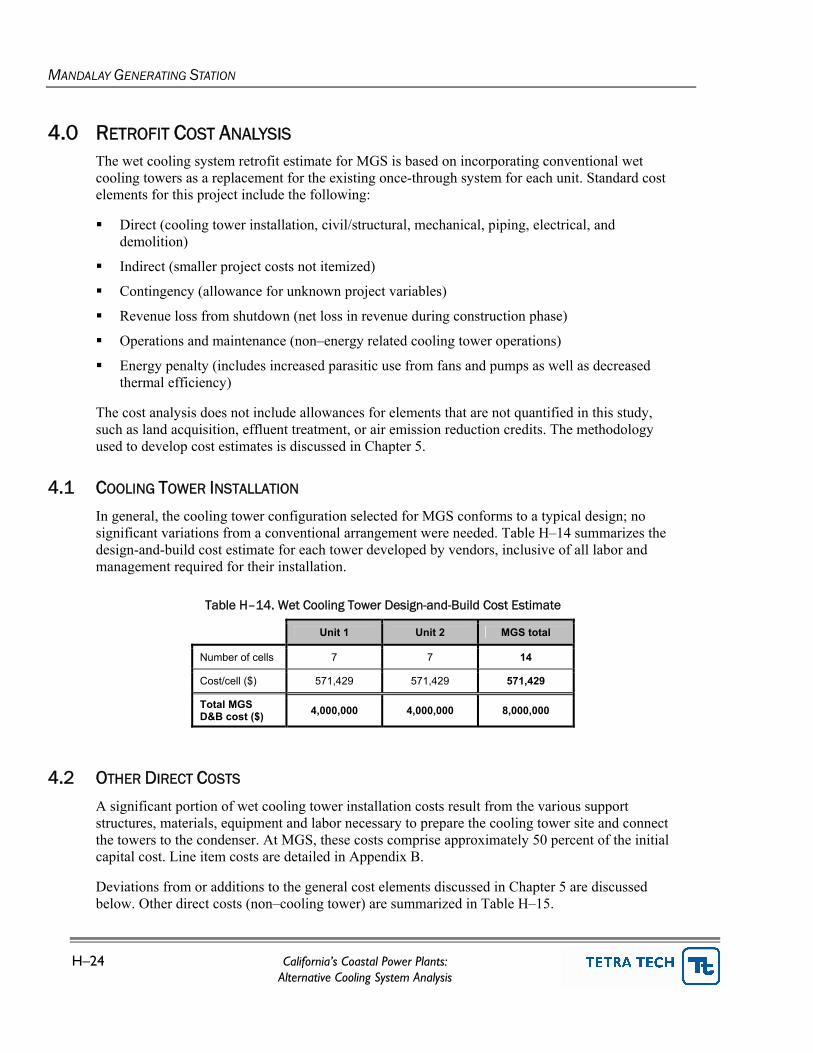
4.0 RETROFIT COST ANALYSIS The wet cooling system retrofit estimate for MGS is based on incorporating conventional wet cooling towers as a replacement for the existing once-through system for each unit. Standard cost elements for this project include the following:
Direct (cooling tower installation, civil/structural, mechanical, piping, electrical, and demolition)
Indirect (smaller project costs not itemized)
Contingency (allowance for unknown project variables)
Revenue loss from shutdown (net loss in revenue during construction phase)
Operations and maintenance (non–energy related cooling tower operations)
Energy penalty (includes increased parasitic use from fans and pumps as well as decreased thermal efficiency)
The cost analysis does not include allowances for elements that are not quantified in this study, such as land acquisition, effluent treatment, or air emission reduction credits. The methodology used to develop cost estimates is discussed in Chapter 5.
4.1 COOLING TOWER INSTALLATION
In general, the cooling tower configuration selected for MGS conforms to a typical design; no significant variations from a conventional arrangement were needed. Table H–14 summarizes the design-and-build cost estimate for each tower developed by vendors, inclusive of all labor and management required for their installation.
Table H–14. Wet Cooling Tower Design-and-Build Cost Estimate
Unit 1 Unit 2 MGS total
Number of cells 7 7 14
Cost/cell ($) 571,429 571,429 571,429
Total MGS D&B cost ($) 4,000,000 4,000,000 8,000,000
4.2 OTHER DIRECT COSTS
A significant portion of wet cooling tower installation costs result from the various support structures, materials, equipment and labor necessary to prepare the cooling tower site and connect the towers to the condenser. At MGS, these costs comprise approximately 50 percent of the initial capital cost. Line item costs are detailed in Appendix B.
Deviations from or additions to the general cost elements discussed in Chapter 5 are discussed below. Other direct costs (non–cooling tower) are summarized in Table H–15.

MANDALAY GENERATING STATION
California’s Coastal Power Plants: H–25 Alternative Cooling System Analysis
Civil, Structural, and Piping The MGS site configuration allows each tower to be located within relative proximity to the generating unit it services.
Mechanical and Electrical Initial capital costs in this category reflect the new pumps (four total) to circulate cooling water between the towers and condensers. No new pumps are required to provide makeup water from Channel Islands Harbor. Electrical costs are based on the battery limit after the main feeder breakers.
Demolition No demolition costs are required.
Table H–15. Summary of Other Direct Costs
Equipment ($)
Bulk material ($)
Labor ($)
MGS total ($)
Civil/structural/piping 2,900,000 8,200,000 6,700,000 17,800,000
Mechanical 4,300,000 0 400,000 4,700,000
Electrical 1,100,000 1,500,000 1,100,000 3,700,000
Demolition 0 0 0 0
Total MGS other direct costs 8,300,000 9,700,000 8,200,000 26,200,000
4.3 INDIRECT AND CONTINGENCY
Indirect costs are calculated as 25 percent of all direct costs (civil/structural, mechanical, electrical, demolition, and cooling towers).
An additional allowance is included for condenser water box and tube sheet reinforcement to withstand the increased pressures associated with a recirculating system. Each condenser may require reinforcement of the tube sheet bracing with 6-inch x 1-inch steel, and water box reinforcement/replacement with 5/8-inch carbon steel. Based on the estimates outlined in Chapter 5, a conservative estimate of 5 percent of all direct costs is included to account for possible condenser modifications.
The contingency cost is calculated as 25 percent of the sum of all direct and indirect costs, including condenser reinforcement. At MGS, potential costs in this category include relocating or demolishing small buildings and structures and potential interferences from underground structures.
Soils were not characterized for this analysis. MGS is situated at sea level adjacent to the Pacific Ocean. Seawater intrusion or the instability of sandy soils may require additional pilings to support any large structures built at the site. Initial capital costs are summarized in Table H–16.
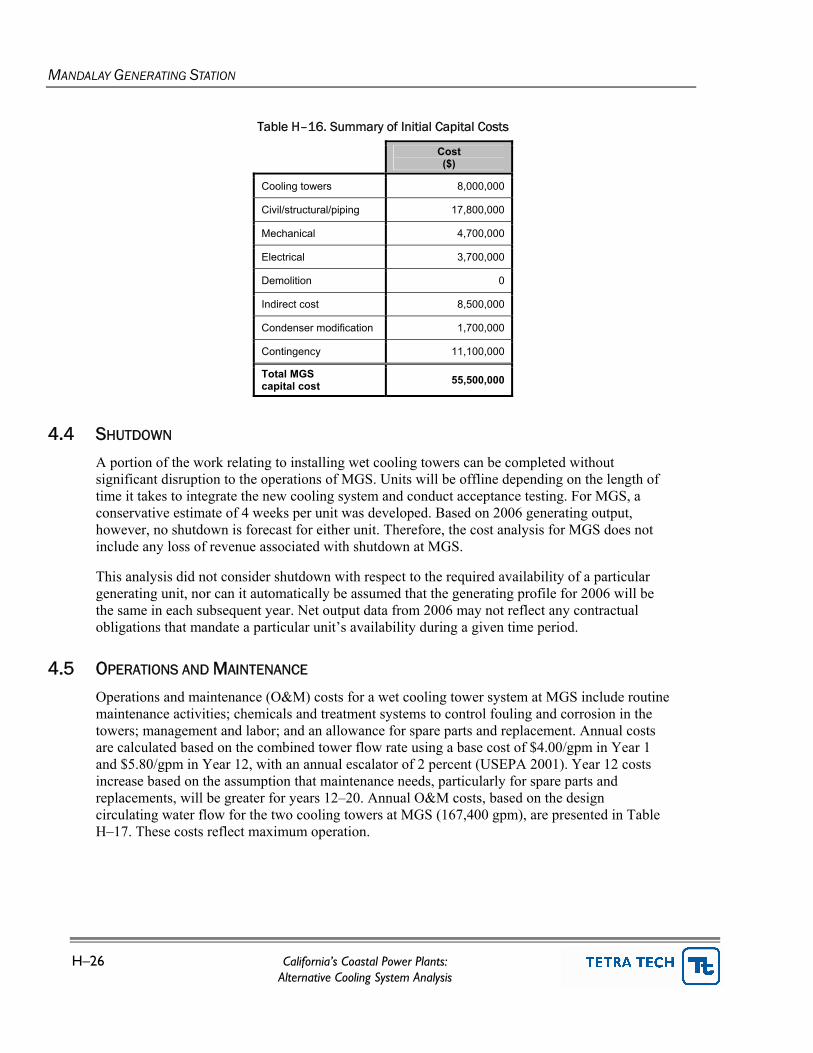
MANDALAY GENERATING STATION
H–26 California’s Coastal Power Plants: Alternative Cooling System Analysis
Table H–16. Summary of Initial Capital Costs
Cost ($)
Cooling towers 8,000,000
Civil/structural/piping 17,800,000
Mechanical 4,700,000
Electrical 3,700,000
Demolition 0
Indirect cost 8,500,000
Condenser modification 1,700,000
Contingency 11,100,000
Total MGS capital cost 55,500,000
4.4 SHUTDOWN
A portion of the work relating to installing wet cooling towers can be completed without significant disruption to the operations of MGS. Units will be offline depending on the length of time it takes to integrate the new cooling system and conduct acceptance testing. For MGS, a conservative estimate of 4 weeks per unit was developed. Based on 2006 generating output, however, no shutdown is forecast for either unit. Therefore, the cost analysis for MGS does not include any loss of revenue associated with shutdown at MGS.
This analysis did not consider shutdown with respect to the required availability of a particular generating unit, nor can it automatically be assumed that the generating profile for 2006 will be the same in each subsequent year. Net output data from 2006 may not reflect any contractual obligations that mandate a particular unit’s availability during a given time period.
4.5 OPERATIONS AND MAINTENANCE
Operations and maintenance (O&M) costs for a wet cooling tower system at MGS include routine maintenance activities; chemicals and treatment systems to control fouling and corrosion in the towers; management and labor; and an allowance for spare parts and replacement. Annual costs are calculated based on the combined tower flow rate using a base cost of $4.00/gpm in Year 1 and $5.80/gpm in Year 12, with an annual escalator of 2 percent (USEPA 2001). Year 12 costs increase based on the assumption that maintenance needs, particularly for spare parts and replacements, will be greater for years 12–20. Annual O&M costs, based on the design circulating water flow for the two cooling towers at MGS (167,400 gpm), are presented in Table H–17. These costs reflect maximum operation.

MANDALAY GENERATING STATION
California’s Coastal Power Plants: H–27 Alternative Cooling System Analysis
Table H–17. Annual O&M Costs (Full Load)
Year 1 cost ($)
Year 12 cost ($)
Management/labor 167,400 242,730
Service/parts 267,840 388,368
Fouling 234,360 339,822
Total MGS O&M cost 669,600 970,920
4.6 ENERGY PENALTY
The energy penalty is divided into two components: increased parasitic use from the added electrical demand from tower fans and pumps; and the decrease in thermal efficiency from elevated turbine backpressures. Monetizing the energy penalty at MGS requires some assumption as to how the facility will choose to alter its operations to compensate for these changes, if at all. One option would be to accept the reduced amount of revenue-generating electricity available for sale and absorb the economic loss (“production loss option”). A second option would be to increase the firing rate to the turbine (i.e., consume more fuel) and produce the same amount of revenue-generating electricity as had been obtained with the once-through cooling system (“increased fuel option”). The degree to which a facility is able, or prefers, to operate at a higher firing rate, however, produces the more likely scenario—some combination of the two.
Ultimately, the manner in which MGS would alter operations to address efficiency changes is driven by considerations unknown to this study (e.g., corporate strategy, contractual obligations, operating protocols and turbine pressure tolerances). In all summary cost estimates, this study calculates the energy penalty’s monetized value by assuming the facility will use the increased fuel option to compensate for reduced efficiency and generate the amount of electricity equivalent to the estimated shortfall. With this option, the energy penalty is equivalent to the financial cost of additional fuel and is nominally less costly than the production loss option. This option, however, may not reflect long-term costs such as increased maintenance or system degradation that may result from continued operation at a higher-than-designed turbine firing rate.
6
The energy penalty for MGS is calculated by first estimating the increased parasitic demand from the cooling tower pumps and fans, expressed as a percentage of each unit’s rated capacity. Likewise, the change in the unit’s heat rate is also expressed as a capacity percentage.
6 Increasing the firing rate will raise the water temperature exiting the condenser. The cooling towers are designed with a maximum water return temperature, typically 120° F. Depending on the system’s operating conditions, a facility may be limited in the degree to which it can alter the thermal input without compromising the cooling tower’s performance.

MANDALAY GENERATING STATION
H–28 California’s Coastal Power Plants: Alternative Cooling System Analysis
4.6.1 INCREASED PARASITIC USE (FANS AND PUMPS)
Depending on ambient conditions or the operating load at a given time, MGS may be able to take one or more cooling tower cells offline and still obtain the required level of cooling. This would also reduce the cumulative electrical demand from the fans. For the purposes of this study, however, operations are evaluated at the design conditions, i.e., full load; no allowance is made for seasonal changes. The increased electrical demand from cooling tower fan operation is summarized in Table H–18.
Table H–18. Cooling Tower Fan Parasitic Use
Tower 1 Tower 2 MGS total
Units served Unit 1 Unit 2 --
Generating capacity (MW) 215 215 430
Number of fans (one per cell) 7 7 14
Motor power per fan (hp) 211 211 --
Total motor power (hp) 1,474 1,474 2,947
MW total 1.10 1.10 2.20
Fan parasitic use (% of capacity) 0.51% 0.51% 0.51%
Additional circulating water pump capacity for the wet cooling towers will also increase the parasitic electricity usage at MGS. Makeup water will continue to be withdrawn from the Pacific Ocean with one of the existing circulating water pumps; the remaining pumps will be retired.
The net increase in pump-related parasitic usage is the difference between the new wet cooling tower configuration (new plus retained pumps) and the existing once-through configuration. For calculation purposes, this study assumes full-load operation to estimate the cost of increased parasitic use. Final estimates, therefore, allocate the retained pump’s electrical demand to each tower based on the proportion of the facility’s generating capacity it services. Operating fewer towers or tower cells will alter the allocation of the retained pump’s electrical demand, but not the total demand.
Because one of the main design assumptions maintains the existing flow rate through each condenser, the new circulating pumps are single speed and are assumed to operate at their full rated capacity when in use. The increased electrical demand associated with cooling tower pump operation is summarized in Table H–19.

MANDALAY GENERATING STATION
California’s Coastal Power Plants: H–29 Alternative Cooling System Analysis
Table H–19. Cooling Tower Pump Parasitic Use
Tower 1 Tower 2 MGS total
Units served Unit 1 Unit 2 --
Generating capacity (MW) 215 215 430
Existing pump configuration (hp) 1,200 1,200 2,400
New pump configuration (hp) 2,345 2,345 4,691
Difference (hp) 1,145 1,145 2,291
Difference (MW) 0.9 0.9 1.7
Net pump parasitic use (% of capacity) 0.40% 0.40% 0.40%
4.6.2 HEAT RATE CHANGE
Heat rate adjustments were calculated based on each month’s ambient climate conditions and reflect the estimated difference between operations with once-through and wet cooling tower systems. As noted above, the energy penalty analysis assumes MGS will increase its fuel consumption to compensate for lost efficiency and the increased parasitic load from fans and pumps. The higher turbine firing rate will increase the thermal load rejected to the condenser, which, in turn, results in a higher backpressure value and corresponding increase in the heat rate. No data are available describing the changes in turbine backpressures above the design thermal loads. For the purposes of monetizing the energy penalty only, this study conservatively assumed an additional increase in the heat rate of 0.5 percent at the higher firing rate; the actual effect at MGS may be greater or less. Changes in the heat rate for each unit at MGS are presented in Figure H–12 and Figure H–13.
9,200
9,300
9,400
9,500
9,600
Jan
Feb Mar AprMay Ju
n JulAug Sep Oct Nov
Dec
Heat
Rat
e (B
TU/k
Wh)
Once Through Wet Cooling Wet Cooling + Increased Firing
9,300
9,400
9,500
9,600
9,700
Jan
Feb Mar AprMay Ju
n Jul
Aug SepOct Nov
Dec
Hea
t Rat
e (B
TU/k
Wh)
Once Through Wet Cooling Wet Cooling + Increased Firing
Figure H–12. Estimated Heat Rate Change (Unit 1) Figure H–13. Estimated Heat Rate Change (Unit 2)
MANDALAY GENERATING STATION
H–30 California’s Coastal Power Plants: Alternative Cooling System Analysis
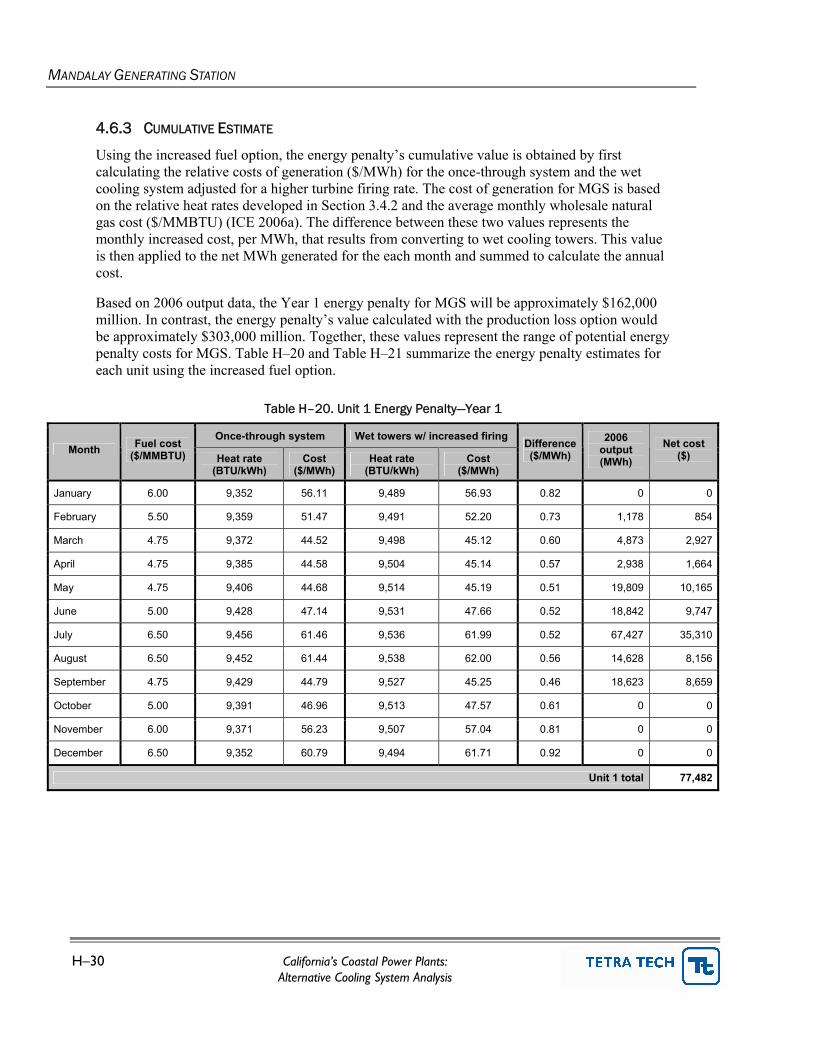
4.6.3 CUMULATIVE ESTIMATE
Using the increased fuel option, the energy penalty’s cumulative value is obtained by first calculating the relative costs of generation ($/MWh) for the once-through system and the wet cooling system adjusted for a higher turbine firing rate. The cost of generation for MGS is based on the relative heat rates developed in Section 3.4.2 and the average monthly wholesale natural gas cost ($/MMBTU) (ICE 2006a). The difference between these two values represents the monthly increased cost, per MWh, that results from converting to wet cooling towers. This value is then applied to the net MWh generated for the each month and summed to calculate the annual cost.
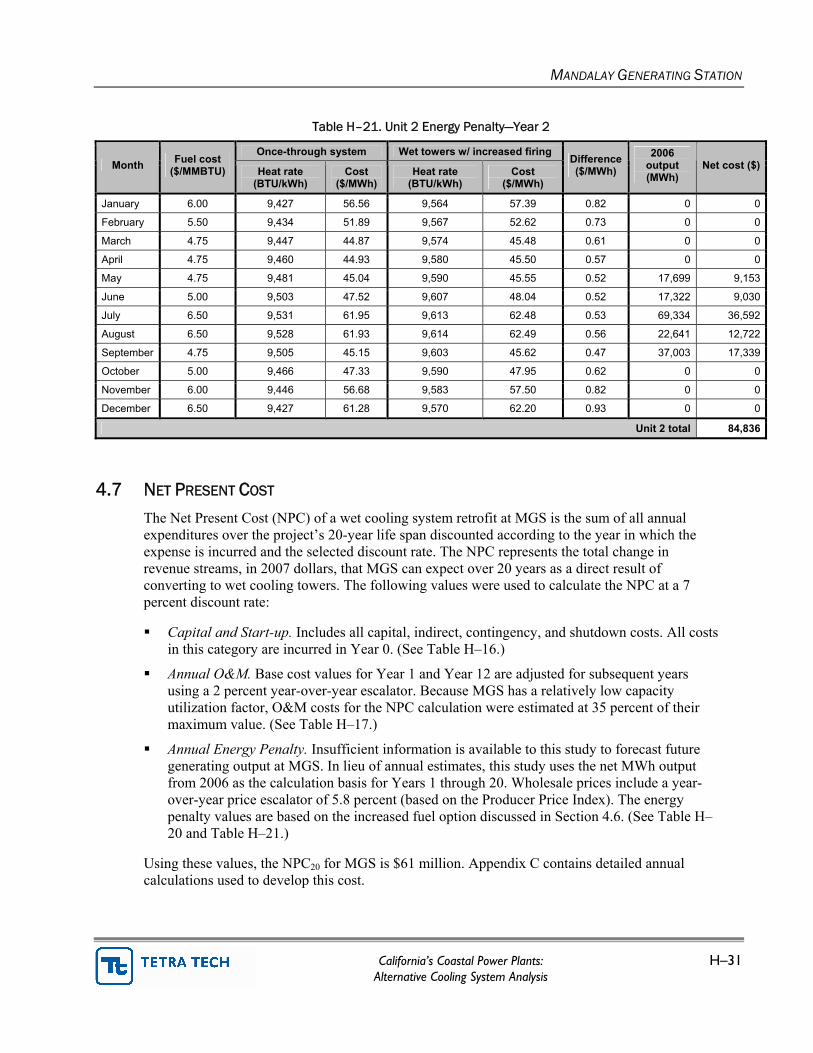
Based on 2006 output data, the Year 1 energy penalty for MGS will be approximately $162,000 million. In contrast, the energy penalty’s value calculated with the production loss option would be approximately $303,000 million. Together, these values represent the range of potential energy penalty costs for MGS. Table H–20 and Table H–21 summarize the energy penalty estimates for each unit using the increased fuel option.
Table H–20. Unit 1 Energy Penalty—Year 1
Once-through system Wet towers w/ increased firing Month Fuel cost
($/MMBTU) Heat rate (BTU/kWh)
Cost ($/MWh)
Heat rate (BTU/kWh)
Cost ($/MWh)
Difference ($/MWh)
2006 output (MWh)
Net cost ($)
January 6.00 9,352 56.11 9,489 56.93 0.82 0 0
February 5.50 9,359 51.47 9,491 52.20 0.73 1,178 854
March 4.75 9,372 44.52 9,498 45.12 0.60 4,873 2,927
April 4.75 9,385 44.58 9,504 45.14 0.57 2,938 1,664
May 4.75 9,406 44.68 9,514 45.19 0.51 19,809 10,165
June 5.00 9,428 47.14 9,531 47.66 0.52 18,842 9,747
July 6.50 9,456 61.46 9,536 61.99 0.52 67,427 35,310
August 6.50 9,452 61.44 9,538 62.00 0.56 14,628 8,156
September 4.75 9,429 44.79 9,527 45.25 0.46 18,623 8,659
October 5.00 9,391 46.96 9,513 47.57 0.61 0 0
November 6.00 9,371 56.23 9,507 57.04 0.81 0 0
December 6.50 9,352 60.79 9,494 61.71 0.92 0 0
Unit 1 total 77,482
MANDALAY GENERATING STATION
California’s Coastal Power Plants: H–31 Alternative Cooling System Analysis
Table H–21. Unit 2 Energy Penalty—Year 2
Once-through system Wet towers w/ increased firing Month Fuel cost
($/MMBTU) Heat rate (BTU/kWh)
Cost ($/MWh)
Heat rate (BTU/kWh)
Cost ($/MWh)
Difference ($/MWh)
2006 output (MWh)
Net cost ($)
January 6.00 9,427 56.56 9,564 57.39 0.82 0 0
February 5.50 9,434 51.89 9,567 52.62 0.73 0 0
March 4.75 9,447 44.87 9,574 45.48 0.61 0 0
April 4.75 9,460 44.93 9,580 45.50 0.57 0 0
May 4.75 9,481 45.04 9,590 45.55 0.52 17,699 9,153
June 5.00 9,503 47.52 9,607 48.04 0.52 17,322 9,030
July 6.50 9,531 61.95 9,613 62.48 0.53 69,334 36,592
August 6.50 9,528 61.93 9,614 62.49 0.56 22,641 12,722
September 4.75 9,505 45.15 9,603 45.62 0.47 37,003 17,339
October 5.00 9,466 47.33 9,590 47.95 0.62 0 0
November 6.00 9,446 56.68 9,583 57.50 0.82 0 0
December 6.50 9,427 61.28 9,570 62.20 0.93 0 0
Unit 2 total 84,836
4.7 NET PRESENT COST
The Net Present Cost (NPC) of a wet cooling system retrofit at MGS is the sum of all annual expenditures over the project’s 20-year life span discounted according to the year in which the expense is incurred and the selected discount rate. The NPC represents the total change in revenue streams, in 2007 dollars, that MGS can expect over 20 years as a direct result of converting to wet cooling towers. The following values were used to calculate the NPC at a 7 percent discount rate:
Capital and Start-up. Includes all capital, indirect, contingency, and shutdown costs. All costs in this category are incurred in Year 0. (See Table H–16.)
Annual O&M. Base cost values for Year 1 and Year 12 are adjusted for subsequent years using a 2 percent year-over-year escalator. Because MGS has a relatively low capacity utilization factor, O&M costs for the NPC calculation were estimated at 35 percent of their maximum value. (See Table H–17.)
Annual Energy Penalty. Insufficient information is available to this study to forecast future generating output at MGS. In lieu of annual estimates, this study uses the net MWh output from 2006 as the calculation basis for Years 1 through 20. Wholesale prices include a year-over-year price escalator of 5.8 percent (based on the Producer Price Index). The energy penalty values are based on the increased fuel option discussed in Section 4.6. (See Table H–20 and Table H–21.)
Using these values, the NPC20 for MGS is $61 million. Appendix C contains detailed annual calculations used to develop this cost.
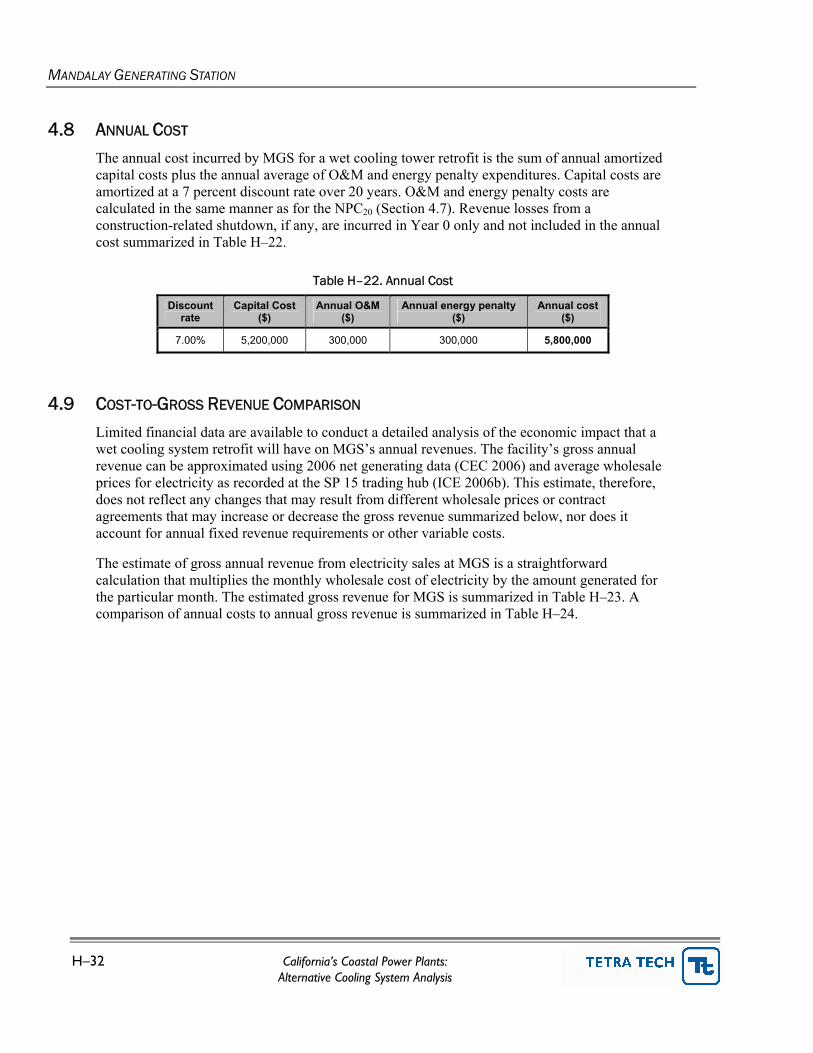
MANDALAY GENERATING STATION
H–32 California’s Coastal Power Plants: Alternative Cooling System Analysis
4.8 ANNUAL COST
The annual cost incurred by MGS for a wet cooling tower retrofit is the sum of annual amortized capital costs plus the annual average of O&M and energy penalty expenditures. Capital costs are amortized at a 7 percent discount rate over 20 years. O&M and energy penalty costs are calculated in the same manner as for the NPC20 (Section 4.7). Revenue losses from a construction-related shutdown, if any, are incurred in Year 0 only and not included in the annual cost summarized in Table H–22.
Table H–22. Annual Cost
Discount rate
Capital Cost ($)
Annual O&M ($)
Annual energy penalty ($)
Annual cost ($)
7.00% 5,200,000 300,000 300,000 5,800,000
4.9 COST-TO-GROSS REVENUE COMPARISON
Limited financial data are available to conduct a detailed analysis of the economic impact that a wet cooling system retrofit will have on MGS’s annual revenues. The facility’s gross annual revenue can be approximated using 2006 net generating data (CEC 2006) and average wholesale prices for electricity as recorded at the SP 15 trading hub (ICE 2006b). This estimate, therefore, does not reflect any changes that may result from different wholesale prices or contract agreements that may increase or decrease the gross revenue summarized below, nor does it account for annual fixed revenue requirements or other variable costs.
The estimate of gross annual revenue from electricity sales at MGS is a straightforward calculation that multiplies the monthly wholesale cost of electricity by the amount generated for the particular month. The estimated gross revenue for MGS is summarized in Table H–23. A comparison of annual costs to annual gross revenue is summarized in Table H–24.

MANDALAY GENERATING STATION
California’s Coastal Power Plants: H–33 Alternative Cooling System Analysis
Table H–23. Estimated Gross Revenue
2006 net output (MWh)
Estimated gross revenue ($)
Wholesale price
($/MWh) Unit 1 Unit 2 Unit 1 Unit 2 MGS total
January 66 0 0 0 0 0
February 61 1,178 0 71,858 0 71,858
March 51 4,873 0 248,523 0 248,523
April 51 2,938 0 149,838 0 149,838
May 51 19,809 17,699 1,010,259 902,649 1,912,908
June 55 18,842 17,322 1,036,310 952,710 1,989,020
July 91 67,427 69,334 6,135,857 6,309,394 12,445,251
August 73 14,628 22,641 1,067,844 1,652,793 2,720,637
September 53 18,623 37,003 987,019 1,961,159 2,948,178
October 57 0 0 0 0 0
November 66 0 0 0 0 0
December 67 0 0 0 0 0
MGS total 148,318 163,999 10,707,508 11,778,705 22,486,213
Table H–24. Cost-Revenue Comparison
Initial capital O&M Energy penalty Total annual cost Estimated gross annual
revenue ($)
Cost ($)
% of gross
Cost ($)
% of gross
Cost ($)
% of gross
Cost ($)
% of gross
22,500,000 5,200,000 23 300,000 1.3 300,000 1.3 5,800,000 26
MANDALAY GENERATING STATION
H–34 California’s Coastal Power Plants: Alternative Cooling System Analysis
5.0 OTHER TECHNOLOGIES Within the scope of this study, and using the OPC resolution’s stated goal of reducing impingement and entrainment by 90–95 percent as a benchmark, the effectiveness of other technologies commonly used to address such impacts could not be conclusively determined for use at MGS. As with many existing facilities, the site’s location and configuration complicate the use of some technologies that might be used successfully elsewhere. A more detailed analysis that also comprises a biological evaluation may determine the applicability of one or more of these technologies to MGS. A brief summary of these technologies’ applicability follows.
5.1 MODIFIED RISTROPH SCREENS—FINE MESH
The principal concern with this technology is the successful return of viable organisms captured on the screens to the source water body. MGS currently withdraws its cooling water from Channel Islands Harbor. Returning any collected organisms to the harbor would be problematic because there is a high likelihood of reimpingement due to the flow patterns within the harbor and canal. There is also a question as to the long-term viability of fragile organisms (eggs and larvae) transported over the long distance from the facility to the harbor. Discharging organisms to the Pacific Ocean is not an option because many harbor species would be expected among the impinged organisms and may not survive in the open ocean. Successful deployment of this technology might be feasible with a better understanding of the biological conditions in Channel Islands Harbor and a detailed evaluation of a proposed return system.
5.2 BARRIER NETS
Placement of a barrier net at the entrance to the Edison Canal (West Channel Islands Boulevard) is not possible due to the likely conflicts with other uses of the marina. A barrier net could conceivably be placed at some distance closer to MGS without interfering with recreational boating and address impingement concerns. Barrier nets are ineffective as an entrainment reduction technology, however, and are not evaluated further in this study.
5.3 AQUATIC FILTRATION BARRIERS
Aquatic filtration barriers (AFBs) require large areas of relatively clean, low turbulence water in which to function properly. To protect the Edison Canal, MGS would require an AFB approximately 14,000 square feet in total area. The lack of sufficient cross currents at any potential location within the harbor would exacerbate any difficulties in keeping the material clean. The lack of available space within Channel Islands Harbor precludes the use of AFBs at MGS.
5.4 VARIABLE SPEED DRIVES
Variable speed drives (VSDs) were not considered for analysis at MGS because the technology alone cannot be expected to achieve the desired level of reductions in impingement and entrainment, nor could it be combined with another technology to yield the desired reductions.

MANDALAY GENERATING STATION
California’s Coastal Power Plants: H–35 Alternative Cooling System Analysis
Pumps that have been retrofitted with VSDs can reduce overall flow intake volumes by 10 to 50 percent over the current once-through configuration (USEPA 2001). The actual reduction, however, will vary based on the cooling water demand at different times of the year. At peak demand, the pumps will essentially function as standard circulating water pumps and withdraw water at the maximum rated capacity, thus negating any potential benefit. Use of VSDs may be an economically desirable option when pumps are retrofitted or replaced for other reasons, but they were not considered further for this study.
5.5 CYLINDRICAL FINE MESH WEDGEWIRE
Fine-mesh cylindrical wedgewire screens have not been deployed or evaluated at open coastal facilities for applications as large as would be required at MGS (approximately 250 mgd). To function as intended, cylindrical wedgewire screens must be submerged in a water body with a consistent ambient current of 0.5 feet per second (fps). Ideally, this current would be unidirectional so that screens may be oriented properly, and any debris impinged on the screens will be carried downstream when the airburst cleaning system is activated.
Fine-mesh wedgewire screens for MGS would be located offshore in the Pacific Ocean, west of the facility. Limited information regarding the subsurface currents in the near-shore environment near MGS is available. Data suggest that these currents are multidirectional, depending on the tide and season, and fluctuate in terms of velocity, with prolonged periods below 0.5 fps (SCCOOS 2006). To attain sufficient depth (approximately 20 feet) and an ambient current that might allow deployment, screens would need to be located 2,000 feet or more offshore. Discussions with vendors who design these systems indicated that distances over 1,000 to 1,500 feet become problematic due to the airburst system’s inability to maintain adequate pressure for sufficient cleaning (Someah 2007). Together, these considerations preclude further evaluation of fine-mesh cylindrical wedgewire screens at MGS.

MANDALAY GENERATING STATION
H–36 California’s Coastal Power Plants: Alternative Cooling System Analysis
6.0 REFERENCES ASHRAE (American Society of Heating, Refrigerating and Air-Conditioning Engineers). 2006.
AHSRAE Handbook—Fundamentals (Design Conditions for Ventura, CA). American Society of Heating, Refrigerating and Air-Conditioning Engineers, Atlanta, GA.
CARB (California Air Resources Board). 2005. Facility Emissions Data: Mandalay Generating Station. < http://arb.ca.gov/app/emsinv/facinfo/facinfo.php>. Accessed August 10, 2007.
CEC (California Energy Commission). 2002. Resource, Reliability and Environmental Concerns of Aging Power Plant Operations and Retirements. California Energy Commission, Sacramento, CA.
— 2006. Quarterly Fuel and Energy Report (QFER). California Energy Commission, Sacramento, CA.
CIMIS (California Irrigation Management Information System). 2006. Daily Monitoring Data for Station 156—Oxnard (2000–2006). <http://www.cimis.water.ca.gov/cimis/data.jsp>. Accessed February 6, 2007.
CTI (Cooling Tower Institute). 1994. Isokinetic Drift Test Code. Cooling Tower Institute, Houston, TX.
FRTR (Federal Remediation Technologies Roundtable). 2002. Remediation Technologies Screening Matrix and Reference Guide, 4
th Edition. Federal Remediation Technologies
Roundtable, Washington, DC.
ICE (Intercontinental Exchange). 2006a. Wholesale Natural Gas Prices—Citygate Trading Hub. <https://www.theice.com/marketdata/naNaturalGas/naNatGasHistory.jsp>. Accessed June 3, 2007.
— 2006b. Wholesale Electricity Prices—SP 15 Trading Hub. <https://www.theice.com/marketdata/naPower/naPowerHistory.jsp>. Accessed July 14, 2007.
LARWQCB (Los Angeles Regional Water Quality Control Board). 2001. Order 01-057. Los Angeles Regional Water Quality Control Board, Los Angeles, CA.
NOAA (National Oceanographic and Atmospheric Administration). 2007. National Oceanographic Data Center—Coastal Water Temperature Guide, Ventura and Port Hueneme. <http://www.nodc.noaa.gov/dsdt/cwtg/index.html>. Accessed March 1, 2007.
Oxnard, City of. 2006. General Plan, Section X—Noise Element.
— 2007. Coastal Land Use Plan.
Reliant Energy, Inc. 2004. Report of Waste Discharge and Application for Renewal of NPDES Permit for Mandalay Generating Station. Reliant Energy, Inc, Oxnard, CA.

MANDALAY GENERATING STATION
California’s Coastal Power Plants: H–37 Alternative Cooling System Analysis
— 2005. Clean Water Act Section 316(b) Proposal for Information Collection for Mandalay Generating Station. Reliant Energy, Inc, Oxnard, CA.
SCCOOS (Southern California Coastal Ocean Observing System). 2006. Surface Currents— Ventura County. <http://www.sccoos.org/data/hfrnet/?r=8>. Accessed July 1, 2007.
Someah, K., 2007. Personal communication from Kaveah Someah, Groupe Laperrière & Verreault Inc., to Tim Havey, Tetra Tech, Inc.
SWRCB (California State Water Resources Control Board). 1972. Water Quality Control Plan for Control of Temperature in the Coastal and Interstate Waters and Enclosed Bays and Estuaries of California. California State Water Resources Control Board, Sacramento, CA.
— 1975. Water Quality Control Policy on the Use and Disposal of Inland Waters Used for Power Plant Cooling. Resolution 75-58. California State Water Resources Control Board, Sacramento, CA.
USEPA (U.S. Environmental Protection Agency). 1982. Development Document for Final Effluent Limitation Guidelines, New Source Performance Standards, and Pretreatment Standards for the Steam Electric Point Source Category. EPA 440/1-82/029. U.S. Environmental Protection Agency, Washington, DC.
— 2000. Wastewater Technology Fact Sheet: Ammonia Stripping. EPA-832-F-00-019. U.S. Environmental Protection Agency, Washington, DC.
— 2001. Technical Development Document for the Final Regulations Addressing Cooling Water Intake Structures for New Facilities. U.S. Environmental Protection Agency, Washington, DC.
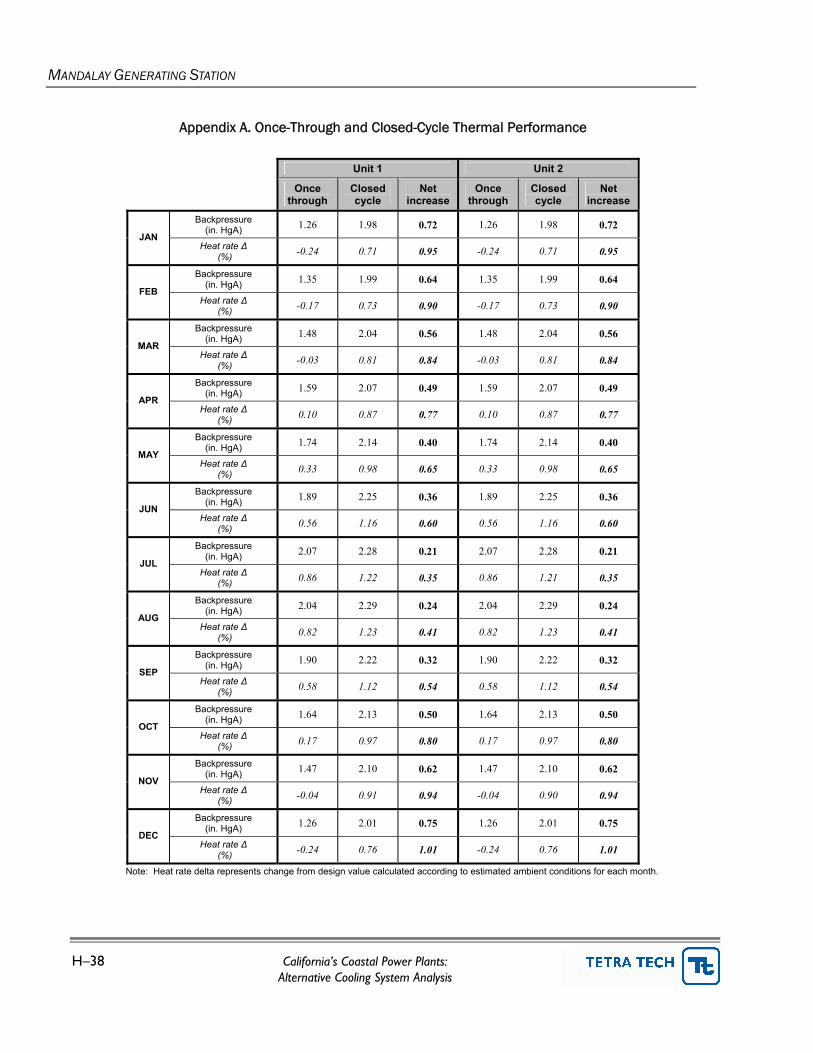
MANDALAY GENERATING STATION
H–38 California’s Coastal Power Plants: Alternative Cooling System Analysis
Appendix A. Once-Through and Closed-Cycle Thermal Performance
Unit 1 Unit 2 Once
through Closed cycle
Net increase
Once through
Closed cycle
Net increase
Backpressure (in. HgA) 1.26 1.98 0.72 1.26 1.98 0.72
JAN Heat rate Δ
(%) -0.24 0.71 0.95 -0.24 0.71 0.95
Backpressure (in. HgA) 1.35 1.99 0.64 1.35 1.99 0.64
FEB Heat rate Δ
(%) -0.17 0.73 0.90 -0.17 0.73 0.90
Backpressure (in. HgA) 1.48 2.04 0.56 1.48 2.04 0.56
MAR Heat rate Δ
(%) -0.03 0.81 0.84 -0.03 0.81 0.84
Backpressure (in. HgA) 1.59 2.07 0.49 1.59 2.07 0.49
APR Heat rate Δ
(%) 0.10 0.87 0.77 0.10 0.87 0.77
Backpressure (in. HgA) 1.74 2.14 0.40 1.74 2.14 0.40
MAY Heat rate Δ
(%) 0.33 0.98 0.65 0.33 0.98 0.65
Backpressure (in. HgA) 1.89 2.25 0.36 1.89 2.25 0.36
JUN Heat rate Δ
(%) 0.56 1.16 0.60 0.56 1.16 0.60
Backpressure (in. HgA) 2.07 2.28 0.21 2.07 2.28 0.21
JUL Heat rate Δ
(%) 0.86 1.22 0.35 0.86 1.21 0.35
Backpressure (in. HgA) 2.04 2.29 0.24 2.04 2.29 0.24
AUG Heat rate Δ
(%) 0.82 1.23 0.41 0.82 1.23 0.41
Backpressure (in. HgA) 1.90 2.22 0.32 1.90 2.22 0.32
SEP Heat rate Δ
(%) 0.58 1.12 0.54 0.58 1.12 0.54
Backpressure (in. HgA) 1.64 2.13 0.50 1.64 2.13 0.50
OCT Heat rate Δ
(%) 0.17 0.97 0.80 0.17 0.97 0.80
Backpressure (in. HgA) 1.47 2.10 0.62 1.47 2.10 0.62
NOV Heat rate Δ
(%) -0.04 0.91 0.94 -0.04 0.90 0.94
Backpressure (in. HgA) 1.26 2.01 0.75 1.26 2.01 0.75
DEC Heat rate Δ
(%) -0.24 0.76 1.01 -0.24 0.76 1.01
Note: Heat rate delta represents change from design value calculated according to estimated ambient conditions for each month.

MANDALAY GENERATING STATION
California’s Coastal Power Plants: H–39 Alternative Cooling System Analysis
Appendix B. Itemized Capital Costs
Equipment Bulk material Labor
Description Unit Qty Unit price
($)
Total price
($)
Unit price
($)
Total price
($) Unit
(Mhr) Rate ($)
Total price
($)
Total cost ($)
CIVIL / STRUCTURAL / PIPING -- -- -- -- -- -- -- -- -- --
Allocation for other accessories (bends, water hammers…)
lot 1 -- -- 500,000 500,000 4,000.00 85 340,000 840,000
Allocation for pipe racks (approx 800 ft) and cable racks
t 80 -- -- 2,500 200,000 17.00 105 142,800 342,800
Allocation for sheet piling and dewatering lot 1 -- -- 500,000 500,000 5,000.00 100 500,000 1,000,000
Allocation for testing pipes lot 1 -- -- -- -- 2,000.00 95 190,000 190,000
Allocation for Tie-Ins to existing condenser's piping
lot 1 -- -- 250,000 250,000 2,000.00 85 170,000 420,000
Allocation for trust blocks lot 1 -- -- 50,000 50,000 500.00 95 47,500 97,500 Backfill for PCCP pipe (reusing excavated material)
m3 14,174 -- -- -- -- 0.04 200 113,392 113,392
Bedding for PCCP pipe m3 2,340 -- -- 25 58,500 0.04 200 18,720 77,220
Bend for PCCP pipe 24" diam (allocation) ea 24 -- -- 3,000 72,000 20.00 95 45,600 117,600
Bend for PCCP pipe 72'' diam (allocation) ea 30 -- -- 18,000 540,000 40.00 95 114,000 654,000
Building architectural (siding, roofing, doors, painting…etc)
ea 2 -- -- 57,500 115,000 690.00 75 103,500 218,500
Butterfly valves 24" c/w allocation for actuator & air lines
ea 8 28,000 224,000 -- -- 50.00 85 34,000 258,000
Butterfly valves 30'' c/w allocation for actuator & air lines
ea 14 30,800 431,200 -- -- 50.00 85 59,500 490,700
Butterfly valves 48" c/w allocation for actuator & air lines
ea 4 46,200 184,800 -- -- 50.00 85 17,000 201,800
Butterfly valves 54'' c/w allocation for actuator & air lines
ea 8 60,900 487,200 -- -- 55.00 85 37,400 524,600
Butterfly valves 72'' c/w allocation for actuator & air lines
ea 12 96,600 1,159,200 -- -- 75.00 85 76,500 1,235,700
Check valves 24" ea 4 40,000 160,000 -- -- 12.00 85 4,080 164,080
Check valves 48'' ea 4 66,000 264,000 -- -- 24.00 85 8,160 272,160 Concrete basin walls (all in) m3 298 -- -- 225 67,050 8.00 75 178,800 245,850
Concrete elevated slabs (all in) m3 322 -- -- 250 80,500 10.00 75 241,500 322,000
Concrete for transformers and oil catch basin (allocation)
m3 200 -- -- 250 50,000 10.00 75 150,000 200,000
Concrete slabs on grade (all in) m3 1,662 -- -- 200 332,400 4.00 75 498,600 831,000
Ductile iron cement pipe 12'' diam. for fire water line
ft 1,600 -- -- 100 160,000 0.60 95 91,200 251,200

MANDALAY GENERATING STATION
H–40 California’s Coastal Power Plants: Alternative Cooling System Analysis
Equipment Bulk material Labor
Description Unit Qty Unit price
($)
Total price
($)
Unit price
($)
Total price
($) Unit
(Mhr) Rate ($)
Total price
($)
Total cost ($)
Excavation and backfill for fire line & make-up (using excavated material for backfill except for bedding)
m3 6,418 -- -- -- -- 0.08 200 102,688 102,688
Excavation for PCCP pipe m3 21,788 -- -- -- -- 0.04 200 174,304 174,304
Fencing around transformers m 50 -- -- 30 1,500 1.00 75 3,750 5,250
Flange for PCCP joints 30'' ea 14 -- -- 2,260 31,640 16.00 95 21,280 52,920
Flange for PCCP joints 72'' ea 16 -- -- 9,860 157,760 25.00 95 38,000 195,760
Foundations for pipe racks and cable racks m3 190 -- -- 250 47,500 8.00 75 114,000 161,500
FRP flange 24" ea 24 -- -- 1,419 34,056 40.00 85 81,600 115,656
FRP flange 30'' ea 42 -- -- 1,679 70,524 50.00 85 178,500 249,024
FRP flange 54'' ea 24 -- -- 5,835 140,038 80.00 85 163,200 303,238
FRP flange 72'' ea 8 -- -- 20,888 167,101 200.00 85 136,000 303,101
FRP pipe 24" diam. ft 600 -- -- 95 56,760 0.30 85 15,300 72,060
FRP pipe 48" diam. ft 160 -- -- 331 52,976 0.70 85 9,520 62,496
FRP pipe 72'' diam. ft 1,400 -- -- 851 1,191,960 1.20 85 142,800 1,334,760
Harness clamp 24" c/w external testable joint ea 80 -- -- 1,715 137,200 14.00 95 106,400 243,600
Harness clamp 72'' c/w internal testable joint ea 190 -- -- 2,440 463,600 18.00 95 324,900 788,500
Joint for FRP pipe 24" diam. ea 20 -- -- 901 18,012 35.00 85 59,500 77,512
Joint for FRP PIPE 48" diam. ea 12 -- -- 1,300 15,600 75.00 85 76,500 92,100
Joint for FRP pipe 72'' diam. ea 45 -- -- 3,122 140,481 200.00 85 765,000 905,481
PCCP pipe 24" dia. For make-up ft 1,500 -- -- 98 147,000 0.50 95 71,250 218,250
PCCP pipe 72'' diam. ft 3,500 -- -- 507 1,774,500 1.30 95 432,250 2,206,750
Riser (FRP pipe 30'' diam X40 ft) ea 14 -- -- 14,603 204,442 100.00 85 119,000 323,442
Structural steel for building t 160 -- -- 2,500 400,000 20.00 105 336,000 736,000
CIVIL / STRUCTURAL / PIPING TOTAL -- -- -- 2,910,400 -- 8,228,101 -- -- 6,653,994 17,792,495
ELECTRICAL -- -- -- -- -- -- -- -- -- -- 4.16 kv cabling feeding MCC's m 1,000 -- -- 75 75,000 0.40 85 34,000 109,000
4.16kV switchgear - 4 breakers ea 1 250,000 250,000 -- -- 150.00 85 12,750 262,750
480 volt cabling feeding MCC's m 500 -- -- 70 35,000 0.40 85 17,000 52,000
480V Switchgear - 1 breaker 3000A ea 2 30,000 60,000 -- -- 80.00 85 13,600 73,600
Allocation for automation and control lot 1 -- -- 500,000 500,000 5,000.00 85 425,000 925,000
Allocation for cable trays and duct banks m 1,000 -- -- 75 75,000 1.00 85 85,000 160,000
Allocation for lighting and lightning protection lot 1 -- -- 75,000 75,000 750.00 85 63,750 138,750

MANDALAY GENERATING STATION
California’s Coastal Power Plants: H–41 Alternative Cooling System Analysis
Equipment Bulk material Labor
Description Unit Qty Unit price
($)
Total price
($)
Unit price
($)
Total price
($) Unit
(Mhr) Rate ($)
Total price
($)
Total cost ($)
Dry Transformer 2MVA xxkV-480V ea 2 100,000 200,000 -- -- 100.00 85 17,000 217,000
Lighting & electrical services for pump house building
ea 2 -- -- 50,000 100,000 500.00 85 85,000 185,000
Local feeder for 1200 HP motor 4160 V (up to MCC)
ea 4 -- -- 40,000 160,000 150.00 85 51,000 211,000
Local feeder for 200 HP motor 460 V (up to MCC) ea 14 -- -- 18,000 252,000 150.00 85 178,500 430,500
Oil Transformer 10/13.33MVA xx-4.16kV ea 2 190,000 380,000 -- -- 150.00 85 25,500 405,500
Primary breaker(xxkV) ea 4 45,000 180,000 -- -- 60.00 85 20,400 200,400
Primary feed cabling (assumed 13.8 kv) m 1,500 -- -- 175 262,500 0.50 85 63,750 326,250
ELECTRICAL TOTAL -- -- -- 1,070,000 -- 1,534,500 -- -- 1,092,250 3,696,750
MECHANICAL -- -- -- -- -- -- -- -- -- --
Allocation for ventilation of buildings ea 2 25,000 50,000 -- -- 250.00 85 42,500 92,500
Cooling tower for unit 1 lot 1 4,000,000 4,000,000 -- -- -- -- -- 4,000,000
Cooling tower for unit 2 lot 1 4,000,000 4,000,000 -- -- -- -- -- 4,000,000 Overhead crane 50 ton in (in pump house) Including additional structure to reduce the span
ea 2 500,000 1,000,000 -- -- 1,000.00 85 170,000 1,170,000
Pump 4160 V 1200 HP ea 4 800,000 3,200,000 -- -- 420.00 85 142,800 3,342,800
MECHANICAL TOTAL -- -- -- 12,250,000 -- 0 -- -- 355,300 12,605,300

MANDALAY GENERATING STATION
H–42 California’s Coastal Power Plants: Alternative Cooling System Analysis
Appendix C. Net Present Cost Calculation
Energy penalty ($) Project
year Capital/start-up
($) O & M
($) Unit 1 Unit 2
Total ($)
Annual discount
factor Present value
($)
0 55,400,000 -- -- -- 55,400,000 1 55,400,000
1 -- 234,360 77,482 84,836 396,678 0.9346 370,735
2 -- 239,047 81,999 89,782 410,828 0.8734 358,817
3 -- 243,828 86,780 95,016 425,624 0.8163 347,437
4 -- 248,705 91,839 100,555 441,099 0.7629 336,514
5 -- 253,679 97,193 106,418 457,290 0.713 326,047
6 -- 258,752 102,859 112,622 474,234 0.6663 315,982
7 -- 263,927 108,856 119,188 491,971 0.6227 306,351
8 -- 269,206 115,202 126,137 510,545 0.582 297,137
9 -- 274,590 121,919 133,490 529,999 0.5439 288,266
10 -- 280,082 129,026 141,273 550,381 0.5083 279,759
11 -- 285,684 136,549 149,509 571,741 0.4751 271,634
12 -- 346,618 144,509 158,225 649,353 0.444 288,313
13 -- 353,551 152,934 167,450 673,935 0.415 279,683
14 -- 360,622 161,850 177,212 699,684 0.3878 271,338
15 -- 367,834 171,286 187,544 726,664 0.3624 263,343
16 -- 375,191 181,272 198,477 754,941 0.3387 255,698
17 -- 382,695 191,841 210,049 784,584 0.3166 248,399
18 -- 390,349 203,025 222,295 815,668 0.2959 241,356
19 -- 398,156 214,861 235,254 848,271 0.2765 234,547
20 -- 406,119 227,388 248,970 882,476 0.2584 228,032
Total 61,209,388