s harris04
DESCRIPTION
S Harris04TRANSCRIPT

Fire Resistance of Epoxy-grouted
Steel Rod Connections in Laminated Veneer Lumber (LVL)
by
Stuart Harris
Supervised by
Professor Andy Buchanan and
Associate Professor Peter Moss
Fire Engineering Research Report 04/7
June 2004
A thesis submitted in partial fulfilment of the requirements for the degree of
Master of Engineering in Fire Engineering
Department of Civil Engineering University of Canterbury
Private Bag 4800 Christchurch, New Zealand
For a full list of reports please visit http://www.civil.canterbury.ac.nz/fire/fe_resrch_reps.html


Page II
Abstract Epoxy-grouted steel rods are becoming increasingly popular for connections in
structural timber in glue-laminated timber (glulam) and laminated veneer lumber
(LVL). This research focuses on the fire resistance of these connections in LVL
timber. These connections have been found to have high strength under service
temperatures, but epoxy is known to soften at relatively low temperatures.
To determine connection performance, an experimental investigation was carried out
on the axial tensile strength of connections that utilised a threaded steel rod bonded
into the timber using two epoxy resins and a composite adhesive. Some specimens
were tested at constant elevated temperatures while similar specimens were tested in
simulated fire conditions under constant load. The three adhesives tested gave
different connection strengths at ambient temperatures and showed different strength
losses at elevated temperatures.

Page III
Acknowledgements Financial support for this project was provided by Carter Holt Harvey Futurebuild and
the Foundation for Research, Science and Technology in the form of an Enterprise
Scholarship and the New Zealand Timber Design Society. Thank you to Hank Bier
and Ross Davison of Carter Holt Harvey for their technical support throughout the
project.
Thank you to my supervisors Andy Buchanan and Peter Moss for their support and
dedication to this project. This project could not have run so smoothly without the
expertise and support of the Civil Engineering technicians. Special thanks to Grant
Dunlop, Russel Peoples, Kevin Wines and Richard Newton.
Adhesives for this project were kindly donated by Hilti Adhesives and Adhesives
Technology. Thank you to Darko Arandjelovic (Hilti) and Chris Timms (Adhesives
Technology) who sadly passed away prior to the completion of this thesis.
A large thank you to my wife, Adie Fortune, for keeping me motivated throughout
and for always supporting me through this research. To Clare-Ann Fortune your
patient proof reading and red pen was enormously appreciated. To my family, the
Fortune family and friends for the light relief when the meltdowns occurred and
encouraging me to keep going.
The photos in section 3 are from the collection of Andy Buchanan, unless noted
otherwise. The original photographers of these photos are unknown.

Page IV
Table of contents Abstract II
Acknowledgements III
List of figures VIII
List of tables XI
1 Introduction 1
2 Objectives 2
2.1 Overall aims 2
2.2 Background 2
2.3 Methods 3
2.3.1 Phase one – cold testing 3
2.3.2 Phase two –oven testing 4
2.3.3 Phase three – furnace testing 4
3 Literature review 5
3.1 Current technology 5
3.1.1 Nailed connections 5
3.1.2 Bolted connections 7
3.1.3 Glued connections 9
3.1.4 Epoxy-grouted steel rod connections 10
3.1.5 Dowelled connections 14
3.2 Fire performance 15
3.2.1 Background 15
3.2.2 Fire resistance of timber and connections 17
3.3 Fire resistance of connections 18
3.3.1 Fire resistance of nailed connections 18
3.3.2 Fire resistance of bolted connections 19
3.3.3 Fire resistance of glued connections 19
3.3.4 Fire resistance of epoxy connections 19
3.4 Summary 21
4 Methodology 22
4.1 Description of LVL 22
4.2 Description of adhesives 23
4.2.1 West System epoxy 23

Page V
4.2.2 RE 500 epoxy resin 24
4.2.3 HY 150 adhesive 25
4.3 Description of steel rods 25
4.4 Preparation of test specimens 26
4.4.1 Screwing of test specimens 26
4.4.2 Gluing of test specimens 27
4.5 Testing equipment 32
4.5.1 Instron testing machine 32
4.5.2 Custom-built testing frame 33
4.5.3 Furnace 37
5 Cold testing 41
5.1 Assembly of specimens 41
5.2 Results 41
5.3 Failure modes 42
5.3.1 Mode 1 failure 42
5.3.2 Mode 2 failure 44
5.3.3 Mode 3 failure 45
5.4 Variations to HY 150 system 46
5.4.1 Increasing surface area 46
5.4.2 Adding a mechanical bond 48
5.4.3 Comparison of HY 150 improvements 51
5.5 Comparison with other testing 52
5.5.1 Van Houtte (2003) 52
5.5.2 Deng (1997) 53
5.6 Conclusions from cold testing 55
6 Oven testing 56
6.1 Setup of tests 56
6.1.1 Time in oven 57
6.1.2 Testing of specimens 58
6.2 Results 59
6.2.1 Failure modes 61
6.3 Cooled tests 67
6.3.1 Failure modes 71

Page VI
6.4 Conclusions 72
7 Furnace testing 74
7.1 Construction of specimens 74
7.2 Testing frame 74
7.2.1 Insulation of test specimen 76
7.3 Charring tests 78
7.4 Results 79
7.4.1 Burning behaviour 80
7.4.2 Time to failure 81
7.5 Failure modes 82
7.5.1 Mode 4 failures 82
7.5.2 Mode 6 failures 83
7.5.3 Mode 7 failures 84
7.6 Comparison with oven testing 85
7.6.1 Displacements during testing 88
7.7 Prediction of fire resistance 95
7.7.1 Rate of charring 95
7.8 Conclusions from furnace testing 98
8 Discussion 100
8.1 Comparison with previous work 100
8.2 Relevance of findings to future construction 101
8.3 Quality control 101
8.4 Selection of adhesives 102
8.4.1 Epoxy resins 102
8.4.2 HY 150 hybrid adhesive 103
8.5 Comparisons with furnace testing 104
8.5.1 Recommissioning of furnace 105
9 Conclusions and recommendations 107
9.1 Summary of testing 107
9.2 Summary of test results 107
9.3 Design recommendations 109
9.4 Recommendations for future research 109
9.5 Overall conclusions 110

Page VII
10 References 112
Appendix 1 Design of custom testing frame 116
Appendix 2 Deflections of custom testing frame 118
Page VIII
List of figures Figure 3.1 Types of portal connections: (a) plywood gusset, (b) steel nailplate, and (c)
epoxy rods with steel hub. Reproduced from Buchanan (2002) 5
Figure 3.2 Plywood gusset plate connection 6
Figure 3.3 Steel gusset plate 7
Figure 3.4 Bolted connection 8
Figure 3.5 Toothed ring connectors (Larsen, 2003) 9
Figure 3.6 Glued portal frame connections (Buchanan and Fairweather, 1993) 9
Figure 3.7 (a) Auckland Education Board classroom detail and (b) Te Awamutu
College gymnasium knee joint detail (Reproduced from McIntosh, 1989) 10
Figure 3.8 Glulam portal frame with steel hub and epoxy-grouted rods 11
Figure 3.9 Steel hub connecting multiple glulam members of the Sydney Olympic
stadium 12
Figure 3.10 Epoxy-grouted steel rod connection in LVL timber (photo by A. van
Houtte) 13
Figure 3.11 LVL connection using self-drilling steel dowels (Scheibmair, 2003) 15
Figure 4.1 Lathe used for drilling test specimens, with drill bit in chuck and test
specimen clamped to tool post. 26
Figure 4.2 Test specimen cast using West System, showing screws, filler and breather
holes. 27
Figure 4.3 Showing the tie wire and nuts used for centring the rods in the holes 28
Figure 4.4 RE 500 specimen with air bubble visible after failure 30
Figure 4.5 Rod fully withdrawn from RE 500 specimen, with many air bubbles (seen
as dark areas) in the resin 30
Figure 4.6 Custom nozzle for preventing air bubbles in RE 500 31
Figure 4.7 Fully removed RE 500 rod, without air bubbles in the resin 32
Figure 4.8 Instron testing machine, with test specimen loaded 33
Figure 4.9 Custom-built test frame with specimen loaded 34
Figure 4.10 Load – deflection plot for test frame comparison, without corrections 36
Figure 4.11 Loading comparison between Instron and custom-built test frame,
including corrections for frame deflection and steel rod elongation 37
Figure 4.12 Custom-built testing frame, with furnace fitted and test specimen loaded
38

Page IX
Figure 4.13 Electrical coil within furnace 38
Figure 5.1 Mode 1 failure in RE 500 specimen 43
Figure 5.2 Mode 2 failure, typical for HY 150 45
Figure 5.3 Mode 3 failure in West System specimen 46
Figure 5.4 Configuration of HY 150 specimen with screws in adhesive 50
Figure 5.5 Comparison of effect of having screws in glue for HY 150 adhesive 51
Figure 5.6 Comparison of predicted and experimental ultimate loads 54
Figure 6.1 Specimen heating curve in oven 58
Figure 6.2 Custom-built testing frame, with oven test specimen loaded 59
Figure 6.3 Oven test results, RE 500 results with air bubbles have been excluded 60
Figure 6.4 Mean oven test results, clearly showing strength decrease with temperature
61
Figure 6.5 Mode 4 failures in RE 500 specimen (left) and West System specimen
(right). These specimens were tested at 100 °C 64
Figure 6.6 Mode 5 failure in a West System specimen 65
Figure 6.7 Exposed failure surface for mode 5 failure 66
Figure 6.8Comparison of RE 500 failure loads at elevated and cooled temperatures 70
Figure 6.9 Comparison of West System failure loads at eleveated and cooled
temperatures 70
Figure 6.10 Comparison of HY 150 failure loads at eleveated and cooled temperatures
71
Figure 7.1 Custom-built testing frame with furnace attached 75
Figure 7.2 Temperature - time plot showing heating of test specimens in furnace. 76
Figure 7.3 Schematic showing location of Kaowool insulation 77
Figure 7.4 Photo showing uncharred end of burnt specimen where protected by
Kaowool insulation. The exposed screws show the extent of timber burnt away77
Figure 7.5 Charring specimens after being cut open. From the left there are two
specimens exposed for 15 minutes, followed by two at 30 minutes and two at 45
minutes. Note that the top layer of specimens are the matching halves to the
lower layer 78
Figure 7.6 Typical load vs. displacement graph for furnace test 80
Figure 7.7 Mode 4 failure in portion of a West System 105 x 105 mm specimen 82
Figure 7.8 Portion of 63 x 63 mm West System specimen showing mode 6 failure 83
Figure 7.9 Extreme case of mode 6 failure, in a 63 x 63 mm HY 150 specimen 84

Page X
Figure 7.10 Portion of 63 x 63 mm RE 500 specimen with split across laminations in
top surface, demonstrating a mode 7 failure 85
Figure 7.11 Comparison of oven and furnace ultimate loads for West System epoxy 86
Figure 7.12 Comparison of oven and furnace ultimate loads for RE 500 86
Figure 7.13 Comparison of oven and furnace ultimate loads for HY 150 87
Figure 7.14 West System displacements recorded during furnace testing 89
Figure 7.15 RE 500 displacements recorded during furnace testing 89
Figure 7.16 HY 150 displacements recorded during furnace testing 90
Figure 7.17 Components of test specimen, for calculation of thermal elongation in
furnace 91
Figure 7.18 Transformed specimen for calculation of thermal elongation 92
Figure 7.19 Comparison of recorded furnace exposures with fire resistance 97
Figure 8.1 Furnace element as built (left) and following severe damage (right) 106
Figure A.1 Elevations of custom testing frame 116

Page XI
List of tables Table 4.1 Design properties for HYSPAN LVL 23
Table 4.2 Test loads for the furnace testing 40
Table 5.1 Comparison of results for cold test specimens 42
Table 5.2 Comparison of shear stress with varying hole geometry 48
Table 5.3 Comparison of HY 150 failure loads 52
Table 6.1 Testing regime for oven heated samples 56
Table 6.2 Failure modes and ultimate loads from oven testing of West System 62
Table 6.3 Failure modes and ultimate loads from oven testing of RE 500 62
Table 6.4 Failure modes and ultimate loads from oven testing of HY 150 63
Table 7.1 Char depths for charring specimens 79
Table 7.2 Time to failure for furnace testing 81
Table 7.3 Calculation of elongation for transformed specimen 92
Table 7.4 Residual sections and depths of char following furnace testing 96
Table 7.5 Results from furnace testing, with calculated fire resistance 98

Page 1
1 Introduction Timber structures in New Zealand are commonly used for low rise residential
dwellings. Another use for which they are suitable is single storey buildings with
large clear spans (e.g. swimming pools, gymnasia and halls). Timber’s light weight
and good strength make it suitable for this type of application.
To achieve large spans, deep sections are needed. Modern forestry does not provide
sawn timber in the dimensions which are required for these spans and so other
methods such as glue laminated timber (glulam), or laminated veneer lumber (LVL)
are typically used to manufacture structural members with large cross-sections.
These timber members carry significant loads and hence connections within these
members need to be very strong. Rigidity is also important for moment resisting
frames, as small rotations at the connections of a large building may give considerable
deflections. Increasingly connections in glulam and, to a lesser extent, LVL are
making use of steel rods epoxy-grouted into the timber. Connections using epoxy-
grouted steel rods provide the strength and rigidity required, but there is uncertainty as
to the fire resistance of these connections.
Heavy timber construction has good fire performance due to its ability to char. This
provides insulation to the inner portion of the member, where strength is retained. Due
to this insulation, heavy timber construction often performs better in fire than
unprotected steel and some concrete structures.
Epoxies are well-suited to connections using glued in rods as they provide a strong,
rigid bond. They are also easy to assemble and as the connection is typically hidden it
has aesthetic appeal. Epoxy has a major potential drawback in structural connections
in that it loses strength at relatively low temperatures.
The effect of heat upon the epoxy-grouted steel rod connection will be investigated in
this research using LVL timber. The objective of this is to determine the fire
resistance of epoxy-grouted steel rod connections in LVL timber. Considerable
research has been undertaken at the University of Canterbury investigating the
performance of epoxy-grouted steel rod connections under cold conditions. This
research is intended to build on that work.


Page 2
2 Objectives
2.1 Overall aims
The primary objective of this research was to quantify and improve the fire resistance
of the epoxy-grouted steel rod connection in LVL timber.
Secondary objectives of this research were:
• To investigate alternative adhesives, with greater fire resistance to use in place
of epoxy resin for grouting steel rods into LVL
• To investigate whether the addition of a mechanical bond would increase the
fire resistance of epoxy-grouted steel rod connections
• To determine the performance of epoxy-grouted steel rod connections in LVL
at constant temperatures
• To determine the performance at ambient temperatures of epoxy-grouted steel
rod connections in LVL which had previously been exposed to high
temperatures
• To determine the behaviour of epoxy-grouted steel rod connections in LVL
when exposed to simulated fire conditions
2.2 Background
LVL is a relatively new high strength structural timber product in New Zealand. To
enable the high strength of LVL to be utilised high strength connections are required.
Epoxy-grouted steel rod connections have been shown to have high strength in LVL
(van Houtte, 2003) and glulam (Deng, 1997 and others) and have been used
successfully in many glulam structures (McIntosh, 1989, Buchanan and Fletcher,
1989). Only limited research has been undertaken in the evaluation of fire resistance
of epoxy-grouted steel rod connections (Barber, 1994).
Carter Holt Harvey Futurebuild has supported this research, both directly and
indirectly through a Bright Futures Enterprise scholarship. Carter Holt are a major
producer of LVL in New Zealand and the development of a fire resistant connection

Page 3
for LVL would enable them to increase the applications for which LVL can be used.
This would result in greater sales for Carter Holt.
Intended outcomes of this research were to determine the fire resistance of the epoxy-
grouted steel rod connection in LVL timber and to assess whether alternative
adhesives are available which could be used in place of the epoxy resin to improve the
fire resistance.
2.3 Methods
There are three distinct phases within the experimental part of this research. Each
phase has its own objectives. Each of these three phases concentrates on one
component of the development and calculation of the fire resistance of connections
using epoxy bars in LVL timber.
2.3.1 Phase one – cold testing
Previous research performed on grouting steel bars inserted into timber has typically
used epoxy resin or polyurethane adhesives. In this research West System, an epoxy
resin proven for this type of connection with glulam timber (Gaunt, 1998) and also in
LVL timber (van Houtte, 2003) was used along with two alternative adhesives. These
alternative adhesives are an epoxy resin (RE 500, by Hilti) and a hybrid urethane
methacrylate/cement adhesive (HY 150, by Hilti).
RE 500 was chosen as it was predicted that it had better strength retention at elevated
temperatures than the West System. HY 150 was chosen as it is used extensively in
industry for grouting steel bars into concrete where fire resistance is required. The
strength of HY 150 as an adhesive in timber was uncertain.
In phase one of testing the performance of the two Hilti adhesives were compared
against the benchmark West System to evaluate their suitability in this connection
system. Comparisons were made between both the ultimate loads and the failure
modes in order to compare the behaviour and strength of the three alternative
adhesives.

Page 4
2.3.2 Phase two –oven testing
It is a well accepted weakness of epoxy resins, especially those cured at room
temperature, that they begin to lose their strength at relatively low temperatures
(Shields, 1984). This phase of testing aimed to provide an evaluation of the strength
of the connections at a range of temperatures using each of the three adhesives.
A second component of this phase of testing investigated the potential post-fire
strength of the connections. Heavy timber construction can often be re-used after a
minor fire, but if the connections are severely damaged then this would require the
structure to be replaced. This research investigates the long-term effects of fire on the
adhesives effectiveness by heating and cooling specimens prior to tensile testing. By
comparing the results from these cooling tests with those established in tests at
ambient temperatures any strength loss as a result of the heating process could be
identified.
2.3.3 Phase three – furnace testing
This phase was an application of phases one and two of the research. In these tests the
connections were held under a constant tensile load while they were exposed to an
external heat flux in a furnace. The objective of these tests was to evaluate the fire
performance of the connection. Quantification of the fire resistance was made by
comparing the results in the test furnace to those achieved burning LVL in a furnace
exposed to the ISO 834 fire by Lane (2004).

Page 5
3 Literature review Public buildings such as swimming pools, halls and gymnasia often call for large clear
spans. Modern timber manufacturing techniques such as creating glued laminated
timber (glulam) and LVL allow for these spans to be achieved, but the high bending
moments generated in moment-resisting frames using these sections make the design
of connections difficult.
The design of these connections becomes further complicated when there is a need for
the connection to have a fire resistance.
3.1 Current technology
There are various technologies currently available in New Zealand for the moment-
resisting connections in large LVL sections in portal frames. Some of the more
common are described in Buchanan (2002) and include nailed gusset plates, steel
gusset plates and epoxied rods with a steel hub. Some of these are shown in Figure 3.1
and are described in sections 3.1.1 through 3.1.5.
Figure 3.1 Types of portal connections: (a) plywood gusset, (b) steel nailplate, and (c) epoxy rods
with steel hub. Reproduced from Buchanan (2002)
3.1.1 Nailed connections
Nailed connections in heavy timber members typically involve sheets of plywood or
steel either side of the intersection of two members. These connections are simple and
are commonly used in portal frame buildings in New Zealand. These plywood sheets
are fixed in place with rows of nails to form a rigid connection, as shown in Figure 3.2
(a) (b) (c)

Page 6
Figure 3.2 Plywood gusset plate connection
Nailed connections using plywood gussets are simple to construct as they do not
require any lining up of holes, or predrilling. They can also be constructed on site
using a pneumatic nail gun. The strength of the gusset plate is limited by the thickness
of the plywood and also by the plywood sheet size (1200 x 2400 mm). Typically this
limits the span of the portal frame to around 20m (Buchanan and Fairweather, 1993).
Design guidance for nailed gusset plates is given by Buchanan (2002).
Steel gusset plates can also be used. These have the advantage over plywood gusset
plates of unrestricted size and thickness. Steel gusset plates are used in a similar
manner to plywood and are attached with rows of nails, as shown in Figure 3.3. As
steel is too hard to nail through, the holes in a steel gusset plate must be pre-drilled
before assembly. Design of steel gusset plates is similar to those for plywood gusset
plates and is also given by Buchanan (2002).
Page 7
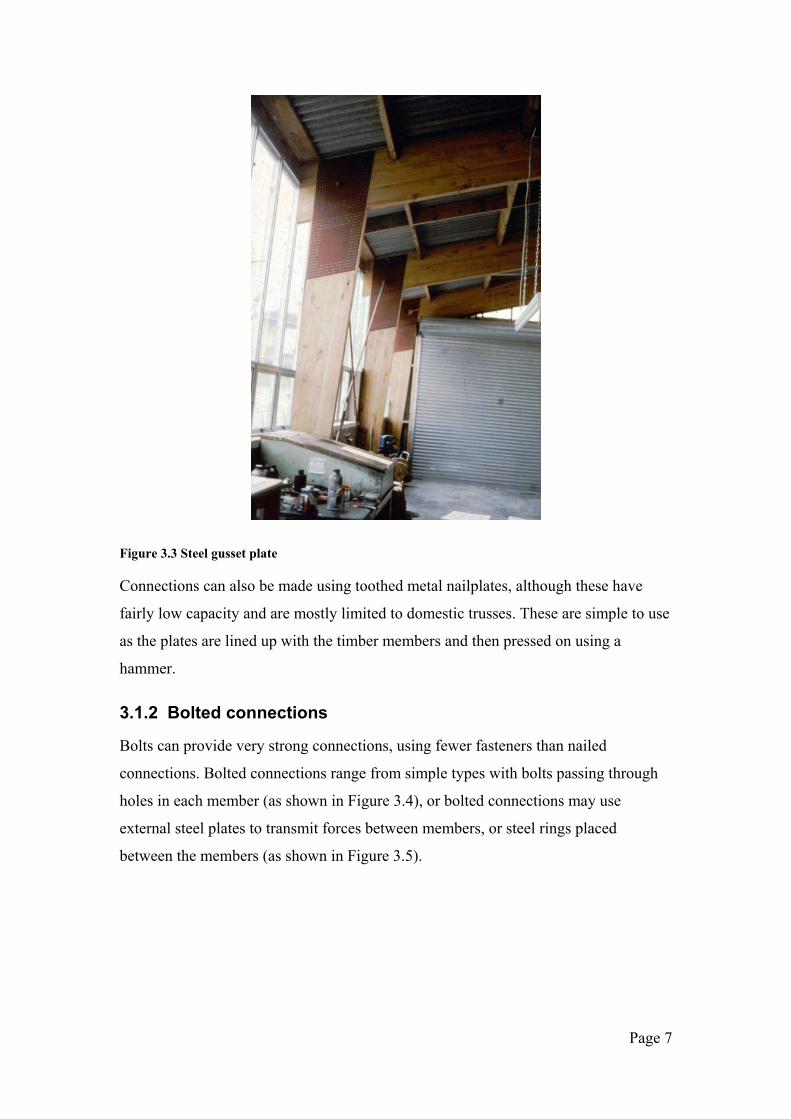
Figure 3.3 Steel gusset plate
Connections can also be made using toothed metal nailplates, although these have
fairly low capacity and are mostly limited to domestic trusses. These are simple to use
as the plates are lined up with the timber members and then pressed on using a
hammer.
3.1.2 Bolted connections
Bolts can provide very strong connections, using fewer fasteners than nailed
connections. Bolted connections range from simple types with bolts passing through
holes in each member (as shown in Figure 3.4), or bolted connections may use
external steel plates to transmit forces between members, or steel rings placed
between the members (as shown in Figure 3.5).

Page 8
Figure 3.4 Bolted connection
Bolted connections typically use slightly oversized holes for ease of construction, but
this reduces their stiffness. The toothed connector plates shown in Figure 3.5 are
sometimes used to increase the strength of the connection by increasing the friction
between the two surfaces (Larsen, 2003).

Page 9
Figure 3.5 Toothed ring connectors (Larsen, 2003)
3.1.3 Glued connections
Glued connections are popular in glulam structures. These connections require strict
quality control and so are required to be fabricated in a factory. These connections do
not provide any ductility, but have very good appearance (Buchanan and Fairweather,
1993).
Two examples of typical glued portal frame connections are shown in Figure 3.6.
Figure 3.6 (a) shows the cross-lapped portal frame joint frequently used by McIntosh
Laminates of Auckland and Figure 3.6 (b) shows a mitred finger joint, which is
commonly used in Europe (Buchanan and Fairweather, 1993).
Figure 3.6 Glued portal frame connections (Buchanan and Fairweather, 1993)
Design procedures for the cross-lapped joint are given by Buchanan (2002).

Page 10
3.1.4 Epoxy-grouted steel rod connections
This research focuses on epoxy-grouted steel rod connections. These have been in use
in New Zealand since the 1960s (McIntosh, 1989). Some of the early examples can be
found in educational buildings with glulam structures built in this period (McIntosh,
1989). Some of these early connections are shown in Figure 3.7.
Figure 3.7 (a) Auckland Education Board classroom detail and (b) Te Awamutu College
gymnasium knee joint detail (Reproduced from McIntosh, 1989)
Epoxy-grouted steel rods are very strong when glued in parallel to the grain of the
timber, but are not as strong when glued perpendicular to the grain, as is the case in
the rafter of Figure 3.7 (a) (Buchanan, 2002). To overcome this problem a steel hub
can be used to connect the members. The use of the hub allows for all of the steel rods
to be grouted in parallel to the grain of the timber, giving the greatest strength. The
steel hub also allows for ductility to be designed into the connection (Buchanan and
Fairweather, 1993). A schematic of this detail is shown in Figure 3.1(c) and a
structure built using this connection is shown in Figure 3.8.
(a) (b)

Page 11
Figure 3.8 Glulam portal frame with steel hub and epoxy-grouted rods
Epoxy-grouted rods (without the use of steel hubs) have the advantage of having no
exposed steel. This is highly advantageous in corrosive environments such as
swimming pool enclosures. Epoxy-grouted rod connections in timber structures have
been used widely to avoid corrosion (Buchanan and Fletcher, 1989).
A more complex version of the steel hub design was used in the construction of the
Sydney Olympic stadium (shown in Figure 3.9). This hub connects steel rods grouted
into the endgrain of multiple heavy timber members to create a large open truss.
Extensive testing of epoxy-grouted steel rod connections in glulam timber was
performed for this project, as reported by Gaunt (1998).

Page 12
Figure 3.9 Steel hub connecting multiple glulam members of the Sydney Olympic stadium
More recent developments in LVL have seen the emergence of a moment resisting
knee joint in LVL without the use of the steel connecting hub (van Houtte, 2003), as
shown in Figure 3.10. This connection by van Houtte also provides a level of fire
resistance to the steel. Having an unseen connection also improves the aesthetics and
allows for clean lines along the structural members.

Page 13
Figure 3.10 Epoxy-grouted steel rod connection in LVL timber (photo by A. van Houtte)
Design guidance for epoxy-grouted steel rod connections is given by Buchanan
(2002). Specific details on the pull-out strengths for different adhesives, rods and
species have been tested and details of these are given in 3.1.4.1.
3.1.4.1 Factors influencing strength of epoxy-grouted steel rods
Epoxy-grouted connections are dependent for their strength on the pullout loads of the
grouted steel rods. These pull-out loads are dependent on many factors, such as the
adhesive type, steel rod type, geometry of embedment and timber species.
Structural glulam and LVL in New Zealand are predominantly constructed from
radiata pine, which removes variations in performance due to species. As timber is a
naturally variable product there will still be some variation between pieces of timber.
Extensive research has been done to verify the impact of varying the depth of
embedment, the diameter of the hole and the type of rod used, such as Deng (1997).
Much of this work is summarised by (Buchanan and Moss, 1999) and is used in the
design guidance given by Buchanan (2002).

Page 14
In New Zealand the most widely used glues for grouted steel rod connections are
epoxy resins, such as the West System (Gaunt, 1998), Araldite 2005 (Buchanan and
Fletcher, 1989) and Nuplex K80 (Buchanan and Moss, 1999).
Adhesive type is important for grouted steel rod connections. Grouted steel rod
connections are typically constructed using epoxy resin, but alternatives have been
investigated. Kemmsies (2000) reported on tests using epoxy resins, polyurethane
adhesives, sealant-adhesives and phenol-resorcinol formaldehyde. From these tests it
was found that the sealant-adhesives were too flexible. This led to poor load carrying
ability and unsatisfactory deformations. Two families of polyurethane adhesives were
tested, one and two-pot varieties. Of these, the one-pot polyurethanes, like the sealant-
adhesives, were found to have low strength and low stiffness. The phenol-resorcinol
formaldehyde tested was modified to be gap filling, but was also found to have low
stiffness. The two-pot polyurethanes and the epoxy resins tested were both found to
have high strength and stiffness. The two-pot polyurethanes were found to be slightly
weaker than the epoxy resins and were found to be prone to reacting with the moisture
in the timber and creating bubbles in the adhesive, which reduced strength. Overall
Kemmsies (2000) found the two-pot polyurethanes had similar characteristics to the
epoxy resins tested. Creep and durability of the bond were not assessed in the study.
The steel rods used in epoxy-grouted steel rod connections must be strong enough to
transmit the forces into the timber. As the epoxy-grouted steel rod connections are
very strong this often requires the use of high strength steel rods (yield strength
680 MPa). Threaded rods have been found favourable over plain and deformed bars,
as their profile allows for a better mechanical bond with the adhesive (Buchanan,
2002).
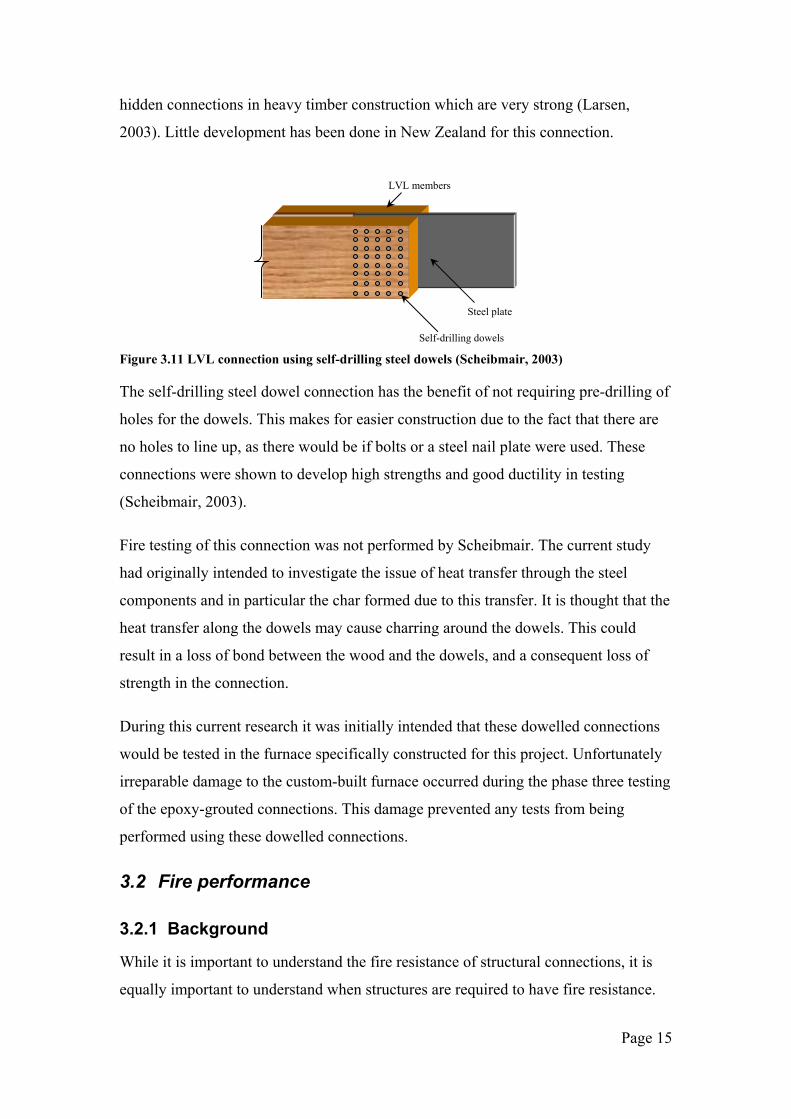
3.1.5 Dowelled connections
Another recent development in New Zealand in the field of connections in LVL
timber includes the self-drilling dowel connection described by Scheibmair (2003).
This connection involves connecting a steel plate between two pieces of LVL, with
the steel plate being fixed using self-drilling steel dowels. This connection is
illustrated in Figure 3.11. Timber connections using self-drilling steel dowels are used
frequently in Europe and other parts of the world (Scheibmair, 2003). These provide
Page 15
hidden connections in heavy timber construction which are very strong (Larsen,
2003). Little development has been done in New Zealand for this connection.
Figure 3.11 LVL connection using self-drilling steel dowels (Scheibmair, 2003)
The self-drilling steel dowel connection has the benefit of not requiring pre-drilling of
holes for the dowels. This makes for easier construction due to the fact that there are
no holes to line up, as there would be if bolts or a steel nail plate were used. These
connections were shown to develop high strengths and good ductility in testing
(Scheibmair, 2003).
Fire testing of this connection was not performed by Scheibmair. The current study
had originally intended to investigate the issue of heat transfer through the steel
components and in particular the char formed due to this transfer. It is thought that the
heat transfer along the dowels may cause charring around the dowels. This could
result in a loss of bond between the wood and the dowels, and a consequent loss of
strength in the connection.
During this current research it was initially intended that these dowelled connections
would be tested in the furnace specifically constructed for this project. Unfortunately
irreparable damage to the custom-built furnace occurred during the phase three testing
of the epoxy-grouted connections. This damage prevented any tests from being
performed using these dowelled connections.
3.2 Fire performance
3.2.1 Background
While it is important to understand the fire resistance of structural connections, it is
equally important to understand when structures are required to have fire resistance.
Self-drilling dowels
Steel plate
LVL members

Page 16
Under the New Zealand Building Code (BIA, 1992) building owners are not required
to protect their own properties from damage by fire. They are, however, required to
prevent fire spreading to neighbouring properties, and to prevent collapse of the
building across the boundary. A building is also required to have sufficient fire
resistance to ensure safe evacuation of the occupants and to allow for Fire Service
intervention for rescue and fire fighting.
Methods of compliance with these requirements are offered by the Acceptable
Solutions to the Building Code (BIA, 2001). Within the Acceptable Solutions, the fire
resistance required of a structure depends upon its use, height and proximity to any
boundaries. If a building is under single ownership, is remote from property
boundaries and is a single level, then no fire resistance ratings are required. Once the
building increases to two levels then a minimum of a 30 minute fire separation is
required between each level. If the building is single level with a mezzanine floor then
the mezzanine floor and its supporting structure are required to have a 15 minute fire
resistance. Where a property is located near a property boundary the fire resistance
rating depends upon the fuel load and ventilation conditions within the building, but
this is typically 30 or 60 minutes.
From these requirements it can be seen that for a single storey building located remote
from property boundaries no fire ratings would be required. Single storey portal frame
buildings are often built using heavy timber construction and sometimes use epoxy-
grouted steel dowel connections. Examples of some timber buildings with epoxy-
grouted steel rod connections are described by Buchanan and Fletcher (1989). In these
buildings fire rating requirements would be minimal, such as Jellie Park swimming
pool (Christchurch), a single storey building remote from property boundaries. In this
building there is a mezzanine floor and its supporting structure would be required to
have a 15/15/15 fire resistance (BIA, 2001). The main portal frames would not be
required to be fire resistant (BIA, 2001). Also, the Aquagym swimming pool
(Christchurch) is single storey, but as one wall is on a property boundary this wall
would be required to be fire resistant. Again, the main portal frames would not require
a fire resistance rating, unless they are providing lateral support to the boundary walls.
Requirements by the building owners and insurers may increase the fire resistance of
the structure above that required by the Acceptable Solutions (BIA, 2001). This may

Page 17
be done to provide a fire separation between tenancies, or to limit the damage to the
building if a fire were to occur.
3.2.2 Fire resistance of timber and connections
All of the connections shown in section 3.1 have been proven through use to have
suitable structural performance. It is also well known that heavy structural timber
sections have good fire resistance and typically perform better than steel and concrete
beams (Jackson and Dhir, 1996). Most of this performance can be attributed to
timber’s ability to char at a predictable rate, the insulative properties of that char and
also that the timber tends not to deform until very near failure.
Research on timber at elevated temperatures has found that beneath the char layer
there is a loss in strength of the remaining section. Green et al. (1999) found that at
50 °C the bending strength of timber can be reduced by between 10 and 25 %
(depending on moisture content) and that the tensile strength can be reduced by
approximately 4 %. Within a timber section exposed to fire temperatures there will be
a zone beneath the char layer where the temperatures will exceed 50 °C. The strength
loss in this zone must be included in any calculations of fire resistance.
Temperature profiles through a timber section are difficult to calculate easily and are
best achieved using finite element numerical methods. For design purposes there are
many simpler techniques for calculating the reduced strength of a timber section.
These methods generally use a specified rate of char to predict the rate at which the
outer layer burns away and then calculate the residual strength based on the remaining
cross-section, with some reductions.
The various techniques for predicting the strength of a heavy timber beam when
exposed to fire are described by Buchanan (2001). This includes the method used in
New Zealand where for radiata pine a charring rate of 0.65 mm/min is used, with
additional charring at the corners. This method ignores any reduction in strength due
to heat affected timber beneath the char, with the residual section capacity being
calculated using the full strength of timber beneath the char layer (Buchanan, 2002).
Other methods used include the effective cross-section method, where a layer of zero
strength timber (typically 7 mm, but varies between codes) below the char layer is

Page 18
excluded from the strength calculation to account for the heat-affected timber below
the char layer. Another alternative method to account for the loss in strength due to
increased temperature is the reduced properties method. This method takes all of the
residual section below the char layer as being at a reduced strength (Buchanan, 2001).
Where fire resistance is required, under the New Zealand loadings code (SNZ, 1992)
the structure is required to carry a load lower than that for cold conditions. For
ultimate limit state conditions a typical load combination is 1.2G & 1.6Q, where G is
dead load and Q is live load. Under fire conditions the structure is required to carry
only G & Qu, where Qu is the live load at ultimate limit state, which, for a roof, is
zero. These lower loads must then be carried by the reduced section size calculated
based on the anticipated duration of the fire, as described above.
It has been observed that the charring rate of solid timber is highly dependent upon
the moisture content of the timber, the density and to a lesser extent the species
(White and Dietenberger, 1999). For radiata pine the New Zealand standard (SNZ,
1993) gives this charring rate as 0.65 mm per minute, based on charring tests on
radiata pine glulam (Buchanan, 2002). Research has shown that solid timber and
glulam char at similar rates (Buchanan, 2002). Recent work by Lane et al. (2004) has
shown that the radiata pine LVL used in this research project chars at 0.71 mm/min.
3.3 Fire resistance of connections
It is well known that a structure is only as strong as its weakest link. A timber beam
can be designed to withstand major fire, but if the connections cannot maintain their
strength at elevated temperatures then the structure will collapse.
3.3.1 Fire resistance of nailed connections
The fire resistance of nailed gusset plate connections relies predominantly on the fire
performance of the gusset plate. Provided that the nails are long enough to remain
embedded in solid timber it will typically be the loss of strength in a steel gusset plate,
or the excessive charring of a timber gusset plate which will lead to collapse.
Tests on steel and plywood gusset plates were performed by Chinniah (1989) and are
summarised by Buchanan and King (1991). Tests were performed on 5 mm steel
gusset plates and 19 mm plywood gusset plates and used a variety of gypsum plaster

Page 19
boards and intumescent coatings for fire resistance. It was found that with similar
levels of protection the plywood gusset plates had around twice the fire resistance of
their steel counterparts (Chinniah, 1989). Using gypsum plaster board for protection
of the connection it was found that the fire resistance of the connection was able to
exceed that of the member (Buchanan and King, 1991).
An in-depth study into the performance of nailed connections was undertaken by
Noren (1996). This study investigated the failure modes and load carrying capacity of
nails when exposed to fire conditions. It was found that for load ratios of around 0.3
in unprotected nailed gusset connections that a 15 minute fire resistance could be
achieved.
Fire resistance of punched nail plates is poor, as the metal is exposed and the teeth of
the nail plates are not buried very deep into the timber. This means that the nail plate
will heat very quickly and as the timber begins to char the nail plates will be quickly
attached to only the char layer. Tests reported by Carling (1989) indicate fire
resistance for a given nail plate of 8 minutes.
3.3.2 Fire resistance of bolted connections
Fire resistance of bolted connections requires external protection to prevent the bolts
from being heated. This can be achieved by recessing the heads of the bolts to the
depth of the expected char layer and then providing wood plugs to cover the bolt
heads (Buchanan, 2001).
3.3.3 Fire resistance of glued connections
Glued connections will behave similarly as for solid timber, provided that the glue is
able to withstand the high temperatures. Glued connections bonded with
thermosetting adhesives such as resorcinol or melamine adhesives will behave well
(Buchanan, 1999). If the connection is bonded with epoxy, or other thermoplastic
adhesives it is likely the connection will lose strength at much lower temperatures.
3.3.4 Fire resistance of epoxy connections
Fire resistance of epoxy-grouted dowel connections is largely dependent upon two
factors. One of these is the performance of the epoxy at elevated temperatures and the
other is the insulative properties of the timber which is protecting the epoxy.

Page 20
The insulative properties of the timber are a function of the thickness of the timber
surrounding the connection. Thus, if additional insulation is required then it is a
matter of increasing the thickness of timber surrounding the joint, or drilling the holes
in a deeper part of the cross-section.
Temperature dependent behaviour of the epoxy is a function primarily of the type of
adhesive being used. Epoxy resins are typically altered by changing the fillers added
to them. Some of these fillers can improve handling characteristics and others can
improve the high temperature performance (Harrison, 1986). One major drawback of
fillers that increase performance at high temperatures is that they require curing at
temperatures of around 120 – 150 °C.
One-pot epoxy systems are also available. Drawbacks of the one-pot systems are that
they are heat cured and are unable to withstand sustained loading (Wilson, 1986). In
epoxy-grouted steel rod connections there are substantial loads applied to the adhesive
through the steel rods and the low strength of the one-pot epoxy makes it unsuitable.
Heat curing of epoxy is not feasible for grouted rod connections. Development of high
temperature epoxies has focussed largely on the automotive industry where large
ovens are used for curing paint finishes and can easily be used for curing epoxy
(Harrison, 1986). Typically, for timber construction, the specimens can be up to 12 m
in length (typical limit for transportation) and ovens of this size are not readily
available. Heat curing would also not be possible if these joints were to be cast on
site.
Very little research has been performed on the fire resistance of epoxy-grouted steel
rod connections. Barber (1994) undertook a series of tests with steel rods grouted into
glulam timber using West System epoxy resin heated in an oven and also in a standard
furnace. These furnace tests indicated that that strength of the epoxy begins to reduce
at 50 °C and that by 70 °C it had lost most of its strength.
Comparisons of the oven tests and the furnace tests by Barber (1994) found that for a
given temperature in the furnace, a specimen heated in the oven could carry
significantly higher load. This indicates that heating epoxy-grouted steel rod
connections in a furnace under constant load is a more severe test than heating
specimens in an oven and then removing them before subjecting them to a tensile test.
Page 21
This disparity was also found by Spieth (2002), who performed similar tests to
Barber, but using steel rods grouted into concrete. Neither author could provide a
substantial argument for why this difference occurred.
3.4 Summary
Fire resistance of heavy timber sections is very good; however connections can be a
weak point. Connections for these members can often contain epoxy-grouted steel
rods as they perform well structurally. Epoxy does, however, lose strength at
relatively low temperatures. The effect that this has on the epoxy-grouted connection
in LVL timber will be investigated, with the intention of predicting its fire resistance.

Page 22
4 Methodology This section provides an overview of the materials used for the construction of test
specimens, as well as the testing machines used in this research. Details of the
preparation of the specimens are also given.
4.1 Description of LVL
The laminated veneer lumber (LVL) used in this project was supplied by Carter Holt
Harvey (CHH) and was produced at their Marsden Point mill in Northland, New
Zealand.
The LVL used for all of the cold and oven testing was 105 mm thick. This thickness is
not typically available on the New Zealand market but was an export product destined
for the Japanese market.
Although this product was not branded as HYSPAN (a brand used only in New
Zealand) it was manufactured to the same specifications as HYSPAN (R. Davison,
pers. comm.). In the furnace testing two thicknesses of LVL were used, the 105 mm
thick material described above and also 63 mm thick HYSPAN, a typically available
product on the New Zealand market.
Although LVL possesses a lower coefficient of variation than sawn timber (CHH,
2000), efforts were made to reduce variability. To achieve this the test specimens
were cut from as few pieces of timber as possible. Design properties of the HYSPAN
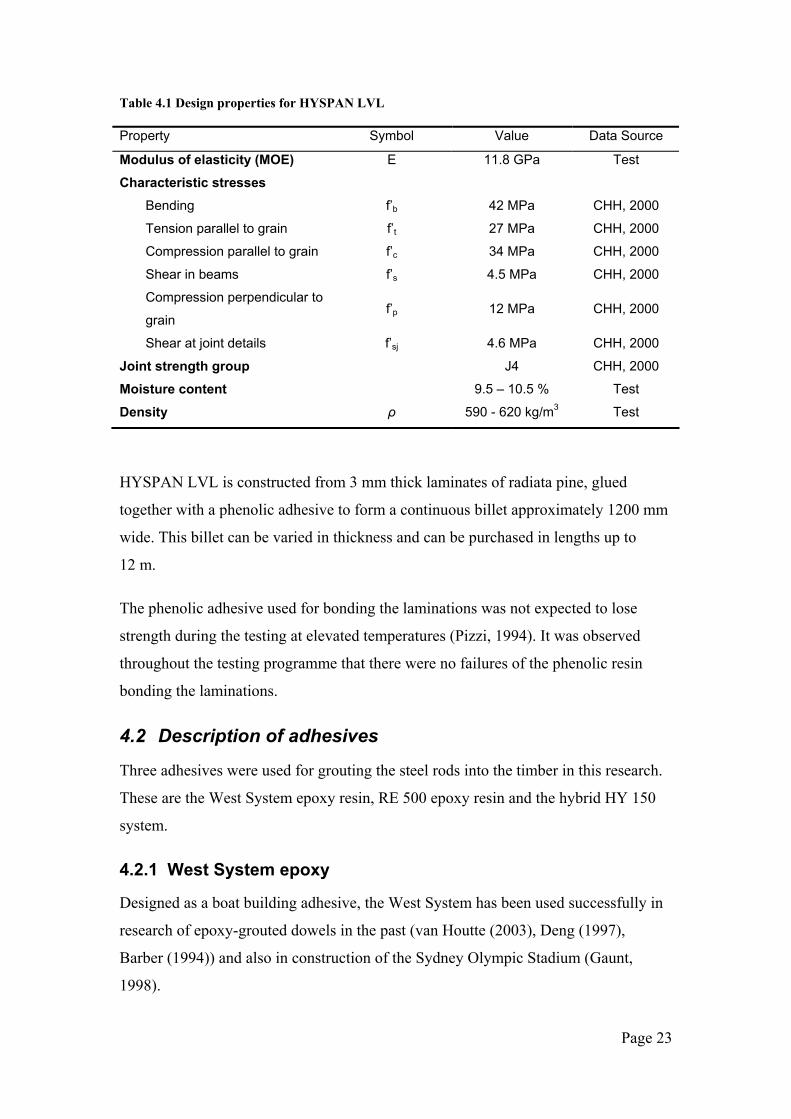
LVL used in this project are shown in Table 4.1. Some of these properties are the
tabulated values for HYSPAN LVL and others were tested as part of this research.
Page 23
Table 4.1 Design properties for HYSPAN LVL
Property Symbol Value Data Source
Modulus of elasticity (MOE) E 11.8 GPa Test
Characteristic stresses
Bending f’b 42 MPa CHH, 2000
Tension parallel to grain f’t 27 MPa CHH, 2000
Compression parallel to grain f’c 34 MPa CHH, 2000
Shear in beams f’s 4.5 MPa CHH, 2000
Compression perpendicular to
grain f’p 12 MPa CHH, 2000
Shear at joint details f’sj 4.6 MPa CHH, 2000
Joint strength group J4 CHH, 2000
Moisture content 9.5 – 10.5 % Test
Density ρ 590 - 620 kg/m3 Test
HYSPAN LVL is constructed from 3 mm thick laminates of radiata pine, glued
together with a phenolic adhesive to form a continuous billet approximately 1200 mm
wide. This billet can be varied in thickness and can be purchased in lengths up to
12 m.
The phenolic adhesive used for bonding the laminations was not expected to lose
strength during the testing at elevated temperatures (Pizzi, 1994). It was observed
throughout the testing programme that there were no failures of the phenolic resin
bonding the laminations.
4.2 Description of adhesives
Three adhesives were used for grouting the steel rods into the timber in this research.
These are the West System epoxy resin, RE 500 epoxy resin and the hybrid HY 150
system.
4.2.1 West System epoxy
Designed as a boat building adhesive, the West System has been used successfully in
research of epoxy-grouted dowels in the past (van Houtte (2003), Deng (1997),
Barber (1994)) and also in construction of the Sydney Olympic Stadium (Gaunt,
1998).

Page 24
This epoxy was supplied as a resin (ADR 310) and hardener (ADH 26) and was
mixed by hand. To ensure that the 100:13 (by weight) resin to hardener ratio was
followed accurately digital scales were used. All epoxy was mixed in small batches to
ensure that it was able to be used within its gel time.
West System has low viscosity when mixed. For injecting into the specimens the
epoxy was mixed and then poured into caulking tubes. These tubes could then be
loaded into a caulking gun to enable injection into the test specimens.
Heat distortion temperature (HDT), also known as the glass transition temperature,
was a critical characteristic of epoxy resins when evaluating performance at elevated
temperatures. West System is specified as having a heat distortion temperature of
60 °C (Adhesive Technologies, 1992). This is the temperature at which the epoxy
transitions from behaving a solid to behaving as a rubbery liquid. The HDT of an
epoxy is measured by immersing a solid bar of cured epoxy into an oil bath. Supports
are provided at each end of the test specimen and a weight is placed at midspan. The
temperature is increased in the oil bath at a rate of 2 °C until the midspan deflection in
the bar reaches 0.25 mm. The temperature at which this deflection occurs is the HDT
of the epoxy (Lee and Neville, 1957).
4.2.2 RE 500 epoxy resin
Produced by Hilti Adhesives, the RE 500 is primarily intended for use where high
strength is required for grouting steel bars into concrete. This product was supplied in
a two-pack cartridge and dispensed using the Hilti MD 2000 dispensing gun. This gun
was designed to hold the cartridge and feed both components into the nozzle at the
appropriate ratios. Within the nozzle there is a spiral to mix the two components
together so that the adhesive emerging from the nozzle is fully mixed.
RE 500 does not have a specified HDT. It does have a recommended maximum
service temperature of 50 °C (D. Arandjelovic, pers. comm.). This service temperature
is the HDT, with an unspecified safety factor. It was also stated that the full strength
of the epoxy can be expected up to temperatures of 43 °C.

Page 25
4.2.3 HY 150 adhesive
HY 150 is also produced by Hilti Adhesives and is intended for grouting steel rods
into concrete where moderate strength and a fire rating are required. It was expected
that being cement based HY 150 would not bond to timber as well as the epoxy resins.
This product was included in this research because of its good performance under fire
conditions.
HY 150 is formulated as a hybrid of urethane methacrylate and cement. Like the
RE 500 it is sold in a 2 pack cartridge and is dispensed using the MD 2000 gun.
In concrete the HY 150 has a lower design strength than the RE 500, so it was
expected that the ultimate loads achieved in timber using the HY 150 would not be as
great as those for the RE 500. This was supported by the design data. The design data
stated that the design tensile load for a 16 mm reinforcing bar, grouted 170 mm into
concrete, was tabulated as 78 kN for RE 500 and 13 kN for the HY 150 (Hilti, 2002).
As with the RE 500, the HY 150 does not have a specified HDT, only a recommended
maximum service temperature. For HY 150 this recommended maximum is 60 °C
(D. Arandjelovic, pers. comm.).
4.3 Description of steel rods
During all of the testing the rods used were M16 threaded steel rods in two grades.
Grade 8.8 steel rods were used for the test specimens with higher expected failure
loads and mild steel rods were used for those with lower expected failure loads.
Grade 8.8 steel rods have a tabulated yield stress of 680 MPa and ultimate stress of
830 MPa. This is compared with a tabulated yield stress of 300 MPa and ultimate
stress of 350 MPa for the mild steel bars. This gives a theoretical yield load of 137 kN
for the M16 grade 8.8 bars and 60 kN for the M16 mild steel bars.
All of the threaded rods used in this testing were purchased from Blacks Fasteners of
Christchurch. They were purchased in 1 m lengths and cut to length in the workshop.
The rods were all zinc plated. No surface preparation was undertaken to improve the
bond with the adhesives, as it is unlikely that this could be done reliably during
construction of a building, and it is not necessary due to the excellent mechanical
bond between the epoxy and the threaded bars.

Page 26
4.4 Preparation of test specimens
All test specimens used in this research were produced from sheets of either 105, or
63 mm thick HYSPAN LVL. A table saw was used to cut the test specimens to the
required widths and lengths.
Boring of the embedment holes was conducted on a metal-working lathe. Depending
on the test, either a 20, 24 or 28 mm hole was bored, to a depth of either 300 or
395 mm.
The test specimens were clamped to a piece of steel angle section fixed to the tool
post and the auger drill bit was placed in the chuck, as shown in Figure 4.1. Using the
lathe to bore the holes allowed greater precision in the location, angle and depth of the
holes. Holes were drilled with standard wood-drilling auger bits, which allowed holes
up to 395 mm deep to be bored.
Figure 4.1 Lathe used for drilling test specimens, with drill bit in chuck and test specimen
clamped to tool post.
4.4.1 Screwing of test specimens
For test specimens where screws were included to prevent splitting between the
laminations, these were placed as shown in Figure 4.2. Screws used for this purpose
were 14 gauge countersunk self-tapping screws, 100 mm in length. These screws were

Page 27
threaded over the entire length of their shank. These screws were placed either side of
the grouted steel rod, as shown in Figure 4.2, with 8 screws used per test specimen.
4.4.2 Gluing of test specimens
Prior to the gluing, the holes in the test specimens were cleaned of loose debris using
compressed air, to ensure that the adhesive was able to bond to solid timber.
For test specimens cast using the West System epoxy resin, the rods were set in place
and the resin was filled through the side of the test specimen. This required additional
holes to be drilled in the specimen. Resin was injected through the filler hole (refer
Figure 4.2) until it was observed to be coming out through the breather hole.
Figure 4.2 Test specimen cast using West System, showing screws, filler and breather holes.
To keep the rods centralised in the holes while the resin was curing, thin wire was
wrapped around the rod near the tip and also near the beginning of the hole, as shown
on the right in Figure 4.3. Leaks were prevented by sealing around the opening of the
hole with flexible putty, which could be removed after curing was complete.
Protection of the thread from leaked epoxy was provided by wrapping the exposed
portion of the rod with insulation tape.
Filler hole
Breather hole
Screws

Page 28
Figure 4.3 Showing the tie wire and nuts used for centring the rods in the holes
For some of the HY 150 specimens larger, 28 mm diameter holes were used with
16 mm rods. In these test specimens the rods were centred in the holes by the use of
half of an M16 nut, as shown on the left of Figure 4.3. The nuts were split in half to
reduce their volume and hence length of unbonded steel rod.
Test specimens using the Hilti adhesives (RE 500 and HY 150) were cast by injecting
the adhesive into the embedment hole and then inserting the rod. This was the
recommended practice for these adhesives (Hilti, 2002) and it was possible because
the higher viscosity of the Hilti adhesives (when compared to West System) prevents
the resin from running out of the hole.
With the Hilti adhesives it was not necessary to use wire to centre the rods in the holes
(Hilti, 2002). It was found that by spinning the rod slightly during insertion it stayed
aligned in the centre of the hole. Again, insulation tape was used to protect the
exposed threads of the rods from epoxy overflow.
Problems were identified during the oven testing with the RE 500 adhesive. It was
found that air bubbles were being trapped within the RE 500 adhesive. This problem
was overcome by using an attachment to the injection nozzle. This is discussed in
further detail in section 4.4.2.1.

Page 29
All test specimens were cured in ambient laboratory conditions, without additional
heating. Typically, during the period of gluing the temperature varied from 15 –
20 °C. All test specimens were left for a minimum of 24 hours prior to testing, as this
allowed for complete curing of the adhesives.
Test specimens were all prepared with approximately 50 mm of steel rod exposed.
When tested they had additional threaded rod coupled to these with threaded couplers,
machined from 50 mm diameter steel bars. These couplers provided the load capacity
required to transmit the load into the test specimens.
4.4.2.1 Removal of air bubbles from RE 500
Gluing of the RE 500 specimens required a special nozzle to prevent air bubbles being
included in the cured resin. In specimens glued without this nozzle sometimes air
bubbles were trapped, in these areas there was no adhesive to transfer load from the
steel rod into the timber. Air bubbles were undetectable in completed test specimens
prior to testing.
Upon failure of test specimens with air bubbles, these bubbles were clearly visible, as
seen in Figure 4.4. In some specimens the rods were fully removed from the test
specimen for inspection and the air bubbles can be clearly, as in Figure 4.5.

Page 30
Figure 4.4 RE 500 specimen with air bubble visible after failure
Figure 4.5 Rod fully withdrawn from RE 500 specimen, with many air bubbles (seen as dark
areas) in the resin
As the presence of air bubbles has a significant impact upon the ultimate load of the
specimen it was very important that the problem be dealt with correctly and in a
manner that provided consistent results.
When the Hilti resins are used in Europe for rods with long embedment a special
nozzle is required (D. Arandjelovic, pers. comm.) to prevent air being mixed into the

Page 31
resin during gluing. Although these nozzles are mandatory in Europe, they are not
available in New Zealand. To overcome the lack of availability a custom-made
solution was prepared as shown in Figure 4.6. This nozzle consists of the standard
injecting nozzle, with the supplied extension fitted. Fitted around the tip of the
extension was a sleeve of plastic, which fitted tightly around the extension. The outer
diameter was slightly smaller than the 20mm diameter of the hole in the timber.
Figure 4.6 Custom nozzle for preventing air bubbles in RE 500
When the hole is being filled with resin the nozzle is initially inserted to the bottom of
the hole. As the resin is pumped into the hole it presses onto the sleeve and forces the
nozzle back out of the timber. This leaves only resin (with no air bubbles) in the
bottom of the hole. Once the required quantity of resin is injected the nozzle is
removed and the rod is inserted. The pressure of the rod being forced in squeezes the
resin towards the edge of the hole, but does not force air down into the hole.
This nozzle was found to be successful, with additional test specimens giving higher
and more consistent ultimate loads. This method was used for most of the RE 500
samples in this research. Using this gluing method removed the air bubbles
completely, as can be seen in a rod cast using this technique in Figure 4.7. It can be
seen that none of the epoxy was visible as there was bonding to the timber over the
complete length of the rod.

Page 32
Figure 4.7 Fully removed RE 500 rod, without air bubbles in the resin
4.5 Testing equipment
All testing carried out in the three phases of this research involved tensile testing of
specimens. Although the loading conditions were the same for all of the tests, the
application of heat provided varying requirements for the testing equipment.
4.5.1 Instron testing machine
The cold tensile testing was performed in the Instron Testing Machine located in the
Model Structures laboratory in the Civil Engineering Department at the University of
Canterbury. This equipment has a capacity of 1000 kN, so was suited to the
anticipated load range of 100 – 150 kN for these tests.
Load was applied at a constant rate of displacement by means of screw feeds. These
screws, located within the vertical portions of the machine control the movement of
the cross-head.

Page 33
Figure 4.8 Instron testing machine, with test specimen loaded
Figure 4.8 shows the specimen, loaded in the vertical position ready for testing. The
cylinder located above the test specimen is the load cell, which feeds directly to the
data logger. There was also a potentiometer recording the elongation of the test
specimen, fixed to the body of the test machine (obscured in Figure 4.8) to measure
the movement of the cross-head during testing.
Calibration of the load cell was carried out using the Avery testing machine in the
main structures lab at the University of Canterbury.
4.5.2 Custom-built testing frame
A testing frame was custom-built for use in this research and was used to perform
tensile tests on timber specimens with grouted in steel rods. It was also fitted with a
furnace for phase three of this research.
The custom test frame (without the furnace) was used during phase two of this
research, where specimens were heated in an oven and then removed and tested (as
seen in Figure 4.9). It was used during this phase of testing as it was able to be
Screw feeds
inside here
Cross-head

Page 34
positioned much closer to the oven than the alternative testing machines, reducing the
amount of cooling of heated specimens.
Figure 4.9 Custom-built test frame with specimen loaded
4.5.2.1 Strength of testing frame
The testing frame was designed to be able to break the strongest expected test
specimen in this research. As all test specimens were constructed using 16 mm steel
bars and the specimens cannot be stronger than the bar, the frame was designed to
break a high strength 16 mm steel bar in tension.
The ultimate stress for grade 8.8 steel is 830 MPa. A 16 mm grade 8.8 steel bar has an
ultimate load of 170 kN. The frame was designed with section sizes chosen to
withstand the 170 kN tensile force without failing. The frame was not designed for
deflection, as the deflection in these tests was not critical. Deflections of the frame
were minimal; these were calculated and subtracted from the recorded elongations
after completion of testing.
Details of the strength calculations for the frame can be found in appendix 1 to this
report.
Page 35
4.5.2.2 Calibration
It was critical to ensure that results achieved within the custom-built test frame were
consistent with those achieved in the Instron machine.
Both the Instron and the custom-built testing frame measured the load on test
specimens through a load cell attached to one end of the specimen. Both of the load
cells for the testing frames were calibrated in the same Avery testing machine.
Verification of this calibration and also of the loading regime between the Instron and
the testing frame was conducted by means of replicating identical tests and checking
for consistent results.
The Instron testing machine was used to conduct the cold testing of the test specimens
and the custom-built frame was used for the oven and furnace components of this
research. Used in this series of calibration tests were matched samples of West
System resin, in a 105 x 105 mm test specimen, 900 mm long, with a 16 mm steel rod
embedded 300 mm. Two of these specimens were tested in the Instron testing
machine and two were tested in the custom-built testing frame. This was to ensure that
not only the loads, but also the behaviours, such as deflection and failure modes, were
consistent between the Instron and the testing frame.
The raw load deflection plots for the Instron testing machine and the custom testing
frame are shown in Figure 4.10. It can be seen from this that although the ultimate
loads were similar, that the deflections are different. This is due to two factors, the
different rigidity of the Instron and the testing frame and also the length of the
exposed steel rod over which the extensions were measured.

Page 36
0
20
40
60
80
100
120
140
160
0 5 10 15 20 25 30
Deflection (mm)
Load
(kN
) Instron 9Instron 10Custom 21Custom 22
Figure 4.10 Load – deflection plot for test frame comparison, without corrections
It can be observed in Figure 4.10 that the recorded deflections in the custom built
testing frame are much larger than in the Instron. This is due to the deflection in the
reaction frame in the Instron being negligible, whereas the deflections of the custom-
built testing frame amount to around 2.1 mm at 100 kN. Also critical was that in the
custom-built testing frame the anchor points for the ends of the samples are further
apart. This means that there was more threaded rod loaded and hence more elongation
was recorded.
The deflections due to the additional steel rod and the deflections of the testing frame
have been calculated and subtracted from those recorded in the custom-built testing
frame. The corrected comparison is shown in Figure 4.11. It can be seen that the
difference in deflection between the Instron and the custom-built testing frame
amounts to approximately 0.3 mm at 100 kN. This difference is evident in Figure
4.11.

Page 37
0
20
40
60
80
100
120
140
160
0 5 10 15 20 25 30
Deflection (mm)
Load
(kN
) Instron 9Instron 10Custom 21Custom 22
Figure 4.11 Loading comparison between Instron and custom-built test frame, including
corrections for frame deflection and steel rod elongation
Details of these calculations for frame deflection can be found in appendix 2 to this
report.
Overall, the loading curves between the Instron and the custom-built testing frame
were seen to be consistent, providing that the displacement of the custom-built frame
was accounted for.
4.5.3 Furnace
A custom-built testing frame with furnace was required for the furnace testing phase
of this research. This testing frame was designed to allow a specimen to be held under
a constant load while a heat flux was applied to the surface of the surface of the test
specimen. This is the same testing frame used in the oven testing of the specimens,
but with the addition of an electric furnace heater, as seen in Figure 4.12. During this
phase of the research the test specimens were held under a constant tensile load while
a heat flux was applied.

Page 38
Figure 4.12 Custom-built testing frame, with furnace fitted and test specimen loaded
This cylindrical furnace was constructed from an outer stainless steel skin, with
100 mm of Kaowool mineral insulation and a stainless steel inner skin. An electrical
element was fixed to the inner skin of the furnace. The element consisted of a 5.5 kW
3.65 mm diameter kanthal aluminium electrical coil, which was fixed to the inner skin
in a spiral with porcelain insulators, as seen in Figure 4.13.
Figure 4.13 Electrical coil within furnace

Page 39
As the coil consisted of a solid wire the surface of the element was electrically live, so
it was not possible to attach a thermocouple as it would conduct current from the coil
into the data logger. This prevented the element from being connected to a thermostat.
Instead, the element was set at a constant level of electrical current, which gave a
constant rate of energy into the system during the testing. Consequently, the test
specimens were not exposed to a constant heat flux as they would have been if heated
in a cone calorimeter.
4.5.3.1 Load applied during furnace tests
The load applied to the specimens during testing was intended to be indicative of the
design load for this connection under fire conditions. Under the New Zealand
Loadings Code (SNZ, 1992) a connection within a timber portal frame would
typically be designed for the most severe loading combination of 1.2G & 1.6Q or
1.2G & S, where G is gravity load, Q is live load and S is snow load. As timber portal
frame structures are lightweight the earthquake case is typically not critical.
For stability during fire the connections are be required to withstand the lesser load
combination of G & Qu, where Qu is the ultimate limit state live load (zero for roofs).
The actual values of G, Q and S are dependent upon the design of the structure and its
location. Typically the ratio of the fire design loads to cold design case is around 0.3.
The design strength of the connection is not the average of the test results, but is a
dependable strength of the connection. Typically this would be a lower fifth percentile
value. As the testing involved in this research did not contain enough tests to
accurately construct a distribution, the design strength has been taken to be 70% of the
average failure load at ambient temperature.
The average cold failure loads for each of the three adhesives are shown in Table 4.2.
As discussed above, the design strength was 70% of the average failure load and the
test load was 30% of the average design load.

Page 40
Table 4.2 Test loads for the furnace testing
Adhesive Bar Grade
Average
Failure Load
(KN)
Design
Strength (KN)
30% of
Design (KN)
Test Load
(KN)
RE 500 8.8 129 90.3 27.1 27
West System 8.8 131 91.7 27.5 27
HY 150 Mild 40 28 8.4 8
It can be seen in Table 4.2 that the 30% values for the two epoxy resins are similar.
To allow for more accurate comparisons of data between the two resins the test load
was chosen as 27KN for both types of epoxy. All loads were rounded to the nearest
whole number to make application of the load easier.
During testing the load did reduce, partially due to a slight leak in the seals of the
pump and partly as the test specimen was extending. As the test progressed the load
was constantly monitored and adjusted. Typically the loads did not exceed ± 0.5 kN
during the test until the specimen began to fail.
4.5.3.2 Removal of char from test specimens
Following the conclusion of testing, the layer of char was scraped from the test
specimens to reveal the solid timber beneath. The dimensions of the remaining solid
timber were recorded for each test specimen then from the original dimensions were
deducted to give the depth of char.
This data was used to calculate the equivalent exposure to the ISO 834 heating
regime, as explained in section 7.7.


Page 41
5 Cold testing Cold testing was carried out to compare the performance of the different adhesives
under normal operating temperatures.
Previous tests by van Houtte (2003), Deng (1997), Barber (1994) and others have
used the West System epoxy, but neither of the Hilti adhesives. As the current study
was evaluating the effectiveness of Hilti adhesives it was necessary to determine their
level of performance at ambient temperatures prior to evaluating their strength at
elevated temperatures.
5.1 Assembly of specimens
The test specimens used for this testing were constructed of HYSPAN LVL with a
105 x 105 mm cross-section and a length of 900 mm. All the test specimens had the
grain running in a longitudinal direction. Grade 8.8 (fy = 680MPa) threaded steel rods
were grouted into these holes using one of the three adhesives; HY 150, RE 500, or
West System. Both ends of each specimen were grouted with the same adhesive.
Detailed assembly of the test specimens is described in 4.4.
The base case for the cold tests was a 16mm diameter threaded steel rod, embedded
300mm in a 20mm diameter hole. This was based on the work by van Houtte (2003)
where he found that this geometry gave the best results for testing parallel to the grain
in LVL timber using epoxy resin.
5.2 Results
The failure observed in all of the tests in this series was brittle. Failures of all of the
specimens were observed to be either in the timber, or at the wood/glue interface.
There were no failures of the adhesive or steel rod. Ultimate loads and failure modes
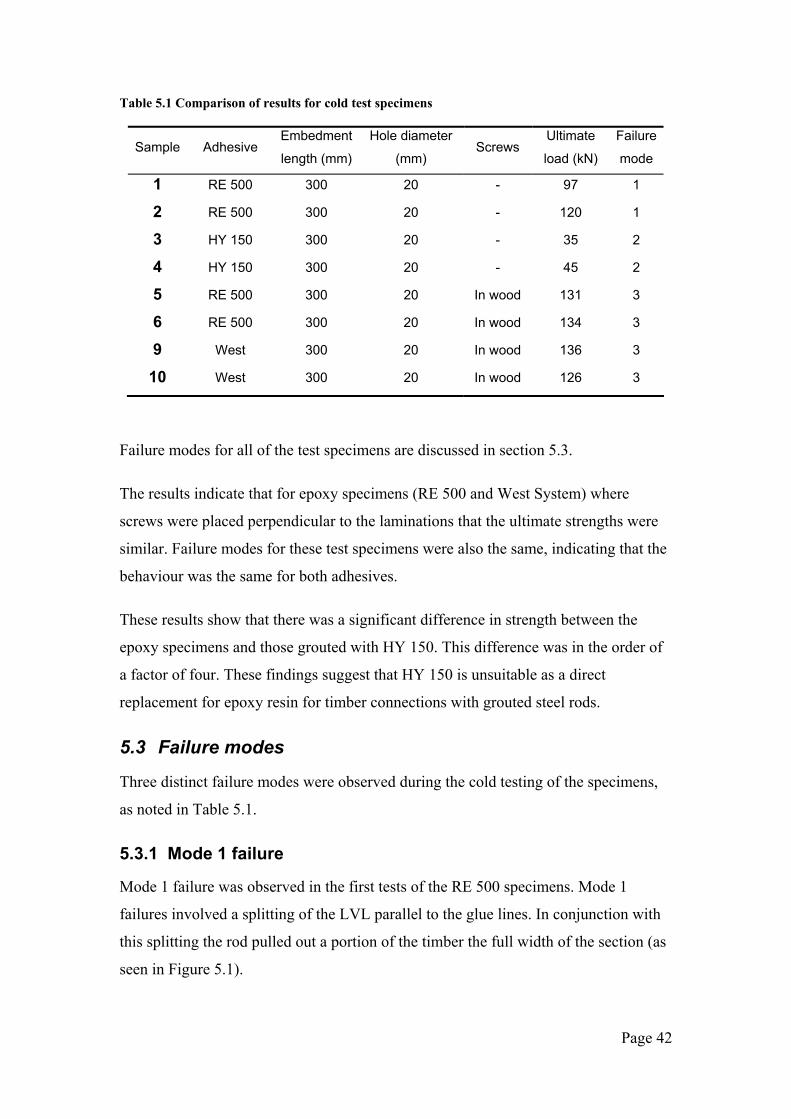
for each of the initial test specimens are shown in Table 5.1.
Page 42
Table 5.1 Comparison of results for cold test specimens
Sample Adhesive Embedment
length (mm)
Hole diameter
(mm) Screws
Ultimate
load (kN)
Failure
mode
1 RE 500 300 20 - 97 1
2 RE 500 300 20 - 120 1
3 HY 150 300 20 - 35 2
4 HY 150 300 20 - 45 2
5 RE 500 300 20 In wood 131 3
6 RE 500 300 20 In wood 134 3
9 West 300 20 In wood 136 3
10 West 300 20 In wood 126 3
Failure modes for all of the test specimens are discussed in section 5.3.
The results indicate that for epoxy specimens (RE 500 and West System) where
screws were placed perpendicular to the laminations that the ultimate strengths were
similar. Failure modes for these test specimens were also the same, indicating that the
behaviour was the same for both adhesives.
These results show that there was a significant difference in strength between the
epoxy specimens and those grouted with HY 150. This difference was in the order of
a factor of four. These findings suggest that HY 150 is unsuitable as a direct
replacement for epoxy resin for timber connections with grouted steel rods.
5.3 Failure modes
Three distinct failure modes were observed during the cold testing of the specimens,
as noted in Table 5.1.
5.3.1 Mode 1 failure
Mode 1 failure was observed in the first tests of the RE 500 specimens. Mode 1
failures involved a splitting of the LVL parallel to the glue lines. In conjunction with
this splitting the rod pulled out a portion of the timber the full width of the section (as
seen in Figure 5.1).

Page 43
Although this failure mode only occurred in the RE 500 specimens it is expected that
it would have occurred had the West System been tested without screws perpendicular
to the lamination, as throughout the testing programme the two epoxies behaved in a
similar manner.
Figure 5.1 Mode 1 failure in RE 500 specimen
Mode 1 failures suggest that there was sufficient bond both between the adhesive and
the rod and between the adhesive and the timber, but that extracting the rod created a
splitting force perpendicular to the laminations. This splitting force was consistent
with results observed by van Houtte (2003) in testing of similar specimens.
Similar observations to this current research and to van Houtte (2003) were recorded
by Buchanan and Moss (1999) in glulam timber. Buchanan and Moss (1999) reported
tests of M20 bars epoxy-grouted into glulam specimens with smaller, M4 rods grouted
perpendicular to the laminations of a specimen for reinforcement. They found that the
reinforcement increased the tensile strength sufficiently to cause the failure to occur at
the anchorage end of the specimen. The anchorage end had twice the embedment
depth, but did not have the transverse reinforcing rods (Buchanan & Moss, 1999).
To prevent mode 1 failures van Houtte (2003) fixed self-tapping screws perpendicular
to the laminates. These screws then act in tension to keep the laminates from splitting
apart and improve the ultimate load of the connection. Based on van Houtte’s

Page 44
research, self-tapping screws were therefore used in the remaining epoxy-grouted
specimens in the current study. The resulting strengths and failure modes are recorded
in Table 5.1.
In van Houtte’s research (2003) he also observed splitting perpendicular to the
laminations. This was observed by van Houtte (2003) in test specimens with screws
perpendicular to the laminations and when the edge distance in the plane of the
laminations was greater than the edge distance perpendicular to the laminations. This
failure mode with cracking across the laminations was not observed during the cold
testing phase of the current research. It was thought to be due to all test specimens
tested in this phase of research having equal edge distances both perpendicular and
parallel to the laminations. It was however, observed in some of the furnace tests of
the current research and was classed as a mode 7 failure.
5.3.2 Mode 2 failure
With the hybrid HY150 adhesive system the behaviour was very different to the
epoxies, with significantly lower ultimate strengths. Failures for the HY150
specimens occurred consistently at the glue/wood interface, with insignificant
amounts of wood being attached to the glue after failure. This failure mode was in
direct contrast to that of the epoxies where the failures were within the wood, with
significant amounts of timber being removed with the rod.
Mode 2 failures occurred only in the HY 150 tests and was the only failure mode
found in tests of the HY 150 system. Figure 5.2 shows this failure mode, with the
withdrawn core of adhesive clearly visible.

Page 45
Figure 5.2 Mode 2 failure, typical for HY 150
Due to the failure of the HY 150 specimens occurring at the wood/glue interface,
there is concern that the failure may lead to durability problems (H. Bier, pers.
comm.). As the failure is at the surface of the glue it demonstrates that the HY 150 did
not penetrate into the timber. Without this penetration the strength of the bond is
highly influenced by changes in the surface of the timber to which it is connected.
Changes such as swelling due to moisture fluctuations could decrease the bond
strength and lead to premature failure.
Under the New Zealand Building Code (BIA, 1992) a connection such as this would
be required to have a service life of not less than 50 years. If it cannot be guaranteed
that it would survive the environmental conditions imposed upon it for 50 years then
it would not be suitable for use. As the durability of the connection is dubious then it
would not meet this requirement without further verification and possible
modification. If it cannot meet this requirement then this adhesive is not able to be
used in this form of structural connection.
5.3.3 Mode 3 failure
Mode 3 failures occurred when the epoxy specimens had screws holding their
laminations together effectively. Mode 3 failures involved the steel rod pulling out of
the test specimen and taking with it a significant amount of timber. In this instance the
timber was found to fail both across and along glue lines and roughly formed an

Page 46
annulus of timber surrounding the steel rod, with a thickness of approximately 5 –
15 mm. An example of a mode 3 failure can be seen clearly in Figure 5.3.
Figure 5.3 Mode 3 failure in West System specimen
5.4 Variations to HY 150 system
Variations were made to the HY 150 configuration originally tested, as it was found
from test specimens 3 and 4 that the pullout strength was considerably lower than that
recorded for epoxy resin. Both specimens 3 and 4 failed at the wood/glue interface
and it was hypothesised that, either if some mechanical bond could be achieved at this
interface, or if the surface area of this interface could be increased then the strength of
the connection would be increased.
These variations included increasing the embedment depth, increasing the diameter of
the embedment hole and also putting screws through the adhesive to provide a
mechanical connection between the adhesive and the wood. Further testing was then
conducted to test these hypotheses.
5.4.1 Increasing surface area
Failure in specimens 3 and 4 failure occurred at the wood/glue interface. From this it
was further hypothesised that there must be a limiting shear stress at which these
failures were occurring. Based on this theory it was postulated that if the thickness of

Page 47
glue surrounding the rod was increased then the ultimate load of the connection
should also increase.
Shear stress along a surface can be calculated using Equation 5.1. In specimens 3 and
4 the steel rod was embedded 300 mm in a 20 mm diameter hole. Ultimate loads for
these test specimens were 35 and 45 kN, giving shear stresses at failure of 1.86 and
2.39 MPa.
AreaForceStress = Equation 5.1
Tests conducted using epoxy resins had an average pullout load of approximately
130 kN. To achieve this load with HY 150 and using 2.10 MPa as the shear stress
limit, using Equation 5.1 the required surface area of the embedment hole is
61.9 x 103 mm2. This was compared to a surface area of 18.8 x 103 mm2 for
specimens 3 and 4. Using this theory, to achieve an ultimate load of 130 kN with
HY 150 would require a 65 mm diameter hole 300 mm deep, or a 50 mm diameter
hole 395 mm deep (the maximum depth achievable with a standard auger bit). Holes
of these diameters however are impractical, as boring a 50, or 65 mm diameter hole to
these depths could not be achieved using a standard auger or spade bit.
To confirm that this theory of a limiting shear stress was accurate the embedment
depth and diameter were increased, although not to the extent calculated above. Two
test specimens were tested with an embedment hole 20 mm in diameter and 395 mm
deep and a further two specimens were tested with a 28 mm embedment hole, 395
deep. Pull-out loads and shear stresses at failure are recorded in Table 5.2. Failure
modes for all of these specimens were as for the original HY 150 tests, with failure at
the wood/glue interface.
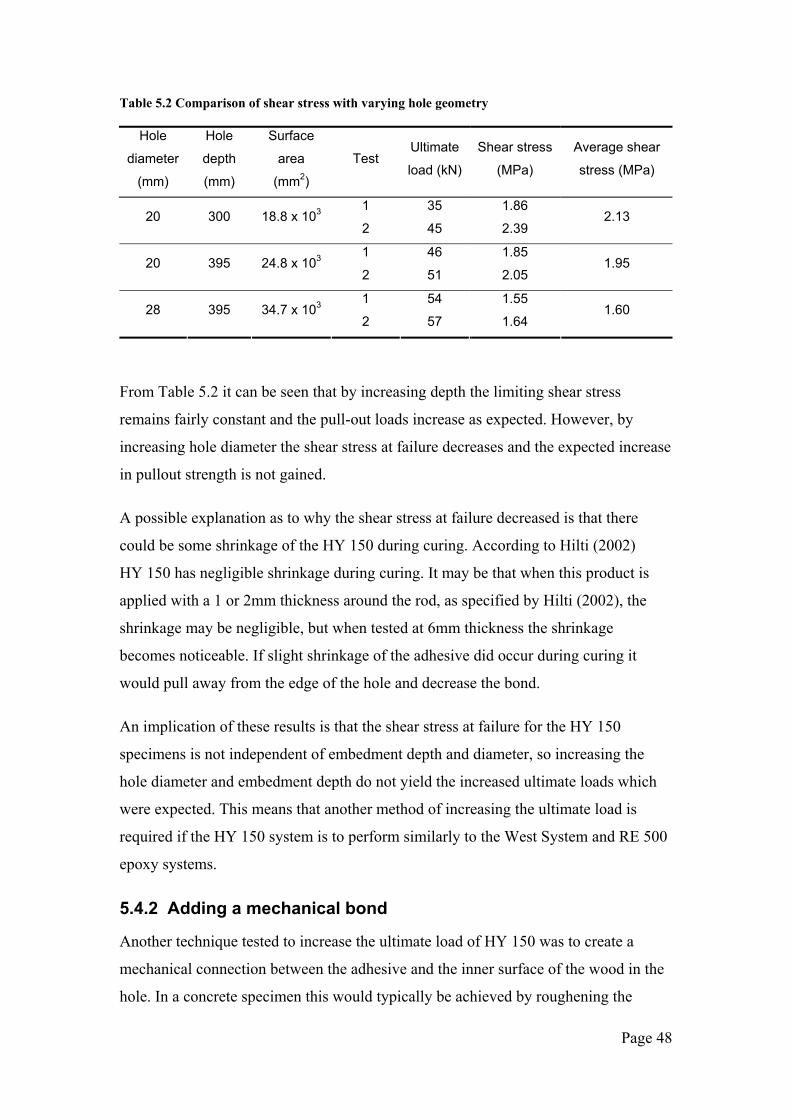
Page 48
Table 5.2 Comparison of shear stress with varying hole geometry
Hole
diameter
(mm)
Hole
depth
(mm)
Surface
area
(mm2)
Test Ultimate
load (kN)
Shear stress
(MPa)
Average shear
stress (MPa)
1 35 1.86 20 300 18.8 x 10³
2 45 2.39 2.13
1 46 1.85 20 395 24.8 x 10³
2 51 2.05 1.95
1 54 1.55 28 395 34.7 x 10³
2 57 1.64 1.60
From Table 5.2 it can be seen that by increasing depth the limiting shear stress
remains fairly constant and the pull-out loads increase as expected. However, by
increasing hole diameter the shear stress at failure decreases and the expected increase
in pullout strength is not gained.
A possible explanation as to why the shear stress at failure decreased is that there
could be some shrinkage of the HY 150 during curing. According to Hilti (2002)
HY 150 has negligible shrinkage during curing. It may be that when this product is
applied with a 1 or 2mm thickness around the rod, as specified by Hilti (2002), the
shrinkage may be negligible, but when tested at 6mm thickness the shrinkage
becomes noticeable. If slight shrinkage of the adhesive did occur during curing it
would pull away from the edge of the hole and decrease the bond.
An implication of these results is that the shear stress at failure for the HY 150
specimens is not independent of embedment depth and diameter, so increasing the
hole diameter and embedment depth do not yield the increased ultimate loads which
were expected. This means that another method of increasing the ultimate load is
required if the HY 150 system is to perform similarly to the West System and RE 500
epoxy systems.
5.4.2 Adding a mechanical bond
Another technique tested to increase the ultimate load of HY 150 was to create a
mechanical connection between the adhesive and the inner surface of the wood in the
hole. In a concrete specimen this would typically be achieved by roughening the

Page 49
surface of the hole (Hilti, 2002). The manufacturers of HY 150 require the inner
surface of the hole be roughened if it is bored into concrete using a diamond drill
(Hilti, 2002).
In timber it is not feasible to roughen the inner surface of the hole, as the roughening
process breaks the fibres of the timber, which decreases its strength. Eistetter (1999)
attempted to create a mechanical bond by roughening the inner surface of holes in
timber prior to grouting with cementitious grout, but only achieved a marginal
increase in bond strength.
Further attempts by Eistetter (1999) to create a mechanical bond used screws and
bolts passing through the timber and the grout. These gave higher ultimate loads than
for the roughening of the hole. Because the cement grout had very little adhesion to
the timber the anchorage was principally through the screws or bolts, which led to
unacceptably large deflections prior to failure.
As the HY 150 was found to give some adhesion in the current study, it was decided
to attempt to create a mechanical bond using screws through the adhesive, with the
hypothesis that the adhesive would prevent the displacement and the screws would
provide an increase in ultimate load.
5.4.2.1 Configuration of test specimen
The test specimens were drilled with an embedment hole of 28mm diameter at each
end, to a depth of 300mm. Four screws were fixed in each end of the test specimen,
staggered either side of the steel rod, as shown in Figure 5.4.

Page 50
Figure 5.4 Configuration of HY 150 specimen with screws in adhesive
Screws used for the fastening were 14 gauge, 100mm long stainless steel, self-
tapping, countersunk and threaded over their entire length. These were the same
screws used for preventing splitting in the epoxy specimens.
5.4.2.2 Results
When tested the specimens initially behaved as if the screws were not present. As load
was applied the same load-displacement curve was followed, indicating that there was
no slip in the adhesive, followed by an initial failure at a similar load to the HY 150
specimens without screws. This behaviour can be seen in Figure 5.5, where all four of
the test specimens had an initial failure at similar loads of around 45 kN. The load
dropped suddenly due to loss of bond, and the subsequent increase in load is due to
bending of the screws. Following this slight increase in load, another drop in load is
noted as the screws fail in bending. This occurred at a load of approximately 30 kN.
Grouted Rod,
16 mm LVL, 105
by 105 mm
Screws, 14 gauge,
100mm long

Page 51
0
10
20
30
40
50
60
0 1 2 3 4 5 6 7 8 9 10
Displacement (mm)
Load
(kN
) With ScrewsWith ScrewsWithout ScrewsWithout Screws
Figure 5.5 Comparison of effect of having screws in glue for HY 150 adhesive
This technique of using screws to increase ultimate failure load was not successful. It
is predicted that this lack of effect was due to the differing rigidity of the screws and
the glue. For the screws to begin carrying load there had to be some slip of the steel
rod, but this only occurred when the brittle failure of the glue occurred and it stopped
carrying load. To obtain any useful benefits from the screws, the load on the specimen
would need to be distributed between the screws and the glue prior to any failure
occurring and this did not occur as the screws were eventually unloaded at the time
when the HY 150 bond failed.
5.4.3 Comparison of HY 150 improvements
Overall comparisons of the performance of the altered HY 150 system shows that
although there was an improvement in the ultimate loads of the specimens when the
hole diameter and embedment depth were increased, it was not as great as was
anticipated. Similarly, the inclusion of screws in the adhesive did not make a
significant difference to the overall performance of the connection.
A summary of the cold test results for the HY 150 system is shown in Table 5.3. It is
worth noting that the failure mode in all specimens was at the wood/glue interface.
This indicates that the strength of the connection never reached the strength of either
Adhesive
fails Screws fail
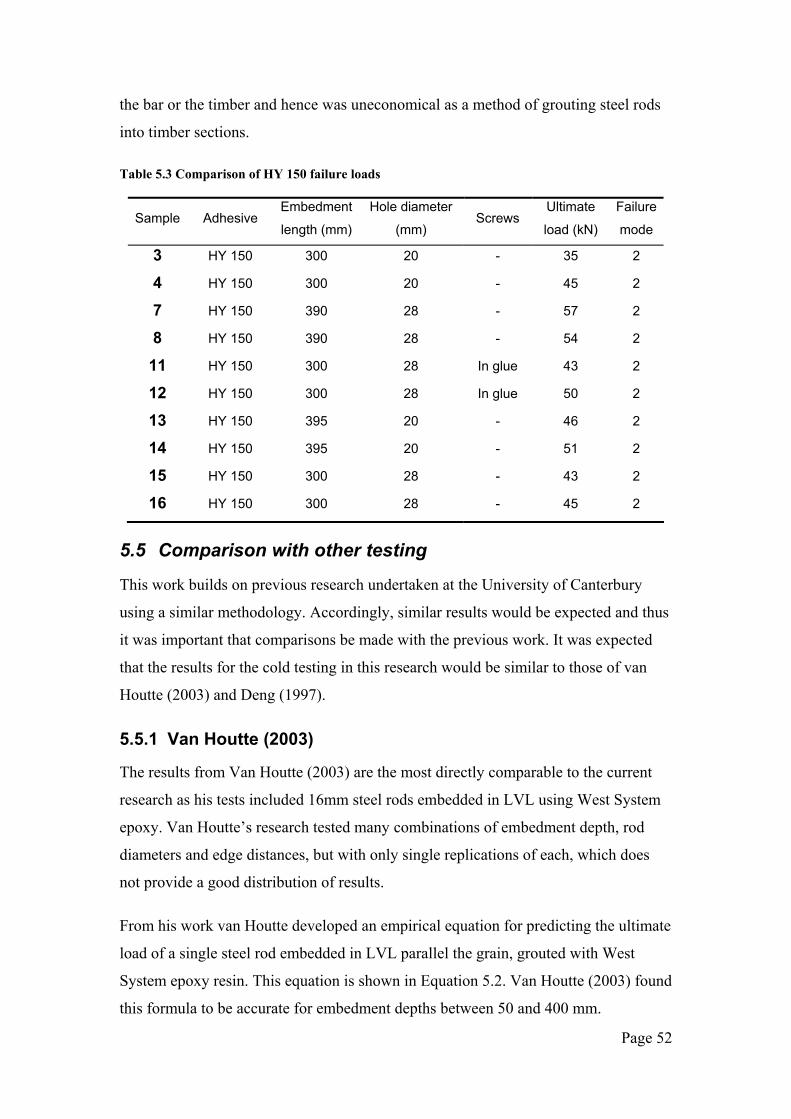
Page 52
the bar or the timber and hence was uneconomical as a method of grouting steel rods
into timber sections.
Table 5.3 Comparison of HY 150 failure loads
Sample Adhesive Embedment
length (mm)
Hole diameter
(mm) Screws
Ultimate
load (kN)
Failure
mode
3 HY 150 300 20 - 35 2
4 HY 150 300 20 - 45 2
7 HY 150 390 28 - 57 2
8 HY 150 390 28 - 54 2
11 HY 150 300 28 In glue 43 2
12 HY 150 300 28 In glue 50 2
13 HY 150 395 20 - 46 2
14 HY 150 395 20 - 51 2
15 HY 150 300 28 - 43 2
16 HY 150 300 28 - 45 2
5.5 Comparison with other testing
This work builds on previous research undertaken at the University of Canterbury
using a similar methodology. Accordingly, similar results would be expected and thus
it was important that comparisons be made with the previous work. It was expected
that the results for the cold testing in this research would be similar to those of van
Houtte (2003) and Deng (1997).
5.5.1 Van Houtte (2003)
The results from Van Houtte (2003) are the most directly comparable to the current
research as his tests included 16mm steel rods embedded in LVL using West System
epoxy. Van Houtte’s research tested many combinations of embedment depth, rod
diameters and edge distances, but with only single replications of each, which does
not provide a good distribution of results.
From his work van Houtte developed an empirical equation for predicting the ultimate
load of a single steel rod embedded in LVL parallel the grain, grouted with West
System epoxy resin. This equation is shown in Equation 5.2. Van Houtte (2003) found
this formula to be accurate for embedment depths between 50 and 400 mm.

Page 53
( )( )15'10855.1 24 += −slfhxKF Equation 5.2
Where: F = ultimate load of connection in kN
K = Reduction factor, equal to 0.85
h = Embedment hole diameter in mm
l = Embedment depth in mm
f’s = LVL shear stress in MPa
This equation includes a 0.85 reduction, or safety factor. As this equation is being
used to compare predicted ultimate loads with actual loads this reduction factor will
be taken as 1.0.
Comparisons using this equation can be seen in Figure 5.6. In these comparisons K
was taken as 1.0, f’s was taken as 4.5 MPa (from Table 4.1) and the hole diameter as
20 mm.
5.5.2 Deng (1997)
Research by Deng (1997) generated design guidance on the pullout loads for epoxy-
grouted rods in glulam timber. Some of Deng’s (1997) testing was performed using
West System and although the timber was different the ultimate loads should have
been fairly similar.
Deng’s research allowed him to propose an equation to calculate the ultimate load of
the connection under tensile load.
5.05.062.186.0
2094.10
=
de
dhd
dlkkkF meb
Equation 5.3
Where: F = ultimate load of connection in kN
d = steel bar diameter in mm, valid for 16 ≤ d ≤ 24
l = embedment length in mm, valid for 5d ≤ l ≤ 15d
h = hole diameter in mm, valid for 1.15d ≤ h ≤ 1.4d
e = edge distance from centre of steel to edge in mm,
valid for 1.5d ≤ e ≤ 3d
kb = bar type factor (1.0 for threaded rod)

Page 54
ke = epoxy type factor (0.86 for West System)
km = moisture content factor (1.0 for < 18 %)
Predicted failure loads using Equation 5.3 can be seen in Figure 5.6, with predictions
using van Houtte’s formula and experimental data from the current research.
Experimental ultimate loads shown in Figure 5.6 were all from test data of
105 x 105 mm LVL specimens, with 16 mm threaded steel rods grouted into 20 mm
diameter holes.
0
20
40
60
80
100
120
140
160
0 50 100 150 200 250 300 350 400 450
Embedment depth (mm)
Ulti
mat
e lo
ad (k
N)
van HoutteDengRE 500WestHY 150
Figure 5.6 Comparison of predicted and experimental ultimate loads
It can be seen from Figure 5.6 that the experimental results for the two epoxy resins
(RE 500 and West System) have higher ultimate loads than predicted by van Houtte
but lower than those predicted by Deng. In his research van Houtte (2003) notes that
his equation was based on a limited set of experimental results and that the correlation
factor (1.855 x 10⁻⁴) may not be entirely accurate. The experimental results shown in
Figure 5.6 indicate that the correlation factor may be too low by around 15%.
It was expected that Deng’s (1997) results may differ from those obtained in this
research due to the Deng’s formula being generated from testing in glulam and this
research being conducted using LVL. The difference between the predicted results
using Deng’s (1997) equation (Equation 5.3) and the experimental results indicate that

Page 55
epoxy-grouted steel rods are stronger when grouted into glulam timber than when
grouted into LVL. The difference may not be quite as great as that shown in Figure
5.6 as the embedment depths tested exceed the limits on embedment depth provided
for Deng’s equation (Equation 5.3).
5.6 Conclusions from cold testing
Both brands of epoxy resin showed similar performance under cold conditions, both
in terms of failure modes and ultimate loads. This will allow for either resin to be used
in the connection with the same design strength.
Ultimate loads for the HY 150 specimens are significantly lower than those for the
epoxy resins, by approximately a factor of four. This will prevent the HY 150 being
used as a substitute for the epoxy resins in this type of connection.
As the failures of the HY 150 specimens are consistently at the wood/glue interface
there is also doubt as to the durability of this glue when bonded to timber. Attempts to
increase the ultimate load for this adhesive by means of increasing the hole diameter
and providing a mechanical bond with screws proved to be ineffective.
Comparisons with earlier work by Deng (1997) and van Houtte (2003) show that the
cold results in this research are similar to those achieved previously and hence that the
fire testing results achieved in the latter portion of this research can be applied to the
previous work by these people.


Page 56
6 Oven testing Phase two of the testing for this research involved testing specimens at constant
elevated temperatures. These tests were conducted to evaluate the strength loss of the
adhesives with increases in temperature.
6.1 Setup of tests
Test specimens tested in this phase were the same as those used for the cold testing.
Test specimens were assembled from 105 x 105 mm LVL, with 16 mm steel rods
embedded 300 mm into each end of a 900 mm long specimen. The grades of the rods
used for these tests were either mild or grade 8.8 steel, chosen to match the anticipated
failure load. Mild steel was used in the tests where it wasn’t expected to yield, as it
was cheaper than grade 8.8 steel. The rod grades for each test are shown in Table 6.1.
Table 6.1 Testing regime for oven heated samples
Adhesive Rod Grade Test temperature
West System Grade 8.8 50 °C
West System Grade 8.8 75 °C
West System Mild 100 °C
RE 500 Grade 8.8 50 °C
RE 500 Grade 8.8 75 °C
RE 500 Mild 100 °C
HY 150 Mild 50 °C
HY 150 Mild 75 °C
HY 150 Mild 100 °C
Three temperatures were tested, 50, 75 and 100 °C. These temperatures were chosen
to give a spread of loads at a range of temperatures. Observations by Barber (1994)
showed that West System epoxy lost a large portion of its strength by 100 °C. If the
HY 150 and RE 500 adhesives were maintaining their strength at 100°C then further
tests would have been performed at higher temperatures.
To achieve the temperatures required for this testing the test specimens were heated in
a large oven.

Page 57
6.1.1 Time in oven
To ensure that the time the specimens were left to heat in the oven was sufficient, an
instrumented test specimen was heated and the temperatures of the oven and within
the test specimen were recorded.
This test specimen was a standard 105 x 105 mm specimen, with steel rods epoxied
into both ends. Within the epoxy at one end were three, type K, thermocouples,
embedded 50, 150 and 300 mm into the test specimen. While the test specimen was in
the oven there was also a type K thermocouple adjacent to the specimen to measure
the air temperature within the oven.
An oven temperature of 100 °C was chosen for this test as it was the hottest of the
oven heating tests and hence it would take the greatest length of time for a test
specimen to achieve this temperature.
In planning this phase of testing it was anticipated that the specimens would be left in
the oven overnight, prior to being strength tested. This was a duration of
approximately 16 hours. While measuring the temperatures within the oven and
specimen it was important that the oven was not opened as this would have resulted in
an alteration in the conditions within the oven. To enable this to be achieved all of the
thermocouple wires were fed through a gap between the front doors of the oven to
allow the recordings to be made from outside the oven.
Temperature measurements were taken over a period of approximately 16 hours and
the results are shown in Figure 6.1. The shallow, medium and deep temperatures refer
to the 50, 150 and 300 mm deep thermocouples within the epoxy resin.

Page 58
0
20
40
60
80
100
120
0:00:00 2:00:00 4:00:00 6:00:00 8:00:00 10:00:00 12:00:00 14:00:00 16:00:00
Hours in oven
Tem
pera
ture
(°C
)
Oven TempShallow TempMedium TempDeep Temp
Figure 6.1 Specimen heating curve in oven
It can be seen from Figure 6.1 that after 16 hours in the oven the temperature within
the epoxy had reached a steady state, approximately 3 degrees lower than that within
the oven. Given that the thermostat on the oven allows the temperature within the
oven to cycle over a range of around 5 degrees, this small variability was considered
suitable.
It is also important to note that the temperature along the depth of the epoxy was
constant and that the temperatures at all three/four measurement points had stabilised
within 16 hours. These results showed that the proposed 16 hour heating of the
specimens was sufficient to ensure that the temperature within the test specimen was
the same as that of the oven.
6.1.2 Testing of specimens
To ensure that the test specimens did not cool prior to being tested they were
individually unloaded from the oven immediately prior to strength testing. The testing
frame was located only a few metres from the oven in order to reduce the time the test
specimen was able to cool prior to being tested. A typical time for which a test
specimen was out of the oven prior to testing was 2 minutes.
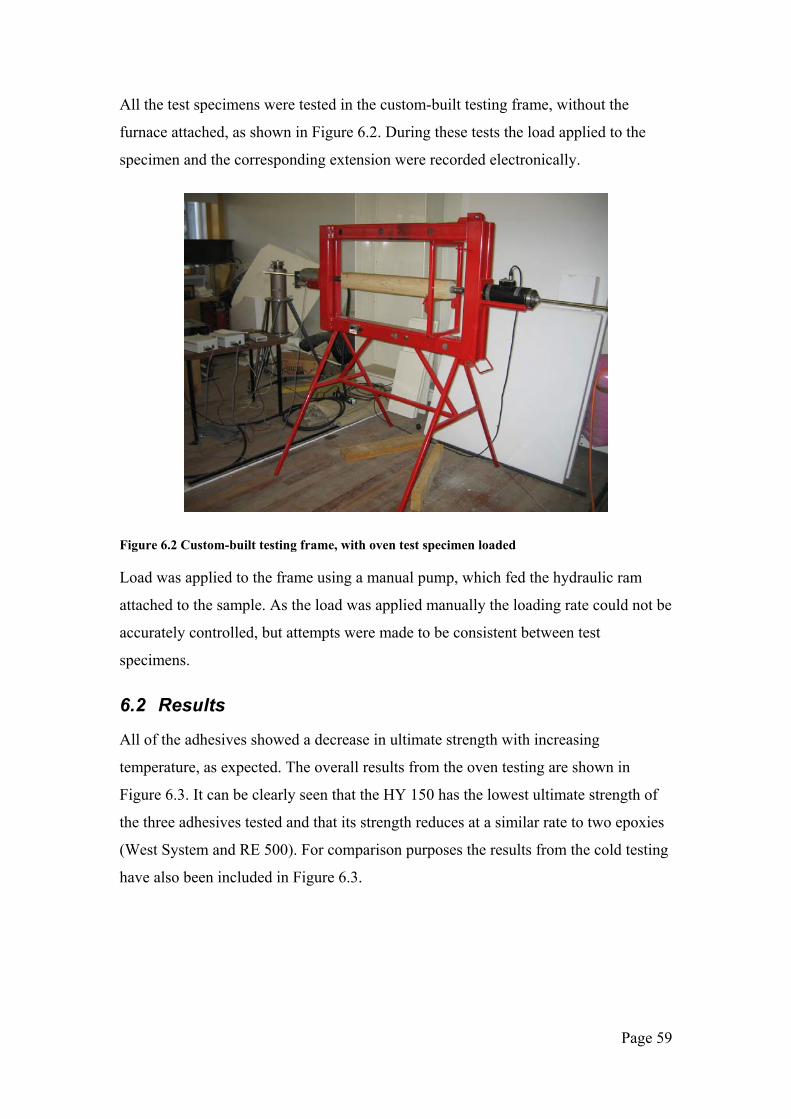
Page 59
All the test specimens were tested in the custom-built testing frame, without the
furnace attached, as shown in Figure 6.2. During these tests the load applied to the
specimen and the corresponding extension were recorded electronically.
Figure 6.2 Custom-built testing frame, with oven test specimen loaded
Load was applied to the frame using a manual pump, which fed the hydraulic ram
attached to the sample. As the load was applied manually the loading rate could not be
accurately controlled, but attempts were made to be consistent between test
specimens.
6.2 Results
All of the adhesives showed a decrease in ultimate strength with increasing
temperature, as expected. The overall results from the oven testing are shown in
Figure 6.3. It can be clearly seen that the HY 150 has the lowest ultimate strength of
the three adhesives tested and that its strength reduces at a similar rate to two epoxies
(West System and RE 500). For comparison purposes the results from the cold testing
have also been included in Figure 6.3.

Page 60
0
20
40
60
80
100
120
140
160
0 20 40 60 80 100 120
Temperature (°C)
Ulti
mat
e Lo
ad (k
N)
HY150RE500West
Figure 6.3 Oven test results, RE 500 results with air bubbles have been excluded
At 50 °C, the West System epoxy was found to hold its strength better than that for
the RE 500 system. The 50 °C West System specimens gave results with ultimate
loads only slightly lower than those at ambient temperatures. Ultimate loads for the
RE 500 system initially decreased at a greater rate than the West System, but at
100 °C the RE 500 specimens have the greater ultimate strength of the two epoxies.
Some tests were performed on test specimens which had been glued with RE 500
without the use of the special nozzle described in 4.4.2.1. In many of these tests large
air bubbles were found in the resin, which gave low strength specimens. The test
specimens with air bubbles are identified in Table 6.3. It is not recommended that
RE 500 samples are glued without the use of the special nozzle, due to the possibility
of air bubbles in the resin. Because of this, the results for all of the RE 500 specimens
with air bubbles have been excluded from Figure 6.3 and subsequent analysis.
To give a clearer indication of the decrease in strength of the adhesives at elevated
temperatures the mean strength at each temperature for each of the adhesives has been
plotted in Figure 6.4.

Page 61
0
20
40
60
80
100
120
140
160
0 20 40 60 80 100 120
Temperature (°C)
Ulti
mat
e lo
ad (k
N)
WestRe 500HY 150
Figure 6.4 Mean oven test results, clearly showing strength decrease with temperature
It was observed in the results that the HY 150 specimens contained a lot of scatter,
with considerably more spread than for the RE 500 and West System epoxies.
Investigation of the failed HY 150 specimens found no evidence of air bubbles in the
adhesive, nor any other factors which might have contributed to a reduction in
strength. It is concluded that the wide variation in the ultimate strength between
HY 150 replications was primarily due to the poor bond between the adhesive and
timber. This poor bond is thought to be affected by possible shrinkage and swelling
associated with the oven heating regime.
6.2.1 Failure modes
Three modes of failure were observed in the specimens tested in this phase of the
research. As two of the failure modes were consistent with those observed in the cold
testing component of this research the labelling of these failure modes will continue
from those described in section 5.3
Failure modes for each of the three adhesives are tabulated in Table 6.2 through Table
6.4. The failure modes observed in oven testing are described in the following
sections.

Page 62
Table 6.2 Failure modes and ultimate loads from oven testing of West System
Sample Adhesive Test temperature
(°C)
Screws Failure
Load (kN)
Failure
mode
Comments
23 West System 50 In wood 114 3
24 West System 50 In wood 130 3
65 West System 50 In wood 70 3
25 West System 75 In wood 70 4
26 West System 75 In wood 61 4
71 West System 75 In wood 50 4
27 West System 100 - 36 5
28 West System 100 - 44 5
73 West System 100 In wood 41 4
74 West System 100 In wood 38 4
75 West System 100 In wood 40 4
Table 6.3 Failure modes and ultimate loads from oven testing of RE 500
Sample Adhesive Test temperature
(°C)
Screws Failure
Load (kN)
Failure
mode
Comments
29 RE 500 50 In wood 95 3
30 RE 500 50 In wood 89 3
42 RE 500 50 In wood 67 3 Air bubble
44 RE 500 50 In wood 93 3
33 RE 500 75 In wood 71 4
34 RE 500 75 In wood 56 4 Air bubble
55 RE 500 75 In wood 55 4 Air bubble
59 RE 500 75 In wood 67 4
31 RE 500 100 - 27 5 Air bubble
32 RE 500 100 - 59 5
63 RE 500 100 In wood 57 4
64 RE 500 100 In wood 58 4

Page 63
Table 6.4 Failure modes and ultimate loads from oven testing of HY 150
Sample Adhesive Test temperature
(°C)
Screws Failure
Load (kN)
Failure
mode
Comments
37 HY 150 50 - 49 2
38 HY 150 50 - 36 2
50 HY 150 50 - 11 2
35 HY 150 75 - 34 2
36 HY 150 75 - 26 2
47 HY 150 75 - 19 2
39 HY 150 100 - 17 2
40 HY 150 100 - 24 2
48 HY 150 100 - 10 2
6.2.1.1 Mode 1 failures
Mode 1 failures were not observed in this phase of the research.
6.2.1.2 Mode 2 failures
Mode 2 failures were observed for all of the HY 150 specimens tested in the oven.
This indicates that the temperatures reached during this phase of testing, although
high enough to cause a loss of strength, were not great enough to alter the behaviour
of the HY 150 adhesive.
6.2.1.3 Mode 3 failures
Mode 3 failures were recorded in the epoxy specimens (West System and RE 500) at
ambient temperatures when the screws were included to prevent splitting of the
laminations. This failure mode was also observed at 50 °C for both brands of epoxy
resin. This indicates that at 50 °C the epoxy resins, although they had lost strength,
were still behaving as they did at ambient temperatures.
6.2.1.4 Mode 4 failures
Mode 4 failures occurred in the epoxy resin specimens once the adhesive had
undergone some thermal degradation. In this mode the failure occurred within the
resin, with no breaking of timber. Associated with this mode of failure, the epoxy was

Page 64
very crumbly and could easily be brushed from the surface of the withdrawn rod with
the fingers.
This mode of failure was similar in the two epoxy resins and can be seen in Figure
6.5, with a RE 500 specimen on the left and a West System specimen on the right.
Both of these specimens were tested at 100 °C, identical to those tested at 75 °C.
Figure 6.5 Mode 4 failures in RE 500 specimen (left) and West System specimen (right). These
specimens were tested at 100 °C
The transition to the epoxy being crumbly was most likely due to the resins being
heated beyond their heat distortion temperatures (HDT). For each brand of epoxy
there is a HDT, which is a measure of the epoxy’s reduction in stiffness when heated
(Goulding, 1994). For the West System this is 60 °C (Adhesives Technologies, 1992)
and for the RE 500 system the HDT is not published, but it has a maximum service
temperature of 50 °C (D. Arandjelovic, pers. comm.). Once this temperature is
exceeded the crystal structure of the epoxy begins to deform and it is thought that this
deformation combined with the removal of the steel bar caused the crumbling of the
epoxy that was observed.
6.2.1.5 Mode 5 failure
Mode 5 failures were a special case of mode 4 failures. In construction of the test
specimens which were tested at 100 °C it was decided that screws would not be
required to prevent splitting between the laminations. In making this decision a
predicted failure load based on the results of the 50 and 75 °C tests was calculated.
This failure load was less than half of that which the mode 1 failures to occur during
the cold tests. Based on this theory the screws between the laminations to prevent
splitting should not be required. This proved to be an incorrect hypothesis, as the

Page 65
epoxy specimens without screws tested at 100 °C were observed to split along a plane
parallel to the laminations. This mode of failure is shown in Figure 6.6 for a West
System specimen.
Figure 6.6 Mode 5 failure in a West System specimen
Although the split shown in Figure 6.6 did not open particularly wide it is worth
considering as it demonstrates a loss in strength within the timber. As the split lies on
the same plane as the glue between the laminations in the timber it is necessary to
identify whether the failure was a failure of the glue, or of one of the laminates.
Quality assurance testing of LVL following production by Carter Holt Harvey
involves a test to check bond strength. These tests include boiling the LVL and then
chiselling laminates from the test specimen. During these tests failures occur at the
weakest point, either within the glue line and the timber laminate. To identify which
of the two materials was the location of the failure visual identification was used. This
visual identification was based on the proportion of the resorcinol adhesive exposed
compared to the amount of timber exposed. To pass this test the specimen needed to
have a maximum of 50% of the exposed surface (failure surface) being resorcinol
(H. Bier, pers. comm.).
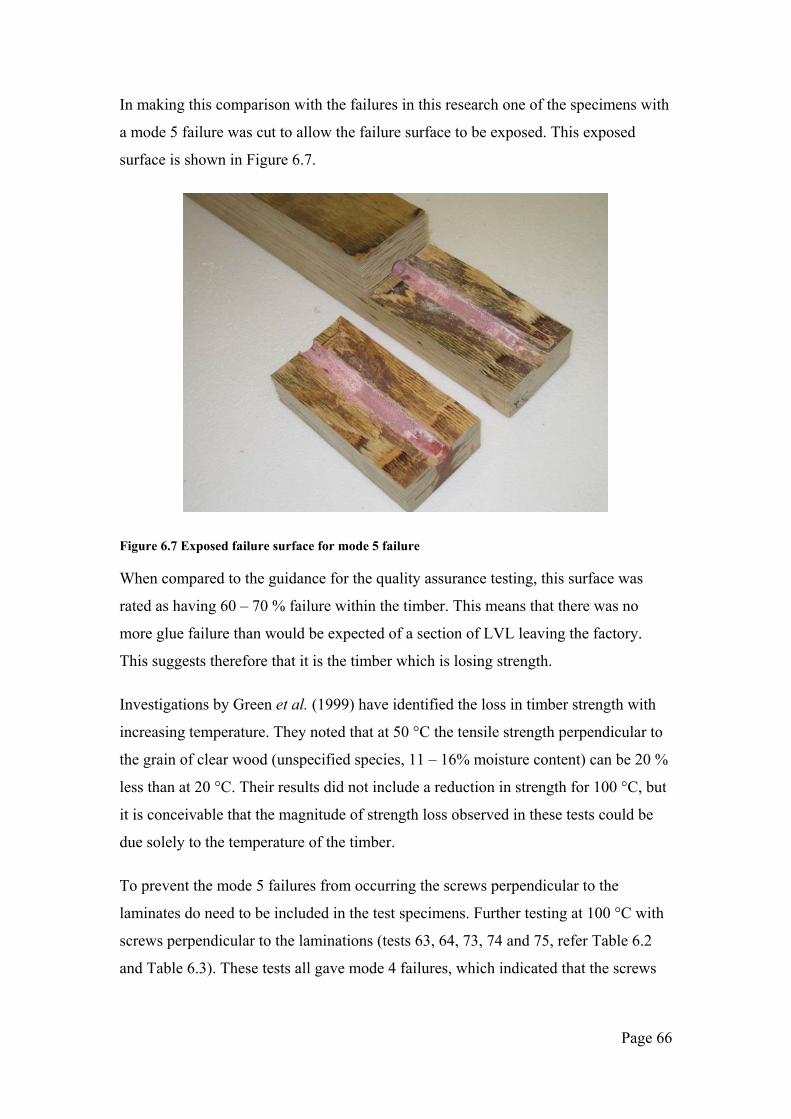
Page 66
In making this comparison with the failures in this research one of the specimens with
a mode 5 failure was cut to allow the failure surface to be exposed. This exposed
surface is shown in Figure 6.7.
Figure 6.7 Exposed failure surface for mode 5 failure
When compared to the guidance for the quality assurance testing, this surface was
rated as having 60 – 70 % failure within the timber. This means that there was no
more glue failure than would be expected of a section of LVL leaving the factory.
This suggests therefore that it is the timber which is losing strength.
Investigations by Green et al. (1999) have identified the loss in timber strength with
increasing temperature. They noted that at 50 °C the tensile strength perpendicular to
the grain of clear wood (unspecified species, 11 – 16% moisture content) can be 20 %
less than at 20 °C. Their results did not include a reduction in strength for 100 °C, but
it is conceivable that the magnitude of strength loss observed in these tests could be
due solely to the temperature of the timber.
To prevent the mode 5 failures from occurring the screws perpendicular to the
laminates do need to be included in the test specimens. Further testing at 100 °C with
screws perpendicular to the laminations (tests 63, 64, 73, 74 and 75, refer Table 6.2
and Table 6.3). These tests all gave mode 4 failures, which indicated that the screws

Page 67
worked effectively. However, the ultimate loads were not observed to be significantly
greater than those specimens tested without the screws at 100 °C.
As both the mode 4 and mode 5 failures involve epoxy failure it may be that the
crumbling of the glue is the primary limit on the strength of the test specimen and it
just happened to coincide with the reduced strength of the laminations. Even though at
100 °C it was observed that there is no difference in strength whether there are screws
between the laminations or not, it is recommended that these screws are used as they
make a significant improvement to the strength under normal conditions.
6.3 Cooled tests
Consultants working in the field of fire engineering have unanswered doubts about the
use of epoxy-grouted bars in timber construction, as there is considerable uncertainty
as to whether the connection will regain its strength following a fire. In a moderate
fire heavy timber members will often survive with only a small degree of charring.
However, if the connections to these members do not regain their strength following a
fire then the connections and possibly the timber members would have to be replaced,
with the building owners incurring significant cost and downtime.
Barber (1994) briefly examined this problem by subjecting failed glulam specimens,
with epoxy-grouted rods, to a cold test. These specimens had been loaded in tension
while being exposed to the standard fire in the furnace at the Building Research
Association of New Zealand (BRANZ). During the furnace test the specimens all
failed and displaced by around 20mm. These test specimens were then allowed to cool
prior to being subjected to a tensile test at ambient temperature. Barber (1994) noted
that the residual strength of these specimens was between 2 and 22 kN. This was a
reduction from a cold strength of approximately 120 kN. Barber (1994) concluded
that “once the epoxy connections have been severely heat affected that their strength
properties are greatly reduced”.
It could be argued, however, that Barber’s (1994) testing was not a fair test of the
residual strength of the connection following heating, as the test specimen had failed
prior to the cooled test being performed. In order to address this weakness in Barber’s
methodology test specimens were tested in this research which had been built
specifically to test the heating and cooling process.

Page 68
Residual loads recorded by Barber (1994) for specimens which had been heated and
cooled were recorded to be around 20 kN. During the cold testing phase of this
research test specimens were often loaded beyond their failure point in order to
withdraw the rods further for inspection. Loads recorded during this process were
around 10 – 20 kN. This indicates that the loads found by Barber as residual loads
following heating are actually likely to be residual loads following failure of the
specimen. The force being recorded is not so much the residual strength of the
connection, as the dynamic friction force caused by the rod being withdrawn from the
specimen.
By this comparison it can be seen that it is not so much the heat that is creating the
loss in strength, but the displacement of the test specimen.
Similar research was carried out by Stumes (1982) in which steel pins were grouted
into timber specimens and heated in an oven. Stumes’ testing was different from both
that done in this study and that done by Barber (1994). Stumes heated the test
specimens in an oven with a constant load applied and did not hold them there until
failure. Stumes does not specify the length of time the specimens were left in the
oven, nor the load applied to them. He concludes that if epoxy is heated and cooled
then its strength is permanently reduced (Stumes, 1982). As epoxy will creep when it
is loaded at higher temperatures, as seen in the furnace testing section of the current
research, it may be that the displacement caused by the loads while the specimens
were in the oven was sufficient to displace the test specimen enough that the epoxy
structure was damaged upon cooling.
The current study therefore set out to test the theory that it was displacement which
was critical to the weakening of the epoxy, not the temperature. To do this the current
study involved the heating of test specimens to 75 and 100 °C in the oven. These test
specimens were then left overnight at this temperature to ensure that they achieved a
constant temperature, were then removed from the oven and allowed to cool to room
temperature. Once the test specimens had reached room temperature they were then
subjected to a tensile test.
Results of these tests can be found in Figure 6.8 to Figure 6.10 and show the
comparison between the test specimens tested hot and those which had been allowed

Page 69
to cool fully prior to testing. It can clearly be seen that for each of the three adhesives
there is no significant difference in strength between those test specimens which have
been tested at ambient temperature and those which were heated and then tested at
ambient temperature. This is important as it shows that the epoxy can withstand the
heating and cooling process that would likely be experienced during a minor fire.

Page 70
0
20
40
60
80
100
120
140
160
0 20 40 60 80 100 120
Temperature (°C)
Failu
re L
oad
(KN
)
RE500RE500, cooled
Figure 6.8Comparison of RE 500 failure loads at elevated and cooled temperatures
0
20
40
60
80
100
120
140
160
0 20 40 60 80 100 120
Temperature (°C)
Failu
re L
oad
(KN
)
WestWest, cooled
Figure 6.9 Comparison of West System failure loads at eleveated and cooled temperatures

Page 71
0
20
40
60
80
100
120
140
160
0 20 40 60 80 100 120
Temperature (°C)
Failu
re L
oad
(KN
)
HY150HY150, cooled
Figure 6.10 Comparison of HY 150 failure loads at eleveated and cooled temperatures
Within the current study there were no differences found between test specimens that
had been heated to 75 and those that had been heated to 100 °C. The current study
also heated the epoxy to a greater temperature and maintained it at that temperature
for a longer period of time than Barber (1994) had used in his testing. The epoxy in
Barber’s (1994) test specimens reached 40 – 45 °C and the temperature was only
maintained for around 30 minutes. This means that the heating performed in this study
was more severe than that used by Barber (1994) and the specimens performed better
in this study, which means that the prior failures of Barber’s specimens was critical to
their low residual strength.
6.3.1 Failure modes
When tested at 75 and 100 °C the failure of the RE 500 and West System epoxy resin
specimens was found to be within the epoxy. At these temperatures the adhesive
became visibly crumbly. This is in contrast to the failure modes at ambient
temperatures where the epoxy specimens failed within the timber. Resin failure
(mode 4) was visible on the failed oven-heated test specimen, where the adhesive had
crumbled and was able to be brushed away with the fingers.
On the test specimen which had been heated and cooled there was no evidence of the
epoxy being crumbly, as was seen in the hot tests. Failure of all of the heated and

Page 72
cooled epoxy specimens were mode 3 failures. For the hot test specimens where
crumbling of the epoxy was observed it was noticed that after cooling the texture of
the epoxy remained crumbly.
It is concluded that the crumbling of the epoxy is not solely a function of temperature
and that it must be as a result of load being applied while the epoxy was at an elevated
temperature. This conclusion is also supported by the condition of the overflowed
epoxy on the surface of the test specimens surrounding filling holes from the gluing
process. This epoxy was exposed to the same temperatures as that in the connection
and it never showed any sign of being crumbly. Efforts to remove it by hand were
futile indicating that it had regained its strength upon cooling, unlike the crumbled
epoxy seen on the withdrawn rod.
Heated and cooled tests using HY 150 gave similar results to the epoxy specimens
(West System and RE 500) in that the behaviour was observed to be the same as for
tests at ambient temperatures. Failures in the HY 150 were mode 2 failures at ambient
and elevated temperatures and mode 2 failures were again observed in the heated and
cooled tests.
6.4 Conclusions
From this phase of tests it can be seen that there were some differences between the
performance of the two epoxy resins (RE 500 and West System) at elevated
temperatures. Strength losses for the two epoxies were similar. Both were reduced to
around 40 % of their cold strengths at 100 °C. The West System maintained its
strength better at 50 °C, but beyond this point the RE 500 was the stronger of the two.
The difference was not great enough for the RE 500 to be recommended in favour of
the West System when temperature resistance is required.
There was an observed difference in consistency in the epoxies when they were
heated to 75 °C and above. At this temperature the epoxy made a transition from
being solid to being crumbly. It is thought that this transition was due to the epoxies
having exceeded their heat distortion temperatures.
This occurrence was not observed for the HY 150 tests where the failure modes
remained at the wood/glue interface as they had been at ambient temperatures. Failure
Page 73
loads in the HY 150 decreased with increasing temperature, but at a lesser rate than
for the epoxies.
Overall, the HY 150 lost strength at a lower rate than the two epoxy resins, but had
highly variable strength, attributed of the lack of bonding.

Page 74
7 Furnace testing The objective of this phase of testing was to measure the fire resistance of the epoxy-
grouted steel rod connection in LVL timber. This was done by testing the specimens
at a constant tensile load while being heated until failure in a furnace. This contrasted
with the oven testing phase where the temperature was held constant and the load was
increased until failure.
7.1 Construction of specimens
As the insulation provided to the adhesive by the timber is important in this testing
there were two specimen sizes tested. One group of test specimens were
105 x 105 mm and were constructed to the same specifications as for the oven test
specimens. The other group were smaller, 63 x 63 mm test specimens. All test
specimens were the same length (900 mm) and the rods were grouted to a depth of
300 mm with 20 mm holes.
The size of the smaller specimens was chosen as it was a more realistic size of timber
for the capacity of the connection. For a 63 x 63 mm section of LVL, the tensile
strength, based on a yield strength of 42 MPa (CHH 2000) is 167 kN. This was
similar to the ultimate load for the 16 mm epoxy-grouted rod of 130 kN.
For data recording purposes a type K thermocouple was cast into the adhesive in all of
the test specimens. This thermocouple gave temperature readings of the adhesive at
the midpoint of the hole (embedment depth of 150 mm) and was connected to the
electronic data logging equipment to give readings every second throughout testing.
7.2 Testing frame
The same testing frame used for the oven tests was used for these tests, but now a
furnace was added, as shown in Figure 7.1. Load was applied using the same
mechanism as for the oven tests, except that in the furnace testing the load was held
constant throughout.

Page 75
Figure 7.1 Custom-built testing frame with furnace attached
To ensure that the specimens were exposed to the same heating conditions in every
experiment the oven was pre-heated to 300 °C and held at that temperature for 10
minutes prior to the test specimen being placed into the furnace. This temperature was
recorded by inserting a thermocouple into the centre of the oven. By holding the
furnace at 300 °C for 10 minutes this allowed the body of the furnace to heat up.
During trials of the furnace it was found that the first specimen tested in a series was
subjected to a less severe test unless the furnace was allowed to heat thoroughly.
Following a test the furnace was often at temperatures in excess of 300 °C, so it was
necessary to allow it to cool down to the 300 °C starting point, again to ensure a
constant starting point for all of the tests. Verification of the similarity of heating
regimes between each of the tests can be found by plotting temperature time plots for
the temperature within the test specimens during testing, as shown in Figure 7.2.

Page 76
0
20
40
60
80
100
120
140
160
180
00:00 00:20 00:40 01:00 01:20
Time (hrs:mins)
Tem
pera
ture
(°C
)
Figure 7.2 Temperature - time plot showing heating of test specimens in furnace.
It can be seen in Figure 7.2 that although the end points of each of the curves differ
the curves are closely grouped indicating very similar heating regimes. The difference
in end point is due to variations in applied load between different adhesives, as
explained in section 4.5.3.1.
7.2.1 Insulation of test specimen
It was anticipated that the heat would travel solely through the thickness of the timber
into the epoxy. For this reason it was important that element was not able to directly
heat the rod. If the rod had been heated then it could be expected that with the higher
thermal conductivity of the steel, heating of the epoxy would be mostly due to heat
transfer along the rod rather than through the timber.
Insulation of the rods at the heated end was achieved by inserting a piece of 40 mm
thick Kaowool mineral insulation over the exposed steel rod, as shown in Figure 7.3.
105 x 105 mm
63 x 63 mm

Page 77
Figure 7.3 Schematic showing location of Kaowool insulation
Following tests it was seen that this insulation was effective as no charring was visible
at the end surface of the test specimens. This is evidenced in Figure 7.4
Figure 7.4 Photo showing uncharred end of burnt specimen where protected by Kaowool
insulation. The exposed screws show the extent of timber burnt away
To keep the heat within the furnace an additional seal of Kaowool insulation was
provided around the test specimen at the opening of the furnace. This insulation
provided a heat and gas seal around the sides and top of the test specimens, but left
the bottom surface open. It was found during trials of the furnace that some
ventilation was required to feed the combustion. Without this air supply the ignition
of the test specimen was dangerously explosive.
Inside wall
of furnace
Kaowool
insulation Cold end of
sample Rod at hot end
of sample

Page 78
The test specimen was positioned in the furnace and the air supply was regulated such
that the heated specimen had approximately uniform charring n all four surfaces.
7.3 Charring tests
A series of charring tests were performed to investigate the consistency of the heating
in the furnace. These tests consisted of loading the furnace with 105 x 105 mm
specimens (previously failed during oven tests), but without a tensile load applied.
These specimens were then heated in the furnace for 15, 30 or 45 minutes, with two
replications at each duration. Following these tests the specimens were removed from
the oven, extinguished and cooled.
For observation purposes these test specimens were then cut open (as shown in Figure
7.5). The layer of char was then removed to expose the remaining section for
measurement, as seen in Table 7.1.
Figure 7.5 Charring specimens after being cut open. From the left there are two specimens
exposed for 15 minutes, followed by two at 30 minutes and two at 45 minutes. Note that the top
layer of specimens are the matching halves to the lower layer
From Figure 7.5 it can be seen that the two 45 minute specimens have similar residual
sections, but that at 15 and 30 minutes there were differences between the replicates.
For the 15 minute test specimen (second from left in Figure 7.5) there was
insignificant charring to the lower surface. This was found to be due to incoming air

Page 79
cooling the specimen and was remedied as described in section 7.2.1. It can also be
seen that one of the 30 minute specimens had less charring. This test specimen was
the first test specimen tested one morning and although the furnace had been pre-
heated to 300 °C prior to loading, it had not been hot long enough to sufficiently heat
the body of the furnace. This was remedied by allowing the furnace to heat through
prior to use, as described in section 7.2.
Table 7.1 Char depths for charring specimens
Sample Exposure
(minutes)
Time to charring
(minutes)
Time to ignition
(minutes)
Depth of char
(mm)
Average
char rate
(mm/min)
50 15 6:30 Did not ignite 4 0.27
52 15 2:30 10:00 9 0.6
51 30 10:00 21:00 14 0.47
54 30 3:00 12:00 19 0.63
49 45 4:00 18:00 25 0.56
53 45 3:00 15:30 25 0.56
Overall average 0.52
Overall average without 50 & 51 0.59
If specimens 50 and 51 are discounted due to their being tested under less severe
conditions, it can be seen that the average charring rate was 0.59 mm/min. This was
slightly lower than that achieved by Lane et al. (2004) in a pilot test furnace heated in
accordance with ISO 834, where an average charring rate of 0.7 mm/min was
achieved for similar LVL timber.
The measured charring rates gave an indication that the furnace was less severe than
the ISO 834 heating regime. A scaling factor was used to convert the results of the
furnace testing to those achieved in a standard furnace test based on the depth of
charring achieved.
7.4 Results
During testing of the specimens a slow decrease in load was observed with increasing
temperature. Some of this was attributed to a slight leak in the hydraulic pump, but

Page 80
mostly it was found to be due to extension of the test specimen, as recorded by the
potentiometer. A typical load vs. displacement graph is shown in Figure 7.6 for an
epoxy test specimen tested in the furnace, which shows the load fluctuations around
the 27 kN target.
Constraints due to the design of the furnace prevented recording of the displacement
between the rod and the test specimen and so from the results it was not possible to
differentiate extension of the timber from slip of the adhesive. Analysis of this could
only be made after completion of the test through inspection of the position of the rod
relative to its original position.
0
5
10
15
20
25
30
0 5 10 15 20 25 30
Displacement (mm)
App
lied
load
(kN)
Figure 7.6 Typical load vs. displacement graph for furnace test
Unfortunately, due to a serious malfunction of the oven the furnace testing for this
phase of the research was unable to be completed. Due to this failure only 15 of the
intended 18 tests were completed.
7.4.1 Burning behaviour
Following insertion into the furnace it took all specimens between 2 and 5 minutes to
heat sufficiently to begin charring. As the surfaces of the test specimens were not
visible from the outside of the furnace, the onset of charring was only evidenced as
smoke began to be expelled from the flue. This led to a period where the test
specimens were charring and building up pyrolyzates within the furnace, but prior to
flaming occurring. After the pyrolyzates built up for a few more minutes the gases

Page 81
reached their unpiloted ignition temperature and ignited. From the point of ignition,
there was flaming on all surfaces of the test specimen until the conclusion of the test.
As soon as the test specimens had failed the furnace was switched off and the test
specimens were removed from the furnace. Once extracted from the furnace the test
specimens were quickly extinguished and cooled with water to prevent further
charring.
7.4.2 Time to failure
Zero time was recorded as the time at which the 27 kN or 8 kN test load was applied.
Failures were recorded as being the time at which the test load was not able to
sustained by the test specimen.
Recorded times to failure for each of the tested configurations are shown in Table 7.2
with their associated modes of failure.
Table 7.2 Time to failure for furnace testing
Sample Sample size Adhesive
Test
load
(kN)
Time to
charring
(minutes)
Time to
ignition
(minutes)
Time to
failure
(minutes)
Failure
mode
79 63 x 63 mm West 27 2:30 14:00 15:00 6
80 63 x 63 mm West 27 4:30 14:00 15:30 6
81 63 x 63 mm West 27 3:00 12:00 15:30 6
82 63 x 63 mm RE 500 27 4:00 13:00 16:00 6
83 63 x 63 mm RE 500 27 4:30 12:00 15:00 7
84 63 x 63 mm RE 500 27 4:00 11:30 15:30 6
85 63 x 63 mm HY 150 8 2:00 12:00 28:30 6
86 63 x 63 mm HY 150 8 3:30 11:30 20:30 4
87 63 x 63 mm HY 150 8 3:30 12:30 21:00 4
76 105 x 105 mm West 27 5:00 18:00 38:00 4
77 105 x 105 mm West 27 2:00 16:00 36:30 4
78 105 x 105 mm West 27 3:00 17:30 38:00 4
91 105 x 105 mm RE 500 27 2:00 13:00 36:30 4
88 105 x 105 mm HY 150 8 2:30 16:00 61:30 4
89 105 x 105 mm HY 150 8 3:00 17:00 63:30 4

Page 82
7.5 Failure modes
The failure modes observed in the furnace testing were slightly different from those
observed in the earlier phases of this research. Again, for consistency the numbering
of the failure modes continues from the earlier phases of this research.
Failure modes 1 and 3 were not observed in this phase of testing as the applied load
was not enough to cause timber failure. Mode 2 failures were also not observed. This
was slightly unexpected, as the HY 150 specimens preceding the furnace tests had all
failed in the same manner, at the wood/glue interface.
7.5.1 Mode 4 failures
Mode 4 failures occurred, as described in the oven testing results, with a failure of the
epoxy resin and no damage to the timber. This mode of failure was evidenced in all of
the 105 x 105 mm tests and in two of the three 63 x 63 mm tests with HY 150
adhesive only.
Figure 7.7 Mode 4 failure in portion of a West System 105 x 105 mm specimen
This indicates that the insulative properties of the timber were sufficient to protect the
epoxy until the time of failure.

Page 83
7.5.2 Mode 6 failures
Mode 6 failures involved the failure of the adhesive, but the splitting of the test
specimen only occurred on one side. Mode 6 failures are very similar to the mode 5
failures observed in the oven testing phase. Mode 5 failures occurred within the
adhesive combined with a splitting across the laminations, on both sides of the steel
rod.
One important point to note about mode 5 and 6 failures is that mode 5 failures
occurred in specimens without screws perpendicular to the laminations to prevent
splitting. In the test specimens where mode 6 failures occurred there were screws
perpendicular to the laminations, although due to the mode of failure there was doubt
as to their effectiveness.
A West System test specimen demonstrating a mode 6 failure can be seen in Figure
7.8. The crack can be observed in the horizontal plane on the left of the rod.
Figure 7.8 Portion of 63 x 63 mm West System specimen showing mode 6 failure
In the HY 150 specimens the specimens charred deeper (but at a similar rate) than
their epoxy (West System and RE 500) counterparts, due to their longer exposure to
the furnace. In many specimens this led to there being very little, if any, residual
section remaining following the testing. Specimen 85 was the only one of the three
63 x 63 mm HY 150 specimens to have a mode 6 failure.

Page 84
Figure 7.9 Extreme case of mode 6 failure, in a 63 x 63 mm HY 150 specimen
7.5.3 Mode 7 failures
Mode 7 failures were when the test specimens split perpendicular to the laminations.
This was only found to happen in some of the furnace test specimens. Mode 7 failures
were similar to mode 6 failures, except that they demonstrated greater effectiveness of
the screws at preventing splitting between the laminates. As the splitting force was not
able to part the test specimen along the line of the laminations it split across the
laminations instead. This can be seen in Figure 7.10, with the split occurring on the
top surface.

Page 85
Figure 7.10 Portion of 63 x 63 mm RE 500 specimen with split across laminations in top surface,
demonstrating a mode 7 failure
7.6 Comparison with oven testing
Failure temperatures within the adhesive observed during the furnace testing were
significantly lower than those observed during the oven testing. This was observed for
all three adhesives and the comparison of these temperatures for each adhesive can be
seen in Figure 7.11 through Figure 7.13.
For the epoxy resins (West System and RE 500) the temperature of the glue at failure
was approximately half of that predicted by the results of the oven testing.
For the HY 150 specimens the difference between the oven and furnace results was
not as great. There was found to be a large amount of scatter in the failure
temperatures for the HY 150 (seen in Figure 7.13), which makes comparisons with the
oven test results difficult. It was expected that this scatter was due to the poor bond of
the adhesive to the timber being affected by moisture movement in the timber.

Page 86
0
20
40
60
80
100
120
140
160
0 20 40 60 80 100 120 140 160
Temperature (°C)
Ulti
mat
e lo
ad (k
N)
OvenFurnace
Figure 7.11 Comparison of oven and furnace ultimate loads for West System epoxy
0
20
40
60
80
100
120
140
160
0 20 40 60 80 100 120 140 160
Temperature (°C)
Ulti
mat
e lo
ad (k
N)
OvenFurnace
Figure 7.12 Comparison of oven and furnace ultimate loads for RE 500

Page 87
0
20
40
60
80
100
120
140
160
0 20 40 60 80 100 120 140 160
Temperature (°C)
Ulti
mat
e lo
ad (k
N)
OvenFurnace
Figure 7.13 Comparison of oven and furnace ultimate loads for HY 150
The furnace testing was observed to be a more severe test for the specimens, when
epoxy temperatures are compared between tests. This may be due to the moisture
movement within the test specimen in the furnace. When specimens are heated
beyond 100 °C the internal moisture is driven off. Initially some of this moisture will
be forced towards the core of the timber. In the furnace tests this will increase the
moisture content in the area of the bond. For the oven tests, as the test specimens were
left in the oven for a longer period of time the moisture would have been able to reach
an equilibrium point and so there would not have been the higher concentrations of
moisture at the bond area.
Possibly more important is that during the furnace tests the adhesive was under tensile
load while the heating was conducted. This would have placed stress on the structure
of the adhesive as it was beginning to soften, as opposed to the oven test specimens
where the adhesive was unloaded while the heating was occurring and load was
applied after heating was finished.
Although the reason for the difference between the oven and furnace tests is not
entirely clear, it was also observed by Barber (1994) and Spieth (2002) that furnace
tests were more severe than oven tests.

Page 88
7.6.1 Displacements during testing
An important factor of this testing was not just the load and temperature at failure, but
also whether the displacements prior to failure were within an unacceptable range.
While a definitive assessment of acceptable displacement was difficult to make when
assessing only a tensile specimen in isolation from the complete structural assembly,
it was possible to make a qualitative assessment.
Displacements were recorded during testing and, when compared to the temperature
within the adhesive, gave an indication of the amount of slipping that was occurring.
The displacements for each of the three adhesives can be found in Figure 7.14 through
Figure 7.16. Displacements are missing for two tests, as there was an error in the data
logging during the experiment.
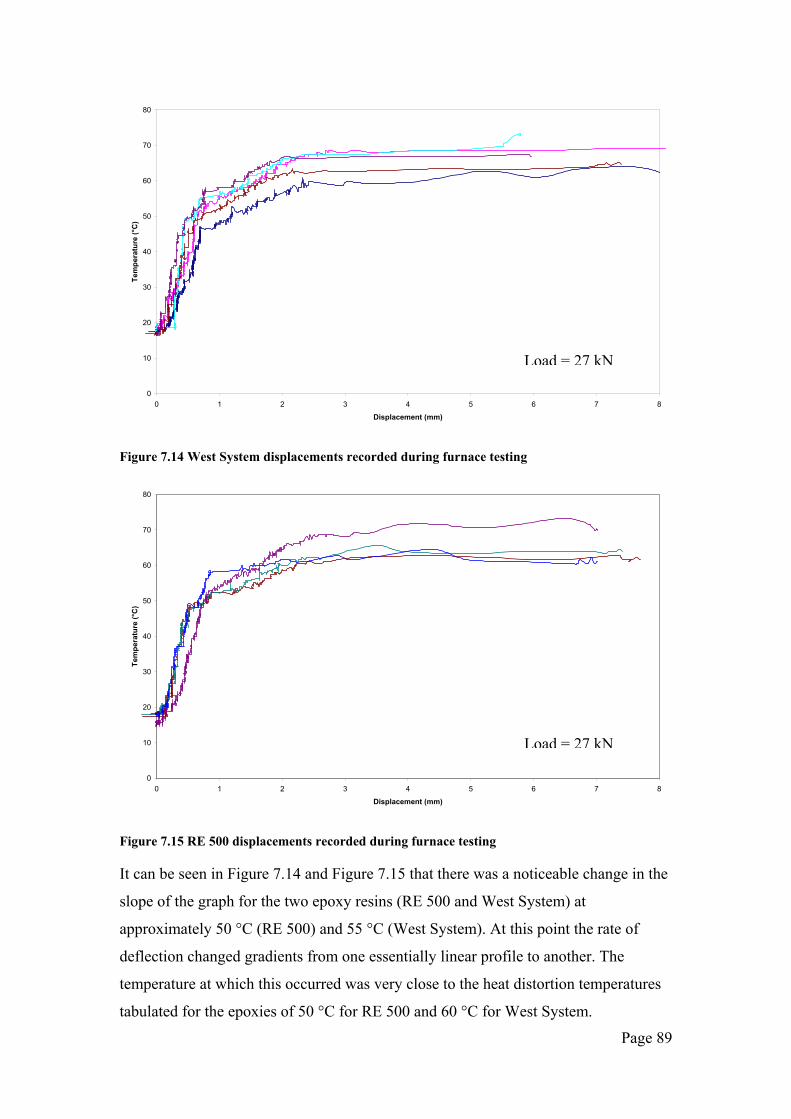
Page 89
0
10
20
30
40
50
60
70
80
0 1 2 3 4 5 6 7 8
Displacement (mm)
Tem
pera
ture
(°C
)
Figure 7.14 West System displacements recorded during furnace testing
0
10
20
30
40
50
60
70
80
0 1 2 3 4 5 6 7 8
Displacement (mm)
Tem
pera
ture
(°C
)
Figure 7.15 RE 500 displacements recorded during furnace testing
It can be seen in Figure 7.14 and Figure 7.15 that there was a noticeable change in the
slope of the graph for the two epoxy resins (RE 500 and West System) at
approximately 50 °C (RE 500) and 55 °C (West System). At this point the rate of
deflection changed gradients from one essentially linear profile to another. The
temperature at which this occurred was very close to the heat distortion temperatures
tabulated for the epoxies of 50 °C for RE 500 and 60 °C for West System.
Load = 27 kN
Load = 27 kN

Page 90
This behaviour was not evident in the HY 150 system. At around 100 °C there was
some distortion in the shape of the graph, but it was thought that this was more likely
to be related to moisture being driven off. This is supported by the curve when the test
specimens were heated beyond 100 °C, where the slope is similar above and below
100 °C, except for a step at 100 °C.
0
20
40
60
80
100
120
140
160
0 1 2 3 4 5 6 7 8
Displacement (mm)
Tem
pera
ture
(°C
)
Figure 7.16 HY 150 displacements recorded during furnace testing
Unfortunately it was not possible to separate the slip of the adhesive from any
elongation of the timber, due to the setup of the testing. If this was recorded then it
would have been possible to determine whether prior to the heat distortion
temperature being reached there was any slipping of the adhesive.
Based on the definition of the heat distortion temperature (Lee and Neville, 1957) it
would be expected that there would be negligible deflection of the epoxy prior to this
point.
As the displacements observed with increasing temperature were seen to be linear up
to the 50 or 60 °C change in gradient, it was speculated that this was due solely to
thermal effects in the timber and steel, as opposed to slip within the epoxy. This issue
cannot be satisfactorily resolved from the testing that was conducted as the relative
displacement was not recorded. All that is known is that there was some slipping of
Load = 8 kN

Page 91
the epoxy at some stage during the test, based on the deformation observed in the
failed specimens.
This elongation of the test specimens could come from two possible sources. One of
these was from heating of the steel and expansion, the other was charring of the
timber and the increased stress on the residual section leading to an increase in strain.
7.6.1.1 Speculative calculation of test specimen extension – cold
The stress and strain of the system must be calculated to give the extension of the test
specimen being loaded, prior to heating. To achieve this the test specimens were
divided into multiple components with different sizes and properties. The properties
of each component are shown in Figure 7.17, with dimensions in mm. The length
referred to in Figure 7.17 as the instrumented length is the length over which the
elongations were recorded.
Figure 7.17 Components of test specimen, for calculation of thermal elongation in furnace
The specimen was subjected to a tensile force of 27 kN while being tested. To
calculate the relative strains of each portion of the test specimen it was important to
know what force was being carried by each material. In the timber only and steel only
portions of the test specimen it was clear which material was carrying the force. Over
the portion with the embedded steel rod it was assumed that there was a linear
exchange of force from the steel to the timber. For the section where there was a
linear distribution of force between the rod and the timber half of the strain came from
the timber and half from the steel. This allowed the specimen to be transformed as
shown in Figure 7.18, with the transition of materials being taken to occur at the mid
point of the embedded steel rod.
Hot Cold
500 300 150 150 300 500
Steel rod
Timber with
steel rod
Timber
Instrumented length

Page 92
Figure 7.18 Transformed specimen for calculation of thermal elongation
From the transformed specimen shown in Figure 7.18 the properties of the LVL and
steel can be assigned to each portion. By knowing the section sizes prior to heating
and the applied load on the specimen the stress and strain of each could be found. The
stresses and strains were acting within the specimen at the beginning of the furnace
test, for a 105 x 105 mm specimen. These are shown in Table 7.3. For the purposes of
this calculation the section was divided into four components, the labelling of these is
shown in Figure 7.18.
In Table 7.3 the strain and elongations have been worked out based on a tensile force
of 27 kN, using Hooke’s law, as shown in Equation 7.1.
εσ E= Equation 7.1
Where: σ Stress (MPa)
E Modulus of elasticity (GPa)
ε Strain (no units)
Table 7.3 Calculation of elongation for transformed specimen
Component Material Length
(mm)
Cross-
section
(mm2)
MOE
(GPa)
Stress
(MPa) Strain
Elongation
(mm)
A Steel 650 201 200 134 0.00067 0.4355
B LVL 300 11,025 11.8 2.45 0.000208 0.0622
C LVL 300 11,025 11.8 2.45 0.000223 0.0622
D Steel 650 201 200 134 0.00067 0.4355
Total elongation (mm) 0.9954
The elongations shown in Table 7.3 give a total theoretical elongation for the test
Hot Cold
650 300 300 650
Steel rod
Timber
AA B C D

Page 93
specimen of 0.995 mm under cold conditions. Data from the loading of the test
specimens indicated that the extension at 27 kN was approximately 1.05 mm. This
slight difference is considered within the tolerances of this experiment.
7.6.1.2 Speculative calculation of test specimen extension – hot
The calculation relies on the char depth of the test specimen. As this was only
measured at the end of the test the char depth for earlier stages of the test must be
interpolated back from this result.
By taking the point when the displacement time curve first changed in slope, at
around 50 °C, then using the 105 x 105 mm RE 500 data, a displacement of 0.78 mm
was recorded. This displacement was the increase in length of the test specimen due to
thermal effects only. It does not include the extension caused while the test specimen
was being loaded.
Thermal extension effects only occur in the sections of the specimen being heated.
Referring to the naming assigned in Figure 7.18 these are sections A and B of the
specimen. Section A is the steel rod, which extends due to the temperature increase in
the steel. Section B is the timber section, whose cross-section was reduced by
charring, thus increasing the stress on the unburnt timber. This additional stress
caused further extension of the test specimen.
7.6.1.2.1 Section A – Steel
If the insulation to the end of the steel rod within the furnace was perfect then the
highest temperature reached by the steel would be roughly the temperature of the
epoxy; as recorded by the thermocouple.
The length of heated rod is assumed to be the 300 mm embedded in the test specimen
and 100 mm external to the test specimen, giving a heated length of 400 mm. This
portion external to the test specimen was included as it was observed to be hot when
removed from the oven.
Elongation of the steel rod was calculated using a heated length of 400 mm and the
Eurocode 3 formula for elongation of steel, as given by Buchanan (2001) and shown
in Equation 7.2. In this equation L is the length of the steel, ∆L is the change in length
and T is the temperature of the steel in °C.

Page 94
( )201014 6 −×=∆ − TLL Equation 7.2
Taking the steel length as 400 mm and taking its temperature as 50 °, then the change
in extension was calculated as equal to 0.17 mm.
If the insulation was not perfect, then the temperature of the steel rod would be greater
and hence would have greater extension. When the test specimens were removed from
the furnace and cooled it was noticed that the water was boiling instantly from the
coupler. This suggested that the temperature of the test specimens was significantly
greater than 100 °C at the conclusion of the test. Assuming that the temperature was
100 °C at the point of interest then the change in length can be reassessed, again using
Equation 7.2.
7.6.1.2.2 Section B – LVL
When the temperature of the steel rod reaches 50 °C during testing the test specimen
had been exposed to the furnace for 31.5 minutes. In this test the average charring rate
(from Table 7.4) was 0.55 mm/min. Using this char rate provides us with a depth of
char for this test specimen of 17mm at the point of interest.
For a 105 x 105 mm specimen with 17 mm of char on all faces the residual section
size was 71 x 71 mm. At elevated temperatures the strength of the timber decreases.
To account for this the effective cross-section method (Buchanan, 2001) discounts a
layer of zero strength from the calculation for strength. The thickness varies between
timber codes, with Buchanan (2001) quoting variation between 7 and 7.5 mm. For this
calculation the thickness of the zero strength layer was taken as 7 mm.
Using a zero strength layer of 7 mm provides an effective full strength section
57 x 57 mm in size. Applied to this reduced cross-section was the same 27 kN tensile
force. This gave an average tensile stress on the cross-section of 8.31 MPa. It can be
seen that this was increased from the cold stress of 2.45 MPa shown in Table 7.3.
Hooke’s law (Equation 7.1) was then be used to determine the elongation of the test
specimen due to thermal effects. This gave a strain of 0.000768 and a corresponding
extension of 0.23 mm. This extension was the extension from zero load, so the
extension calculated at ambient temperature must be subtracted. From Table 7.3 this

Page 95
extension was 0.0668 mm and hence the thermal extension in the timber section was
0.16 mm.
When the expansion of the steel (0.45 mm, using 100 °C) and the LVL (0.16 mm) are
combined they gave a theoretical thermal extension of the test specimen of 0.61 mm.
This was less than the observed extension of 0.78 mm.
Given the extent of the approximations in the heating of the steel it is possible that the
extension of the specimen up until the epoxy reaches 50 °C was due solely to thermal
effects in the timber and steel. If this was the case then there was no slip in the epoxy
and the reduction in strength would have been reversible after the fire.
Unfortunately, the slip between the rod and the timber was not recorded, so this
theory cannot be confirmed by this research.
7.7 Prediction of fire resistance
As the furnace was not exposing the test specimens to the standard ISO 834 time-
temperature curve used in fire resistance tests, the time to failure in these tests was not
the fire resistance of the connection. To convert from the time to failure in this
furnace to an estimated fire resistance, the depth of char observed was compared with
the rate of char recorded in fire resistance tests of LVL under the ISO 834 fire by
Lane et al. (2004).
7.7.1 Rate of charring
During a fire a layer of char forms over the surface of unburnt timber which then
shrinks and burns away after a period of time. To measure the charring rate of the
timber the thickness of timber which has been converted to char was required. This
thickness was best measured by removing the char layer after testing and measuring
the remaining section to back-calculate the amount of timber which had been
converted to char. The residual sections and the corresponding char depths are shown
in Table 7.4. Char rates tabulated in Table 7.4 are the average char over the duration
of the test, that is, the observed depth of char divided by the duration of exposure.
This treats the period at the beginning of the test before the onset of char as part of the
charring time. This was done to be consistent with the testing procedure of Lane et al.
(2004), the source of the standard furnace charring data to be used for comparison.

Page 96
Table 7.4 Residual sections and depths of char following furnace testing
Sample Sample size Adhesive
Time to
failure
(minutes)
Residual
thickness*
(mm)
Depth of
char*
(mm)
Average
char rate*
(mm/min)
79 63 x 63 mm West 15:00 51 6 0.40
80 63 x 63 mm West 15:30 50 6.5 0.42
81 63 x 63 mm West 15:30 51 6 0.39
82 63 x 63 mm RE 500 16:00 48 7.5 0.47
83 63 x 63 mm RE 500 15:00 51 6 0.40
84 63 x 63 mm RE 500 15:30 49 7 0.45
85 63 x 63 mm HY 150 28:30 30 16.5 0.58
86 63 x 63 mm HY 150 20:30 43 10 0.49
87 63 x 63 mm HY 150 21:00 41 11 0.52
76 105 x 105 mm West 38:00 68 18.5 0.49
77 105 x 105 mm West 36:30 70 17.5 0.48
78 105 x 105 mm West 38:00 71 17 0.45
91 105 x 105 mm RE 500 36:30 65 20 0.55
88 105 x 105 mm HY 150 61:30 30 37.5 0.61
89 105 x 105 mm HY 150 63:30 28 38.5 0.61
Mean char rate (mm/min) 0.47
*depth of char was observed to be slightly more severe on the sides of the test
specimen. To give a conservative fire resistance this value has been used in the
assessment of char rates.
It can be seen that the char rates for the test specimens tested in the furnace ranged
from 0.40 mm/min up to 0.61 mm/min, with a mean value of 0.47 mm/min. This was
significantly lower than the average charring rate observed in the ISO 834 furnace by
Lane et al. (2004) of 0.71 mm/min.
To convert from time in the custom-built furnace to time in the standard furnace
Equation 7.3 was proposed.
custISO
custISO t
cct = Equation 7.3

Page 97
Where: tISO Fire resistance time in ISO furnace (mins)
tcust Time exposed to the custom furnace
cISO Char rate recorded in the ISO furnace (0.71 mm/min)
ccust Char rate recorded in the custom furnace (mm/min)
Using Equation 7.3 the durations in the custom-furnace were converted to expected
durations in the ISO furnace, or the fire resistance. The comparison between the two
durations is shown in Figure 7.19. This comparison was made for all test specimens
tested in the custom furnace. No differentiation was made between the 105 x 105 mm
and the 63 x 63 mm test specimens in this comparison as the charring rate was
observed to be similar for both.
0
10
20
30
40
50
60
0 10 20 30 40 50 60 70
Time of exposure in custom furnace (mins)
Fire
resi
stan
ce (m
ins)
Figure 7.19 Comparison of recorded furnace exposures with fire resistance
From these comparisons, the results in Table 7.4 can be extended by the addition of
the fire resistance of the test specimens. This appended table is shown in Table 7.5.

Page 98
Table 7.5 Results from furnace testing, with calculated fire resistance
Sample Sample size Adhesive
Time to
failure
(minutes)
Depth of
char*
(mm)
Average
char rate*
(mm/min)
Calculated fire
resistance
(mins)
79 63 x 63 mm West 15:00 6 0.40 8
80 63 x 63 mm West 15:30 6.5 0.42 9
81 63 x 63 mm West 15:30 6 0.39 9
82 63 x 63 mm RE 500 16:00 7.5 0.47 11
83 63 x 63 mm RE 500 15:00 6 0.40 8
84 63 x 63 mm RE 500 15:30 7 0.45 10
85 63 x 63 mm HY 150 28:30 16.5 0.58 23
86 63 x 63 mm HY 150 20:30 10 0.49 14
87 63 x 63 mm HY 150 21:00 11 0.52 15
76 105 x 105 mm West 38:00 18.5 0.49 26
77 105 x 105 mm West 36:30 17.5 0.48 25
78 105 x 105 mm West 38:00 17 0.45 24
91 105 x 105 mm RE 500 36:30 20 0.55 28
88 105 x 105 mm HY 150 61:30 37.5 0.61 53
89 105 x 105 mm HY 150 63:30 38.5 0.61 55
Mean char rate (mm/min) 0.47
7.8 Conclusions from furnace testing
From this furnace testing measurements of the fire resistance of the epoxy-grouted
steel rod connections was able to be made.
Time to failure measured in the furnace during this phase of testing was converted to
fire resistance in a standard furnace by comparing the depth of char. These
comparisons were made by using the depth of char observed in the furnace tests in
this research compared to the depth of char observed in LVL exposed to the ISO 834
fire (Lane et al., 2004).
This research yielded a range of fire resistance values from 8 minutes for the
63 x 63 mm epoxy specimens up to 55 minutes for the 105 x 105 mm HY 150
specimens.

Page 99
Deflections were observed to increase throughout the test in spite of the load being
held constant. It was important to know whether this was due to slip of the adhesive,
or to thermal effects in the timber and steel. Thermal effects in the timber and steel are
inevitable and must be expected. Slip in the adhesive would be more serious, as it
indicates failure of the connection. Direct measurement was not made of this slip, but
speculative calculations indicate that this deflection could not have been due to slip
until the adhesives reached their HDT (50 – 60 °C for epoxy).
Future testing could directly measure the slip between the timber and the adhesive.
Although there is very little space in which any probe could be located to make this
measurement on this furnace, it would provide valuable information on when the
adhesives begin to slip.
Further testing using this furnace would require the element to be replaced and it is
recommended that an element with an electrically insulated sheath be used. This will
allow a thermocouple to be bonded to the element and for the temperature of the
element to be controlled. This will enable test specimens to be tested under a constant
heat flux and the exposure could be controlled to be similar to that of a standard
furnace.

Page 100
8 Discussion
8.1 Comparison with previous work
Comparisons with the work of van Houtte (2003), who tested West System epoxy in
LVL showed cold test results similar to those in the current research. Methodology
and materials used by van Houtte (2003) were similar to that used for this research, so
it would be expected that the results were consistent. However the current study went
further than Van Houtte (2003) and performed testing at elevated temperatures.
Deng (1997) performed an extensive study into the pullout strength of steel bars
epoxy-grouted into glulam timber. In his study he proposed an equation for
calculating the ultimate strength of single bars grouted into glulam, based on the
testing of three epoxies, one of which was the West System. However tests performed
in the current research with the West System used an embedment depth which fell
outside of the limits of validity for the equation. This research found that the equation
by Deng over-predicted the observed ultimate loads by approximately 20 %. This may
be largely due to the difference between the glulam timber used by Deng and the LVL
used in the current research.
Barber (1994) performed oven tests on rods grouted into glulam timber using similar
methodology as the current research. His results showed a trend similar to that
observed in the oven tests for this research. The general trend showed only minor
decreases in strength of the connection until around 50 °C and then a sharp fall so that
only around 25 % of the cold strength remained at 80 °C. In Barber’s (1994) tests he
used two epoxy resins, West System and Nuplex K80. These were seen to perform
similarly in the oven tests, but the RE 500 tested in the current research was observed
to have a greater strength at 80 °C when compared with the performance of both of
the West System and Nuplex K80 in Barber’s (1994) and the current research.
Unpublished Hilti literature (Arandjelovic, D. pers. comm.) on RE 500 gives the
strength loss with temperature to be similar to those values observed in this testing.
Values found in the literature tend to over-predict the strength of RE 500 by
approximately 10 % when compared with results observed in this study. This may be
due to the RE 500 tests in the literature being performed with steel rods grouted into
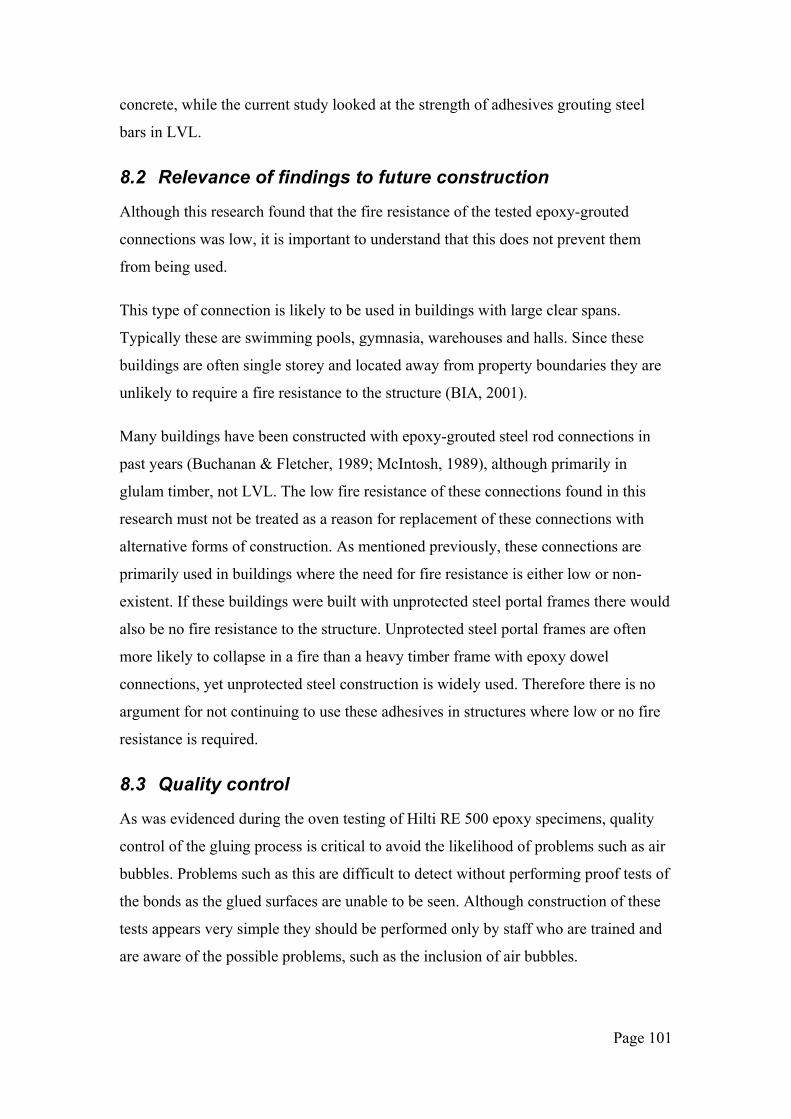
Page 101
concrete, while the current study looked at the strength of adhesives grouting steel
bars in LVL.
8.2 Relevance of findings to future construction
Although this research found that the fire resistance of the tested epoxy-grouted
connections was low, it is important to understand that this does not prevent them
from being used.
This type of connection is likely to be used in buildings with large clear spans.
Typically these are swimming pools, gymnasia, warehouses and halls. Since these
buildings are often single storey and located away from property boundaries they are
unlikely to require a fire resistance to the structure (BIA, 2001).
Many buildings have been constructed with epoxy-grouted steel rod connections in
past years (Buchanan & Fletcher, 1989; McIntosh, 1989), although primarily in
glulam timber, not LVL. The low fire resistance of these connections found in this
research must not be treated as a reason for replacement of these connections with
alternative forms of construction. As mentioned previously, these connections are
primarily used in buildings where the need for fire resistance is either low or non-
existent. If these buildings were built with unprotected steel portal frames there would
also be no fire resistance to the structure. Unprotected steel portal frames are often
more likely to collapse in a fire than a heavy timber frame with epoxy dowel
connections, yet unprotected steel construction is widely used. Therefore there is no
argument for not continuing to use these adhesives in structures where low or no fire
resistance is required.
8.3 Quality control
As was evidenced during the oven testing of Hilti RE 500 epoxy specimens, quality
control of the gluing process is critical to avoid the likelihood of problems such as air
bubbles. Problems such as this are difficult to detect without performing proof tests of
the bonds as the glued surfaces are unable to be seen. Although construction of these
tests appears very simple they should be performed only by staff who are trained and
are aware of the possible problems, such as the inclusion of air bubbles.

Page 102
Improper mixing of the resin and hardener, especially for systems mixed by hand such
as the West System, can also lead to reduced strength. This was not a factor evidenced
in this research but during furnace testing by Barber (1994) using West System a
failure was observed while load was being applied, prior to heating in the furnace.
This failure occurred at 25 kN, or around 20 % of the expected cold failure load.
Observations found that this failure was due to inadequate mixing of the hardener
leading to the resin being largely uncured.
A potential solution to this problem was provided by Gaunt (1998). Gaunt (1998)
found that simply including coloured dye with the resin allowed for visual
confirmation that mixing had occurred. This is also used in the RE 500 system, where
the resin is a pale grey colour and the hardener is red, resulting in a mixed product
that is pink.
Transport limitations often dictate the maximum size of specimens which can be pre-
fabricated in the factory. When epoxied rods are used to attach timber sections to steel
brackets the epoxy grouting can be done in the controlled factory environment,
leaving only the bolting to be performed on site. For epoxy rod connections where the
epoxied rods are grouted into timber at both ends (as opposed to being attached to a
steel bracket) (see van Houtte, 2003), it may be inevitable that grouting is performed
on the construction site. When gluing occurs on site there may not be the same
stringent controls on the curing time nor a level surface to lay the frame down and this
may cause alignment problems. All of these factors can lead to a connection which
has considerably less than the intended design strength.
8.4 Selection of adhesives
Three adhesives were tested during the course of this research. Two of these were
epoxy resins (West System and RE 500) and the third, HY 150, was a hybrid of
urethane methacrylate and cement. Structural performance varied between these
adhesives, as did the reliability.
8.4.1 Epoxy resins
Both of the epoxy resins were found during the cold tests to behave almost identically.
They both had similar ultimate loads and both failed in the same manner, with failures
of the timber due to their good bonding.

Page 103
In the oven tests the West System was observed to retain its strength better than the
RE 500 up to a temperature of around 60 °C and then the RE 500 was seen to retain
its strength better. Both epoxies were seen to fail in a similar manner at elevated
temperatures, with the epoxy becoming crumbly and failing.
Tests involving heating and cooling the specimens prior to testing also yielded no
differences between the test specimens, with both returning to their cold strength.
Furnace testing of the specimens also gave very similar results, unfortunately two of
the 105 x 105 mm RE 500 tests were unable to be performed due to the furnace
failure. This may have provided some evidence of differing performance, although
based on the 63 x 63 mm test specimens the difference would be minimal.
The two epoxies are grouted differently. For the West System epoxy the low viscosity
means that test specimens must be cast in such a way that the resin cannot run out.
This means that additional filler and breather holes must be drilled to use for filling
the epoxy. As the West System is supplied in two containers it must be weighed and
mixed by hand, which is a potential source for problems.
Gluing rods in with the RE 500 system is simpler, as it has a higher viscosity and does
not require measuring of the components. Due to the high viscosity the epoxy will not
pour out of a hole, which allows the resin to be injected directly into the embedment
hole. One drawback with this method is that it is easy to trap air bubbles in the epoxy.
A special nozzle was built to overcome this problem and a similar nozzle is available
from Hilti. As the RE 500 is mixed in the gun, the ratio of epoxy to hardener is more
uniform and the nozzle provides good mixing of the product.
For construction purposes either of the two epoxy resins (West System or RE 500)
would be expected to perform equally well. Aside from price and availability the main
factors to separate the two epoxies are the gluing methods. Both of these methods
have their strengths and weaknesses and these should be assessed before selecting an
adhesive.
8.4.2 HY 150 hybrid adhesive
It was noticed that in all of the HY 150 specimens tested both cold and in the oven
that the failures occurred at the wood/glue interface, indicating poor bonding to the

Page 104
timber. With the poor bonding not only is there a lower strength for the connection,
but it also raises concerns about durability. As the glue has not completely bonded to
the timber surface, any changes in this surface, such as shrinkage, or changes in the
moisture content could lead to the failure of this connection. Some of these factors
may have been evident in the scatter of results which was found for HY 150 in both
the oven and furnace tests.
Recordings of moisture movement were not made, but the scatter in the results for
HY 150, especially in the oven and furnace tests, was greater than that for both of the
epoxies. This scatter was also unable to be explained by gluing problems as it was
with the air bubbles in the RE 500. It has been assumed that this variation was due
primarily to the bond strength being inconsistent.
Due to the unpredictability of the HY 150 it is not recommended as a substitute for
epoxy resin in this type of connection.
8.5 Comparisons with furnace testing
Full-scale fire resistance testing in New Zealand can only be performed in the furnace
operated by the Building Research Association of New Zealand. This is costly and for
research purposes while it provides excellent data some of the quantification work can
be done on a smaller scale. For this purpose a smaller furnace was constructed and
was used in the current research. This furnace was able to provide consistent thermal
exposure to the specimens, which enabled comparisons to be drawn between their
behaviours. It was unknown, however, exactly what this exposure was.
The design of the furnace meant that it was impossible to precisely control the
temperature of the element. This prevented the heating of the test specimens from
following the ISO 834 time-temperature curve used for fire resistance. The outcome
of this shortfall is that it required all furnace results to be converted to an equivalent
fire resistance.
While the comparisons made using the rate of char observed by Lane (2004) are
expected to be accurate this method has not been proved. It may be that the rate of
temperature rise of the test specimen alters the heat transfer to the core of the test
specimen (and hence the epoxy) without greatly affecting the char depth.

Page 105
If the temperature of the element could be controlled then tests could be conducted
with temperatures following the ISO 834 curve and more confident predictions of fire
resistance could be made.
By knowing the temperature of the element the radiant heat flux to which the test
specimens are exposed can be calculated. This can then be used to correlate to the
ISO 834 furnace results using the radiant exposure area correlation method proposed
by Nyman (2002). This correlation was shown to give good correlations between the
real fires and the failure times of the construction elements, which were generated in
the standard furnace. If this method was able to be used to correlate the furnace built
for this testing to the standard furnace it would remove the need for measuring the
char layer and could be more accurate than comparing char layer depths. This method
was not able to be used with the current furnace setup, as the heat flux was not
constant and attempts to measure it were unsuccessful.
8.5.1 Recommissioning of furnace
As was noted in the furnace results section, severe damage was done to the furnace
during the testing. This damage was caused by the extreme temperatures reached
during one of the 105 x 105 mm HY 150 tests. Temperatures reached within the
stainless wire mounting the element was such that it appears to have melted and
allowed the element to detach from its mounts.
Damage to the furnace is shown in Figure 8.1, with the intact element shown on the
left. Porcelain insulators used to attach the element can be seen around the perimeter
of the element. The insulators were fitted to either side of small holes drilled in the
inner skin of the oven and allowed the stainless wire to pass through the wall and
attach the element. In the damaged furnace, seen on the right in Figure 8.1, many of
these are seen to have detached, as are the semi-circular supports used on the lower
side of the element.

Page 106
Figure 8.1 Furnace element as built (left) and following severe damage (right)
Future plans for this testing frame are to remove the remnants of the existing element
and replace it with two elements which are contained within an electrically insulated
sheath.
Being within an electrically insulated sheath will allow thermocouples to be attached
to the outer surface of the element and enable the temperature to be controlled with a
thermostat. It also reduces the danger to the user of the furnace. In its current design,
if the element touched the skin of the furnace it could make the entire furnace
electrically live. The insulated elements will remove this risk entirely.


Page 107
9 Conclusions and recommendations
9.1 Summary of testing
During this research testing of epoxy-grouted steel bars in LVL timber was carried out
using three different adhesives. These were the West System epoxy resin, Hilti
RE 500 epoxy resin and Hilti HY 150 hybrid adhesive.
Tensile testing was initially performed at ambient temperatures to compare the
performance of the three adhesives under normal conditions. Tensile tests were then
performed on specimens which had been heated in an oven at temperatures of up to
100 °C. During these tests some test specimens were allowed to cool to room
temperature prior to being tested. Finally specimens were tested in a custom-built
furnace to investigate their fire resistance while carrying load.
9.2 Summary of test results
Of the three adhesives, both epoxy resins (West System and RE 500) were found to
have similar results at ambient temperatures. The hybrid adhesive, HY 150, was found
to have an ultimate strength of around 30 % of that recorded for the two epoxy resins.
Failure modes of the HY 150 at the wood/glue interface indicate poor bonding of the
adhesive to the timber. This led to concerns about the durability of HY 150, especially
when moisture is increased on the bond surface and also if shrinking or swelling
occurs. During the oven tests highly variable results were obtained for the HY 150.
Irregularities in the test specimens were ruled out following inspection of the test
specimens. The variable results have been attributed to poor bonding properties of the
HY 150. Attempts to provide a mechanical bond using screws to increase the ultimate
strength of the HY 150 system were unsuccessful. Failures occurred at the wood/glue
interface prior to the mechanical fasteners carrying any load.
Minor differences in behaviour were observed between the West System and RE 500
epoxy resins when heated in the oven. Below 50 °C the epoxies behaved as they did at
ambient temperatures. Above this point failures occurred within the epoxy instead of
within the timber. In these failures the epoxy was found to have a crumbly texture.

Page 108
At temperatures above 50 °C West System was found to lose strength at a greater rate
than RE 500. At 100 °C the West System was observed to have around 30 % of its
cold strength remaining and RE 500 was observed to have approximately 40 % of its
cold strength remaining.
Strength reductions observed for HY 150 in the oven tests were almost linear with
temperature. HY 150 was found to have approximately 40 % of its cold strength
remaining at 100 °C.
In order to predict post-fire behaviour of these connections tests of specimens were
conducted after they had been heated and then allowed to cool. Results showed that as
long as the epoxy did not slip while it was hot, it would return to full strength after
cooling.
In practical terms this means the connection would not need to be replaced as long as
no movement occurred at the connection during a fire. During furnace testing both
epoxy resins were found to behave similarly. Slipping of the adhesive was observed to
begin at around 50 °C for RE 500 and at approximately 55 °C for West System.
Extensions of the test specimens were recorded prior to the 50 or 55 °C initiation of
slipping described above. These extensions were shown by calculation to be possibly
due to expansion in the steel rod and thermal effects in the timber. This calculation
was unable to be verified by the testing.
Fire resistance of the connections was found by calibrating the char depths recorded in
this research with results by Lane et al. (2004), who burnt LVL in the standard
furnace. These gave fire resistance for the epoxy resins of around 10 minutes in the
63 x 63 mm test specimens and 25 minutes for the 105 x 105 mm test specimens. For
the HY 150 the fire resistance was greater, this was partly due to the HY 150 carrying
a lower test load. Fire resistance for these test specimens ranged from around
15 minutes for the 63 x 63 mm specimens up to 55 minutes for the 105 x 105 mm
specimens.
No significant differences were found between the performance of the two epoxy
resins (West System and RE 500). Gluing procedures for the two were very different
and may be the deciding factor in selecting between the two.

Page 109
Overall, the two epoxy resins (West System and RE 500) were found to have similar
properties and either could be used successfully. HY 150 was found to be unsuitable
for use in timber due to its poor bonding.
Where fire resistance is required the thickness of the timber may have to be increased
slightly to keep the epoxy temperatures below 50 °C. Fire resistance ratings of
30 minutes are feasible, although only 25 minutes was achieved in this research.
Ratings of 60 minutes or more would either require an impractical thickness of timber
for insulation, or protection with other materials such as gypsum plaster board.
9.3 Design recommendations
When designing epoxy-grouted steel rod connections to achieve a fire resistance it is
critical to ensure that the strength exceeds the applied load after a given exposure to
fire. While the epoxy remains below 50 °C the strength remains essentially the same
as it was at ambient temperatures. Above 50 °C the epoxy begins to lose strength
rapidly as it passes its heat distortion temperature (HDT). Unfortunately the oven test
results and the furnace results provide conflicting information on the rate of strength
loss above the HDT, which makes accurate strength loss difficult to predict. For
design purposes the temperature of the epoxy should be maintained below its HDT,
typically around 50 °.
Both the West System and RE 500 were found to have similar strength characteristics
in grouting steel rods into LVL. At elevated temperatures both epoxies lost strength at
a similar rate. Both brands of epoxy are recommended for use in epoxy-grouted steel
rod connections.
It is not recommended that HY 150 is used for grouting steel rods into timber. It does
not bond sufficiently to the timber and may not provide a durable connection.
9.4 Recommendations for future research
Further research continuing this work could be done in the following areas:
• Performing fire testing of the dowelled connections developed by Scheibmair
(2003), as described in section 3.1. These connections have been shown to
have excellent strength at ambient temperatures, but have unknown fire

Page 110
resistance. Tensile tests of these connections would be possible in the custom-
built testing rig constructed for this research.
• A further assessment could be conducted on the heating and cooling of the
epoxy-grouted steel rod connection. It was found in this research that if the
test specimens were heated and cooled without any load being applied that
they fully recovered their strength. It was also found that the epoxy did not
become crumbly when heated without an applied load. Further assessment
could be undertaken to assess the extent of load which is required before the
connections will not regain their strength upon cooling.
• It was found that there was a discrepancy between the load carried at a given
temperature in the oven tests and the load carried at that temperature in the
furnace tests. This is thought to be related to the oven specimens being
unloaded while heated and the furnace specimens being held under constant
load. Further investigation could look into the effects of load on the epoxy
while it is being heated.
• In the furnace tests within this research the test setup allowed for the adhesive
to be heated through the wood only. Epoxy-grouted steel rods can be used in
connections utilising a steel hub (Buchanan and Fairweather, 1993). The
addition of a steel hub means that heat can be transmitted via the steel hub into
the rods much quicker and would likely reduce the fire resistance of the
connection. Assessments could be made as to how significant the inclusion of
the steel hub is on the fire resistance of the connection.
9.5 Overall conclusions
The primary objective of this research was to quantify and improve the fire resistance
of epoxy-grouted steel rod connections in LVL timber. This quantification was
achieved through the furnace testing, with a fire resistance being found for each of the
adhesives and specimens sizes tested.
Attempts were made to improve the fire resistance of the epoxy-grouted steel rod
connection by using alternatives to epoxy resin, such as Hilti’s HY 150. This proved

Page 111
to be unsuccessful, as the behaviour under cold conditions prevented it from being a
suitable replacement.
The addition of a mechanical fastener was attempted with the HY 150 specimens,
with the provision of a screw passing through the wood and the resin. This was in
order to improve the cold strength and give a mechanical bond if the adhesive failed.
This was found to be unsuccessful, as the mechanical bond was not as stiff as the
adhesive and this disparity caused the mechanical fastener to carry no load until after
the adhesive had failed. It was not tested under fire conditions as the displacement
caused before the mechanical fastener began to carry load was too great to be
acceptable.
Tests were performed of all three adhesives to determine their performance at
elevated temperatures. This enabled comparisons of their strength loss at elevated
temperatures.
Tests were also conducted on specimens which had been heated in the oven and then
cooled prior to testing. These tests demonstrated that, for an unloaded specimen, the
adhesives regained their strength upon cooling. This means that for a epoxy-grouted
steel rod connection where there has been a minor fire that it should regain its strength
upon cooling, provided that there has been no slip of the adhesive.
Simulated fire conditions were used to measure the fire resistance of the epoxy-
grouted steel rod connections in LVL timber. A furnace was custom-built for this
research, which enabled specimens to be held under a tensile load and exposed to
simulated fire conditions. Failure times were recorded in these tests, which were then
able to be correlated to the fire resistance of the connection under standard conditions.
Overall it was found that epoxy-grouted steel rod connections in LVL could be
designed with some fire resistance provided that there was sufficient timber
surrounding the epoxy. It was found that although epoxy resins behave poorly at
elevated temperatures, no suitable substitutes could be found to improve the fire
resistance.


Page 112
10 References Adhesive Technologies Ltd. (1992). Information sheet of West System – resin and
hardener. Adhesives Technologies Ltd. Auckland, New Zealand.
Barber, D.J. (1994). ‘Fire resistance of epoxied steel rods in glulam timber’. Civil
Engineering Research Report 94-1. University of Canterbury, New Zealand.
BIA. (1992). New Zealand Building Code. Building Industry Authority, Wellington,
New Zealand.
BIA. (2001). Acceptable solutions to the Building Code, C/AS1. Building Industry
Authority, Wellington, New Zealand.
Buchanan, A.H. (1999). ‘Burning issues in timber engineering’. In Walford, G.B. and
Gaunt, D.J. (ed.) Proceedings of the Pacific Timber Engineering Conference.
Volume 3, pp 1 – 11.
Buchanan, A.H. (2001). Structural design for fire safety. John Wiley & Sons Ltd,
Chichester.
Buchanan, A.H. (ed.) (2002). Timber design guide. Second edition. New Zealand
Timber Industry Federation Inc, Wellington, New Zealand.
Buchanan, A.H. and Fairweather, R.H. (1993). ‘Seismic design of glulam structures’.
Bulletin of the New Zealand national society for earthquake engineering.
Volume 26, no. 4, pp 415 – 436.
Buchanan, A.H. and Fletcher, M.R. (1989). ‘Glulam portal frame swimming pool
construction’. Proceedings of the second Pacific Timber Engineering
Conference. pp 245 – 249.
Buchanan, A.H. and King, A.B. (1991). ‘Gusset plate connections in glue-laminated
timber’. Fire and Materials, Vol. 15, pp 137 – 143.
Buchanan, A.H. and Moss, P.J. (1999). ‘Design of epoxied steels rods in glulam
timber’. In Walford, G.B. and Gaunt, D.J. (ed.) Proceedings of the Pacific
Timber Engineering Conference. Volume 3, pp 286 – 293.

Page 113
Carling, O. (1989). ‘Fire resistance of joint details in load bearing timber
construction – a literature survey. [translated from Swedish]. BRANZ Study
Report SR 18. Building Research Association of New Zealand.
CHH (2000). HYSPAN span tables for residential building. Carter Holt Harvey Wood
Products Limited.
Chinniah, R. (1989). ‘Fire performance of nailed gusset connections between glulam
members’. Civil Engineering Research Report 89-6. University of Canterbury,
New Zealand.
Deng, J.X. (1997). ‘Strength of the epoxy bonded steel connection in glue laminated
timber’. Civil Engineering Research Report 97-4. University of Canterbury,
New Zealand.
Eistetter, S. (1999). ‘Strength of cement bonded steel connections in glue laminated
timber’. Civil Engineering Research Report 99-1. University of Canterbury,
New Zealand.
Gaunt, D.J. (1998). ‘Joints in glulam using groups of epoxy-grouted steel bars’. New
Zealand timber design journal. Issue 1, Volume 7, pp 13 – 20.
Goulding, T.M. (1994). ‘Epoxy resin adhesives’. In Pizzi, A. and Mittal, K.L. (ed.)
Handbook of adhesive technology. Marcel Dekker Inc, New York. pp 531 –
547.
Green, D.W., Winandy, J.E., and Kretschmann, D.E. (1999). ‘Mechanical properties
of wood’. In Wood Handbook. Forest Products Research Society, United
States of America. pp 4-1 – 4-44.
Harrison, K.W. (1986). ‘Application of epoxy and acrylic adhesives’. Proceedings of
the international conference on structural adhesives in engineering. Institution
of Mechanical Engineers publication 1986-6.
Hilti (2002). Fastening technology manual. Issue 2002. Hilti Corporation,
Liechtenstein.
Page 114
Jackson, N., and Dhir, R.K. (1996). Civil engineering materials. Fifth edition.
Macmillan Press Ltd, Hong Kong.
Kemmsies, M. (2000). ‘Comparison of pull-out loads of 12 adhesives for glued-in
rods for timber structures. Proceedings of Wood Adhesives conference.
Lane, W., Buchanan, A.H., and Moss, P.J. (2004). ‘Fire performance of laminated
veneer lumber (LVL)’. Proceedings of the 18th Australasian conference on the
mechanics of structures and materials. Perth, Australia.
Larsen, H.J. (2003). ‘Introduction: fasteners, joints, and composite structures’. In
Thelandersson, S. and Larsen, H.J. (ed.). Timber engineering. John Wiley &
Sons Ltd, Chichester. pp 303 – 313.
Lee, H. and Neville, K. (1957). Epoxy resins. McGraw Hill Book Company Inc., New
York.
McIntosh, K.A. (1989). ‘From theory to reality – 30 years in glulam manufacture’.
Proceedings of the second Pacific Timber Engineering Conference. pp 229 –
234.
Noren, J. (1996). ‘Load-bearing capacity of nailed joints exposed to fire’. Fire and
Materials, Vol. 20, pp 133 – 143.
Nyman, J.F. (2002). ‘Equivalent fire resistance ratings of construction elements
exposed to realistic fires’. Fire Engineering Research Report 02/13. University
of Canterbury, New Zealand.
Pizzi, A. (1994). ‘Phenolic resin adhesives’. In Pizzi, A. and Mittal, K.L. (ed.)
Handbook of adhesive technology. Marcel Dekker Inc, New York. pp 329 –
346.
Scheibmair, D. (2003). Self-drilling pin joints in laminated veneer lumber. Masters
thesis in Civil Engineering, University of Auckland, New Zealand.
Shields, J. (1984). Adhesives handbook. Third edition. Butler & Tanner Ltd, Somerset

Page 115
SNZ (1992). ‘Code of practice for general structural design and design loadings for
buildings’. NZS4203:1992. Standards New Zealand, Wellington, New
Zealand.
SNZ (1993). ‘Code of practice for timber design’. NZS3603:1993. Standards New
Zealand, Wellington, New Zealand.
Spieth, H.A. (1992). Tragverhalten und bemessung von eingemörtelten
bewehrungsstäben. (Load carrying and design of mortared reinforcing bars).
Ph.D thesis, University of Stuttgart.
Stumes, P. (1982). ‘Structural rehabilitation of deteriorated timber’. In Meyer, R.W.,
and Kellogg, R.M. (ed.) Structural uses of wood in adverse environments.
Society of Wood Science and Technology. pp 467 – 471.
van Houtte, A.T, 2003, ‘Innovative connections in laminated veneer lumber using
epoxied steel rods’. Masters thesis in Civil Engineering. University of
Canterbury, New Zealand.
White, R.H., and Dietenberger, M.A. (1999). ‘Fire safety’. In Wood Handbook. Forest
Products Research Society, United States of America. pp 17-4 – 17-36.
Wilson, R.G. (1986). ‘Jointing techniques – adhesives’. Proceedings of the
international conference on structural adhesives in engineering. Institution of
Mechanical Engineers publication 1986-6.

Page 116
Appendix 1 Design of custom testing frame For this research a custom-built testing frame was constructed, as shown in
Figure A.1.
The custom-built testing frame used in this research was designed to be able to break
a 16 mm high strength (Fu = 830 MPa) steel bar, as this is the maximum strength
which can be achieved by a test specimen.
Figure A.1 Elevations of custom testing frame
As the connections between the members are all single bolt connections they were
treated for design purposes as being pinned connections. This allowed for the vertical
members to be simply supported with a single, central point load and the horizontal
members to be pin ended members in compression only.
For a 16 mm steel rod, with an ultimate strength of 830 MPa the failure load is
170 kN. This was taken as the design load for the testing frame.
The vertical members were designed to be able to withstand the 170 kN central point
load, with the moment demand calculated using Equation A.1:

Page 117
4* PLM = Equation A.1
Where M* is the design bending moment (kNm)
P is the applied point load (170 kN)
L is the span of the member (650 mm)
This gives a design bending moment, M* of 27.6 kNm.
Bending capacity of the section is given by Equation A.2
yxn fZeM φφ = Equation A.2
Where φ is the safety reduction factor (0.9)
Mn is the section capacity of the member (kNm)
Zex is the effective section modulus (90.6 x 103 mm3 per section)
f is the yield strength of the section (350 MPa)
Two 100 x 50 x 5.0 RHS sections were used in tandem at each end of the testing
frame. These have an effective section modulus of 45.3 x 103 mm3 each, giving a
combined effective section modulus of 90.6 x 103 mm3.
From Equation A.2 φMn of the section is found as 28.4 kNm. This exceeds the
moment demand of 27.6 kNm and so was suitable.
For the compression members the design load was half of the 170 kN test load as
there are two members sharing the load, therefore 85 kN each. Design capacity was
checked using the Euler buckling formula, shown in Equation A.3. 100 x 100 x 4.0
RHS sections were used for the compression members.
2
2
ecr l
EIP π= Equation A.3
Where Pcr is the critical load for buckling
π is pi (3.1416)
E is the modulus of elasticity (200 GPa)
I is the moment of inertia (2.36 x 106 mm4)
le is the effective length of the member (1150mm, as pin ended)

Page 118
This gives a buckling load of 3522 kN, well in excess of the 85 kN design load.
Appendix 2 Deflections of custom testing frame Deflections of the custom-built testing frame were calculated to enable them to be
subtracted from the recorded deflections. The deflection calculation was broken into
the bending of the upright members and the compression of the horizontal members.
Bending of the upright members was treated as a simply supported beam with a
central point load. The span was taken between the centrelines of the adjacent
members and was 650 mm. As the upright members consist of two pieces of
100 x 50 x 3.0 RHS the moment of inertia was taken as twice that for the individual
RHS section.
Deflections were calculated using the equation for deflection under a central point
load, as given in Equation A.1
EIPL
48
3
=∆ Equation A.1
Where: P is the applied point load (test load, in kN)
L is the span (650 mm)
E is the modulus of elasticity (200 GPa)
I is the moment of inertia (3.06 x 106 mm4 for the double section)
This was then entered into the spreadsheet of data to give frame deflections as a
function of load. At 100 kN this gave a frame deflection in each upright of 0.93 mm.
Deflections by compression of the horizontal members were calculated by using
Hooke’s law, given in Equation A.2. The horizontal members were constructed of
100 x 100 x 4.0 RHS sections, 1150 mm in length. There was one section at the top
and one at the bottom, so each carried half of the test load.
εσ E= or LLE
AP ∆= Equation A.2
Where P is the applied load in kN (half of test, as two members)
A is the cross-section area (1536 mm2)

Page 119
∆L is the change in length
L is the original length
Again, this was calculated in the spreadsheet of loads to give compression as a
function of applied load. At 100 kN this gave a compression of 0.19 mm.
Combining the deflections from both uprights and the horizontal members gives a
total frame deflection at 100 kN of: 2(0.93 mm) + 0.19 mm = 2.05 mm.