s tatistical r eview and e valuation · project manager: jessica lee . professional affairs ......
TRANSCRIPT

US Department of Health and Human Services Food and Drug Administration Center for Drug Evaluation and Research Office of Translational Sciences Office of Biostatistics
S T A T I S T I C A L R E V I E W A N D E V A L U A T I O N
CLINICAL STUDIES
NDA 207-988 Drug Name Zurampic (Lesinurad) 200mg QD Indication(s) Use in combination with xanthine oxidase inhibitor
for the chronic treatment of hyperuricemia associated with gout
Applicant Ardea Biosciences Inc Date(s) Stamp date December 29 2014
PDUFA goal date December 29 2015
Review Priority Standard
Division of Biometrics II Biometrics Division Statistical Reviewer Yu (Jade) Wang PhD Concurring Statistical Reviewers Gregory Levin PhD
Ruthanna Davi PhD Thomas Permutt PhD
Medical Division Division of Pulmonary Allergy and Rheumatology Products Rosemarie Neuner Medical Reviewer Clinical Team Sarah Yim Medical Team Leader
Project Manager Jessica Lee
Professional Affairs and Stakeholder Naomi Lowy MD Medical Officer Engagement Team Milena Lolic MD Medical Officer
Keywords subgroup analyses
Reference ID 3896980
1
Table of Contents 1 EXECUTIVE SUMMARY 3
2 INTRODUCTION 6
3 FINDINGS IN SPECIALSUBGROUP POPULATIONS 6
31 AVAILABLE DATA 6 32 STATISTICAL METHODS FOR ASSESSING DIFFERENCES IN TREATMENT EFFECT ACROSS SUBGROUPS 8 33 RESULTS BY SEX RACE AGE AND ETHNICITY 11
4 SUMMARY AND CONCLUSIONS 19
Reference ID 3896980
2
List of Tables Table 1 Study Designs7
Table 2 Results of Primary Efficacy Analyses in Studies A B and C Proportion of Subjects with an sUA
Level lt 6 mgdL (lt 5 mgdL for study C) at Month 6 (Non-Responder Imputation for Dropouts) 8
Table 3 Patient Demographics by Treatment (ITT)11
Table 4 Difference (95 Confidence Interval) of Proportion for Subjects with Month 6 sUA Levels lt 60
mgdL (lt 50 mgdL in Study C) (By Age Group Zurampic 200mg Minus Placebo Non-Responder Imputation)14
Table 5 Difference (95 Confidence Interval) of Proportion for Subjects with Month 6 sUA Levels lt 60
mgdL (lt 50 mgdL in Study C) (By Sex Zurampic 200mg Minus Placebo Non-Responder Imputation) 15
Table 6 Difference (95 Confidence Interval) of Proportion for Subjects with Month 6 sUA Levels lt 60
mgdL (lt 50 mgdL in Study C) (By Race Zurampic 200mg Minus Placebo Non-Responder Imputation) 17
Table 7 Difference (95 Confidence Interval) of Proportion for Subjects with Month 6 sUA Levels lt 60
mgdL (lt 50 mgdL in Study C) (By Ethnicity Zurampic 200mg Minus Placebo Non-Responder Imputation)18
Reference ID 3896980
3
List of Figures
Figure 1 Difference (95 Confidence Interval) of Proportion for Subjects with Month 6 sUA Levels lt 60
mgdL (Study A Zurampic 200mg minus Placebo Non-Responder Imputation)12
Figure 2 Difference (95 Confidence Interval) of Proportion for Subjects with Month 6 sUA Levels lt 60
mgdL (Study B Zurampic 200mg minus Placebo Non-Responder Imputation) 12
Figure 3 Difference (95 Confidence Interval) of Proportion for Subjects with Month 6 sUA Levels lt 50
mgdL (Study C Zurampic 200mg minus Placebo Non-Responder Imputation) 13
Figure 4 Difference (95 Confidence Interval) of Proportion for Subjects with Month 6 sUA Levels lt 60
mgdL (Pooled Studies A and B Zurampic 200mg Minus Placebo Non-Responder Imputation)13
Figure 5 Difference (95 Confidence Interval) of Proportion for Subjects with Month 6 sUA Levels lt 60
mgdL (Study A Zurampic 400mg minus Placebo Non-Responder Imputation)21
Figure 6 Difference (95 Confidence Interval) of Proportion for Subjects with Month 6 sUA Levels lt 60
mgdL (Study B Zurampic 400mg minus Placebo Non-Responder Imputation) 21
Figure 7 Difference (95 Confidence Interval) of Proportion for Subjects with Month 6 sUA Levels lt 50
mgdL (Study C Zurampic 400mg minus Placebo Non-Responder Imputation) 22
Figure 8 Difference (95 Confidence Interval) of Proportion for Subjects with Month 6 sUA Levels lt 60
mgdL (Pooled Studies A and B Zurampic 400mg minus Placebo Non-Responder Imputation) 22
Reference ID 3896980
4
1 EXECUTIVE SUMMARY
This review examined existing data to assess the treatment effect of Zurampic 200mg on the serum uric acid (sUA) level lt 60 mgdL responder rate at month 6 within each sex age race and ethnicity subgroup and whether the treatment effect of Zurampic 200mg on sUA level lt 60 mgdL responder rate at month 6 differs by sex age race or ethnicity We acknowledge that the analyses provided in this review are exploratory and the trials were not designed to support such investigations Despite possible statistical limitations these investigations were undertaken in the interest of transparency and to provide as much information regarding subgroup differences as is possible using the available data
We consider results from three studies two in gout patients receiving background allopurinol (Studies A and B) and one in gout patients receiving background febuxostat (Study C) Our general conclusions on the subgroup analyses were mainly based on the integrated Studies A and B as these two studies were similar in design In addition in most cases the individual study subgroup analysis results were consistent between these two studies Study C data were analyzed similarly but due to smaller sample sizes a potential study design issue and the lack of evidence of a treatment effect in the overall study population this study was given less weight Also we mainly based our judgment on Zurampic 200mg data as this is the dose approved by the Agency Data from Zurampic 400mg were used as supportive evidence when needed In the single Studies A or B the small sample size of some subgroups (eg women) does not provide enough precision to reliably evaluate whether the treatment effect might differ in those subgroups That being said in Studies A and B there was statistical evidence of a treatment effect of Zurampic 200mg relative to placebo on sUA level lt 60 mgdL responder rate at month 6 within most of the subgroups examined (by sex age race and ethnicity) In particular this review concludes based on the totality of the data that
Zurampic 200mg appears to be efficacious compared with placebo with respect to the sUA lt 06 mgdL responder rate at month 6 within each age group (below 65 years and 65 years and above) Available data did not give a strong indication that the treatment effect for Zurampic 200mg is larger in one age group than the other
Zurampic 200mg appears to be efficacious compared with placebo with respect to the sUA lt 06 mgdL responder rate within male patients with gout Available data for the female patient subgroup is too limited to draw conclusions about whether the treatment effect for Zurampic 200mg exists in females (without borrowing information from male subjects) There was some evidence of a difference between treatment effects in men and women in a single study However with the small female patient numbers and the relatively large number of subgroup analyses performed in this review as well as the lack of consistency in treatment by sex interaction findings across studies and doses we have little evidence to suggest that the treatment effect truly differs by sex Based on these considerations and using all available data including data in males we suppose that Zurampic 200mg is superior to placebo even in female patients
Reference ID 3896980
5
There was evidence of a treatment effect for the White Black and Asian subgroups For smaller racial subgroups (combined in the analyses) while positive estimates were observed small sample sizes resulted in wide confidence intervals There was no evidence of a treatment by race interaction in any of the individual or combined analyses
There was evidence of a treatment effect for both the HispanicLatino and not HispanicLatino subgroups For the smaller HispanicLatino subgroup while positive estimates of similar size were observed small sample sizes resulted in wide confidence intervals There was no evidence of a treatment by ethnicity interaction in any of the individual or combined analyses
Display of data to describe the effect of Zuramipic by sex age race and ethnicity on the proportion of subjects with sUAlt6 (sUAlt5 for Study C) could reliably be achieved by displaying results from the following
(1) Studies A and B combined since they were identically designed with the exception that study A was conducted in the US and study B was a global study
(2) Study C alone due to the unique patient population and other design characteristics
2 INTRODUCTION
This statistical review is written under FDArsquos 2014 action plan to enhance the collection and availability of demographic subgroup data The objective of the review is to use existing data to understand the effects of Zurampic 200mg within age sex racial and ethnic subgroups and whether these effects differ across subgroups
3 FINDINGS IN SPECIALSUBGROUP POPULATIONS
31 Available Data
The applicant proposed and the Agency has approved1 Zurampic 200mg to be used in combination with a xanthine oxidase inhibitor for the treatment of hyperuricemia associated with gout in patients who have not achieved target serum uric acid levels with a xanthine oxidase inhibitor alone
The applicant provided results of two phase 3 trials (referred to in this document as study A and B) conducted to evaluate the efficacy and safety of Zurampic in combination with allopurinol versus allopurinol alone in gout patients who have had an inadequate hypouricemic response
1 httpwwwaccessdatafdagovdrugsatfda_docsappletter2015207988Orig1s000ltrpdf
Reference ID 3896980
6
to allopurinol and one phase 3 trial (referred to in this document as C) conducted similarly with allopurinol replaced by febuxostat in gout patients with tophi at baseline
The three studies were all randomized placebo controlled double-blind multicenter trials Among them study A was conducted in the US studies B and C were both multinational studies Key features of these studies are summarized in Table 1 In all studies the primary efficacy endpoint to evaluate the contribution of Zurampic was the proportion of subjects with an sUA level lt 60 mgdL (or 50 mgdL in study C with tophi patients) at month 6 Readers of this review may refer to my primary statistical review for additional details on the design and results of these studies
Table 1 Study Designs
Study Patient Population Treatment Duration (Months)
Treatment Groups
Randomized patients
Allopurinol Background
Study A
RDEA594-301
Inadequate responders to allopurinol
-Had a history of at least 2 gout flares in the prior year
-Already on a stable medically appropriate dose of allopurinol for at least 8 weeks at screening
-Had sUA levels repeatedly greater than the recommended treatment goal
12 Zurampic 200mg once daily Zurampic 400mg once daily
Placebo
202
202
203
Study B
RDEA594-302
12 Zurampic 200mg once daily Zurampic 400mg once daily
Placebo
204
201
206
Febuxostat Background
Study C
RDEA594-304
Subjects with
-Tophaceous gout
-Elevated sUA
12 Zurampic 200mg once daily Zurampic 400mg once daily
Placebo
106
109
109
Reference ID 3896980
7
Consistent with product labeling these three phase 3 trials are the basis of the efficacy portion of the ldquodrug snapshotrdquo and the evaluation of whether treatment effects vary across subgroups The primary efficacy results from the phase 3 studies showing comparisons between Zurampic and placebo with respect to sUA level reduction in the overall study population are summarized in Table 2
Table 2 Results of Primary Efficacy Analyses in Studies A B and C Proportion of Subjects with an sUA Level lt 6 mgdL (lt 5 mgdL for study C) at Month 6 (Non-Responder Imputation for Dropouts)
Study Treatment Groups Treatment Difference
(Zurampic ndash Placebo)
Difference in Proportion 95 CI
Allopurinol Background
Study A
RDEA594-301
Zurampic 200mg once daily 026 (017 036)
Study B
RDEA594-302
Zurampic 200mg once daily 032 (023 041)
Febuxostat Background
Study C
RDEA594-304
Zurampic 200mg once daily 010 (-003 023)
32 Statistical Methods for Assessing Differences in Treatment Effect across Subgroups
To assess the overall efficacy of a product that is the treatment effect in the overall population we typically rely on replicated results from more than one study each of which may represent a different patient population dose regimen or background therapy With this review and its supporting analyses our objective is to characterize the differences in treatment effect across subgroups In this pursuit we rely on two statistical tools combining data from individual studies to gain precision of characterization or power of comparison and tests of treatment by subgroup interactions to detect potential treatment effect differences across subgroups In planning analyses to assess differences in treatment effect across subgroups the merits of combining studies to provide increased power for small subgroups were weighed against the merits of analyzing all studies separately so as not to miss possible clinical settings where differences in treatment effect across subgroups differ for different populations dose regimens or background therapy When the decision of combining studies is made at the same time of interpreting the combined treatment effect by subgroup we will also look at individual studies to identify possible sources that may result in differences across studies or populations in terms of differences in treatment effect across subgroups While we acknowledge that differences in the treatment effect across differing populations or background medications are possible even likely we note that consistency in the treatment effect across studies is not
Reference ID 3896980
8
needed to justify combining studies for the purpose of identifying subgroups where the treatment effect differs The objective of this review and these analyses is different from assessing the overall efficacy of the product It is to characterize the differences in treatment effect across subgroups The important assumption of this type of combined analysis is that if there are differences in the treatment effect between certain subgroups these differences by subgroup should be similar in studies with different populations or background therapy For example if the treatment effect for Zurampic in males is larger than that of females in a population such as used in study A combining study A with a population such as is used in study B is more agreeable if the treatment effect for Zurampic is also larger for males than females in the population used in study B We believe that in general this type of assumption might be more likely to be true than the assumption that the overall treatment effect is similar across different populations and background therapies
As introduced in the previous section Studies A and B were similar in design with the only difference being Study A was conducted in North America and Study B was a global study Aside from this regional difference the two studies had the same xanthine oxidase inhibitor allopurinol as background therapy enrolled patients of the same disease severity category and were the same in terms of other trial design elements In addition the two studies had similar estimated overall effect sizes (proportional difference of 26 vs 32) in terms of sUA level reduction responder rate and were the main basis for the approval of Zurampic 200mg by the FDA With these considerations in mind data from the two allopurinol add-on studies (Studies A and B) were combined for examination of consistency of treatment effect across subgroups
As a result of the afore-mentioned considerations about combining studies subgroup results for the individual Studies A and B were also examined to help explore consistency in any findings across studies
Study C was not included in the combined analysis of Studies A and B for several reasons The study population of Study C was different than those of Studies A and B Instead of enrolling patients who had inadequate urate control with a stable xanthine oxidase inhibitor Study C enrolled patients whose disease status reached a more severe level as only patients who had tophi at screening were entered into this study In addition a stable xanthine oxidase inhibitor was not required at screening and patients were titrated on febuxostat to a stable dose in the run-in period This may potentially explain why around 50 of patients reached target sUA level criteria at baseline which may in turn contribute to the failure of the study to demonstrate overall efficacy of Zurampic 200mg over placebo on the background of febuxostat Still there were trends toward benefit for other measures of sUA reduction for Zurampic 200mg in Study C (including a similar mean reduction of around 1 mgdL to that of Studies A and B) so there is likely some utility in exploring subgroup analyses from this study
Reference ID 3896980
9
Due to the fact that the dose of Zurampic 200mg was approved for the add-on therapy to treat hyperuricemia associated with gout subgroup analyses of the combined Studies A and B and each individual study (A-C) were considered mainly for Zurampic 200mg When subgroup and treatment interaction results were not consistent between studies on the Zurampic 200mg dose data subgroup analysis results based on Zurampic 400mg data were also examined for trend and consistency
In the original application the treatment effect of Zurampic 200mg (difference in proportion of subjects with an sUA level lt 60 mgdL in studies A and B or 50 mgdL in study C between treatment groups) for the individual trials was calculated from the binomial treatment proportions The corresponding confidence intervals the Wald asymptotic confidence limits for the difference of proportions were calculated based on the normal approximation to the binomial distribution For Studies A and B the difference in sUA response rates between the Zurampic 200mg group and placebo was tested using the CMH test statistic for the ITT population stratifying by Day -7 renal function and tophus status during Screening (randomized values) For Study C Day -7 renal function and sUA level at Day -7 were used as stratifying factors
In this review for each individual study the treatment effect of Zurampic 200mg relative to placebo within subgroups was estimated by calculating the proportional difference for each subgroup separately The difference in treatment effect between subgroups was tested by a treatment by subgroup interaction When performing the test for treatment by subgroup interaction I used a logistic regression model by including the stratifying factors used in the original CMH test and the factor subgroup and a term for treatment by subgroup interaction
In all cases where Studies A and B were combined the treatment effect of Zurampic 200mg relative to placebo within subgroups was estimated by combining the data from the individual studies The test for treatment by subgroup interaction was performed using the same model and approach as described for the individual trials with the exception that the model was extended with interaction terms with study for each factor and covariate as used in the model for individual trials (eg including subgroup by study interaction treatment by study interaction and stratification factor by study interactions) This approach was taken to allow the relationship between covariates and the outcome to differ between the studies
We acknowledge that these analyses are exploratory and the trials were not designed to support such investigations In general these comparisons may be limited by multiplicity on one hand and low power considerations on the other Despite these possible statistical limitations associated with multiplicity and low power these investigations are undertaken in the interest of transparency and to provide as much information regarding subgroup differences as is possible using the available data In cases in which an analysis identifies possible subgroup differences we evaluated a number of additional factors such as study consistency and consistency across doses (utilizing Zurampic 400mg data) to help explore
Reference ID 3896980
10
whether low p-values for subgroup interaction tests might represent a true difference or a false positive
33 Results by Sex Race Age and Ethnicity
This section provides estimates of the difference between Zurampic 200mg and placebo in the proportion of subjects with an sUA level lt 60 (50 in Study C) mgdL at Month 6 by sex race age and ethnicity subgroups Approximate 95 confidence intervals for treatment differences within each subgroup were constructed using normal approximation to the binomial distribution Tests for the treatment-by-subgroup interaction are also provided Table 4 displays the patient demographics by treatment arm Figures 1 through 4 display results for each study considered individually as well as the combinations of studies A and B Analogous results are displayed for lesinurad 400mg in the Appendix
Table 3 Patient Demographics by Treatment (ITT)
Subgroup Category
Study A Study B Study C
Placebo N ()
Zurampic 200mg N()
Placebo N ()
Zurampic 200mg N()
Placebo N ()
Zurampic 200mg N()
Total N 201 201 206 204 109 106
Age lt 65 YEARS 169 (84) 181 (90) 185 (90) 184 (90) 89 (82) 89 (84)
gt= 65 YEARS 32 (16) 20 (10) 21 (10) 20 (10) 20 (18) 17 (16)
Sex F 12 (6) 9 (4) 10 (5) 7 (3) 2 (2) 6 (6)
M 189 (94) 192 (96) 196 (95) 197 (97) 107 (98) 100 (94)
Race
ASIAN 10 (5) 9 (4) 14 (7) 10 (5) 6 (6) 8 (8)
BLACK OR AFRICAN AMERICAN 29 (14) 31 (15) 22 (11) 15 (7) 8 (7) 14 (13)
WHITE 153 (76) 151 (75) 155 (75) 167 (82) 94 (86) 80 (75)
COMBINED OTHER 9 (4) 10 (5) 15 (7) 12 (6) 1 (lt1) 4 (4)
AMERICAN INDIAN OR ALASKA NATIVE 1 (lt1) 2 (lt1) 1 (lt1) 1 (lt1) 0 1 (lt1)
MAORI 0 0 1 (lt1) 4 (2) 0 0
NATIVE HAWAIIAN OR OTHER PACIFIC ISLANDERS
5 (2) 4 (2) 5 (2) 3 (1) 0 1 (lt1)
OTHER 3 (1) 4 (2) 8 (4) 4 (2) 1 (lt1) 2 (2)
Ethnicity HISPANIC OR LATINO 19 (9) 27 (13) 7 (3) 10 (5) 9 (8) 7 (7)
NOT HISPANIC OR LATINO 182 (91) 174 (87) 199 (97) 194 (95) 100 (92) 99 (93)
Reference ID 3896980
11
Figure 1 Difference (95 Confidence Interval) of Proportion for Subjects with Month 6 sUA Levels lt 60 mgdL (Study A Zurampic 200mg minus Placebo Non-Responder Imputation)
sUA serum uric acid Diff Difference in proportion LCL lower confidence limit UCL upper confidence limit p-vaule statistical test measuring whether the treatment effect differs across subgroups (ie p-value for treatment-by-subgroup interaction) F female M Male LESU lesinurad (Zurampic)
Figure 2 Difference (95 Confidence Interval) of Proportion for Subjects with Month 6 sUA Levels lt 60 mgdL (Study B Zurampic 200mg minus Placebo Non-Responder Imputation)
sUA serum uric acid Diff Difference in proportion LCL lower confidence limit UCL upper confidence limit p-vaule statistical test measuring whether the treatment effect differs across subgroups (ie p-value for treatment-by-subgroup interaction) F female M Male LESU lesinurad (Zurampic)
Reference ID 3896980
12
Figure 3 Difference (95 Confidence Interval) of Proportion for Subjects with Month 6 sUA Levels lt 50 mgdL (Study C Zurampic 200mg minus Placebo Non-Responder Imputation)
sUA serum uric acid Diff Difference in proportion LCL lower confidence limit UCL upper confidence limit p-vaule statistical test measuring whether the treatment effect differs across subgroups (ie p-value for treatment-by-subgroup interaction) F female M Male LESU lesinurad (Zurampic)
Figure 4 Difference (95 Confidence Interval) of Proportion for Subjects with Month 6 sUA Levels lt 60 mgdL (Pooled Studies A and B Zurampic 200mg Minus Placebo Non-Responder Imputation)
sUA serum uric acid Diff Difference in proportion LCL lower confidence limit UCL upper confidence limit p-vaule statistical test measuring whether the treatment effect differs across subgroups (ie p-value for treatment-by-subgroup interaction) F female M Male LESU lesinurad (Zurampic)
Reference ID 3896980
13
Table 4 Difference (95 Confidence Interval) of Proportion for Subjects with Month 6 sUA Levels lt 60 mgdL (lt 50 mgdL in Study C) (By Age Group Zurampic 200mg Minus Placebo Non-Responder Imputation)
Study Age
Group
Placebo Zurampic 200mg Difference (95 CI) in
Proportion of sUA Responders (Zurampic
200mg - Placebo)
Test for Treatment by
Age Group Interaction (p-
value)
N
Number () of Subjects with sUA Level lt 60 mgdL
at Month 6
N
Number () of Subjects with sUA Level lt 60 mgdL
at Month 6
Study A
lt 65 years
169 46(272) 181 99(547) 027( 018 037)
0537 gt= 65 years
32 10(313) 20 10(500) 019(-008 046)
Study B
lt 65 years
185 43(232) 184 100(543) 031( 022 041)
0565 gt= 65 years
21 5(238) 20 13(650) 041( 013 069)
Pooled Studies A and B
lt 65 years
354 89(251) 365 199(545) 029( 023 036)
0936 gt= 65 years
53 15(283) 40 23(575) 029( 010 049)
Study C
lt 65 years
89 41(461) 89 50(562) 010(-004 025)
0625 gt= 65 years
20 10(500) 17 10(588) 009(-023 041)
Examination of treatment effect by age group The combined analysis of Studies A and B showed no evidence of an interaction and produced the same point estimates of effect in the two age subgroups In addition in the combined analysis there is evidence that for gout patients on background allopurinol Zurampic 200mg is effective compared to placebo with respect to the proportion of subjects with an sUA level lt 60 mgdL at month 6 in both age groups Consistent with the conclusions of the combined analysis within Study A the estimated effect of Zurampic 200mg over placebo is positive in both age groups although in the older patient group the confidence interval for the difference between treatment groups includes 0 This lack of statistical significance is potentially due to the small sample size in this age group Also consistent with the combined analysis within the individual Studies A and B there is no statistical evidence suggesting that the effect of Zurampic relative to placebo may be different between the two age groups as the p-values associated with the treatment-by-age interaction are about 05
Reference ID 3896980
14
There also was no evidence of a treatment by age interaction in Study C There was no evidence of treatment effects in the age subgroups in Study C which is consistent with the lack of evidence of an overall study effect but trends were in the direction favorable to Zurampic and of a similar magnitude in the two subgroups Similar results were observed for the 400mg dose in these studies
In summary with evidence of effects in both subgroups in integrated studies A and B consistent estimates in Study C with trends toward benefit and no evidence of interactions from any analyses the totality of the data suggests that Zurampic is efficacious compared with placebo in both patient age groups and does not suggest any striking differences in effects between older and younger patients
Table 5 Difference (95 Confidence Interval) of Proportion for Subjects with Month 6 sUA Levels lt 60 mgdL (lt 50 mgdL in Study C) (By Sex Zurampic 200mg Minus Placebo Non-Responder Imputation)
Study Sex
Placebo Zurampic 200mg Difference (95 CI) in Proportion of sUA
Responders (Zurampic 200mg -
Placebo)
Test for Treatment by
Sex Interaction (p-value)
N
Number () of Subjects with sUA Level lt 60 mgdL
at Month 6
N
Number () of Subjects with sUA
Level lt 60 mgdL at Month 6
Study A F 12 5(417) 9 1(111) -031(-065 004) 0016
M 189 51(270) 192 108(563) 029( 020 039)
Study B F 10 2(200) 7 3(429) 023(-021 067) 0818
M 196 46(235) 197 110(558) 032( 023 041)
Pooled Studies A and B
F 22 7(318) 16 4(250) -007(-036 022) 0030
M 385 97(252) 389 218(560) 031( 024 037)
Study C F 2 0 6 2(333) 033(-004 071) 0972
M 107 51(477) 100 58(580) 010(-003 024)
Examination of treatment effect by sex Among the three phase 3 studies about 95 of the subjects were male In both Study A and Study B there was evidence of a treatment effect on serum uric reduction in males There was considerable uncertainty in the evaluation in females due to small sample sizes Compared with men women are less likely to develop gout in the premenopausal period due to the uricosuric effect of female hormones this explains largely the gender imbalance of subject numbers in enrollment The small female sample sizes resulted in some statistical difficulties due to small responders counts for example there were zero female responders on the placebo arm in study C (Table 6) and a female responder count of
Reference ID 3896980
15
only 1 in the Zurampic 200mg arm in study A which could be partially attributed to 3 early discontinuations among the 9 total subjects that were imputed as non-responders
Despite the small numbers of females in these studies there was some evidence in Study A of a treatment by sex interaction (p=0016) Borderline evidence (p=003) was also seen based on the integrated analysis of Studies A and B However this finding in the combined analysis was primarily driven by the Study A interaction test results and such an interaction was not replicated in either Study B or Study C With the limited female data in mind in the face of the inconsistency of subgroup analysis results among the three studies and with reference the Zurampic 400mg interaction tests results as any true differences in efficacy by subgroup might be expected to exist for both doses we conclude that the suggestion of a differing treatment effect by sex in study A may not represent a finding of a true treatment by sex interaction
In study C the zero frequency in female patients in placebo group resulted in a quasi-complete separation of data points such that the maximum likelihood iterations did not converge The result shown for the interaction test are based on the last maximum likelihood iteration (p=0972) the validity of which is questionable In terms of point estimates and corresponding confidence intervals the by sex group responder rate results are consistent with the overall study results showing a numerically positive but not statistically significant trend There was no statistical evidence of subgroup differences between the two sexes
Data from Zurampic 400mg data showed that in general the two genders had consistent treatment effects with no significant interaction effects among the 3 studies individually or combined Of note from the febuxostat background study C while the overall effect of Zurampic 400mg was statistically significant and 200mg was not both doses showed a numerically higher treatment effect in females as compared with males which is different from the trend found from the integrated 200mg dose allopurinol background studies and reinforces the conclusion that the differences in treatment effect by sex are likely a result of natural variation and not indicative of a true treatment by sex interaction
The totality of the above data shows that there was consistent evidence of a treatment effect in males There was some evidence (p-value=003) of an interaction by sex in integrated Studies A and B with trends toward less efficacy in females However with the small female patient numbers and the relatively large number of subgroup analyses performed in this review as well as the lack of consistency in findings across studies and doses it remains unclear whether the treatment effect differs by sex
Reference ID 3896980
16
Table 6 Difference (95 Confidence Interval) of Proportion for Subjects with Month 6 sUA Levels lt 60 mgdL (lt 50 mgdL in Study C) (By Race Zurampic 200mg Minus Placebo Non-Responder Imputation)
Study Race
Placebo Zurampic 200mg
Difference (95 CI) in Proportion of sUA Responders (Zurampic 200mg - Placebo)
Test for Treatment by Race Interaction
(p-value)
N
Number () of Subjects with sUA Level lt 60 mgdL at Month 6 N
Number () of Subjects with sUA Level lt 60 mgdL at Month 6
Study A
ASIAN 10 4(400) 9 5(556) 016(-029 060)
0782
BLACK OR AFRICAN AMERICAN
29 5(172) 31 10(323) 015(-006 036)
COMBINED OTHER
9 3 (333) 10 5(500) 017(022 060)
WHITE 153 44(288) 151 89(589) 030( 020 041)
Study B
ASIAN 14 3(214) 10 8(800) 059( 026 091)
BLACK OR AFRICAN AMERICAN
22 4(182) 15 8(533) 035( 005 065)
0371COMBINED OTHER
15 3 (200) 12 3 (250) 005(-027 037)
WHITE 155 38(245) 167 94(563) 032( 022 042)
Pooled Studies A
and B
ASIAN 24 7(292) 19 13(684) 039( 012 067)
0611
BLACK OR AFRICAN AMERICAN
51 9(176) 46 18(391) 021( 004 039)
COMBINED OTHER
24 6(250) 22 8(364) 011(-015 038)
WHITE 308 82(266) 318 183(575) 031( 024 038)
Study C
ASIAN 6 3(500) 8 7(875) 038(-009 084)
0479
BLACK OR AFRICAN AMERICAN
8 3(375) 14 7(500) 013(-030 055)
COMBINED OTHER
1 0 4 1 (250) 025(-017 067)
WHITE 94 45(479) 80 45(563) 008(-006 023)
Examination of treatment effect by race There were a total of 7 racial subgroups across the studies with some groups of very small sample sizes Some subgroup sizes were too small to allow for a reliable evaluation so we combined some racial subgroups as catalogued in Table 3 into a Combined Other group
Reference ID 3896980
17
From the integrated analysis of Studies A and B there was evidence of a treatment effect for the White Black and Asian subgroups In individual Study A or B in general there was evidence of treatment effects or trends toward benefit for the White Black Asian and Other subgroups For smaller subgroups while positive estimates were observed small sample sizes resulted in wide confidence intervals Trends toward benefit were observed in all racial subgroups in Study C but the small sample sizes resulted in wide confidence intervals (that included zero) in all racial groups There was no evidence of a treatment by race interaction in any of the individual or combined analyses Results were similar for the 400mg dose The totality of the data therefore suggests that Zurampic is effective in Whites Blacks and Asians and no large differences in efficacy across racial subgroups were identified
Table 7 Difference (95 Confidence Interval) of Proportion for Subjects with Month 6 sUA Levels lt 60 mgdL (lt 50 mgdL in Study C) (By Ethnicity Zurampic 200mg Minus Placebo Non-Responder Imputation)
Study Ethnicity
Placebo Zurampic 200mg Difference (95 CI) in
Proportion of sUA
Responders (Zurampic 200mg -Placebo)
Test for Treatment
by Ethnicity Interaction (p-value)
N Number () of Subjects
with sUA Level lt 60 mgdL at Month 6
N
Number () of Subjects with sUA
Level lt 60 mgdL at Month 6
Study A
HISPANIC OR LATINO
19 3(158) 27 10(370) 021(-003
046) 0962
NOT HISPANIC OR LATINO
182 53(291) 174 99(569) 028( 018
038)
Study B
HISPANIC OR LATINO
7 2(286) 10 6(600) 031(-014
077) 0889
NOT HISPANIC OR LATINO
199 46(231) 194 107(552) 032( 023
041)
Pooled Studies A and B
HISPANIC OR LATINO
26 5(192) 37 16(432) 024( 002
046) 0902
NOT HISPANIC OR LATINO
381 99(260) 368 206(560) 030( 023
037)
Study C
HISPANIC OR LATINO
9 3(333) 7 2(286) -005(-050
041) 0413
NOT HISPANIC OR LATINO
100 48(480) 99 58(586) 011(-003
024)
Reference ID 3896980
18
Examination of treatment effect by ethnicity Results and conclusions from analyses across the ethnic subgroups were similar to those across racial subgroups From the pooled analysis of Studies A and B there was evidence of a treatment effect for both the ethnic subgroups When looking at Study A or B a treatment effect was observed in patients who were not Hispanic or Latino For the Hispanic or Latino subgroup while positive estimates were observed small samples resulted in wider confidence intervals that included zero In Study C a trend toward benefit was observed in the not Hispanic or Latino group but not in the Hispanic or Latino group although the sample size in this subgroup was very small
Subgroup analysis results from Lesinurad 400mg supported the efficacy of both subgroups with the only exception of a wide confidence interval for the Hispanic or Latino subgroup in Study B Across studies and dosages there was no evidence based on interaction tests of differences in treatment effects across the ethnic subgroups
4 SUMMARY AND CONCLUSIONS This review examined existing data to assess the treatment effect of Zurampic 200mg on sUA level lt 60 mgdL responder rate at month 6 within each sex age race and ethnicity subgroup and whether the treatment effect of Zurampic 200mg on sUA level lt 60 mgdL responder rate at month 6 differs by sex age race or ethnicity We acknowledge that the analyses provided in this review are exploratory and the trials were not designed to support such investigations Despite possible statistical limitations these investigations were undertaken in the interest of transparency and to provide as much information regarding subgroup differences as is possible using the available data
This review concludes that
Zurampic 200mg appears to be efficacious compared with placebo with respect to the sUA lt 06 mgdL responder rate at month 6 within each age group (below 65 years and 65 years and above) Available data did not give a strong indication that the treatment effect for Zurampic 200mg is larger in one age group than the other
Zurampic 200mg appears to be efficacious compared with placebo with respect to the sUA lt 06 mgdL responder rate within male patients with gout Available data for the female patient subgroup is too limited to draw conclusions about whether the treatment effect for Zurampic 200mg exists in females (without borrowing information from male subjects) There was some evidence of a difference between treatment effects in men and women in a single study However with the small female patient numbers and the relatively large number of subgroup analyses performed in this review as well as the lack of consistency in treatment by sex interaction findings across studies and doses we have little evidence to suggest that the treatment effect truly differs by
Reference ID 3896980
19
sex Based on these considerations and using all available data including data in males we suppose that Zurampic 200mg is superior to placebo even in female patients
There was evidence of a treatment effect for the White Black and Asian subgroups For smaller racial subgroups (combined in the analyses) while positive estimates were observed small sample sizes resulted in wide confidence intervals There was no evidence of a treatment by race interaction in any of the individual or combined analyses
There was evidence of a treatment effect for both the HispanicLatino and not HispanicLatino subgroups For the smaller HispanicLatino subgroup while positive estimates of similar size were observed small sample sizes resulted in wide confidence intervals There was no evidence of a treatment by ethnicity interaction in any of the individual or combined analyses
Reference ID 3896980
20
Appendix Subgroup Analysis Results Comparing Zurampic 400mg with Placebo Figure 5 Difference (95 Confidence Interval) of Proportion for Subjects with Month 6 sUA Levels lt 60 mgdL (Study A Zurampic 400mg minus Placebo Non-Responder Imputation)
sUA serum uric acid Diff Difference in proportion LCL lower confidence limit UCL upper confidence limit p-vaule statistical test measuring whether the treatment effect differs across subgroups (ie p-value for treatment-by-subgroup interaction) F female M Male LESU lesinurad (Zurampic)
Figure 6 Difference (95 Confidence Interval) of Proportion for Subjects with Month 6 sUA Levels lt 60 mgdL (Study B Zurampic 400mg minus Placebo Non-Responder Imputation)
sUA serum uric acid Diff Difference in proportion LCL lower confidence limit UCL upper confidence limit p-vaule statistical test measuring whether the treatment effect differs across subgroups (ie p-value for treatment-by-subgroup interaction) F female M Male LESU lesinurad (Zurampic)
Reference ID 3896980
21
Figure 7 Difference (95 Confidence Interval) of Proportion for Subjects with Month 6 sUA Levels lt 50 mgdL (Study C Zurampic 400mg minus Placebo Non-Responder Imputation)
sUA serum uric acid Diff Difference in proportion LCL lower confidence limit UCL upper confidence limit p-vaule statistical test measuring whether the treatment effect differs across subgroups (ie p-value for treatment-by-subgroup interaction) F female M Male LESU lesinurad (Zurampic)
Figure 8 Difference (95 Confidence Interval) of Proportion for Subjects with Month 6 sUA Levels lt 60 mgdL (Pooled Studies A and B Zurampic 400mg minus Placebo Non-Responder Imputation)
sUA serum uric acid Diff Difference in proportion LCL lower confidence limit UCL upper confidence limit p-vaule statistical test measuring whether the treatment effect differs across subgroups (ie p-value for treatment-by-subgroup interaction) F female M Male LESU lesinurad (Zurampic)
Reference ID 3896980
22
---------------------------------------------------------------------------------------------------------
---------------------------------------------------------------------------------------------------------
----------------------------------------------------
This is a representation of an electronic record that was signed electronically and this page is the manifestation of the electronic signature
s
YU WANG 03042016
GREGORY P LEVIN 03042016
Reference ID 3896980

There was evidence of a treatment effect for the White Black and Asian subgroups For smaller racial subgroups (combined in the analyses) while positive estimates were observed small sample sizes resulted in wide confidence intervals There was no evidence of a treatment by race interaction in any of the individual or combined analyses
There was evidence of a treatment effect for both the HispanicLatino and not HispanicLatino subgroups For the smaller HispanicLatino subgroup while positive estimates of similar size were observed small sample sizes resulted in wide confidence intervals There was no evidence of a treatment by ethnicity interaction in any of the individual or combined analyses
Display of data to describe the effect of Zuramipic by sex age race and ethnicity on the proportion of subjects with sUAlt6 (sUAlt5 for Study C) could reliably be achieved by displaying results from the following
(1) Studies A and B combined since they were identically designed with the exception that study A was conducted in the US and study B was a global study
(2) Study C alone due to the unique patient population and other design characteristics
2 INTRODUCTION
This statistical review is written under FDArsquos 2014 action plan to enhance the collection and availability of demographic subgroup data The objective of the review is to use existing data to understand the effects of Zurampic 200mg within age sex racial and ethnic subgroups and whether these effects differ across subgroups
3 FINDINGS IN SPECIALSUBGROUP POPULATIONS
31 Available Data
The applicant proposed and the Agency has approved1 Zurampic 200mg to be used in combination with a xanthine oxidase inhibitor for the treatment of hyperuricemia associated with gout in patients who have not achieved target serum uric acid levels with a xanthine oxidase inhibitor alone
The applicant provided results of two phase 3 trials (referred to in this document as study A and B) conducted to evaluate the efficacy and safety of Zurampic in combination with allopurinol versus allopurinol alone in gout patients who have had an inadequate hypouricemic response
1 httpwwwaccessdatafdagovdrugsatfda_docsappletter2015207988Orig1s000ltrpdf
Reference ID 3896980
6
to allopurinol and one phase 3 trial (referred to in this document as C) conducted similarly with allopurinol replaced by febuxostat in gout patients with tophi at baseline
The three studies were all randomized placebo controlled double-blind multicenter trials Among them study A was conducted in the US studies B and C were both multinational studies Key features of these studies are summarized in Table 1 In all studies the primary efficacy endpoint to evaluate the contribution of Zurampic was the proportion of subjects with an sUA level lt 60 mgdL (or 50 mgdL in study C with tophi patients) at month 6 Readers of this review may refer to my primary statistical review for additional details on the design and results of these studies
Table 1 Study Designs
Study Patient Population Treatment Duration (Months)
Treatment Groups
Randomized patients
Allopurinol Background
Study A
RDEA594-301
Inadequate responders to allopurinol
-Had a history of at least 2 gout flares in the prior year
-Already on a stable medically appropriate dose of allopurinol for at least 8 weeks at screening
-Had sUA levels repeatedly greater than the recommended treatment goal
12 Zurampic 200mg once daily Zurampic 400mg once daily
Placebo
202
202
203
Study B
RDEA594-302
12 Zurampic 200mg once daily Zurampic 400mg once daily
Placebo
204
201
206
Febuxostat Background
Study C
RDEA594-304
Subjects with
-Tophaceous gout
-Elevated sUA
12 Zurampic 200mg once daily Zurampic 400mg once daily
Placebo
106
109
109
Reference ID 3896980
7
Consistent with product labeling these three phase 3 trials are the basis of the efficacy portion of the ldquodrug snapshotrdquo and the evaluation of whether treatment effects vary across subgroups The primary efficacy results from the phase 3 studies showing comparisons between Zurampic and placebo with respect to sUA level reduction in the overall study population are summarized in Table 2
Table 2 Results of Primary Efficacy Analyses in Studies A B and C Proportion of Subjects with an sUA Level lt 6 mgdL (lt 5 mgdL for study C) at Month 6 (Non-Responder Imputation for Dropouts)
Study Treatment Groups Treatment Difference
(Zurampic ndash Placebo)
Difference in Proportion 95 CI
Allopurinol Background
Study A
RDEA594-301
Zurampic 200mg once daily 026 (017 036)
Study B
RDEA594-302
Zurampic 200mg once daily 032 (023 041)
Febuxostat Background
Study C
RDEA594-304
Zurampic 200mg once daily 010 (-003 023)
32 Statistical Methods for Assessing Differences in Treatment Effect across Subgroups
To assess the overall efficacy of a product that is the treatment effect in the overall population we typically rely on replicated results from more than one study each of which may represent a different patient population dose regimen or background therapy With this review and its supporting analyses our objective is to characterize the differences in treatment effect across subgroups In this pursuit we rely on two statistical tools combining data from individual studies to gain precision of characterization or power of comparison and tests of treatment by subgroup interactions to detect potential treatment effect differences across subgroups In planning analyses to assess differences in treatment effect across subgroups the merits of combining studies to provide increased power for small subgroups were weighed against the merits of analyzing all studies separately so as not to miss possible clinical settings where differences in treatment effect across subgroups differ for different populations dose regimens or background therapy When the decision of combining studies is made at the same time of interpreting the combined treatment effect by subgroup we will also look at individual studies to identify possible sources that may result in differences across studies or populations in terms of differences in treatment effect across subgroups While we acknowledge that differences in the treatment effect across differing populations or background medications are possible even likely we note that consistency in the treatment effect across studies is not
Reference ID 3896980
8
needed to justify combining studies for the purpose of identifying subgroups where the treatment effect differs The objective of this review and these analyses is different from assessing the overall efficacy of the product It is to characterize the differences in treatment effect across subgroups The important assumption of this type of combined analysis is that if there are differences in the treatment effect between certain subgroups these differences by subgroup should be similar in studies with different populations or background therapy For example if the treatment effect for Zurampic in males is larger than that of females in a population such as used in study A combining study A with a population such as is used in study B is more agreeable if the treatment effect for Zurampic is also larger for males than females in the population used in study B We believe that in general this type of assumption might be more likely to be true than the assumption that the overall treatment effect is similar across different populations and background therapies
As introduced in the previous section Studies A and B were similar in design with the only difference being Study A was conducted in North America and Study B was a global study Aside from this regional difference the two studies had the same xanthine oxidase inhibitor allopurinol as background therapy enrolled patients of the same disease severity category and were the same in terms of other trial design elements In addition the two studies had similar estimated overall effect sizes (proportional difference of 26 vs 32) in terms of sUA level reduction responder rate and were the main basis for the approval of Zurampic 200mg by the FDA With these considerations in mind data from the two allopurinol add-on studies (Studies A and B) were combined for examination of consistency of treatment effect across subgroups
As a result of the afore-mentioned considerations about combining studies subgroup results for the individual Studies A and B were also examined to help explore consistency in any findings across studies
Study C was not included in the combined analysis of Studies A and B for several reasons The study population of Study C was different than those of Studies A and B Instead of enrolling patients who had inadequate urate control with a stable xanthine oxidase inhibitor Study C enrolled patients whose disease status reached a more severe level as only patients who had tophi at screening were entered into this study In addition a stable xanthine oxidase inhibitor was not required at screening and patients were titrated on febuxostat to a stable dose in the run-in period This may potentially explain why around 50 of patients reached target sUA level criteria at baseline which may in turn contribute to the failure of the study to demonstrate overall efficacy of Zurampic 200mg over placebo on the background of febuxostat Still there were trends toward benefit for other measures of sUA reduction for Zurampic 200mg in Study C (including a similar mean reduction of around 1 mgdL to that of Studies A and B) so there is likely some utility in exploring subgroup analyses from this study
Reference ID 3896980
9
Due to the fact that the dose of Zurampic 200mg was approved for the add-on therapy to treat hyperuricemia associated with gout subgroup analyses of the combined Studies A and B and each individual study (A-C) were considered mainly for Zurampic 200mg When subgroup and treatment interaction results were not consistent between studies on the Zurampic 200mg dose data subgroup analysis results based on Zurampic 400mg data were also examined for trend and consistency
In the original application the treatment effect of Zurampic 200mg (difference in proportion of subjects with an sUA level lt 60 mgdL in studies A and B or 50 mgdL in study C between treatment groups) for the individual trials was calculated from the binomial treatment proportions The corresponding confidence intervals the Wald asymptotic confidence limits for the difference of proportions were calculated based on the normal approximation to the binomial distribution For Studies A and B the difference in sUA response rates between the Zurampic 200mg group and placebo was tested using the CMH test statistic for the ITT population stratifying by Day -7 renal function and tophus status during Screening (randomized values) For Study C Day -7 renal function and sUA level at Day -7 were used as stratifying factors
In this review for each individual study the treatment effect of Zurampic 200mg relative to placebo within subgroups was estimated by calculating the proportional difference for each subgroup separately The difference in treatment effect between subgroups was tested by a treatment by subgroup interaction When performing the test for treatment by subgroup interaction I used a logistic regression model by including the stratifying factors used in the original CMH test and the factor subgroup and a term for treatment by subgroup interaction
In all cases where Studies A and B were combined the treatment effect of Zurampic 200mg relative to placebo within subgroups was estimated by combining the data from the individual studies The test for treatment by subgroup interaction was performed using the same model and approach as described for the individual trials with the exception that the model was extended with interaction terms with study for each factor and covariate as used in the model for individual trials (eg including subgroup by study interaction treatment by study interaction and stratification factor by study interactions) This approach was taken to allow the relationship between covariates and the outcome to differ between the studies
We acknowledge that these analyses are exploratory and the trials were not designed to support such investigations In general these comparisons may be limited by multiplicity on one hand and low power considerations on the other Despite these possible statistical limitations associated with multiplicity and low power these investigations are undertaken in the interest of transparency and to provide as much information regarding subgroup differences as is possible using the available data In cases in which an analysis identifies possible subgroup differences we evaluated a number of additional factors such as study consistency and consistency across doses (utilizing Zurampic 400mg data) to help explore
Reference ID 3896980
10
whether low p-values for subgroup interaction tests might represent a true difference or a false positive
33 Results by Sex Race Age and Ethnicity
This section provides estimates of the difference between Zurampic 200mg and placebo in the proportion of subjects with an sUA level lt 60 (50 in Study C) mgdL at Month 6 by sex race age and ethnicity subgroups Approximate 95 confidence intervals for treatment differences within each subgroup were constructed using normal approximation to the binomial distribution Tests for the treatment-by-subgroup interaction are also provided Table 4 displays the patient demographics by treatment arm Figures 1 through 4 display results for each study considered individually as well as the combinations of studies A and B Analogous results are displayed for lesinurad 400mg in the Appendix
Table 3 Patient Demographics by Treatment (ITT)
Subgroup Category
Study A Study B Study C
Placebo N ()
Zurampic 200mg N()
Placebo N ()
Zurampic 200mg N()
Placebo N ()
Zurampic 200mg N()
Total N 201 201 206 204 109 106
Age lt 65 YEARS 169 (84) 181 (90) 185 (90) 184 (90) 89 (82) 89 (84)
gt= 65 YEARS 32 (16) 20 (10) 21 (10) 20 (10) 20 (18) 17 (16)
Sex F 12 (6) 9 (4) 10 (5) 7 (3) 2 (2) 6 (6)
M 189 (94) 192 (96) 196 (95) 197 (97) 107 (98) 100 (94)
Race
ASIAN 10 (5) 9 (4) 14 (7) 10 (5) 6 (6) 8 (8)
BLACK OR AFRICAN AMERICAN 29 (14) 31 (15) 22 (11) 15 (7) 8 (7) 14 (13)
WHITE 153 (76) 151 (75) 155 (75) 167 (82) 94 (86) 80 (75)
COMBINED OTHER 9 (4) 10 (5) 15 (7) 12 (6) 1 (lt1) 4 (4)
AMERICAN INDIAN OR ALASKA NATIVE 1 (lt1) 2 (lt1) 1 (lt1) 1 (lt1) 0 1 (lt1)
MAORI 0 0 1 (lt1) 4 (2) 0 0
NATIVE HAWAIIAN OR OTHER PACIFIC ISLANDERS
5 (2) 4 (2) 5 (2) 3 (1) 0 1 (lt1)
OTHER 3 (1) 4 (2) 8 (4) 4 (2) 1 (lt1) 2 (2)
Ethnicity HISPANIC OR LATINO 19 (9) 27 (13) 7 (3) 10 (5) 9 (8) 7 (7)
NOT HISPANIC OR LATINO 182 (91) 174 (87) 199 (97) 194 (95) 100 (92) 99 (93)
Reference ID 3896980
11
Figure 1 Difference (95 Confidence Interval) of Proportion for Subjects with Month 6 sUA Levels lt 60 mgdL (Study A Zurampic 200mg minus Placebo Non-Responder Imputation)
sUA serum uric acid Diff Difference in proportion LCL lower confidence limit UCL upper confidence limit p-vaule statistical test measuring whether the treatment effect differs across subgroups (ie p-value for treatment-by-subgroup interaction) F female M Male LESU lesinurad (Zurampic)
Figure 2 Difference (95 Confidence Interval) of Proportion for Subjects with Month 6 sUA Levels lt 60 mgdL (Study B Zurampic 200mg minus Placebo Non-Responder Imputation)
sUA serum uric acid Diff Difference in proportion LCL lower confidence limit UCL upper confidence limit p-vaule statistical test measuring whether the treatment effect differs across subgroups (ie p-value for treatment-by-subgroup interaction) F female M Male LESU lesinurad (Zurampic)
Reference ID 3896980
12
Figure 3 Difference (95 Confidence Interval) of Proportion for Subjects with Month 6 sUA Levels lt 50 mgdL (Study C Zurampic 200mg minus Placebo Non-Responder Imputation)
sUA serum uric acid Diff Difference in proportion LCL lower confidence limit UCL upper confidence limit p-vaule statistical test measuring whether the treatment effect differs across subgroups (ie p-value for treatment-by-subgroup interaction) F female M Male LESU lesinurad (Zurampic)
Figure 4 Difference (95 Confidence Interval) of Proportion for Subjects with Month 6 sUA Levels lt 60 mgdL (Pooled Studies A and B Zurampic 200mg Minus Placebo Non-Responder Imputation)
sUA serum uric acid Diff Difference in proportion LCL lower confidence limit UCL upper confidence limit p-vaule statistical test measuring whether the treatment effect differs across subgroups (ie p-value for treatment-by-subgroup interaction) F female M Male LESU lesinurad (Zurampic)
Reference ID 3896980
13
Table 4 Difference (95 Confidence Interval) of Proportion for Subjects with Month 6 sUA Levels lt 60 mgdL (lt 50 mgdL in Study C) (By Age Group Zurampic 200mg Minus Placebo Non-Responder Imputation)
Study Age
Group
Placebo Zurampic 200mg Difference (95 CI) in
Proportion of sUA Responders (Zurampic
200mg - Placebo)
Test for Treatment by
Age Group Interaction (p-
value)
N
Number () of Subjects with sUA Level lt 60 mgdL
at Month 6
N
Number () of Subjects with sUA Level lt 60 mgdL
at Month 6
Study A
lt 65 years
169 46(272) 181 99(547) 027( 018 037)
0537 gt= 65 years
32 10(313) 20 10(500) 019(-008 046)
Study B
lt 65 years
185 43(232) 184 100(543) 031( 022 041)
0565 gt= 65 years
21 5(238) 20 13(650) 041( 013 069)
Pooled Studies A and B
lt 65 years
354 89(251) 365 199(545) 029( 023 036)
0936 gt= 65 years
53 15(283) 40 23(575) 029( 010 049)
Study C
lt 65 years
89 41(461) 89 50(562) 010(-004 025)
0625 gt= 65 years
20 10(500) 17 10(588) 009(-023 041)
Examination of treatment effect by age group The combined analysis of Studies A and B showed no evidence of an interaction and produced the same point estimates of effect in the two age subgroups In addition in the combined analysis there is evidence that for gout patients on background allopurinol Zurampic 200mg is effective compared to placebo with respect to the proportion of subjects with an sUA level lt 60 mgdL at month 6 in both age groups Consistent with the conclusions of the combined analysis within Study A the estimated effect of Zurampic 200mg over placebo is positive in both age groups although in the older patient group the confidence interval for the difference between treatment groups includes 0 This lack of statistical significance is potentially due to the small sample size in this age group Also consistent with the combined analysis within the individual Studies A and B there is no statistical evidence suggesting that the effect of Zurampic relative to placebo may be different between the two age groups as the p-values associated with the treatment-by-age interaction are about 05
Reference ID 3896980
14
There also was no evidence of a treatment by age interaction in Study C There was no evidence of treatment effects in the age subgroups in Study C which is consistent with the lack of evidence of an overall study effect but trends were in the direction favorable to Zurampic and of a similar magnitude in the two subgroups Similar results were observed for the 400mg dose in these studies
In summary with evidence of effects in both subgroups in integrated studies A and B consistent estimates in Study C with trends toward benefit and no evidence of interactions from any analyses the totality of the data suggests that Zurampic is efficacious compared with placebo in both patient age groups and does not suggest any striking differences in effects between older and younger patients
Table 5 Difference (95 Confidence Interval) of Proportion for Subjects with Month 6 sUA Levels lt 60 mgdL (lt 50 mgdL in Study C) (By Sex Zurampic 200mg Minus Placebo Non-Responder Imputation)
Study Sex
Placebo Zurampic 200mg Difference (95 CI) in Proportion of sUA
Responders (Zurampic 200mg -
Placebo)
Test for Treatment by
Sex Interaction (p-value)
N
Number () of Subjects with sUA Level lt 60 mgdL
at Month 6
N
Number () of Subjects with sUA
Level lt 60 mgdL at Month 6
Study A F 12 5(417) 9 1(111) -031(-065 004) 0016
M 189 51(270) 192 108(563) 029( 020 039)
Study B F 10 2(200) 7 3(429) 023(-021 067) 0818
M 196 46(235) 197 110(558) 032( 023 041)
Pooled Studies A and B
F 22 7(318) 16 4(250) -007(-036 022) 0030
M 385 97(252) 389 218(560) 031( 024 037)
Study C F 2 0 6 2(333) 033(-004 071) 0972
M 107 51(477) 100 58(580) 010(-003 024)
Examination of treatment effect by sex Among the three phase 3 studies about 95 of the subjects were male In both Study A and Study B there was evidence of a treatment effect on serum uric reduction in males There was considerable uncertainty in the evaluation in females due to small sample sizes Compared with men women are less likely to develop gout in the premenopausal period due to the uricosuric effect of female hormones this explains largely the gender imbalance of subject numbers in enrollment The small female sample sizes resulted in some statistical difficulties due to small responders counts for example there were zero female responders on the placebo arm in study C (Table 6) and a female responder count of
Reference ID 3896980
15
only 1 in the Zurampic 200mg arm in study A which could be partially attributed to 3 early discontinuations among the 9 total subjects that were imputed as non-responders
Despite the small numbers of females in these studies there was some evidence in Study A of a treatment by sex interaction (p=0016) Borderline evidence (p=003) was also seen based on the integrated analysis of Studies A and B However this finding in the combined analysis was primarily driven by the Study A interaction test results and such an interaction was not replicated in either Study B or Study C With the limited female data in mind in the face of the inconsistency of subgroup analysis results among the three studies and with reference the Zurampic 400mg interaction tests results as any true differences in efficacy by subgroup might be expected to exist for both doses we conclude that the suggestion of a differing treatment effect by sex in study A may not represent a finding of a true treatment by sex interaction
In study C the zero frequency in female patients in placebo group resulted in a quasi-complete separation of data points such that the maximum likelihood iterations did not converge The result shown for the interaction test are based on the last maximum likelihood iteration (p=0972) the validity of which is questionable In terms of point estimates and corresponding confidence intervals the by sex group responder rate results are consistent with the overall study results showing a numerically positive but not statistically significant trend There was no statistical evidence of subgroup differences between the two sexes
Data from Zurampic 400mg data showed that in general the two genders had consistent treatment effects with no significant interaction effects among the 3 studies individually or combined Of note from the febuxostat background study C while the overall effect of Zurampic 400mg was statistically significant and 200mg was not both doses showed a numerically higher treatment effect in females as compared with males which is different from the trend found from the integrated 200mg dose allopurinol background studies and reinforces the conclusion that the differences in treatment effect by sex are likely a result of natural variation and not indicative of a true treatment by sex interaction
The totality of the above data shows that there was consistent evidence of a treatment effect in males There was some evidence (p-value=003) of an interaction by sex in integrated Studies A and B with trends toward less efficacy in females However with the small female patient numbers and the relatively large number of subgroup analyses performed in this review as well as the lack of consistency in findings across studies and doses it remains unclear whether the treatment effect differs by sex
Reference ID 3896980
16
Table 6 Difference (95 Confidence Interval) of Proportion for Subjects with Month 6 sUA Levels lt 60 mgdL (lt 50 mgdL in Study C) (By Race Zurampic 200mg Minus Placebo Non-Responder Imputation)
Study Race
Placebo Zurampic 200mg
Difference (95 CI) in Proportion of sUA Responders (Zurampic 200mg - Placebo)
Test for Treatment by Race Interaction
(p-value)
N
Number () of Subjects with sUA Level lt 60 mgdL at Month 6 N
Number () of Subjects with sUA Level lt 60 mgdL at Month 6
Study A
ASIAN 10 4(400) 9 5(556) 016(-029 060)
0782
BLACK OR AFRICAN AMERICAN
29 5(172) 31 10(323) 015(-006 036)
COMBINED OTHER
9 3 (333) 10 5(500) 017(022 060)
WHITE 153 44(288) 151 89(589) 030( 020 041)
Study B
ASIAN 14 3(214) 10 8(800) 059( 026 091)
BLACK OR AFRICAN AMERICAN
22 4(182) 15 8(533) 035( 005 065)
0371COMBINED OTHER
15 3 (200) 12 3 (250) 005(-027 037)
WHITE 155 38(245) 167 94(563) 032( 022 042)
Pooled Studies A
and B
ASIAN 24 7(292) 19 13(684) 039( 012 067)
0611
BLACK OR AFRICAN AMERICAN
51 9(176) 46 18(391) 021( 004 039)
COMBINED OTHER
24 6(250) 22 8(364) 011(-015 038)
WHITE 308 82(266) 318 183(575) 031( 024 038)
Study C
ASIAN 6 3(500) 8 7(875) 038(-009 084)
0479
BLACK OR AFRICAN AMERICAN
8 3(375) 14 7(500) 013(-030 055)
COMBINED OTHER
1 0 4 1 (250) 025(-017 067)
WHITE 94 45(479) 80 45(563) 008(-006 023)
Examination of treatment effect by race There were a total of 7 racial subgroups across the studies with some groups of very small sample sizes Some subgroup sizes were too small to allow for a reliable evaluation so we combined some racial subgroups as catalogued in Table 3 into a Combined Other group
Reference ID 3896980
17
From the integrated analysis of Studies A and B there was evidence of a treatment effect for the White Black and Asian subgroups In individual Study A or B in general there was evidence of treatment effects or trends toward benefit for the White Black Asian and Other subgroups For smaller subgroups while positive estimates were observed small sample sizes resulted in wide confidence intervals Trends toward benefit were observed in all racial subgroups in Study C but the small sample sizes resulted in wide confidence intervals (that included zero) in all racial groups There was no evidence of a treatment by race interaction in any of the individual or combined analyses Results were similar for the 400mg dose The totality of the data therefore suggests that Zurampic is effective in Whites Blacks and Asians and no large differences in efficacy across racial subgroups were identified
Table 7 Difference (95 Confidence Interval) of Proportion for Subjects with Month 6 sUA Levels lt 60 mgdL (lt 50 mgdL in Study C) (By Ethnicity Zurampic 200mg Minus Placebo Non-Responder Imputation)
Study Ethnicity
Placebo Zurampic 200mg Difference (95 CI) in
Proportion of sUA
Responders (Zurampic 200mg -Placebo)
Test for Treatment
by Ethnicity Interaction (p-value)
N Number () of Subjects
with sUA Level lt 60 mgdL at Month 6
N
Number () of Subjects with sUA
Level lt 60 mgdL at Month 6
Study A
HISPANIC OR LATINO
19 3(158) 27 10(370) 021(-003
046) 0962
NOT HISPANIC OR LATINO
182 53(291) 174 99(569) 028( 018
038)
Study B
HISPANIC OR LATINO
7 2(286) 10 6(600) 031(-014
077) 0889
NOT HISPANIC OR LATINO
199 46(231) 194 107(552) 032( 023
041)
Pooled Studies A and B
HISPANIC OR LATINO
26 5(192) 37 16(432) 024( 002
046) 0902
NOT HISPANIC OR LATINO
381 99(260) 368 206(560) 030( 023
037)
Study C
HISPANIC OR LATINO
9 3(333) 7 2(286) -005(-050
041) 0413
NOT HISPANIC OR LATINO
100 48(480) 99 58(586) 011(-003
024)
Reference ID 3896980
18
Examination of treatment effect by ethnicity Results and conclusions from analyses across the ethnic subgroups were similar to those across racial subgroups From the pooled analysis of Studies A and B there was evidence of a treatment effect for both the ethnic subgroups When looking at Study A or B a treatment effect was observed in patients who were not Hispanic or Latino For the Hispanic or Latino subgroup while positive estimates were observed small samples resulted in wider confidence intervals that included zero In Study C a trend toward benefit was observed in the not Hispanic or Latino group but not in the Hispanic or Latino group although the sample size in this subgroup was very small
Subgroup analysis results from Lesinurad 400mg supported the efficacy of both subgroups with the only exception of a wide confidence interval for the Hispanic or Latino subgroup in Study B Across studies and dosages there was no evidence based on interaction tests of differences in treatment effects across the ethnic subgroups
4 SUMMARY AND CONCLUSIONS This review examined existing data to assess the treatment effect of Zurampic 200mg on sUA level lt 60 mgdL responder rate at month 6 within each sex age race and ethnicity subgroup and whether the treatment effect of Zurampic 200mg on sUA level lt 60 mgdL responder rate at month 6 differs by sex age race or ethnicity We acknowledge that the analyses provided in this review are exploratory and the trials were not designed to support such investigations Despite possible statistical limitations these investigations were undertaken in the interest of transparency and to provide as much information regarding subgroup differences as is possible using the available data
This review concludes that
Zurampic 200mg appears to be efficacious compared with placebo with respect to the sUA lt 06 mgdL responder rate at month 6 within each age group (below 65 years and 65 years and above) Available data did not give a strong indication that the treatment effect for Zurampic 200mg is larger in one age group than the other
Zurampic 200mg appears to be efficacious compared with placebo with respect to the sUA lt 06 mgdL responder rate within male patients with gout Available data for the female patient subgroup is too limited to draw conclusions about whether the treatment effect for Zurampic 200mg exists in females (without borrowing information from male subjects) There was some evidence of a difference between treatment effects in men and women in a single study However with the small female patient numbers and the relatively large number of subgroup analyses performed in this review as well as the lack of consistency in treatment by sex interaction findings across studies and doses we have little evidence to suggest that the treatment effect truly differs by
Reference ID 3896980
19
sex Based on these considerations and using all available data including data in males we suppose that Zurampic 200mg is superior to placebo even in female patients
There was evidence of a treatment effect for the White Black and Asian subgroups For smaller racial subgroups (combined in the analyses) while positive estimates were observed small sample sizes resulted in wide confidence intervals There was no evidence of a treatment by race interaction in any of the individual or combined analyses
There was evidence of a treatment effect for both the HispanicLatino and not HispanicLatino subgroups For the smaller HispanicLatino subgroup while positive estimates of similar size were observed small sample sizes resulted in wide confidence intervals There was no evidence of a treatment by ethnicity interaction in any of the individual or combined analyses
Reference ID 3896980
20
Appendix Subgroup Analysis Results Comparing Zurampic 400mg with Placebo Figure 5 Difference (95 Confidence Interval) of Proportion for Subjects with Month 6 sUA Levels lt 60 mgdL (Study A Zurampic 400mg minus Placebo Non-Responder Imputation)
sUA serum uric acid Diff Difference in proportion LCL lower confidence limit UCL upper confidence limit p-vaule statistical test measuring whether the treatment effect differs across subgroups (ie p-value for treatment-by-subgroup interaction) F female M Male LESU lesinurad (Zurampic)
Figure 6 Difference (95 Confidence Interval) of Proportion for Subjects with Month 6 sUA Levels lt 60 mgdL (Study B Zurampic 400mg minus Placebo Non-Responder Imputation)
sUA serum uric acid Diff Difference in proportion LCL lower confidence limit UCL upper confidence limit p-vaule statistical test measuring whether the treatment effect differs across subgroups (ie p-value for treatment-by-subgroup interaction) F female M Male LESU lesinurad (Zurampic)
Reference ID 3896980
21
Figure 7 Difference (95 Confidence Interval) of Proportion for Subjects with Month 6 sUA Levels lt 50 mgdL (Study C Zurampic 400mg minus Placebo Non-Responder Imputation)
sUA serum uric acid Diff Difference in proportion LCL lower confidence limit UCL upper confidence limit p-vaule statistical test measuring whether the treatment effect differs across subgroups (ie p-value for treatment-by-subgroup interaction) F female M Male LESU lesinurad (Zurampic)
Figure 8 Difference (95 Confidence Interval) of Proportion for Subjects with Month 6 sUA Levels lt 60 mgdL (Pooled Studies A and B Zurampic 400mg minus Placebo Non-Responder Imputation)
sUA serum uric acid Diff Difference in proportion LCL lower confidence limit UCL upper confidence limit p-vaule statistical test measuring whether the treatment effect differs across subgroups (ie p-value for treatment-by-subgroup interaction) F female M Male LESU lesinurad (Zurampic)
Reference ID 3896980
22
---------------------------------------------------------------------------------------------------------
---------------------------------------------------------------------------------------------------------
----------------------------------------------------
This is a representation of an electronic record that was signed electronically and this page is the manifestation of the electronic signature
s
YU WANG 03042016
GREGORY P LEVIN 03042016
Reference ID 3896980
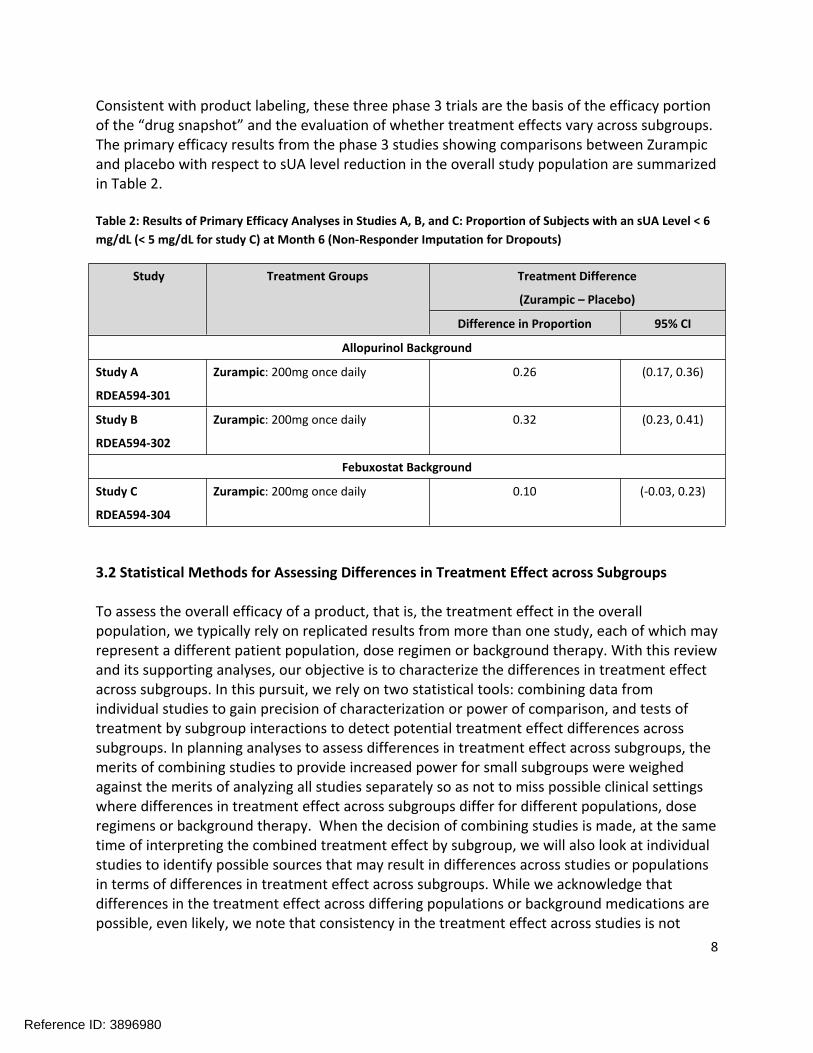
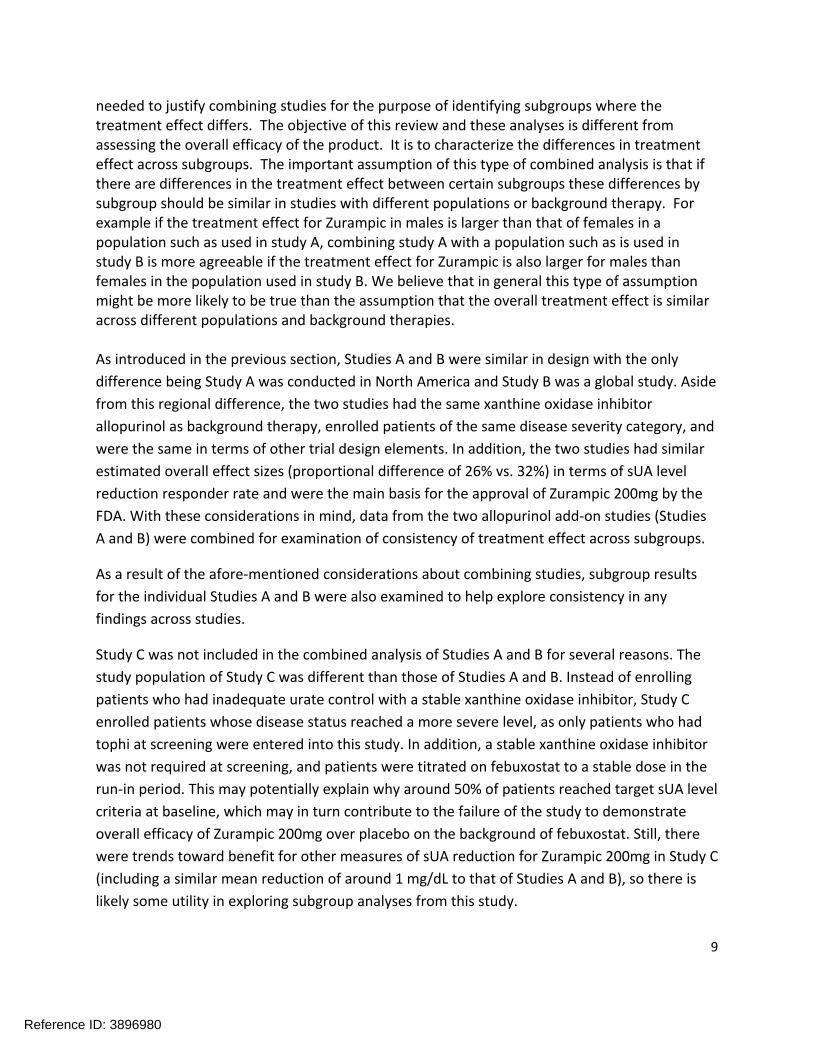
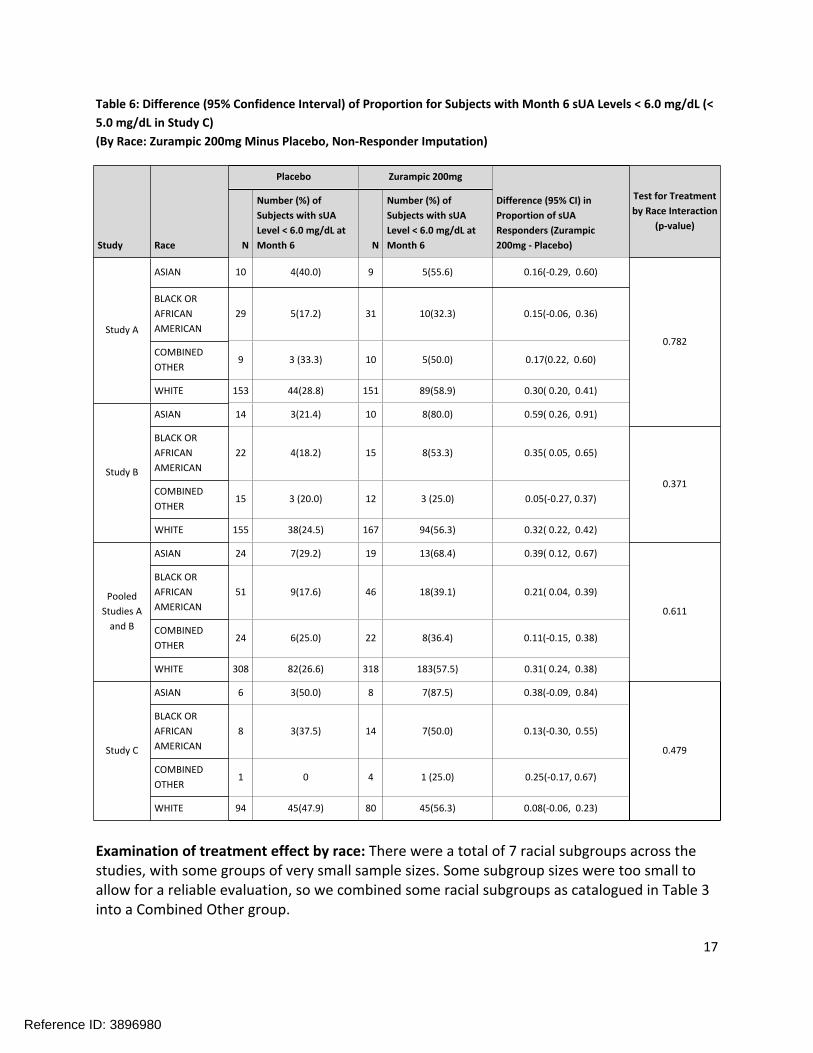
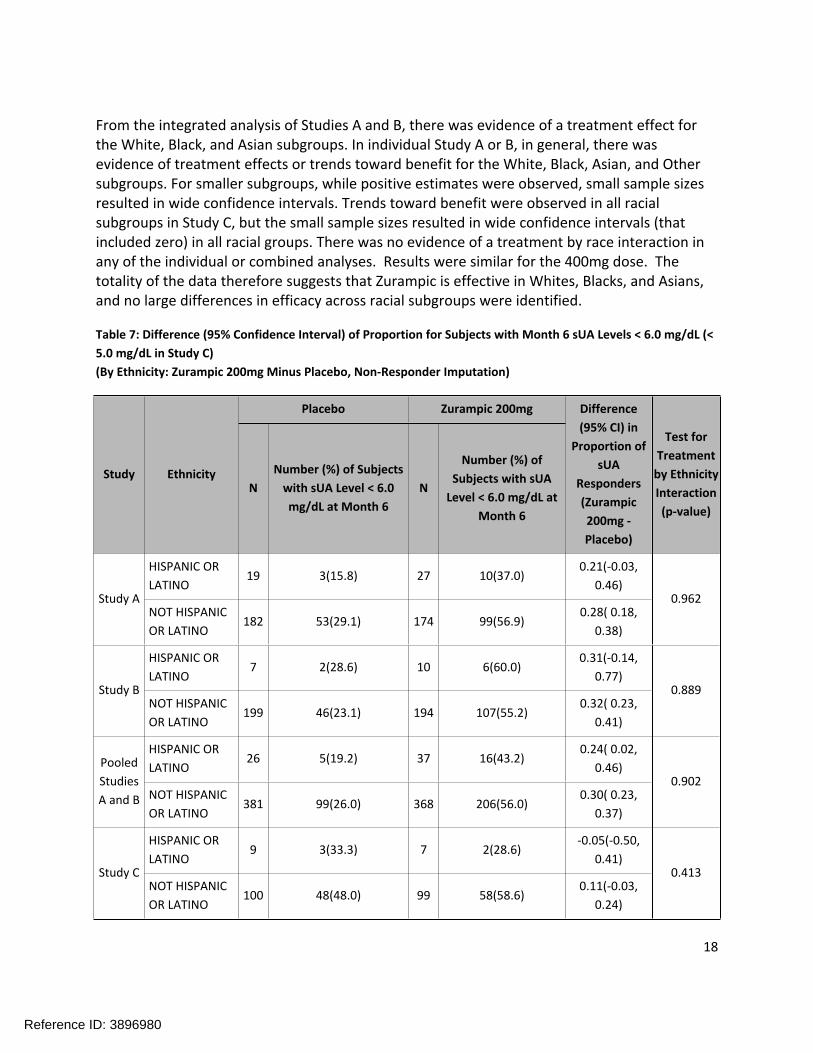

---------------------------------------------------------------------------------------------------------
---------------------------------------------------------------------------------------------------------
----------------------------------------------------
This is a representation of an electronic record that was signed electronically and this page is the manifestation of the electronic signature
s
YU WANG 03042016
GREGORY P LEVIN 03042016
Reference ID 3896980