s2 mpc - esa
TRANSCRIPT

Reference: S2-PDGS-MPC-L2ADQR
Issue: 43
Date: 08/11/2021
Level 2A Data
Quality Report
Ref. S2-PDGS-MPC-L2ADQR
S2 MPC

Reference: S2-PDGS-MPC-L2ADQR
Issue: 43
Date: 08/11/2021
2/30
Authors Table Name Company Responsibility Date Signature
Written by S. Clerc & MPC Team ARGANS Technical
Manager 08/11/2021
Verified by O. Devignot CS Quality Manager 08/11/2021
Approved by L. Pessiot CS Service Manager 08/11/2021
Reference: S2-PDGS-MPC-L2ADQR
Issue: 43
Date: 08/11/2021
3/30
Table of contents
1. SCOPE OF THE DOCUMENT 4
1.1 Introduction ............................................................................... 4
1.2 Main points for this month .......................................................... 4
2. MEASURED PRODUCT PERFORMANCES 5
2.1 Performances Overview .............................................................. 5
2.2 Performances ............................................................................. 6
2.2.1 Surface reflectance radiometry accuracy ..................................... 6
2.2.2 Water Vapour accuracy ............................................................. 7
2.2.3 Aerosol Optical Depth accuracy ................................................. 10
2.2.4 Classification accuracy ............................................................. 13
3. PROCESSING CHAIN STATUS 16
3.1 Processing baseline .................................................................. 16
3.1.1 Configuration and differences with Sen2cor ‘User’ version ............ 16
3.1.2 New processing baseline 03.01 ................................................. 17
3.1.3 Major evolution: processing baseline 04.00 ................................ 17
3.2 Status of Processing Baselines and Known Processing Anomalies
................................................................................................. 19
4. PRODUCT ANOMALIES 21
4.1 Introduction ............................................................................. 21
4.2 Incorrect Tile ID metadata (#55) ............................................. 21
4.3 Incorrect No Data mask (#56) .................................................. 21
4.4 Encoding of Quality Bands (#59) .............................................. 22
4.5 Terrain correction over clouds (#60) ........................................ 22
4.6 Naming of quality masks files (#61) ......................................... 22
4.7 Incorrect cloud probability near the boundary of the swath (#62)
................................................................................................. 23
4.8 Products processed without DEM (#63) ................................... 23
4.9 Scene classification at high Sun-Zenith Angle (#65) ................ 24
4.10 Halo near image boundaries (#66) ........................................... 24
5. PRODUCT FEATURES 25
5.1 Scene classification .................................................................. 25
5.2 Overlap between tiles ............................................................... 27
5.3 Terrain over-correction on shaded areas .................................. 27
5.4 Maximal Sun-Zenith Angle ........................................................ 27
5.5 Missing packets ........................................................................ 28
5.6 Discontinuities visible in Terrain Correction on very flat areas . 29

Reference: S2-PDGS-MPC-L2ADQR
Issue: 43
Date: 08/11/2021
4/30
1. Scope of the Document
1.1 Introduction
This document provides the status of Sentinel-2 mission Level 2A products data
quality. It refers to systematic production from processing baselines 02.07 and
higher and complements the Data Quality Report for L1C products.
It documents the measured product performances, the status of Level 2A
processing chain, and the list of known anomalies on the production.
Additional performance metrics (in particular geometry) are reported in the
companion Level 1C Data Quality Report. Similarly, anomalies affecting L1C
products documented in that report also impact L2A products.
Note that a reference article provides an in-depth presentation of Sentinel-2
Calibration and Validation methods and results after one year in operation
(F. Gascon et al., “Copernicus Sentinel-2 Calibration and Products Validation
Status”, RSE, 2017). More information about L2A performance validation can be
found in G. Doxani et al., “Atmospheric Correction Inter-Comparison Exercise”,
Remote Sensing, 10 (352), pp 1-18. DOI: doi:10.3390/rs10020352 ISSN 2072-
4292. Please note that a former version of Sen2Cor was used during this inter-
comparison exercise (not 02.07) and performance have generally improved since
then.
1.2 Main points for this month
✓ No new points for this month

Reference: S2-PDGS-MPC-L2ADQR
Issue: 43
Date: 08/11/2021
5/30
2. Measured Product Performances
2.1 Performances Overview
The following overview table provides a summary of the Level 2A products data
quality performances. Note that the performances reported in this issue of the L2A
Data Quality Report have been measured with Sen2cor versions 2.5 (toolbox
version), and may thus slightly differ from the performance of the current
processing baseline.
Table 2-1: Summary of Sentinel-2 L2A products measured performances
for mission key requirements.
Requirement Description Measured
performance
Surface reflectance accuracy
Uncertainty of Bottom-of-Atmosphere reflectance ρ shall be
less than
0.05ρreference + 0.005
Uncertainty (U): all bands outside specification
Accuracy: B5 and B12 outside specification for
U, all other bands within
Water Vapour
accuracy
The difference ΔWV of retrieved Water vapour to reference from AERONET WVref shall be within
|ΔWV| ≤0.1*WVref+0.2
92% of retrieved Water vapour values are within
requirement
Aerosol Optical Depth accuracy
The difference ΔAOT of retrieved Aerosol optical thickness at 550 nm to reference from AERONET
AOTref shall be within
|ΔAOT| ≤0.1*AOTref+0.03
41% of retrieved Aerosol optical thickness
values at 550 nm are within requirement
Classification
accuracy No requirement defined.
omission and commission
classification errors are 15% and 16% for recognition of clear pixels over land and
water
Measured performances are detailed in the following sections.

Reference: S2-PDGS-MPC-L2ADQR
Issue: 43
Date: 08/11/2021
6/30
2.2 Performances
2.2.1 Surface reflectance radiometry accuracy
Quantitative assessment of surface reflectance radiometric performance is
provided for Sen2Cor version 2.5 ‘user’ version. AERONET-corrected surface
reflectance data serve as a reference for this analysis. They are computed from
the Sentinel-2 L1C data (TOA) using the aerosol properties obtained from
AERONET in-situ measurements as input to the 6S radiation transport processor.
The analysis is based on the dataset defined for the Atmospheric Correction Inter-
comparison Exercise (ACIX-1) (G. Doxani et al., “Atmospheric Correction Inter-
Comparison Exercise”, Remote Sensing, 10 (352), pp 1-18. DOI:
doi:10.3390/rs10020352 ISSN 2072-4292). Plots were generated for all Sentinel-
2 bands showing the average accuracy, precision and uncertainty values (APU)
over all images within the validation data set per surface reflectance bin. Accuracy
value is equivalent to the mean bias, precision value is equivalent to the
repeatability or variation around the mean bias and uncertainty is quadratic sum
of Accuracy and Precision.
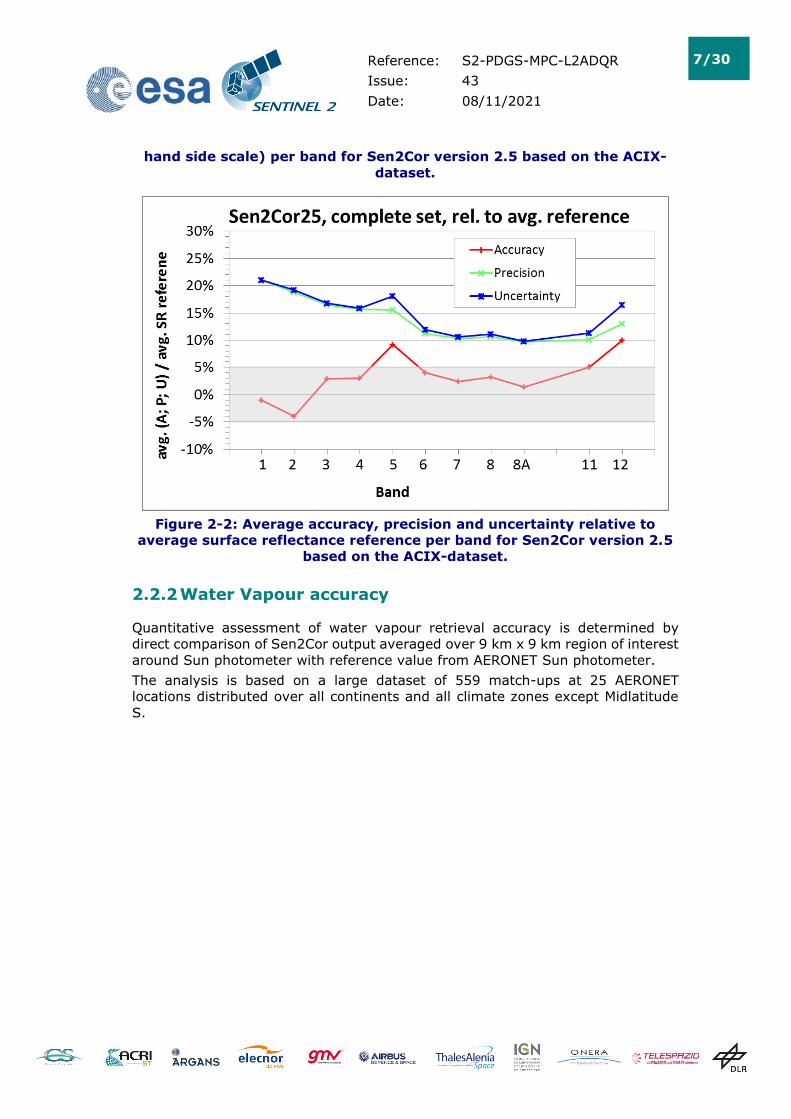
Average APU per band is shown in Figure 2-1, while Figure 2-2 shows the average
APU per band relative to the average surface reflectance of the band. Uncertainty
is outside specification for all bands due to the large precision value. Less variation
of results would remarkably improve the situation because accuracy value is well
within the specification except band 5 and band 12. Both uncertainty and accuracy
value show an increasing trend with wavelength (band number). Thus, best
performance is achieved for VIS bands with lowest accuracy and precision values
and lowest uncertainty. Average accuracy value relative to average surface
reflectance reference is below or near to 5% except for bands 5 and 12 (Figure
2-2).
Figure 2-1: Average accuracy, precision, uncertainty (solid lines, left
hand side scale) and surface reflectance reference (dashed line, right
Reference: S2-PDGS-MPC-L2ADQR
Issue: 43
Date: 08/11/2021
7/30
hand side scale) per band for Sen2Cor version 2.5 based on the ACIX-
dataset.
Figure 2-2: Average accuracy, precision and uncertainty relative to
average surface reflectance reference per band for Sen2Cor version 2.5
based on the ACIX-dataset.
2.2.2 Water Vapour accuracy
Quantitative assessment of water vapour retrieval accuracy is determined by
direct comparison of Sen2Cor output averaged over 9 km x 9 km region of interest
around Sun photometer with reference value from AERONET Sun photometer.
The analysis is based on a large dataset of 559 match-ups at 25 AERONET
locations distributed over all continents and all climate zones except Midlatitude
S.

Reference: S2-PDGS-MPC-L2ADQR
Issue: 43
Date: 08/11/2021
8/30
Figure 2-3: Correlation plot of Sen2Cor WV retrieval at 20 m resolution
over WV reference from AERONET on basis of a data set at 25 AERONET
sites. The dashed line indicates x=y and the solid lines show the limits of
uncertainty requirement |ΔWV|≤0.1*WVref+0.2.

Reference: S2-PDGS-MPC-L2ADQR
Issue: 43
Date: 08/11/2021
9/30
Figure 2-4: Histogram plot of WV (at 20 m resolution) retrieval
difference to the reference value from AERONET. The green dashed curve
gives a normal distribution computed with accuracy as mean value and precision
as standard deviation. The blue dashed curve represents a normal distribution
around zero with uncertainty as standard deviation.
Table 2-2: Statistical numbers reporting on WV-validation for Sen2Cor
2.5 on basis a data set at 25 AERONET sites.
WV statistics
Total no. of granules 559
WV retrievals within requirement 92%
R2 (Coefficient of variation) 0.97
r (Pearson’s corr. coeff.) 0.98
MA (Median Accuracy value) -0.13 cm
MP (Median Precision value) 0.22 cm
Uncertainty (U) 0.28 cm
Max WV difference 1.63 cm
Water vapour retrieval is very accurate with correlations over 0.98 and with 92%
of retrievals within the requirement. Validation shows a trend for little
underestimation of WV by Sen2Cor. The large maximum difference of WV retrieval
occurs at WV reference value above 6 cm, which is an extreme value even for the
tropics.

Reference: S2-PDGS-MPC-L2ADQR
Issue: 43
Date: 08/11/2021
10/30
2.2.3 Aerosol Optical Depth accuracy
Quantitative assessment of aerosol optical depth retrieval accuracy is determined
by direct comparison of Sen2Cor output averaged over 9kmx9km region of interest
around Sun photometer with reference value from AERONET Sun photometer. The
analysis is based on a large dataset of 559 match-ups at 25 AERONET locations
distributed over all continents and all climate zones except Midlatitude S.
Figure 2-5: Correlation plot of Sen2Cor AOT550 retrieval at 20 m
resolution over AOT550 reference from AERONET on basis of a data set at
25 AERONET sites. Green triangles are AOT550 retrieved with the DDV-
algorithm and orange triangles are AOT550 resulting from the present fall-back
solution (process with configured start VIS of 40 km). The dashed grey line
indicates x=y and the solid grey lines show the limits of uncertainty requirement
|ΔAOT550|≤0.1*AOT550ref+0.03. (Inset: zoom on low AOT values).

Reference: S2-PDGS-MPC-L2ADQR
Issue: 43
Date: 08/11/2021
11/30
Figure 2-6: Histogram plots of AOT550 (at 20 m resolution) retrieval
difference to the reference value from AERONET. The blue dashed curves
give normal distributions around zero with uncertainty as standard deviation.
The upper plot shows results for the complete data set and the lower plot for the
subset of images containing more than 2% DDV-pixels.
Reference: S2-PDGS-MPC-L2ADQR
Issue: 43
Date: 08/11/2021
12/30
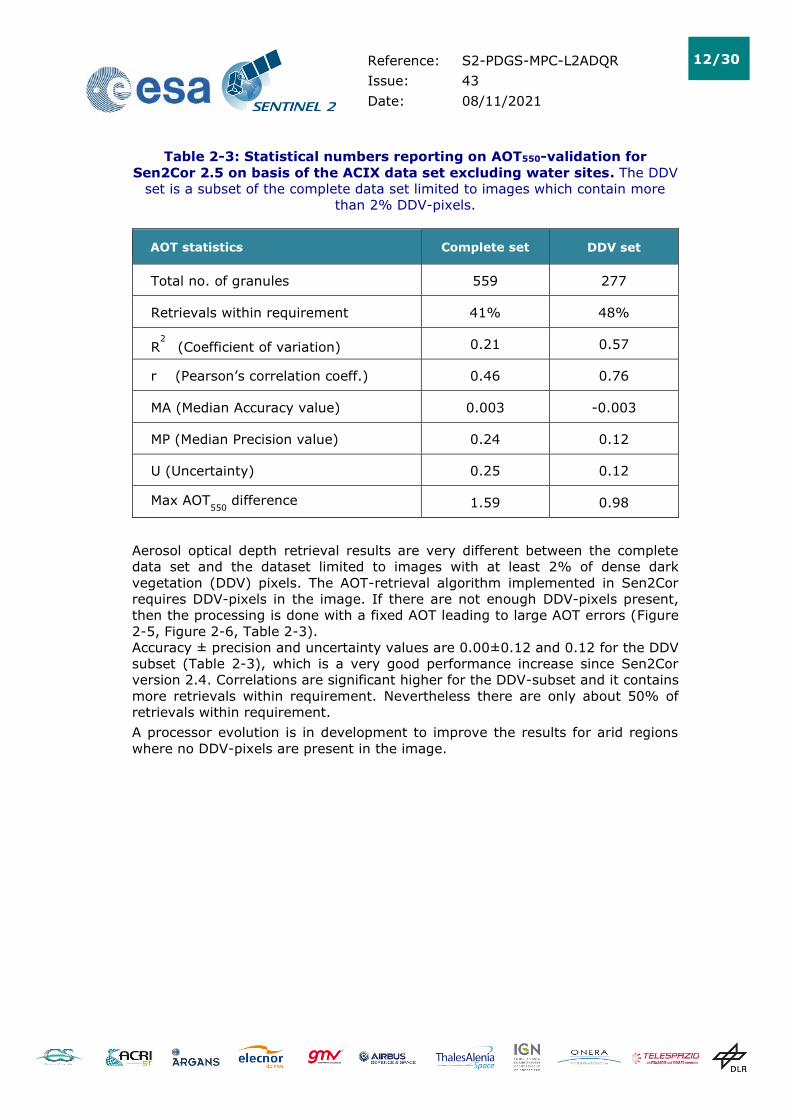
Table 2-3: Statistical numbers reporting on AOT550-validation for
Sen2Cor 2.5 on basis of the ACIX data set excluding water sites. The DDV
set is a subset of the complete data set limited to images which contain more
than 2% DDV-pixels.
AOT statistics Complete set DDV set
Total no. of granules 559 277
Retrievals within requirement 41% 48%
R2
(Coefficient of variation) 0.21 0.57
r (Pearson’s correlation coeff.) 0.46 0.76
MA (Median Accuracy value) 0.003 -0.003
MP (Median Precision value) 0.24 0.12
U (Uncertainty) 0.25 0.12
Max AOT550
difference 1.59 0.98
Aerosol optical depth retrieval results are very different between the complete
data set and the dataset limited to images with at least 2% of dense dark
vegetation (DDV) pixels. The AOT-retrieval algorithm implemented in Sen2Cor
requires DDV-pixels in the image. If there are not enough DDV-pixels present,
then the processing is done with a fixed AOT leading to large AOT errors (Figure
2-5, Figure 2-6, Table 2-3).
Accuracy ± precision and uncertainty values are 0.00±0.12 and 0.12 for the DDV
subset (Table 2-3), which is a very good performance increase since Sen2Cor
version 2.4. Correlations are significant higher for the DDV-subset and it contains
more retrievals within requirement. Nevertheless there are only about 50% of
retrievals within requirement.
A processor evolution is in development to improve the results for arid regions
where no DDV-pixels are present in the image.

Reference: S2-PDGS-MPC-L2ADQR
Issue: 43
Date: 08/11/2021
13/30
2.2.4 Classification accuracy
Classification accuracy is evaluated by comparison of the Sen2Cor outputs with
reference samples. The reference samples are generated by visual inspection and
labelling of a validation data set, which was determined by stratified random
sampling.
Current analysis of classification accuracy for Sen2Cor 2.5 using CCI data as
auxiliary information is based on 14 Sentinel-2 L2A images over 13 test sites
(Table 2-4).
Table 2-4: Selected test sites for Sen2Cor 2.5 validation
Site Tile Date (MM/DD/YYYY)
L1C Cloud cover
Antarctic 21EVK 2/4/2016 9.9
Barrax (Spain) 1 30SWH 5/9/2017 17.7
Barrax (Spain) 2 30SWH 5/19/2017 1.6
Berlin (Germany) 33UUU 5/4/2018 0.9
Casleo (Argentina) 19HDE 8/12/2016 21.7
Dunhuang (China) 46TFK 1/22/2018 29.4
Manila (Phillipines) 51PTS 3/19/2018 1.4
Rimrock (USA) 11TMM 5/12/2018 0.7
Yakutsk (Russia) 52VEP 3/8/2016 61.5
Etna Volcano (Italy) 33SVB 3/9/2017 6.9
Kilauea Volcano (USA - Hawaii) 05QKB 4/23/2018 28.4
Lagos (Portugal) 29SNB 8/8/2018 0.0
Buenos Aires (Argentina) 21HUC 8/27/2018 0.0
Tallin (Estonia) 35VLG 7/14/2018 2.1
Beside the Copernicus Sentinel-2 L2A images over core-test sites (defined in
Calibration and Validation Plan ROCVP) for the regular validation of scene
classification, 6 additional sites – Antarctic, two volcano sites and three coastal
sites – were selected. Validation data set represents different atmospheric
conditions (e.g. cloud cover), latitudes (various solar angles and seasons),
topography (flat, rough and mountainous terrain), and land cover types
(agricultural area, forests, water bodies, arid area, urban area, deserts,
permanent ice, and active volcanos).
The accuracy assessment per test site is presented in Table 2-5. OA of clear pixels
over land and water aggregate results for the Sen2Cor classes vegetation, non-
vegetated and water. OA of clouds aggregates results for Sen2Cor classes

Reference: S2-PDGS-MPC-L2ADQR
Issue: 43
Date: 08/11/2021
14/30
cloud_medium_probability, cloud_high_probability and thin cirrus. The average
overall accuracy for 14 classification products reached 81.1±14.1%. The
recognition of clear pixels over land and water reached OA of 91.5% and a
consolidated OA for clouds recognition is 94.8% (Table 2-5).
Table 2-5: Accuracy assessment per test site for SCL product with 11 classes, and
for clear land and water pixels, and clouds separation.
Site OA OA
clear pixels
OA
clouds
Pixel
validated
Antarctic 94.7 96.8 98.8 527803
Barrax (Spain) -1 64.6 96.9 98.7 141546
Barrax (Spain) -2 90.5 98.7 99.5 104799
Berlin (Germany) 93.4 96.5 no clouds 51964
Casleo (Argentina) 63.8 86.1 98.1 186238
Dunhuang (China) 57.3 66.2 no clouds 105454
Manila (Phillipines) 82.1 90.0 91.6 106263
Rimrock (USA) 90.2 98.2 99.2 103394
Yakutsk (Russia) 69.9 93.8 92.9 177983
Etna Volcano (Italy) 95.8 97.9 99.4 132340
Kilauea Volcano (USA - Hawaii) 60.4 75.4 74.2 118357
Lagos (Portugal) 96.8 97.3 no clouds 69753
Buenos Aires (Argentina) 91.8 97.3 no clouds 31841
Tallin (Estonia) 84.3 90.4 95.6 71773
Average 81.1 91.5 94.8 137822
Stdev 14.1 9.4 7.4
Commission and omission errors (corresponding to user’s and producer’s
accuracies respectively) are presented in Table 2-6. Commission for recognition of
clear pixels over land and water reached about 16% and omission error was 15%.
Commission for recognition of clouds reached 25% while omission error was 11%.
In total 1,929,508 pixels were validated.

Reference: S2-PDGS-MPC-L2ADQR
Issue: 43
Date: 08/11/2021
15/30
Table 2-6: Summarized results of omission and commission
classification errors for clear pixels and clouds detection for 14 Sentinel-
2 images.
Clear pixels over land and water
Clear pixels
Land-Water Others Sum Commission
Clear pixels
Land-Water
733113 78587 811700 16.136
Others 72526 1045282 1117808 26.874
Sum 805639 1123869 1929508
Omission 15.011 18.818
All clouds
Clouds Others Sum Commission
Clouds 491769 30212 521981 25.013
Others 54967 1352560 1407527 5.082
Sum 546736 1382772 1929508
Omission 10.788 2.642
Reference: S2-PDGS-MPC-L2ADQR
Issue: 43
Date: 08/11/2021
16/30
3. Processing Chain Status
3.1 Processing baseline
Note that ESA-L2A core products which can be downloaded from SciHub have not
all been processed with the same Sen2Cor processor version. There is no
reprocessing of the archive after a new Sen2Cor release.
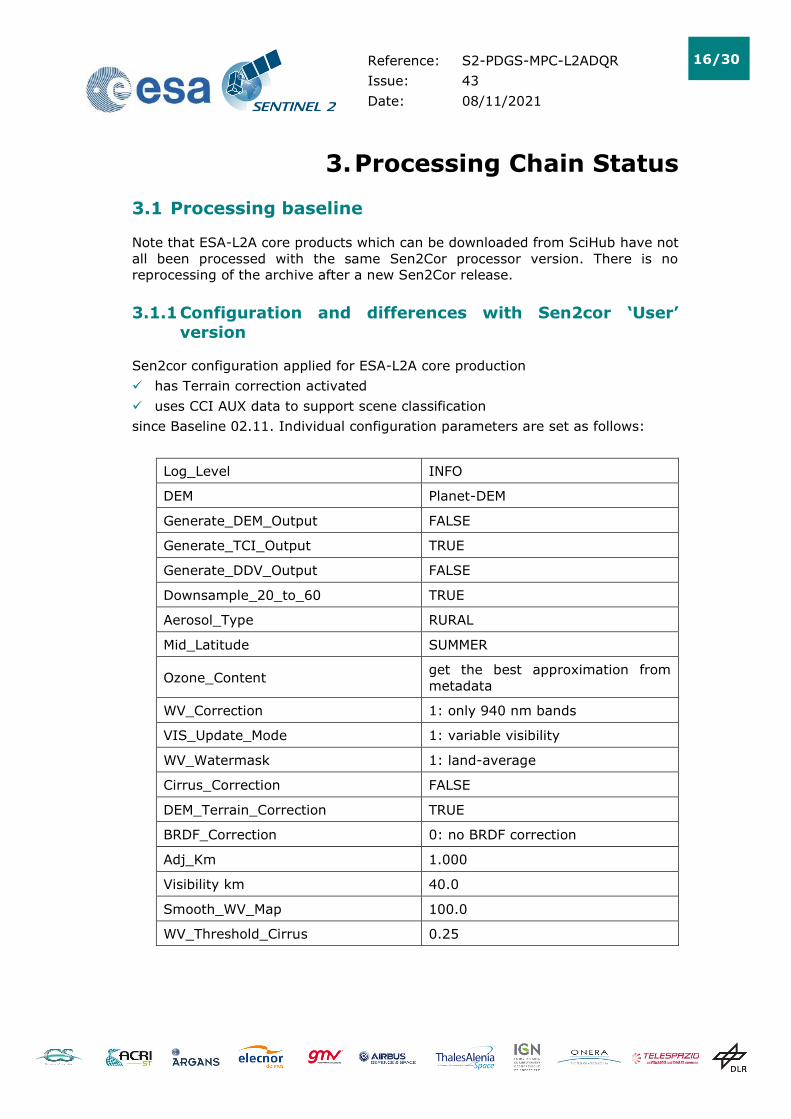
3.1.1 Configuration and differences with Sen2cor ‘User’
version
Sen2cor configuration applied for ESA-L2A core production
✓ has Terrain correction activated
✓ uses CCI AUX data to support scene classification
since Baseline 02.11. Individual configuration parameters are set as follows:
Log_Level INFO
DEM Planet-DEM
Generate_DEM_Output FALSE
Generate_TCI_Output TRUE
Generate_DDV_Output FALSE
Downsample_20_to_60 TRUE
Aerosol_Type RURAL
Mid_Latitude SUMMER
Ozone_Content get the best approximation from
metadata
WV_Correction 1: only 940 nm bands
VIS_Update_Mode 1: variable visibility
WV_Watermask 1: land-average
Cirrus_Correction FALSE
DEM_Terrain_Correction TRUE
BRDF_Correction 0: no BRDF correction
Adj_Km 1.000
Visibility km 40.0
Smooth_WV_Map 100.0
WV_Threshold_Cirrus 0.25

Reference: S2-PDGS-MPC-L2ADQR
Issue: 43
Date: 08/11/2021
17/30
Some differences can be found between L2A products generated by users with
current Sen2cor version and the ESA-L2A core products from the 02.11 baseline:
✓ The Digital Elevation Model (DEM) is different, which can impact terrain
correction results (users have access to SRTM-DEM whereas ESA-L2A core
production uses Planet-DEM),
✓ The JP2000 compression library is different, which leads to a slightly different
size of the products and a different compression noise,
✓ Anomaly #4 is corrected in baseline 02.11, while this anomaly will be corrected
in a future version of the toolbox version.
3.1.2 New processing baseline 03.01
On June 30th 2021, a new processing baseline 03.01 has been introduced. The
checksum algorithm has been changed from md5 to SHA3.
3.1.3 Major evolution: processing baseline 04.00
Processing Baseline 04.00 will be activated on October 26, 2021. This major
evolution will lead to a modification of the L2A products format.
The new L2A products will inherit the modifications of the L1C processing baseline
04.00, described in the L1C Data Quality Report, in particular the provision of
quality masks in raster (JP2) format.
1. Provision of negative radiometric values (implementing an offset): The
dynamic range will be shifted by a band-dependent constant:
BOA_ADD_OFFSET. This offset will allow encoding negative surface
reflectances that may occur over very dark surfaces. From the user’s point
of view, the L2A Bottom of Atmosphere (BOA) reflectance (L2A_BOA) shall
be retrieved from the output radiometry as follows:
• Digital Number DN=0 remains the “NO_DATA” value
• For a given DN in [1; 1;2^15-1], the L2A BOA reflectance value will
be: L2A_BOAi = (L2A_DNi + BOA_ADD_OFFSETi) /
QUANTIFICATION_VALUEi
The radiometric offset value will be reported in a new field in the
General_Info/Product_Image_Characteristics section of the Datastrip and User
Product Metadata. It will be initially set to -1000 Digital counts for all bands.
It is also noted that the percentage of negative surface reflectance pixels per
band will be also reported in the L2A_QUALITY report in the QI_DATA folder of
the tile.
2. Provision of Band 01 at 20 m spatial resolution: Band 01 will be added with
20m resolution (in the 20 m resolution image folder) in addition to the
native 60 m resolution.
3. Addition of Level-2A Quality Indicators (new fields in the tile metadata
and additional xml L2A_QI_report in the QI_DATA folder): New Quality
Indicators CLOUDY_PIXEL_OVER_LAND_PERCENTAGE,
AOT_RETRIEVAL_METHOD, GRANULE_MEAN_AOT, GRANULE_MEAN_WV,

Reference: S2-PDGS-MPC-L2ADQR
Issue: 43
Date: 08/11/2021
18/30
OZONE_SOURCE, and OZONE_VALUE, will be added in the Level-2A tile
metadata in the Quality_Indicators_Info section. In addition, Quality
Indicators providing information on the Scene Classification, Atmospheric
Correction and Auxiliary Data will be reported in a new L2A_QUALITY.xml
report in the QI_DATA folder of the tile.
4. Aerosol correction using CAMS auxiliary data: The Level-2A processor will
use the CAMS Total Aerosol Optical Depth (AOD) at 550nm when Dark
Dense Vegetation (DDV) pixels are missing in the image. This improvement
will mitigate the chess-board effect that is sometimes visible between tiles.
5. Improvement of the bright target classification over coastal areas: The
cloud detection over coastal areas of bright targets (e.g. buildings and
bright sand) is improved to mitigate against false detections.
6. Improvement of the topographic and cast shadows: The class “dark
features and shadows” (SCL = 2) is replaced by “topographic and cast
shadows” (keeping code SCL = 2), while dark features pixels will be re-
assigned to the “unclassified” class (SCL = 7).
7. Improvement of clouds and cloud shadows detection: Thanks to the use of
the Sentinel-2 MSI parallax properties between bands B08 (resampled at
20m) and B8A (20m native resolution), the accuracy of the cloud detection
algorithm has been improved, reducing the false clouds detection of bright
targets - especially in urban areas - as well as reducing the snow false
detection in high altitude clouds. Also, the cloud shadow algorithm benefits
from using the parallax properties, by retrieving an estimate of the cloud
top-height to improve the localization of clouds shadows on ground.
8. Addition of the DOI (Digital Object Identifier) in the Level-2A metadata:
Similarly to Level-1C product, a DOI will be reported in a new field in the
General_Info section of the Datastrip and User Product Metadata.

Reference: S2-PDGS-MPC-L2ADQR
Issue: 43
Date: 08/11/2021
19/30
3.2 Status of Processing Baselines and Known Processing Anomalies
The following table provides the status of known L2A processing anomalies. Note that some L1C anomalies directly affect the quality
of the L2A products.
Table 3-1: Anomaly and processing baseline summary.
Anomaly ID
Baseline number 02.07 02.08 02.09 02.10 02.11
02.12,
02.13,
02.14
Deployment date 26/03/2018 23/05/2018 08/09/2018 06/11/2018 21/112018 06/05/2019
Anomaly title
55 Wrong tile ID
metadata
All products until
05/04/2018
56 Incorrect No Data
mask
Limited occurrences for pixels near the edge of the swath
(Until 19/09/2018)
59 Encoding of Quality
Bands Until 19/09/2018
60 Terrain Correction
over clouds A few products
61 Naming of quality
mask files A few products
62 Cloud Probability
mask Some products
63 Products processed
without DEM
Until
09/05/19

Reference: S2-PDGS-MPC-L2ADQR
Issue: 43
Date: 08/11/2021
20/30
Anomaly ID
Baseline number 02.07 02.08 02.09 02.10 02.11
02.12,
02.13,
02.14
Deployment date 26/03/2018 23/05/2018 08/09/2018 06/11/2018 21/112018 06/05/2019
Anomaly title
65 Incorrect SCL at high Sun Zenith
Angle High SZA

Reference: S2-PDGS-MPC-L2ADQR
Issue: 43
Date: 08/11/2021
21/30
4. Product Anomalies
4.1 Introduction
This chapter describes anomalies observed on the L2A production.
Note that some L1C anomalies affect also the quality of L2A products. Whenever
this is the case, any reprocessing to correct an anomaly will include level 2
products.
An on-line version of the anomaly register is available on-line at this url:
https://sentinels.copernicus.eu/web/sentinel/user-guides/sentinel-2-
msi/sentinel-2-anomalies/home/
This register includes all anomalies (L1C and L2A). Note that in previous issues
of the L2A DQR (prior to November 2019), L2A anomalies were numbered
separately.
Two recent L1C anomalies are also affecting L2A products:
• Anomaly 70: products with zero solar irradiance
• Strong geolocation error on orbit S2A orbits 31188 and 32722
More details about these anomalies can be found in the L1C Data Quality Report.
4.2 Incorrect Tile ID metadata (#55)
This minor anomaly affects the L1C_TILE_ID field of the tile metadata. The
processing baseline of the source L1C product is incorrectly reported as 02.07
instead of 02.06. The issue has been corrected on 05/04/2018.
4.3 Incorrect No Data mask (#56)
In the Scene Classification mask (SCL) some pixels near the edge of the swath
may be incorrectly flagged as “water” instead of “No Data”. The issue has been
fixed on 19/09/2018.

Reference: S2-PDGS-MPC-L2ADQR
Issue: 43
Date: 08/11/2021
22/30
Figure 4-1: Incorrect No Data Mask (anomaly #2). Left: pixels incorrectly
flagged as water (blue) near the swath edge. Right: same image after
correction.
4.4 Encoding of Quality Bands (#59)
In products from processing baselines 02.07 and 02.08, the quality bands are
coded over 16 bits instead of 8 bits as specified in the Product Definition Document
(PDD). This minor anomaly affects the following bands: SCL, CLD, SNW, PVI, TCI.
The correction has been deployed on 19/09/2018.
4.5 Terrain correction over clouds (#60)
This anomaly creates spurious topographic correction over cloudy pixels. Please
note the impact of this anomaly is limited to the visual appearance of the images.
Cloudy pixels are flagged in the scene classification mask and shall not be used
for quantitative remote sensing.
Terrain correction has been de-activated for cloudy pixels with processing baseline
02.10.
Figure 4-2: Band B04, Tile 32TLP from orbit S2B 7098. Left: L1C image;
Right: L2A image. The topography seems to be visible through the opaque
clouds. (Anomaly #4)
4.6 Naming of quality masks files (#61)
This anomaly affects the naming of the quality mask files in the QI_DATA folder.
The “long name” convention (e.g. S2A_OPER_MSK…) is used instead of the “short
name” convention (MSK_DEFECT…). This anomaly has been found on L2A products
of orbit S2B 8458 only. It is currently under investigation.

Reference: S2-PDGS-MPC-L2ADQR
Issue: 43
Date: 08/11/2021
23/30
4.7 Incorrect cloud probability near the boundary of the
swath (#62)
This issue affects the computation of the cloud probability (CLDPRB mask) near
the boundary of the swath. The mask extends outside the area of valid data. Users
are advised to disregard the cloud probability values for pixels which are flagged
as No Data in the spectral band images. This issue is fixed with PB 03.00.
Figure 4-3: incorrect values of the cloud probability mask (CLDPRB) near
the boundary of the swath. Left: L2A true colour image, Right: CLDPRB
mask.
4.8 Products processed without DEM (#63)
Due to a ground segment anomaly, some L2A products with sensing time between
00:46:48 UTC on 6 May and 10:06:28 UTC on 9 May have been processed without
DEM and ESA CCI data package.
The main impacts on product quality are as follows:
✓ The quality of the cloud screening and scene classification is reduced (lower
accuracy for water detection and cloud discrimination)
✓ Surface reflectances are less accurate due to a processing with a default
altitude
✓ Terrain correction is not applied. This effect is clearly visible in the next figure.
Figure 4-4: Left: affected product processed without DEM. Right:
corrected product processed with DEM (anomaly #7).

Reference: S2-PDGS-MPC-L2ADQR
Issue: 43
Date: 08/11/2021
24/30
The affected products have been replaced by reprocessed products.
4.9 Scene classification at high Sun-Zenith Angle (#65)
This anomaly affects products acquired at high Sun-Zenith Angle (SZA). Due to a
processing anomaly, the scene classification contains pixels incorrectly classified
as “Dark Features”. A fix has been identified and will be deployed in the next
processing baseline.
Figure 4-5: Incorrect Scene Classification for products at high Sun-
Zenith Angle Left: True Colour Image (Snow and clouds). Right: Scene
Classification. Black pixels are incorrectly classified as “Dark Features”. Ref: (S2B_MSIL2A_20191105T022549_N0213_R017_T46DEH_20191105T064747, Australian Antarctic Territory).
4.10 Halo near image boundaries (#66)
A light halo can sometimes be observed along image boundaries, either edge of
the swath or end of data-strips. The issue is fixed with PB 03.00.

Reference: S2-PDGS-MPC-L2ADQR
Issue: 43
Date: 08/11/2021
25/30
Figure 4-6: Halo near a swath edge (left) or data-strip end (right).
Anomaly #66.
5. Product features
5.1 Scene classification
The current scene classification algorithm has some known limitations:
✓ Over-detection of clouds over bright targets,
✓ Under-detection of semi-transparent clouds or cloud edges,
✓ Cloud pixels miss-classified as snow (shaded parts of the clouds),
✓ Dark areas miss-classified as cloud shadows. This can occur in particular when
bright objects are incorrectly classified as clouds,
✓ Topographic shadows may be miss-classified as water,
✓ Open fires can be miss-classified as cirrus.
✓ Degraded pixels from data loss at L1C are currently not supported by the L2A
processor. Users are advised to check the TECQUA mask to identify affected
pixels.
As mentioned in section 3.1, these problems have been significantly reduced
starting with baseline 02.09.
Starting with baseline 02.10, terrain correction is no longer applied for pixels
identified as cloudy. This can lead to visual artefacts at the edges of semi-
transparent clouds, see figure below.

Reference: S2-PDGS-MPC-L2ADQR
Issue: 43
Date: 08/11/2021
26/30
Figure 5-1: Visual artefacts at the edges of semi-transparent clouds.
Another known issue concerns the occurrence of blocky patterns on the Scene
Classification mask, as illustrated in the figure below. This issue is due to the
coarser resolution of the CCI auxiliary data used to improve the scene
classification. In some cases (as on Figure 5-2 – Left) it can lead to a local over-
detection of clouds.
Figure 5-2: Blocky patterns on the scene classification layer (SCL). Left:
near the coastline. Right: near city boundaries.

Reference: S2-PDGS-MPC-L2ADQR
Issue: 43
Date: 08/11/2021
27/30
5.2 Overlap between tiles
The L2A products are processed at tile level and some differences can occur in the
overlap area between adjacent tiles:
✓ The scene classification may be different for a few pixels
✓ The AOD and surface reflectances are generally different, although the
difference should be small.
5.3 Terrain over-correction on shaded areas
Due to inaccuracies of the Digital Elevation Model, a strong terrain correction may
be applied in totally or partially shaded areas. This results in a bluish colour in
colour composite and inaccuracy in the surface reflectance.
Figure 5-3: Terrain over-correction on shaded areas. Left: Level 1C true
colour image, right: L2A true colour image.
5.4 Maximal Sun-Zenith Angle
Users are advised that products with a Sun-Zenith Angle (SZA) higher than 70°
are processed with a clipped SZA value of 70°. This results in an under-correction
of the atmospheric signal, which results in a bluish colour on the L2A products.
The surface reflectance of products with SZA > 70° should not be used for
quantitative/scientific analysis. The value of the SZA can be obtained from the
GRANULE metadata (MTD_TL.xml, field Mean_Sun_Angle/ZENITH_ANGLE). In the
coming period, a warning message will also be introduced in the
GENERAL_QUALITY report to identify these products.

Reference: S2-PDGS-MPC-L2ADQR
Issue: 43
Date: 08/11/2021
28/30
Figure 5-4: L2A True Colour Image of tile 30VVH;
left: 10/10/2018, SZA = 62°; right: 24/12/208, SZA = 80°. The
radiometric quality for surface reflectance is not ensured for SZA > 70°.
5.5 Missing packets
In the current version of L2A products, corrupted pixels affected by missing or
degraded instrument source packets are not reported in the Scene Classification
Layer. Users are advised to check the TECQUA mask to identify affected areas
where the SCL is not reliable.
Figure 5-5: Left: TCI image of a product affected by missing packets.
Right: Scene Classification Layer.
Note that missing packets in atmospheric correction input bands (B10 and B09)
can affect surface reflectance of other spectral bands.

Reference: S2-PDGS-MPC-L2ADQR
Issue: 43
Date: 08/11/2021
29/30
5.6 Discontinuities visible in Terrain Correction on very
flat areas
Figure 5-6: Contour-like line features (red box – right) visible in L2A
products over Antarctica
This apparent contouring in L2A products arises on images over very flat area with
high Sun-Zenith angles. This artifact comes from the impact of the vertical
quantization of the Digital Elevation Map (1 metre steps in the current production)
on topographic correction.
End of Document

Reference: S2-PDGS-MPC-L2ADQR
Issue: 43
Date: 08/11/2021
30/30