s3.amazonaws.com...into their digital multi-touch attribution framework to provide cross-channel...
TRANSCRIPT

AND
RESEARCH PROVIDED BY
Overview, Key Topics and a Comparison of Leading Providers
Television Attribution
FEBRUARY 2019

The Industry Welcomes Television Attribution
1
Attribution—the science of allocating credit to exposures for driving sales or other outcomes—is the most scintillating yet complicated and elusive topic facing the television industry. It is exciting and promising, but also confusing. There are a vast number of analytic providers and a wide variety of approaches. There are many disparate television viewing datasets that fuel the analyses. And, depending on the provider, there are a host of additional variables that may or may not be brought in to fully explain television’s impact.
Let’s Back Up. Where Does Television Attribution Fit and Where Did It Come From?
Television attribution is the latest iteration of a relatively new data science discipline that started in digital. Digital advertisers enjoyed the ability to see the impact of digital campaign touchpoints on online conversions or even offline behaviors like sales in real-time (or daily, or at least weekly). Early, simplistic digital attribution approaches evolved with the inclusion of very granular digital consumer exposure data incorporating the full range of digital touchpoints to provide “Multi-Touch Attribution (MTA).” This yielded a more accurate measure of the role of all digital campaign elements, not just the “last touch.”
Television has not had the kind of data to support such granular analysis. But with Smart TV and set top box data, and specialized analysts, television can now be measured with highly granular household or device level data, just like digital. This has given rise to television attribution, which, like digital, specifically identifies the contribution of TV exposures on behavioral outcomes. Given the similarity in approaches, some providers can integrate TV attribution into their digital Multi-Touch Attribution framework to provide Cross-Channel Attribution.
Television attribution provides a view into what’s working— particular dayparts, networks, distribution platforms, programs, audiences and creative executions. It can also provide a view into the ROI of television investments, assuming the analysis includes other critical elements at play during the television campaign like other media and marketing events.
At the moment, however, there are a number of different approaches to studying the impact of television, and there are many providers. The recent evolution of digital attribution from “last-touch” to Multi-Touch has provided
Successfully navigating these issues is essential because the promise of TV attribution is enormous: the ability to read the impact of television advertising at a very fine level and a pace quick enough to enable the tactical optimization of campaigns, mid-flight. The ultimate benefit, though, is moving beyond simply measuring ROIto actively managing ROI.
a number of critical lessons that must be applied to speed the evolution of TV Attribution. One important example is that both methods are exceedingly short term, which worries television stakeholders, who fear television’s upper-funnel, branding benefits will be overlooked in the drive to optimize short-term effects.
Long-term, upper-funnel effects have traditionally been the domain of Marketing Mix Models (MMM), a related modeling discipline. MMM works at the market level, rather than the individual HH or device level, and at the week level, rather than the individual exposure level. This less granular approach has not proven as useful for tactical optimization as attribution. But their completeness, generally incorporating all media, marketing and marketplace drivers, are why they have been used for ROI measurement and strategic optimization for decades.
Most of the major television researchers have experimented with attribution projects, and people are entirely sold on the promise, but their experience has been uneven, a bit fuzzy and frustrating.
CIMM and the 4A’s Media Measurement Taskforce commis-sioned this study of television attribution and key providers to shed light on current practices, demystify the science behind the modeling approaches and analytics, delve into strengths and weaknesses of data supporting the models, and offer a means of comparing the major providers.
This report is a follow-up to a report released in 2018 that compared the offerings of 26 companies in digital, cross-channel, multi-touch and television attribution and marketing mix modeling.

RESEARCH PROVIDED BY 2
Though industry leaders expressed optimism and enthusiasm for attribution, they also had several concerns. These issues fell into five buckets:
1. Fundamentally, How TV is Measured • How to ensure all forms of television are measured • How to evaluate television fully (i.e., concern that television attribution has been too short-term, direct-response- focused; failing to capture television’s latency and branding effects) • How to ensure complete attribution of television (i.e., fear of under-counting TV, it is done the same way as early digital attribution [e.g., last click])
2. The State of Provider Knowledge • How to bridge the gap between researchers and providers who lack sufficient knowledge of television and the industry’s language and practice • How to quell overselling of attribution studies: positioning tactical campaign tools as something bigger and more strategic • How to encourage vendors to be truthful about what they know for certain and what they do not
3. Data Issues • How to disentangle data integration issues and overcome the challenge of making datasets represent the world • How to succeed with only sufficient data, not optimal data • How to know when data matches are good enough
4. Implementation • How to get the right answers in standardized data delivery platforms (dashboards) versus custom analyses • How to easily implement customized solutions
5. Applications • How to know which answer is right when results do not align with past learning • How to understand what factors drive other factors • How to accumulate learning across studies rather than learning new things each time a study is conducted
This list of issues tells us quite a bit about the state of the art right now. There are questions regarding data, measurement techniques and applying learning to day-to-day practice. That’s what propelled CIMM and the 4A’s Media Measurement Taskforce to request this deep dive.
The bullet points, above, are a helpful outline of the major issues in TV attribution. They provide a guide to where you need to ask questions. Because this practice is still developing, it will be important for you to dig deeply into those issues that are most relevant to your business and your objectives. Ask questions and request sample input data until you are satisfied.
For example, there are many different television measurement techniques in use and sources of viewing data available. You need to be sure that the data being used for your study includes all of the platforms that are important to you. And that the biases in the data don’t yield a materially distorted view of your audience.
You also need to be sure that the approaches the providers use for isolating the impact of television are relevant to your business. Some techniques involve statistical models like regression; others involve test/control studies. Both approaches are valid depending on your objectives. But there are different factors that may influence results. In the regression models, are all the drivers of marketplace outcomes included in the study? All the marketing tactics, external influences and non-television media included? In the test/control approach, are the control groups set up in a way that all other factors are equally represented? Is the only thing that’s different the presence of television advertising in the test group?
Ask questions. Trust. But verify.
And don’t be shy about sharing your experience. The industry needs to know how the practice is evolving and whether any of these key concerns are rectified. A continuing dialogue between you and your providers will improve your success rates, and sharing something with the industry will help all of us get there together faster.
Taking the Industry’s Temperature

2. EVALUATING DATA AND MODELING SPECIFICS FOR YOUR APPLICATIONS
WHAT IS THE ISSUE?
Preferred TV Data Sources, Granularity and Scale
Model Completeness: All Media and Marketing Elements in the Plan are in the Model
WHAT DOES IT MEAN?
Different modelers work with different TV audience data: Nielsen Ratings, Set-Top Box Data From MVPDs, Automatic Content Recognition (ACR) data from Smart TVs or mobile apps, ad occurrence data from tracking services. Some providers extend the scale of their TV data sources by integrating multiple sources or ascribing viewership through lookalike modeling.
Some models only include television; others include some or all of the other media in the campaign. Some also include other marketing components (like price, promotion, direct mail) and non-marketing drivers (like weather or economic factors).
WHY IS IT IMPORTANT?
Each TV data set has strengths and weaknesses. No data set is perfect in terms of demographic or geographic representation, which is why you must understand how the provider combines multiple sources.
Inaccurate measurement of response can occur when models do not account for all of the drivers of outcome. The over-attribution will favor the media and marketing elements in the model, and the elements that ran but were not in the model will be disadvantaged.
What Matters in Television Attribution?
3
1. FITTING THE OVERALL MODEL APPROACH TO YOUR BUSINESS/CAMPAIGN NEEDS
WHAT IS THE ISSUE?
Primary Need: Campaign ROI or Tactical Optimization
Type of TV Analyzedin the Model
Modelers Use a Variety of Data Sources that Measure Multiple Outcomes
WHAT DOES IT MEAN?
Attribution models are used to measure the ROI of a campaign and its components and/or to maximize campaign performance by optimizing the spend allocated to each component.
Television and video are delivered on many platforms, each with their own data sources. Not all attribution models work with all TV/video data: Linear, DVR, VOD, Addressable, Premium TV on Smart TVs or computer/mobile, short video on computer/mobile or Smart TV.
Data streams that reflect the marketplace outcome you want to measure/optimize across all the media and marketing components must be in the model. Typically, online/offline sales, online/offline traffic, brand metrics or TV tune-in.
WHY IS IT IMPORTANT?
Some models can do both; some can only do one. Model completeness is important to accurate ROI measure-ment. Speed and granularity are important to tactical optimization.
Without accurately and completely capturing the components of the television plan, the contribution of the unmeasured platforms will be off.
There needs to be close alignment between the model’s outcome variable and your business objectives if the model is going to be relevant.

WHAT CAN GO WRONG?
Bias can be introduced when sources are stitched together, such as STB combined with Smart TV data. The direction of the bias and the extensiveness are unknown.
TV contribution may be inflated.
WHAT ARE BEST PRACTICES?
Make sure the data being used will serve your purposes in terms of accuracy, representivity and granularity. Understand whether the data is 100% measured, the matched combination of multiple measured sources or modeled to some degree. Review the data for representivity and material biases.
When combining STB and Smart TV data, beyond the obvious need to de-duplicate them, it is best to leverage their respective strengths and weaknesses and use them in a comple-mentary way. For example, Smart TV data provides a more geographically representative sample than STB. But STB data generally provides a more complete measure of each HH’s viewing. STB can’t tell when the TV is off, but the STB has been left on. It can’t detect OTA or OTT viewing. Smart TV captures all of these. There are a host of technical and resource challenges to doing this. In addition, the ability to manipulate these data sets is controlled by a variety of licensing agreements, some of which may prohibit such data combinations.
The model must reflect the incremental contribution of TV on top of everything else that might lift the KPI. Strive to include all campaign media, marketing and marketplace elements in the model. If the goal is tactical optimization, include all of the elements that are run in parallel with the elements you wish to optimize. Often, the most important factor to include is the baseline, or natural purchase propensity (i.e., the purchases that would have occurred in the absence of advertising). And the most difficult is the value of the brand, which can amplify the performance of lower-funnel media, but is frequently not recognized for that contribution.
RESEARCH PROVIDED BY 4
WHAT CAN GO WRONG?
Campaign response “lift” studies misrepresent ROI. They are not ROI studies. Lift studies are incomplete measures that do not properly decompose all the elements of the mix and the marketplace conditions.
The contribution of key platforms will be unmeasured if the modeler does not work with that type of television data.
The thing you most want to measure—sales, traffic, brand attitudes or TV program tune-in—may not be available or part of the provider specialization. They require different data for measurement.
WHAT ARE BEST PRACTICES?
Any model that promises an accurate measure of ROI must include all of the major factors influencing sales, including the baseline of consumer habits that drive sales in the absence of marketing. Moreover, the model of advertising must reflect the known dynamics of advertising, including diminishing returns, residual effects over time, interactions and halos.
Tactical optimizations most often address media placement and creative performance, but there is added value in also attending to the relative performance of different audience segments that are being targeted.
Know what platforms your campaign is being delivered on and be clear the provider has a way of including them in the model.
Ensure the model’s outcome variable matches your business objectives. If your actual KPI is not available, there should be some accepted relationship between the model’s outcome variable and your KPI.

What Matters in Television Attribution?
5
2. EVALUATING DATA AND MODELING SPECIFICS FOR YOUR APPLICATIONS (CONTINUED)
WHAT IS THE ISSUE?
Method for Matching Data
Method for Determining Attribution: Statistical Models, Rules-Based Algorithms or Experimental Design
WHAT DOES IT MEAN?
Data matching is central to attribution modeling. Device- or household- level data for each model component is drawn from its own source. All ofthese data streams must be joined at the device or household level through an identity-based data matching technique.
Once all of the data is sourced and put together, different approaches are used to read the contributions of TV and other campaign components. Statistical models use proven mathematical methods to infer the contribution of TV. Rules-based algorithms allocate the contribution of TV based on the arbitrary rules about the order of exposures. Experimental design strives to isolate the effect of TV in a test/control comparison. These approaches have different capabilities and timing.
Experimental designs can produce results in near real-time. But they can only measure one thing at a time unless they become very elaborate. Models read the contribution of all factors at once. They capture interactions and properly sort-out the contribution of each factor.
WHY IS IT IMPORTANT?
Data matching is imperfect. Less than perfect match rates among multiple data sets result in increasingly smaller data sets. The matching process may also introduce biases that transform repre-sentative data into unrepresentative data.
Experimental design (test/control or randomized controlled tests) are dependent on the control group construction. The control group must accurately reflect what would have happened in the absence of TV advertising, all other things being equal. In statistical models, a baseline and covariates serve that purpose by overtly representing everything else that can affect the marketplace outcome. Models can also more directly reflect the ways in which advertising works: residual effects over time, halo, interactions and branding effects.
3. PROCESS HYGIENE
WHAT IS THE ISSUE?
Quality Control Processes
Model Validation
Managing Consumer Privacy
WHAT DOES IT MEAN?
Data for attribution models is drawn from sources not originally designed for this purpose. Typically, disparate data sources are joined together at massive scale.
How does the modeler and the end user know the model is right?
Attribution models deal with individual device- and household-level data, often joined together using PII.
WHY IS IT IMPORTANT?
The accuracy of attribution is dependent on the accuracy and representivity of the data inputs.
Model validation provides an initial answer to that question. The model’s in-market performance is the ultimate measure of its validity.
Protecting consumer privacy is an essential responsibility of the modeler and their sub-contractors.

RESEARCH PROVIDED BY 6
WHAT CAN GO WRONG?
Misleading model outputs may result.
Without a complete representation of all the ways advertising contributes to the outcome, over time, the contribu-tion of TV is likely to be understated.
Unless the approach includes diminish-ing returns to frequency, predictions of increased or decreased spending levels will be wrong.
Attribution models are inherently short-term. Advertising also builds brands that continue to have long-term contributions that should not be overlooked.
WHAT ARE BEST PRACTICES?
Review the matched data to check for representivity and material biases.
Both approaches must reflect the way we know advertising works: diminishing returns, residual effects over time (adstock), halo and interaction effects.
In the case of a model, be sure it fits well to a hold-out sample.
In the case of experimental design, be sure the control group is identical to the exposed group in every way, except for TV exposure. For example, pre-exposure propensity to purchase the advertised brand must be identical. Exposure to the advertising in other media and competitive advertising must be identical. Exposure to other marketing activity such a price, promotion, distribution, direct marketing and customer relationship marketing must be identical. Exposure to marketplace factors known to drive outcomes such as weather or economic factors must be identical. And be certain that the unexposed group is totally unexposed, which can be difficult for a high-reach campaign.
WHAT CAN GO WRONG?
Inappropriate TV data will result in an underestimate of the contribution of TV.
Model results that do not conform to anything the brand has ever seen may result. And questions will abound impacting uptake and satisfaction with the model. Public disclosure of PII can result in legal and PR issues.
WHAT ARE BEST PRACTICES?
Extensive, careful quality control, including screening for outliers and missing data, is essential.
Know the plan to validate the model results. Goodness of fit against a holdout sample is preferred.
The policies and practices of the safe harbor companies shield modeling providers from liability.
7
Final Word – Best Practices in Attribution
Sequent Partners has said this before, and we believe it warrants restatement: We can’t be enamored by glossy models and cool applications. Regardless of the dashboard or the API, fundamentals of how advertising and television work must be addressed in the models. Modeling approach must build on what the industry knows about how advertising works and include halos, interactions and baselines in attribution. And creative matters! Modeling individual creative and media types will lead to an understanding of how messages and creative treatments work individually and synergistically. We should not underestimate the value of test-and-learn activities. Conducting meta analyses for benchmarks and collective learning helps evolve our thinking and understanding.
And do not forget the brand. Brand metrics and longer-term response are important. Television is an upper-funnel, awareness-raising medium, as well as a lower-funnel, immediate sales mechanism. It is important that both attributes of television are well-represented in the model. And finally, strive to bridge digital and traditional media operations. Bring in as much campaign data as possible. Assessing the value of any single media element in isolation will be misleading. When we attend to each of these concerns, television attribution will become to tool everyone envisions.
Enjoy the provider guide!
Jim & Alice

RESEARCH PROVIDED BY 8
Study Participants
Fifteen leading television attribution providers who incorporate data from Smart TVs and set-top boxes were analyzed and compared.
How This Study was Conducted
Sequent Partners sent a request for information to leading television attribution specialists who were identified by CIMM and the 4A’s Media Measurement Taskforce. The use of device- or household-level TV exposure data was a qualifier for inclusion in this study, so providers of television attribu-tion studies who do not take this approach were not includ-ed. We conducted interviews with each provider to gain clarity and dig deeper into their responses. We submitted a draft to each provider so they could refine and clarify their entry in the guide. We also interviewed TV attribution users to gain perspective on the relative importance of various product characteristics and data sources.
It is important to note that despite multiple interactions with each provider, ultimately the information in this guide reflects what we were told by each of them. That said, there were a few opportunities for Sequent Partners toapply some judgement.
One example is Adstock, a term of art that denotes the measurement of advertising’s lingering, but declining, effect over time. This was often confused with the attribution window (i.e., the timeframe over which ad exposures are considered for potential impact). Accurate measurementof advertising’s contribution requires that the rate of decline in advertising’s impact, as time passes before the next purchase decision, is part of the measurement approach.
The most important judgment made in this guide is whether or not the methodology can be relied upon to produce reasonable ROI estimates. There are three critical qualifiers
for this capability. First, sales must be the KPI. ROI is a financial metric (i.e., the profit returned for the advertising dollars invested). While other KPI’s are important and may even be the campaign objective, they do not reveal the incremental profit generated.
Second, even sales-based attribution models most often yield estimates of incremental revenue, not profit. This can be remedied, roughly, by applying an estimated profit margin. Without this added perspective, it is not possible to determine if the TV investment is profitable or not.
Third, when the model is incomplete, it is highly likely that sales lifts may be misattributed to TV. A complete model includes the baseline and all media, marketing and market-place factors that lift sales over that baseline. To illustrate, consider a TV campaign run in support of a year-end sale. The marketer has reduced prices, employed extensive merchandising and direct marketing, and invested heavily in digital display and paid search. If the contributions of all of those activities are not factored out, the total sales lift will be erroneously attributed to TV. A perfect control group addresses these concerns. But requires that the control group experiences the same level of exposure to all of the “non-TV sales drivers” as the test group. Test and control must be identical, except for the presence of TV exposures. You will see later in this document that ensuring accurate control groups is one of the key issues in attribution studies that rely on experimental design, and one that needs significant attention and monitoring.

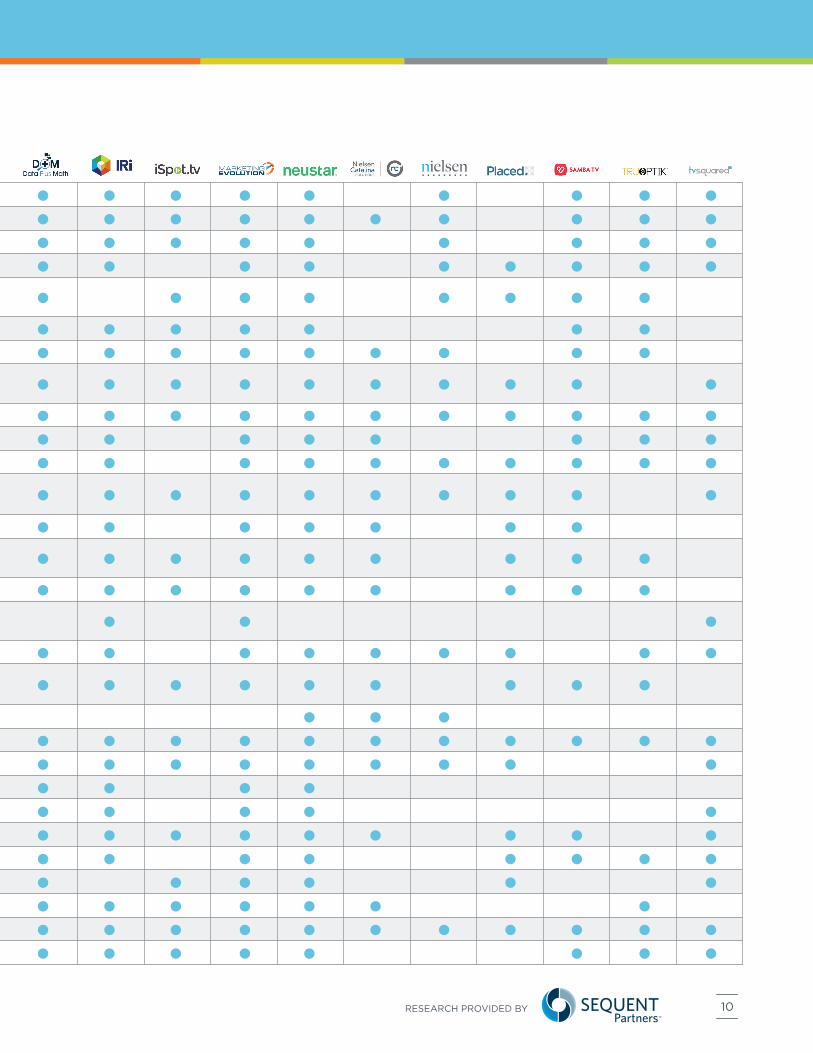
TV Providers At-a-GlanceDependent (Outcome) Variable: Online Sales
Dependent (Outcome) Variable: Offline Sales
Dependent (Outcome) Variable: Online Traffic
Dependent (Outcome) Variable: Offline Traffic
Dependent (Outcome) Variable: Brand Metrics (e.g., Awareness, Consideration, Purchase Intent)
Dependent (Outcome) Variable: TV Tune-In
Primary Application: Measure the ROI of television and its components
Primary Application: Provide tactical optimizations(creative or placement)
Forms of TV Analyzed: Linear TV
Forms of TV Analyzed: VOD
Forms of TV Analyzed: Addressable TV
Forms of TV Analyzed: Short digital video viewed on a computer or mobile device
Forms of TV Analyzed: Short digital video viewed on a connected TV
Forms of TV Analyzed: Premium TV/Video viewed on a computer or mobile device
Forms of TV Analyzed: Premium TV/Video viewed on a connected TV
Preferred TV Data Sources: Audio/Video Content Recognition on Mobile Devices
Preferred TV Data Sources: Set Top Box
Preferred TV Data Sources: Audio/Video Content Recognition on Smart TV
Preferred TV Data Sources: Nielsen Panel Data
Preferred TV Data Sources: Ad Occurrences
Scaling Data Through Data Integration or lookalike models
Other Marketing Factors Included?
Other Non-Marketing Factors Included (e.g., weather)?
Other Media Included?
Diminishing Returns Included In Analysis?
Adstock Included In Analysis?
Halo Included In Analysis?
Baseline Included In Analysis?
Interactions Included In Analysis?
9
RESEARCH PROVIDED BY 10

11
• A detailed, comparative guide to the methods and services of leading TV Attribution providers
• A glossary of relevant attribution terminology— adapted and expanded from The CIMM/4A’S Attribution Provider Guide (glossary on page 43)
• Provider insights are delineated in 15 key areas: • Use cases – linear, digital video running on Connected TV or addressable TV or other platforms delivered via digital
• Key Performance Indices (KPIs)
• Source of TV data
• Non-television media included
• Additional marketing and non-marketing factors included
• Data integration method
• Quality control
• Degree of granularity
• Timing
• Attribution method: statistical models, rules- based algorithms or experimental design and the challenge of control groups
• Advertising modeling
• Incrementality/baseline
• Privacy management
• Model validation
What You Will See in This Guide

PROVIDER INSIGHTS
RESEARCH PROVIDED BY 12

13
ONLINE SALES Yes. Via client CRM and credit card data.
OFFLINE SALES Yes. Sourced from client CRM and frequent shopper data providers—and with merchant/advertiser consent.
ONLINE TRAFFIC Yes. Cookie matched to HHs via SafeHavens.
OFFLINE TRAFFIC Yes. Mobile location data from various sources, depending on client needs.
BRAND METRICS (E.G.,, AWARENESS, CONSIDERATION, PURCHASE INTENT) Yes. Sourced through surveys.
TV TUNE-IN Yes. Via their own STB data from 15+ million TV households.
DEPENDENT (OUTCOME) VARIABLES:
LINEAR TV Yes. Local and national.
VOD No. On 2019 roadmap.
ADDRESSABLE TV Yes. Across the full addressable footprint nationally.
SHORT DIGITAL VIDEO VIEWED ON A COMPUTER OR MOBILE DEVICE Yes, if provided by the client.
SHORT DIGITAL VIDEO VIEWED ON A CONNECTED TV No. On 2019 roadmap.
PREMIUM TV/VIDEO VIEWED ON A COMPUTER OR MOBILE DEVICE No. On 2019 roadmap.
PREMIUM TV/VIDEO VIEWED ON A CONNECTED TV No. On 2019 roadmap.
FORMS OF TV ANALYZED:
PRIMARY APPLICATION:
MEASURE THE ROI OF TELEVISION AND ITS COMPONENTS Yes. Applies single-source TV attribution methodology to account for exposure bias using person and household level demographic, behavioral (including transactional) and viewership features.
PROVIDE TACTICAL OPTIMIZATIONS (CREATIVE OR PLACEMENT) Yes. Impact Index is broken out for all campaign elements (e.g., creative and media placement).
Potentially second by second, frame by frame, rolled-up into standard media units.
TV DATA GRANULARITY:
MEDIA UNITS
Potentially second by second, frame by frame.
TIME
HH level, typically rolled-up to national data, 80 DMA, 13 of the top 20 DMAs.
GEOGRAPHY
605605 provides stand-alone TV attribution, not MTA, MMM or unified models.

RESEARCH PROVIDED BY 14
AUDIO/VIDEO CONTENT RECOGNITION ON MOBILE DEVICES No.
SET TOP BOXYes. 15M+ HHs/30M STBs.
AUDIO/VIDEO CONTENT RECOGNITION ON SMART TV Yes. On a project-by-project basis.
NIELSEN PANEL DATA No.
AD OCCURRENCES Yes. Kantar, Hive.
SCALING DATA THROUGH DATA INTEGRATION OR LOOKALIKE MODELSNo. Projections (weighed and balanced) are developed upon request.
PREFERRED TV DATA SOURCES: STATISTICAL, OR RULES-BASED, APPROACHES USED TO ESTIMATE TV LIFT ON KPISRandomized controlled experiments with a hold-out.
CONTROL GROUP SELECTION, IF APPROPRIATEAn ensemble of methods is used—exposure propensity-matched controls, counter-factual models and multi-dimensional segment matching—all at the HH level. Segment matching considers thousands of features, including demographics, pre/during/post campaign conversion behavior and thousands of viewership features.
TYPICAL MODEL CYCLE AND REFRESH TIMINGDaily. With a one-day lag for TV Data. Most clients are on a bi-weekly cadence, with quarterly deeper dives.
QUALITY CONTROL PROCESSESRaw tuning records are inspected for file formats, trends and anomalies.
MANAGING CONSUMER PRIVACYRaw running records are assigned a unique de-identified id (access is restricted).
MODEL VALIDATION All models are validated using hold-out samples and cross-validation, at the HH level, for the individual models and at the campaign level for the overall attribution.
OTHER MARKETING FACTORS INCLUDED? No. Audience characteristics are integrated for CRM data, (customer email, ecommerce, etc.) and lookalike models.
OTHER NON-MARKETING FACTORS INCLUDED (E.G., WEATHER)? Yes. Upon request.
OTHER MEDIA INCLUDED? Yes. Addressable media that can be matched deterministically.
METHOD FOR MATCHING OTHER DEPENDENT (OUTCOME) OR MEDIA DATAAny and all PII is matched through third-party safe-haven (i.e., Experian, LiveRamp).
ADDITIONAL DATA IN THE MODEL
DIMINISHING RETURNS INCLUDED IN ANALYSIS?Yes. By comparing exposure frequency distributions (in exposure-propensity matched controls) or by comparing different segment groupings by frequency.
ADSTOCK INCLUDED IN ANALYSIS?No.
HALO INCLUDED IN ANALYSIS?Yes. Depending on the source of conversion data.
BASELINE INCLUDED IN ANALYSIS?Yes. Test and control groups are balanced for pre-measurement period, creating HH level baselines.
INTERACTIONS INCLUDED IN ANALYSIS?Yes. Limited to household charcteristics, including viewership features and conversion behavior and potentially exposure to competitive ads.

15
AlphonsoAlphonso provides measurement of TV and Digital ROAS for standalone TV and MTA analysis via ACR.
ONLINE SALES Yes. Online sales data from multiple credit card data providers.
OFFLINE SALES Yes. TV ad exposures tied to offline sales data in CPG, (frequent shopping data) Autos (registration data), Retail, and QSR (credit card transaction data).
ONLINE TRAFFIC Yes. Website pixel tracks visitation, which is tied to TV campaign exposure.
OFFLINE TRAFFIC Yes. Foot traffic and transactions via multiple location data partnerships.
BRAND METRICS (E.G., AWARENESS, CONSIDERATION, PURCHASE INTENT) Yes. Direct surveys or via Kantar Millward-Brown, comScore or Research Now.
TV TUNE-IN Yes. Real-time viewership data from 34M households.
DEPENDENT (OUTCOME) VARIABLES:
PRIMARY APPLICATION:
MEASURE THE ROI OF TELEVISION AND ITS COMPONENTS Yes. Test and control groups matched on brand and TV Viewing behavior, demos, etc.
PROVIDE TACTICAL OPTIMIZATIONS (CREATIVE OR PLACEMENT) Yes. By network, daypart, day of week, shows, creatives and creative type (e.g., length, messaging, call to actions, mood and others).
LINEAR TV Yes. National and local.
VOD Yes. National and local.
ADDRESSABLE TV Yes. National and local.
SHORT DIGITAL VIDEO VIEWED ON A COMPUTER OR MOBILE DEVICE Yes. If short digital video has been provided prior (including gaming). OTT applications can be measured via Alphonso OTT pixel fired from content serving side.
SHORT DIGITAL VIDEO VIEWED ON A CONNECTED TV Yes. If short digital video has been provided prior (including gaming). OTT applications can be measured via Alphonso OTT pixel fired from content serving side.
PREMIUM TV/VIDEO VIEWED ON A COMPUTER OR MOBILE DEVICE Yes. OTT applications can be measured via Alphonso OTT pixel fired from content serving side.
PREMIUM TV/VIDEO VIEWED ON A CONNECTED TV Yes. OTT applications can be measured via Alphonso OTT pixel fired from content serving side.
FORMS OF TV ANALYZED:
Program and ad occurrence analyzed by network, season, episode, program title, duration (seconds and equivalized units), ad brand, ad title, product, ad offer, co-op, spend and demographics.
TV DATA GRANULARITY:
MEDIA UNITS
Exact time of occurrence (time stamped), duration
(seconds, equivalized units), daypart, day of the week
and week.
TIME
GEOGRAPHY

RESEARCH PROVIDED BY 16
AUDIO/VIDEO CONTENT RECOGNITION ON MOBILE DEVICES Yes. Proprietary ACR SDK embedded into over 1000 mobile apps uses audio fingerprinting to determine viewership on any TV in the same room, at the program and ad level.
SET TOP BOXYes. Smart STB data providers.
AUDIO/VIDEO CONTENT RECOGNITION ON SMART TV Yes. 4 Smart TV brands and additionally from 2 TV chipsets.
NIELSEN PANEL DATA No.
AD OCCURRENCES Yes. Proprietary capture via ACR 24/7 on 200+ networks at both national and local levels, including meta data (i.e., product advertised, existence of coop partners, deal offered if any, mood of the ad).
SCALING DATA THROUGH DATA INTEGRATION OR LOOKALIKE MODELSData from mobile devices, Smart TVs, smart STBs and smart living room devices are integrated to provide deterministic data from 34M HHs.
STATISTICAL, OR RULES-BASED, APPROACHES USED TO ESTIMATE TV LIFT ON KPISTest versus control. Principal component analysis (to reduce viewing dimensions), stratified sampling (to create representative samples), chi-squared (to test response rate differences between control and test) and bootstrapping (to develop bounds for lift estimates).
CONTROL GROUP SELECTION, IF APPROPRIATEControl group selection tailored to brand/category. Criteria include pre-exposure conversion behavior, demographics, TV viewing behavior and equal opportunity to visit.
TYPICAL MODEL CYCLE AND REFRESH TIMINGDaily and custom, based on client needs/requirements.
QUALITY CONTROL PROCESSESMultiple methods are deployed to ensure data quality, for example: • Continuously compare our machine-generated ad occurrence data with actual human watched ad logs. • ACR measures both ad and program exposure, providing a baseline for quality control. • ACR viewership data is compared to partner data.
MANAGING CONSUMER PRIVACYConsumers provide consent via “double opt-in” before data collection and are given an easy-to-use opt-out choice. Our software never collects PII; data is associated only with a numeric device ID.
MODEL VALIDATION All models are validated using P value and internal benchmarks for every variable, r-squared test/control studies, simulations and bootstrapping, for the model.
PREFERRED TV DATA SOURCES:
OTHER MARKETING FACTORS INCLUDED? No. Audience characteristics are integrated (e.g., demographics, location, credit card, auto, CPG).
OTHER NON-MARKETING FACTORS INCLUDED (E.G., WEATHER)? No.
OTHER MEDIA INCLUDED? Yes. Digital via CRM, server logs and pixel tagging.
SCALING DATA THROUGH DATA INTEGRATION OR LOOKALIKE MODELSData from mobile devices, Smart TVs, smart STBs and smart living room devices are integrated to provide deterministic data from 34M HHs.
ADDITIONAL DATA IN THE MODEL
DIMINISHING RETURNS INCLUDED IN ANALYSIS?Yes. Using time-based and frequency-based weighting methodologies.
ADSTOCK INCLUDED IN ANALYSIS?No.
HALO INCLUDED IN ANALYSIS?No.
BASELINE INCLUDED IN ANALYSIS?Yes. Estimated from norms and benchmarks by brands and categories.
INTERACTIONS INCLUDED IN ANALYSIS?No.

17
Analytic PartnersAnalytic Partners uses a unified approach to television attribution, combining MMM+MTA+TV Path Analysis with a full range of variables to provide reliable ROI estimates at a highly granular level.
ONLINE SALES Yes. Typically sourced from client.
OFFLINE SALES Yes. Typically sourced from client or industry specific third party data provider.
ONLINE TRAFFIC Yes. Typically sourced from client.
OFFLINE TRAFFIC Yes. Typically sourced from client or third party data provider (e.g., geolocation provider)
BRAND METRICS (E.G., AWARENESS, CONSIDERATION, PURCHASE INTENT) Yes. Typically sourced from client or any of a number of third party data providers.
TV TUNE-IN Yes. Typically sourced from third party providers such as Samba, Alphonso, iSpot/Inscape.
DEPENDENT (OUTCOME) VARIABLES:
PRIMARY APPLICATION:
MEASURE THE ROI OF TELEVISION AND ITS COMPONENTS Yes. In a unified framework: MMM used to determine overall TV ROI; TV path analysis is used to measure the influence of TV on intermediate drivers such as paid search and website visits. Granular, person, HH or minute-level TV exposure data enables deeper insights into the components of TV ROI (e.g., creative, placement, length, daypart, etc.)
PROVIDE TACTICAL OPTIMIZATIONS (CREATIVE OR PLACEMENT) Yes. A key outcome of TV attribution/path analysis is tactical optimization based on response and ROI by target segment, daypart, creative, day of week, network, spot length, pod position, etc.
LINEAR TV Yes. At the finest granularity available (e.g., HH or DMA/local and by timestamp and aligned with addressable, OLV, etc.) by common unique identifier.
VOD Yes. At the finest granularity available (e.g., HH or DMA/local and by timestamp and aligned with addressable, OLV, etc.) by common unique identifier.
ADDRESSABLE TV Yes. At the finest granularity available (e.g., HH or DMA/local and by timestamp and aligned with addressable, OLV, etc.) by common unique identifier.
SHORT DIGITAL VIDEO VIEWED ON A COMPUTER OR MOBILE DEVICE Yes. At the finest granularity available (e.g., HH or DMA/local and by timestamp and aligned with addressable, OLV, etc.) by common unique identifier.
SHORT DIGITAL VIDEO VIEWED ON A CONNECTED TV Yes. At the finest granularity available (e.g., HH or DMA/local and by timestamp and aligned with addressable, OLV, etc.) by common unique identifier.
PREMIUM TV/VIDEO VIEWED ON A COMPUTER OR MOBILE DEVICE Yes. At the finest granularity available (e.g., HH or DMA/local and by timestamp and aligned with addressable, OLV, etc.) by common unique identifier.
PREMIUM TV/VIDEO VIEWED ON A CONNECTED TV Yes. At the finest granularity available (e.g., HH or DMA/local and by timestamp and aligned with addressable, OLV, etc.) by common unique identifier.
FORMS OF TV ANALYZED:
Program
DMA
TV DATA GRANULARITY:
MEDIA UNITS
Exact time/timestamp
TIME
GEOGRAPHY

AUDIO/VIDEO CONTENT RECOGNITION ON MOBILE DEVICES Yes.
SET TOP BOXYes.
AUDIO/VIDEO CONTENT RECOGNITION ON SMART TV Yes.
NIELSEN PANEL DATA Yes.
AD OCCURRENCES Yes.
SCALING DATA THROUGH DATA INTEGRATION OR LOOKALIKE MODELSNo.
STATISTICAL, OR RULES-BASED, APPROACHES USED TO ESTIMATE TV LIFT ON KPISA unified measurement approach (MMM+MTA+TV path analysis). Adaptive Structural Equation Modeling, at the aggegate level, captures TV's direct and indirect influences on KPIs, including upper and lower funnel effects. Behavior-Segmented Probabilistic Attribution, a patent-pending algorithmic method at the HH level, segments users into consistent behavior groups, ensuring comparison of similar converting and non-converting paths.
CONTROL GROUP SELECTION, IF APPROPRIATETest and control experiments are just used for validation. Control groups are formed by stratifying sample based on key attributes (e.g., geography, household size, etc.), then, randomly selecting HHs within each stratum
TYPICAL MODEL CYCLE AND REFRESH TIMINGWeekly or monthly, dependent on data latency.
QUALITY CONTROL PROCESSESTV data is cross-checked with media plans and agency post-buys and filtered for extreme or missing values. Individual or HH data is cross-checked with aggregate data from path analysis or marketing mix to understand and account for inevitable data loss at the cookie level. Our third party partnerships enhance data quality by establishing identity and consistency across data sets and by appending audience data when available.
MANAGING CONSUMER PRIVACYWe do not collect any PII and leverage third-party data onboarding experts ensuring data privacy.
MODEL VALIDATION All models validated via: model statistics, hold-out cross validation and experimental design, at the lowest level of data granularity available.
PREFERRED TV DATA SOURCES:
OTHER MARKETING FACTORS INCLUDED? Yes. Unified measurement integrates the entire marketing mix; MTA for addressable factors, MMM for non-addressable factors.
OTHER NON-MARKETING FACTORS INCLUDED (E.G., WEATHER)? Yes. All non-marketing factors are integrated: weather, operational, competitive influences, etc.; MTA for addressable factors, MMM for non-addressable factors.
OTHER MEDIA INCLUDED? Yes. All other media data (Radio, OOH, Email, Print, etc.) are integrated; MTA for addressable factors, MMM for non-addressable factors.
METHOD FOR MATCHING OTHER DEPENDENT (OUTCOME) OR MEDIA DATAThird parties are used to match TV data with other media (e.g., LiveRamp, Experian, Throtle, Tapad, Barometric, etc.) at the HH or individual level.
ADDITIONAL DATA IN THE MODEL
DIMINISHING RETURNS INCLUDED IN ANALYSIS?Yes. Diminishing returns are captured within our unified measurement approach for TV attribution.
ADSTOCK INCLUDED IN ANALYSIS?Yes. Adstock is captured within our unified measurement approach for TV attribution.
HALO INCLUDED IN ANALYSIS?Yes. Halo effects are captured within our unified measurement approach for TV attribution.
BASELINE INCLUDED IN ANALYSIS?Yes. Baseline is captured within our unified measurement approach through a holistic marketing mix. Marketing mix is the most accurate approach to capturing baseline as it is the only approach that includes all potential business drivers.
INTERACTIONS INCLUDED IN ANALYSIS?Yes. Interactions/synergistic impacts are captured within our unified measurement approach for TV attribution. Analysis aligns time frames of layering of media/marketing channels to measure synergistic impact.
RESEARCH PROVIDED BY 18

19
Conversion LogicConversion Logic delivers television measurement and MTA using machine-learning models and SaaS solution.
ONLINE SALES Yes. Data typically sourced from the client, but have available data in CPG, Auto, Retail and Entertainment.
OFFLINE SALES Yes. Data typically sourced from the client, but have available data in CPG, Auto, Retail, and Entertainment.
ONLINE TRAFFIC Yes. Data typically sourced from the client or pulled from Google Analytics or other web analytics tools.
OFFLINE TRAFFIC Yes. Data typically sourced from the client or location-data vendors.
BRAND METRICS (E.G., AWARENESS, CONSIDERATION, PURCHASE INTENT) No.
TV TUNE-IN Yes.
DEPENDENT (OUTCOME) VARIABLES:
PRIMARY APPLICATION:
MEASURE THE ROI OF TELEVISION AND ITS COMPONENTS Yes. With control group matched on viewing history, location, demo, etc.
PROVIDE TACTICAL OPTIMIZATIONS (CREATIVE OR PLACEMENT) Yes.
LINEAR TV Yes.
VOD Yes.
ADDRESSABLE TV Yes.
SHORT DIGITAL VIDEO VIEWED ON A COMPUTER OR MOBILE DEVICE Yes (MTA).
SHORT DIGITAL VIDEO VIEWED ON A CONNECTED TV Yes.
PREMIUM TV/VIDEO VIEWED ON A COMPUTER OR MOBILE DEVICE Yes (MTA).
PREMIUM TV/VIDEO VIEWED ON A CONNECTED TV Yes.
FORMS OF TV ANALYZED:
Programs and networks, and spot creative.
National and large DMAs.
TV DATA GRANULARITY:
MEDIA UNITS
Dayparts and day of week.
TIME
GEOGRAPHY

RESEARCH PROVIDED BY 20
AUDIO/VIDEO CONTENT RECOGNITION ON MOBILE DEVICES No.
SET TOP BOXYes.
AUDIO/VIDEO CONTENT RECOGNITION ON SMART TV Yes.
NIELSEN PANEL DATA No.
AD OCCURRENCES No.
SCALING DATA THROUGH DATA INTEGRATION OR LOOKALIKE MODELSNo.
STATISTICAL, OR RULES-BASED, APPROACHES USED TO ESTIMATE TV LIFT ON KPISTest/control for standalone TV Attribution: Machine-learning models to determine incremental impact of TV by comparing matched exposed and unexposed households. In a full MTA setting, machine-learning models to deter-mine incremental impact of multiple media channels, including TV, by controlling for media exposures, user actions and other user attributes.
CONTROL GROUP SELECTION, IF APPROPRIATEControl groups are developed using a propensity model to ensure comparability of exposed and unexposed in terms of viewing history, location, demo, etc.
TYPICAL MODEL CYCLE AND REFRESH TIMINGWeekly and monthly.
QUALITY CONTROL PROCESSESData is validated during onboarding to identify missing or invalid data. Validation reports are produced to review channel mappings, potential tracking limitations/gaps, mapping exceptions, and data accuracy (events and spend)—with various stakeholders at data review sessions to ensure that the data is processed correctly, potential gaps are recognized and addressed, and outliers are confirmed and explained.
MANAGING CONSUMER PRIVACYWe don’t collect any PII. Our data partners have the rights to use of viewership data. Offline conversions and viewership data are connected in a safe, private and anonymous way.
MODEL VALIDATION Every model is validated with hold-out samples, assessed on prediction accuracy. We use Area Under the Curve and Confusion Matrix to determine accuracy. TV lifts are checked for reasonable and consistent measurements across many dimensions (e.g., number of impressions, dayparts, geos, etc.).
PREFERRED TV DATA SOURCES:
OTHER MARKETING FACTORS INCLUDED? No. For standalone TV Attribution Yes. For MTA, including other digital data, direct mail and other addressable data.
OTHER NON-MARKETING FACTORS INCLUDED (E.G., WEATHER)? No.
OTHER MEDIA INCLUDED? No. For standalone TV Attribution Yes. For MTA, including other digital data, direct mail and other addressable data.
METHOD FOR MATCHING OTHER DEPENDENT (OUTCOME) OR MEDIA DATANo. For standalone TV Attribution. Yes. For MTA.
ADDITIONAL DATA IN THE MODEL
DIMINISHING RETURNS INCLUDED IN ANALYSIS?Yes.
ADSTOCK INCLUDED IN ANALYSIS?Yes.
HALO INCLUDED IN ANALYSIS?No. Yes in MTA.
BASELINE INCLUDED IN ANALYSIS?Yes.
INTERACTIONS INCLUDED IN ANALYSIS?No. For standalone TV Attribution. Yes. For MTA.

21
ONLINE SALES Yes. Source data from a brand's website, directly from brands or from brands or through partnerships with third-party providers.
OFFLINE SALES Yes. We typically source data directly from brands/advertisers.
ONLINE TRAFFIC Yes. Online and mobile taffic sourced via pixel.
OFFLINE TRAFFIC Yes. Work with third-party mobile location partners and advertisers' first party store visit data.
BRAND METRICS (E.G., AWARENESS, CONSIDERATION, PURCHASE INTENT) Yes. Through partnership with leading research firm.
TV TUNE-IN Yes. Data sourced from partnership with Vizio Inscape and a number of MVPDs.
DEPENDENT (OUTCOME) VARIABLES:
LINEAR TV Yes. We measure Linear TV exposure via Vizio Smart TVs (approximately 8M households), as well as via 4 of the top 8 MVPDs in US for approximately 38M households.
VOD Yes. VOD and other time-shifted viewing.
ADDRESSABLE TV Yes.
SHORT DIGITAL VIDEO VIEWED ON A COMPUTER OR MOBILE DEVICE Yes. VAST compliant tracking tags appended to ads served across most major digital video ad-serving platforms.
SHORT DIGITAL VIDEO VIEWED ON A CONNECTED TV Yes. Using VAST compliant tracking tags appended to ads plus Smart TV ACR.
PREMIUM TV/VIDEO VIEWED ON A COMPUTER OR MOBILE DEVICE Yes. VAST compliant tracking tags appended to ads served across most Premium TV/Video ad-serving platforms. In use across most major networks’ full episode players.
PREMIUM TV/VIDEO VIEWED ON A CONNECTED TV Yes. Using VAST compliant tracking tags appended to ads plus Smart TV ACR.
FORMS OF TV ANALYZED:
PRIMARY APPLICATION:
MEASURE THE ROI OF TELEVISION AND ITS COMPONENTS Yes. Ultimately, how findings are applied is up to our clients and their specific objectives. We have a dashboard that provides timely access to attribution model results. Our models enables clients to understand the contribution of different components of the media campaign and explore these results at a granular level.
PROVIDE TACTICAL OPTIMIZATIONS (CREATIVE OR PLACEMENT) Yes. Can also supply a programmatic feed of results to advertiser and platforms.
Second-by-second program and ad viewing.
TV DATA GRANULARITY:
MEDIA UNITS
Precise program airtime or ad exposure time.
TIME
Zipcode, market and region.
GEOGRAPHY
Data Plus MathData+Math leverages ACR and STB data in its ensemble machine-learning attribution MTA method.

RESEARCH PROVIDED BY 22
AUDIO/VIDEO CONTENT RECOGNITION ON MOBILE DEVICES No.
SET TOP BOXYes. Via 4 of the top 8 MVPDs by subscriber count, approximately 38M HHs.
AUDIO/VIDEO CONTENT RECOGNITION ON SMART TV Yes. Via Vizio Inscape, approximately 10M HHs.
NIELSEN PANEL DATA No.
AD OCCURRENCES Yes. Ad occurrence data from Smart TV ACR and clients and programmer clients.
SCALING DATA THROUGH DATA INTEGRATION OR LOOKALIKE MODELSYes. Integrates Smart TV and set top box data for a more complete picture of total home TV viewing.
PREFERRED TV DATA SOURCES: STATISTICAL, OR RULES-BASED, APPROACHES USED TO ESTIMATE TV LIFT ON KPISEnsemble of machine-learning models are trained on both aggregated and user-level data. Where appropriate, model parameters are calibrated to norms.
CONTROL GROUP SELECTION, IF APPROPRIATEWhere no explicit test or control group has been utilized like with addressable TV, Data+Math’s platform uses synthetic control groups based on viewing and other user level attributes.
TYPICAL MODEL CYCLE AND REFRESH TIMINGAs frequently as nightly, depending on data latency.
QUALITY CONTROL PROCESSESData is tested at the aggregate level by comparison to known measures such as content/spot ratings for consistency and accuracy. Quality of other platform inputs, such as synthetic controls, is measured by computing statistical metrics to check for bias.
MANAGING CONSUMER PRIVACYData+Math does not collect any PII. Our policies and contracts do not allow for the re-identification of any collected data. Consumers can opt-out of our TVPixel™ tracking.
MODEL VALIDATION We use both hold-out samples and cross-validation to validate our models. We compare model performance across markets and data sets to ensure consistency and to discover and avoid systematic errors inherent to individual data sets.
OTHER MARKETING FACTORS INCLUDED? Yes. Price and promotion, sourced from third parties and matched at the HH level; competitive media spend; HH characteristics such as age, income, seasonality.
OTHER NON-MARKETING FACTORS INCLUDED (E.G., WEATHER)? Yes.
OTHER MEDIA INCLUDED? Yes. Digital via proprietary pixel tags; other media (e.g., OOH, Email, etc.) from third parties can be integrated.
METHOD FOR MATCHING OTHER DEPENDENT (OUTCOME) OR MEDIA DATATV and digital media matched with our signal graph at the household or device level via multiple different match points and methods, including IP address and cookie/device/identity matching partners like
ADDITIONAL DATA IN THE MODEL
DIMINISHING RETURNS INCLUDED IN ANALYSIS?Yes.
ADSTOCK INCLUDED IN ANALYSIS?Yes.
HALO INCLUDED IN ANALYSIS?Yes.
BASELINE INCLUDED IN ANALYSIS?Yes. The model synthetically controls for the propensity of consumers to be observed in exposed group and extracts the baseline conversion in the absence of a campaign.
INTERACTIONS INCLUDED IN ANALYSIS?Yes. Interaction between channels.

23
ONLINE SALES Yes. Transaction-level data from frequent shopper program plus orders placed online with store-pickup directly from for retailers.
OFFLINE SALES Yes. Through frequent shopper program (FSP) data.
ONLINE TRAFFIC Yes. This data is received via client agencies or when provided directly by clients.
OFFLINE TRAFFIC Yes. Included in Frequent Shopper Program Data. Also have third-party location data.
BRAND METRICS (E.G., AWARENESS, CONSIDERATION, PURCHASE INTENT) No.
TV TUNE-IN No.
DEPENDENT (OUTCOME) VARIABLES:
LINEAR TV Yes. Through data partnerships that enable turn-key measurement.
VOD Yes. Through data partnerships that enable turn-key measurement.
ADDRESSABLE TV Yes. Through data partnerships that enable turn-key measurement.
SHORT DIGITAL VIDEO VIEWED ON A COMPUTER OR MOBILE DEVICE Yes. Through data partnerships that enable turn-key measurement.
SHORT DIGITAL VIDEO VIEWED ON A CONNECTED TV Yes. Through data partnerships that enable turn-key measurement.
PREMIUM TV/VIDEO VIEWED ON A COMPUTER OR MOBILE DEVICE Yes. Through data partnerships that enable turn-key measurement. PREMIUM TV/VIDEO VIEWED ON A CONNECTED TV Yes. Through data partnerships that enable turn-key measurement.
FORMS OF TV ANALYZED:
PRIMARY APPLICATION:
MEASURE THE ROI OF TELEVISION AND ITS COMPONENTS Yes. Focused on assessing incremental sales or dollars/HH.
PROVIDE TACTICAL OPTIMIZATIONS (CREATIVE OR PLACEMENT) Yes. In-flight and end-of-campaign reads of network, creative, ad type, ad duration, day of week and ad size.
Networks, dayparts, day-of-week, programs, episodes.
TV DATA GRANULARITY:
MEDIA UNITS
Time stamped viewing.
TIME
National and local (depending on the HH TV exposure data provider).
GEOGRAPHY
IRiIRI utilizes ACR and set top box data to measure television exposures with CPG and OTC Healthcare frequent shopper data. TV and Digital MTA.

RESEARCH PROVIDED BY 24
AUDIO/VIDEO CONTENT RECOGNITION ON MOBILE DEVICES Yes. Through data partnerships that enable turn-key measurement.
SET TOP BOXYes. Through data partnerships that enable turn-key measurement.
AUDIO/VIDEO CONTENT RECOGNITION ON SMART TV Yes. Through data partnerships that enable turn-key measurement.
NIELSEN PANEL DATA No.
AD OCCURRENCES Yes. Through+G15 data partnerships that enable turn-key measurement.
SCALING DATA THROUGH DATA INTEGRATION OR LOOKALIKE MODELSYes. Combine different exposure sources where legally permissible.
PREFERRED TV DATA SOURCES: STATISTICAL, OR RULES-BASED, APPROACHES USED TO ESTIMATE TV LIFT ON KPISGeneralized Linear Models are applied to estimate lift in Penetration, Dollars per Trip and Trip level, then combined to Dollars/HH, for standalone TV attribution. That estimate is adjusted for covariates such as store promotions to isolate the effect of ad exposure on purchase behavior. In a full MTA setting, Random Forest models (machine learning) are used to derive attribution of incremental S/HH at HH level for various combinations of TV and Digital exposure and interactions.
CONTROL GROUP SELECTION, IF APPROPRIATEIf a hold out control is provided, we can build the base line prediction. If no hold out control is provided, then we match test and control HHs based on pre-campaign purchase behavior to ensure parity between test and control on purchase characteristics.
TYPICAL MODEL CYCLE AND REFRESH TIMINGThe first interim read can be provided within 5 weeks of a campaign start; thereafter, they can be updated on a biweekly basis.
QUALITY CONTROL PROCESSESData is reconciled to control totals, checked for missing data, checked for count of impressions and HHs at total and break level, assessed for leakage of row counts when matching to Experian and FSP sets, and checked for mismatched tag IDs between the exposure file and lookup file. Count of exposed and non-exposed HHs and buyers and non-buyers are checked.
MANAGING CONSUMER PRIVACYIRI does not handle or receive PII. Experian is our custodian of PII, and we receive only HH IDs with no PII attached to them.
MODEL VALIDATION All models are validated at a HH level using hold out samples and cross validation. During model development, we apply outlier removal, level consolidation, and two sample Kolmogorov–Smirnov test (matching); variables are checked for P-values, logical sign and multi-collinearity; and overall goodness of fit is assessed.
OTHER MARKETING FACTORS INCLUDED? Yes. Promotional factors, Feature, Display, temporary price reduction from point of sale data.
OTHER NON-MARKETING FACTORS INCLUDED (E.G., WEATHER)? Yes.
OTHER MEDIA INCLUDED? Yes.
METHOD FOR MATCHING OTHER DEPENDENT (OUTCOME) OR MEDIA DATAMatching is done based on Experian ID or Liveramp ID.
ADDITIONAL DATA IN THE MODEL
HALO INCLUDED IN ANALYSIS?Yes.
BASELINE INCLUDED IN ANALYSIS?Yes.
INTERACTIONS INCLUDED IN ANALYSIS?Yes.
DIMINISHING RETURNS INCLUDED IN ANALYSIS?Yes.
ADSTOCK INCLUDED IN ANALYSIS?Yes.

25
ONLINE SALES Yes. Pixel placed on client’s website or integrated within their mobile app.
OFFLINE SALES Yes. Brand CRM and transactional purchase data uploaded to LiveRamp.
ONLINE TRAFFIC Yes. Same as Online Sales, our pixel tracks all funnel points, including web visits.
OFFLINE TRAFFIC No. Partnerships are in the works for location-based data to be tied to TV exposure. Ready in 2019.
BRAND METRICS (E.G., AWARENESS, CONSIDERATION, PURCHASE INTENT) Yes. 150+ brands make use of iSpot Attention Scores and Creative Wear metrics to identify creative success and audience receptivity.
TV TUNE-IN Yes. TV Tune-In is a core product that ties promotional or cross-channel creative exposure to viewership. iSpot provides a syndicated platform that measures show promo to TV tune-in for over 4,000 programs.
DEPENDENT (OUTCOME) VARIABLES:
LINEAR TV Yes. Via Inscape Smart TV (9.1M TVs) detection data and iSpot’s creative catalog.
VOD No. Cannot yet accurately isolate VOD from Addressable since many addressable impessions are inserted into VOD.
ADDRESSABLE TV No. Cannot yet accurately isolate VOD from Addressable since many addressable impessions are inserted into VOD.
SHORT DIGITAL VIDEO VIEWED ON A COMPUTER OR MOBILE DEVICE Yes. Via the iSpot digital ad pixel.
SHORT DIGITAL VIDEO VIEWED ON A CONNECTED TV No. These are bucketed as VOD/Addressable/Other.
PREMIUM TV/VIDEO VIEWED ON A COMPUTER OR MOBILE DEVICE Yes. Via the iSpot digital ad pixel.
PREMIUM TV/VIDEO VIEWED ON A CONNECTED TV Yes.
FORMS OF TV ANALYZED:
PRIMARY APPLICATION:
MEASURE THE ROI OF TELEVISION AND ITS COMPONENTS Yes. iSpot’s core capability is connecting TV ad impressions with business outcomes. We provide both a lift measurement for understanding ROI and the causal impact of TV by network and daypart, as well as a converstion rate measure-ment for understanding relative performance of creative and media placements.
PROVIDE TACTICAL OPTIMIZATIONS (CREATIVE OR PLACEMENT) Yes. We provide lift measurement by network and daypart and conversion rate measurement by creative, network, program, daypart and individual media unit. We also provide optimal frequency measurement. From a tactical perspective, our clients can appropriately allocate dollars across network using our lift measurement, and then optimize the creative, programs and frequencies based on our conversion rates.
Occurrence level analyzed by episode, program, network, daypart and by each ad ID.
TV DATA GRANULARITY:
MEDIA UNITS
Second by second; pod number and position.
TIME
All 210 DMAs, as well as 28,438 Zip Code Triangulation Areas (ZCTAs).
GEOGRAPHY
iSpot.tviSpot offers television measurement through MTA with Smart TV data.

AUDIO/VIDEO CONTENT RECOGNITION ON MOBILE DEVICES No.
SET TOP BOXNo.
AUDIO/VIDEO CONTENT RECOGNITION ON SMART TV Yes. Proprietary measurement based on 4 data sets: iSpot creative catalog, iSpot’s airing schedules, Inscape Smart TV (~10M TVs) program data and Inscape's data matched to iSpot’s creative catalog; all normalized and projected to US Census.
NIELSEN PANEL DATA No.
AD OCCURRENCES Yes. Proprietary real-time ad occurrence data sourced from Smart TV ACR.
SCALING DATA THROUGH DATA INTEGRATION OR LOOKALIKE MODELSYes. Project from 9.1M measured devices to US Census, by DMA.
PREFERRED TV DATA SOURCES: STATISTICAL, OR RULES-BASED, APPROACHES USED TO ESTIMATE TV LIFT ON KPISTest/control for lift measurement with rules based approach to assign fractional credit. Two approaches are offered: (1) equal credit, or (2) a decay model with a 7-day half life. The attribution window can be selected from 2 hours to 30 days. Conversion rates are calculated across creatives, programs, genres, media units, etc., by dividing conversions by total impressions.
CONTROL GROUP SELECTION, IF APPROPRIATEControl groups are created for each network, using Coars-ened Exact Matching, to match the exposed group on three criteria: (1) total TV ads exposed, (2) total competitive ads exposed, and (3) total time viewing the network.
TYPICAL MODEL CYCLE AND REFRESH TIMINGUp-to-date through midnight of the night before.
QUALITY CONTROL PROCESSES25 programs are audited per day to ensure our occurrence data is as accurate as possible. Current accuracy rate is 99% at brand level and 98% at creative level. Clients compare our data to post-logs and Nielsen C3 ratings. Our pixel tracking data is compared to our clients own analytics system (Google Analytics or Adobe Site Analytics).
MANAGING CONSUMER PRIVACYiSpot does not collect any PII (other than IP Address, which is not considered as PII in the U.S.). All TV devices have an explicit consumer opt-in. We follow the rules of the DAA (Digital Advertising Alliance) and honor all "do not track" settings in browsers.
MODEL VALIDATIONPeriodically comparing TV attribution results to relevant MMM studies.
OTHER MARKETING FACTORS INCLUDED? No. Audience characteristics are integrated: custom segments, both first and third party, call center data.
OTHER NON-MARKETING FACTORS INCLUDED (E.G., WEATHER)? No.
OTHER MEDIA INCLUDED? Yes. Digital.
METHOD FOR MATCHING OTHER DEPENDENT (OUTCOME) OR MEDIA DATAOnline data is matched in house; offline is done via LiveRamp or another matching partner.
ADDITIONAL DATA IN THE MODEL
ADSTOCK INCLUDED IN ANALYSIS?Yes. Declining returns in conversion rate from exposure date, by day.
HALO INCLUDED IN ANALYSIS?Yes. The Halo effect of both sister brands and competitor brands.
BASELINE INCLUDED IN ANALYSIS?Yes. For lift, the baseline is the conversion rate of the control group. For conversion rate, the baseline is the overall conversion rate for the brand across all advertising over a specified period of time.
INTERACTIONS INCLUDED IN ANALYSIS?No.
DIMINISHING RETURNS INCLUDED IN ANALYSIS?No.
RESEARCH PROVIDED BY 26

27
ONLINE SALES Yes. Data sourced directly from a client or partner and matched at the person level through an identity resolution platform.
OFFLINE SALES Yes. Data sourced directly from client or partner and matched at the person level through an identity resolution platform.
ONLINE TRAFFIC Yes. Sourced directly from ad serving providers or tagging solutions.
OFFLINE TRAFFIC Yes. Our data is sourced directly from various location providers and matched at the person level through an identity resolution platform.
BRAND METRICS (E.G., AWARENESS, CONSIDERATION, PURCHASE INTENT) Yes. Sourced directly from various survey providers.
TV TUNE-IN Yes. Data sourced directly from various providers.
DEPENDENT (OUTCOME) VARIABLES:
LINEAR TV Yes. Via probabilistic models based on 10+ years of survey plus custom surveys.
VOD Yes. Via ad audio fingerprint record.
ADDRESSABLE TV Yes. Via server log file records.
SHORT DIGITAL VIDEO VIEWED ON A COMPUTER OR MOBILE DEVICE Yes. Using server log file records.
SHORT DIGITAL VIDEO VIEWED ON A CONNECTED TV Yes. Via ad audio fingerprint record.
PREMIUM TV/VIDEO VIEWED ON A COMPUTER OR MOBILE DEVICE Yes. Via server log file records.
PREMIUM TV/VIDEO VIEWED ON A CONNECTED TV Yes. Via server log file records.
FORMS OF TV ANALYZED:
PRIMARY APPLICATION:
MEASURE THE ROI OF TELEVISION AND ITS COMPONENTS Yes. Provides analysis of TV ROI allowing for in-flight optimization and future media planning.
PROVIDE TACTICAL OPTIMIZATIONS (CREATIVE OR PLACEMENT) Yes. Provides optimizations at the creative, placementand channel level.
Program and ad occurrences.
TV DATA GRANULARITY:
MEDIA UNITS
Exact time.
TIME
All zip codes and DMAs.
GEOGRAPHY
Marketing EvolutionMarketing Evolution provides unified measurement, with television insights sourced from Smart TV ACR and MVPD data at the HH level.

RESEARCH PROVIDED BY 28
AUDIO/VIDEO CONTENT RECOGNITION ON MOBILE DEVICES Yes. Log level data matched to persons via identity management platform.
SET TOP BOXYes. National household level ad occurrence data sourced from MVPD’s such as Comcast, DISH, etc.
AUDIO/VIDEO CONTENT RECOGNITION ON SMART TV Yes. Inscape.
NIELSEN PANEL DATA No.
AD OCCURRENCES Yes. Device level ad occurrence data sourced from Inscape; second-by-second data is delivered hourly.
SCALING DATA THROUGH DATA INTEGRATION OR LOOKALIKE MODELSYes. Append Experian data and build lookalike audiences.
PREFERRED TV DATA SOURCES: STATISTICAL, OR RULES-BASED, APPROACHES USED TO ESTIMATE TV LIFT ON KPISLogistic regression to estimate the contribution of media to KPIs. Models Elastic Net is used to stabilize the model coefficients where there are a large number of predictors and a small training dataset. It also addressdes the challenge of highly correlated predictors.
CONTROL GROUP SELECTION, IF APPROPRIATETest/control groups are used for validation.
TYPICAL MODEL CYCLE AND REFRESH TIMINGModels are refreshed based data latency. Models are often refreshed monthly, or more often if needed.
QUALITY CONTROL PROCESSESAll data feeds are monitored and alerts generated if any anomalies are detected. Data is validated at every step in the analytics process to ensure accuracy.
MANAGING CONSUMER PRIVACYMarketing Evolution never handles PII and works with industry certified providers that provide safe house environments such as Experian and Acxiom. All systems are encrypted and firewall secured.
MODEL VALIDATION Models are validated monthly, or semi-annually, at the HH/person level by comparison to actual results. In the model building process, k-fold cross-validation with hold outs is utilized. Area under the Curve is the goodness of fit metric.
OTHER MARKETING FACTORS INCLUDED? Yes.
OTHER NON-MARKETING FACTORS INCLUDED (E.G., WEATHER)? Yes.
OTHER MEDIA INCLUDED? Yes. All media, both online and offline, including CRM, Direct Mail, Email, OOH, Print, Radio, etc.
METHOD FOR MATCHING OTHER DEPENDENT (OUTCOME) OR MEDIA DATAMatched via partners, such as LiveRamp. Marketing Evolution does not ingest any PII.
ADDITIONAL DATA IN THE MODEL
DIMINISHING RETURNS INCLUDED IN ANALYSIS?Yes.
ADSTOCK INCLUDED IN ANALYSIS?Yes.
HALO INCLUDED IN ANALYSIS?Yes.
BASELINE INCLUDED IN ANALYSIS?Yes.
INTERACTIONS INCLUDED IN ANALYSIS?Yes.

29
ONLINE SALES Yes. Through tagging, client’s site analytics data or onboarded customer transaction files.
OFFLINE SALES Yes. Data from onboarded customer transaction files.
ONLINE TRAFFIC Yes. Through tagging and client’s site analytics data.
OFFLINE TRAFFIC Yes. From partnerships with GPS sources or client app data.
BRAND METRICS (E.G., AWARENESS, CONSIDERATION, PURCHASE INTENT) Yes. Through third-party suppliers or proxies derived from web-engagement data.
TV TUNE-IN Yes. Via STB or Smart TV data partners.
DEPENDENT (OUTCOME) VARIABLES:
LINEAR TV Yes. Via STB and Smart TV partners. National only.
VOD Yes. Via STB and Smart TV partners.
ADDRESSABLE TV Yes. Via log files.
SHORT DIGITAL VIDEO VIEWED ON A COMPUTER OR MOBILE DEVICE Yes. Sourced through Video DSPs and Ad-serving platforms.
SHORT DIGITAL VIDEO VIEWED ON A CONNECTED TV Yes. Sourced through Smart TV data providers.
PREMIUM TV/VIDEO VIEWED ON A COMPUTER OR MOBILE DEVICE Yes. Sourced through Video DSPs and Ad-serving platforms and content providers.
PREMIUM TV/VIDEO VIEWED ON A CONNECTED TV Yes. Sourced through Smart TV data partners.
FORMS OF TV ANALYZED:
PRIMARY APPLICATION:
MEASURE THE ROI OF TELEVISION AND ITS COMPONENTS Yes. ROI calculations, along with recency/frequency parame-ters, inform channel investment decisions.
PROVIDE TACTICAL OPTIMIZATIONS (CREATIVE OR PLACEMENT) Yes. We measure effectiveness of creative, daypart and programming to inform investment tactical optimizations.
Ad occurrences, analyzed by creative, campaign hierarchy, point in pod, network, network group and program type.
TV DATA GRANULARITY:
MEDIA UNITS
Daypart, weekday, seasonality at week or
month level.
TIME
National.
GEOGRAPHY
NeustarNeustar's offers both MTA and standalone television attribution solutions.

RESEARCH PROVIDED BY 30
AUDIO/VIDEO CONTENT RECOGNITION ON MOBILE DEVICES No.
SET TOP BOXYes. Fourth Wall (1.8M), Comcast (19M) and others depending on client needs.
AUDIO/VIDEO CONTENT RECOGNITION ON SMART TV Yes. Samba (13.5M) and iSpot (~10M).
NIELSEN PANEL DATA Yes. For validation, panel too small for most client use-cases.
AD OCCURRENCES Yes. iSpot or agency logs.
SCALING DATA THROUGH DATA INTEGRATION OR LOOKALIKE MODELSYes. Typically combine multiple providers, then weight to reflect national characteristics.
PREFERRED TV DATA SOURCES: STATISTICAL, OR RULES-BASED, APPROACHES USED TO ESTIMATE TV LIFT ON KPISLogistic regression with a hierarchical Bayesian framework.
CONTROL GROUP SELECTION, IF APPROPRIATEWe don’t consider post-hoc test and control groups to be valid, due to the biases in the characteristics of the unexposed group (e.g., they were on holiday and unavailable to purchase, they watch little TV and werelikely exposed to other media, etc.).
TYPICAL MODEL CYCLE AND REFRESH TIMINGStandalone: Monthly. MTA: Daily/Weekly/Monthly.
QUALITY CONTROL PROCESSESData is compared to media plans, client expectations, delivery sources of truth and Neustar benchmarks. Coverage is checked for each TV data source for any impact on reach. Completeness of TV data is checked at HH level for any impact on frequency. Match rates for TV data to outcome or other marketing data are checked for any impact on the customer journey, across media channels and business outcomes.
MANAGING CONSUMER PRIVACYWe do not enable any brand to de-anonymize the customers or their media pathways.
MODEL VALIDATION Models are validated with every data refresh at the HH and macro level using a range tests, including fit (AUC), multi-collinearity (VIF) and endogeneity tests. We also corroborate the model results with other external measurement studies and our internal benchmark database of measurements.
OTHER MARKETING FACTORS INCLUDED? Yes. Unified measurement integrates the entire marketing mix; MTA for addressable factors, MMM for non-addressable factors.
OTHER NON-MARKETING FACTORS INCLUDED (E.G., WEATHER)? Yes. All non-marketing factors are integrated: weather, operational, competitive influences, etc.; MTA for addressable factors, MMM for non-addressable factors.
OTHER MEDIA INCLUDED? Yes. All other media data (Radio, OOH, Email, Print, etc.) are integrated; MTA for addressable factors (digital, CRM, direct mail), MMM for non-addressable factors. Partner-ships enable us to access data and measure the impact of walled gardens (Facebook and Amazon). We also leverage our identity graph to connect to the customer journey for measurement and optimization.
METHOD FOR MATCHING OTHER DEPENDENT (OUTCOME) OR MEDIA DATAWe use Neustar’s in-house OneID system to combine at any available level of offline PII or digital identifiers, including device ID, IP address, cookie or Smart TV ID.
ADDITIONAL DATA IN THE MODEL
DIMINISHING RETURNS INCLUDED IN ANALYSIS?Yes.
ADSTOCK INCLUDED IN ANALYSIS?Yes.
HALO INCLUDED IN ANALYSIS?Yes.
BASELINE INCLUDED IN ANALYSIS?Yes.
INTERACTIONS INCLUDED IN ANALYSIS?Yes.

31
ONLINE SALES No. NCS does not measure online sales.
OFFLINE SALES Yes. Through purchase data from 18,000+ grocery and drug retailers, and nearly 300M loyalty shopper cards.
ONLINE TRAFFIC No. NCS does not measure online traffic.
OFFLINE TRAFFIC No. NCS does not measure offline traffic.
BRAND METRICS (E.G., AWARENESS, CONSIDERATION, PURCHASE INTENT) NCS does not mesaure Brand Metrics.
TV TUNE-IN NCS does not measure TV Tune-In.
DEPENDENT (OUTCOME) VARIABLES:
LINEAR TV Yes. National only.
VOD Yes. Using direct match with MVPDs.
ADDRESSABLE TV Yes. Using direct match with MVPDs.
SHORT DIGITAL VIDEO VIEWED ON A COMPUTER OR MOBILE DEVICE Yes. Using direct match (e.g., with Hulu, Roku).
SHORT DIGITAL VIDEO VIEWED ON A CONNECTED TV Yes. Using direct match (e.g., with Hulu, Roku).
PREMIUM TV/VIDEO VIEWED ON A COMPUTER OR MOBILE DEVICE Yes. Using direct match (e.g., with Hulu, Roku).
PREMIUM TV/VIDEO VIEWED ON A CONNECTED TV Yes. Using direct match (e.g., with Hulu, Roku).
FORMS OF TV ANALYZED:
PRIMARY APPLICATION:
MEASURE THE ROI OF TELEVISION AND ITS COMPONENTS Yes. Test and control groups matched on purchase history.
PROVIDE TACTICAL OPTIMIZATIONS (CREATIVE OR PLACEMENT) Yes. NCS measures incremental sales by creative or placement to provide optimization on future campaigns.
Ad occurrences.
TV DATA GRANULARITY:
MEDIA UNITS
Minute by minute timestamp.
TIME
National for Linear TV; DMA for addressable TV (with minimum 2 retailers in the DMA).
GEOGRAPHY
Nielsen Catalina SolutionsNielsen Catalina Solutions provides a measure of television effectiveness through attribution studies involving CPG in-store and frequent shopper data.
DIMINISHING RETURNS INCLUDED IN ANALYSIS?No.
ADSTOCK INCLUDED IN ANALYSIS?No.
HALO INCLUDED IN ANALYSIS?Yes.
BASELINE INCLUDED IN ANALYSIS?Yes. ANCOVA models assume a baseline from the observed control households. Cognitive Advantics models derive a baseline from all observations.
INTERACTIONS INCLUDED IN ANALYSIS?No.

RESEARCH PROVIDED BY 32
AUDIO/VIDEO CONTENT RECOGNITION ON MOBILE DEVICES No.
SET TOP BOXYes. 7MM+ STBs (DISH, Charter, FourthWall) and Nielsen People Meter matched to frequent shopper data at the HH level, calibrated for demographics and projected nationally.
Addressable TV measurement from DirecTV (14.8MM), DISH (8MM), Verizon FiOS (4.6M), Altice (2.3M), Comcast (ncluding VOD) (22M and Charter/Spectrum (including VOD) (9M).
AUDIO/VIDEO CONTENT RECOGNITION ON SMART TV Yes. Direct match with SlingTV, Hulu and Roku for Connected TV.
NIELSEN PANEL DATA Yes.
AD OCCURRENCES Yes. Nielsen AdIntel can work with client-provided data as well.
SCALING DATA THROUGH DATA INTEGRATION OR LOOKALIKE MODELSYes. Integrates NPM data with STB providers like DISH, Charter and FourthWall Media to create a nationally projectable viewing sample.
PREFERRED TV DATA SOURCES: STATISTICAL, OR RULES-BASED, APPROACHES USED TO ESTIMATE TV LIFT ON KPISTest/control, at a HH level, using ANCOVA for campaigns with reach <80%. In other cases, NCS's proprietary Cognitive Advantics propensity scoring methodology is used for causal estimation of advertising lift at a household-level or store-trip-level in three stages once a trip is identified: (1) category purchase, (2) brand purchase, or (3) brand purchase size. The model also accounts for the likelihood that a control HH would have been in the target group to avoid endogeniety (in-target) bias.
CONTROL GROUP SELECTION, IF APPROPRIATEAll households (test and control) must pass static and unification criteria to ensure that they are reporting an accurate and reliable data stream.
For ANCOVA, non-purchasing households are excluded from the match. Where possible, each test household is matched with a unique control household, where campaign reach is 50% to 80%, control households are matched with replacement. Matching minimizes the pairwise and group-wise distances across about 100 variables, including purchase, purchase cycle and demos. For Cognitive Advantics, which is an observational method, and is not matched, each HH or Store Trip is used as observed.
TYPICAL MODEL CYCLE AND REFRESH TIMINGDaily. Typical studies at NCS are standalone and do not have a refresh rate.
QUALITY CONTROL PROCESSESAutomated process only allows quality data into reporting applications. Nielsen’s TV ingestion process handles quality control for NCS TV viewing.
MANAGING CONSUMER PRIVACYNCS does not receive any PII and has strict processes in place whenever a partner accidentally includes PII. All purchasing and viewing is completely anonymous within the walls of NCS.
MODEL VALIDATION All models are validated at the total-model level, as well as for key factors (e.g., frequency, creative), using a variety of goodness-of-fit metrics, as well as validating against synthetic or semi-synthetic datasets where the outcome is known.
OTHER MARKETING FACTORS INCLUDED? No. Experian audience characteristics are integrated.
OTHER NON-MARKETING FACTORS INCLUDED (E.G., WEATHER)? No.
OTHER MEDIA INCLUDED? Yes. Any medium with a sufficient HH level data overlap can be integrated into a Cross-Media Sales Effect Study.
METHOD FOR MATCHING OTHER DEPENDENT (OUTCOME) OR MEDIA DATAMatched via a third-party matching agent who households the data, removes PII, and matches itto NCS outcome data.
ADDITIONAL DATA IN THE MODEL

33
ONLINE SALES Yes. In Nielsen Sales Effect, offline sales from banks and credit. In MTA, collected via conversion pixel.
OFFLINE SALES Yes. In Nielsen Sales Effect, offline sales from banks and credit cards. In MTA, Liveramp integrates addressable offline channels (e.g., direct mail, catalog).
ONLINE TRAFFIC Yes. In MTA, data collected through pixels. Nielsen Sales Effect does not measure online traffic.
OFFLINE TRAFFIC Yes. In MTA, integrated user-level impressions from addressable channels, such as direct mail and SMS. Nielsen Sales Effect does not measure offline traffic/in-store visits.
BRAND METRICS (E.G., AWARENESS, CONSIDERATION, PURCHASE INTENT) Yes. In MTA, measured across addressable channels via pixels. Nielsen Sales Effect does not measure brand health metrics.
TV TUNE-IN No.
DEPENDENT (OUTCOME) VARIABLES:
LINEAR TV Yes. Via Nielsen’s TV panel and STB data. National only.
VOD No.
ADDRESSABLE TV Yes. Via direct match.
SHORT DIGITAL VIDEO VIEWED ON A COMPUTER OR MOBILE DEVICE Yes. Except YouTube. Mobile media providers must be Nielsen certified.
SHORT DIGITAL VIDEO VIEWED ON A CONNECTED TV No.
PREMIUM TV/VIDEO VIEWED ON A COMPUTER OR MOBILE DEVICE No.
PREMIUM TV/VIDEO VIEWED ON A CONNECTED TV No.
FORMS OF TV ANALYZED:
PRIMARY APPLICATION:
MEASURE THE ROI OF TELEVISION AND ITS COMPONENTS Nielsen can report ROAS. In MTA, clients can download performance and cost data to measure TV ROI and its components.
PROVIDE TACTICAL OPTIMIZATIONS (CREATIVE OR PLACEMENT) Yes. In Nielsen Sales Effect, TV’s impact on sales, sales drivers, audience segment and category sales are measured. In MTA, tactical optimizations at the network and geography level.
Network type (broadcast or cable), telecast/program, daypart, day, pod position, spot length, creative, brand and air date.
TV DATA GRANULARITY:
MEDIA UNITS
Day part, time of day, day of week.
TIME
DMA level or grouped into larger regions.
GEOGRAPHY
NielsenNielsen provides both MTA and standalone television attribution solutions.

DIMINISHING RETURNS INCLUDED IN ANALYSIS?No.
ADSTOCK INCLUDED IN ANALYSIS?No.
HALO INCLUDED IN ANALYSIS?No.
AUDIO/VIDEO CONTENT RECOGNITION ON MOBILE DEVICES No.
SET TOP BOXYes. Set Top Box data in combination with Nielsen panel data (7.5M).
AUDIO/VIDEO CONTENT RECOGNITION ON SMART TV No.
NIELSEN PANEL DATA Yes. 50,000 households.
AD OCCURRENCES Yes. Nielsen TV Panel AdIntel data.
SCALING DATA THROUGH DATA INTEGRATION OR LOOKALIKE MODELSYes. Through Nielsen Panel and STB data from providers.
PREFERRED TV DATA SOURCES: STATISTICAL, OR RULES-BASED, APPROACHES USED TO ESTIMATE TV LIFT ON KPISTest/control for Nielsen Sales Effect: Lift calculated for important metrics (e.g., spend/buyer). For MTA, a logistical regression model estimates the KPI lift over baseline, and proportionately distributes credit to all addressable channels and TV.
CONTROL GROUP SELECTION, IF APPROPRIATEControl group is matched to test group with weighting via Iterative Proportional Fitting on key purchasing and demographic characteristics. For MTA, a 20% holdout sample is used to validate the model.
TYPICAL MODEL CYCLE AND REFRESH TIMINGNielsen Sales Effect studies are point-in-time studies. For MTA, refresh is bi-weekly, with weekly or monthly optional. TV Attribution in MTA can measure KPI from seconds after ad airing up to 14 days after airing up to 24 days. 30 day data lag in UI.
QUALITY CONTROL PROCESSESNielsen’s TV and Radio data is currency-level quality; STB and RPD TV data are cross-checked with TV panel. Digital and mobile-in app tags are monitored throughout the campaign period. Data is screened for outliers. Ad occurrences come from Nielsen Ad Intel.
MANAGING CONSUMER PRIVACYAll data is non-PII. Transaction data is onboarded via third party. Credit/debit spend is appended anonymously to the onboarded universe in secure data environment.
MODEL VALIDATION Sales Effect Models, the fit between test and control groups is assessed based on bias/balance between groups and variance inflation due to weighting. MTA studies are validated for 13 dimensions using cross validation with a holdout of random weeks (typically 20%).
OTHER MARKETING FACTORS INCLUDED? No.
OTHER NON-MARKETING FACTORS INCLUDED (E.G., WEATHER)? No.
OTHER MEDIA INCLUDED? No.
METHOD FOR MATCHING OTHER DEPENDENT (OUTCOME) OR MEDIA DATANielsen Panel and set top box panelists are matched to credit card and debit card purchases at a household level using PII (zip11) via a secure third-party data onboarder.
ADDITIONAL DATA IN THE MODEL
BASELINE INCLUDED IN ANALYSIS?Yes. Nielsen Sales Effect uses a period prior to determine baseline for comparing unexposed and exposed groups before and after the campaign. MTA uses historic data to establish baseline.
INTERACTIONS INCLUDED IN ANALYSIS?No.
RESEARCH PROVIDED BY 34

35
ONLINE SALES No.
OFFLINE SALES No.
ONLINE TRAFFIC No.
OFFLINE TRAFFIC Yes. Placed measures 3 billion offline visits per month via a first party SDK operating in over 150 apps, and from additional bid stream sources.
BRAND METRICS (E.G., AWARENESS, CONSIDERATION, PURCHASE INTENT) Yes. Placed offers survey capabilities.
TV TUNE-IN No.
DEPENDENT (OUTCOME) VARIABLES:
LINEAR TV Yes. Via television ACR matched back to Placed panel and validated using surveys.
VOD No.
ADDRESSABLE TV Yes. Via addressable TV vendors (including DISH, DirecTV, Comcast and Spectrum).
SHORT DIGITAL VIDEO VIEWED ON A COMPUTER OR MOBILE DEVICE Yes. Via digital video data matched to Placed platform via device ID.
SHORT DIGITAL VIDEO VIEWED ON A CONNECTED TV Yes. Via connected TV digital video publishers with mobile ad IDs or Placed matching process.
PREMIUM TV/VIDEO VIEWED ON A COMPUTER OR MOBILE DEVICE Yes. Via digital video data matched to Placed platform via device ID.
PREMIUM TV/VIDEO VIEWED ON A CONNECTED TV Yes. Via connected TV digital video publishers with mobile ad IDs or Placed matching process.
FORMS OF TV ANALYZED:
PRIMARY APPLICATION:
MEASURE THE ROI OF TELEVISION AND ITS COMPONENTS No. No sales data. However, Placed's attribution clients use offline visitation and cost as lower-funnel return-on-objectives performance metrics.
PROVIDE TACTICAL OPTIMIZATIONS (CREATIVE OR PLACEMENT) Yes. Placed provides TV offline attribution data for campaign optimization decisions at the geographic, network, daypart, creative, spot length and program level. Ad occurence analysed by creative, network
and flight.
TV DATA GRANULARITY:
MEDIA UNITS
Daypart and day of week.
TIME
Placed Attribution provides a Geography Report for TV campaigns. The report can be viewed as heatmap or table, and can be broken out by market, state or region. The performance metrics available are Impression Index and Lift Index.
GEOGRAPHY
PlacedPlaced specializes in analysis of television's impact on foot traffic through geolocation measurement and provides standalone TV and Cross-channel (Digital + TV) measurement.

RESEARCH PROVIDED BY 36
AUDIO/VIDEO CONTENT RECOGNITION ON MOBILE DEVICES No.
SET TOP BOXYes. Millions of set top boxes, but the exact deployment footprint varies.
AUDIO/VIDEO CONTENT RECOGNITION ON SMART TV Yes. Inscape (~10M).
NIELSEN PANEL DATA No.
AD OCCURRENCES Yes. Kantar and client systems.
SCALING DATA THROUGH DATA INTEGRATION OR LOOKALIKE MODELSPrimarily SmartTV ACR, but can be deduplicated with other sources, when available.
PREFERRED TV DATA SOURCES: STATISTICAL, OR RULES-BASED, APPROACHES USED TO ESTIMATE TV LIFT ON KPISTest/control: lift in visits. after filtering for outliers. In MTA settings, conversions are fractionally attributed to impressions considering channel overlap.
CONTROL GROUP SELECTION, IF APPROPRIATEControl groups are created to match test group based on business visitation, demographics, operating system, geography, mobile apps installed and recent visitation.
TYPICAL MODEL CYCLE AND REFRESH TIMINGTV attribution reports are pre-processed and available right away. The data is refreshed monthly.
For new clients who want custom configuration, the average setup time is less than a day, or 1-2 weeks for MTA. Clients see their first report at the end of the month after the conversion window closes. The data is refreshed monthly.
QUALITY CONTROL PROCESSESAll third-party data is filtered, and only sensor data that passes this strict filtering process is used. TV ownership and exposure data is validated with first-party sources and by matching back to individuals.
MANAGING CONSUMER PRIVACYLinear TV exposure is collected from an opt-in set of households via Inscape. Placed first-party location data is collected via an opt-in process.
MODEL VALIDATION Location data is continuously validated at a visit level. First-party location data, as well as survey data from our first-party audience, is used to validate visitation behaviors.
OTHER MARKETING FACTORS INCLUDED? No.
OTHER NON-MARKETING FACTORS INCLUDED (E.G., WEATHER)? No.
OTHER MEDIA INCLUDED? Yes. Digital, Search and Out-of-Home.
METHOD FOR MATCHING OTHER DEPENDENT (OUTCOME) OR MEDIA DATAWe match TV exposure data into our platform using a combination of IP address data from TVs, TV on/off data, user location data and time at home data. This matching is validated using surveys into our first-party data. Outcomes are pulled from that new matched data. For MTA, other media data is matched in the Placed platform by using mobile advertising IDs, as well as cross-device cookie matching from partners.
ADDITIONAL DATA IN THE MODEL
ADSTOCK INCLUDED IN ANALYSIS?Yes. Time to First Visit helps advertisers understand the lag between exposure and conversion (store visit). A useful time dimension, but not the same as traditional Adstock decay curves.
HALO INCLUDED IN ANALYSIS?No.
BASELINE INCLUDED IN ANALYSIS?Yes. Test/Control.
INTERACTIONS INCLUDED IN ANALYSIS?No. Omni-channel measurement with MTA offers overlap analysis and optimizes TV and digital interactions. But the exclusion of other marketing and marketplace factors makes ROI estimation uncertain, and the inability to model revenue outcomes makes it impossible.
DIMINISHING RETURNS INCLUDED IN ANALYSIS?Yes. Optimal frequency report lift in visits at the different exposure frequencies.

37
ONLINE SALES Yes. Sourced directly from the client via pixel or through an API integration.
OFFLINE SALES Yes. Sourced directly from the client or through a preferred third-party vendor, such as IRI or Shopcom.
ONLINE TRAFFIC Yes. Sourced directly from the client via pixel.
OFFLINE TRAFFIC Yes. Sourced from preferred third-party vendors such as Cuebiq, Arbor, or 9th Decimal or client-preferred offline/location data source.
BRAND METRICS (E.G., AWARENESS, CONSIDERATION, PURCHASE INTENT) Yes. Via partnership with Kantar Millward Brown.
TV TUNE-IN Yes. Sourced from proprietary ACR technology installed in Smart TVs.
DEPENDENT (OUTCOME) VARIABLES:
LINEAR TV Yes. National and Local via Smart TV ACR.
VOD Yes. Via Smart TV ACR.
ADDRESSABLE TV Yes. National and Local via Smart TV ACR.
SHORT DIGITAL VIDEO VIEWED ON A COMPUTER OR MOBILE DEVICE Yes. Sourced directly from the client via pixel implementation.
SHORT DIGITAL VIDEO VIEWED ON A CONNECTED TV Yes. Via Smart TV ACR.
PREMIUM TV/VIDEO VIEWED ON A COMPUTER OR MOBILE DEVICE Yes. Sourced directly from the client via measurement API/SDK integration.
PREMIUM TV/VIDEO VIEWED ON A CONNECTED TV Yes. Via Smart TV ACR.
FORMS OF TV ANALYZED:
PRIMARY APPLICATION:
MEASURE THE ROI OF TELEVISION AND ITS COMPONENTS Yes. Samba TV provides ROI lift analysis, ROAS analysis or media efficiency analysis by network, creatives and platforms.
PROVIDE TACTICAL OPTIMIZATIONS (CREATIVE OR PLACEMENT) Yes. Insights into creative wearout, optimal media tactics, waste, and reach/frequency dynamics available.
Individual episode, ad occurrence.
TV DATA GRANULARITY:
MEDIA UNITS
Exact time of viewership.
TIME
DMA.
GEOGRAPHY
SambaSamba offers standalone TV and MTA measurement via ACR technology.

RESEARCH PROVIDED BY 38
AUDIO/VIDEO CONTENT RECOGNITION ON MOBILE DEVICES No.
SET TOP BOXNo.
AUDIO/VIDEO CONTENT RECOGNITION ON SMART TV Yes. Proprietary ACR in 14 global Smart TV Manufacturers (14.5M HHs).
NIELSEN PANEL DATA No.
AD OCCURRENCES
SCALING DATA THROUGH DATA INTEGRATION OR LOOKALIKE MODELSNo. Projections (weighed and balanced) are developed upon request.
PREFERRED TV DATA SOURCES: STATISTICAL, OR RULES-BASED, APPROACHES USED TO ESTIMATE TV LIFT ON KPISTest/control to measure ad lift, using Shapley values to allocate fractional credit; logistical and linear regressions for classifying and predicting.
CONTROL GROUP SELECTION, IF APPROPRIATESynthetic control group matches unexposed control HH to each exposed HH based on target group definition, viewing history and DMA.
TYPICAL MODEL CYCLE AND REFRESH TIMINGSamba TV’s attribution studies are able to support Weekly, Monthly, Quarterly, and custom reporting cycles. Samba TV’s viewership is refreshed internally in real-time.
QUALITY CONTROL PROCESSESSamba TV implements both statistical controls and proce-dural checks to identify potential anomalies within a study.
MANAGING CONSUMER PRIVACYSamba TV does not collect PII when a consumer opts-in. Samba TV does not receive PII from clients or third parties. In attribution studies, Samba TV applies a minimum cohort size to ensure that metrics sufficiently anonymize.
MODEL VALIDATION All models are cross-validated at the HH level.
OTHER MARKETING FACTORS INCLUDED? No. Audience characteristics are integrated: custom segments, both first and third party, call center data.
OTHER NON-MARKETING FACTORS INCLUDED (E.G., WEATHER)? No.
OTHER MEDIA INCLUDED? Yes. Digital and OOH media (from select OOH partners).
METHOD FOR MATCHING OTHER DEPENDENT (OUTCOME) OR MEDIA DATAMatch other media data via a pixel, measurement API, third-party match partner (e.g., Experian, Acxiom, Liveramp, Neustar), mobile ad id (idfa/aaid), or a direct match with Samba TV.
ADDITIONAL DATA IN THE MODEL
DIMINISHING RETURNS INCLUDED IN ANALYSIS?Yes. Diminishing returns in conversion by frequency.
ADSTOCK INCLUDED IN ANALYSIS?No.
HALO INCLUDED IN ANALYSIS?No.
BASELINE INCLUDED IN ANALYSIS?Yes. Test/control.
INTERACTIONS INCLUDED IN ANALYSIS?Yes. Consumer interaction with content such as “binge watchers,” or loyal watchers. MTA studies include interactions with digital.

39
HALO INCLUDED IN ANALYSIS?Yes. Depending on the source of conversion data.
BASELINE INCLUDED IN ANALYSIS?Yes. Parent brand halo.
INTERACTIONS INCLUDED IN ANALYSIS?Yes. Pre-campaign KPI levels provide the baseline.
ONLINE SALES Yes. Via sales tracking on online purchase pages or via e-tailer transaction files sourced directly or through a data onboarder.
OFFLINE SALES Yes. Sourced through frequent-shopper card data.
ONLINE TRAFFIC Yes. Via landing page tags.
OFFLINE TRAFFIC Yes. Through partnerships with geolocation data providers.
BRAND METRICS (E.G., AWARENESS, CONSIDERATION, PURCHASE INTENT) Yes. Sourced via surveys. Brand metrics can be linked to store visitation and purchased with retailer first-party transactions.
TV TUNE-IN Yes. For OTT tune-in via tags. For linear tune-in via STB data. For cross-platform TV tune-in via de-duped exposure data from proprietary graph of 75M households.
DEPENDENT (OUTCOME) VARIABLES:
LINEAR TV Yes. Via pixel tracking with STB or Smart TV exposure data.
VOD Yes. Via pixel tracking with STB or Smart TV exposure data. ADDRESSABLE TV Yes. Via pixel tracking with STB or Smart TV exposure data.
SHORT DIGITAL VIDEO VIEWED ON A COMPUTER OR MOBILE DEVICE No. Only PC/Mobile OTT apps.
SHORT DIGITAL VIDEO VIEWED ON A CONNECTED TV No. Only PC/Mobile OTT apps.
PREMIUM TV/VIDEO VIEWED ON A COMPUTER OR MOBILE DEVICE Yes.
PREMIUM TV/VIDEO VIEWED ON A CONNECTED TV Yes.
FORMS OF TV ANALYZED:
PRIMARY APPLICATION:
MEASURE THE ROI OF TELEVISION AND ITS COMPONENTS Yes. ROI provided on client request and availability of financial data. Control group matched purchase history salient audience characteristics.
PROVIDE TACTICAL OPTIMIZATIONS (CREATIVE OR PLACEMENT) Yes. Tactical recommendations provided for creative deployment, publisher placement, and target audience.
Tracks OTT publisher/app, and ad unit, aggregate for analysis based on client specs.
TV DATA GRANULARITY:
MEDIA UNITS
Second by second,
but clients rarely
request more granu-
larity than weekly.
TIME
Zip-code level, but typically client request DMAs or Total U.S.
GEOGRAPHY
TruOptikTruOptik offers OTT and other television analysis and attribution.
DIMINISHING RETURNS INCLUDED IN ANALYSIS?Yes. Response by exposure frequency is empirically derived at the HH level.
ADSTOCK INCLUDED IN ANALYSIS?No.

RESEARCH PROVIDED BY 40
AUDIO/VIDEO CONTENT RECOGNITION ON MOBILE DEVICES No.
SET TOP BOXYes. Through partnerships with STB data providers.
AUDIO/VIDEO CONTENT RECOGNITION ON SMART TV Yes. Through relationships with Smart TV data providers.
NIELSEN PANEL DATA No.
AD OCCURRENCES Yes. Pixel tags synced to proprietary 75MM+ OTT Household Graph that synchs all streaming devices to a persistent anonymized household identifier.
SCALING DATA THROUGH DATA INTEGRATION OR LOOKALIKE MODELSNo. TruOptik's OTT ad-exposure data is census level; no need for lookalike modeling.
PREFERRED TV DATA SOURCES: STATISTICAL, OR RULES-BASED, APPROACHES USED TO ESTIMATE TV LIFT ON KPISPre-post/test control experimental design. Use ANCOVA for offline purchase and location-based attribution studies to isolate TV ad effects.
CONTROL GROUP SELECTION, IF APPROPRIATEAll test and control consumers are proven OTT viewers. Control group is matched to test group on dependent variable and related criteria (e.g., advertised brand purchase/share of requirements, category purchase for CPG; in-market for similar vehicle for Auto). We also control for salient audience characteristics (e.g., location/DMA, demos, shopping patterns). RIM weighting on salient dimensions is used to strengthen test/control match if needed.
TYPICAL MODEL CYCLE AND REFRESH TIMINGDaily. Timing varies, from near real-time for straight-up “conversion” based on digital behavior to 4 weeks for studies involving third-party data providers (linear tune-in, offline purchase) or advanced analytics.
For studies involving advanced analytics, such as sales effect modeling and cross-media attribution, update frequency is based on client needs. 30-day refresh cycle is the most rapid we’ve encountered; 90 days or longer is more typical.
QUALITY CONTROL PROCESSESOTT is bot-free, with nearly 100% viewability and ad-comple-tion rates. Tru Optik measures 100% of ad impressions across all OTT screens, devices and operating systems. We test tracking pixel installation and configuration pre-campaign to ensure proper firing and data capture. We update our Household Graph continuously and refresh it every 24 hours to maintain accurate mapping of devices to households.
Third-party data projections are calibrated to Census or other gold standards to adjust for OTT viewing levels by market and audience characteristics. Offline sales projections factor in brand/category development and retail coverage.
MANAGING CONSUMER PRIVACYTru Optik has clear consumer opt-out mechanisms, masks all PII and is transparent regarding the data we collect and how it is used. We do not collect any PII and do not accept external files containing PII. External files that contain PII are processed by a data onboarder. Tru Optik operates OptOut.TV, a one-stop OTT-wide solution for HHs who do not want to receive interest-based or behaviorally-targeted OTT advertising.
MODEL VALIDATION Every model is valdated, consistent with the deliverable, using holdout samples.
OTHER MARKETING FACTORS INCLUDED? No. However, can incorporate digital ad exposure and reconcile with OTT exposure at the household level.
OTHER NON-MARKETING FACTORS INCLUDED (E.G., WEATHER)? No.
OTHER MEDIA INCLUDED? No.
METHOD FOR MATCHING OTHER DEPENDENT (OUTCOME) OR MEDIA DATAOTT household identifiers are matched to “other TV” identifiers directly by client (advertiser or publisher), by Tru Optik, or through a third-party onboarder. All TV ad-exposure data is census-level direct measure-ment. Outcomes are matched at the device level via our proprietary Household Graph. For campaigns with non-OTT TV, we use a data onboarder. For survey measures, we use survey platforms to recruit ad-exposed consumers for continuous post-campaign measurement and granular subgroup analysis.
ADDITIONAL DATA IN THE MODEL

41
ONLINE SALES Yes. Via proprietary tracking.
OFFLINE SALES Yes. Sourced directly from the client.
ONLINE TRAFFIC Yes. Via proprietary tracking.
OFFLINE TRAFFIC Yes. For phone and SMS, not for in-store retail tracking.
BRAND METRICS (E.G., AWARENESS, CONSIDERATION, PURCHASE INTENT) No.
TV TUNE-IN No.
DEPENDENT (OUTCOME) VARIABLES:
LINEAR TV Yes. National and local and local cable.
VOD Yes.
ADDRESSABLE TV Yes. But not yet on general release.
SHORT DIGITAL VIDEO VIEWED ON A COMPUTER OR MOBILE DEVICE Yes. Click-through and view-through.
SHORT DIGITAL VIDEO VIEWED ON A CONNECTED TV No.
PREMIUM TV/VIDEO VIEWED ON A COMPUTER OR MOBILE DEVICE Yes. Click-through and view-through.
PREMIUM TV/VIDEO VIEWED ON A CONNECTED TV Yes.
FORMS OF TV ANALYZED:
PRIMARY APPLICATION:
MEASURE THE ROI OF TELEVISION AND ITS COMPONENTS No. Focused primarily on online activation to support tactical optimization rather than ROI measurement.
PROVIDE TACTICAL OPTIMIZATIONS (CREATIVE OR PLACEMENT) Yes. Generates buy recommendatons from anticipated impact of ad by response and spend.
Occurrences.
TV DATA GRANULARITY:
MEDIA UNITS
Exact time.
TIME
ZIP code.
GEOGRAPHY
TV SquaredTV Squared offers hybrid TV attribution—using both probabilistic and deterministic data for standalone TV measurement.

RESEARCH PROVIDED BY 42
AUDIO/VIDEO CONTENT RECOGNITION ON MOBILE DEVICES Yes. Currently in beta.
SET TOP BOXYes. Currently in beta.
AUDIO/VIDEO CONTENT RECOGNITION ON SMART TV No.
NIELSEN PANEL DATA No. Can be activated upon request.
AD OCCURRENCES Yes. Post logs or in-house tracking through ACR.
SCALING DATA THROUGH DATA INTEGRATION OR LOOKALIKE MODELSYes. Combine mobile ACR, STB and client-provided logs (based on overlap); lookalike models are created based on the demographic profile of TV responders from impression-level data.
PREFERRED TV DATA SOURCES: STATISTICAL, OR RULES-BASED, APPROACHES USED TO ESTIMATE TV LIFT ON KPISHybrid approach using both occurrence data and HH level exposure data. Test/control design for lift vs. base. Response curves and patterns are used to define probabilistic rules for spot-level attribution. Regression models for the adstock and longer-term, indirect impact of TV. Filter out HHs not likely to have been influenced by TV.
CONTROL GROUP SELECTION, IF APPROPRIATEControl group based on similarity to exposed group.
TYPICAL MODEL CYCLE AND REFRESH TIMINGData refresh timing depends on data sources. Automatic updates occur as frequently as data is provided; results can be provided daily.
QUALITY CONTROL PROCESSESImpression data is validated for control group robustness, detection of outliers (i.e., if a STB may be on, but the TV may not be) and device matching. Weighting factors are applied to overcome demographic bias in data samples.
MANAGING CONSUMER PRIVACYTVSquared does not process PII. We use a third-party onboarder such as Experian or LiveRamp. Data is matched to website behavior, usually using cookies. The company adheres to defined security and privacy policies for information security, data classification, data retention and destruction and encryption.
MODEL VALIDATION Ongoing comparison of high-level results amongst other proprietary models.
OTHER MARKETING FACTORS INCLUDED? No. Audience chracteristics integrated from Liveramp and Epsilon.
OTHER NON-MARKETING FACTORS INCLUDED (E.G., WEATHER)? Yes. Seasonality and holiday periods.
OTHER MEDIA INCLUDED? Yes. Digital click-through tracker (social, affiliates, digital campaigns, email, search).
METHOD FOR MATCHING OTHER DEPENDENT (OUTCOME) OR MEDIA DATAURLs for referrals; timestamps to match media data. Depending on the data source, outcome data is matched by IP address or LiveRamp ID matching.
ADDITIONAL DATA IN THE MODEL
ADSTOCK INCLUDED IN ANALYSIS?Yes. WIth a persistent ID, response following each spot is tracked to establish adstock. Where a persistent ID is unavailable, adstock is based on regression models.
HALO INCLUDED IN ANALYSIS?No.
BASELINE INCLUDED IN ANALYSIS?Yes. By stripping out all non-TV-driven activity. The baseline is not a single figure, it’s a continually moving and adjusting smooth curve that produces a separate value for every minute of every day in response to marketing activity, time of day, seasonality and other factors.
INTERACTIONS INCLUDED IN ANALYSIS?Yes.
DIMINISHING RETURNS INCLUDED IN ANALYSIS?Yes.

43
Web/Wikipedia-Sourced, Sequent Partners Adapted
A/B TestingA controlled experiment involving two variables. Used extensively in digital to optimize messaging performance. It is essential that all contextual factors, audience, content environment, time, etc. be perfectly matched to isolate the comparative effect of A versus B.
Addressable TV Television technology platform able to serve different targeted ad content to different audience segments watching the same linear TV program on Internet-enabled TVs and set top boxes in live, playback or VOD mode.
AdstockTerm coined by Simon Broadbent to describe the prolonged or lagged effect of advertising on consumer purchase behavior. It’s an essential model specification for capturing the full extent of advertising’s contribution.
Agent-Based Models Model for simulating the actions and interactions of autonomous agents (e.g., consumers) with a view toward assessing the effects of causal factors (e.g., advertising) on their behaviors (e.g., purchasing) and the system as a whole (e.g., market). Provides explanatory insight into the collective behavior of agents following known behavior patterns (e.g., repeat purchase distributions) or simple rules (e.g., average purchase size).
Algorithm Procedure or formula for solving a problem, based on conducting a sequence of specified calculations or steps. For example, a media optimizer uses an algorithm to sequentially add the next best medium to the plan.
Attribution The statistical method of assigning credit to the media stimuli consumers encounter along the path to “conversion”—taking action, sales, etc.—a “bottom up,” consumer-and transaction-level model.
Baseline/Incrementality In modeling, sales that would have occurred without any marketing efforts are considered base sales. Incrementality reflects the sales lift associated with media/marketing stimuli. Important to distinguish between the two to avoid misattributing to a medium, the value of sales that would have occurred naturally. Not measureable, this is a model inference.
Bayesian Priors In Bayesian statistics, a prior probability distribution—often simply called the prior—of an uncertain quantity is the probability distribution that would express one's beliefs about this quantity before some evidence is taken into account. This enables facts taken from other sources to be imposed on a model. It also enables a model to work with data sources of different levels of granularity.
Behavioral EconomicsStudy of the effects of psychological, social, cognitive, and emotional factors on the economic decisions of individuals and the consequences for market prices, returns, etc.
CollinearityA condition in which some of the independent variables are highly correlated; a linear relationship exists between two explanatory variables. Results in an inability to tease out the effects of either variable, as in television flight running the same time as a digital campaign.
Covariate ControlsAny method for statistically removing the effects of contextual variables from the variables being evaluated. This could be as simple as analyzing two groups separately (e.g., deal-prone vs. full-price consumers) or more complex—fitting a multivariate model and adjusting dependent variable estimates to simulate the average, not actual, level of the covariates.
Cross-Channel AttributionThe process of assigning credit to the touchpoints consumers encounter along the path to conversion, when all touchpoints, online and offline are included. Sometimes driven by “rules” or algorithms that arbitrarily assign credit to one touchpoint. More often by statistical models that infer the contribution of each touchpoint to conversion, (e.g., traffic or sales). When only online touchpoints are included, Multi-Touch Attribution is a more descriptive name.
Cycle TimeThe period required to complete one cycle of a modeling operation (i.e., ingesting new data, refitting the model and providing an updated evaluation of campaign performance). Data MatchingThe task of identifying, matching and merging records that correspond to the same entities, typically households, or devices, from several databases using a device graph based on personally identifiable information, IP Addresses, etc. (See Device Graph)
Glossary

RESEARCH PROVIDED BY 44
Dependent Variable The variable to be predicted by the model (e.g., sales).
Device GraphsA Device Graph (Identity Graph) is a database that stores all identifiers that correlate with individual devices, households or consumers. These identifiers include: device IDs, IP addresses, usernames, email, cookies, street addresses, loyalty card numbers, and more. Device graphs are the backbone for data matching.
Device IDsA distinctive number associated with a smartphone or other mobile device. Device IDs are separate from hardware serial numbers. Important in data matching and assigning devices to households or individuals.
Digital VideoDigital video is video content delivered via the Internet, such as programs, short videos and ads run across publisher sites, as well as social media (including Facebook and YouTube). Typically viewed on PCs, laptops, tablets and via mobile phones.
Diminishing ReturnsThe saturation effect where sales increases reach a limit after which each additional advertising dollar has a decreasing incremental effect and, eventually, reaches a ceiling with near zero incremental effect.
Discrete Choice Model of choices customers make between products or services. By identifying patterns in these choices, models predict how different consumers respond to competing products. Allows marketers to examine the share impact of pricing, service bundling, etc., on different classes of customers.
EconometricsStatistical models used in econometrics that specifies the statistical relationship between variables. (See also Regression)
Exposed vs. UnexposedCommonly used approaches for measuring ad effectiveness in which the subsequent behavior of individuals exposed to an ad is compared to individuals not exposed to the ad. Due to collinearity and the effect of unobserved contextual variables, this approach does not necessarily reveal whether or not ads have a causal effect on outcomes such as purchases and site visits. (See A/B testing)
External InfluencesFactors that occur entirely beyond the marketers control, but exert influence on the way advertising in a particular category behaves. For instance, weather, consumer confidence, gas prices, etc. (also known as Exogenous factors).
First-Party DataLoosely defined, first-party data is information owned and collected by one entity from a group of people with whom they have a relationship. Could be directly from a panel, audience or CRM (customer relationship marketing) data. Typically appended with third-party data, publicly available or behavioral data.
Game TheoryUsed to fairly distribute credit or value to each individual player/participant. Game theory attribution assigns (with the help of algorithms) each touchpoint fair credit for a conversion based on their true contribution.
GranularityThe level of detail considered in a model. The greater the granularity, the deeper the level of detail and potential for actionable insight. Granularity can also be a solution for collinearity.
Hierarchical BayesianA statistical modeling technique that enables a multi-layered approach (e.g., an upper branding model that identifies consumer preferences and a lower conversion model where brand preference is one of the causal factors).
Holdout SamplesSample of observations withheld from the model fitting process. Model predictive validity can be estimated by its ability to predict the data. Sometimes the holdout is chosen for convenience, but a mixture of random and designed holdouts (to provide a set of specific situations) is preferred.
Independent VariablesThe variables that, in combination, predict the dependent, or outcome, variable (e.g., sales). They represent the causal factors that drive the outcome variable.
IP AddressA unique string of numbers that identifies each connected device (e.g., smartphones, tablets, television sets) using the Internet protocol to communicate over the Internet. Useful when IP addresses are static, for matching data to households for targeting purposes. But when IP addresses are dynamically assigned, they do not provide persistent identities.
Linear Television Traditional television programming that follows a schedule. Typically includes live viewing and time shifting via DVR and VOD that includes the same ad load as the live telecast.
Logit Models A regression model where the dependent variable is categorical (e.g., brand chosen) at the person/HH level. This is the classical statistical model for individual person/ HH transaction data.

45
Long-term EffectsCumulative effect of advertising on consumers’ brand choice behavior, lasting over several years. Measures of loyalty to a brand or consideration set of brands. It can also reflect customer lifetime values. Lacks consistent definition and, in some cases, long-term effects of digital advertising are measured on a “next quarter” basis.
Lookback WindowsDefines a time span during which advertising is analyzed prior to a conversion. The period of time the model “looks back” at the ad exposures that may have contributed to a conversion.
Machine Learning An application of artificial intelligence (AI) that provides systems the ability to automatically learn and improve from experience without being explicitly programmed. In its current rudimentary form, multiple modeling techniques are assembled in a framework. The framework determines which model, or combination of models, best fits the historical data.
Market Level ANCOVAAnalysis of covariance. Isolates the effect of a potential causal categorical factor (e.g., an ad exposure) on a dependent outcome variable (e.g., purchase), while statistically controlling for the effects of other continuous variables that are not of primary interest (e.g., price), known as covariates.
Media Interactions and HalosDegree to which media enhance or detract from each other’s effects—coordinated, sequenced for maximum performance. Often called synergies.
Marketing Mix ModelsModels involving the application of regression and other statistical approaches to estimate the impact of marketing elements on incremental sales. Historical data is used to fit the model, which then can be used for prediction of future outcomes (e.g., sales). They assess the effectiveness of spending by channel over and above a baseline of sales that would have occurred without any marketing efforts. Often called “Top Down” models. These models explain a high proportion of the variance in sales and typically include explanatory factors like seasonality, competitive activities, and trade and consumer promotion. They are most frequently used to inform budget allocation across channels.
Multi-Touch Attribution The process of assigning credit to the touchpoints consumers encounter along the path to conversion. Sometimes driven by “rules” or algorithms that arbitrarily assign credit to one touchpoint. More often by statistical models that infer the contribution of each touchpoint to conversion (e.g., traffic or sales). In practice, MTA most often refers to digital touchpoints and is used to compare the impact of digital
vehicles. When online and offline touchpoints are included, Cross-Platform Attribution is a more descriptive name.
Other Marketing VariablesAspects of product marketing besides media and advertising that drive sales. Price, promotion, product features, in-store variables, competitive trade deals and impact provide the full picture of marketplace pressure and consumer response. Models that do not include these factors fail to provide a holistic view and implicitly overstate the contribution of advertising.
Other Non-Marketing Data Non-marketing data typically includes outside variables that influence category sales such as seasonality, weather, consumer confidence, fuel prices, holidays, etc.
Other Media DataThe inclusion of all media used in a particular campaign in the models, including addressable and non-addressable, online and offline media, traditional and non-traditional media. Important for determining the correct contribution of television or digital relative to the performance of other media in the mix.
OTT“Over-the-top,” a term used to describe the delivery of premium programming (i.e., full program episodes, games or films) delivered over the Internet to either a Smart TV or computer/mobile device. Subscriptions to traditional cable or satellite services are not required.
PrivacyProtections and security level of personal data published via the Internet. It is a broad term that refers to a variety of factors, techniques and technologies used to protect sensitive and private data, communications and preferences.
Random Control TestsPopular in digital analytics but an elemental research approach involving creating random test and control groups as a way of determining the behavioral lift (e.g., visits, conversions) associated with exposure to a specific campaign. The estimation of the measured effect is only as good as the controls associated with assigning subjects to each exposed vs. unexposed condition.
Refresh TimeMaximum time interval between the original attribution model and updates with new data. Models are typically refreshed daily, monthly, quarterly or run continuously. The same as cycle time.
RegressionA broad set of statistical techniques for estimating the relationships among variables. Helps determine how the typical value of the dependent variable (e.g., sales, conversions, etc.) changes when any one of the independent

RESEARCH PROVIDED BY 46
variables (media weight, media mix) is varied, while the other independent variables are held fixed. Developed in the early 19th century for astronomy, it has been used extensively by marketers for predicting and forecasting sales outcomes for over 30 years.
ROIReturn on Investment—a measure of profitability based on the incremental sales generated by advertising (or other marketing factor) in relation to its cost. Used to determine the value of advertising. Specifically a financial term, ROI represents the ratio between a marketer’s net profit from that investment and the cost of an advertising campaign (or media element within the plan).
Safe Haven MatchesThird-party services that use their proprietary Device Graph to match first-party advertiser data (e.g., CRM data) and other partners’ data, by scrubbing out anything that personally identifies end users (personally identifiable information—PII) and replacing it with a generic but unique ID to use in multiple marketing applications. (See Device Graph).
Set Top Box A device from a cable or satellite television service that allows the service to be viewed. In media research, this data is used to passively measure viewing. The set top box output, called return-path data, is TV tuning data identifying when and to what channel the set is tuned, which must then be matched with a content library in order to determine what program the set was tuned to.
Smart TV A digital television that is an Internet-connected, storage- aware computer specialized for entertainment. Smart TVs are available as stand-alone products, but regular televisions can also be made “smart” through connected devices and set-top boxes that enable advanced functions.
SVODSubscription video on demand. Subscription-based services such as Netflix, Amazon and Hulu that give users unlimited access to a wide range of programs for a monthly flat rate.
Tactical Optimization The process of assessing and re-allocating advertising to the medium, publisher, daypart or program that produces the greatest response. This process can also be used to optimize the mix of creative executions and consumer target audiences. Can occur daily or less frequently, but tends not to be based on ROI.
Third-Party DataAny information collected by an entity that does not have a direct relationship with the user the data is being collected on. Oftentimes, third-party data is generated on a variety of websites and platforms and is then aggregated together by a third-party data provider such as a DMP.
TV Tune-inThe degree to which viewers tune into a particular program after exposures to network program-specific promotions.
Unified ModelsRelatively new statistical approach for integrating strategic marketing mix and tactical digital analytics into a holistic model. Considered best practice in theory; generally involves broader marketing mix model results being applied as constraints for highly granular digital outcomes. Complicated by lack of standard approaches.
ValidationA measure of the accuracy and precision of modeled results. There are two common and complementary approaches. Goodness of fit (MAPE: Mean Average Percent Error, or R2: percent of variance explained) describes how well the model replicates the historical data to which it was fit. Predictive validity: The same statistics can be used to evaluate how well a model replicates hold-out, or future data not used in the orginal model fitting process. In essence, the extent to which modeled results are well-founded and correspond accurately to real-world results.

RESEARCH PROVIDED BY