s4/s4e family of solid state meters instruction/technical
TRANSCRIPT

Document No.: 011808-03 Date: 07/26/201
E650 S4x
Family of Commercial and Industrial Meters Instruction/Technical Manual

B
Document Number: 10142014-01 Revision: 0 Information in this document is subject to change without notice. No part of this document may be reproduced or transmitted in any form or by any means, electronic or mechanical, for any purpose without the express written permission of Landis+Gyr Inc. 2014 Landis+Gyr Inc All rights reserved. For further information, contact: Landis+Gyr Inc 2800 Duncan Road Lafayette, IN 47904 USA Tel. 765-742-1001 or 800-777-2774 Fax 765-742-0936 Web: http://www.landisgyr.com/na/en/pub/index.cfm

C
Document History Title: E650 S4x Solid State Meter Instruction/Technical Manual Document Number: 10142014-01 Revision Date Description Level Issued Original 10/14/2014 Initial Issue Revision 0
D
Table of contents
1 THE E650 S4X ................................................................................................. 1
1.1 The E650 S4x Universal Meter ................................................................. 2
1.2 ServiceScan Automatic Meter Service Type Recognition ........................ 2
1.3 GyrBox Installation Diagnostics .............................................................. 3
1.4 Software and Software Upgrades ............................................................ 3
1.5 Inputs / Outputs ...................................................................................... 3
1.6 Communications ...................................................................................... 3
1.7 Provisions for AMI Integration: ............................................................... 3
1.8 Advanced Feature Sets ............................................................................ 4
1.8.1 Expanded Load Profile of 1Meg Bytes ........................................................ 4
1.8.2 Dual Recorder Option ............................................................................... 4
2 APPLICATION INFORMATION ........................................................................ 4
2.1 Available Meter Forms by Base and Class ............................................... 4
2.2 Installation Procedures ............................................................................ 4
2.3 Battery Installation (for TOU and Load Profile applications) ................. 4
2.3.1 Battery Carryover Time ............................................................................ 5
3 OPERATING INSTRUCTIONS .......................................................................... 5
3.1 Overview of Electronic Hardware ............................................................ 5
3.1.1 LCD Display ............................................................................................. 5
3.1.2 Special Display Identifiers ......................................................................... 6
3.2 Switches ................................................................................................... 6
3.2.1 User Interface Switches ............................................................................ 7
3.2.2 Internal Switch & Sensor .......................................................................... 8
3.3 Optical Port/ Calibration LED .................................................................. 8
3.4 Programmable Outputs/Inputs ............................................................... 8
3.5 Initial Power-Up and Operation .............................................................. 8
3.5.1 Unprogrammed Displays .......................................................................... 8

E
3.5.2 Programming Equipment .......................................................................... 9
3.5.3 Manual Loading of Service Type ............................................................... 9
3.6 Accessing the Display Modes ................................................................... 9
3.6.1 Normal Display Sequence ......................................................................... 9
3.6.2 Alternate Display Sequence ...................................................................... 9
3.6.3 GyrBox Display Sequence ......................................................................... 9
3.7 Test Mode Sequence .............................................................................. 10
3.7.1 Using 1132 Com .................................................................................... 10
3.8 Scroll Modes ........................................................................................... 11
3.8.1 Auto-scroll Mode .................................................................................... 11
3.8.2 Manual Scroll Mode ................................................................................ 11
3.8.3 Scrolling in the Alternate Display Sequence ............................................. 11
3.8.4 Scrolling in the GyrBox Mode .................................................................. 11
3.9 Test Mode ............................................................................................... 11
3.10 Test Mode Display ............................................................................... 11
3.11 Actions upon Entering Test Mode ....................................................... 11
3.12 Action upon Exiting Test Mode ........................................................... 12
3.13 Test Mode Demand Functions ............................................................ 12
3.14 Operation of Outputs during Test Mode ............................................. 12
3.15 Miscellaneous Functions During Test Mode ....................................... 12
3.16 Test Mode Time-out ............................................................................ 12
4 GYRBOX OPERATION .................................................................................... 12
4.1 Overview of GyrBox ............................................................................... 12
4.1.1 ServiceScan: Service Recognition and Verification ................................... 13
4.1.2 Service Scan Displays ............................................................................. 13
4.1.3 Programmable Service Types .................................................................. 13
4.1.4 GyrBox Activation ................................................................................... 13
4.2 Methods for entering GyrBox................................................................. 13

F
4.2.1 Digital Power Indicator (DPI) during GyrBox Activation ............................ 13
4.2.2 Display Format and Reference ................................................................ 14
4.2.3 GyrBox Display List ................................................................................ 14
4.2.4 Diagnostic Counters ............................................................................... 15
4.2.5 Diagnostic Check Display Options ........................................................... 15
4.3 Diagnostic Checks .................................................................................. 15
4.3.1 D1 Voltage Phase Angle (Polarity and Cross-phase) ................................ 15
4.3.2 D2 (Phase Voltage Deviation Check) ....................................................... 15
4.3.3 D3 (Inactive Phase Current Check) ......................................................... 15
4.3.4 D4 (Phase Angle Displacement Check) .................................................... 16
4.3.5 D5 (Voltage Imbalance Detect) ............................................................... 16
4.3.6 D6 (Current Magnitude Imbalance Check) ............................................... 16
4.3.7 D7 (Energy Polarity Check) ..................................................................... 16
4.4 Normal phase angles.............................................................................. 17
4.4.1 3-Wire Network Service .......................................................................... 17
4.4.2 3-Wire Delta Service .............................................................................. 17
4.4.3 4-Wire Wye Service ................................................................................ 18
4.4.4 4-Wire Delta Service .............................................................................. 21
4.5 Common sources for diagnostic alerts .................................................. 23
4.6 Loss of Potential on Any Phase (Diagnostic 1 & 2) ............................... 23
4.7 CT’s Reversed, Current Flowing in Wrong Direction. ............................ 24
5 EVENTS AND LOGS AVAILABLE IN THE E650 S4X ....................................... 27
5.1 Manufacturers (dedicated) Events: ....................................................... 27
5.2 Optional Events (can be enabled or disabled)....................................... 28
5.3 The Audit Trail (Audit Log) .................................................................... 30
6 DEMAND METERING ..................................................................................... 30
6.1 DEMAND TYPES ...................................................................................... 31
6.1.1 Maximum (Indicating) demand ............................................................... 31
6.1.2 Cumulative demand ............................................................................... 31

G
6.1.3 Continuous cumulative demand .............................................................. 31
6.1.4 Three Highest Demands ......................................................................... 31
6.1.5 Demand (Billing Period) Reset ................................................................ 31
6.1.6 Rolling, Demand Reset Type I ................................................................ 32
6.1.7 Rolling, Demand Reset Type II ............................................................... 32
6.2 Demand Reset Methods ......................................................................... 32
6.2.1 Manual Method ...................................................................................... 32
6.2.2 Software Method ................................................................................... 32
6.2.3 Power on demand delay timing ............................................................... 32
7 TOU METERING ............................................................................................. 32
7.1 TOU without Battery .............................................................................. 32
7.2 “Stand-By” mode ................................................................................... 33
7.3 Stand-By Mode in Practice ..................................................................... 33
8 MAIN CLOCK ................................................................................................. 33
8.1 Time Display Format .............................................................................. 33
8.2 Date Display Format .............................................................................. 33
8.3 Date and Time Setting ........................................................................... 33
8.4 Daylight Savings Time ........................................................................... 34
8.5 Time On Carryover ................................................................................. 34
9 PROGRAMMABLE DATES AND SCHEDULES .................................................. 34
9.1 Programmable Dates ............................................................................. 34
9.2 Seasonal Rate Changes .......................................................................... 34
9.3 TOU Daily Schedules .............................................................................. 35
9.4 Day Select for Schedules........................................................................ 35
9.5 Load Control/TOU Switchpoints ............................................................ 35
9.6 Rate Indicator Outputs .......................................................................... 35
9.7 Load Profile ............................................................................................ 35
9.7.1 Load Profile Memory Capacity ................................................................. 35

H
9.7.2 Upgrade of Load Profile Memory ............................................................. 35
9.7.3 Load Profile Interval Length with Single Load Profile ................................ 35
9.7.4 Load Profile Recording Channels ............................................................. 36
9.7.5 2nd Load Profile Option (Dual Recorder) .................................................. 37
9.7.6 Load Profile Engineering Units ................................................................ 37
9.7.7 Load Profile Status Flag .......................................................................... 37
9.8 Long Outage Detection .......................................................................... 38
9.9 Real Time Billing .................................................................................... 38
10 MASTER RESET ............................................................................................. 38
10.1 Performing a master reset optically using 1132Prog/1132Com....... 38
10.2 Performing a master reset manually using switches ........................ 38
10.3 Cold Starts........................................................................................... 38
10.3.1 Method 1, Optical Cold Start ................................................................... 38
10.3.2 Method 2, Manual Cold Start .................................................................. 38
11 MANUAL UNLOCK PROCEDURE .................................................................... 39
12 ANSI TYPE II OPTICAL COMMUNICATIONS PORT ...................................... 39
12.1 Security ............................................................................................... 39
12.1.1 Optical Port Lock-Out Feature (Gridstream feature only) .......................... 40
12.1.2 Magnetic / DC Detection / Hall Effect Switch ............................................ 40
12.1.3 Tilt Tamper Detection............................................................................. 40
12.1.4 E650 S4x ANSI Security Information ....................................................... 40
13 VOLTAGE QUALITY INFORMATION .............................................................. 41
13.1 Sag Information .................................................................................. 41
13.2 Swell Information ............................................................................... 41
13.3 Voltage Sag Alert ................................................................................ 41
13.4 Voltage Swell Alert ............................................................................. 41
13.5 Instantaneous Readings ..................................................................... 41
13.6 Self-Reads ........................................................................................... 42
13.6.1 Self-Read Data....................................................................................... 42
I
13.6.2 Number of Self-Reads ............................................................................ 43
13.6.3 Self-Read Displays ................................................................................. 43
14 OUTPUTS, INPUTS, AND COMMUNICATIONS .............................................. 44
14.1 Output Cables and Connectors ........................................................... 44
14.2 Inputs 1 and 2 ..................................................................................... 45
14.2.1 Real-Time Communication Links ............................................................. 45
14.2.2 External Load Profile Inputs .................................................................... 45
14.3 Output Relays 1-4 ............................................................................... 46
14.3.1 KYZ Pulse Outputs ................................................................................. 46
14.3.2 8.3.2 KYZ Pulse Constant as kWh ........................................................... 47
14.3.3 TOU Load Control (LC) ........................................................................... 47
14.3.4 End of Interval Output (EOI) .................................................................. 47
14.3.5 Demand Threshold Alerts (DTA) ............................................................. 47
14.3.6 Power Factor Threshold Alerts (PFTA) ..................................................... 48
14.3.7 Voltage Threshold Alerts (VTA) ............................................................... 48
14.3.8 Diagnostic Alerts (GTA) .......................................................................... 48
14.3.9 Operation of Outputs During Test Mode .................................................. 48
14.4 Electrical Specifications for KYZ Boards (absolute maximums) ........ 48
14.4.1 Output Relays 1-4 (See Figure 8.3 in Section 8.3 for the suggested KYZ output connection) ......................................................................................................... 48
14.4.2 Inputs 1 and 2 ....................................................................................... 48
14.5 Optical Port Communications ............................................................. 48
14.6 RS-232/RS-485 Communications Board ........................................... 48
15 TROUBLESHOOTING AND ERROR CODES .................................................... 49
15.1 Error Codes ......................................................................................... 49
15.1.1 Non-Scrolling errors ............................................................................... 49
15.1.2 Scrolling errors ...................................................................................... 49
15.2 Unprogrammed Register Error (Error S00) ........................................ 52
15.3 Configuration Error (Error S01) .......................................................... 52
J
15.4 Memory/Load Profile Errors: .............................................................. 52
RAM Error, S03 ............................................................................................. 52
ROM Error, S04 ............................................................................................ 52
Non-Volatile Memory Error, S05 ..................................................................... 53
15.5 Clock Error (S06) ................................................................................ 53
15.6 Measurement Diagnostics Failure (Error S07) ................................... 53
15.7 Low Battery Error (Error S08) ............................................................ 53
15.8 Demand Overload Error (S10) ............................................................ 53
15.9 Power Failure Error (S11) ................................................................... 53
15.10 Tamper Detect Error (S12) ................................................................. 53
15.11 Demand Overload Errors (Errors M16 through M31) ........................ 54
15.12 Stuck Switch Error (Error M05) .......................................................... 54
15.13 Phase Errors: ....................................................................................... 54
15.14 Disabling Display of Error Codes ........................................................ 54
16 MEASUREMENT TECHNIQUES ...................................................................... 55
16.1 Metric Calculations ............................................................................. 55
16.1.1 Pulse Values and Energy Metrics ............................................................. 55
16.2 Digital Implementation ...................................................................... 55
17 OVERVIEW OF E650 S4X IMPLEMENTATION ............................................... 55
17.1 Input Circuitry .................................................................................... 55
17.2 Sampling Rate ..................................................................................... 56
17.3 Register Section .................................................................................. 56
17.4 Negative Energy Metric ...................................................................... 56
17.5 Security (Add) Mode ........................................................................... 56
17.6 Detent (Ignore) Mode ........................................................................ 56
17.7 Net Mode ............................................................................................. 56
18 REACTIVE METRICS IN THE E650 S4X METER ............................................. 56

K
18.1 VArms, VARrms, kVAR Phasor, and kVA Phasor measurements ....... 56
18.2 50 Hz Operation .................................................................................. 57
18.3 Power Quadrant Indicators ................................................................ 58
19 OVERVIEW OF THE E650 S4X MEASURING ELEMENT ................................. 58
19.1 E650 S4x Measurement Metrics—Landis + Gyr Terminology ............ 58
19.2 Neutral Current Calculations .............................................................. 59
19.3 Register Metric-Hour Constant (Kh) .................................................. 59
19.4 Transformer Factor (TF) ..................................................................... 59
19.5 Power Factor ....................................................................................... 60
19.5.1 Available Power Factor Measurements .................................................... 60
20 CALIBRATION VERIFICATION AND TESTING .............................................. 61
20.1 E650 S4x Factory Calibration ............................................................. 61
20.2 How to Verify the E650 S4x Calibration ............................................. 61
20.2.1 Verification of Watt Calibration ................................................................ 61
20.2.2 Calibration Pulse Displays ....................................................................... 61
20.2.3 Test Times ............................................................................................ 61
20.2.4 Field Testing .......................................................................................... 61
20.2.5 Demand Measurement Verification .......................................................... 61

L
List of Tables
Table 3.2.1 Unprogrammed Displays Table 5.2.3 GyrBox Displays Table 6.0 Demand Subintervals/Intervals Table 7.10.3 Number of Days in Different Load Profile
Configurations Table 7.10.4 Load Profile Metrics Table 7.15 Security Levels and Corresponding Operations Table 8.0 Option Board Inputs/Outputs Table 8.1 Output Cables Table 9.1 Error Codes List of Figures
Figure 1.1 E650 S4x Meter Figure 1.6 Option Board Figure 2.1 Wiring Diagrams for 45S (5S), 36S (6S) Figure 2.3 Battery Installation Procedures Figure 3.1.1 LCD Display Figure 3.1.3 E650 S4x Switches Figure 3.1.2 Exploded Diagram of E650 S4x Figure 5.2.2 Sample GyrBox Display on LCD Figures 5.4.1-5 Suggested KYZ Output Connection

M
Safety Warnings The following safety precautions must be observed during all phases of operation, service, and repair of this device. Failure to comply with these precautions or with specific warnings elsewhere in this manual violates safety standards of design, manufacture, and the intended use of the metering instrument. Landis+Gyr Inc assumes no liability for the customer's failure to comply with these requirements.
Warning: Any work on, or near, energized meters, meter sockets, or other metering equipment can present a danger of electrical shock. All work on this product should be performed only by qualified electricians and metering specialists in accordance with local utility safety practices, utility requirements and procedures outlined in Chapter 14 of The Handbook for Electricity Metering (10th edition). The information contained within this manual is intended to be an aid to qualified metering personnel. It is not intended to replace the extensive training necessary to handle metering equipment in a safe manner.
Use care when servicing with the power on. Be aware that dangerous voltages exist at several points within the meter when this product
is installed on a meter base.
Disconnect power before meter disassembly, soldering, or replacing components. The E650 S4x meter is connected directly to line potential. Due to the possibility of the potential lines being reversed, points accessible with the cover off may be at line voltage. LINE POTENTIAL IS PRESENT ON THE INCOMING CONNECTORS ON THE MEASUREMENT BOARD INCLUDING THE BATTERY CONNECTOR. The option board is connected directly to the main board and may also be at a high potential. The meter’s inner housing prevents touching the option board. Removing the inner housing exposes line voltage. This warning label is affixed to the meter frame and identifies hazards in the meter. Any option or I/O cables connecting to the meter from the mounting device must use sufficient insulation for the service voltage employed. As a general rule insulation should be designed for a 480 volt ACrms service voltage since service voltage is not always known at the time of meter manufacture. Warning All applicable electrical codes and standards must be followed. Failure to use sufficient insulation on option or I/O cables connecting to the meter through the mounting device could cause serious personal injury, property damage, and/or death.
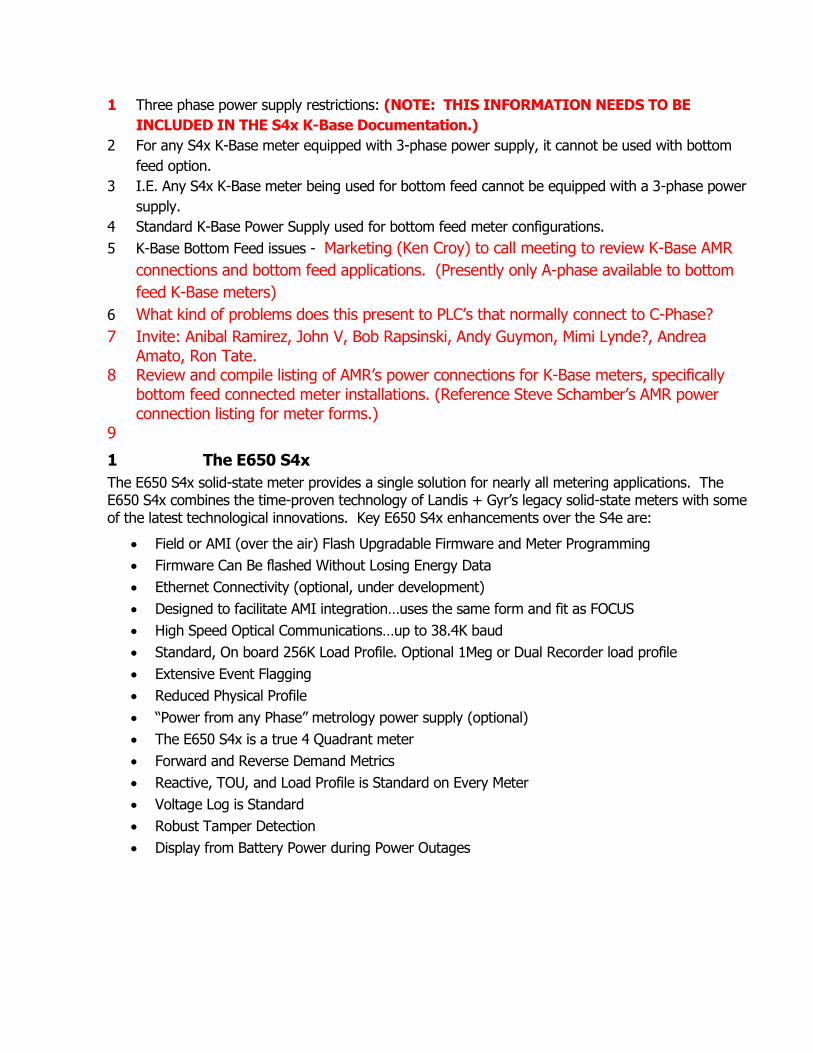
1 Three phase power supply restrictions: (NOTE: THIS INFORMATION NEEDS TO BE
INCLUDED IN THE S4x K-Base Documentation.)
2 For any S4x K-Base meter equipped with 3-phase power supply, it cannot be used with bottom
feed option.
3 I.E. Any S4x K-Base meter being used for bottom feed cannot be equipped with a 3-phase power
supply.
4 Standard K-Base Power Supply used for bottom feed meter configurations.
5 K-Base Bottom Feed issues - Marketing (Ken Croy) to call meeting to review K-Base AMR
connections and bottom feed applications. (Presently only A-phase available to bottom
feed K-Base meters)
6 What kind of problems does this present to PLC’s that normally connect to C-Phase?
7 Invite: Anibal Ramirez, John V, Bob Rapsinski, Andy Guymon, Mimi Lynde?, Andrea Amato, Ron Tate.
8 Review and compile listing of AMR’s power connections for K-Base meters, specifically bottom feed connected meter installations. (Reference Steve Schamber’s AMR power connection listing for meter forms.)
9
1 The E650 S4x
The E650 S4x solid-state meter provides a single solution for nearly all metering applications. The E650 S4x combines the time-proven technology of Landis + Gyr’s legacy solid-state meters with some of the latest technological innovations. Key E650 S4x enhancements over the S4e are:
Field or AMI (over the air) Flash Upgradable Firmware and Meter Programming
Firmware Can Be flashed Without Losing Energy Data
Ethernet Connectivity (optional, under development)
Designed to facilitate AMI integration…uses the same form and fit as FOCUS
High Speed Optical Communications…up to 38.4K baud
Standard, On board 256K Load Profile. Optional 1Meg or Dual Recorder load profile
Extensive Event Flagging
Reduced Physical Profile
“Power from any Phase” metrology power supply (optional)
The E650 S4x is a true 4 Quadrant meter
Forward and Reverse Demand Metrics
Reactive, TOU, and Load Profile is Standard on Every Meter
Voltage Log is Standard
Robust Tamper Detection
Display from Battery Power during Power Outages

2
Figure 1.1 E650 S4x Meter
The E650 S4x provides more than just reliability and accurate billing data. The E650 S4x is designed to be the foundation for a complete metering infrastructure. See section 1.7 for communication options and section 1.5 for upgradeability. Combining the E650 with the 1132 Suite software or an AMI system, can yield a complete package for accessing real-time voltage, current, and load data monitoring, extensive user-defined event and Tamper alerts, data and graphical load analysis capability, and vector diagrams.
1.1 The E650 S4x Universal Meter
All E650 S4x meters include wide-dynamic voltage application capability, forms reduction, ServiceScan automatic service recognition, and GyrBox installation diagnostics and monitoring. A single register type is all that is needed. The following chart details the various capabilities available in the basic E650 S4x meter:
RXR Active and Reactive Energy, Demand or TOU
format, 256K Load Profile Onboard Standard Configuration
AXR
ACTIVE ENERGY METERING ONLY: Even though reactive metrics are always available, the meter can be programmed for Active Energy Metering
Only
Requires programming via 1132Prog
1.2 ServiceScan Automatic Meter Service Type Recognition
Wide-dynamic voltage ranging and form consolidation techniques allow each E650 S4x to be used in a wide variety of metering installations. There is no need, however, to identify the service in advance. You can simply install the E650 S4x, and it will automatically detect the service type and voltage, displaying the information on the LCD and properly configuring the GyrBox for a complete diagnostic check of the installation. An E650 S4x can be re-installed at an installation of a different wiring type, same base type required, without the need for re-programming. For use in a non-ANSI
3
standard service, a total of five user defined service types can be downloaded to the E650 S4x (see section 3.2.3).
1.3 GyrBox Installation Diagnostics
The E650 S4x GyrBox continually performs a complete diagnostic analysis on the metering installation equipment, the service wiring, and the load characteristics. See section 5.2 for instructions on activating GyrBox mode. The E650 S4x continually monitors the service and load for equipment failures, improper installation wiring, poor load conditions, power quality conditions, and tampering. GyrBox monitors the installation for phase polarity, inactive phases, phase angle displacement, phase imbalance, and energy flow polarity while reporting in real-time the phase angles, phase voltages, phase currents, and diagnostic error counters.
1.4 Software and Software Upgrades
The E650 S4x meter offers flexible functionality options to support today’s rapidly advancing utility environment. 1132 Suite software is used to upgrade meters to TLC (under development, not yet available), 1Meg load profile, and Dual Recorder (2nd Load Profile). Upgrading Load Profile to 1Meg and/or Dual Recorder, or upgrading to TLC requires a connection to the meter and a Hardlock Key (USB type available). The meter programming utilities are 1132Com for reading, programming, upgrading, and flashing new firmware, 1132Prog for developing programs, and 1132Gyr for preparing reports. Windows XP or Windows 7 is needed for 1132Com/1132Prog/1132Gyr.
1.5 Inputs / Outputs
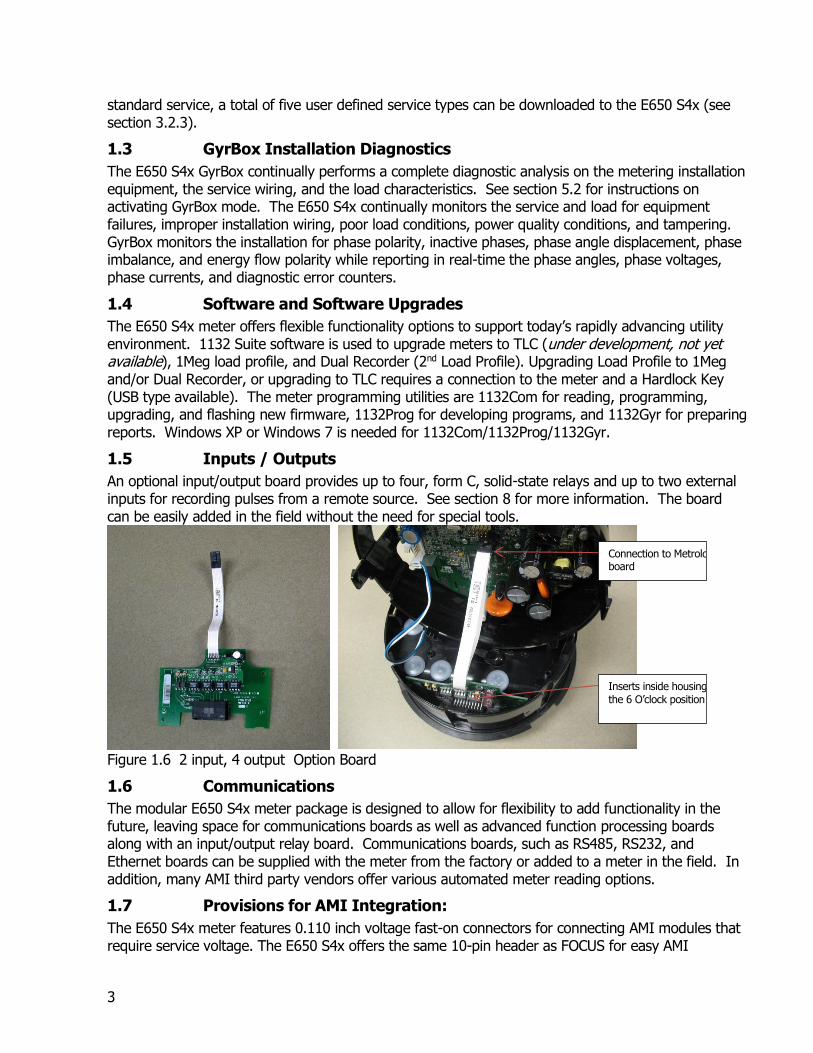
An optional input/output board provides up to four, form C, solid-state relays and up to two external inputs for recording pulses from a remote source. See section 8 for more information. The board can be easily added in the field without the need for special tools.
Figure 1.6 2 input, 4 output Option Board
1.6 Communications
The modular E650 S4x meter package is designed to allow for flexibility to add functionality in the future, leaving space for communications boards as well as advanced function processing boards along with an input/output relay board. Communications boards, such as RS485, RS232, and Ethernet boards can be supplied with the meter from the factory or added to a meter in the field. In addition, many AMI third party vendors offer various automated meter reading options.
1.7 Provisions for AMI Integration:
The E650 S4x meter features 0.110 inch voltage fast-on connectors for connecting AMI modules that require service voltage. The E650 S4x offers the same 10-pin header as FOCUS for easy AMI
Connection to Metrology board
Inserts inside housing at
the 6 O’clock position

4
installation. All meter data has the capability to be transmitted over the optical port or 10 pin AMI communication header.
1.8 Advanced Feature Sets
1.8.1 Expanded Load Profile of 1Meg Bytes
Using the basic E650 S4x, a utility has the capability of recording up to 16 channels of load profile information with 256K. With the optional 1Meg bytes of memory, extended power quality load surveys are possible. The load profile capability in conjunction with Landis+Gyr Data Analysis Software (1132Gyr) provides utilities and their customers with statistical and graphic representations of load conditions for continuous monitoring of the power system. See section 7.10 for a full discussion on load profile capabilities.
1.8.2 Dual Recorder Option
The E650 S4x also offers, as an option, Dual Recorder function. This “2nd Load Profile” can be configured for an additional 16 channels and have different interval lengths than the 1st Recorder. This 2nd recorder can be used with the standard 256K or the optional 1Meg load profile memory capacity.
2 Application Information
2.1 Available Meter Forms by Base and Class
Base Transformer Rated
Class 20 Class 120 Class 200 Class 320** Class 480
S-Base 3, 9/8, 45(5)*, 36(6)*, 29 1,2, 12, 25, 16/15/14
2, 12, 16/15/14
A-Base 10/8, 45(5)*, 36(6)* 16/15/14
K-Base 12, 16/15/14, and
27
*36S/36A replaces the traditional 6S/6A, 45S/45A replaces the traditional 5S/5A **Class 320 Meters are referred to as SE base
Figure 2.1 Wiring Diagrams for 36S (6S), 45S (5S)
2.2 Installation Procedures
For installation instructions refer to local utility practices, regulations and/or the Handbook for Electricity Metering.
2.3 Battery Installation (for TOU and Load Profile applications)
Warning: LINE POTENTIAL IS PRESENT ON THE INCOMING CONNECTORS ON THE MEASUREMENT BOARD
INCLUDING THE BATTERY CONNECTOR. BE SURE TO INSTALL THE BATTERY WITH THE METER DE-ENERGIZED.
1) Remove the meter cover
2) Place the battery’s two-pin connector into the matching two-pin slot, which is located in the 10 o’clock position on the register assembly housing, see figure 2.3 below.
3) Put the battery in the round cavity located directly below the two-pin connector on the meter frame
4) Position the battery wires into the slot to prevent them from interfering with cover installation or meter functions
5) Replace meter cover

5
Figure 3.3 Battery Installation Procedures
2.3.1 Battery Carryover Time
Battery carryover time is measured to log the cumulative time the battery has been in use. Time on carryover is displayed in minutes, and is reset to zero when a new battery is installed and the change battery function is performed in 1132Com. Minimum expected carryover time for the E650 S4x meter with supplied battery is 2 years. The shelf life of the battery is 10 years.
3 Operating Instructions
3.1 Overview of Electronic Hardware
3.1.1 LCD Display
A full listing of the available Register Displays can be found in the 1132 Prog software, version 5.0 or newer. The blue arrows indicate direction of positive energy flow. Negative Value Potential Indicators Metric Annunciators
Quadrant Indicator Digital Power Indicator Nominal Service Rate Indicators Voltage

6
Figure 3.1 LCD Display
The potential indicators on the LCD (Va, Vb, Vc) appear only if the service is polyphase and only then if potential is applied to the respective phase. The annunciators, kVARh, Vrms, kW, etc. are programmed for display using 1132Prog/1132Com. They can be enabled or disabled; this feature does not affect the other indicators/identifiers on the LCD. The nominal service voltage indicators (120, 240, 277, 347, 480) signal which service voltage is being applied to the meter. Review of the power quadrant indicator indicates the quadrant in which power is presently applied by flashing that particular quadrant. The delta/wye symbols light according to the service type of the meter. The digital power indicator scrolls across the bottom of the display (left to right) to indicate positive or (right to left) to indicate negative energy flow.
3.1.2 Special Display Identifiers
The E650 meter indicates certain modes of operation on the display by flashing back and forth between the normal 3 character display ID and a special display ID (the 3 smaller digits at the left end of the LCD). The following table lists the special display ID's and their meaning.
Special Display ID
Meaning Firmware Version
Available Description
C/U Catch-Up
The meter is in catch-up.
P/T Pass-Through
The meter is in pass-through communication mode.
R/C Remote Communication
The meter is in a communication session through the AMR port.
P/R Programmer/Reader
The meter is in a communication session through the optical port.
Z/F Zero Fill
The meter is zero filling load profile.
S/B Stand-By
The meter is in stand-by mode.
U/L Un-Lock
The meter has un-lock active.
Table 3.1.1 Special Display Identifiers
3.2 Switches
There are four user interactive switches on the E650 S4x. They are the Demand Reset, Cover Removal Detect, Test Mode and GyrBox Magnetic Reed switches. The Demand Reset switch is accessible through the covers having the Demand Reset feature. The GyrBox Magnetic Reed switch is actuated by holding a magnet over the designated area, with or without the meter cover present. To activate the Test Mode switch the cover must be removed. Removing the cover actuates the Cover Removal Detect switch. Unlike the S4e, the E650 S4x is not equipped with a scroll switch but rather the display sequences will be accessible with a series of procedures that employ the GyrBox Magnetic Reed, Demand Reset, and Test Mode switches.
7
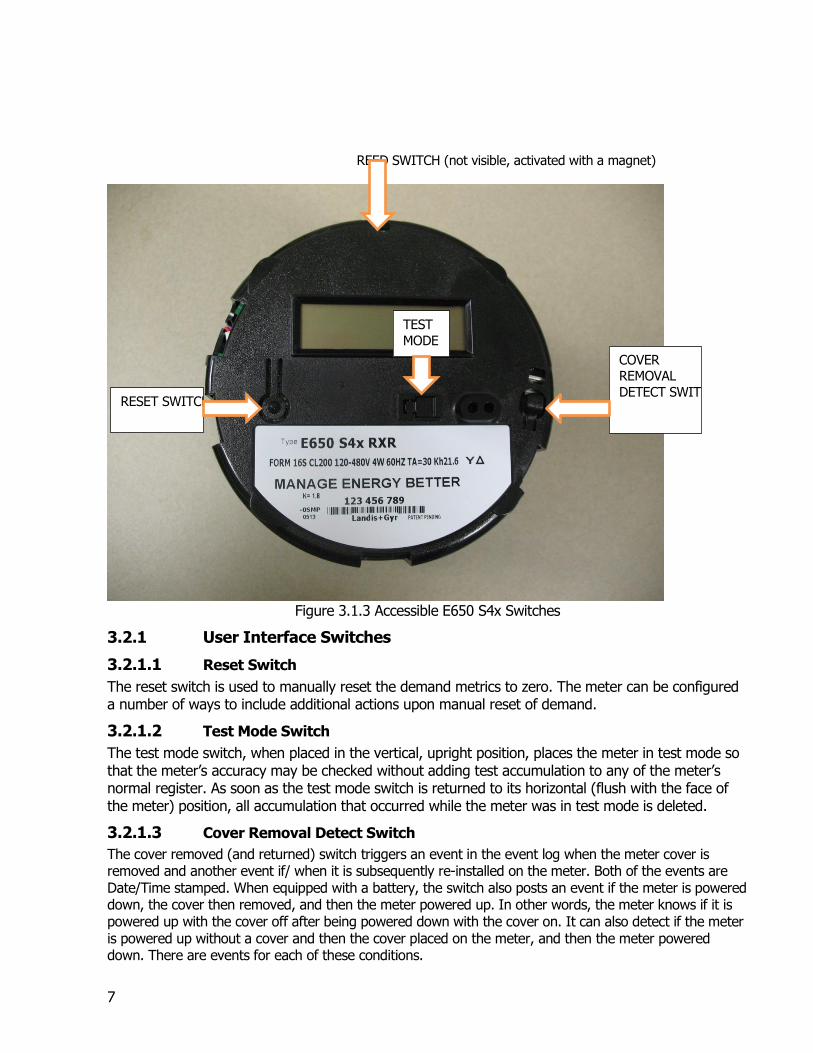
Figure 3.1.3 Accessible E650 S4x Switches
3.2.1 User Interface Switches
3.2.1.1 Reset Switch
The reset switch is used to manually reset the demand metrics to zero. The meter can be configured a number of ways to include additional actions upon manual reset of demand.
3.2.1.2 Test Mode Switch
The test mode switch, when placed in the vertical, upright position, places the meter in test mode so that the meter’s accuracy may be checked without adding test accumulation to any of the meter’s normal register. As soon as the test mode switch is returned to its horizontal (flush with the face of the meter) position, all accumulation that occurred while the meter was in test mode is deleted.
3.2.1.3 Cover Removal Detect Switch
The cover removed (and returned) switch triggers an event in the event log when the meter cover is removed and another event if/ when it is subsequently re-installed on the meter. Both of the events are Date/Time stamped. When equipped with a battery, the switch also posts an event if the meter is powered down, the cover then removed, and then the meter powered up. In other words, the meter knows if it is powered up with the cover off after being powered down with the cover on. It can also detect if the meter is powered up without a cover and then the cover placed on the meter, and then the meter powered down. There are events for each of these conditions.
REED SWITCH (not visible, activated with a magnet)
RESET SWITCH
TEST
MODE
COVER REMOVAL
DETECT SWITCH

8
3.2.1.4 Reed Switch
A reed switch, which is activated by placing a magnet at the twelve o’clock position (on top of the meter), can be used for advancing the normal mode display sequence with a swipe, activating the ALT display mode by holding the magnet at the top for approximately 3 seconds, and GyrBox diagnostic displays, by holding the magnet at this position for approximately 6 seconds. In each case, swiping the magnet will then advance the display OR the display will advance automatically after a few seconds if no action is taken.
3.2.2 Internal Switch & Sensor
3.2.2.1 Tilt Switch
The internal tilt switch is a level detector and can sense when the meter is shifting position from its normal orientation and post an event in the event history log. (Does this detect vibration?)
3.2.2.2 Magnetic Field Sensor
The E650 S4x is equipped with a Hall Effect switch to detect the presence of a foreign magnetic field being introduced. The metrology will post an event in the event log if a field is detected. (Does this sensor differentiate between reed sw. actuation and attempts to influence the meter accuracy?)
3.3 Optical Port/ Calibration LED
An optical port is provided for programming and recording meter data. The port is an ANSI Type II. The optical port and calibration output share the same LED. Whenever the meter is not communicating, the optical port LED will output a calibration pulse at a rate proportional to the watt-hours flowing through the meter. This calibration pulse automatically stops when the meter clock transits midnight. Other programmed metrics can be tested by entering test mode, manually scrolling to the appropriate metric calibration pulse display (causing the LED to pulse proportional to that metric), and checking calibration while in test mode. The Calibration LED automatically stops at midnight. In an E650 S4x, it restarts when any switch is activated.
3.4 Programmable Outputs/Inputs
The E650 S4x KYZ Option boards inputs and outputs are programmable in a variety of configurations. See section 8 for further details and possible configurations.
3.5 Initial Power-Up and Operation
Unless specified by the customer, E650 S4x meters are shipped unprogrammed. When powered up, the display on an unprogrammed device will show “S00 Error” at the end of the auto scroll sequence of displays, indicating an unprogrammed state. To clear this condition, the device needs to be programmed using 1132Com (Landis+Gyr Reader/Programmer Software package) through an optical serial communications cable or equivalent communication device. An unprogrammed E650 S4x will accumulate billing data, including energy and kW in 15-minute blocks but cannot be read using 1132Com. An E650 S4x is always a demand meter in an unprogrammed state.
3.5.1 Unprogrammed Displays
Upon powering up, an unprogrammed register goes through a power-up display sequence, and then stops on the S00 error code. The unprogrammed displays are as follows:
ID Display Mode
RXR Firmware Version Normal
DSP DSP Version Number Normal
TOT Total kWh Normal
MAX Total kW Max Demand #1 Normal
(All LCD Segments On) Segment Check Normal

9
BAT Days On Battery Normal
PCO Power Outage Counter Normal
S00 Error (unprogrammed error) Normal
FL As Left 3 EL FL Alternate
LL As Left 3 EL LL Alternate
PF As Left 3 EL PF Alternate
POW Instantaneous Watts Test
VAR Test Mode VAR (RMS) Pulse Test
VA Test Mode VA (RMS) Pulse Test
VA Test Mode VA (Vectorial) Pulse Test
VAR Test Mode VAR (Vectorial) Pulse Test
Table 3.2.1 Unprogrammed Displays
3.5.2 Programming Equipment
The E650 S4x registers are programmable using 1132Prog/1132Com for Windows based devices. Third party hand-held readers also have the ability to communicate to the E650 S4x. The E650 S4x offers a user-friendly environment for programming the registers. Consult the 1132Prog/1132Com help files for detailed instructions on programming the meter. NOTE: The E650 S4x requires 1132 Suite, version 5.0 or higher!
3.5.3 Manual Loading of Service Type
In installations that are not ANSI standard, such as using a poly phase meter in a single phase application, ServiceScan allows the user to define the voltages and voltage angles to create up to five new service types. The following values can be programmed: Voltage (rms) values: 0v, 60v, 104v, 120v, 208v, 240v, 277v, 347v, 416v, 480v Phase angle values (in degrees): 0, 60, 90, 120, 180, 240, 270, 300
3.6 Accessing the Display Modes
Up to 96 individual displays may be selected in any order and can be used more than once. The ANSI firmware counts one display programmed for Normal, Alternate and Test Mode as three different displays. There are four display sequences: Normal, Alternate, GyrBox Diagnostics and Test.
3.6.1 Normal Display Sequence
The Normal Display Sequence is present on the LCD under normal operating conditions if no special action is taken.
3.6.2 Alternate Display Sequence
An alternate display sequence may be created for the LCD using 1132Prog/1132Com software. To activate the alternate display,
a. Place a magnet over the meter in the 12 O’ clock position (over the reed switch) for 3 seconds to activate the reed switch or until you see “ ALT”. Quickly remove the magnet. The word “ALT” will appear on the display before the alternate display sequence starts. Alternate displays will be shown in sequence.
b. To exit… The meter will automatically exit back to the normal display sequence after one pass through the alternate displays.
3.6.3 GyrBox Display Sequence
The GyrBox is a sequence of displays designed to facilitate troubleshooting problems in the meter installation. All normal meter functioning continues while in the GyrBox display sequence. The
10
GyrBox sequence is pre-defined, but GyrBox displays may also be programmed to appear in the other display sequences, i.e., normal, alternate and test mode.
This is the method for obtaining the GyrBox display sequence:
3.6.3.1 Reed Switch
1) Activate reed switch by placing a magnet at the 12 O’clock position for six seconds or until you see the first display of the Gyrbox sequence.
2) The meter will then show the first GyrBox display. Swipe the magnet over the reed switch to advance the display OR allow auto-scroll to advance the display automatically.
3) To exit Gyrbox mode, hold the magnet over the reed switch until the first display of the normal display sequence appears.
You can view the GyrBox displays using 1132Com by selecting the View Data operation in the read menu. You can select this operation using the following procedure:
3.6.3.2 Using 1132 Com
1) In 1132Com highlight a meter file in the meter file window on the left-hand side. Selecting “New Meter” will automatically establish a connection to a meter.
2) Select View Data under the read menu.
3) View each screen of data. Use the tree on the left to move through the different portions of the E650 S4x meter’s program and registers, GyrBox Diagnostics and Instantaneous Data are the two GyrBox related branches.
4) To exit…In 1132Com exiting is performed by selecting the ‘X’ in the upper right corner of the program or selecting Exit in the File menu.
3.6.3.3 Power Down Display Sequence
The E650 S4x is capable of displaying pre-programmed displays during a power outage if the meter is equipped with a battery. If the meter is programmed in a Demand Only format (no battery installed), a battery can be installed on the spot to access the Power Down Display Sequence if needed. The Power Down Display Sequence will be the same sequence that is displayed during normal meter operation.
With the meter powered down, hold a magnet over the reed switch at the 12 O’clock position for six seconds. The Power Down Display mode will start and auto scroll one time through the display sequence programmed into the meter. The default setting will allow this function to be performed twice per hour, however the number of times and duration of each display is programmable in 1132Prog.
Note: Optical port access to and programming of the meter is not possible during power outage conditions and is not supported by the meter battery if so equipped.
3.7 Test Mode Sequence
Flipping the Test Mode switch enters the Test Mode. “TEST” will appear on the LCD. While in test mode, the displays must be manually scrolled by swiping the magnetic reed switch.
3.7.1 Using 1132 Com
1. In 1132Com highlight a meter file in the meter file window on the left-hand side. Selecting “New Meter” will automatically establish a connection to a meter.
2. Select Toggle Test Mode under the Meter Tools menu.

11
3. The meter is now in Test Mode and the Test Mode Displays can be observed on the meter display. The displays can be advanced with a magnet at the 12 O’clock position (reed switch)
4. To exit …repeat step 2 to toggle the meter out of test mode and back into normal mode. Click the Disconnect tab in the lower right hand corner to end the session.
3.8 Scroll Modes
3.8.1 Auto-scroll Mode
The display continually cycles through the programmed Normal Display Sequence, referred to as auto-scrolling. The LCD displays each quantity for a selectable time of 1 to 15 seconds. The default is 3 seconds. The auto-scroll mode operates by default and is only affected by a manual activation of another display mode, by activating the reed switch or by the occurrence of an error that is programmed to stop the auto-scroll sequence. Auto-scrolling is not active in test mode.
3.8.2 Manual Scroll Mode
While the E650 S4x register is auto-scrolling, the reed switch can be activated by swiping a magnet over it at the 12 O’clock position. The display will then advance to the next item in the sequence and auto-scrolling will be suspended. Each subsequent swipe over the reed switch causes the display to show the next item in the sequence. The display resumes auto-scrolling when the switch has not been activated for one minute. Manual scrolling operates in this manner for both the normal, alternate, and GyrBox sequences. The test mode sequence never auto-scrolls.
Note: In Time of Use meters’ manually scrolling for the first time causes a battery test on TOU meters. If the battery voltage is low, an error code, “S08” is indicated on the meter.
3.8.3 Scrolling in the Alternate Display Sequence
If a magnet is held over the reed switch for approximately 3 seconds, the Alternate Display Sequence is initiated, starting with the ALT display then continuing with the first alternate display item. Once the end of the Alternate Display Sequence is reached, the E650 S4x register reverts back to the Normal Display Sequence.
3.8.4 Scrolling in the GyrBox Mode
Once in the GyrBox sequence (entered via the reed switch), the GyrBox displays auto-scroll. Swiping a magnet across the reed switch stops the auto-scrolling and the E650 S4x will be in the manual scroll mode starting with the first GyrBox display. Subsequent swipes of the magnet will advance the GyrBox displays 1 at a time. Unlike the alternate display sequence, which just makes one pass before returning to the normal sequence, the GyrBox sequence wraps around to its first display and continues scrolling until GyrBox mode is exited. Placing the magnet at the twelve O’clock position again and holding it there for 6 seconds will cause the display to exit GyrBox mode and return to normal display mode.
3.9 Test Mode
Test Mode feature allows meter testing without affecting billing data, data collected is for test mode purposes only. Test mode is entered through the optic port or by activating the test mode switch on the face of the device.
3.10 Test Mode Display
Swiping the reed switch causes the next item to be displayed. Each test mode display value is updated continuously.
3.11 Actions upon Entering Test Mode

12
Upon entering test mode, the current demand interval is terminated and all billing data is stored. As a result, this demand interval will be shorter than normal. The end-of-interval (EOI) output and display indicator both activate as if a normal EOI has occurred. If the present demand is greater than the previous maximum demand, maximum demand will be updated.
3.12 Action upon Exiting Test Mode
Upon exiting test mode all billing data is restored and a new demand interval is started. The EOI output switch and display indicator activates, indicating the end of test mode and the start of a new demand interval and subinterval.
3.13 Test Mode Demand Functions
1132Prog/1132Com allows programming of separate demand interval length and Kh for test mode purposes. This allows for quicker verification of demand by using a shorter interval. Using a large Kh value allows display of kWh on the LCD with small accumulation. A demand reset performed in test mode starts a new test mode interval and zeroes accumulated demand, maximum demand, and the energy recorded.
3.14 Operation of Outputs during Test Mode
While the meter is in test mode, the optional outputs work as they would in normal mode, with the following exceptions:
EOI activates upon entering and upon exiting test mode and with every EOI. Demand Threshold Alert (DTA), Voltage Threshold Alert (VTA) and Power Factor Threshold
Alert (PFTA) are cleared upon exiting test mode.
Load Control will not work in test mode.
3.15 Miscellaneous Functions During Test Mode
Power on demand delay (PODT) is not in effect during test mode, although timing continues. For example, if PODT is 10 minutes and the meter is put into test mode for 4 minutes immediately on power up, the meter will start accumulating demand 6 minutes after exiting Test Mode.
3.16 Test Mode Time-out
After a prescribed length of time, the test mode is automatically ended and the meter returns to normal mode. 1132Prog allows the user to program the test mode time-out value from 1 to 255 minutes (a value of 0 disables the time-out function) into the meter. Once test mode is entered, the test mode counter begins timing. If the meter is left in test mode longer than the time-out value, test mode will end. Note: If a meter leaves test mode due to inactivity time-out and the mechanical switch stays activated for longer than 4 minutes, the stuck switch error, if programmed, will be displayed. This error will be cleared after the switch is deactivated.
4 GyrBox Operation
4.1 Overview of GyrBox
GyrBox diagnostics are designed to quickly conduct a meter and installation system electrical check. The E650 S4x GyrBox continually performs a complete diagnostic analysis on the metering installation equipment, the service wiring, and the load characteristics. This allows the E650 S4x to continually monitor the service and load for equipment failures, improper installation wiring, poor load conditions, power quality conditions, and tampering. The GyrBox monitors the installation for phase polarity, inactive phases, phase angle displacement, phase imbalance, voltage imbalance, and energy flow polarity. The voltage and current per phase information that the meter automatically calculates and displays will indicate if the meter is installed and operating properly. Continuous voltage and current
13
measurements are rms values and are updated every 200 ms and are available in Mfg Table 34. The display updates every 500ms.
4.1.1 ServiceScan: Service Recognition and Verification
ServiceScan automatically detects the service type and voltage, displaying the information on the LCD and properly configuring the GyrBox for a complete diagnostic check of the installation. This feature checks if the service matches the meter form type, i.e., a 8/9S meter form will not function as a 6S meter form. In cases where all three potentials are not initially present when the meter first powers up (e.g. installing a meter in a 480V site), ServiceScan will not be able to identify the service at first and will then rescan the voltage and phase information every minute until correctly identifying the service type. Therefore, an E650 S4x can be re-installed as a different type without needing to be re-programmed. For all E650 S4x meters, ServiceScan is performed at power up. ServiceScan is performed not only at power up but also in one minute intervals following power up until the device recognizes a valid service. ServiceScan can also be initiated from 1132 COM software using “Trigger Service Scan” from the Meter Tools dropdown. Refer to Appendix C entitled “Service Types” for a table listing various devices and their compatible service types.
4.1.2 Service Scan Displays
A 120V four wire wye service will illuminate the “Y” annunciator, the “120” nominal service voltage, and the three potential indicators (“Va, Vb and Vc”).
A 240V four wire delta service will illuminate the ““, the “240” nominal service voltage (even though the phases individually measured line to neutral would be 120, 120 and 208), and the three potential indicators. For single phase loads on test boards, only the nominal voltage will be illuminated.
4.1.3 Programmable Service Types
GyrBox accommodates these service types: network, 3 wire delta, 4 wire wye, and 4 wire delta. Up to five non-standard service types can be programmed using 1132Com.
4.1.4 GyrBox Activation
GyrBox may be activated while the register is operating in either the normal or alternate mode of operation. Normal energy measurement continues while GyrBox is activated.
4.2 Methods for entering GyrBox
This is the method for entering GyrBox: Reed Switch (see section 3.1.3) a. Place a magnet on top of the meter in the 12 o’clock position. b. After six seconds, the display will go blank briefly. c. The meter will then show the first GyrBox diagnostic. d. Swipe the magnet across the reed switch to stop auto-scrolling. e. Swipe the magnet again to advance the GyrBox displays, one at a time for each swipe of
the magnet. To exit
i. Hold the magnet over the reed switch for six seconds to return to the normal sequence.
4.2.1 Digital Power Indicator (DPI) during GyrBox Activation
14
The DPI shows the direction of energy flow during each phase check. It runs at a rate consistent with the load, in the direction of the energy flow.
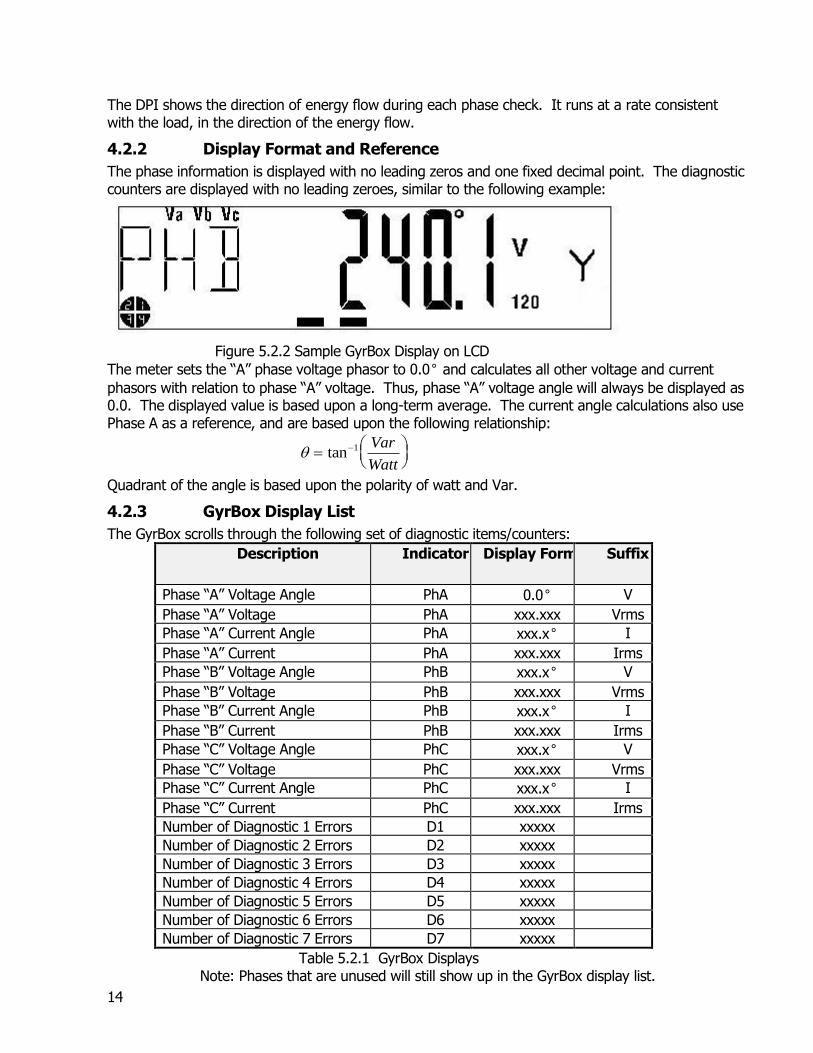
4.2.2 Display Format and Reference
The phase information is displayed with no leading zeros and one fixed decimal point. The diagnostic counters are displayed with no leading zeroes, similar to the following example:
Figure 5.2.2 Sample GyrBox Display on LCD
The meter sets the “A” phase voltage phasor to 0.0° and calculates all other voltage and current
phasors with relation to phase “A” voltage. Thus, phase “A” voltage angle will always be displayed as 0.0. The displayed value is based upon a long-term average. The current angle calculations also use Phase A as a reference, and are based upon the following relationship:
Quadrant of the angle is based upon the polarity of watt and Var.
4.2.3 GyrBox Display List
The GyrBox scrolls through the following set of diagnostic items/counters:
Description Indicator Display Format Suffix
Phase “A” Voltage Angle PhA 0.0° V
Phase “A” Voltage PhA xxx.xxx Vrms
Phase “A” Current Angle PhA xxx.x° I
Phase “A” Current PhA xxx.xxx Irms
Phase “B” Voltage Angle PhB xxx.x° V
Phase “B” Voltage PhB xxx.xxx Vrms
Phase “B” Current Angle PhB xxx.x° I
Phase “B” Current PhB xxx.xxx Irms
Phase “C” Voltage Angle PhC xxx.x° V
Phase “C” Voltage PhC xxx.xxx Vrms
Phase “C” Current Angle PhC xxx.x° I
Phase “C” Current PhC xxx.xxx Irms
Number of Diagnostic 1 Errors D1 xxxxx
Number of Diagnostic 2 Errors D2 xxxxx
Number of Diagnostic 3 Errors D3 xxxxx
Number of Diagnostic 4 Errors D4 xxxxx
Number of Diagnostic 5 Errors D5 xxxxx
Number of Diagnostic 6 Errors D6 xxxxx
Number of Diagnostic 7 Errors D7 xxxxx
Table 5.2.1 GyrBox Displays Note: Phases that are unused will still show up in the GyrBox display list.
tan 1 Var
Watt

15
4.2.4 Diagnostic Counters
The GyrBox diagnostic counters record the number of times (0 to 65535) that a diagnostic error was detected since the last counter reset. Any diagnostic conditions still existing when the counters are cleared will count to 1 within 15 seconds. You can clear the diagnostic counters by performing a cold start, either manually or optically, or a demand reset.
4.2.5 Diagnostic Check Display Options
The following section lists the possible display formats for diagnostic errors. Each diagnostic error can be programmed for display in one of these formats. Note: The meter must pass two consecutive checks before the diagnostic error will be cleared from the LCD.
Lock: The selected error remains on the LCD display. The diagnostic display causes auto-scrolling to stop at the first Error Code display. Diagnostic check code displays appear at the end of the normal/alternate scroll sequence, just before any Error Code in the sequence that may be present (See Section 9 for a discussion of Error Codes). Scroll: The diagnostic error does not cause auto-scrolling to stop. The error code byte is inserted at the end of the display sequence. No Display: The diagnostic error is not displayed on the LCD. The diagnostic counter is still increased by one. Disable: The diagnostic error will not be displayed on the LCD and the diagnostic counter will not be increased.
4.3 Diagnostic Checks
The following sections describe each of the diagnostics that GyrBox performs. When a diagnostic check is triggered it will appear on the normal display sequence if it has been programmed to lock or scroll. After seeing the particular diagnostic error in the LCD display, compare the Phase A, B and C readings to the expected values found in section 5.4. Note which values are inconsistent and use that information to help track down the source of the error.
4.3.1 D1 Voltage Phase Angle (Polarity and Cross-phase)
The D1 diagnostic checks for proper phase relationships of voltage, incorrect polarity of voltage, internal meter measurement malfunction, and faulty site wiring. The envelope of the voltage phasors has a default value of plus or minus 10 degrees, however this value can be programmed. The range is any number from 0 up to 90 degrees. If any voltage phasor angle values measure more than plus or minus the programmed value, from their nominal, expected position, an error will be detected. This error can only occur on poly-phase forms (i.e. 12S, 25S, 16S, 9S, 36S, 45S, etc.) and cannot occur on single-phase forms (i.e. 1S, 2S, 2SE, 2K, 3S, 4S, etc.) since single-phase forms only have a single voltage measurement.
4.3.2 D2 (Phase Voltage Deviation Check)
The Phase Voltage Deviation Check verifies loss of phase voltage, incorrect phase voltage, shorted voltage transformer windings, or incorrect voltage transformer ratio by detecting differences between phase voltage magnitudes. This check uses the nominal voltage per phase as a reference. The tolerance range of the voltage deviation (%) is programmable using 1132Prog/1132Com software.
4.3.3 D3 (Inactive Phase Current Check)
The Inactive Phase Current Check verifies that the service is maintaining an acceptable current level and is expected to detect current diversion and an open or shorted CT circuit. The low current value is programmed into the register using 1132Prog/1132Com software and will have a limit starting at the creep level of the meter and up to 200A in increments of 1mA. Each phase can have a separate threshold. The error flag will trip if one or more currents fall below its threshold and at least one

16
current remains above this value for more than 15 seconds. The error flag will not trip if all phase currents fall below their thresholds.
4.3.4 D4 (Phase Angle Displacement Check)
The Phase Angle Displacement Check diagnostic verifies that the elements are sensing and receiving the correct current for each phase of the service and indicates poor load power factor system conditions and reversed CT’s. The phase displacement angle () is programmable through the
1132Prog/1132Com software package. Angles for leading and lagging loads are separately programmable. The current phasors must be within this programmable phase with respect to their voltage phasor to pass this diagnostic check. This is calculated with respect to its respective voltage phasor, not necessarily phase A’s voltage phasor. The check is not performed if Diagnostic #3 did not pass or if phase A voltage is missing.
4.3.5 D5 (Voltage Imbalance Detect)
The D5 Diagnostic is programmed according to the settings in 1132Prog with a variable threshold. This diagnostic compares the voltage of each phase with the other phases in the installation. If the ratio between any phase voltage and the average of all phase voltages exceeds the user programmable percentage, then this diagnostic flag is tripped. However for delta configurations, it's the phase to phase voltages that are compared to each other.
4.3.6 D6 (Current Magnitude Imbalance Check)
This diagnostic compares the current of each phase with the other phases in the installation. If the ratio between any phase current and the average of all phase currents exceeds the user programmable percentage, then this diagnostic flag is tripped. The check is not performed if Diagnostic #3 did not pass, if the average current is below 0.5% of class, or if phase A voltage is missing.
4.3.7 D7 (Energy Polarity Check)
The D7 diagnostic checks for reverse energy flow of one or more phases. If the energy polarity (watts) for any phase is negative, this flag will be tripped. This check is not performed if phase A voltage is missing.
17
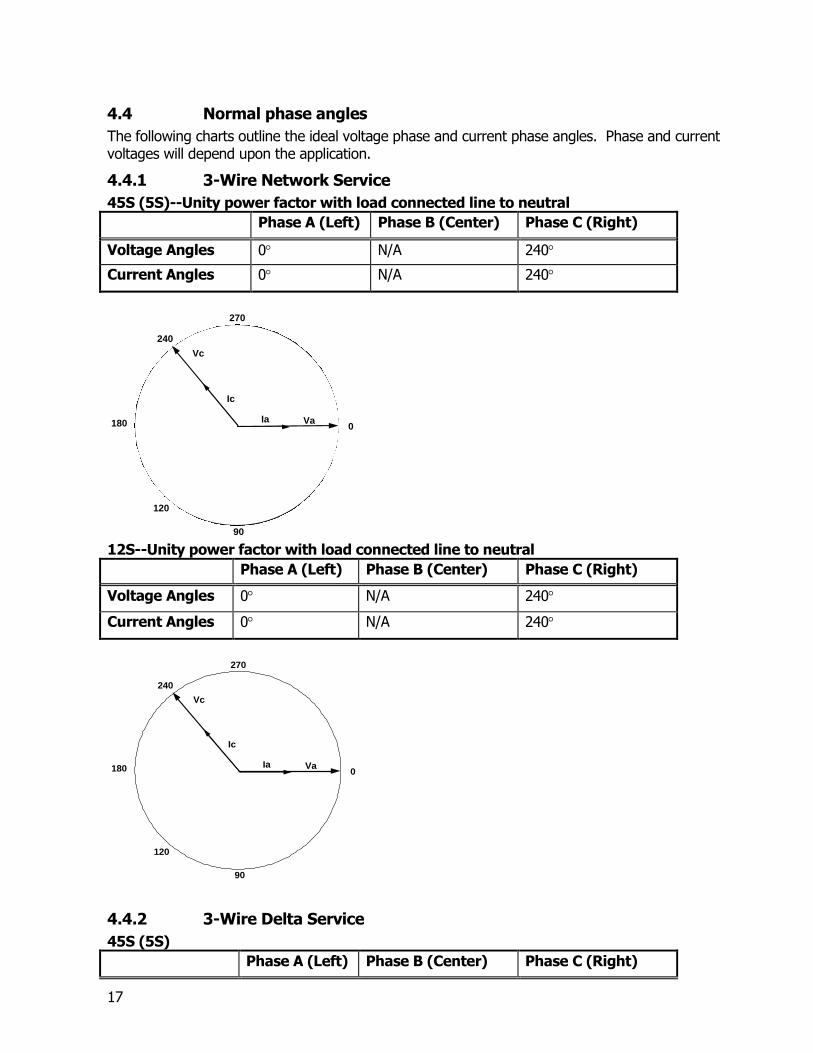
4.4 Normal phase angles
The following charts outline the ideal voltage phase and current phase angles. Phase and current voltages will depend upon the application.
4.4.1 3-Wire Network Service
45S (5S)--Unity power factor with load connected line to neutral
Phase A (Left) Phase B (Center) Phase C (Right)
Voltage Angles 0 N/A 240
Current Angles 0 N/A 240
12S--Unity power factor with load connected line to neutral
Phase A (Left) Phase B (Center) Phase C (Right)
Voltage Angles 0 N/A 240
Current Angles 0 N/A 240
0 180
270
90
Va
240
120
Vc
Ic
Ia
4.4.2 3-Wire Delta Service
45S (5S)
Phase A (Left) Phase B (Center) Phase C (Right)
0180
270
90
Va
240
120
Vc
Ic
Ia

18
Phase A (Left) Phase B (Center) Phase C (Right)
Voltage Angles 0 N/A 300
Current Angles 30 N/A 270
12S
Phase A (Left) Phase B (Center) Phase C (Right)
Voltage Angles 0 N/A 300
Current Angles 30 N/A 270
4.4.3 4-Wire Wye Service
36S (6S)--Unity power factor with load connected line to neutral
Phase A (Left) Phase B (Center) Phase C (Right)
Voltage Angles 0 120 240
Current Angles 0 120 240
0180
270
90
Va
Ic
Vc
Ia
300
30
0180
270
90
Va
Ic
Vc
Ia
300
30

19
9S/8S--Unity power factor with load connected line to neutral
Phase A (Left) Phase B (Center) Phase C (Right)
Voltage Angles 0 120 240
Current Angles 0 120 240
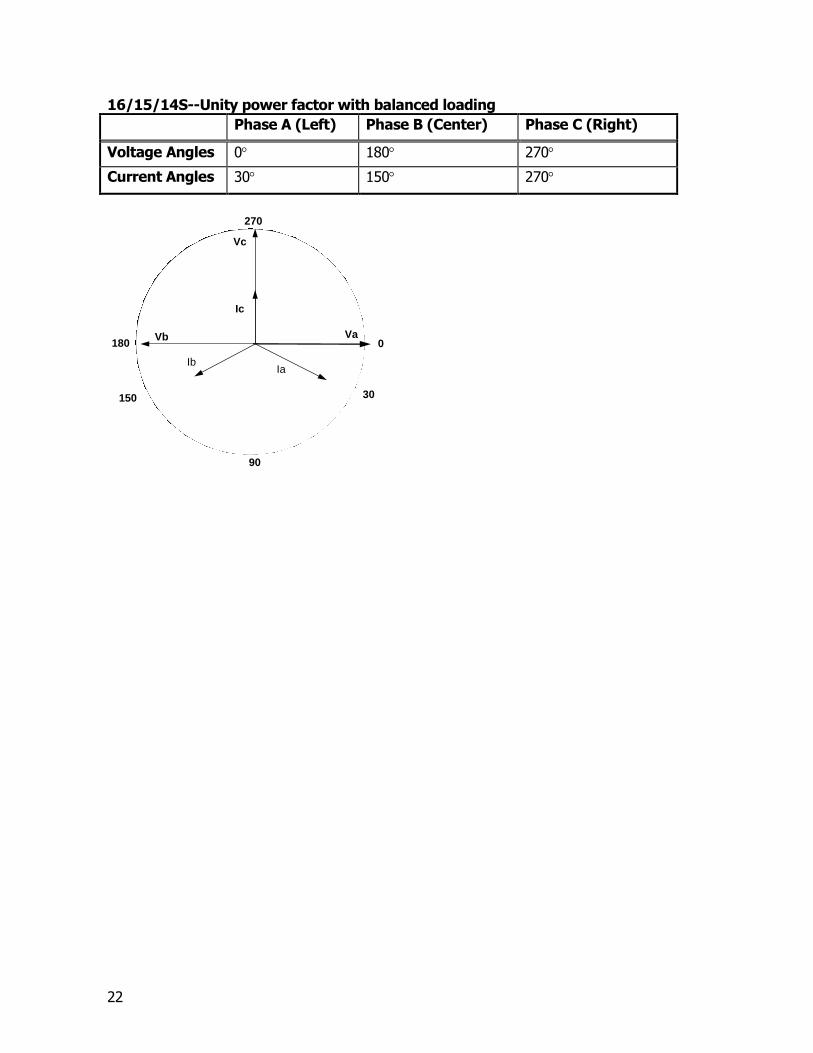
16/15/14S--Unity power factor with load connected phase to neutral
Phase A (Left) Phase B (Center) Phase C (Right)
Voltage Angles 0 120 240
Current Angles 0 120 240
0180
270
90
240
120
Vc
Ic
Va
Ia
Ib
Vb
0180
270
90
240
120
Vc
Ic
Va
Ia
Ib
Vb

20
0180
270
90
240
120
Vc
Ic
Va
Ia
Ib
Vb

21
4.4.4 4-Wire Delta Service
45S (5S)--Unity power factor with balanced loading
Phase A (Left) Phase B (Center) Phase C (Right)
Voltage Angles 0 N/A 270
Current Angles 0 N/A 270
9S/8S--Unity power factor with balanced loading
Phase A (Left) Phase B (Center) Phase C (Right)
Voltage Angles 0 180 270
Current Angles 30 150 270
0
270
90
Va
Ic
Vc
Ia
0180
270
90
Va
Ic
Vc
150 30
Vb
IaIb
22
16/15/14S--Unity power factor with balanced loading
Phase A (Left) Phase B (Center) Phase C (Right)
Voltage Angles 0 180 270
Current Angles 30 150 270
0180
270
90
Va
Ic
Vc
150 30
Vb
IaIb
23
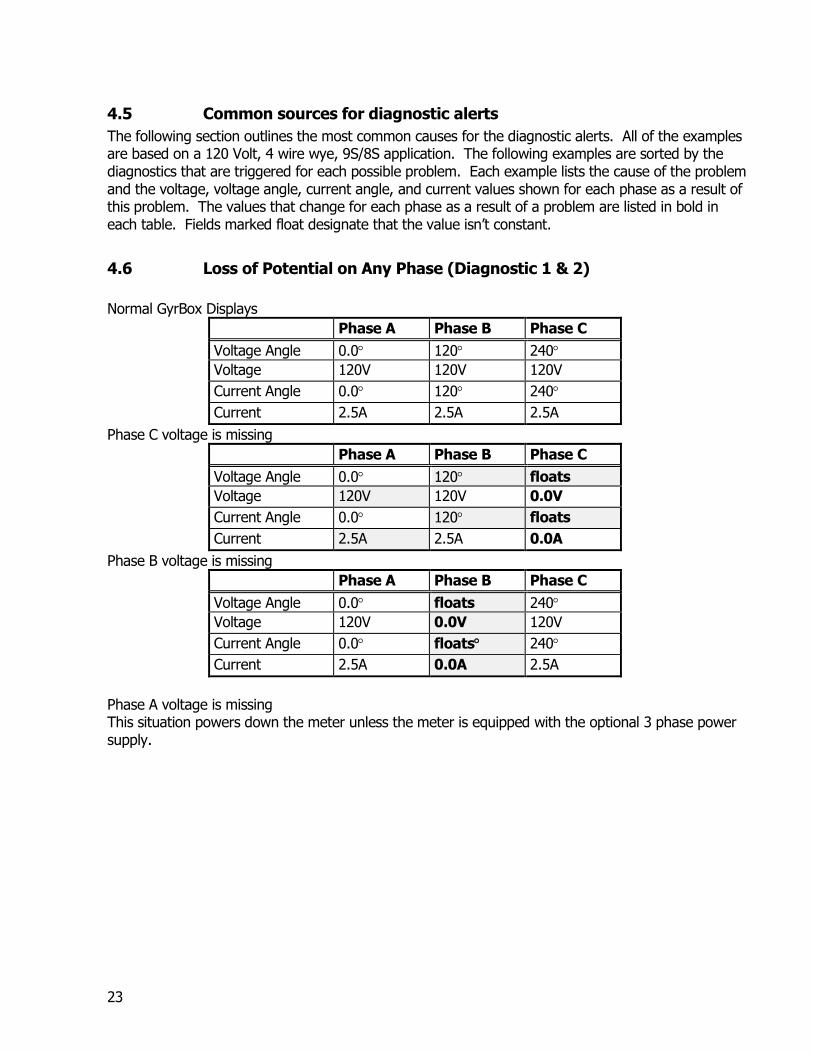
4.5 Common sources for diagnostic alerts
The following section outlines the most common causes for the diagnostic alerts. All of the examples are based on a 120 Volt, 4 wire wye, 9S/8S application. The following examples are sorted by the diagnostics that are triggered for each possible problem. Each example lists the cause of the problem and the voltage, voltage angle, current angle, and current values shown for each phase as a result of this problem. The values that change for each phase as a result of a problem are listed in bold in each table. Fields marked float designate that the value isn’t constant.
4.6 Loss of Potential on Any Phase (Diagnostic 1 & 2)
Normal GyrBox Displays
Phase A Phase B Phase C
Voltage Angle 0.0 120 240
Voltage 120V 120V 120V
Current Angle 0.0 120 240
Current 2.5A 2.5A 2.5A
Phase C voltage is missing
Phase A Phase B Phase C
Voltage Angle 0.0 120 floats
Voltage 120V 120V 0.0V
Current Angle 0.0 120 floats
Current 2.5A 2.5A 0.0A
Phase B voltage is missing
Phase A Phase B Phase C
Voltage Angle 0.0 floats 240
Voltage 120V 0.0V 120V
Current Angle 0.0 floats 240
Current 2.5A 0.0A 2.5A
Phase A voltage is missing This situation powers down the meter unless the meter is equipped with the optional 3 phase power supply.

24
Diagnostic #s Possible Problem
4 and 7 CT’s are reversed. The current is flowing in the wrong direction.
4.7 CT’s Reversed, Current Flowing in Wrong Direction.
Normal GyrBox Displays (resistive loads) PF = 1.0rms/1.0td; Total Watts = 900
Phase A Phase B Phase C
Voltage Angle 0.0 120 240
Voltage 120V 120V 120V
Current Angle 0.0 120 240
Current 2.5A 2.5A 2.5A
Phase A current is reversed PF = 0.333rms/1.0td; Total Watts = 300
Phase A Phase B Phase C
Voltage Angle 0.0 120 240
Voltage 120V 120V 120V
Current Angle 180 120 240
Current 2.5A 2.5A 2.5A
Phase B current reversed PF = 0.333rms/1.0td; Total Watts = 300
Phase A Phase B Phase C
Voltage Angle 0.0 120 240
Voltage 120V 120V 120V
Current Angle 0.0 300 240
Current 2.5A 2.5A 2.5A
Phase C current reversed PF = 0.333rms/1.0td; Total Watts = 300
Phase A Phase B Phase C
Voltage Angle 0.0 120 240
Voltage 120V 120V 120V
Current Angle 0.0 120 60
Current 2.5A 2.5A 2.5A

25
Phase A and B reversed PF = 0.333rms/1.0td; Total Watts = -300
Phase A Phase B Phase C
Voltage Angle 0.0 120 240
Voltage 120V 120V 120V
Current Angle 180.0 300 240
Current 2.5A 2.5A 2.5A
Phase A and C Current Reversed PF = 0.333rms/1.0td; Total Watts = -300
Phase A Phase B Phase C
Voltage Angle 0.0 120 240
Voltage 120V 120V 120V
Current Angle 180.0 120 60
Current 2.5A 2.5A 2.5A
Phase A, B and C Current Reversed PF = 1.0rms/1.0td; Total Watts = -900
Phase A Phase B Phase C
Voltage Angle 0.0 120 240
Voltage 120V 120V 120V
Current Angle 180 300 60
Current 2.5A 2.5A 2.5A

26
Diagnostic #s Possible Problem
4, 7, and sometimes 1
Potential transformer reversed.
7.5 Normal GyrBox Displays (resistive loads)
Phase A Phase B Phase C
Voltage Angle 0.0 120 240
Voltage 120V 120V 120V
Current Angle 0.0 120 240
Current 2.5A 2.5A 2.5A
Phase A voltage reversed: Diagnostic # 1, 4, 7
PF = 0.333rms/1.0td; Total Watts = 300
Phase A Phase B Phase C
Voltage Angle 0.0 300 60
Voltage 120V 120V 120V
Current Angle 180.0 300 60
Current 2.5A 2.5A 2.5A
Phase B voltage reversed: Diagnostic # 1, 4, 7
PF = 0.333rms/1.0td; Total Watts = 300
Phase A Phase B Phase C
Voltage Angle 0.0 300 240
Voltage 120V 120V 120V
Current Angle 0.0 120 240
Current 2.5A 2.5A 2.5A
Phase C voltage reversed: Diagnostic # 1, 4, 7
PF = 0.333rms/1.0td; Total Watts = 300
Phase A Phase B Phase C
Voltage Angle 0.0 120 60
Voltage 120V 120V 120V
Current Angle 0.0 120 240
Current 2.5A 2.5A 2.5A

27
Phase A and B voltage reversed: Diagnostic # 1, 4, 7
PF = 0.333rms/-1.0td; Total Watts = -300
Phase A Phase B Phase C
Voltage Angle 0.0 120 60
Voltage 120V 120V 120V
Current Angle 180 300 60
Current 2.5A 2.5A 2.5A
Phase A and C voltage reversed: Diagnostic # 1, 4, 7
PF = 0.333rms/-1.0td; Total Watts = -300
Phase A Phase B Phase C
Voltage Angle 0.0 300 240
Voltage 120V 120V 120V
Current Angle 180 300 60
Current 2.5A 2.5A 2.5A
Phase B and C voltage reversed: Diagnostic # 1, 4, 7
PF = 0.333rms/-1.0td; Total Watts = -300
Phase A Phase B Phase C
Voltage Angle 0.0 300 60
Voltage 120V 120V 120V
Current Angle 0.0 120 240
Current 2.5A 2.5A 2.5A
All Voltages Reversed: Diagnostic # 4, 7 (not 1)
PF = 1.0rms/-1.0td; Total Watts = -900
Phase A Phase B Phase C
Voltage Angle 0.0 120 240
Voltage 120V 120V 120V
Current Angle 180 300 60
Current 2.5A 2.5A 2.5A
5 Events and Logs Available in the E650 S4x
There are many Events available in the E650 S4x. The first list below are Manufacturers (dedicated) Events. Manufacturers Events are ones that will always be posted in the meter’s History log when they occur. These are events that cannot be disabled. The second list are Optional Events and each of these events can be included or excluded from the Optional Events log when creating the meter program in the 1132 Prog software.
5.1 Manufacturers (dedicated) Events:
Power Down Power Up Time Change Old

28
Time Change New Meter Program Reset List Pointer History Log Cleared Event Log Cleared Event Log Updated DST On DST Off Enter Test Mode Exit Test Mode Meter is Re-programmed Meter Configuration Error Clock Error Measurement Error End Device Sealed End Device Unsealed Authentication Enabled Cold Start Meter Flash Standby Exit Meter FW Image Verification Meter Upgrade Flash Pointer Corruption Enter Factory Mode Exit Factory Mode Expected Sequence Number Actual Sequence Number Cover Was Installed Cover Was Removed L5/AMR Security Is Disabled By Programming L5/AMR is Re-enabled By Under-cover Switch Sequence Disable OPT Port Lockout via MGF Procedure 19 Disable OPT Port Demotion via MFG Procedure 22 Power Down Cover Power Down Magnet Power Down Unknown
5.2 Optional Events (can be enabled or disabled)
Primary Power Down Primary Power up Time Changed – Old Time Time Changed – New Time End Device Accessed for Read End Device Programmed Communication Terminated Normally Communication Terminated Abnormally Reset List Pointers Update List Pointers

29
History Log Cleared History Log Pointers Updated Event Log Cleared Event Log Pointers Updated Demand Reset Occurred Self-Read Occurred Daylight Savings Time On Daylight Savings Time Off Season Change Rate Change Special Schedule Activated Tier Switch / Change Pending Table Activated Pending Table Activation Cleared Test Mode Started Test Mode Stopped Meter is Re-programmed Configuration Error Detected RAM Failure Detected ROM Failure Detected Nonvolatile Memory Failure Detected Clock Error Detected Measurement Error Detected Low Battery Detected Demand Overload Detected Tamper Attempt Detected Reverse Rotation Detected End Device Sealed End Device Unsealed Authentication Enabled Log On Failure Voltage Sag or Swell Started or Stopped Temperature Threshold Exceeded Error Excessive Leading Current Enter / Exit Real Time Rate Cold Start Unauthorized Request Meter Flash Line Frequency Range Adjust Error Standby Exit Meter FW Image Verification Meter Upgrade End Device Programming Started Tilt Detected VHoldUp Event Detected Flash Pointers Corrupted Meter ROM Verification Arm Seal Bit Cleared Due To Tamper Enter Factory Mode Exit Factory Mode

30
Expected Sequence Number Actual Sequence Number Alert Occurred Cover Was Installed Cover Was Removed L5 / AMR Security is Disabled by Programming L5/ AMR Security is Re-enabled by Under-Cover Switch Sequence (Menu Mode) Disable OPT Port LOCKOUT via MFG Procedure 19 Disable OPT Port Demotion via MFG Procedure 22 Power Down Cover Power Down Magnet Power Down Unknown NOTE…The tamper detection triggers are active even when the meter is not powered so long as
there is a lithium battery installed, however they will be reported only after power is restored to
the meter.
5.3 The Audit Trail (Audit Log)
The Audit Trail Log is kept in STD table 76 and is a continuous record of events that are considered vital as a reliable reference of activities when changes are made to the meter’s programming or status. It does not specify what changes have been made, however it does indicate that a change was attempted or executed, and includes possible tamper activities. This log is not selectable and permanently resides in the meters STD table 76. When it is full and a new event is added to the log, the oldest event will be deleted and so on. The audit trail log currently includes the following events:
6 Demand Metering
The E650 S4x meter can calculate active (kWh) energy or reactive (VAR Phasor, VA Phasor, VArms) energy and demand in block, or rolling block. Demand interval length and the number of subintervals are established through programming. The possible arrangements of subintervals per interval for “rolling demand” are shown in Table 7.0. Rolling demand is sometimes referred to as “sliding demand”. A new demand interval timing sequence begins when power is applied/restored, upon programming when the demand interval is changed, and when entering or exiting test mode. The number of minutes remaining in the current subinterval is available for display.
Number of Subintervals
Interval Length 1 2 3 4 5 6 10 15
Meter Program Event Log Cleared Event Log Updated Meter is Re-Programmed End Device Sealed End Device Unsealed Authentication Enabled Cold Start Meter Flash
Meter Programming Started Enter Factory Mode Exit Factory Mode L5/AMR Security is Disabled by Programming L5/AMR Security is Re-Enabled by Under the Cover Switch Sequence Disable OPT port LOCKOUT via MFG Procedure 19 Disable OPT port Demotion via MFG Procedure 22

31
Demand Subinterval Length (minutes)
1 Block Only!
2
3
4 5 6 10 12 15 20 30
60 Block Only!
2 3 4 5 6 10 12 15 -
-
-
- - 2 - 3 5 6 -
10
-
15
- - - - 2 - 4 5 -
-
10
- - - - - - 3 - 5
-
-
- - - - - 2 - 3 4
-
6
- - - - - - 2 - -
-
5
- - - - - - - -
-
2 3
- - - - - - - - -
-
2
Table 7.0 Demand Subintervals/Intervals
6.1 DEMAND TYPES
Demand can be displayed in three different ways:
6.1.1 Maximum (Indicating) demand
The maximum demand since the last demand reset.
6.1.2 Cumulative demand
The sum of the maximum demands from all demand resets.
6.1.3 Continuous cumulative demand
The sum of indicating and cumulative demands.
6.1.4 Three Highest Demands
The highest three demands during a billing period are recorded with the time and date of occurrence for all demand metrics. This is true for the Total and each Rate.
6.1.5 Demand (Billing Period) Reset
Block: The following actions occur upon Demand Reset: 1) For each of the rates the following is done to the present season values:
a) Max kW is added to the Cumulative kW value and Max VAR phasor, VA phasor, or VA rms is added to the Cumulative value for each metric.
b) Max kW is reset to zero. Max VAR phasor, VA phasor, and VA rms are reset to zero.
2) The three highest kW and VAR phasor, VA phasor, and VA rms values and coincident values are reset to zero (TOU Only).
3) For block demand, all demand data for all previous intervals is zeroed, and all demand data in the present interval (including before the Demand Reset) is retained.
4) Date of last reset is updated (TOU Only) (see exception under No. 5).

32
5) If it is an automatic Demand Reset as a result of season change, then all present season values are written to last season registers before any data is zeroed. Date of last reset is not updated.
6) If a season change results from this Demand Reset, then all present season values are written to last season registers before any data is zeroed.
6.1.6 Rolling, Demand Reset Type I
Same as Block Demand Reset except demand data from current subinterval is not cleared. As a result the Present kW register is not affected.
6.1.7 Rolling, Demand Reset Type II
Same as Block Demand Reset except all demand data from all previous subintervals is zeroed, and all demand data in the present subinterval (including before the Demand Reset) is retained. Automatic Demand Reset upon Season Change A demand reset may be programmed to occur automatically at each season change. In order to not lose the demand data, all present season demand values are copied into last season demand registers, before clearing the present season values to zero. The last season values can be displayed and can be read by any compatible reader.
6.2 Demand Reset Methods
6.2.1 Manual Method
A Demand Reset can be initiated manually via the reset mechanism installed in the front of the meter cover. Upon initiating a Demand Reset, all LCD display segments are briefly displayed. No further Demand Resets are allowed to occur until the completion of one normal display sequence. After a Demand Reset, the display sequence will begin at the first programmed display of the normal display sequence.
6.2.2 Software Method
A Demand Reset may also be accomplished optically or remotely (via AMI device, RS232, RS485, or Ethernet) using Landis+Gyr’s 1132Prog/1132Com software package on a PC or other compatible device (AMI system with I/O capabilities). The meter is also capable of automatically doing a demand reset daily, monthly, as a part of a Self-Read, or on season change.
6.2.3 Power on demand delay timing
Power on demand delay timing (PODT) allows for demand measurement to be delayed when power is restored after a power outage. The length of time for which demand is delayed, after power resumes, is programmable. The demand measurement may be delayed for times of 0 to 255. A time of zero minutes would cause no delay to occur. The value of PODT left is available for display. Additionally, a PODT Trigger can be set to designate how long an outage has to be for the meter to utilize the PODT. This value can be programmed from 0 to 255.
7 TOU Metering
This section of the instruction manual covers the Time of Use function and operation of the E650 S4x meters where TOU and recorder capabilities are employed.
7.1 TOU without Battery

33
The meter is configurable to ignore all errors and events resulting from a low or missing battery including clock error. The meter is configurable such that after a power outage, if it is not able to determine the current time, it defers some power up handling until it can, and enters stand-by mode.
7.2 “Stand-By” mode
When configured for Time of Use without battery and to allow stand-by mode, the meter enters stand-by after a power outage during which clock function was lost. Stand-by mode is designed to enable a utility to continue recording demand and Load Profile data while the meter is uncertain of the correct time. Upon entering stand-by, the meter’s clock is set to 12:00AM 1/1/2000, a clock error is asserted, and an enter stand-by event is logged. The day of week is also set to “7” (unassigned day of week) In an operational AMI network, the meter should only remain in stand-by for a few seconds. However if a wide scale outage has occurred, the AMI network might take a period of time to fully function and to propagate the correct time to the meter. The meter does not exit stand-by unless the clock is set.
7.3 Stand-By Mode in Practice
Stand-by mode records Load Profile data. The meter stores up to the full capacity of load profile memory (256K or 1Meg) while in Stand-By Mode. The number of days the meter is able to store is dependent on the interval lengths and number of channels being used. All power up and down events are recorded as in normal operation. The season and special schedule (aka Holiday) are retained. The rate changes to the Stand-By rate set in Mfg table 15 and does not change due to any calendar event. Self reads and season changes are skipped.
On subsequent power outages in which the time is lost, the meter creates a new stand-by start event in the log, but no stop event. The clock error is retained until the time is set and is not reset with a “Clear Standard Status flags” request. Test mode remains available, and data is not logged while in this mode (as normal). The Stand-By data will merge with normal load profile data using the current time as a reference point, upon exiting stand-by via a time set.
8 Main Clock
The E650 S4x register maintains its clock by counting the line cycles. The clock maintains accurate time-keeping from the line while power is present. On battery carry over, the E650 S4x register maintains its clock using a 32kHz crystal with an accuracy of ±0.02%, or ±1 minute per month. Optionally, the E650 S4x may be programmed to always maintain its clock from the 32kHz crystal.
8.1 Time Display Format
The register clock displays time in a 24-hour format of XX hour and XX minutes or with XX seconds. Midnight is considered to be the beginning of a day and is displayed as 00:00 or 00:00.00 with seconds.
8.2 Date Display Format
The E650 S4x can be programmed to display the date in month/day/year, day/month/year, year/day/month or year/month/day (Canada) format. The time and date are always stored in the same manner. The format only affects the display of the data.
8.3 Date and Time Setting

34
Changing the software clock is achievable through any compatible programmer such as a handheld device, AMI (with time keeping functionality), or a PC with the proper software and hardware without prior knowledge of the program in the meter. Changing the time in the meter will not result in a loss of register data.
8.4 Daylight Savings Time
Daylight savings time shifts either follow U.S./Canada dates or user programmed dates. On a spring time shift the time moves from 2 to 3 AM and from 2 to 1 AM on a fall time shift. In the following table Rate A is programmed from 12 to 1:30 AM and Rate B is programmed from 1:30 AM to end of day.
Event Action
Time reaches midnight Rate A activated
Time reaches 1:30 AM Rate B activated
Time reaches 2:00 AM Time changed to 1:00 (on Fall DST date), Rate A activated
Time reaches 1:30 AM again Rate B activated
Time reaches 2:00 AM again No action
8.5 Time On Carryover
Time on battery carryover is measured to log the cumulative time the battery has been in use. Time on carryover is measured in seconds, has an internal recording capacity of 136 years, and is displayed on the LCD in minutes (the expected capacity of the battery is 2 years, if the battery is connected and no power is applied to the meter). Performing a cold start resets the time on battery carryover. Time on carryover will roll over to 0 when the monitoring of battery usage extends past 999999 minutes (694 days) on the display. Time on battery is available for display. While minutes are available for display, the internal resolution of time on carryover is seconds. When installing a new battery, the battery carryover time can be reset to zero using 1132 COM the “Test Battery and Clear Time” function in the Meter Tools dropdown.
9 Programmable Dates and Schedules
9.1 Programmable Dates
The register has enough memory to provide a 20 year calendar when using 15 holiday or season change dates. Users may define their own fixed date perpetual dates. Perpetual dates also signal season changes or holidays. Examples of perpetual dates are: Jan. 1 New Year's Day
July 1 Canada Day
July 4 Independence Day
Nov. 11 Veteran's Day
Dec. 25 Christmas Day
Dec. 31 New Year's Eve
9.2 Seasonal Rate Changes
TOU schedules for up to four seasons per year are available. Seasonal rate changes occur at the first hour of programmable dates (midnight). At season change, all energy and demand accumulators are copied into last season storage.

35
9.3 TOU Daily Schedules
Two hundred and fifty-five transitions are available to divide between the daily schedules. The switch points are shared among the five TOU rates and the optional TOU Load Control switch.
9.4 Day Select for Schedules
Each of the seven days of the week may have one of the TOU schedules assigned to it. Any schedule may be used as an exception to the TOU daily schedule (i.e. a holiday).
9.5 Load Control/TOU Switchpoints
A switchpoint is a quarter-hour boundary during the day that defines a TOU rate change and/or a programmable output option change. TOU schedules are made up of switchpoints. Each schedule may have from 1 to 96 switchpoints.
The meter allows for up to five TOU rate periods, Rates A, B, C, D and E. Any rate may last for as short as one switchpoint (changing every quarter-hour) or for as long as an entire day. Switchpoints may also be used to enable or disable programmable outputs. Control of the outputs may occur in conjunction with rate changes or apart from them. Therefore, a switchpoint may either change the TOU rate; change the state of the programmable outputs, or both.
This action directs the load control relay to energize or de-energize. Energizing a load control relay should close or open the KY contact (depending upon the normal off state of the relay, either open or close). Load control actions in a TOU schedule will have no effect unless one of the optional general purpose relays is programmed for load control.
9.6 Rate Indicator Outputs
Rate indicator outputs may be accomplished by programming an output relay for TOU Load Control as stated in the above section.
9.7 Load Profile
9.7.1 Load Profile Memory Capacity
The E650 S4x Load Profile memory sizes are 256K and 1Meg. The reader/programmer will initialize load profile memory or disable load profile recording completely. On the E650 meter, the Load profile maximum is 1Meg. The number of days of capacity is dependent upon the interval length duration and the number of channels used. Table 7.10.3 on the following page shows the relationship between capacity and load profile interval length.
9.7.2 Upgrade of Load Profile Memory
E650 S4x meters can be upgraded from 256K to 1Meg with a softkey and bullets (credits on a hardlock key). Note…The meter can also be configured to have a (optional) dual recorder or “Second Load Profile”. This is where intervals of a different length from the 1st Load Profile (in minutes) can be configured. How the two load profiles are apportioned is flexible. See section 7.10.4.1
9.7.3 Load Profile Interval Length with Single Load Profile
Load Profile interval lengths include, 1, 5, 15, 20, 30, and 60. Load profile interval length and TOU demand interval length are independent and may be different.
Number of Days (approximate*) in Load Profile:

36
Table 7.10.3 Number of Days in Different Load Profile Configurations *NOTE…Because engineering units (and not pulses) are used, capacity of load profile
may increase with light loads
9.7.4 Load Profile Recording Channels
The register with single recorder Load Profile records up to 16 channels of load profile data. The number of channels is programmable. The available memory is distributed equally among each channel. The metric for each load profile channel is selectable by the reader/programmer and may be different from the additional metric used elsewhere in the register for energy and demand calculation. Each channel has a configuration byte defining its selected metric. All calculations are based on the meter’s true kh. These configuration bytes may be read by the reader/programmer. The metrics available are as follows (all channels must use the same interval lengths with Single Load Profile recorder):
Delivered kWh Q3 kVArh Phasor Q2 kVAr RMS
Received kWh Q4 kVArh Phasor Q3 kVAr RMS
Total kWh Phase A RMS Volts Q4 kVAr RMS
Q1 kWh Phase B RMS Volts Delivered KVA RMS
Q2 kWh Phase C RMS Volts Received kVA RMS
Q3 kWh Phase A RMS Amps Total kVA RMS
Q4 kWh Phase B RMS Amps Q1 kVA RMS
Delivered kVarh Phase C RMS Amps Q2 kVA RMS
Received kVarh Phase Neutral RMS Amps Q3 kVA RMS
Total kVarh Average Power Factor Q4 kVA RMS
Q1 kVarh RMS Frequency Delivered kVA Phasor
Q2 kVarh RMS External Input 1 Received kVA Phasor
Q3 kVarh RMS External Input 2 Total kVA Phasor
Q4 kVarh RMS Voltage Sag Phase A Q1 kVA Phasor

37
Delivered kVAh RMS Voltage Sag Phase B Q2 kVA Phasor
Received kVAh RMS Voltage Sag Phase C Q3 kVA Phasor
Total kVAh RMS Voltage Sag Any Phase Q4 kVA Phasor
Q1 kVAh RMS Voltage Swell Phase A Delivered kVAr Phasor
Q2 kVAh RMS Voltage Swell Phase B Received kVAr Phasor
Q3 kVAh RMS Voltage Swell Phase C Total kVAr Phasor
Q4 kVAh RMS Voltage Swell Any Phase Q1 kVAr Phasor
Delivered kVAh Phasor Temperature (Degrees C) Q2 kVAr Phasor
Received kVAh Phasor Delivered kW Q3 kVAr Phasor
Total kVAh Phasor Received kW Q4 kVAr Phasor
Q1 kVAh Phasor Total kW For Future Use
Q2 kVAh Phasor Q1 kW For Future Use
Q3 kVAh Phasor Q2 kW For Future Use
Q4 kVAh Phasor Q3 kW For Future Use
Delivered kVArh Phasor Q4 kW For Future Use
Received kVArh Phasor Delivered kVAr For Future Use
Total kVArh Phasor Received kVAr For Future Use
Q1 kVArh Phasor Total kVAr For Future Use
Q2 kVArh Phasor Q1 kVAr RMS For Future Use
Table 7.10.4 Load Profile Metrics
9.7.5 2nd Load Profile Option (Dual Recorder)
An additional and separate, 2nd Load Profile option can be added to the E650 S4x through 1132COM with a soft key upgrade. Once upgraded, the meter can provide up to 16 additional channels. This separate, 2nd Load Profile may use different interval lengths than the 1st Load Profile. The available (256K or 1Meg) memory can be divided between the two Load Profiles in various proportions by percentage, using whole numbers.
9.7.6 Load Profile Engineering Units
Size of LP interval values are 32 bit signed integers. This size allows for the storage of energy metrics in the same engineering units as the summations (mWh, mVAh, mVARh) without the possibility of overflow. If demand instead of energy is desired, then this option is exposed and the meter will divide out the time to give demand in the same units as max demands (mW, mVA, mVAR). Diagnostic values (like voltages, currents, frequency and temperature) are stored in micro (1 millionth) and have the time factored out of them (they are in units of uV, uA,uHz,u°C, not uVh, uAh, etc.). Minimum LP capacity can be calculated. It is dependent on the number of channels, interval length, and whether end block readings (a device used to validate energy channels against the summations in Std. 23) are enabled. For normal size LP (256K), this calculation yields a hard amount of days of LP that will be available. For the large LP (1Meg), the capacity will be guaranteed to be at least 4 times that of the normal LP. There is a status flag in the LP for overflow and the code is looking for and will set this condition if detected.
9.7.7 Load Profile Status Flag
The statuses flagged in load profile are overflow, partial interval, long interval, skipped interval, test mode, power fail, clock set forward, clock set backward, and Daylight Savings Time in effect during interval. Under normal circumstances an overflow error should not occur as the metrics have been scaled to units that preclude this, but with a large backward time set or perhaps some other circumstances, it could be set.

38
9.8 Long Outage Detection
Before a load profile interval has a power outage indicator bit set, the cumulative power outage time during the interval must exceed a programmable length of time. This length of time is programmed in seconds and may range from 1 to 16. Note: Long outage time for load profile is a different quantity than the long outage time used to trigger demand delay. Note: A power fail in load profile is defined as loss of voltage below roughly 85 volts, depending on conditions, for 6 or more line cycles.
9.9 Real Time Billing
Real time billing may be entered via the demand or power factor threshold alerts. Refer to Section 8.2 for real-time communication links.
10 Master Reset
A master reset clears all billing data in the register, while leaving the customer program unchanged. The master reset can be performed in two ways: 1) optically using 1132Prog/1132Com software package and 2) manually using the switches located on the display of the register.
10.1 Performing a master reset optically using 1132Prog/1132Com
Follow the instructions for performing a master reset listed in the help file for 1132Prog/1132Com.
10.2 Performing a master reset manually using switches
NOTE…The meter cover must be removed for this procedure 1. Enter Gyrbox mode by holding a magnet to the 12 O’clock position (top and front of the meter
for 6 seconds. 2. The phase voltage and angles should now be displayed…Remove the magnet. 3. lift the Test Mode switch…you should now see Normal mode display “01 rESET”, which is
MASTER reset, the first display in the sequence. 4. To execute the “01 rESET” menu item, fully depress the reset switch once. 5. To exit the menu display mode, flip the Test Mode switch back to its “at rest” position (flush
with the register housing). If the steps are not completed correctly and in a timely fashion,”01 rESET” will NOT show on the display. No menu item function will occur, but a demand reset will occur if the reset switch is pressed.
10.3 Cold Starts
A cold start will initialize all memory and return the register to an unprogrammed state. The register will accumulate energy and demand data for 15 minute intervals while in this condition. Test mode will not function as normal Caution: Cold starting a device will result in an irreversible loss of billing data and the meter programmed must be restored. A cold start may be accomplished in two ways: optically or manually.
10.3.1 Method 1, Optical Cold Start
The instructions for performing a cold start can be found in the 1132Com help file.
10.3.2 Method 2, Manual Cold Start
NOTE…The meter cover must be removed for this procedure!

39
1. Enter Gyrbox mode by holding a magnet to the 12 O’clock position (top and front of the meter for 6 seconds).
2. The phase voltage and angles should now be displayed…Remove the magnet.
3. lift the Test Mode switch…you should now see Normal mode display “01 rESET”, which is MASTER reset, the first display in the sequence.
4. To change the displayed Menu item, swipe the magnet once for each display menu item until you see “02CLd St”. This is the Cold Start menu item.
5. To execute the menu item, fully depress the reset switch once.
6. To exit the menu display mode, flip the Test Mode switch back to its “at rest” position (flush with the register housing).
If the steps are not completed correctly and in a timely fashion,”01 rESET” will NOT show on the display. No menu item function will occur, but a demand reset will occur if the reset switch is pressed.
10.3.2.1 Register Displays following a Cold Start
After the meter is cold started the meter auto-scrolls through a power-up display sequence and then stops on the error code S00. If you wish to review the power-up display sequence, please consult Section 3.2.1 of this manual entitled “Power-Up Displays”.
11 Manual Unlock Procedure
(Set Communications security temporarily from L4 to L5) 1. Enter Gyrbox mode by holding a magnet to the 12 O’clock position (top and front of the meter for
6 seconds 2. The phase voltage and angles should now be displayed…Remove the magnet. 3. lift the Test Mode switch…you should now see Normal mode display “01 rESET”, which is MASTER reset, the first display in the sequence. 4. To change the displayed Menu item, swipe the magnet once for each display menu item until you see “03UNLOCK”. This is the Communications unlock (optical or AMI) menu item. 5. To execute the menu item, fully depress the reset switch once. 6. To exit the menu display mode, flip the Test Mode switch back to its “at rest” position (flush with the register housing). You now have 2 minutes to execute communication before the L4 security re-engages If the steps are not completed correctly and in a timely fashion,”01 rESET” will NOT show on the display. No menu item function will occur, but a demand reset will occur if the reset switch is pressed.
12 ANSI Type II Optical Communications Port
An ANSI Type II optical communications port mounted on the meter cover provides bi-directional communications between the register and an external programmer or reader. To gain access to any optical port functions, the register must first verify a security code. All billing and program information in the register is readable via the optical port. Communications through the optical port is at 38400 baud and is asynchronous. Data transfer is compatible with a PC serial port or USB port.
12.1 Security

40
When the E650 S4x is programmed, a range of security features can be used. The E650 S4x security scheme consists of five levels of access to the meter, involving two communication security codes and a special switch sequence. Once the meter has been programmed, an operator must log in to the meter to establish a security level before any further programming commands or meter operations will be accepted. The security level granted to the operator must be at least as high as the level programmed for the desired operation or the meter rejects the command.
12.1.1 Optical Port Lock-Out Feature (Gridstream feature only)
The E650 S4x has the ability to completely lock-out the optical port of the meter by sending a command over an AMI network. A meter’s optical port can be made active (not locked out) either indefinitely or for a programmable period of time when the AMI unlock command is sent or a limited time unlock (2 minutes) via a series of switch actuations on the meter (this requires the removal of the meter cover). The AMI network can be configured to send the lock-out command once per day in the event the meter’s optical port is left unsecured unintentionally. An unsecured optical port will follow the L1 – L5 meter security as it exists in today’s Landis + Gyr ANSI meters. An intervening outage keeps the optical port unsecured for the remaining duration of the lock-out. If the outage duration exceeds the lock-out time OR if the outage duration causes stand-by mode, the meter secures the optical port upon power up. Any attempt to initiate an optical port lock-out procedure, optically will be rejected by the meter.
12.1.2 Magnetic / DC Detection / Hall Effect Switch
The E650 S4x has the ability to set an error flag for each phase if leading current angles above 10° are detected. The error flags are based on a fixed per phase threshold angle of 10° meter form. Per phase start-stop events can be enabled to be logged in meter event log along with displaying optional error codes (M04) on LCD of meter. The triggering of this event indicates that conditions consistent with magnetic/DC tamper may be present. In addition, the meter is equipped with a Hall Effect sensor to detect the presence of an external magnetic field outright. This activity will trigger an event to be posted in the event log.
12.1.3 Tilt Tamper Detection
The E650 S4x has an on-board tilt sensor for detection of vibration and / or “tilt” as a means to alert a utility that a meter has possibly been removed from its socket. • If vibration/tilt was detected in the 10 seconds before power down, reset, etc. this can indicate meter removal. • If vibration/tilt was detected in the 10 seconds after power up, reset, etc. this can indicate meter insertion. Note: If any of the above conditions are met, an event can be logged in the meter’s event log.
12.1.4 E650 S4x ANSI Security Information
These are the five levels of security for E650 S4x meters. Each security code is 20 digits in length and all 20 digits must be used. Each level includes all capabilities of the lower levels: L1 - Allows for the meter to be read only. No programming or procedures may be executed. L2 - Allows for demand resets to be done. L3 - Allows for the following additional programming tasks to be performed:
o Set date and time o Program or modify TOU rates and calendar o Program or modify the display table o Program or modify the ANSI specific utility information

41
o Program or modify the tables associated with modem communication o Program or modify network ID o Program or modify output relays o Program or modify load profile configuration
L4 - Allows for all programming and procedures to be done, with the exception of device configuration. L5 - Allows everything to be done, including device configuration. This is needed when adding TLC, load profile capacity, or adding a second Load Profile recorder capability. It is what is required when altering which ANSI standard tables or Manufacturer tables are enabled in the meter.
13 Voltage Quality Information
The E650 S4x continually monitors voltage and provides information for evaluating voltage quality. Through 1132Prog/1132Com, the user can program in voltage sag and swell threshold values (such as 90% and 110%, for example). When a voltage exceeds the sag or swell threshold, the information is recorded in the meter’s event log, load profile (if channels are programmed for that function), or communicated via a programmable output.
13.1 Sag Information
A threshold value is provided for detecting voltage sags in load profile. If the voltage drops below this threshold, then a sag counter is incremented once per 0.3 seconds. This counter continues to increment until the voltage is no longer less than the sag threshold. At the beginning of each new load profile interval, this counter is zeroed. A load profile channel may be selected to record the value of the sag counter at the end of each load profile interval. Although there is only a single sag threshold for load profile, each phase can have its own channel.
13.2 Swell Information
A threshold value is provided for detecting voltage swells in load profile. If the voltage exceeds this threshold, then a swell counter is incremented once per 0.3 seconds. This counter continues to increment until the voltage no longer exceeds the swell threshold. At the beginning of each new load profile interval, this counter is zeroed. A load profile channel may be selected to record the value of the swell counter at the end of each load profile interval. Although there is only a single swell threshold for load profile, each phase can have its own channel.
13.3 Voltage Sag Alert
A threshold is provided for alerting voltage sag. The voltage is inspected and an alert set when it drops below the sag alert threshold. This alert is cleared when the voltage is no longer below the sag alert threshold. This threshold is separate from the load profile threshold.
13.4 Voltage Swell Alert
A threshold is provided for alerting a voltage swell for output relays. The voltage is inspected and an alert is set when it exceeds the swell alert threshold. This alert is cleared when the voltage is no longer above the swell alert threshold. This threshold is separate from the load profile threshold.
13.5 Instantaneous Readings
All programmed Demand metrics are available as "instantaneous" values, and are displayable and available through the optical port or the communications link:
Voltage per Phase Current per Phase Neutral Current kW kVAR rms and kVAR Phasor

42
kVArms and kVA Phasor These values will be updated at a rate based on the rate of incoming data. The update rate for voltage will be 1 second and for other values the update rate will be no longer than four seconds. On-line updates may vary depending on communications rate and query time.
13.6 Self-Reads
When actuated, the self-read function will save a copy of all energy and demand information, including TOU metrics, and mark the current date and time. Self-read data is available for display on E650 S4x as well.
Note: You do not need to have Load Profile programmed for self-reads to work.
13.6.1 Self-Read Data
The following list contains the self-read items that are captured at the time of a self-read. All Demand metrics (the three highest) will be Time and Date Stamped: ENERGY (Total and for each rate programmed):
13.6.1.1 Delivered: kWh, kVArh RMS, kVAh RMS, kVAh Phasor, kVArh Phasor, Q1, Q2, Q3, Q4 for each Metric
Received: kWh, kVArh RMS, kVAh RMS, kVAh Phasor, kVArh Phasor, Q1, Q2, Q3, Q4 for each Metric Total: kWh, kVArh RMS, kVAh RMS, kVAh Phasor, kVArh Phasor, Q1, Q2, Q3, Q4 for each Metric
13.6.1.1.1 DEMAND (Total and for each rate programmed):
Delivered: kW, kVAr RMS, kVA RMS, kVA Phasor, kVAr Phasor, Received: kW, kVAr RMS, kVA RMS, kVA Phasor, kVAr Phasor Total: kW, kVAr RMS, kVA RMS, kVA Phasor, kVAr Phasor Cumulative: kW, kVAr RMS, kVA RMS, kVA Phasor, kVAr Phasor Continuous Cumulative: kW, kVAr RMS, kVA RMS, kVA Phasor, kVAr Phasor Max (3 highest): All demand metrics, including time, date, and rate
13.6.1.1.2 POWER FACTOR:
For Cumulative Demand, Continuous Cumulative Demand For the Three highest Max Demands for each rate programmed NOTE...the demand metric to be used for posting PF is selectable in 1132 PROG software.
13.6.1.1.3 COINCIDENT DEMAND (Total and for each rate programmed):
Total kW at Max Total kVAr: Three for each rate Programmed Total kW at Max Total kVA: Three for each rate Programmed Total kW at Min Power Factor: Three for each rate Programmed Total kVA at Max Total kW: Three for each rate Programmed Total kVA at Max Total kVAr: Three for each rate Programmed Total kVA at Min Power Factor: Three for each rate Programmed Delivered kW at Max Delivered kVAr Phasor-RMS: Three for each rate Programmed Delivered kW at Max Delivered kVA Phasor: Three for each rate Programmed Total kVAr Phasor-RMS at Max Total kW: Three for each rate Programmed Total kVAr Phasor-RMS at Max Total kVA: Three for each rate Programmed Total kVA Phasor at Max Total kW: Three for each rate Programmed

43
13.6.1.1.4 Coincident Power Factor:
Power Factor at Max Total kW: Three for each rate Programmed Power Factor at Max Total kVAr RMS: Three for each rate Programmed Power Factor at Max Total kVA RMS: Three for each rate Programmed Power Factor at Max Delivered kW: Three for each rate Programmed Power Factor at Max Delivered kVAr RMS: Three for each rate Programmed
13.6.2 Number of Self-Reads
The E650 S4x is capable of storing up to twelve sets of self-read data. A self-read initiates the transfer of current data into the next available self-read memory block, followed by a demand reset, if desired. Only the most recent twelve self-reads are retained. The oldest self-read is replaced by the most recent when the programmable number has been reached.
13.6.2.1 Self-Read at Season Change
If a season change and a self-read occur at 00:00:00 of the same day, the self-read actions occur before the season change. Previous season data is stored in the self-read information.
13.6.2.2 Initiating a Self-Read
You can program an automatic self-read to occur according to the methods listed below. The first three methods (day of the month, hours since the last reset, every day) are mutually exclusive, while the last two methods (after a manual reset and through an external input) can be selected in conjunction with one of the other methods.
13.6.2.2.1 A particular day of the month
Self-read occurs on one of the programmable self-read days from 1 to 28 at 00:00:00 on the specified day. Therefore, selecting the first day of the month will actuate self-read at midnight just after the last day of the previous month. Calendar month billing is obtained by selecting the first day of the month as the day which the read should occur.
13.6.2.2.2 Every day
Self-read will occur each night at midnight or 00:00 on the clock.
13.6.2.2.3 After a manual reset
A self-read occurs after a demand reset is performed using any method except for the demand reset method concurrent with a season change. The self-read data is stored prior to the actual reset of indicating and cumulative demands.
13.6.2.2.4 Through an external input
A self-read is initiated through external input #1. The input is only available when the E650 S4x optional relay board is installed. Using the external input to actuate self-reads may be programmed to occur on either the presence or absence of a signal on external input #1. Note: Test Mode disables external inputs.
13.6.3 Self-Read Displays
When self-read displays are enabled, self-read data will follow the user-programmed display sequence. If the display is currently in the “normal” mode, self-reads are enabled, and there has been an automatically generated self-read, this data will follow the normal display sequence. Self-read data is displayed using the same programmed display sequence that normal real-time data uses.

44
Self-read data will be displayed in chronological order starting from the most recent block. For example, if the time, date, and maximum kilowatts are to be displayed in the normal mode sequence, then when self-reads are displayed, the time, date, and maximum power data recorded in the self-read will be displayed beginning with the most recent self-read data.
14 Outputs, Inputs, and Communications
The E650 S4x option board has up to four form “C”, optoMOS, general purpose output relays (relays 1 through 4), and one or two general purpose inputs. Two different input/output option board combinations can be ordered and programmed as outlined in the following chart.
Input/Output Options
Two Relays: Each relay programmable for KYZ, EOI, LC, DTA, VTA, GyrBox Alert Output, and Power Factor Threshold Alerts.
One Input: Input programmable for Real Time, Temperature Sensor, Load Profile Channel Input, or self-read activation.
Four Relays: Each relay programmable for KYZ, EOI, LC, DTA, VTA, GyrBox Alert Output, and Power Factor Threshold Alerts.
Two Inputs: Input 1 programmable for Real Time, Temperature Sensor, and Load Profile Channel Input. Input 2 programmable for Load Profile Channel Input.
Table 8.0 Option Board Inputs/Outputs
NOTE: In addition to the external relays, the E650 S4x has four additional internal or “virtual” relays (relays 5 through 8) available and programmable with the 1132 Software
14.1 Output Cables and Connectors
The E650 S4x meter equipped with options can be provided with an output cable which exits through the meter base via a 20 pin connector.
The electronic option board on the E650 S4x meter is a plug-in type in order to facilitate easy addition or removal. For quick reference, each meter has a tag on the option cable showing the option installed on that meter, along with the wire colors, see table below:
Option Connections
PIN # DESCRIPTION WIRE COLOR PIN # DESCRIPTION WIRE COLOR
1 Input 2A Black 11 Input 1A Blue/Black
2 Input 2B White 12 Input 1B Black/White
3 Relay 3 COM Red 13 Relay 1 COM Red/White
4 Relay 3 N/O Green 14 Relay 1 N/O Green/White
5 Relay 3 N/C Orange 15 Relay 1 N/C Blue/White
6 Relay 4 COM Blue 16 Relay 2 COM Black/Red
7 Relay 4 N/O White/Black 17 Relay 2 N/O White/Red
8 Relay 4 N/C Red/Black 18 Relay 2 N/C Orange/Red
9 Unused Green/Black 19 Unused Blue/Red
10 Unused Orange/Black 20 Unused Red/Green
Table 8.1 Option Connectors and Wire Colors for Output Cables

45
14.2 Inputs 1 and 2
14.2.1 Real-Time Communication Links
The real-time communications link allows the utility to change the active rate in real time. Real-time rates may be achieved in two ways: 1) External Input 1 may be programmed to initiate a real-time rate; or 2) a communication command may be used to initiate a real-time rate. Real time may be used to reduce system peak demand by switching to a premium rate or to encourage more usage by switching to a low-cost rate. To use real-time communications, install a communications board in the meter. The active rate may be changed at any time by sending the appropriate command. Consult the 1132Prog/1132Com help file for more information about the necessary commands. Using the real-time input
1) Program the meter so that Input 1 is configured for real-time. 2) Select a rate, A, B, C, D, or E, to use when real-time is active. 3) Select whether a high or low signal activates real-time (1132Prog/1132Com for more
information). 4) Attach the activating device to Input 1 wires on the option cable. Polarity should match
program. Note: The activating device must be capable of supplying the voltage and current indicated in Section 8.4. To use the low range, resistors R1 and R2 must be removed with a wire cutter. Typically the real time rate used is a different rate from those defined in the TOU schedule.
14.2.2 External Load Profile Inputs
Inputs 1 and 2 may be programmed as load profile inputs. Each input may have its own channel in load profile. In this mode, the meter acts as load profile recorder with two inputs. Other channels may be used for recording any of the meters metrics explained in the load profile section.
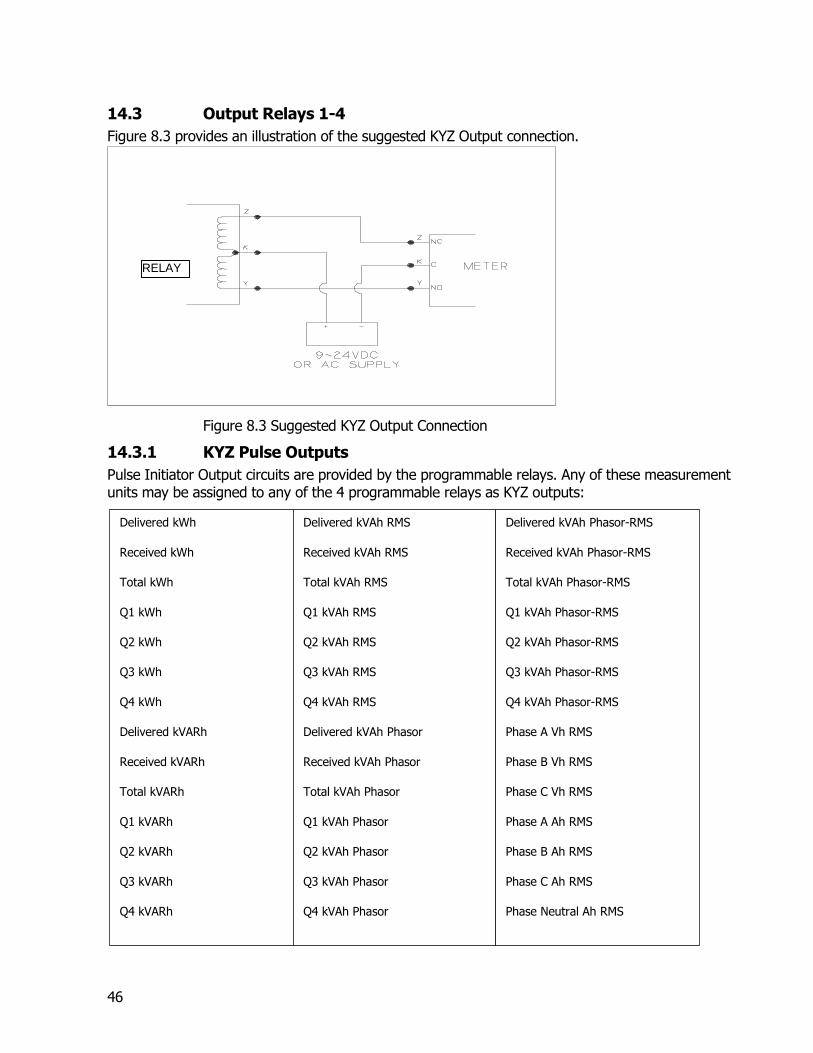
46
14.3 Output Relays 1-4
Figure 8.3 provides an illustration of the suggested KYZ Output connection.
RELAY
Figure 8.3 Suggested KYZ Output Connection
14.3.1 KYZ Pulse Outputs
Pulse Initiator Output circuits are provided by the programmable relays. Any of these measurement units may be assigned to any of the 4 programmable relays as KYZ outputs:
Delivered kWh
Received kWh
Total kWh
Q1 kWh
Q2 kWh
Q3 kWh
Q4 kWh
Delivered kVARh
Received kVARh
Total kVARh
Q1 kVARh
Q2 kVARh
Q3 kVARh
Q4 kVARh
Delivered kVAh RMS
Received kVAh RMS
Total kVAh RMS
Q1 kVAh RMS
Q2 kVAh RMS
Q3 kVAh RMS
Q4 kVAh RMS
Delivered kVAh Phasor
Received kVAh Phasor
Total kVAh Phasor
Q1 kVAh Phasor
Q2 kVAh Phasor
Q3 kVAh Phasor
Q4 kVAh Phasor
Delivered kVAh Phasor-RMS
Received kVAh Phasor-RMS
Total kVAh Phasor-RMS
Q1 kVAh Phasor-RMS
Q2 kVAh Phasor-RMS
Q3 kVAh Phasor-RMS
Q4 kVAh Phasor-RMS
Phase A Vh RMS
Phase B Vh RMS
Phase C Vh RMS
Phase A Ah RMS
Phase B Ah RMS
Phase C Ah RMS
Phase Neutral Ah RMS
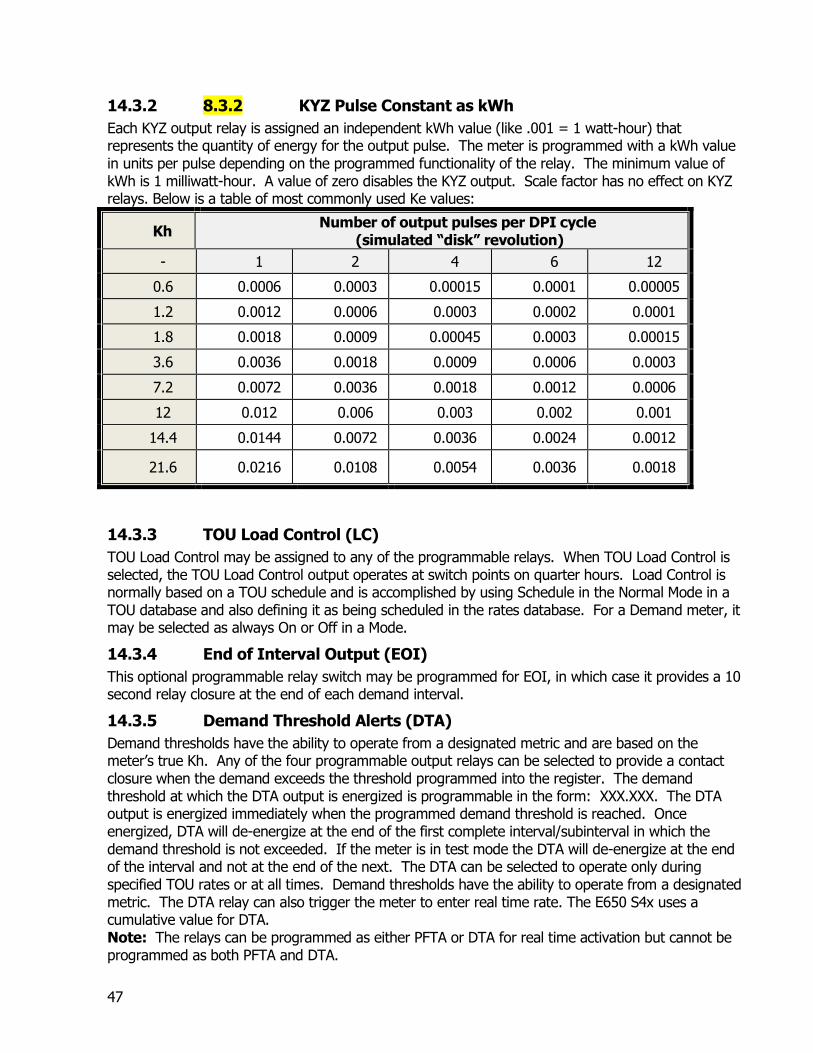
47
14.3.2 8.3.2 KYZ Pulse Constant as kWh
Each KYZ output relay is assigned an independent kWh value (like .001 = 1 watt-hour) that represents the quantity of energy for the output pulse. The meter is programmed with a kWh value in units per pulse depending on the programmed functionality of the relay. The minimum value of kWh is 1 milliwatt-hour. A value of zero disables the KYZ output. Scale factor has no effect on KYZ relays. Below is a table of most commonly used Ke values:
Kh Number of output pulses per DPI cycle
(simulated “disk” revolution)
- 1 2 4 6 12
0.6 0.0006 0.0003 0.00015 0.0001 0.00005
1.2 0.0012 0.0006 0.0003 0.0002 0.0001
1.8 0.0018 0.0009 0.00045 0.0003 0.00015
3.6 0.0036 0.0018 0.0009 0.0006 0.0003
7.2 0.0072 0.0036 0.0018 0.0012 0.0006
12 0.012 0.006 0.003 0.002 0.001
14.4 0.0144 0.0072 0.0036 0.0024 0.0012
21.6 0.0216 0.0108 0.0054 0.0036 0.0018
14.3.3 TOU Load Control (LC)
TOU Load Control may be assigned to any of the programmable relays. When TOU Load Control is selected, the TOU Load Control output operates at switch points on quarter hours. Load Control is normally based on a TOU schedule and is accomplished by using Schedule in the Normal Mode in a TOU database and also defining it as being scheduled in the rates database. For a Demand meter, it may be selected as always On or Off in a Mode.
14.3.4 End of Interval Output (EOI)
This optional programmable relay switch may be programmed for EOI, in which case it provides a 10 second relay closure at the end of each demand interval.
14.3.5 Demand Threshold Alerts (DTA)
Demand thresholds have the ability to operate from a designated metric and are based on the meter’s true Kh. Any of the four programmable output relays can be selected to provide a contact closure when the demand exceeds the threshold programmed into the register. The demand threshold at which the DTA output is energized is programmable in the form: XXX.XXX. The DTA output is energized immediately when the programmed demand threshold is reached. Once energized, DTA will de-energize at the end of the first complete interval/subinterval in which the demand threshold is not exceeded. If the meter is in test mode the DTA will de-energize at the end of the interval and not at the end of the next. The DTA can be selected to operate only during specified TOU rates or at all times. Demand thresholds have the ability to operate from a designated metric. The DTA relay can also trigger the meter to enter real time rate. The E650 S4x uses a cumulative value for DTA. Note: The relays can be programmed as either PFTA or DTA for real time activation but cannot be programmed as both PFTA and DTA.

48
14.3.6 Power Factor Threshold Alerts (PFTA)
The Power Factor Thresholds can be programmed to operate on lagging loads, leading loads, or both and with a value of .001 to 0.999. The relay is activated when the Power Factor threshold is exceeded and is deactivated at the end of the next complete subinterval in which the Power Factor does not exceed the threshold value. The register, through software, allows the PFTA function to cause the programmed real-time rate to go into effect.
14.3.7 Voltage Threshold Alerts (VTA)
Voltage Threshold Alerts operate in much the same way as DTA. The relay activates when the Voltage Threshold is exceeded and is deactivated at the end of the next complete subinterval in which the VTA does not exceed the threshold value. Voltage Thresholds can be selected to operate only during specified TOU rates or at all times.
14.3.8 Diagnostic Alerts (GTA)
One relay can be programmed for GyrBox Diagnostic Alerts. Whenever any diagnostic check fails, an alert is given. The alert is not cleared until all diagnostics are passed.
8.3.8.1 Temperature Alert (TA) Temperature alerts operate from a threshold set in the 1132 Prog software. The threshold is in degrees Fahrenheit.
14.3.9 Operation of Outputs During Test Mode
During test mode, all outputs are available except for load control.
14.4 Electrical Specifications for KYZ Boards (absolute maximums)
14.4.1 Output Relays 1-4 (See Figure 8.3 in Section 8.3 for the suggested KYZ output connection)
60 mA maximum 350 Vdc/240Vac rms maximum On resistance 50 ohms maximum
14.4.2 Inputs 1 and 2
Inputs 1 & 2 Standard 5V system*
Voltage 14-24V (DC) 16-26V (AC)
Low: 0-4V (AC/DC)
High: 4-6V (DC)
Low: 0-1V (DC)
Current 10 mA Max. 10mA Max.
*Requires removal of resistors (R5 and R6)
14.5 Optical Port Communications
The E650 S4x meters have an ANSI Type II optical port. The meter may be read by any ANSI device for this meter type.
14.6 RS-232/RS-485 Communications Board
An optional RS-232/RS-485 communications board is under development. It provides an alternate communications channel to the meter. Communications boards are installed parallel to the register board. The 12 pin connector plugs into the same header as the optional relay board. RS-232/RS-485 communications are transmitted via an isolated three-wire interface located in the meter’s base using an RJ-11 connector. The three lines (transmit, receive, and ground) each provide 2500 Vrms isolation. This interface uses the same protocol as the optical port. A 38400 baud rate is supported.

49
14.6.1.1 Ethernet Communications Board
Ethernet I/O option is under development. The device’s capabilities are similar to that of the Lantronix external box, but under the cover. The Ethernet option is usable in a ‘standalone’ application and as part of a RS485/RS232 network.
15 Troubleshooting and Error Codes
NOTE…A complete list of error definitions can be found in the Help content of the 1132 PROG software.
15.1 Error Codes
15.1.1 Non-Scrolling errors
If non-scrolling errors are selected in 1132Prog, the error code(s) byte will lock at the end of the display sequence. Activating the reed switch will cause the first display in the display sequence to appear. After 1 minute, auto scrolling will resume and continue until the error display once again shows and again, locks for 1 minute.
15.1.2 Scrolling errors
If scrolling errors are selected in 1132Prog, the selection will allow auto-scrolling to continue with the error code(s) byte inserted at the end of the display sequence. The display sequence will continue in auto-scroll.
Error Condition
Non-Scrolling Error Display for Standard (S) Errors
Scrolling Error Display For Standard (S) Errors
Un-programmed Register Error
ERR S00
ERR S00
Configuration Error ERR S01 ERR S01 RAM Failure Error
ROM Failure Error
Non-volatile Memory Error Clock Error
Measurement Error Low Battery Voltage Error
Demand Overload Error
Power Failure Error Tamper Detect Error
ERR S03
ERR S04
ERR S05 ERR S06
ERR S07 ERR S08
ERR S10
ERR S11 ERR S12
ERR S03
ERR S04
ERR S05 ERR S06
ERR S07 ERR S08
ERR S10
ERR S11 ERR S12
Reverse Rotation Error ERR S13 ERR S13
Error Condition
Non-Scrolling Error Display for Manufacturer (M)
Errors
Scrolling Error Display For Manufacturer (M) Errors

50
Using Default Time Error
Line Freq Time Adjust Error
Voltage Phase Error
Teridian-PIC Sync Error
Magnetic Tamper Error
Stuck Switch Error
Temp Thresh Exceeded Error
Power Fail Data Restore Error
Phase A Voltage Out Error
Phase B Voltage Out Error
Phase C Voltage Out Error
Valid Service Error
Stand-By Energy Error
RTOS Event Present Error
Firmware Failure Error
Demand Overload Error #1
Demand Overload Error #2
Demand Overload Error #3
Demand Overload Error #4
Demand Overload Error #5
Demand Overload Error #6
Demand Overload Error #7
Demand Overload Error #8
Demand Overload Error #9
Demand Overload Error #10
Demand Overload Error #11
ERR M00
ERR M01
ERR M02
ERR M03
ERR M04
ERR M05
ERR M06
ERR M07
ERR M08
ERR M09
ERR M10
ERR M11
ERR M12
ERR M13
ERR M15
ERR M16
ERR M17
ERR M18
ERR M19
ERR M20
ERR M21
ERR M22
ERR M23
ERR M24
ERR M25
ERR M26
ERR M00
ERR M01
ERR M02
ERR M03
ERR M04
ERR M05
ERR M06
ERR M07
ERR M08
ERR M09
ERR M10
ERR M11
ERR M12
ERR M13
ERR M15
ERR M16
ERR M17
ERR M18
ERR M19
ERR M20
ERR M21
ERR M22
ERR M23
ERR M24
ERR M25
ERR M26

51
Demand Overload Error #12
Demand Overload Error #13
Demand Overload Error #14
Demand Overload Error #15
Demand Overload Error #16
Gyrbox D1 Diagnostic
Gyrbox D2 Diagnostic
Gyrbox D3 Diagnostic
Gyrbox D4 Diagnostic
Gyrbox D5 Diagnostic
Gyrbox D6 Diagnostic
Gyrbox D7 Diagnostic
Bottom Feed Active
Leading Current PhA
Leading Current PhB
Leading Current PhC
Audit Trail Log Full
Meter Not Sealed
Alert 1 Set
Alert 2 Set
Alert 3 Set
Alert 4 Set
Alert 5 Set
Alert 6 Set
Alert 7 Set
Alert 8 Set
ERR M27
ERR M28
ERR M29
ERR M30
ERR M31
ERR M32
ERR M33
ERR M34
ERR M35
ERR M36
ERR M37
ERR M38
ERR M40
ERR M41
ERR M42
ERR M43
ERR M44
ERR M45
ERR M48
ERR M49
ERR M50
ERR M51
ERR M52
ERR M53
ERR M54
ERR M55
ERR M27
ERR M28
ERR M29
ERR M30
ERR M31
ERR M32
ERR M33
ERR M34
ERR M35
ERR M36
ERR M37
ERR M38
ERR M40
ERR M41
ERR M42
ERR M43
ERR M44
ERR M45
ERR M48
ERR M49
ERR M50
ERR M51
ERR M52
ERR M53
ERR M54
ERR M55

52
External Input Error
Default SysConfig & Calibration in Use
Default Phase to Phase Calibration Constants in Use
Measurement Overrun Detected
Measurement Timeout Detected
Measurement Bad CRC Detected
Measurement Lockout Detected
Incorrect CRC on Sys Config Write Detected
Incorrect CRC on Cal Data Write Detected
ERR M56
ERR M57
ERR M58
ERR M59
ERR M60
ERR M61
ERR M62
ERR M63
ERR M64
ERR M56
ERR M57
ERR M58
ERR M59
ERR M60
ERR M61
ERR M62
ERR M63
ERR M64
Table 9.1 Error Codes
15.2 Unprogrammed Register Error (Error S00)
If the meter is unprogrammed, error code S00 will be displayed, if it is enabled. Suggested Action: To clear this error, program the meter.
15.3 Configuration Error (Error S01)
A configuration error indicates that essential data installed at the factory is missing or has become corrupt. Suggested Action: To clear this error, cold start the meter. If the error persists, return the meter for servicing
15.4 Memory/Load Profile Errors:
RAM Error, S03
ROM Error, S04

53
Non-Volatile Memory Error, S05
A hardware failure in the serial EEPROM or a checksum error in the ROM, SRAM, or EEPROM triggers a memory/load profile error. The error codes above indicate which is the area of memory in question.
Suggested Action: To clear the errors S03, S04 and S05, cold start and reprogram the meter. If the error reappears, return the meter for service.
15.5 Clock Error (S06)
A clock error is generated whenever the meter loses it’s time reference. This is most often followed by the meter entering standby mode until the clock reference is restored by setting the time with 1132
COM software or by an AMI system that supports TOU time set functions.
Suggested Action: Set the meter time and date with 1132 COM or allow the AMI system (if the meter is equipped with an AMI device) to set the correct time and date.
15.6 Measurement Diagnostics Failure (Error S07)
This error indicates a problem with the measurement cuirtry and/or calculation processes. This is a critical error if the meter is out of calibration. Suggested Action: To clear this error, cold start the meter. If the error persists, return the meter for servicing.
15.7 Low Battery Error (Error S08)
The battery voltage is automatically checked each day at 4 a.m. The error is set when the voltage
drops to 2.5 0.2 volts. A check of the battery may be initiated manually, any time a manual reset is performed or the register goes from Auto-scroll mode to Manual scroll mode by swiping the reed switch with a magnet. Note: A good charge on the supercap does not mask the state of a bad battery. Suggested Action: To clear this error, install a new battery and perform a battery retest as described above.
15.8 Demand Overload Error (S10)
This error indicates one of the Demand Overload thresholds has been exceeded. Suggested Action: Identify the Demand Threshold that has been exceeded and change the threshold appropriately in meter program, or, with a transformer rated meter, use a higher ratio CT or with a self –contained, use a higher class meter. To clear the error use the “Clear Errors” function in the Reset dropdown of 1132 COM. The error can also be cleared when a demand reset is performed, if that function has been selected when setting up the meter program.
15.9 Power Failure Error (S11)
This is typically caused by an unexpected processor reset.
Suggested Action: Clear the error using the “Clear Errors” function in the Reset dropdown of 1132 COM. If the error re-occurs, return the meter for servicing.
15.10 Tamper Detect Error (S12)
The Tamper Detect Error is set when the meter detects a power outage followed by reverse energy flow (as when a meter has been pulled from its socket and then re-inserted upside down).
Reverse Rotation Error (S13) This error is set when there is negative energy flow registered in the meter. The error can be disabled in the meter program if negative energy flow is expected at any given installation.

54
15.11 Demand Overload Errors (Errors M16 through M31)
At the end of every interval the current demand values for all metrics are compared against the programmed overload values. If the value of any is equaled or has exceeded the programmed threshold, an overload error code is latched. Programming the overload values to zero will disable this function. The overload value is cleared if a cold start or reprogramming is initialized. Also, a demand reset may be programmed to clear the demand overload error. Typically, demand overload is set to 83.3% of the system's capacity. Suggested Action: With a transformer rated meter, use a higher ratio CT. With a self –contained, use a higher class meter.
15.12 Stuck Switch Error (Error M05)
Error M05 is displayed when any one of the following situations occur: 1) Reset switch is in active mode for a period of four minutes; 2) Test Mode switch is in active mode for a period of 4 minutes after the exiting test mode via the optical command or test mode time out. Suggested Action: This error will be cleared when the switches are returned to normal. If the error does not clear, return the meter for servicing.
15.13 Phase Errors:
Phase A Voltage Out Error, M08 Phase B Voltage Out Error, M09 Phase C Voltage Out Error, M10 Valid Service Error, M11
The E650 S4x registers the loss of phase voltage by blinking the potential indicator for that phase; see Figure 3.1.1. No displays appear other than the error code displays, which, if included in the program’s display sequence, may be seen by swiping a magnet over the reed switch at the 12 O’clock position at the top and front of the meter. The Valid Service error occurs if the meter has never detected a valid service type. Phase error displays disappear when voltage is restored. Normal scrolling continues automatically. The Valid Service type error clears when the meter is put in a valid service. The E650 S4x meter is powered from phase A, so any loss to this phase powers down the whole register and is treated as a normal power failure (unless the “Metrology powered from any energized phase” (3 phase power supply option has been configured at the time the meter is manufactured). Loss of phase B or C will cause an error message to appear. A phase is considered lost at 50% of the nominal voltage. Based on the programmable option of the reader/programmer, the phase error display discontinues auto-scrolling either temporarily or completely. When auto-scrolling is temporarily discontinued, the phase error appears on the display until the reed switch is swiped with a magnet. Auto-scrolling then continues for one pass. Any other error codes will appear in their programmed manner with the phase error(s) display returning at the end of this sequence. If auto-scrolling is completely discontinued, the register may only be read electronically.
15.14 Disabling Display of Error Codes
Each error code may be individually programmed to be displayed or not displayed. All error codes will still be flagged by the register. Reference the 1132Prog/1132Com help file for more details. The reader programmer may clear any error flag, regardless whether or not it is displayable. The meter has a programmable mask to allow the reader/programmer to enable or disable individual error conditions. The reader/programmer may clear any error condition by toggling the appropriate mask bit. If cleared, the register retests for the error.

55
16 Measurement Techniques
The following sections briefly describe the methods of measurement for the E650 S4x meter. For a more detailed discussion of measurement techniques used in metering, please refer to the Handbook for Electricity Metering.
16.1 Metric Calculations
The term metric refers to any electrical units being measured. Typical metrics are watthours, VA hours, kVA, kVAR, volts, and amps, to name a few. Other values such as power factor are based upon these measurements.
16.1.1 Pulse Values and Energy Metrics
Arithmetic measurements are generated by basic mathematical functions such as multiplication, division, subtraction, and addition. Watthours are an example of arithmetic metric. Each voltage sample is multiplied by each current sample and the product is accumulated. Pulse values: In E650 S4x, all values for energies and demands are calculated in engineering units, and therefore, no meter form specific constant (kFactor or kh) is needed to convert these values. Pulses are only used as a unit for a physical pulse signal that comes out of the meter (KYZ and calibration pulses). These do need a conversion and the traditional kh is used for the calibration pulse and the KYZ ke values are scalable via programming. Energy metrics: The S4x calculates active energy (Wh) and reactive energy (VARh) from the voltage and current samples as described above. In the C12.19 Implementation specification these metrics are named “milliwatthours” and “milliVARhours”. Then using Wh and Varh, apparent energy is calculated using the Phasor method (VAh = SQRT(Wh^2 + VARh^2)). This metric in the C12.19 Implementation specification is named “milliVAhours phasor”. Additionally, the apparent energy is calculated using the RMS method which uses the RMS voltage and current values where VAh = ∑Vrms*Irms across all phases. For delta services the voltages are the line to line voltages and the currents are those on each leg of the delta, where the meter performs a transformation on the measured line to neutral values in order to derive these values. This metric in the C12.19 Implementation specification is named “milliVAhours”. Finally a reactive metric is computed from the Wh and milliVAhours using the phasor equation and solving for VARh as such VARh = SQRT(VAh^2-Wh^2). This metric in the C12.19 Implementation specification is named “milliVARhours phasor-rms”. For each of these five energy metrics, there are 7 summations: Delivered, Received, Total, Q1, Q2, Q3, and Q4. For each of these 5 metrics there are 3 demands: Delivered, Received, and Total. There is a PF demand value and it is calculated using one specified active metric and one specified reactive metric of all of the 15 metrics available as demands.
16.2 Digital Implementation
For a digital implementation, the voltage and current waveforms must be transformed into a digital format. Once digitized, the values must be used to calculate metrics, and the metrics are then stored and made available for end use. Metrics are either presented on an LCD display or read from memory through a communication port.
17 Overview of E650 S4x Implementation
Voltage and current transducers provide a representation of the actual voltage and current waveforms as input to a power meter interface ASIC (ASIC). The ASIC contains a digital signal processor (DSP) where energy, power, and other measurements are calculated.
17.1 Input Circuitry
The design of the input circuitry allows for the meter to withstand 10KV transient surges without damage. Resistors are used to reduce the line voltage to a level compatible with the solid state circuitry. The scaled potential is input into the ASIC. Similarly, the current is converted for input to

56
the ASIC. The transformer-rated E650 S4x uses current transformer sensors while the self-contained K-base version uses an embedded coil sensor in each phase. Embedded coils provide an output that is proportional to the rate of change of the load current with respect to time, and the external input to the ASIC provides an integration function to restore the current wave form to its original shape. Both types of current sensors provide 10 kV of isolation.
17.2 Sampling Rate
Voltage and current pairs are sampled by the delta sigma converters at a sampling frequency of 2.52 kHz. These samples are digitally filtered to provide a 21 bit representation of the input signal. Note: Frequency is calculated when potential is applied to phase A.
17.3 Register Section
The DSP in the measurement ASIC calculates metric values. A communications serial bus is used to transfer metric data from the ASIC to the micro-controller. These are both on the primary printed wiring board. All metric data is calculated by the DSP except for VA. VA is calculated by the micro-controller.
17.4 Negative Energy Metric
The E650 S4x register may be programmed to treat negative energy in three different ways, security (add) mode, detent (ignore) mode, and net (positive + negative). In all instances of negative energy measurement, the digital power indicator will operate from right-to-left and the negative energy accumulator increments.
17.5 Security (Add) Mode
In security (add) mode, negative energy is treated as if it were positive energy. kWh is accumulated positively in the total kWh register. Demand functions operate in their normal manner. All optional outputs function normally. Negative energy is also accumulated in the negative energy register.
17.6 Detent (Ignore) Mode
Negative energy is accumulated in the negative energy register and ignored in the normal (positive) energy register used for billing purposes. In detent mode, all negative watt and watthour measurements are ignored for billing purposes.
17.7 Net Mode
In Net mode negative watthour measurements are accumulated and subtracted from the normal (positive) energy register for billing purposes.
18 Reactive Metrics in the E650 S4x Meter
The E650 S4x is a true four quadrant and as such differs from the S4e. All Reactive metrics are displayed recorded in the read record at face value. In other words, there is no assigning of those metrics to a “kM” or “kM3”” designate as there was in S4e and in 1132Prog, the program building software. In an 1132 meter read file, the meter will present all reactive metrics labeled appropriately.
18.1 VArms, VARrms, kVAR Phasor, and kVA Phasor measurements
We have intentionally avoided using the terms lead and lag and have chosen Delivered and Received, where the definition of these summations and the resultant Total register can be defined by the customer in terms of quandrants (e.g. which quadrant(s) the meter is in to accumulate in its Delivered VARh summation). Which combinations are ultimately available is controlled by the software (as can be imagined, there are many possibilities, many of which are ambiguous, and so these are not exposed as choices). As a rule then, the Total quantity can be set to Add, Net, or Ignore, where Add means Total = Delivered + ǀReceivedǀ, Net means Total = Delivered – ǀReceivedǀ, and Ignore means Total = Delivered.

57
NOTE…”ǀReceivedǀ” means the absolute or positive value of the received metric.
18.2 50 Hz Operation
The E650 S4x meter is normally calibrated at 60 Hz, but will operate at either 50 or 60 Hz. Upon power-up, the meter checks the frequency, and operates on the frequency it registers.

58
18.3 Power Quadrant Indicators
On the LCD, a numbered four quadrant “pie” indicates the combined load on the meter. The chart below outlines the load when that quadrant is highlighted.
Quadrant I Positive watts (delivered) VAR (delivered) / (lagging power factor)
Quadrant II Negative watts (received) VAR (delivered) / (leading power factor)
Quadrant III Negative watts (received) VAR (received) / (lagging power factor)
Quadrant IV Positive watts (delivered) VAR (received) / (leading power factor)
19 Overview of the E650 S4x Measuring Element
The E650 S4x utilizes a digital sampling technique to measure voltage and current in a customer load. The E650 S4x calculates active, reactive, and apparent power in quadrants one and four. Apparent power is calculated as the product of the square-root of the mean-square value of the current (Irms) and voltage (Vrms). Calculations include harmonics of the fundamental.
19.1 E650 S4x Measurement Metrics—Landis + Gyr Terminology
The E650 S4x offers the following metrics: kWh, kVAh, kVArh, Kw, kVA Phasor, kVA RMS, kVAr Phasor, kVAr RMS. All metrics are measured bi-directionally. All are presented as face value and, where appropriate, are labeled as “Phasor” or “RMS” for easy identification. The metrics are recorded per true quadrant and as totals. The meter’s program can be configured to allow combinations of quadrants to satisfy specific utility methodology for registration. See the 1132Prog software for detail on how this is done.
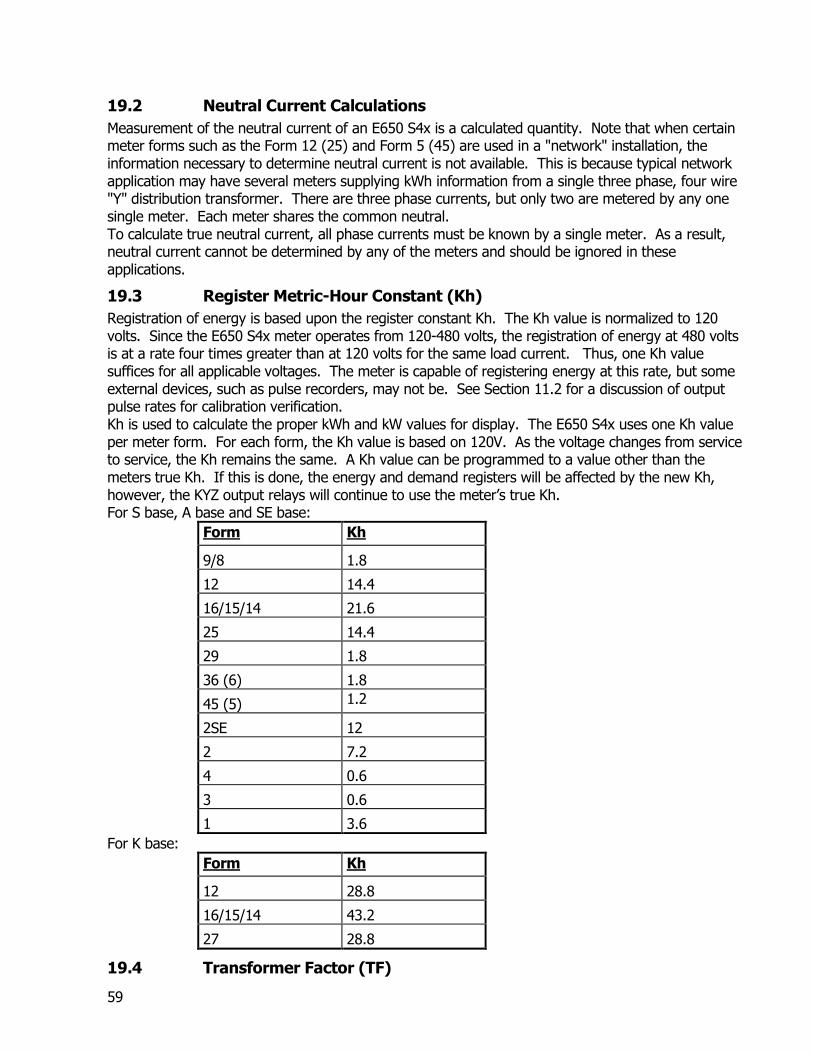
59
19.2 Neutral Current Calculations
Measurement of the neutral current of an E650 S4x is a calculated quantity. Note that when certain meter forms such as the Form 12 (25) and Form 5 (45) are used in a "network" installation, the information necessary to determine neutral current is not available. This is because typical network application may have several meters supplying kWh information from a single three phase, four wire "Y" distribution transformer. There are three phase currents, but only two are metered by any one single meter. Each meter shares the common neutral. To calculate true neutral current, all phase currents must be known by a single meter. As a result, neutral current cannot be determined by any of the meters and should be ignored in these applications.
19.3 Register Metric-Hour Constant (Kh)
Registration of energy is based upon the register constant Kh. The Kh value is normalized to 120 volts. Since the E650 S4x meter operates from 120-480 volts, the registration of energy at 480 volts is at a rate four times greater than at 120 volts for the same load current. Thus, one Kh value suffices for all applicable voltages. The meter is capable of registering energy at this rate, but some external devices, such as pulse recorders, may not be. See Section 11.2 for a discussion of output pulse rates for calibration verification. Kh is used to calculate the proper kWh and kW values for display. The E650 S4x uses one Kh value per meter form. For each form, the Kh value is based on 120V. As the voltage changes from service to service, the Kh remains the same. A Kh value can be programmed to a value other than the meters true Kh. If this is done, the energy and demand registers will be affected by the new Kh, however, the KYZ output relays will continue to use the meter’s true Kh. For S base, A base and SE base:
Form Kh
9/8 1.8
12 14.4
16/15/14 21.6
25 14.4
29 1.8
36 (6) 1.8
45 (5) 1.2 2SE 12
2 7.2
4 0.6
3 0.6
1 3.6
For K base:
Form Kh
12 28.8
16/15/14 43.2
27 28.8
19.4 Transformer Factor (TF)

60
A transformer factor can be programmable as a 6-digit number available for display only or as a multiplier to achieve direct primary readings for display. Transformer factor = CT ratio x the PT ratio
19.5 Power Factor
True power factor is calculated as the ratio of active power to apparent power. Note: The power factor calculations described below are based on true power factor; power factor is calculated using the following two methods:
where V*A is based on rms quantities and using the kVA rms calculation, or:
using the kVA Phasor power factor calculation
19.5.1 Available Power Factor Measurements
The following power factor measurements are calculated, stored, and available for display: Instantaneous power factor Previous interval power factor Average power factor since last reset Smallest power factor since last reset Power factor for each maximum demand, including kW, Power factor for the three highest demand metric maximums and coincidents, totals and
for each rate Power factor cumulative demand User selectable power factor (See 1132 Prog for full listings and options)
rmsPowerFactorW
VA
ReactivePowerFactorW
W VAR
2 2

61
20 Calibration Verification and Testing
20.1 E650 S4x Factory Calibration
Calibration of voltages, currents and phase angles per element is accomplished through calibration constants stored in non-volatile memory. These constants cannot be changed except by recalibration at the factory
20.2 How to Verify the E650 S4x Calibration
20.2.1 Verification of Watt Calibration
E650 S4x watt calibration may be verified using standard procedures. The watt calibration LED is the left LED located inside the Type II optical port on the face of the polycarbonate cover. The infra-red output pulses from the LED can be changed through programming with the 1132Prog/1132Com software packages. The optical pulse rate can be selected to be either medium (one pulse per equivalent revolution), fast (12 pulses per equivalent revolution), or slow (1 pulse for every 4 equivalent revolutions).
20.2.2 Calibration Pulse Displays
Four Test Mode calibration pulse displays, used in the test mode sequence, give calibration pulses other than watts. Whenever the meter is in test mode and scrolled to one of these Test Mode displays VA Pulse (RMS), VA Pulse (Vectorial), VAR Pulse (RMS), and VAR Pulse (Vectorial), the meter will start pulsing in these metrics. At all other times the meter will give watt pulses. Each RMS calibration metric display will show the “RMS” enunciator on the right side of the LCD. If the “RMS” is not being display, the metric is vectorial
20.2.3 Test Times
The minimum test times required to obtain accurate verification for E650 S4x calibration are given below. Testing at power factors other than those specified below will require longer test times.
Quantity Present Minimum Test Time
Watthour TA 21.6 seconds @ unity PF
VA phase shift TA 90 seconds
VAR TA 90 seconds
VArms TA 90 seconds
When testing, the test board should have a 6 second settling time programmed. This will allow 6 seconds for the calibration pulse to stabilize when the current changes. Allow 15 seconds if the meter has a modem.
20.2.4 Field Testing
To test the meter in the field using test mode, complete the following procedure: 1) Remove the cover. 2) Flip the test mode switch. The LCD will indicate the meter is in test mode. 3) Swipe a magnet over the reed switch to scroll through the displays. 4) Exit test mode by returning the test mode switch to its original position.
20.2.5 Demand Measurement Verification

62
In order to test the demand measurement of an E650 S4x meter, complete the following procedure: 1) Connect the reference standard to the meter. 2) Select the voltage test to match the application. 3) Turn on the pulse counting device and make sure it is set to 0. 4) Flip the test mode switch. 5) Press the Demand Reset button. 6) Turn on the current to the meter and the standard at the same time. 7) After the End of Interval flag is displayed; turn off the current to the meter and the standard,
again at the same time. 8) Record the pulse counter total and compare it with the total on the E650 S4x display.

A-1
Appendix A: Technical Specifications
General Conditions
Nameplate Voltage Vn = 120- 480 VAC (W/O AMI Device Onboard)
Rated Frequency Fn = 50 or 60 Hz ± 5% Power Factor PF = 1.0 Ambient Temperature TA = 23° C ±5° C Temperature (inside cover) -40° C to + 85° C Operating -40° F to +185° F Humidity (non-condensing) Relative Humidity <=95% Rh
Input Specifications
Voltage Withstand: Effect of High Voltage Line Surges (ANSI/IEEE C62.41)
6KV (1.2/50µs-8/20µs combination wave and 100kHz ring wave at .05µs-100kHz)
Surge Withstand Capability (ANSI C37.90A) Oscillatory 3 kV (1 mHz; 100 Hz, 10 seconds)
Fast Transient
5Kv (50 pulses/sec, 20 seconds)
Temporary Overvoltage Withstand (0.5 seconds) (IEC 61000-4-4)
150% of Vn
Continuous Overvoltage Withstand ( 5 hours) 130% of Vn

A-2
Internal Meter Losses (Burden), exceeds ANSI Standards Below:
Class 20, 200, 320 Phase A & B Phase C
Potential
120V 20 VA 20 VA
240V 20 VA 20 VA
480V 20 VA 20 VA
Current
20 Amps 1.0 VA 1.0 VA
200 Amps 1.0 VA 1.0 VA
320 Amps 1.0 VA 1.0 VA
Length of 100% Power Loss Resulting in No Power Down of the Register: Power loss duration @ Vn 100 milliseconds Minimum
Current System: Test Amps Starting Load Class 20 2.5 Amps Class 120 30 Amps Class 200 30 Amps Class 320 50 Amps Class 480 50 Amps No Load (Creep) With potential applied over the entire line voltage range of the meter and no current flowing in the current circuit, there shall be no pulse accumulation in the register. The test for no pulse accumulation shall be conducted over a period of 24 hours.

A-3
Applicable Standards
ANSI C12.1 - for electricity metering ANSI C12.10 - for watthour meters ANSI C12.18 – Protocol Specification for ANSI Type 2 Optical Port ANSI C12.19 – Protocol Specification for Utility Industry End Device Tables ANSI C12.20 – for Electricity Meters – 0.2 and 0.5 Accuracy Classes ANSI C12.21 – Protocol Specification for Telephone Modem Communication CAN3-C17-M84 Canadian specifications for approval of type of electricity meters CAN3-Z234.4-79 Canadian specifications for all-numeric dates and times IEC (Electrical Specifications)
FCC Class B Emissions Landis+Gyr Engineering Specification 69343

A-4
Weights and Dimensions
Form Net lbs. Single Pack Weight
Single Pack Dimensions
Four-Pack Weight Four-Pack Dimensions
45S (5S)
36S (6S)
9S/8S
12S(E)
16S(E)
45A (5A)
36A (6A)
10A/8A
12K
16/15/14K
27K
E650 S4x Meter Component Description P.B.T. Baseplate:
The E650 S4x baseplate is made of ENV13-1502GFR-BK Polycarbonate Injection Molding Grade, Black,10% Fiberglass Reinforced, Flame Retardant, RoHS Compliant.
Meter Frame: The injection molded polycarbonate frame is designed with unique "snap-in" features that allow quick and easy assembly or disassembly of major meter components. Connector is made with a "gas-tight" connection to insure electrical connection over time. Cover: The cover is made of high strength polycarbonate that will not break even under extreme physical abuse.
FCC Requirements
1. This equipment complies with Part 68 of the Federal Communication Commission (FCC) Rules and
Regulations. These rules permit this device to be directly connected to the telephone network. Standardized jacks are used for these connections. This equipment should not be used on party lines or coin lines.
2. If the Type E650 S4x Electronic Watthour Meter is malfunctioning it may cause harm to the telephone network; the telephone company will notify you in advance that temporary discontinuance of service may be required. If advance notice is not practical, the telephone company will notify you of the discontinuance as soon as possible. You will be advised of your right to file a complaint with the FCC if you believe it is necessary.
3. The telephone company may make changes in its technical operations and procedures; if such changes affect the compatibility or use of this device, the telephone company is required to give adequate notice of the changes. You will be advised of your right to file a complaint with the FCC if you believe it is necessary.
4. If the telephone company requests information on what equipment is connected to their lines, inform them of: a. The telephone number this unit is connected to b. Ringer Equivalence Number (REN) for this equipment

A-5
c. The USOC jack required d. The FCC Registration Number
The label on the left side of the meter contains the FCC Registration Number and the Ringer Equivalence Number (REN) for this equipment. The REN is useful to determine the quantity of devices that may be connected to the telephone line. Excessive RENs on the telephone line may result in the devices not ringing in response to an incoming call. In most, but not all areas, the sum of the RENs should not exceed five (5.0). To be certain of the number of devices that may be connected to the line, as determined by the total RENs, contact the telephone company to determine the maximum REN for the calling area. This device complies with part 15 of the FCC rules. Operation is subject to the following two conditions: (1) This device may not cause harmful interference, and (2) this device must accept any interference received, including interference that may cause undesired operation.

A-6
In the event of equipment malfunction, repairs should be performed by our Company or an authorized agent. It is the responsibility of users requiring service to report the need for service to our Company or to one of our authorized agents. If you experience trouble with the Landis+Gyr E650 S4x Electricity Meters please contact your authorized Landis + Gyr distributor or Landis + Gyr agent for repair and/or warranty information. Changes of modifications not expressly approved by Landis+Gyr Inc could void your authority to operate the equipment.

B-1
Appendix B: Register Displays Each display includes a three digit identification number on the left side of the LCD. The identification number can be any number from 0 through 999 or can be a three character alphanumeric code. The identifiers are merely labels; numbers may be repeated and may be in any order. Except for countdown timers, present demand, instantaneous measurements, and Test Mode displays, display values will not be updated as they are shown, even if the value is changing internally in the meter. To display an updated value, it will be necessary to scroll through all the display items until the value desired appears again.
For a full listing of available displays for the E650 S4x consult the 1132 Prog software.

C-1
Appendix C: Polyphase Service Types Form 9S/8S, 10A/8A Service Type Table
Meter Form Service Type Rotation Va Phase A Vb Phase B Vc Phase C
10/9/8 4WY-120v ABC 120 0 120 120 120 240
4WY-277v ABC 277 0 277 120 277 240
4WY-120v CBA 120 0 120 240 120 120
4WY-277v CBA 277 0 277 240 277 120
4WD-120v ABC 60 0 60 180 104 90
4WD-240v ABC 120 0 120 180 208 90
4WD-480v ABC 240 0 240 180 416 90
4WD-120v CBA 60 0 60 180 104 270
4WD-240v CBA 120 0 120 180 208 270
4WD-480v CBA 240 0 240 180 416 270
Form 29S, 36S (6S), 36A (6A) Service Type Table
Meter Form Service Type Rotation Va Phase A Vb Phase B Vc Phase C
29, 36 (6) 4WY-120v ABC 120 0 IGNORE 120 240
4WY-277v ABC 277 0 IGNORE 277 240
4WY-120v CBA 120 0 IGNORE 120 120
4WY-277v CBA 277 0 IGNORE 277 120
Form 45S (5S), 45A (5A) Service Type Table

C-2
Meter Form Service Type Rotation Va Phase A Vb Phase B Vc Phase C
45 (5) 3WY-120v ABC 120 0 IGNORE 120 120
3WY-277v ABC 277 0 IGNORE 277 120
3WY-120v CBA 120 0 IGNORE 120 240
3WY-277v CBA 277 0 IGNORE 277 240
3WD-120v ABC 120 0 IGNORE 120 60
3WD-240v ABC 240 0 IGNORE 240 60
3WD-480v ABC 480 0 IGNORE 480 60
3WD-120v CBA 120 0 IGNORE 120 300
3WD-240v CBA 240 0 IGNORE 240 300
3WD-480v CBA 480 0 IGNORE 480 300
4WD-120v ABC 120 0 60 180 104 90
4WD-240v ABC 240 0 120 180 208 90
4WD-480v ABC 480 0 240 180 416 90
4WD-120v CBA 120 0 60 180 104 270
4WD-240v CBA 240 0 120 180 208 270
4WD-480v CBA 480 0 240 180 416 270
3WY-240v ABC 240 0 IGNORE 240 180
3WY-480V ABC 480 0 IGNORE 480 180
Form 16/15/14S, 16/15/14A, 16/15/14K Service Type Table
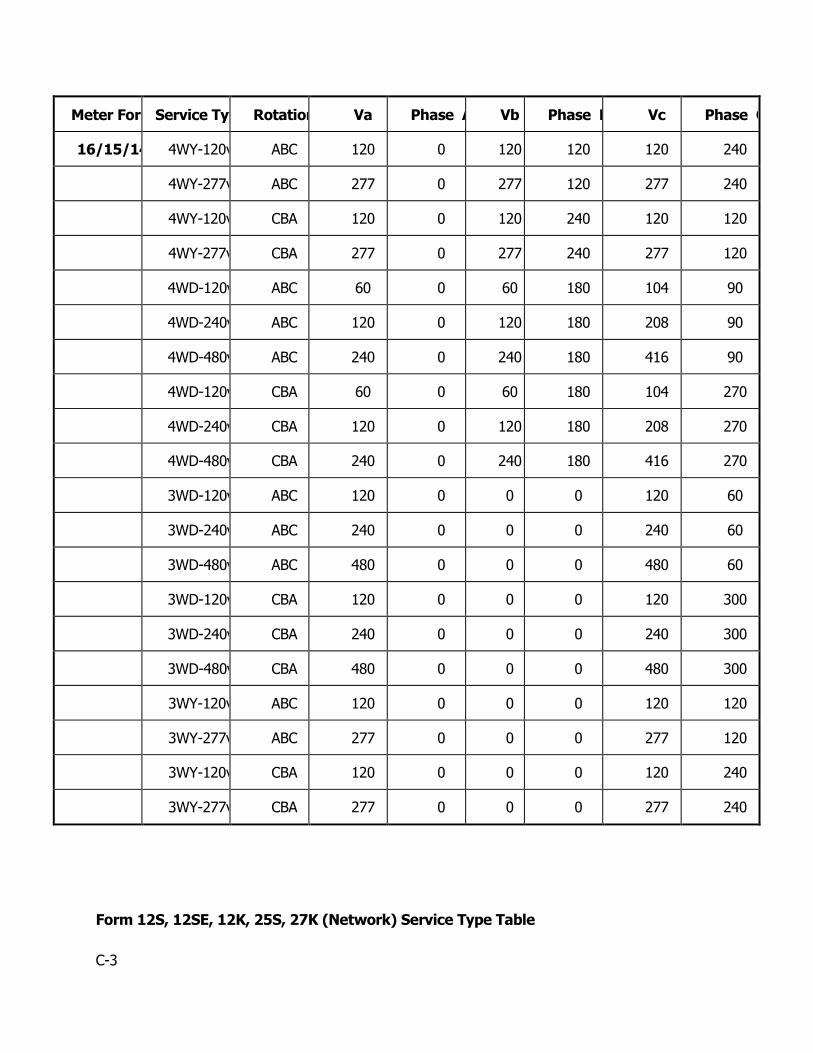
C-3
Meter Form Service Type Rotation Va Phase A Vb Phase B Vc Phase C
16/15/14 4WY-120v ABC 120 0 120 120 120 240
4WY-277v ABC 277 0 277 120 277 240
4WY-120v CBA 120 0 120 240 120 120
4WY-277v CBA 277 0 277 240 277 120
4WD-120v ABC 60 0 60 180 104 90
4WD-240v ABC 120 0 120 180 208 90
4WD-480v ABC 240 0 240 180 416 90
4WD-120v CBA 60 0 60 180 104 270
4WD-240v CBA 120 0 120 180 208 270
4WD-480v CBA 240 0 240 180 416 270
3WD-120v ABC 120 0 0 0 120 60
3WD-240v ABC 240 0 0 0 240 60
3WD-480v ABC 480 0 0 0 480 60
3WD-120v CBA 120 0 0 0 120 300
3WD-240v CBA 240 0 0 0 240 300
3WD-480v CBA 480 0 0 0 480 300
3WY-120v ABC 120 0 0 0 120 120
3WY-277v ABC 277 0 0 0 277 120
3WY-120v CBA 120 0 0 0 120 240
3WY-277v CBA 277 0 0 0 277 240
Form 12S, 12SE, 12K, 25S, 27K (Network) Service Type Table

C-4
Meter Form Service Type Rotation Va Phase A Vb Phase B Vc Phase C
12, 25, 27 3WD-120v ABC 120 0 IGNORE 120 60
3WD-240v ABC 240 0 IGNORE 240 60
3WD-480v ABC 480 0 IGNORE 480 60
3WD-120v CBA 120 0 IGNORE 120 300
3WD-240v CBA 240 0 IGNORE 240 300
3WD-480v CBA 480 0 IGNORE 480 300
3WY-120v ABC 120 0 IGNORE 120 120
3WY-277v ABC 277 0 IGNORE 277 120
3WY-120v CBA 120 0 IGNORE 120 240
3WY-277v CBA 277 0 IGNORE 277 240

D-1
Appendix D: Meter Forms
2/3-Element4-Wire
FORM 9/8S
YK Z
2-Element
3-Wire FORM 12S
Alternate
Positions of
Moveable
Terminal
2-Element 4-Wire
FORM 36S (6S)
K YK
ZK
2-Element 3-Wire
FORM 45S (5S)
2/3-Element 4-Wire
FORM 16/15/14S
2-Element 3-Wire
FORM 25S
2-Element4-Wire
FORM 29S
S-Base Forms

D-2
2-Element 4-Wire
FORM 36A (6A)
K Y Z
2-Element 3-Wire
FORM 45A (5A)
K Y Z
2/3-Element4-Wire
FORM 10/8A
K
Y Z
2-Element3-Wire
FORM 12K
2/3-Element 4-Wire
FORM 16/15/14K
2-Element 3-Wire
FORM 27K
Single Phase 2-Wire
Form 3S
Single Phase 3-Wire
Form 2S
Singlephase Forms
K-Base Forms
A-Base Forms
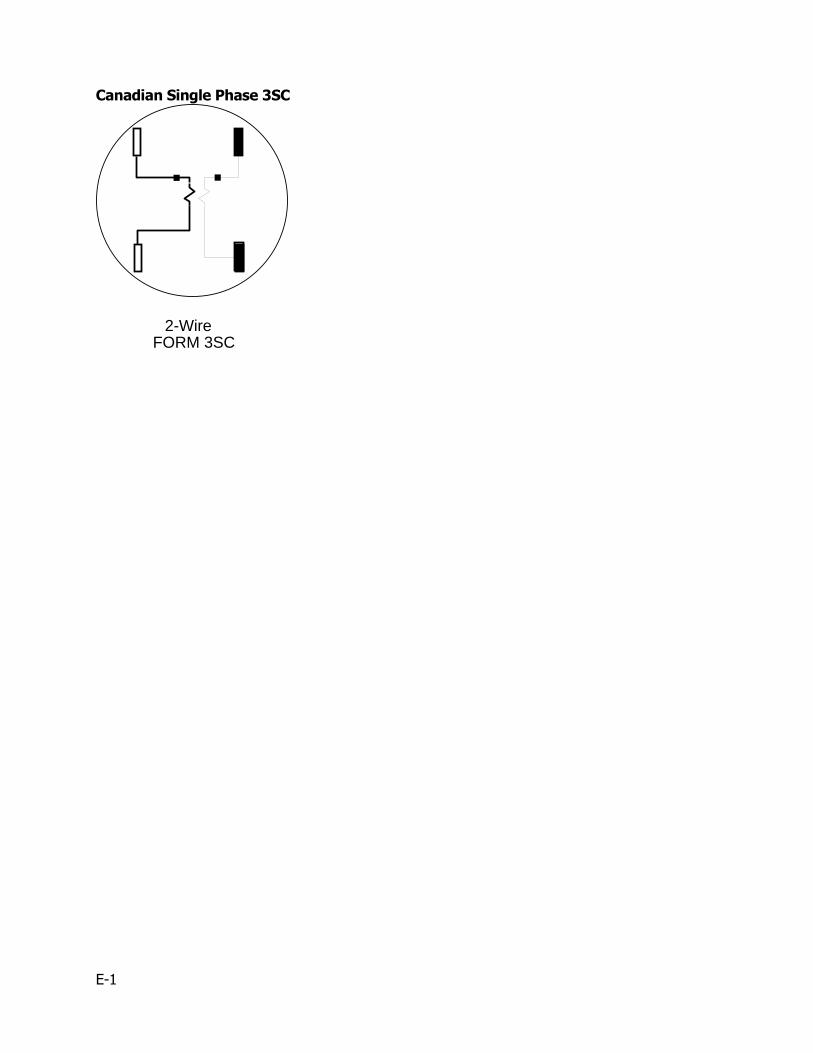
E-1
Canadian Single Phase 3SC
2-Wire FORM 3SC

D-2
Appendix E: Definitions NOTE: Items marked with * are under development and not yet available. 1132Prog/1132Com/1132Gyr: 1132Suite is Landis+Gyr’s windows based software package. 1132Prog is the program development portion,1132Com is the reader/program portion, and 1132Gyr is the report generation portion. Note…1132Gyr requires a yearly licensing/Maintenance fee.
ANSI Protocol: ANSI C12.19 is an industry standard communication protocol that is used in the ANSI E650 S4x meter.
Ethernet*….Under development, TBD.
RS232*: RS-232 is a communication, Recommended Standard, for serial interface devices. Using this standard and an RS-232 add-on board the meter can communicate with RS-232 based devices. The RS-232 standard defines communications between two devices only.
RS485*: RS-485 is a newer communication standard that is similar to RS-232. Using this standard and an RS-485 add-on board the meter can communicate with RS-485 based devices. The RS-485 standard supports communications between several devices on an RS-485 bus.
Remote Communications Alert: (Availability TBD at a future time)
Active and Reactive Metrics: The E650 S4x can be programmed for all of the following aspects of energy: kW, kWh, kVA/kVAh rms, kVA/kVAh Phasor, kVAR/kVARh Phasor. In an optical meter read, the metrics will appear as these values.
VArms: Root mean squared measurement of Volt-Amperes.
VA Phasor: Vectorial measurement of Volt-Amperes. At unity power factor VA Phasor is equal to watts.
VAR Phasor: Vectorial measurement of Volt-Amperes reactive
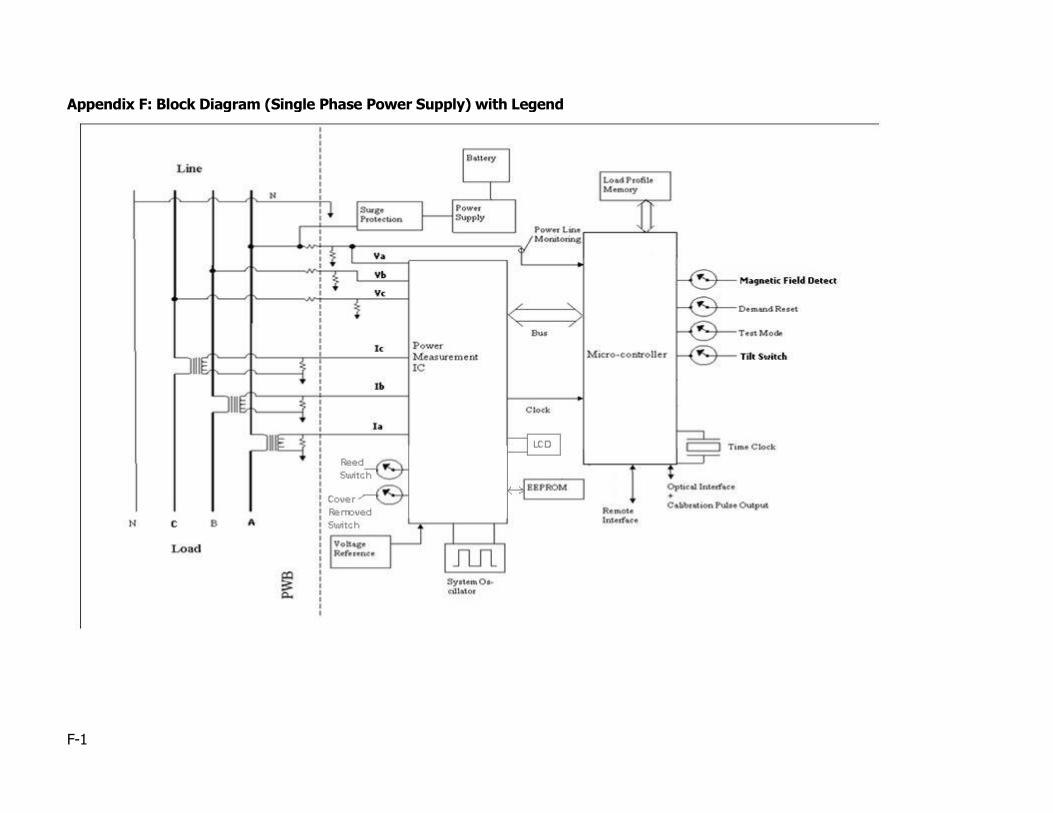
F-1
Appendix F: Block Diagram (Single Phase Power Supply) with Legend

G-1
Appendix G: Diagram of Parts
Figure 3.1.2 Exploded Diagram of E650 S4x
Appendix H: Notes and Notices
Current Manuals, Notes, Generation Documents, Software, etc. can be found on the website: http://eportal.landisgyr.us/ePortal/Applications/login.aspx
A User ID and Password will be required to access this website.
L-1
Legend Battery – 3.6V Lithium battery for backup during outages maintains timekeeping and registers.
Bus – The connection between the microcontroller and the power measurement IC.
Clock – Maintains the timing for energy and demand calculations
Cover Removed Switch – Triggers event in the log when the meter cover is removed and another event if/ when it is subsequently re-installed on the meter.
Demand Reset – Switch activates the demand reset sequence.
EEPROM – EEPROM stands for Electronic Erasable Programmable Read Only Memory and is non-volatile storage location for programming constants and for meter data. Data is retained during an outage.
LCD – Display on top of the meter, can be programmed to scroll through 96 displays.
Load Profile Memory –Memory used for storing load profile register data. (256K or 1Meg for an E650 S4x)
Magnetic Field Detect - Triggers and logs an event if the presence of a foreign magnetic field is detected.
Microcontroller – Processor that controls the meter, performs data calculations, and meter I/O.
Optical Interface + Calibration Pulse Output – This an ANSI type II optic port that operates as a calibration LED during testing.
Power Line Monitoring – Monitors AC power for line loss detection. After 6 missing line cycles on phase A the meter shuts down, saves data, and runs off the battery in TOU programmed meters (unless the meter is equipped with an optional 3 Phase power supply).
Power Measurement IC – The power measurement IC analyzes the incoming voltage and current inputs to perform basic measurement calculations.
Power Supply – Converts incoming AC on phase A to low voltage DC for meter operation.
Reed Switch – Switch activated magnetically and used to access Alternate mode and GyrBox mode.
Remote Interface (Port) – Serial Port communication used for communications devices including RS232, RS485, Ethernet, cellular modems, and AMI devices.
Surge Protection – The surge protection protects the meter against voltage spikes and surges.
System Oscillator – Crystal controlled oscillator which provides measurement time base.
Test Mode – The test mode switch activates test mode.
Tilt Switch – Triggers event in the event log when meter significantly shifts position.
Time Clock – Time keeping device maintaining TOU time during power outages.
Voltage Reference – Stable reference used by Power Measurement IC