s7 - 1© 2011 pearson education, inc. publishing as prentice hall process strategies ( process,...
TRANSCRIPT

S7 - 1© 2011 Pearson Education, Inc. publishing as Prentice Hall
Process StrategiesProcess Strategies( process, repetitive, product)( process, repetitive, product)
The objective of the process strategy is to build a The objective of the process strategy is to build a production process that has capacity to meetproduction process that has capacity to meet
•customer requirements customer requirements (quality & quantity) (quality & quantity)
•product specifications product specifications (quality & cost)(quality & cost)
•within finance within finance (fixed costs = capital invested)(fixed costs = capital invested)
•other managerial constraints other managerial constraints (flexibility)(flexibility)

S7 - 2
Process Strategy & CapacityProcess Strategy & CapacityProcess strategy chosen has to
•Meet consumer demand (quality & quantity expectations)
– low/medium/high ?
– constant or changing ?
– predictable or unpredictable ?
•Meet Business requirements (average cost per unit)
– efficient use of existing capacity
– ability to change output (up or down) if needed
© 2011 Pearson Education, Inc. publishing as Prentice Hall

S7 - 3© 2011 Pearson Education, Inc. publishing as Prentice Hall
CapacityCapacity The number of units a facility can produce, hold,
receive, or store, in a period of time
Has a big effect on fixed costs (& therefore break even )
Determines if demand will be satisfied
Three time horizons
Long (>1yr)
Medium (3 -18 months)
Short (<3 months)

S7 - 4© 2011 Pearson Education, Inc. publishing as Prentice Hall
Planning Over a Time HorizonPlanning Over a Time Horizon(relates to forecasting accuracy)(relates to forecasting accuracy)
Figure S7.1
To increase capacity To use excess capacity
Medium(3-18 month)
Subcontract Add personnelAdd equipment Build or use inventory Add shifts
Short(< 3 month)
Schedule jobsSchedule personnel Allocate machinery*
Long (> 12 month)
Add facilitiesAdd long lead time equipment *
* Difficult to adjust capacity as limited options exist
Options for Adjusting Capacity

S7 - 5© 2011 Pearson Education, Inc. publishing as Prentice Hall
Capacity and StrategyCapacity and Strategy
Capacity decisions impact all 10 decisions of operations management as well as other functional areas of the organization
Capacity decisions must be integrated into the organization’s mission and strategy

S7 - 6© 2011 Pearson Education, Inc. publishing as Prentice Hall
Capacity ConsiderationsCapacity Considerations
1. Forecast demand accurately(marketing department do this)
2. Understand the technology and capacity increments
3. Find the optimum operating level (volume)
4. Build for change(flexibility is desirable)
S7 - 7© 2011 Pearson Education, Inc. publishing as Prentice Hall
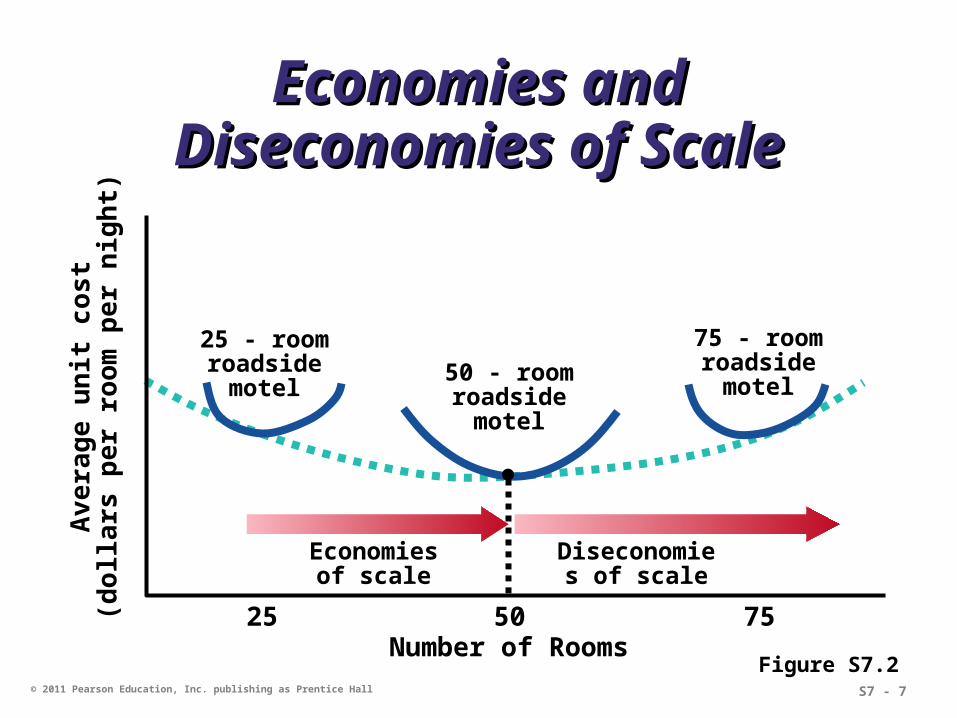
Economies and Economies and Diseconomies of ScaleDiseconomies of Scale
Economies of scale
Diseconomies of scale
25 - room roadside motel 50 - room
roadside motel
75 - room roadside motel
Number of Rooms25 50 75
Av
era
ge
un
it c
os
t(d
olla
rs p
er
roo
m p
er n
igh
t)
Figure S7.2

S7 - 8© 2011 Pearson Education, Inc. publishing as Prentice Hall
Decision making about Decision making about Capacity ChangesCapacity Changes
(a) Leading demand with incremental expansion
Dem
and
Expected demand
New capacity
(c) Attempts to have an average capacity with incremental expansion
Dem
and
New capacity Expected
demand
(b) Capacity lags demand with incremental expansion
Dem
and
New capacity
Expected demand
Figure S7.6

S7 - 9© 2011 Pearson Education, Inc. publishing as Prentice Hall
Managing DemandManaging Demand Demand exceeds capacity
reduce demand by raising prices, scheduling longer lead time
Long term solution is to increase capacity
Capacity exceeds demand Stimulate market (advertising, price cuts, etc)
Product changes (diversify, make to stock)
Adjusting to seasonal demands Produce products with opposite demand
patterns (surf wear / snow wear)

S7 - 10© 2011 Pearson Education, Inc. publishing as Prentice Hall
Complementary Demand Complementary Demand PatternsPatterns
4,000 –
3,000 –
2,000 –
1,000 –
J F M A M J J A S O N D J F M A M J J A S O N D J
Sal
es i
n u
nit
s
Time (months)
Combining both demand patterns reduces the variation
Snowmobile motor sales
Jet ski engine sales
Figure S7.3

S7 - 11© 2011 Pearson Education, Inc. publishing as Prentice Hall
Tactics for Matching Tactics for Matching Capacity to DemandCapacity to Demand
1. Making staffing changes (extra shifts(+), reduce hours (-))
2. Adjusting equipment Purchasing additional machinery(+)
Selling or leasing out existing equipment(-)
3. Improving processes to increase throughput (+)
4. Redesigning products to facilitate more throughput(+)
5. Adding process flexibility to meet changing product preferences (+/-)
6. Closing facilities(-)

S7 - 12
Capacity Management StrategiesCapacity Management Strategies
© 2011 Pearson Education, Inc. publishing as Prentice Hall
Level Capacity Strategy
Keeping operations running steadily through low demand periods to build up inventory for high demand periods.
Typical of any business where fixed assets are a big part of the operation. (hotels,
theatres, hospitals).
Inflexible in face of changing demand.

S7 - 13
Capacity Management StrategiesCapacity Management Strategies
© 2011 Pearson Education, Inc. publishing as Prentice Hall
Chase Demand Strategy
Change operations by increasing / decreasing inputs so that capacity meets the demand.
Requires good forecasting and flexible resourcing (eg outsourcing, spare capacity).
Often seen in services. (cannot build inventory ad so must meet demand when it is there).

S7 - 14
CHASE & LEVEL comparedCHASE & LEVEL compared
© 2011 Pearson Education, Inc. publishing as Prentice Hall
Level Capacity Chase Demand
Size of variation Small Large
Speed of change Slow Fast
Predictability Predictable Unpredictable
Costs Structure Fixed cost high Variable cost high
Cost of complaints High Low
Cost of lost business Low High

S7 - 15© 2011 Pearson Education, Inc. publishing as Prentice Hall
Demand & Capacity Management Demand & Capacity Management in Servicesin Services
Demand management Appointment, reservations, FCFS rule
Capacity management Staffing levels & scheduling
full-time
part-time
Temporary/casual
S7 - 16
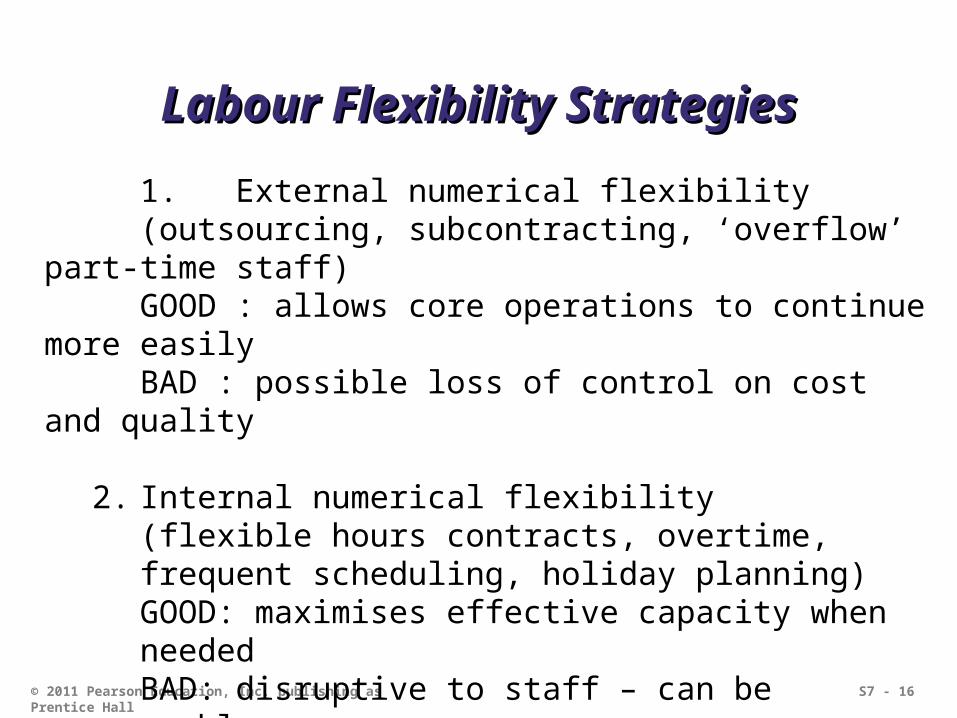
Labour Flexibility StrategiesLabour Flexibility Strategies
© 2011 Pearson Education, Inc. publishing as Prentice Hall
1. External numerical flexibility(outsourcing, subcontracting, ‘overflow’ part-time staff)GOOD : allows core operations to continue more easilyBAD : possible loss of control on cost and quality
2. Internal numerical flexibility(flexible hours contracts, overtime, frequent scheduling, holiday planning)GOOD: maximises effective capacity when neededBAD: disruptive to staff – can be problems

S7 - 17
Labour Flexibility StrategiesLabour Flexibility Strategies
© 2011 Pearson Education, Inc. publishing as Prentice Hall
3. Functional flexibility (multiskilling)(change staff roles to meet different needs)GOOD: works well in simple businesses.BAD: training costs, occupational identity
issues (person and industry).
4. Financial flexibility (performance pay, seasonal pay)(pay reflects the existing need/output of staff)GOOD : may increase employment optionsBAD : may be difficult for staff

S7 - 18© 2011 Pearson Education, Inc. publishing as Prentice Hall

S7 - 19© 2011 Pearson Education, Inc. publishing as Prentice Hall
Capacity DefinitionsCapacity Definitions
Design capacity (measured as utilisation)
is the maximum theoretical output of a system
normally expressed as a rate (output/time)
Effective capacity (measured as efficiency)
is the actual output expects to achieve given current operating constraints (e.g. downtime for maintenance)
Often lower than design capacity

S7 - 20© 2011 Pearson Education, Inc. publishing as Prentice Hall
Utilization and EfficiencyUtilization and Efficiency
Utilization is the percent of design capacity Utilization is the percent of design capacity achievedachieved
Efficiency is the percent of effective capacity Efficiency is the percent of effective capacity achievedachieved
Utilization = Actual output/Design capacity (as %)
Efficiency = Actual output/Effective capacity (as %)

S7 - 21© 2011 Pearson Education, Inc. publishing as Prentice Hall
Bakery ExampleBakery Example(design capacity & utilisation)
Actual production last week = 148,000 rollsEffective capacity = 175,000 rollsDesign capacity = 1,200 rolls per hourBakery operates 7 days/week, 3 - 8 hour shifts
Design capacity = (7 x 3 x 8) x (1,200) = 201,600 rolls

S7 - 22© 2011 Pearson Education, Inc. publishing as Prentice Hall
Bakery ExampleBakery Example(design capacity & utilisation)
Actual production last week = 148,000 rollsEffective capacity = 175,000 rollsDesign capacity = 1,200 rolls per hourBakery operates 7 days/week, 3 - 8 hour shifts
Design capacity = (7 x 3 x 8) x (1,200) = 201,600 rolls

S7 - 23© 2011 Pearson Education, Inc. publishing as Prentice Hall
Bakery ExampleBakery Example(design capacity & utilisation)
Actual production last week = 148,000 rollsEffective capacity = 175,000 rollsDesign capacity = 1,200 rolls per hourBakery operates 7 days/week, 3 - 8 hour shifts
Design capacity = (7 x 3 x 8) x (1,200) = 201,600 rolls
Utilization = 148,000/201,600 = 73.4%

S7 - 24© 2011 Pearson Education, Inc. publishing as Prentice Hall
Bakery ExampleBakery Example(design capacity & utilisation)
Actual production last week = 148,000 rollsEffective capacity = 175,000 rollsDesign capacity = 1,200 rolls per hourBakery operates 7 days/week, 3 - 8 hour shifts
Design capacity = (7 x 3 x 8) x (1,200) = 201,600 rolls
Utilization = 148,000/201,600 = 73.4%

S7 - 25© 2011 Pearson Education, Inc. publishing as Prentice Hall
Bakery ExampleBakery Example(effective capacity & efficiency)
Actual production last week = 148,000 rollsEffective capacity = 175,000 rollsDesign capacity = 1,200 rolls per hourBakery operates 7 days/week, 3 - 8 hour shifts
Design capacity = (7 x 3 x 8) x (1,200) = 201,600 rolls
Utilization = 148,000/201,600 = 73.4%
Efficiency = 148,000/175,000 = 84.6%

S7 - 26© 2011 Pearson Education, Inc. publishing as Prentice Hall
Bakery ExampleBakery Example(effective capacity & efficiency)
Actual production last week = 148,000 rollsEffective capacity = 175,000 rollsDesign capacity = 1,200 rolls per hourBakery operates 7 days/week, 3 - 8 hour shifts
Design capacity = (7 x 3 x 8) x (1,200) = 201,600 rolls
Utilization = 148,000/201,600 = 73.4%
Efficiency = 148,000/175,000 = 84.6%

S7 - 27© 2011 Pearson Education, Inc. publishing as Prentice Hall
Bakery ExampleBakery Example(effective capacity & efficiency)
Actual production last week = 148,000 rollsEffective capacity = 175,000 rollsDesign capacity = 1,200 rolls per hourBakery operates 7 days/week, 3 - 8 hour shiftsEfficiency = 84.6%Efficiency of new line = 75%
Expected Output = (Effective Capacity)(Efficiency)
= (175,000)(.75) = 131,250 rolls

S7 - 28© 2011 Pearson Education, Inc. publishing as Prentice Hall
Bakery ExampleBakery Example(effective capacity & efficiency)
Actual production last week = 148,000 rollsEffective capacity = 175,000 rollsDesign capacity = 1,200 rolls per hourBakery operates 7 days/week, 3 - 8 hour shiftsEfficiency = 84.6%Efficiency of new line = 75%
Expected Output = (Effective Capacity)(Efficiency)
= (175,000)(.75) = 131,250 rolls

S7 - 29© 2011 Pearson Education, Inc. publishing as Prentice Hall