sa/acad & supp prog - calstate.edu · ethnic groups in fall 1992, ranging from 16.3 percent of...
TRANSCRIPT

Statistical Abstract 125
Academic and Support Programs
engineering undergraduate programs, minoritiesrepresented a clear majority (56.7%). Interdisciplinarystudies programs generally attract students who arepreparing for teaching careers. The ethnic distribution ofinterdisciplinary studies majors was: (67.3%), Latinos(18.7%), African American (5.5%), Asian-Pacifics (5.5%),and American Indians (1.3%). Business and managementwas the most popular undergraduate major across allethnic groups in fall 1992, ranging from 16.3 percent ofAmerican Indian undergraduate majors to 32.5 percent ofAsian American counterparts.
The program interests of graduate students differedconsiderably from those of undergraduate students. Thegraduate degree programs that attracted the highestpercentage of students were education (23.0%), businessand management (15.6%), public affairs and services(8.9%), and engineering (8.0%). Education was the firstchoice among students from all ethnic groups exceptAsian Americans. Only 10.2 percent of Asian graduatestudents were in Education; 35.9 percent of MexicanAmerican graduate students were. Percentage enrollmentin business and management varied from 6.8 percentamong Mexican American graduate students to 22.7percent among Asian American graduate students .Enrollment in public affairs and services varied from a low4.8 percent for Asian Americans to a high of 23.7 percentfor African Americans. The engineering percentages alsovaried substantially from 2.3 percent for American Indiansto 25.5 percent for Asian Americans who are seeking aMaster’s degree.
Note: Statistics in this section do not include informationabout special program enrollments.
Student Majors
Enrollment in the CSU has increased from 95,081 to347,693 students since fall 1960 when individual campuseswere combined into a California state system. Fall 1992enrollment in undergraduate degree programs numbered281,003 or 87.1 percent of the total enrollment in degreeprograms. Students enrolled in postbaccalaureate andgraduate degree programs during fall 1992 numbered41,603 or 12.9 percent of the total. Nearly 72 percent ofthe fall 1992 students enrolled in an undergraduate degreeprogram on a full-time basis. In contrast, more than threequarters of all graduate program enrollment consists ofpart-time students.
Since 1979 the number of men in undergraduate programshas increased at a small but steady rate. Fall 1979 alsowas the last year in which men in undergraduate programsoutnumbered women. The number of women hasincreased steadily every year since 1972. The number ofmen and women enrolled in approved graduate degreeprograms has increased, but women have increased at arate higher than men.
The objective of most postbaccalaureate enrollment iseither the acquisition or enhancement of a Californiateaching credential and, therefore, most often is notdegree related. Enrollment of men in these programschanged little between 1972 and 1992. The number ofwomen in postbaccalaureate programs, however, hasincreased by 70 percent since 1972.
Business and management, engineering andinterdisciplinary studies contributed nearly 40 percent tothe undergraduate enrollment in fall 1992 (business 21.3%,engineering 8.7% and interdisciplinary studies 7.2%).Slightly less than half of the business undergraduateswere minorities. Among the students enrolled in
Introduction

126
Academic and Support ProgramsStudent Majors
Figure 12Enrollment by Level of Degree Program and Gender, Fall 1972 to Fall 1992*
Figure 13Graduate Enrollment in Degree Programs and Postbaccalaureate Enrollment
by Gender, Fall 1972 to Fall 1992
72 73 74 75 76 77 78 79 80 81 82 83 84 85 86 87 88 89 90 91 92
0
50,000
100,000
150,000
200,000
250,000
300,000
350,000
Number
Year
Undergraduate MenUndergraduate WomenGraduate MenGraduate Women
* Excludes student enrolled as Postbaccalaureates
0
5,000
10,000
15,000
20,000
25,000
30,000
35,000
40,000
45,000
0
5,000
10,000
15,000
20,000
25,000
30,000
35,000
40,000
45,000
Year
72 73 74 75 76 77 78 79 80 81 82 83 84 85 86 87 88 89 90 91 92
Tot GradTot PB
Graduate MenGraduate Women
Postbacc. WomenPostbacc. Men
Number
Number
Year

Statistical Abstract 127
Academic and Support ProgramsStudent Majors
Table 77
Total Enrollment by Level of Degree Program, from Fall 1960
Undergraduate Graduate TotalYear Programs* Programs Other** Enrollment
1960 73,115 11,768 10,198 95,0811961 81,930 12,198 11,859 105,9871962 91,843 13,377 12,837 118,0571963 102,838 15,665 14,605 133,1081964 115,358 16,032 17,566 148,956
1965 118,460 18,706 17,761 154,9271966 129,369 19,214 20,937 169,5201967 141,711 22,438 21,452 185,6011968 162,934 24,449 24,185 211,5681969 171,573 26,012 27,252 224,837
1970 187,508 29,585 24,466 241,5591971 205,052 36,501 20,528 262,0811972 213,601 37,135 26,001 276,7371973 226,190 39,349 21,094 286,6331974 232,264 39,077 20,201 291,542
1975 243,911 42,478 24,502 310,8911976 237,123 42,595 24,016 303,7341977 244,297 37,913 30,170 312,3801978 243,058 37,188 25,929 306,1751979 245,577 34,591 26,633 306,801
1980 251,618 34,061 28,171 313,8501981 256,350 35,369 27,846 319,5651982 256,575 34,107 25,132 315,8141983 259,295 31,725 22,880 313,9001984 261,715 29,981 24,309 316,005
1985 267,373 30,717 26,536 324,6261986 271,829 32,513 29,082 333,4241987 278,887 34,652 29,237 342,7761988 289,677 36,202 29,227 355,1061989 293,525 38,737 28,576 360,8381990 298,368 39,732 30,953 369,0531991 291,787 41,908 28,209 361,9041992 282,937 42,248 25,046 350,231
*Includes postbaccalaureate students seeking a second bachelor's degree.**Includes postbaccalaureate students seeking an education credential.

128
Academic and Support Programs
Table 78
Student Enrollment in Degree Programs, from All Campuses, Fall 1990
Undergraduate Graduate TotalDiscipline Division Number Percent Number Percent Number Percent
Agriculture and Natural Resources 5,543 1.9 259 0.7 5,802 1.7Architecture and Environmental Design 3,185 1.1 312 0.8 3,497 1.0Area Studies 274 0.1 85 0.2 359 0.1Biological Sciences 10,605 3.5 803 2.0 11,408 3.4Business and Management 68,769 23.0 6,684 16.8 75,453 22.3Communications 12,981 4.3 428 1.1 13,409 4.0Computer and Information Sciences 10,761 3.6 1,153 2.9 11,914 3.5Education 14,242 4.8 9,320 23.5 23,562 7.0Engineering 25,879 8.7 3,105 7.8 28,984 8.6Fine and Applied Arts 14,552 4.9 1,411 3.6 15,963 4.7Foreign Languages 2,057 0.7 308 0.8 2,365 0.7Health Professions 11,099 3.7 2,637 6.6 13,736 4.1Home Economics 3,855 1.3 341 0.9 4,196 1.2Letters 11,807 4.0 2,815 7.1 14,622 4.3Library Science 0 0.0 255 0.6 255 0.1Mathematics 3,234 1.1 497 1.3 3,731 1.1Physical Sciences 3,917 1.3 672 1.7 4,589 1.4Psychology 15,530 5.2 1,501 3.8 17,031 5.0Public Affairs and Services 10,686 3.6 3,524 8.9 14,210 4.2Social Sciences 20,782 7.0 2,222 5.6 23,004 6.8Interdisciplinary Studies 21,422 7.2 552 1.4 21,974 6.5Undeclared 27,188 9.1 848 2.1 28,036 8.3Total, All Programs 298,368 100.0 39,732 100.0 338,100 100.0
Table 78 (continued)
Student Enrollment in Degree Programs, from All Campuses, Fall 1991
Undergraduate Graduate TotalDiscipline Division Number Percent Number Percent Number Percent
Agriculture and Natural Resources 5,423 1.9 275 0.7 5,698 1.7Architecture and Environmental Design 3,175 1.1 297 0.7 3,472 1.0Area Studies 288 0.1 95 0.2 383 0.1Biological Sciences 11,056 3.8 798 1.9 11,854 3.6Business and Management 65,214 22.4 6,748 16.1 71,962 21.6Communications 12,634 4.3 472 1.1 13,106 3.9Computer and Information Sciences 10,067 3.4 1,453 3.5 11,520 3.4Education 14,101 4.8 9,562 22.8 23,663 7.1Engineering 25,491 8.7 3,282 7.8 28,773 8.6Fine and Applied Arts 14,021 4.8 1,510 3.6 15,531 4.7Foreign Languages 2,007 0.7 356 0.8 2,363 0.7Health Professions 11,958 4.1 2,908 6.9 14,866 4.5Home Economics 3,556 1.2 683 1.6 4,239 1.3Letters 12,121 4.2 3,217 7.7 15,338 4.6Library Science 0 0.0 321 0.8 321 0.1Mathematics 3,049 1.0 504 1.2 3,553 1.1Physical Sciences 3,725 1.3 702 1.7 4,427 1.3Psychology 15,827 5.4 1,592 3.8 17,419 5.2Public Affairs and Services 11,208 3.8 3,675 8.8 14,883 4.5Social Sciences 20,889 7.2 2,414 5.8 23,303 7.0Interdisciplinary Studies 21,470 7.4 667 1.6 22,137 6.6Undeclared 24,507 8.4 377 0.9 24,884 7.5Total, All Programs 291,787 100.0 41,908 100.0 333,695 100.0
Note: Excludes enrollment in the CSU Statewide Nursing Program.
Student Majors
Statistical Abstract 129
Academic and Support ProgramsStudent Majors
Table 78 (continued)
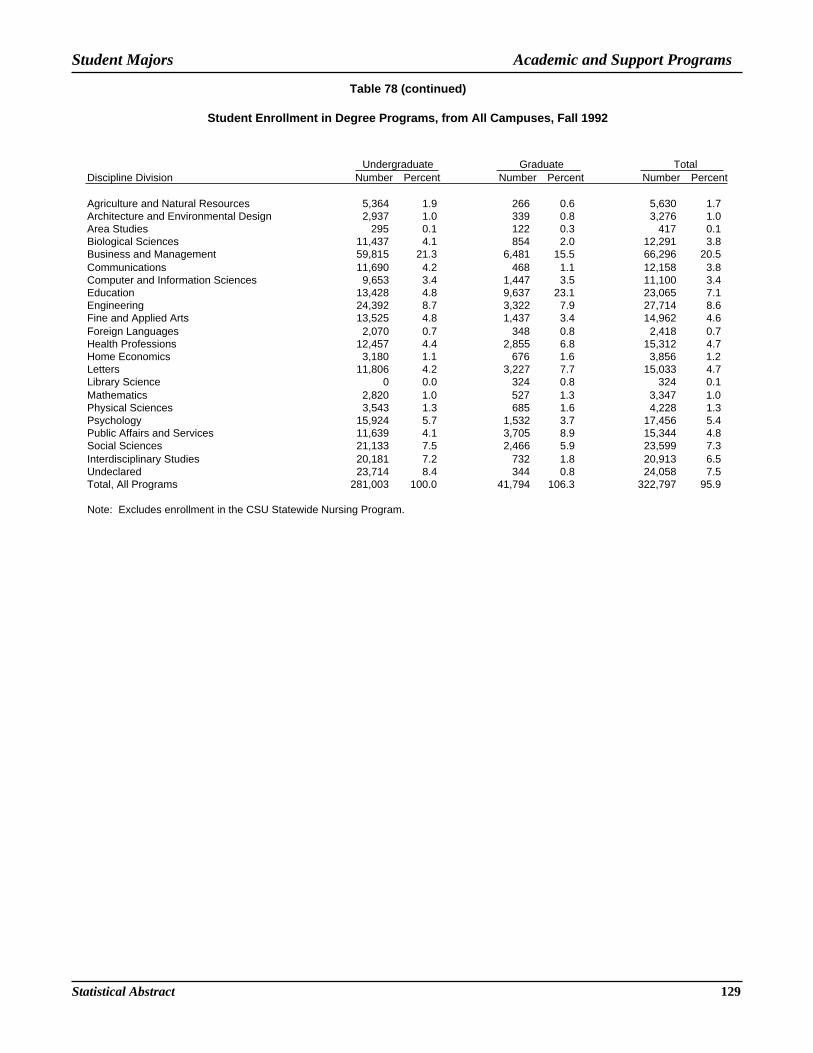
Student Enrollment in Degree Programs, from All Campuses, Fall 1992
Undergraduate Graduate TotalDiscipline Division Number Percent Number Percent Number Percent
Agriculture and Natural Resources 5,364 1.9 266 0.6 5,630 1.7Architecture and Environmental Design 2,937 1.0 339 0.8 3,276 1.0Area Studies 295 0.1 122 0.3 417 0.1Biological Sciences 11,437 4.1 854 2.0 12,291 3.8Business and Management 59,815 21.3 6,481 15.5 66,296 20.5Communications 11,690 4.2 468 1.1 12,158 3.8Computer and Information Sciences 9,653 3.4 1,447 3.5 11,100 3.4Education 13,428 4.8 9,637 23.1 23,065 7.1Engineering 24,392 8.7 3,322 7.9 27,714 8.6Fine and Applied Arts 13,525 4.8 1,437 3.4 14,962 4.6Foreign Languages 2,070 0.7 348 0.8 2,418 0.7Health Professions 12,457 4.4 2,855 6.8 15,312 4.7Home Economics 3,180 1.1 676 1.6 3,856 1.2Letters 11,806 4.2 3,227 7.7 15,033 4.7Library Science 0 0.0 324 0.8 324 0.1Mathematics 2,820 1.0 527 1.3 3,347 1.0Physical Sciences 3,543 1.3 685 1.6 4,228 1.3Psychology 15,924 5.7 1,532 3.7 17,456 5.4Public Affairs and Services 11,639 4.1 3,705 8.9 15,344 4.8Social Sciences 21,133 7.5 2,466 5.9 23,599 7.3Interdisciplinary Studies 20,181 7.2 732 1.8 20,913 6.5Undeclared 23,714 8.4 344 0.8 24,058 7.5Total, All Programs 281,003 100.0 41,794 106.3 322,797 95.9
Note: Excludes enrollment in the CSU Statewide Nursing Program.

130
Academic and Support Programs
Table 79
Enrollment in Undergraduate Programs* by Discipline Division and Sex from Fall 1980
Discipline Division Sex 1980 1981 1982 1983 1984 1985 1986 1987 1988 1989
Agriculture and Men 4,892 4,660 4,320 4,187 4,017 3,691 3,312 3,140 3,112 3,139 Natural Resources Women 2,982 2,973 2,850 2,692 2,522 2,334 2,189 2,184 2,183 2,284
Total 7,874 7,633 7,170 6,879 8,539 6,025 5,501 5,324 5,295 5,423
Architecture and Men 1,808 1,685 1,440 1,523 1,565 1,554 1,585 1,874 1,722 1,798 Environmental Design Women 610 625 615 758 765 777 896 1,082 1,223 1,368
Total 2,418 2,310 2,055 2,281 2,330 2,331 2,481 2,756 2,945 3,166
Area Studies Men 102 67 88 87 87 98 108 106 122 115Women 176 191 171 159 164 164 118 113 126 138
Total 278 278 259 246 251 262 226 219 248 253
Biological Sciences Men 5,250 4,917 4,743 4,758 4,652 4,738 4,706 4,631 4,645 4,648Women 5,136 5,176 5,121 5,292 5,472 5,459 5,231 5,169 5,436 5,510
Total 10,386 10,093 9,864 10,048 10,124 10,197 9,937 9,800 10,081 10,158
Business and Men 33,097 32,261 29,887 27,944 27,846 29,841 31931 32,910 34128 34,342 Management Women 25,589 27,196 27,316 26,955 28,213 31,541 33,616 34,746 35,405 35,112
Total 58,666 59,457 57,203 54,699 56,059 61,382 65,547 67,656 69,533 69,454
Communications Men 4,406 4,256 4,272 4,716 4,698 4,790 4,902 5,006 5,285 5,370Women 5,182 5,255 5,640 6,480 6,499 6,704 6,927 7,214 7,458 7,517
Total 9,588 9,511 9,912 11,196 11,197 11,494 11,829 12,220 12,743 12,887
Computer and Men 4,163 5,672 6,972 6,374 8,907 8,983 8,745 8,417 7,701 7,299 Information Sciences Women 2,225 3,453 4,445 5,501 5,578 5,233 4,813 4,360 3,794 3,564
Total 6,388 9,125 11,417 13,875 14,485 14,216 13,556 12,777 11,495 10,863
Education Men 6,142 5,937 5,986 6,264 6,263 6,523 6,541 7,212 7,177 7,331Women 6,626 6,021 5,933 5,861 5,575 5,662 5,740 6,117 6,362 6,543
Total 12,768 11,958 11,919 12,125 11,838 12,185 12,281 13,329 13,539 13,874
Engineering Men 19,659 20,730 21,502 21,328 21,795 21404 21853 21401 21,977 22,209Women 2,318 2,684 3,082 3,274 3,323 3,362 3,514 3,402 3,477 3,457
Total 21,977 23,414 24,584 24,602 25,118 24,786 25,367 24,803 25,454 25,666
Fine and Applied Arts Men 5,679 5,615 5,363 5,270 4,963 5,129 5,187 5,467 5,893 6057Women 8,457 8,473 8,288 7,591 7,199 7,484 7,671 7,877 8,214 8,080
Total 14,136 14,088 13,851 12,861 12,182 12,613 12,858 13,344 14,107 14,137
Foreign Languages Men 510 499 496 481 456 519 548 532 613 600Women 1,406 1,290 1,251 1,251 1,274 1,242 1,265 1,315 1,367 1,329
Total 1,916 1,789 1,747 1,732 1,730 1,761 1,813 1,847 1,980 1,929
Health Professions Men 1,695 1,578 1,518 1,557 1,534 1,622 1,593 1,609 1,658 1,546Women 9,888 9,869 9,630 10,055 9,421 9,419 9,203 8,845 8,527 8,678
Total 11,583 11,447 11,348 11,612 10,955 11,041 10,796 10,454 10,185 10,224
Home Economics Men 125 137 130 142 178 205 231 239 253 221Women 4,160 3,898 3,730 3,741 4,111 4,102 4,000 3,893 3,804 3,682
Total 4,285 4,035 3,860 3,883 4,289 4,307 4,231 4,132 4,057 3,903
Letters Men 2,490 2,767 2,687 2,486 2,735 3,028 3,248 3,520 3,798 4,056Women 4,270 4,667 4,744 4,369 4,679 5,204 5,775 6,431 6,969 7,296
Total 6,760 7,434 7,431 6,875 7,414 8,232 9,023 9,951 10,767 11,352
Mathematics Men 1,408 1,576 2,023 2,553 2,760 2,742 2,468 2,295 2,157 1,954Women 869 958 1,253 1,580 1,847 1,811 1,759 1,644 1,507 1,447
Total 2,277 2,534 3,276 4,133 4,607 4,553 4,247 3,939 3,664 3,401
Physical Science Men 3,572 3,774 3,857 3,886 3,704 3,571 3,437 3,167 2,970 2,844Women 1,260 1,400 1,440 1,469 1,428 1,341 1,219 1,182 1,160 1,174
Total 4,832 5,174 5,297 5,355 5,132 4,912 4,656 4,349 4,130 4,018
Psychology Men 3,160 3,071 3,026 2,954 2,926 3,068 3,138 3,289 3,548 3,633Women 6,554 6,829 6,930 7,102 7,076 7,610 8,045 8,811 9,997 10,880
Total 9,714 9,900 9,956 10,056 10,002 10,678 11,183 12,080 13,545 14,513
Public Affairs and Men 4,246 3,854 3,533 3,609 3,765 4,007 4,038 4,438 4,553 4,632 Services Women 5,848 5,383 4,915 4,618 4,589 4,742 4,686 4,925 5,364 5,467
Total 10,094 9,237 8,448 8,227 8,354 8,749 8,724 9,363 9,937 10,099
Social Sciences Men 7,814 7,743 7,681 7,922 7,988 8,008 8,545 9,053 9,933 10,515Women 7,257 7,269 6,971 6,838 6,793 6,780 6,938 7,473 8,411 8,994
Total 15,071 15,012 14,652 14,760 14,781 14,788 15,483 16,526 18,344 19,509
Interdisciplinary Men 2,036 1,950 1,943 1,902 1,923 2,212 2,416 2,919 3,211 3,663 Studies Women 8,513 8,687 8,660 6,768 9,309 10,303 12,194 14,191 16,045 16,842
Total 10,549 10,637 10,603 10,670 11,232 12,515 14,612 17,110 19,256 20,505
Undeclared Bachelors Men 12,679 13,367 14,429 15,407 15,736 14,522 12,927 12,141 12,885 12,668Women 17,359 17,917 17,494 17,573 17,380 15,844 14,549 14,767 15,467 15,523
Total 30,038 31,284 31,923 32,980 33,096 30,366 27,476 26,908 28,372 28,191
Total, All Programs Men 124,933 126,136 125,898 127,348 128,518 130,255 131,481 133,146 137,341 138,640Women 126,665 130,214 130,679 131,947 133,197 137,118 140,348 145,741 152,338 154,885
Total 251,616 256,350 256,575 259,295 261,715 267,373 271,629 278,887 289,677 293,525
*Includes postbaccalaureate students seeking a second bachelor's degree. Note: Excludes enrollment in the CSU Statewide Nursing Program.
Student Majors

Statistical Abstract 131
Academic and Support Programs
Table 79 (continued)
Enrollment in Undergraduate Programs* by Discipline Division and Sex from Fall 1980
Discipline Division Sex 1990 1991 1992
Agriculture and Men 3,126 3,085 3,034 Natural Resources Women 2,417 2,338 2,330
Total 5,543 5,423 5,364
Architecture and Men 1,739 1,755 1,617 Environmental Design Women 1,446 1,420 1,320
Total 3,185 3,175 2,937
Area Studies Men 113 123 120Women 161 165 175
Total 274 288 295
Biological Science Men 4,877 5,145 5,321Women 5,728 5,911 6,116
Total 10,605 11,056 11,437
Business and Men 34,204 32,385 29,434 Management Women 34,565 32,829 30,381
Total 68,769 65,214 59,815
Communications Men 5,445 5,434 5,218Women 7,536 7,200 6,472
Total 12,981 12,634 11,690
Computer and Men 7,293 6,896 6,591 Information Sciences Women 3,468 3,171 3,062
Total 10,761 10,067 9,653
Education Men 7,332 6,851 6,479Women 6,910 7,250 6,949
Total 14,242 14,101 13,428
Engineering Men 22,331 21,906 20,866Women 3,548 3,585 3,526
Total 25,879 25,491 24,392
Fine and Applied Arts Men 6,385 6,227 6,139Women 8,167 7,794 7,386
Total 14,552 14,021 13,525
Foreign Languages Men 646 659 678Women 1,411 1,348 1,392
Total 2,057 2,007 2,070
Health Professions Men 1,771 2,083 2,369Women 9,328 9,875 10,088
Total 11,099 11,958 12,457
Home Economics Men 272 243 223Women 3,583 3,313 2,957
Total 3,855 3,556 3,180
Letters Men 4,334 4,417 4,381Women 7,473 7,704 7,425
Total 11,807 12,121 11,806
Mathematics Men 1,833 1,725 1,600Women 1,401 1,324 1,220
Total 3,234 3,049 2,820
Physical Science Men 2,744 2,587 2,416Women 1,173 1,138 1,127
Total 3,917 3,725 3,543
Psychology Men 3,826 3,986 4,056Women 11,704 11,841 11,868
Total 15,530 15,827 15,924
Public Affairs Men 4,924 5,159 5,383 and Services Women 5,762 6,049 6,256
Total 10,686 11,208 11,639
Social Sciences Men 11,158 11,088 11,099Women 9,624 9,801 10,034
Total 20,782 20,889 21,113
Interdisciplinary Men 3,908 3,990 3,948 Studies Women 17,514 17,480 16,233
Total 21,422 21,470 20,181
Undeclared Men 12,230 11,044 10,459Women 14,958 13,463 13,255
Total 27,188 24,507 23,714
Total, All Programs Men 140,491 136,788 131,431Women 157,877 154,999 149,572
Total 298,368 291,787 281,003
*Includes postbaccalaureate students seeking a second bachelor's degree. Excludes enrollment in the CSU Statewide Nursing Program.
Student Majors
132
Academic and Support ProgramsTable 80
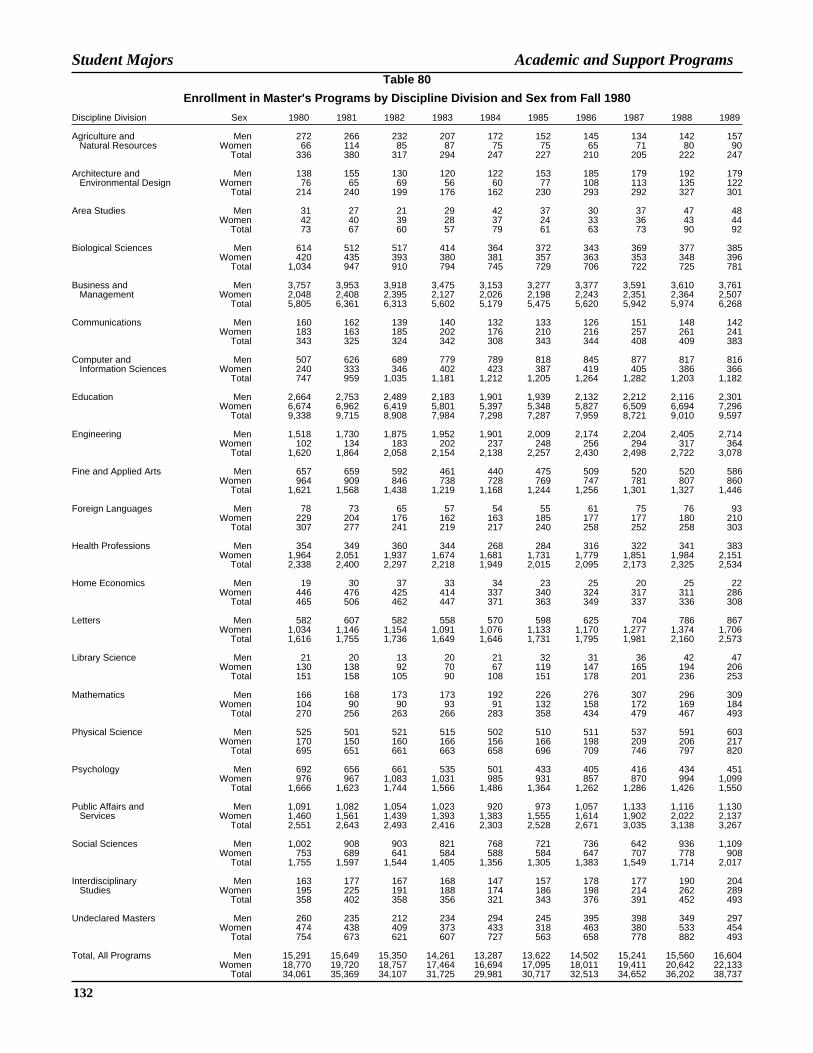
Enrollment in Master's Programs by Discipline Division and Sex from Fall 1980
Discipline Division Sex 1980 1981 1982 1983 1984 1985 1986 1987 1988 1989
Agriculture and Men 272 266 232 207 172 152 145 134 142 157 Natural Resources Women 66 114 85 87 75 75 65 71 80 90
Total 336 380 317 294 247 227 210 205 222 247
Architecture and Men 138 155 130 120 122 153 185 179 192 179 Environmental Design Women 76 65 69 56 60 77 108 113 135 122
Total 214 240 199 176 162 230 293 292 327 301
Area Studies Men 31 27 21 29 42 37 30 37 47 48Women 42 40 39 28 37 24 33 36 43 44
Total 73 67 60 57 79 61 63 73 90 92
Biological Sciences Men 614 512 517 414 364 372 343 369 377 385Women 420 435 393 380 381 357 363 353 348 396
Total 1,034 947 910 794 745 729 706 722 725 781
Business and Men 3,757 3,953 3,918 3,475 3,153 3,277 3,377 3,591 3,610 3,761 Management Women 2,048 2,408 2,395 2,127 2,026 2,198 2,243 2,351 2,364 2,507
Total 5,805 6,361 6,313 5,602 5,179 5,475 5,620 5,942 5,974 6,268
Communications Men 160 162 139 140 132 133 126 151 148 142Women 183 163 185 202 176 210 216 257 261 241
Total 343 325 324 342 308 343 344 408 409 383
Computer and Men 507 626 689 779 789 818 845 877 817 816 Information Sciences Women 240 333 346 402 423 387 419 405 386 366
Total 747 959 1,035 1,181 1,212 1,205 1,264 1,282 1,203 1,182
Education Men 2,664 2,753 2,489 2,183 1,901 1,939 2,132 2,212 2,116 2,301Women 6,674 6,962 6,419 5,801 5,397 5,348 5,827 6,509 6,694 7,296
Total 9,338 9,715 8,908 7,984 7,298 7,287 7,959 8,721 9,010 9,597
Engineering Men 1,518 1,730 1,875 1,952 1,901 2,009 2,174 2,204 2,405 2,714Women 102 134 183 202 237 248 256 294 317 364
Total 1,620 1,864 2,058 2,154 2,138 2,257 2,430 2,498 2,722 3,078
Fine and Applied Arts Men 657 659 592 461 440 475 509 520 520 586Women 964 909 846 738 728 769 747 781 807 860
Total 1,621 1,568 1,438 1,219 1,168 1,244 1,256 1,301 1,327 1,446
Foreign Languages Men 78 73 65 57 54 55 61 75 76 93Women 229 204 176 162 163 185 177 177 180 210
Total 307 277 241 219 217 240 258 252 258 303
Health Professions Men 354 349 360 344 268 284 316 322 341 383Women 1,964 2,051 1,937 1,674 1,681 1,731 1,779 1,851 1,984 2,151
Total 2,338 2,400 2,297 2,218 1,949 2,015 2,095 2,173 2,325 2,534
Home Economics Men 19 30 37 33 34 23 25 20 25 22Women 446 476 425 414 337 340 324 317 311 286
Total 465 506 462 447 371 363 349 337 336 308
Letters Men 582 607 582 558 570 598 625 704 786 867Women 1,034 1,146 1,154 1,091 1,076 1,133 1,170 1,277 1,374 1,706
Total 1,616 1,755 1,736 1,649 1,646 1,731 1,795 1,981 2,160 2,573
Library Science Men 21 20 13 20 21 32 31 36 42 47Women 130 138 92 70 67 119 147 165 194 206
Total 151 158 105 90 108 151 178 201 236 253
Mathematics Men 166 168 173 173 192 226 276 307 296 309Women 104 90 90 93 91 132 158 172 169 184
Total 270 256 263 266 283 358 434 479 467 493
Physical Science Men 525 501 521 515 502 510 511 537 591 603Women 170 150 160 166 156 166 198 209 206 217
Total 695 651 661 663 658 696 709 746 797 820
Psychology Men 692 656 661 535 501 433 405 416 434 451Women 976 967 1,083 1,031 985 931 857 870 994 1,099
Total 1,666 1,623 1,744 1,566 1,486 1,364 1,262 1,286 1,426 1,550
Public Affairs and Men 1,091 1,082 1,054 1,023 920 973 1,057 1,133 1,116 1,130 Services Women 1,460 1,561 1,439 1,393 1,383 1,555 1,614 1,902 2,022 2,137
Total 2,551 2,643 2,493 2,416 2,303 2,528 2,671 3,035 3,138 3,267
Social Sciences Men 1,002 908 903 821 768 721 736 642 936 1,109Women 753 689 641 584 588 584 647 707 778 908
Total 1,755 1,597 1,544 1,405 1,356 1,305 1,383 1,549 1,714 2,017
Interdisciplinary Men 163 177 167 168 147 157 178 177 190 204 Studies Women 195 225 191 188 174 186 198 214 262 289
Total 358 402 358 356 321 343 376 391 452 493
Undeclared Masters Men 260 235 212 234 294 245 395 398 349 297Women 474 438 409 373 433 318 463 380 533 454
Total 754 673 621 607 727 563 658 778 882 493
Total, All Programs Men 15,291 15,649 15,350 14,261 13,287 13,622 14,502 15,241 15,560 16,604Women 18,770 19,720 18,757 17,464 16,694 17,095 18,011 19,411 20,642 22,133
Total 34,061 35,369 34,107 31,725 29,981 30,717 32,513 34,652 36,202 38,737
Student Majors
Statistical Abstract 133
Academic and Support Programs
Table 80 (continued)
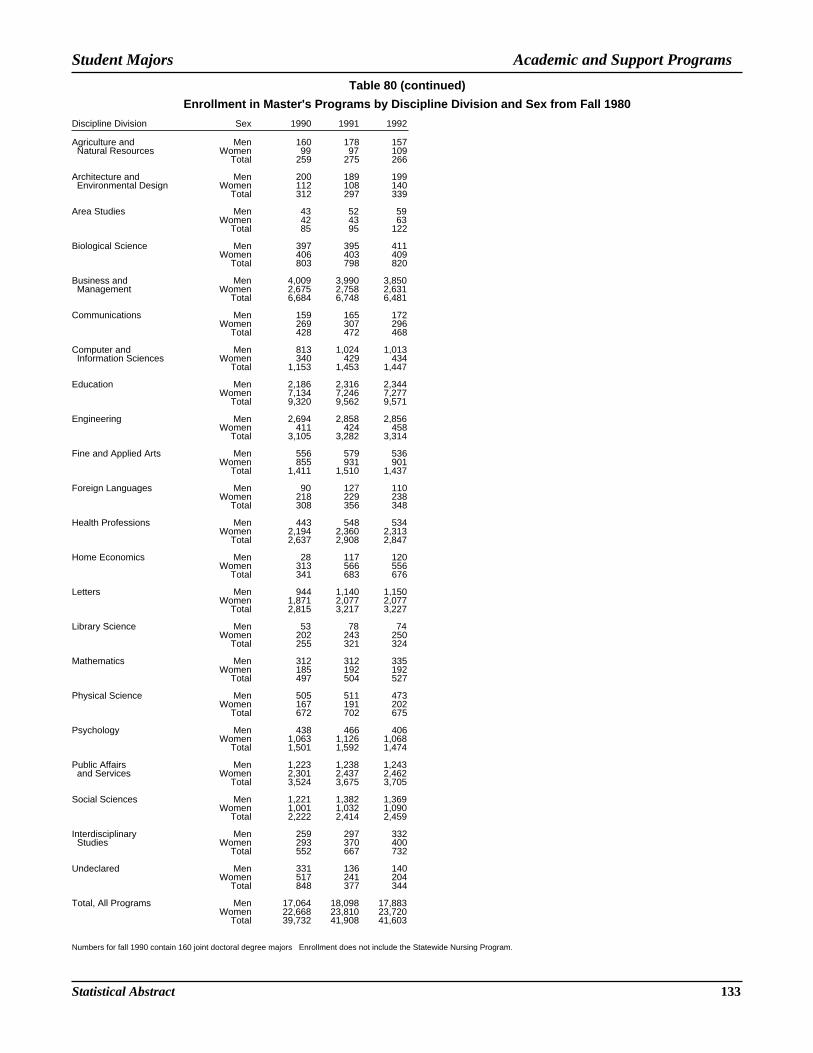
Enrollment in Master's Programs by Discipline Division and Sex from Fall 1980
Discipline Division Sex 1990 1991 1992
Agriculture and Men 160 178 157 Natural Resources Women 99 97 109
Total 259 275 266
Architecture and Men 200 189 199 Environmental Design Women 112 108 140
Total 312 297 339
Area Studies Men 43 52 59Women 42 43 63
Total 85 95 122
Biological Science Men 397 395 411Women 406 403 409
Total 803 798 820
Business and Men 4,009 3,990 3,850 Management Women 2,675 2,758 2,631
Total 6,684 6,748 6,481
Communications Men 159 165 172Women 269 307 296
Total 428 472 468
Computer and Men 813 1,024 1,013 Information Sciences Women 340 429 434
Total 1,153 1,453 1,447
Education Men 2,186 2,316 2,344Women 7,134 7,246 7,277
Total 9,320 9,562 9,571
Engineering Men 2,694 2,858 2,856Women 411 424 458
Total 3,105 3,282 3,314
Fine and Applied Arts Men 556 579 536Women 855 931 901
Total 1,411 1,510 1,437
Foreign Languages Men 90 127 110Women 218 229 238
Total 308 356 348
Health Professions Men 443 548 534Women 2,194 2,360 2,313
Total 2,637 2,908 2,847
Home Economics Men 28 117 120Women 313 566 556
Total 341 683 676
Letters Men 944 1,140 1,150Women 1,871 2,077 2,077
Total 2,815 3,217 3,227
Library Science Men 53 78 74Women 202 243 250
Total 255 321 324
Mathematics Men 312 312 335Women 185 192 192
Total 497 504 527
Physical Science Men 505 511 473Women 167 191 202
Total 672 702 675
Psychology Men 438 466 406Women 1,063 1,126 1,068
Total 1,501 1,592 1,474
Public Affairs Men 1,223 1,238 1,243 and Services Women 2,301 2,437 2,462
Total 3,524 3,675 3,705
Social Sciences Men 1,221 1,382 1,369Women 1,001 1,032 1,090
Total 2,222 2,414 2,459
Interdisciplinary Men 259 297 332 Studies Women 293 370 400
Total 552 667 732
Undeclared Men 331 136 140Women 517 241 204
Total 848 377 344
Total, All Programs Men 17,064 18,098 17,883Women 22,668 23,810 23,720
Total 39,732 41,908 41,603
Numbers for fall 1990 contain 160 joint doctoral degree majors Enrollment does not include the Statewide Nursing Program.
Student Majors

134
Academic and Support ProgramsStudent Majors
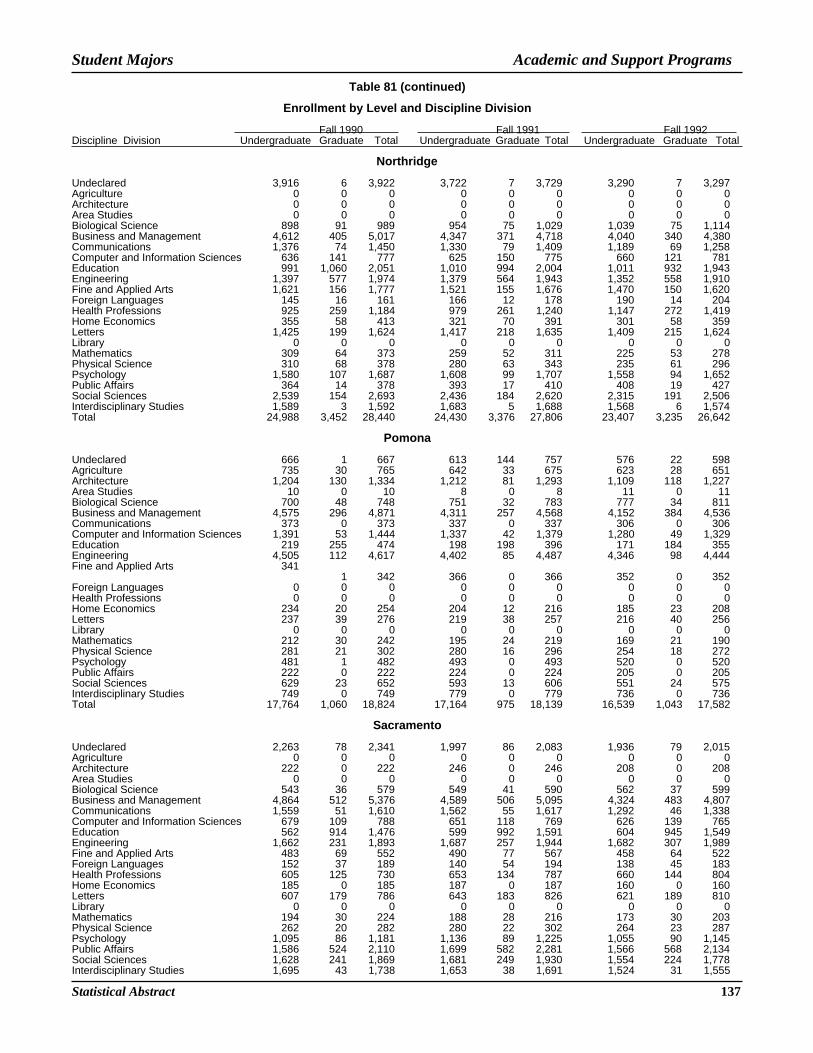
Table 81
Enrollment By Level And Discipline Division
Fall 1990 Fall 1991 Fall 1992Discipline Division Undergraduate Graduate Total Undergraduate Graduate Total Undergraduate Graduate Total
Bakersfield
Undeclared 563 3 566 532 3 535 513 1 514Agriculture 0 0 0 0 0 0 0 0 0Architecture 0 0 0 0 0 0 0 0 0Area Studies 0 0 0 0 0 0 0 0 0Biological Science 107 0 107 143 0 143 130 0 130Business and Management 825 158 983 797 171 968 794 163 957Communications 116 0 116 101 0 101 94 0 94Computer and Information Sciences 104 0 104 105 0 105 101 0 101Education 180 160 340 199 195 394 192 289 481Engineering 0 0 0 0 0 0 0 0 0Fine and Applied Arts 95 0 95 86 0 86 102 0 102Foreign Languages 26 0 26 26 0 26 37 0 37Health Professions 220 10 230 247 2 249 319 2 321Home Economics 0 0 0 0 0 0 0 0 0Letters 164 19 183 159 13 172 157 7 164Library 0 0 0 0 0 0 0 0 0Mathematics 78 0 78 84 0 84 85 0 85Physical Science 89 8 97 89 6 95 102 2 104Psychology 211 21 232 236 12 248 242 8 250Public Affairs 180 40 220 166 43 209 178 30 208Social Sciences 322 7 329 309 5 314 308 4 312Interdisciplinary Studies 624 0 624 651 0 651 644 0 644Total 3,904 426 4,330 3,930 450 4,380 3,998 506 4,504
Chico
Undeclared 1,510 7 1,517 1,178 0 1,178 1,201 0 1,201Agriculture 185 17 202 209 20 229 224 15 239Architecture 0 11 11 0 15 15 0 11 11Area Studies 22 0 22 24 0 24 18 0 18Biological Science 352 31 383 350 30 380 385 27 412Business and Management 2,993 51 3,044 2,549 59 2,608 2,229 43 2,272Communications 936 25 961 913 24 937 890 17 907Computer and Information Sciences 406 92 498 401 90 491 388 98 486Education 969 218 1,187 978 205 1,183 900 193 1,093Engineering 1,157 15 1,172 1,144 15 1,159 1,103 15 1,118Fine and Applied Arts 331
31 362 322 28 350 340 18 358Foreign Languages 117 0 117 102 0 102 105 0 105Health Professions 400 56 456 443 63 506 491 57 548Home Economics 307 8 315 271 13 284 224 14 238Letters 678 56 734 697 56 753 697 65 762Library 0 0 0 0 0 0 0 0 0Mathematics 146 0 146 140 0 140 116 0 116Physical Science 178 7 185 172 14 186 183 9 192Psychology 719 84 803 743 96 839 748 100 848Public Affairs 628 69 697 658 49 707 737 51 788Social Sciences 1,442 145 1,587 1,437 160 1,597 1,481 119 1,600Interdisciplinary Studies 1,182 49 1,231 1,090 48 1,138 1,104 63 1,167Total 14,658 972 15,630 13,821 985 14,806 13,564 915 14,479
Dominguez Hills
Undeclared 502 134 636 525 3 528 502 1 503Agriculture 0 0 0 0 0 0 0 0 0Architecture 0 0 0 0 0 0 0 0 0Area Studies 0 0 0 0 0 0 0 0 0Biological Science 147 23 170 160 27 187 202 51 253Business and Management 1,877 197 2,074 1,850 224 2,074 1,812 203 2,015Communications 216 0 216 230 0 230 198 0 198Computer and Information Sciences 508 0 508 451 19 470 391 21 412Education 102 430 532 127 585 712 146 692 838Engineering 0 77 77 0 85 85 0 58 58Fine and Applied Arts 212 11 223 208 14 222 206 10 216Foreign Languages 56 0 56 72 0 72 111 0 111Health Professions 477 38 515 567 59 626 505 57 562Home Economics 0 0 0 0 56 56 0 67 67Letters 142 34 176 196 108 304 211 107 318Library 0 0 0 0 0 0 0 0 0Mathematics 61 0 61 55 0 55 63 0 63Physical Science 64 0 64 57 0 57 68 0 68Psychology 325 102 427 385 139 524 462 153 615Public Affairs 448 93 541 465 117 582 556 119 675Social Sciences 514 51 565 547 59 606 619 57 676Interdisciplinary Studies 1,012 3 1,015 1,146 3 1,149 1,251 3 1,254

Statistical Abstract 135
Academic and Support ProgramsStudent Majors
Table 81 (continued)
Enrollment by Level and Discipline Division
Fall 1990 Fall 1991 Fall 1992Discipline Division Undergraduate Graduate Total Undergraduate Graduate Total Undergraduate Graduate Total
Fresno
Undeclared 1,708 177 1,885 1,308 27 1,335 1,228 49 1,277Agriculture 719 66 785 765 72 837 772 61 833Architecture 15 21 36 43 19 62 71 12 83Area Studies 0 0 0 0 0 0 0 0 0Biological Science 527 47 574 569 32 601 552 31 583Business and Management 3,378 280 3,658 3,283 231 3,514 3,023 216 3,239Communications 427 53 480 473 43 516 469 34 503Computer and Information Sciences 368 0 368 338 1 339 323 0 323Education 845 464 1,309 973 431 1,404 868 403 1,271Engineering 1,087 32 1,119 1,106 35 1,141 1,144 22 1,166Fine and Applied Arts 479 62 541 446 57 503 379 44 423Foreign Languages 88 15 103 93 21 114 86 21 107Health Professions 1,185 194 1,379 1,337 202 1,539 1,520 180 1,700Home Economics 141 22 163 120 120 240 102 123 225Letters 555 119 674 555 175 730 524 182 706Library 0 0 0 0 0 0 0 0 0Mathematics 190 30 220 189 30 219 173 25 198Physical Science 200 30 230 199 37 236 191 31 222Psychology 658 84 742 719 75 794 669 68 737Public Affairs 820 236 1,056 915 249 1,164 967 271 1,238Social Sciences 639 87 726 637 92 729 631 107 738Interdisciplinary Studies 2,196 5 2,201 2,084 7 2,091 1,820 9 1,829Total 16,225 2,024 18,249 16,152 1,956 18,108 15,512 1,889 17,401
Fullerton
Undeclared 1,055 0 1,055 1,078 1 1,079 1,314 0 1,314Agriculture 0 0 0 0 0 0 0 0 0Architecture 0 0 0 0 0 0 0 0 0Area Studies 105 22 127 115 27 142 104 39 143Biological Science 840 38 878 847 33 880 905 43 948Business and Management 6,643 503 7,146 6,986 494 7,480 6,048 466 6,514Communications 2,253 50 2,303 2,147 82 2,229 1,963 80 2,043Computer and Information Sciences 982 162 1,144 937 195 1,132 870 188 1,058Education 1,338 759 2,097 1,338 773 2,111 1,294 696 1,990Engineering 1,148 242 1,390 1,063 221 1,284 797 234 1,031Fine and Applied Arts 1,288
179 1,467 1,216 185 1,401 1,207 197 1,404Foreign Languages 142 29 171 141 26 167 130 39 169Health Professions 313 68 381 301 69 370 281 72 353Home Economics 0 0 0 0 0 0 0 0 0Letters 772 210 982 777 249 1,026 777 248 1,025Library 0 0 0 0 0 0 0 0 0Mathematics 201 60 261 164 57 221 157 53 210Physical Science 226 23 249 191 19 210 218 37 255Psychology 1,188 40 1,228 1,161 45 1,206 1,183 46 1,229Public Affairs 823 105 928 890 105 995 982 106 1,088Social Sciences 1,352 219 1,571 1,350 245 1,595 1,412 296 1,708Interdisciplinary Studies 792 79 871 818 99 917 817 92 909Total 21,461 2,788 24,249 21,520 2,925 24,445 20,459 2,932 23,391
Hayward
Undeclared 661 0 661 829 0 829 822 26 848Agriculture 0 0 0 0 0 0 0 0 0Architecture 0 0 0 0 0 0 0 0 0Area Studies 3 0 3 3 0 3 4 0 4Biological Science 303 21 324 325 23 348 378 27 405Business and Management 3,824 598 4,422 3,746 687 4,433 3,637 619 4,256Communications 273 0 273 285 0 285 318 0 318Computer and Information Sciences 561 50 611 506 65 571 487 77 564Education 259 651 910 262 644 906 293 626 919Engineering 0 0 0 0 0 0 0 0 0Fine and Applied Arts 290 19 309 287 24 311 288 18 306Foreign Languages 53 0 53 53 0 53 48 0 48Health Professions 546 49 595 403 45 448 404 44 448Home Economics 0 0 0 0 0 0 0 0 0Letters 271 57 328 280 64 344 285 56 341Library 0 0 0 0 0 0 0 0 0Mathematics 102 51 153 105 57 162 109 68 177Physical Science 142 32 174 160 33 193 140 37 177Psychology 735 0 735 758 0 758 791 0 791Public Affairs 336 250 586 362 260 622 424 252 676Social Sciences 598 87 685 627 91 718 655 102 757Interdisciplinary Studies 904 16 920 1,043 23 1,066 1,023 4 1,027

136
Academic and Support Programs
Table 81 (continued)
Enrollment by Level and Discipline Division
Fall 1990 Fall 1991 Fall 1992Discipline Division Undergraduate Graduate Total Undergraduate Graduate Total Undergraduate Graduate Total
Humboldt
Undeclared 672 0 672 685 21 706 553 4 557Agriculture 898 84 982 924 82 1,006 1,015 86 1,101Architecture 0 0 0 0 0 0 0 0 0Area Studies 0 0 0 0 0 0 0 0 0Biological Science 663 34 697 693 49 742 749 55 804Business and Management 490 38 528 458 32 490 416 22 438Communications 173 0 173 162 1 163 166 0 166Computer and Information Sciences 80 0 80 73 1 74 78 0 78Education 243 124 367 252 110 362 260 38 298Engineering 232 0 232 274 14 288 352 3 355Fine and Applied Arts 473 45 518 450 46 496 512 38 550Foreign Languages 79 0 79 88 3 91 90 0 90Health Professions 210 16 226 199 15 214 195 1 196Home Economics 33 0 33 31 0 31 10 0 10Letters 404 54 458 423 50 473 406 55 461Library 0 0 0 0 0 0 0 0 0Mathematics 101 0 101 95 1 96 100 0 100Physical Science 249 0 249 254 3 257 237 0 237Psychology 335 93 428 348 83 431 367 100 467Public Affairs 106 0 106 107 0 107 97 0 97Social Sciences 638 36 674 685 52 737 708 62 770Interdisciplinary Studies 569 41 610 625 56 681 648 57 705Total 6,648 565 7,213 6,826 619 7,445 6,959 521 7,480
Long Beach
Undeclared 2,203 150 2,353 1,823 0 1,823 1,397 0 1,397Agriculture 0 0 0 0 0 0 0 0 0Architecture 300 0 300 270 0 270 240 0 240Area Studies 41 13 54 42 15 57 41 20 61Biological Science 924 71 995 946 76 1,022 872 79 951Business and Management 5,693 604 6,297 5,110 509 5,619 4,513 541 5,054Communications 859 0 859 848 0 848 846 0 846Computer and Information Sciences 415 0 415 377 202 579 397 210 607Education 1,624 620 2,244 1,131 628 1,759 911 587 1,498Engineering 3,104 697 3,801 3,171 722 3,893 2,857 691 3,548Fine and Applied Arts 2,087
193 2,280 1,977 169 2,146 1,871 213 2,084Foreign Languages 144 35 179 133 40 173 140 40 180Health Professions 1,491 335 1,826 1,681 377 2,058 1,765 360 2,125Home Economics 759 95 854 696 122 818 655 135 790Letters 1,348 252 1,600 1,284 292 1,576 1,197 299 1,496Library 0 0 0 0 0 0 0 0 0Mathematics 230 52 282 204 45 249 183 53 236Physical Science 225 84 309 196 93 289 221 64 285Psychology 1,506 163 1,669 1,447 150 1,597 1,388 139 1,527Public Affairs 1,067 842 1,909 1,120 797 1,917 1,061 782 1,843Social Sciences 1,554 153 1,707 1,533 173 1,706 1,536 190 1,726Interdisciplinary Studies 2,059 18 2,077 2,004 35 2,039 1,942 32 1,974Total 27,633 4,377 32,010 25,993 4,445 30,438 24,033 4,435 28,468
Los Angeles
Undeclared 2,061 0 2,061 1,623 23 1,646 1,874 0 1,874Agriculture 0 0 0 0 0 0 0 0 0Architecture 0 0 0 0 0 0 0 0 0Area Studies 18 9 27 25 5 30 30 7 37Biological Science 454 35 489 475 16 491 483 12 495Business and Management 4,678 323 5,001 4,371 324 4,695 3,901 266 4,167Communications 342 0 342 354 0 354 324 0 324Computer and Information Sciences 794 0 794 773 0 773 733 0 733Education 1,557 449 2,006 1,666 590 2,256 1,512 710 2,222Engineering 1,087 60 1,147 1,019 64 1,083 913 73 986Fine and Applied Arts 652 110 762 609 189 798 542 128 670Foreign Languages 226 26 252 213 34 247 177 31 208Health Professions 1,048 227 1,275 1,169 227 1,396 988 202 1,190Home Economics 156 23 179 137 17 154 134 24 158Letters 414 74 488 448 160 608 384 175 559Library 0 0 0 0 0 0 0 0 0Mathematics 159 27 186 149 28 177 143 19 162Physical Science 147 57 204 158 57 215 139 44 183Psychology 590 95 685 620 105 725 574 109 683Public Affairs 769 43 812 812 16 828 830 35 865Social Sciences 918 121 1,039 936 107 1,043 918 96 1,014Interdisciplinary Studies 369 1 370 374 2 376 301 9 310
Student Majors
Statistical Abstract 137
Academic and Support Programs
Table 81 (continued)
Enrollment by Level and Discipline Division
Fall 1990 Fall 1991 Fall 1992Discipline Division Undergraduate Graduate Total Undergraduate Graduate Total Undergraduate Graduate Total
Northridge
Undeclared 3,916 6 3,922 3,722 7 3,729 3,290 7 3,297Agriculture 0 0 0 0 0 0 0 0 0Architecture 0 0 0 0 0 0 0 0 0Area Studies 0 0 0 0 0 0 0 0 0Biological Science 898 91 989 954 75 1,029 1,039 75 1,114Business and Management 4,612 405 5,017 4,347 371 4,718 4,040 340 4,380Communications 1,376 74 1,450 1,330 79 1,409 1,189 69 1,258Computer and Information Sciences 636 141 777 625 150 775 660 121 781Education 991 1,060 2,051 1,010 994 2,004 1,011 932 1,943Engineering 1,397 577 1,974 1,379 564 1,943 1,352 558 1,910Fine and Applied Arts 1,621 156 1,777 1,521 155 1,676 1,470 150 1,620Foreign Languages 145 16 161 166 12 178 190 14 204Health Professions 925 259 1,184 979 261 1,240 1,147 272 1,419Home Economics 355 58 413 321 70 391 301 58 359Letters 1,425 199 1,624 1,417 218 1,635 1,409 215 1,624Library 0 0 0 0 0 0 0 0 0Mathematics 309 64 373 259 52 311 225 53 278Physical Science 310 68 378 280 63 343 235 61 296Psychology 1,580 107 1,687 1,608 99 1,707 1,558 94 1,652Public Affairs 364 14 378 393 17 410 408 19 427Social Sciences 2,539 154 2,693 2,436 184 2,620 2,315 191 2,506Interdisciplinary Studies 1,589 3 1,592 1,683 5 1,688 1,568 6 1,574Total 24,988 3,452 28,440 24,430 3,376 27,806 23,407 3,235 26,642
Pomona
Undeclared 666 1 667 613 144 757 576 22 598Agriculture 735 30 765 642 33 675 623 28 651Architecture 1,204 130 1,334 1,212 81 1,293 1,109 118 1,227Area Studies 10 0 10 8 0 8 11 0 11Biological Science 700 48 748 751 32 783 777 34 811Business and Management 4,575 296 4,871 4,311 257 4,568 4,152 384 4,536Communications 373 0 373 337 0 337 306 0 306Computer and Information Sciences 1,391 53 1,444 1,337 42 1,379 1,280 49 1,329Education 219 255 474 198 198 396 171 184 355Engineering 4,505 112 4,617 4,402 85 4,487 4,346 98 4,444Fine and Applied Arts 341
1 342 366 0 366 352 0 352Foreign Languages 0 0 0 0 0 0 0 0 0Health Professions 0 0 0 0 0 0 0 0 0Home Economics 234 20 254 204 12 216 185 23 208Letters 237 39 276 219 38 257 216 40 256Library 0 0 0 0 0 0 0 0 0Mathematics 212 30 242 195 24 219 169 21 190Physical Science 281 21 302 280 16 296 254 18 272Psychology 481 1 482 493 0 493 520 0 520Public Affairs 222 0 222 224 0 224 205 0 205Social Sciences 629 23 652 593 13 606 551 24 575Interdisciplinary Studies 749 0 749 779 0 779 736 0 736Total 17,764 1,060 18,824 17,164 975 18,139 16,539 1,043 17,582
Sacramento
Undeclared 2,263 78 2,341 1,997 86 2,083 1,936 79 2,015Agriculture 0 0 0 0 0 0 0 0 0Architecture 222 0 222 246 0 246 208 0 208Area Studies 0 0 0 0 0 0 0 0 0Biological Science 543 36 579 549 41 590 562 37 599Business and Management 4,864 512 5,376 4,589 506 5,095 4,324 483 4,807Communications 1,559 51 1,610 1,562 55 1,617 1,292 46 1,338Computer and Information Sciences 679 109 788 651 118 769 626 139 765Education 562 914 1,476 599 992 1,591 604 945 1,549Engineering 1,662 231 1,893 1,687 257 1,944 1,682 307 1,989Fine and Applied Arts 483 69 552 490 77 567 458 64 522Foreign Languages 152 37 189 140 54 194 138 45 183Health Professions 605 125 730 653 134 787 660 144 804Home Economics 185 0 185 187 0 187 160 0 160Letters 607 179 786 643 183 826 621 189 810Library 0 0 0 0 0 0 0 0 0Mathematics 194 30 224 188 28 216 173 30 203Physical Science 262 20 282 280 22 302 264 23 287Psychology 1,095 86 1,181 1,136 89 1,225 1,055 90 1,145Public Affairs 1,586 524 2,110 1,699 582 2,281 1,566 568 2,134Social Sciences 1,628 241 1,869 1,681 249 1,930 1,554 224 1,778Interdisciplinary Studies 1,695 43 1,738 1,653 38 1,691 1,524 31 1,555
Student Majors

138
Academic and Support Programs
Table 81 (continued)
Enrollment by Level and Discipline Division
Fall 1990 Fall 1991 Fall 1992Discipline Division Undergraduate Graduate Total Undergraduate Graduate Total Undergraduate Graduate Total
San Bernardino
Undeclared 1,063 5 1,068 798 2 800 784 29 813Agriculture 0 0 0 0 0 0 0 0 0Architecture 0 0 0 0 0 0 0 0 0Area Studies 3 0 3 4 0 4 6 0 6Biological Science 312 12 324 351 18 369 357 19 376Business and Management 2,303 177 2,480 2,446 186 2,632 2,388 273 2,661Communications 264 0 264 293 0 293 310 0 310Computer and Information Sciences 248 0 248 241 3 244 236 18 254Education 248 435 683 284 474 758 258 477 735Engineering 0 0 0 0 0 0 0 0 0Fine and Applied Arts 285 0 285 303 0 303 295 0 295Foreign Languages 83 0 83 74 0 74 85 0 85Health Professions 292 19 311 431 29 460 501 32 533Home Economics 43 0 43 42 0 42 48 0 48Letters 275 28 303 324 37 361 445 39 484Library 0 0 0 0 0 0 0 0 0Mathematics 125 7 132 138 10 148 128 14 142Physical Science 113 0 113 120 0 120 114 0 114Psychology 635 57 692 710 81 791 796 82 878Public Affairs 342 110 452 412 164 576 445 186 631Social Sciences 674 48 722 725 55 780 775 32 807Interdisciplinary Studies 1,443 12 1,455 1,469 13 1,482 1,345 19 1,364Total 8,751 910 9,661 9,165 1,072 10,237 9,316 1,220 10,536
San Diego
Undeclared 2,374 25 2,399 2,330 40 2,370 2,569 38 2,607Agriculture 0 0 0 0 0 0 0 0 0Architecture 207 45 252 182 51 233 144 40 184Area Studies 54 41 95 51 48 99 60 56 116Biological Science 924 123 1,047 953 133 1,086 980 139 1,119Business and Management 7,345 820 8,165 6,465 917 7,382 5,550 841 6,391Communications 970 59 1,029 859 56 915 711 68 779Computer and Information Sciences 630 191 821 547 214 761 497 212 709Education 1,071 808 1,879 1,052 759 1,811 942 768 1,710Engineering 2,214 251 2,465 1,985 249 2,234 1,822 224 2,046Fine and Applied Arts 1,233
104 1,337 1,183 109 1,292 1,102 120 1,222Foreign Languages 214 57 271 218 58 276 217 40 257Health Professions 808 518 1,326 900 560 1,460 944 604 1,548Home Economics 316 30 346 292 29 321 198 9 207Letters 1,465 287 1,752 1,428 305 1,733 1,388 274 1,662Library 0 0 0 0 0 0 0 0 0Mathematics 333 60 393 306 77 383 302 83 385Physical Science 353 118 471 344 120 464 308 126 434Psychology 1,987 132 2,119 1,890 139 2,029 1,898 145 2,043Public Affairs 1,526 427 1,953 1,413 433 1,846 1,508 440 1,948Social Sciences 2,296 238 2,534 2,233 284 2,517 2,331 278 2,609Interdisciplinary Studies 2,324 39 2,363 1,981 45 2,026 1,156 40 1,196Total 28,644 4,373 33,017 26,612 4,626 31,238 24,627 4,545 29,172
San Francisco
Undeclared 3,321 157 3,478 2,923 3 2,926 2,684 65 2,749Agriculture 0 0 0 0 0 0 0 0 0Architecture 0 0 0 0 0 0 0 0 0Area Studies 18 0 18 16 0 16 21 0 21Biological Science 780 103 883 734 118 852 785 120 905Business and Management 5,486 1,024 6,510 5,000 1,050 6,050 4,500 965 5,465Communications 1,135 62 1,197 1,097 67 1,164 1,081 69 1,150Computer and Information Sciences 943 74 1,017 814 77 891 740 69 809Education 666 821 1,487 606 804 1,410 694 773 1,467Engineering 776 7 783 681 19 700 625 45 670Fine and Applied Arts 1,940 278 2,218 1,824 287 2,111 1,724 262 1,986Foreign Languages 300 70 370 281 89 370 290 98 388Health Professions 934 374 1,308 869 465 1,334 662 390 1,052Home Economics 407 17 424 394 182 576 390 163 553Letters 1,232 839 2,071 1,342 876 2,218 1,284 857 2,141Library 0 0 0 0 0 0 0 0 0Mathematics 127 29 156 112 28 140 88 30 118Physical Science 213 73 286 195 71 266 162 81 243Psychology 1,182 150 1,332 1,093 159 1,252 1,067 155 1,222Public Affairs 245 303 548 274 343 617 303 340 643Social Sciences 1,749 368 2,117 1,754 362 2,116 1,727 387 2,114Interdisciplinary Studies 840 78 918 859 102 961 903 115 1,018
Student Majors

Statistical Abstract 139
Academic and Support ProgramsStudent Majors
Table 81 (continued)
Enrollment by Level and Discipline Division
Fall 1990 Fall 1991 Fall 1992Discipline Division Undergraduate Graduate Total Undergraduate Graduate Total Undergraduate Graduate Total
San Jose
Undeclared 1,449 70 1,519 1,246 0 1,246 1,114 0 1,114Agriculture 2 0 2 13 0 13 24 0 24Architecture 61 72 133 50 73 123 54 83 137Area Studies 0 0 0 0 0 0 0 0 0Biological Science 711 52 763 752 47 799 795 55 850Business and Management 5,349 376 5,725 5,018 438 5,456 4,724 377 5,101Communications 1,136 54 1,190 1,057 65 1,122 960 85 1,045Computer and Information Sciences 1,206 211 1,417 1,145 197 1,342 1,081 170 1,251Education 1,970 561 2,531 2,006 599 2,605 2,045 699 2,744Engineering 3,250 725 3,975 3,299 872 4,171 3,244 879 4,123Fine and Applied Arts 1,978 153 2,131 1,944 170 2,114 1,883 175 2,058Foreign Languages 124 23 147 101 19 120 118 20 138Health Professions 1,373 302 1,675 1,547 330 1,877 1,848 348 2,196Home Economics 136 68 204 127 62 189 127 60 187Letters 798 196 994 837 216 1,053 782 247 1,029Library 0 255 255 0 321 321 0 324 324Mathematical 202 35 237 193 46 239 154 61 215Physical Science 352 127 479 299 144 443 270 152 422Psychology 981 102 1,083 1,001 112 1,113 1,055 101 1,156Public Affairs 755 338 1,093 797 379 1,176 906 388 1,294Social Sciences 1,268 160 1,428 1,276 213 1,489 1,285 229 1,514Interdisciplinary Studies 900 91 991 934 106 1,040 988 154 1,142Total 24,001 3,971 27,972 23,642 4,409 28,051 23,457 4,607 28,064
San Luis Obispo
Undeclared 25 1 26 56 0 56 38 31 69Agriculture 3,003 62 3,065 2,870 68 2,938 2,706 76 2,782Architecture 1,176 33 1,209 1,172 58 1,230 1,111 75 1,186Area Studies 0 0 0 0 0 0 0 0 0Biological Science 920 15 935 949 21 970 875 24 899Business and Management 1,622 117 1,739 1,528 112 1,640 1,468 85 1,553Communications 265 0 265 251 0 251 203 0 203Computer and Information Sciences 475 70 545 424 79 503 421 75 496Education 1,004 273 1,277 1,006 263 1,269 897 257 1,154Engineering 4,260 79 4,339 4,281 80 4,361 4,155 107 4,262Fine and Applied Arts 206
0 206 237 0 237 230 0 230Foreign Languages 0 0 0 0 0 0 0 0 0Health Professions 0 0 0 0 0 0 0 0 0Home Economics 783 0 783 734 0 734 646 0 646Letters 463 51 514 445 60 505 372 72 444Library 0 0 0 0 0 0 0 0 0Mathematics 298 22 320 285 21 306 249 17 266Physical Science 237 4 241 200 4 204 165 1 166Psychology 396 44 440 508 63 571 437 27 464Public Affairs 194 0 194 218 0 218 171 0 171Social Sciences 956 0 956 908 0 908 800 0 800Interdisciplinary Studies 388 7 395 360 17 377 311 21 332Total 16,671 778 17,449 16,432 846 17,278 15,255 868 16,123
San Marcos
Undeclared 14 0 14 51 0 51 47 0 47Agriculture 0 0 0 0 0 0 0 0 0Architecture 0 0 0 0 0 0 0 0 0Area Studies 0 0 0 0 0 0 0 0 0Biological Science 11 0 11 16 0 16 25 0 25Business and Management 120 0 120 280 0 280 509 0 509Communications 0 0 0 0 0 0 0 0 0Computer and Information Sciences 0 0 0 0 0 0 11 0 11Education 0 0 0 0 0 0 0 0 0Engineering 0 0 0 0 0 0 0 0 0Fine and Applied Arts 0 0 0 0 0 0 0 0 0Foreign Languages 0 0 0 0 0 0 0 0 0Health Professions 0 0 0 0 0 0 0 0 0Home Economics 0 0 0 0 0 0 0 0 0Letters 25 0 25 57 0 57 104 0 104Library 0 0 0 0 0 0 0 0 0Mathematics 8 0 8 30 0 30 39 0 39Physical Science 0 0 0 0 0 0 0 0 0Psychology 57 0 57 123 0 123 226 0 226Public Affairs 0 0 0 0 0 0 0 0 0Social Sciences 55 0 55 134 0 134 266 0 266Interdisciplinary Studies 110 0 110 293 0 293 477 0 477

140
Academic and Support Programs
Table 81 (continued)
Enrollment by Level and Discipline Division
Fall 1990 Fall 1991 Fall 1992Discipline Division Undergraduate Graduate Total Undergraduate Graduate Total Undergraduate Graduate Total
Sonoma
Undeclared 726 33 759 733 17 750 879 2 881Agriculture 0 0 0 0 0 0 0 0 0Architecture 0 0 0 0 0 0 0 0 0Area Studies 0 0 0 0 0 0 0 0 0Biological Science 292 23 315 336 27 363 365 27 392Business and Management 1,164 69 1,233 1,141 59 1,200 836 54 890Communications 213 0 213 224 0 224 253 0 253Computer and Information Sciences 165 0 165 163 0 163 170 0 170Education 174 147 321 189 165 354 218 221 439Engineering 0 0 0 0 0 0 0 0 0Fine and Applied Arts 395 0 395 401 0 401 399 0 399Foreign Languages 85 0 85 85 0 85 82 0 82Health Professions 120 47 167 111 70 181 105 88 193Home Economics 0 0 0 0 0 0 0 0 0Letters 363 86 449 417 71 488 378 60 438Library 0 0 0 0 0 0 0 0 0Mathematics 85 0 85 91 0 91 90 0 90Physical Science 193 0 193 189 0 189 189 0 189Psychology 620 71 691 598 87 685 600 46 646Public Affairs 166 55 221 148 42 190 116 40 156Social Sciences 601 53 654 655 49 704 793 45 838Interdisciplinary Studies 805 3 808 786 11 797 767 15 782Total 6,167 587 6,754 6,267 598 6,865 6,240 598 6,838
Stanislaus
Undeclared 436 1 437 457 0 457 393 0 393Agriculture 1 0 1 0 0 0 0 0 0Architecture 0 0 0 0 0 0 0 0 0Area Studies 0 0 0 0 0 0 0 0 0Biological Science 197 0 197 203 0 203 221 0 221Business and Management 928 136 1,064 939 121 1,060 951 140 1,091Communications 95 0 95 111 0 111 117 0 117Computer and Information Sciences 170 0 170 159 0 159 163 0 163Education 220 171 391 225 153 378 212 154 366Engineering 0 0 0 0 0 0 0 0 0Fine and Applied Arts 163
0 163 151 0 151 165 0 165Foreign Languages 23 0 23 21 0 21 26 0 26Health Professions 152 0 152 121 0 121 122 0 122Home Economics 0 0 0 0 0 0 0 0 0Letters 169 36 205 173 46 219 169 40 209Library 0 0 0 0 0 0 0 0 0Mathematics 73 0 73 67 0 67 74 0 74Physical Science 83 0 83 62 0 62 83 0 83Psychology 249 69 318 250 58 308 288 69 357Public Affairs 109 75 184 135 79 214 179 78 257Social Sciences 410 31 441 433 21 454 468 23 491Interdisciplinary Studies 872 64 936 838 57 895 856 62 918Total 4,350 583 4,933 4,345 535 4,880 4,487 566 5,053
Systemwide
Undeclared 27,188 848 28,036 24,507 377 24,884 23,714 354 24,068Agriculture 5,543 259 5,802 5,423 275 5,698 5,364 266 5,630Architecture 3,185 312 3,497 3,175 297 3,472 2,937 339 3,276Area Studies 274 85 359 288 95 383 295 122 417Biological Science 10,605 803 11,408 11,056 798 11,854 11,437 855 12,292Business and Management 68,769 6,684 75,453 65,214 6,748 71,962 59,815 6,481 66,296Communications 12,981 428 13,409 12,634 472 13,106 11,690 468 12,158Computer and Information Sciences 10,761 1,153 11,914 10,067 1,453 11,520 9,653 1,447 11,100Education 14,242 9,320 23,562 14,101 9,562 23,663 13,428 9,644 23,072Engineering 25,879 3,105 28,984 25,491 3,282 28,773 24,392 3,314 27,706Fine and Applied Arts 14,552 1,411 15,963 14,021 1,510 15,531 13,525 1,437 14,962Foreign Languages 2,057 308 2,365 2,007 356 2,363 2,070 348 2,418Health Professions 11,099 2,637 13,736 11,958 2,908 14,866 12,457 2,853 15,310Home Economics 3,855 341 4,196 3,556 683 4,239 3,180 676 3,856Letters 11,807 2,815 14,622 12,121 3,217 15,338 11,806 3,227 15,033Library 0 255 255 0 321 321 0 324 324Mathematics 3,234 497 3,731 3,049 504 3,553 2,820 527 3,347Physical Science 3,917 672 4,589 3,725 702 4,427 3,543 686 4,229Psychology 15,530 1,501 17,031 15,827 1,592 17,419 15,924 1,532 17,456Public Affairs 10,686 3,524 14,210 11,208 3,675 14,883 11,639 3,705 15,344Social Sciences 20,782 2,222 23,004 20,889 2,414 23,303 21,133 2,466 23,599Interdisciplinary Studies 21,422 552 21,974 21,470 667 22,137 20,181 732 20,913
Student Majors

Statistical Abstract 141
Academic and Support Programs
Table 82
Systemwide Enrollment in Undergraduate* and Graduate Degree Programsby Discipline Division, Fall 1980 to Fall 1992
Discipline Division 1980 1981 1982 1983 1984 1985 1986 1987 1988 1989
Baccalaureate Programs
Agriculture and Natural Resources 7,874 7,633 7,170 6,879 6,539 6,025 5,501 5,324 5,295 5,423Architecture and Environmental Design 2,418 2,310 2,055 2,281 2,330 2,331 2,481 2,756 2,945 3,166Area Studies 278 278 259 246 251 262 226 219 248 253Biological Sciences 10,386 10,093 9,864 10,048 10,124 10,197 9,937 9,800 10,081 10,158Business and Management 58,686 59,457 57,203 54,899 56,059 61,382 65,547 67,656 69,533 69,454Communications 9,588 9,511 9,912 11,196 11,197 11,494 11,829 12,220 12,743 12,887Computer and Information Sciences 6,388 9,125 11,417 13,875 14,485 14,216 13,558 12,777 11,495 10,863Education 12,757 11,958 11,919 12,125 11,838 12,185 12,281 13,329 13,539 13,874Engineering 21,977 23,414 24,584 24,602 25,118 24,766 25,367 24,803 25,454 25,666Fine and Applied Arts 14,136 14,088 13,651 12,861 12,182 12,613 12,858 13,344 14,107 14,137Foreign Languages 1,916 1,789 1,747 1,732 1,730 1,761 1,813 1,847 1,980 1,929Health Professions 11,583 11,447 11,348 11,612 10,955 11,041 10,796 10,454 10,185 10,224Home Economics 4,285 4,035 3,860 3,883 4,289 4,307 4,231 4,132 4,057 3,903Letters 6,760 7,434 7,431 6,875 7,414 8,232 9,023 9,951 10,767 11,352Library Science — — — — — — — — — —Mathematics 2,277 2,534 3,276 4,133 4,607 4,553 4,247 3,939 3,664 3,401Physical Sciences 4,832 5,174 5,297 5,355 5,132 4,912 4,656 4,349 4,130 4,018Psychology 9,714 9,900 9,956 10,056 10,002 10,678 11,183 12,080 13,545 14,513Public Affairs and Services 10,094 9,237 8,448 8,227 8,354 8,749 8,724 9,363 9,937 10,099Social Sciences 15,071 15,012 14,652 14,760 14,781 14,788 15,483 16,526 18,344 19,509Interdisciplinary Studies 10,549 10,637 10,603 10,670 11,232 12,515 14,612 17,110 19,256 20,505Undeclared 30,049 31,284 31,923 32,980 33,096 30,366 27,476 26,908 28,372 28,191Total, All Programs 251,618 256,350 256,575 259,295 261,715 267,373 271,829 278,887 289,677 293,525
Master’s Programs
Agriculture and Natural Resources 338 380 317 294 247 227 210 205 222 247Architecture and Environmental Design 226 240 199 176 182 230 293 292 327 301Area Studies 73 67 60 57 79 61 63 73 90 92Biological Sciences 1,027 942 905 793 741 720 694 706 702 756Business and Management 5,805 6,361 6,313 5,602 5,179 5,475 5,620 5,942 5,974 6,268Communications 343 325 324 342 308 343 344 408 409 383Computer and Information Sciences 747 959 1,035 1,181 1,212 1,205 1,264 1,282 1,603 1,182Education 9,298 9,679 8,852 7,953 7,225 7,213 7,899 8,659 8,951 9,517Engineering 1,620 1,864 2,058 2,154 2,138 2,257 2,430 2,498 2,722 3,078Fine and Applied Arts 1,621 1,568 1,438 1,219 1,168 1,244 1,256 1,301 1,327 1,446Foreign Languages 307 277 241 219 217 240 258 252 258 303Health Professions 2,338 2,400 2,297 2,218 1,949 2,015 2,095 2,173 2,325 2,534Home Economics 465 506 462 477 371 363 349 337 336 308Letters 1,616 1,755 1,736 1,649 1,646 1,731 1,795 1,981 2,160 2,573Library Science 151 158 105 90 108 151 178 201 236 253Mathematics 270 258 263 266 283 358 434 479 467 493Physical Sciences 686 641 672 681 646 689 698 732 783 806Psychology 1,668 1,623 1,744 1,566 1,486 1,364 1,249 1,266 1,400 1,512Public Affairs and Services 2,551 2,643 2,493 2,416 2,303 2,528 2,671 3,035 3,138 3,266Social Sciences 1,755 1,597 1,544 1,405 1,356 1,305 1,383 1,549 1,714 2,017Interdisciplinary Studies 358 402 358 356 321 343 376 391 452 493Undeclared 742 671 615 606 722 555 858 778 882 751Total, All Programs 34,005 35,316 34,031 31,690 29,887 30,617 32,417 34,540 36,078 38,579
Joint Doctoral Programs
Biological Sciences 7 5 5 1 4 9 12 16 23 25Education 40 36 56 31 73 74 60 62 59 80Engineering — — — — — — — — — —Health Professions — — — — — — — — — —Physical Sciences 9 10 9 2 12 9 11 14 14 14Psychology — — — — — — — — 28 38Total, All Programs 56 53 76 35 94 100 96 112 124 158
*Includes postbaccalaureate students enrolled in and pursuing a second bachelor's degree.
Student Majors

142
Academic and Support Programs
Table 82 (continued)
Systemwide Enrollment in Undergraduate* and Graduate Degree Programsby Discipline Division, Fall 1980 to Fall 1992
Discipline Division 1990 1991 1992
Baccalaureate Programs
Agriculture and Natural Resources 5,543 5,423 5,364Architecture and Environmental Design 3,185 3,175 2,937Area Studies 274 288 295Biological Sciences 10,605 11,056 11,437Business and Management 68,769 65,214 59,815Communications 12,981 12,634 11,690Computer and Information Sciences 10,761 10,067 9,653Education 14,242 14,101 13,428Engineering 25,879 25,491 24,392Fine and Applied Arts 14,552 14,021 13,525Foreign Languages 2,057 2,007 2,070Health Professions 11,099 11,958 12,457Home Economics 3,855 3,556 3,180Letters 11,807 12,121 11,806Library Science — — —Mathematics 3,234 3,049 2,820Physical Sciences 3,917 3,725 3,543Psychology 15,530 15,827 15,924Public Affairs and Services 10,686 11,208 11,639Social Sciences 20,782 20,889 21,133Interdisciplinary Studies 21,422 21,470 20,181Undeclared 27,188 24,507 23,714Total, All Programs 298,368 291,787 281,003
Master’s Programs
Agriculture and Natural Resources 259 275 266Architecture and Environmental Design 312 297 339Area Studies 85 95 122Biological Sciences 776 798 820Business and Management 6,684 6,748 6,481Communications 428 472 468Computer and Information Sciences 1,153 1,453 1,447Education 9,253 9,562 9,571Engineering 3,104 3,282 3,314Fine and Applied Arts 1,411 1,510 1,437Foreign Languages 308 356 348Health Professions 2,634 2,908 2,847Home Economics 341 683 676Letters 2,815 3,217 3,227Library Science 255 321 324Mathematics 497 504 527Physical Sciences 659 702 675Psychology 1,452 1,592 1,474Public Affairs and Services 3,524 3,675 3,705Social Sciences 2,222 2,414 2,459Interdisciplinary Studies 552 667 732Undeclared 848 377 344Total, All Programs 39,572 41,908 41,603
Joint Doctoral Programs
Biological Sciences 27 34 34Education 67 72 66Engineering 1 3 8Health Professions 3 6 8Physical Sciences 13 11 10Psychology 49 48 58Social Sciences — 4 7Total, All Programs 160 178 191
*Includes postbaccalaureate students enrolled in and pursuing a second bachelor's degree.Enrollment does not include the CSU Statewide Nursing Program.
Student Majors

Statistical Abstract 143
Academic and Support ProgramsStudent Majors
Table 83
CSU Fall 1990 Systemwide Enrollment in Undergraduate Programs by Discipline Division, by Ethnicity
White Non- TotalAfrican American Asian Mexican Other Pacific Non- Total resident All
Discipline Division American Indian American Filipino American Latino Islander Hispanic Identified Unknown Alien Groups
Number by Discipline
Undeclared 1,986 262 3,326 1,039 3,308 1,023 119 13,242 24,305 2,406 475 27,186Agriculture and Natural Resources 58 86 136 28 279 103 14 4,350 5,054 376 113 5,543Architecture and Environmental Design 95 25 491 131 333 164 17 1,678 2,934 192 59 3,185Area Studies 5 1 23 2 21 19 1 169 241 28 5 274Biological Science 486 106 1,523 529 824 332 44 5,578 9,422 864 319 10,605Business and Management 3,702 497 12,181 2,766 5,608 1,959 304 34,499 61,516 4,151 3,102 68,769Communications 976 125 597 353 952 365 41 8,448 11,857 893 231 12,981Computer and Information Sciences 641 66 2,873 575 578 284 44 4,036 9,097 728 936 10,761Education 735 148 1,286 353 1,501 456 65 8,567 13,111 932 200 14,243Engineering 929 158 6,660 1,462 2,210 798 97 10,473 22,787 1,718 1,374 25,879Fine and Applied Arts 506 130 1,364 389 950 374 51 9,053 12,817 1,414 321 14,552Foreign Languages 61 15 116 24 464 197 4 906 1,787 198 72 2,057Health Professions 747 118 1,198 1,108 879 338 44 5,746 10,178 765 156 11,099Home Economics 135 30 377 108 223 93 14 2,565 3,545 244 66 3,855Letters 470 116 386 142 742 254 44 8,417 10,571 1,106 130 11,807Library Science 0 0 0 0 0 0 0 0 0 0 0 0Mathematics 124 30 443 71 301 95 7 1,806 2,877 246 111 3,234Physical Science 139 40 439 80 214 89 14 2,372 3,387 366 164 3,917Psychology 1,140 177 738 355 1,575 634 40 9,571 14,230 1,149 153 15,532Public Affairs and Services 1,436 140 542 196 1,428 346 81 5,834 10,003 602 80 10,685Social Sciences 1,492 248 1,001 367 1,918 624 86 12,797 18,533 1,847 402 20,782Interdisciplinary Studies 959 228 814 253 2,500 603 53 14,469 19,879 1,436 107 21,422Total 16,822 2,746 36,514 10,331 26,808 9,150 1,184 164,576 268,131 21,661 8,576 298,368
Percent by Ethnic Group
Undeclared 8.2 1.1 13.7 4.3 13.6 4.2 0.5 54.5 (89.4) ( 8.9) ( 1.7) 100.0Agriculture and Natural Resources 1.1 1.7 2.7 0.6 5.5 2.0 0.3 86.1 (91.2) ( 6.8) ( 2.0) 100.0Architecture and Environmental Design 3.2 0.9 16.7 4.5 11.3 5.6 0.6 57.2 (92.1) ( 6.0) ( 1.9) 100.0Area Studies 2.1 0.4 9.5 0.8 8.7 7.9 0.4 70.1 (88.0) (10.2) ( 1.8) 100.0Biological Science 5.2 1.1 16.2 5.6 8.7 3.5 0.5 59.2 (88.8) ( 8.1) ( 3.0) 100.0Business and Management 6.0 0.8 19.8 4.5 9.1 3.2 0.5 56.1 (89.5) ( 6.0) ( 4.5) 100.0Communications 8.2 1.1 5.0 3.0 8.0 3.1 0.3 71.2 (91.3) ( 6.9) ( 1.8) 100.0Computer and Information Sciences 7.0 0.7 31.6 6.3 6.4 3.1 0.5 44.4 (84.5) ( 6.8) ( 8.7) 100.0Education 5.6 1.1 9.8 2.7 11.4 3.5 0.5 65.3 (92.1) ( 6.5) ( 1.4) 100.0Engineering 4.1 0.7 29.2 6.4 9.7 3.5 0.4 46.0 (88.1) ( 6.6) ( 5.3) 100.0Fine and Applied Arts 3.9 1.0 10.6 3.0 7.4 2.9 0.4 70.6 (88.1) ( 9.7) ( 2.2) 100.0Foreign Languages 3.4 0.8 6.5 1.3 26.0 11.0 0.2 50.7 (86.9) ( 9.6) ( 3.5) 100.0Health Professions 7.3 1.2 11.8 10.9 8.6 3.3 0.4 56.5 (91.7) ( 6.9) ( 1.4) 100.0Home Economics 3.8 0.8 10.6 3.0 6.3 2.6 0.4 72.4 (92.0) ( 6.3) ( 1.7) 100.0Letters 4.4 1.1 3.7 1.3 7.0 2.4 0.4 79.6 (89.5) ( 9.4) ( 1.1) 100.0Library Science 0.0 0.0 0.0 0.0 0.0 0.0 0.0 0.0 ( 0.0) ( 0.0) ( 0.0) 100.0Mathematics 4.3 1.0 15.4 2.5 10.5 3.3 0.2 62.8 (89.0) ( 7.6) ( 3.4) 100.0Physical Science 4.1 1.2 13.0 2.4 6.3 2.6 0.4 70.0 (86.5) ( 9.3) ( 4.2) 100.0Psychology 8.0 1.2 5.2 2.5 11.1 4.5 0.3 67.3 (91.6) ( 7.4) ( 1.0) 100.0Public Affairs and Services 14.4 1.4 5.4 2.0 14.3 3.5 0.8 58.3 (93.6) ( 5.6) ( 0.7) 100.0Social Sciences 8.1 1.3 5.4 2.0 10.3 3.4 0.5 69.0 (89.2) ( 8.9) ( 1.9) 100.0Interdisciplinary Studies 4.8 1.1 4.1 1.3 12.6 3.0 0.3 72.8 (92.8) ( 6.7) ( 0.5) 100.0Total 6.3 1.0 13.6 3.9 10.0 3.4 0.4 61.4 (89.9) ( 7.3) ( 2.9) 100.0
*Includes postbaccalaureate students enrolled in and pursuing a second bachelor's degree.

144
Academic and Support ProgramsStudent Majors
Table 83 (continued)
CSU Fall 1990 Systemwide Enrollment in Undergraduate Programs by Discipline Division, by Ethnicity
White Non- TotalAfrican American Asian Mexican Other Pacific Non- Total resident All
Discipline Division American Indian American Filipino American Latino Islander Hispanic Identified Unknown Alien Groups
Percent by Discipline Division
Undeclared 11.8 9.5 9.1 10.1 12.3 11.2 10.1 8.0 9.1 11.1 5.5 9.1Agriculture and Natural Resources 0.3 3.1 0.4 0.3 1.0 1.1 1.2 2.6 1.9 1.7 1.3 1.9Architecture and Environmental Design 0.6 0.9 1.3 1.3 1.2 1.8 1.4 1.0 1.1 0.9 0.7 1.1Area Studies 0.0 0.0 0.1 0.0 0.1 0.2 0.1 0.1 0.1 0.1 0.1 0.1Biological Science 2.9 3.9 4.2 5.1 3.1 3.6 3.7 3.4 3.5 4.0 3.7 3.6Business and Management 22.0 18.1 33.4 26.8 20.9 21.4 25.7 21.0 22.9 19.2 36.2 23.0Communications 5.8 4.6 1.6 3.4 3.6 4.0 3.5 5.1 4.4 4.1 2.7 4.4Computer and Information Sciences 3.8 2.4 7.9 5.6 2.2 3.1 3.7 2.5 3.4 3.4 10.9 3.6Education 4.4 5.4 3.5 3.4 5.6 5.0 5.5 5.2 4.9 4.3 2.3 4.8Engineering 5.5 5.8 18.2 14.2 8.2 8.7 8.2 6.4 8.5 7.9 16.0 8.7Fine and Applied Arts 3.0 4.7 3.7 3.8 3.5 4.1 4.3 5.5 4.8 6.5 3.7 4.9Foreign Languages 0.4 0.5 0.3 0.2 1.7 2.2 0.3 0.6 0.7 0.9 0.8 0.7Health Professions 4.4 4.3 3.3 10.7 3.3 3.7 3.7 3.5 3.8 3.5 1.8 3.7Home Economics 0.8 1.1 1.0 1.0 0.8 1.0 1.2 1.6 1.3 1.1 0.8 1.3Letters 2.8 4.2 1.1 1.4 2.8 2.8 3.7 5.1 3.9 5.1 1.5 4.0Library Science 0.0 0.0 0.0 0.0 0.0 0.0 0.0 0.0 0.0 0.0 0.0 0.0Mathematics 0.7 1.1 1.2 0.7 1.1 1.0 0.6 1.1 1.1 1.1 1.3 1.1Physical Science 0.8 1.5 1.2 0.8 0.8 1.0 1.2 1.4 1.3 1.7 1.9 1.3Psychology 6.8 6.4 2.0 3.4 5.9 6.9 3.4 5.8 5.3 5.3 1.8 5.2Public Affairs and Services 8.5 5.1 1.5 1.9 5.3 3.8 6.8 3.5 3.7 2.8 0.9 3.6Social Sciences 8.9 9.0 2.7 3.6 7.2 6.8 7.3 7.8 6.9 8.5 4.7 7.0Interdisciplinary Studies 5.7 8.3 2.2 2.4 9.3 6.6 4.5 8.8 7.4 6.6 1.2 7.2Total 100.0 100.0 100.0 100.0 100.0 100.0 100.0 100.0 100.0 100.0 100.0 100.0
Percent Female
Undeclared 60.0 58.9 52.6 55.8 59.3 56.6 52.4 55.9 56.3 53.9 45.1 55.8Agriculture and Natural Resources 48.3 52.3 41.2 46.4 38.0 45.6 57.1 44.3 44.1 42.0 25.7 43.6Architecture and Environmental Design 34.7 52.0 42.0 38.2 34.8 36.0 29.4 50.7 45.4 44.3 47.5 45.4Area Studies 40.0 0.0 56.5 50.0 81.3 60.0 0.0 60.8 61.2 44.4 80.0 59.8Biological Science 68.2 57.6 53.5 56.7 53.3 53.5 35.9 53.6 54.4 51.2 54.5 54.1Business and Management 57.8 47.4 57.8 56.7 52.0 52.0 50.0 46.1 50.1 46.8 48.2 49.8Communications 62.1 56.0 61.1 56.5 61.9 60.3 47.5 57.5 58.4 52.5 60.3 58.0Computer and Information Sciences 42.9 27.9 38.0 37.3 37.6 27.7 22.7 25.1 31.8 25.3 35.4 31.7Education 38.1 42.1 30.7 38.4 45.1 41.3 28.6 49.5 46.1 42.9 35.7 45.8Engineering 25.1 17.0 13.2 16.5 15.8 14.7 10.5 12.6 13.9 12.2 11.8 13.7Fine and Applied Arts 59.2 52.0 61.1 42.8 46.7 57.1 44.0 57.0 56.3 54.0 61.6 56.2Foreign Languages 55.8 86.7 65.1 70.8 66.7 71.2 75.0 71.1 69.4 65.4 69.8 69.0Health Professions 84.6 82.7 83.5 85.5 81.0 77.8 82.9 84.9 84.3 81.4 80.3 84.0Home Economics 93.4 86.2 90.8 84.8 87.4 89.7 78.6 95.0 93.5 88.7 83.1 93.0Letters 65.9 68.8 61.5 59.4 62.1 63.8 46.3 64.0 63.8 56.5 74.4 63.3Library Science 0.0 0.0 0.0 0.0 0.0 0.0 0.0 0.0 0.0 0.0 0.0 0.0Mathematics 44.5 38.5 46.3 43.3 41.9 38.6 57.1 44.3 44.1 35.3 43.1 43.5Physical Science 34.7 31.6 39.7 44.6 30.5 21.6 50.0 27.4 29.8 28.3 39.0 30.1Psychology 77.8 74.1 70.5 72.5 74.8 77.8 58.3 76.5 76.0 69.6 71.6 75.5Public Affairs and Services 62.1 51.5 47.7 47.2 54.4 52.3 39.7 53.2 54.0 49.9 68.7 53.9Social Sciences 52.3 49.8 48.0 50.6 45.8 42.1 35.4 45.6 46.3 43.8 44.3 46.0Interdisciplinary Studies 81.2 80.6 80.3 78.9 80.2 80.9 78.8 83.1 82.4 75.0 78.0 81.8Total 59.5 54.9 47.7 52.2 55.0 53.5 45.4 54.0 53.5 49.9 43.4 52.9
*Includes postbaccalaureate students enrolled in and pursuing a second bachelor's degree.

Statistical Abstract 145
Academic and Support Programs
Table 83 (continued)
CSU Fall 1991 Systemwide Enrollment in Undergraduate Programs by Discipline Division, by Ethnicity
White Non- TotalAfrican American Asian Mexican Other Pacific Non- Total resident All
Discipline Division American Indian American Filipino American Latino Islander Hispanic Identified Unknown Alien Groups
Number
Undeclared 3,259 1,831 226 966 3,457 1,142 112 10,732 21,725 2,341 441 24,507Agriculture And Natural Resources 141 54 90 23 317 111 11 4,160 4,907 396 120 5,423Architecture And Environmental Design 534 91 26 140 336 167 22 1,585 2,901 202 72 3,175Area Studies 24 4 1 3 32 17 2 172 255 26 7 288Biological Science 1,733 473 99 555 942 392 43 5,565 9,802 970 284 11,056Business And Management 12,426 3,533 492 2,683 5,765 2,001 283 30,826 58,009 4,158 3,047 65,214Communications 596 962 133 363 1,032 383 45 7,921 11,435 947 252 12,634Computer And Information Sciences 2,738 578 58 534 586 255 46 3,673 8,468 691 908 10,067Education 1,237 683 154 353 1,680 518 61 8,291 12,977 947 177 14,101Engineering 6,380 985 149 1,518 2,434 842 93 9,960 22,361 1,849 1,281 25,491Fine And Applied Arts 1,443 506 131 408 957 391 43 8,336 12,215 1,459 347 14,021Foreign Languages 114 51 12 24 464 217 6 850 1,738 195 74 2,007Health Professions 1,410 824 108 1,257 974 367 43 5,958 10,941 842 175 11,958Home Economics 376 126 26 102 215 92 11 2,297 3,245 247 64 3,556Letters 436 559 125 171 808 303 32 8,279 10,713 1,247 161 12,121Library Science 0 0 0 0 0 0 0 0 0 0 0 0Mathematics 401 112 35 72 302 110 12 1,630 2,674 263 112 3,049Physical Science 418 132 29 85 218 97 12 2,243 3,234 349 142 3,725Psychology 791 1,212 190 389 1,718 656 49 9,393 14,398 1,269 160 15,827Public Affairs And Services 633 1,483 150 184 1,587 374 88 5,958 10,457 643 108 11,208Social Sciences 1,052 1,556 236 430 2,080 706 88 12,326 18,474 2,005 410 20,889Interdisciplinary Studies 866 1,047 238 293 2,671 648 59 13,934 19,756 1,593 121 21,470Totals 37,008 16,802 2,708 10,553 28,575 9,789 1,161 154,089 260,685 22,639 8,463 291,787
Percent By Ethnic Group
Undeclared 8.4 1.0 15.0 4.4 15.9 5.3 0.5 49.4 88.6 9.6 1.8 100.0Agriculture And Natural Resources 1.1 1.8 2.9 0.5 6.5 2.3 0.2 84.8 90.5 7.3 2.2 100.0Architecture And Environmental Design 3.1 0.9 18.4 4.8 11.6 5.8 0.8 54.6 91.4 6.4 2.3 100.0Area Studies 1.6 0.4 9.4 1.2 12.5 6.7 0.8 67.5 88.5 9.0 2.4 100.0Biological Science 4.8 1.0 17.7 5.7 9.6 4.0 0.4 56.8 88.7 8.8 2.6 100.0Business And Management 6.1 0.8 21.4 4.6 9.9 3.4 0.5 53.1 89.0 6.4 4.7 100.0Communications 8.4 1.2 5.2 3.2 9.0 3.3 0.4 69.3 90.5 7.5 2.0 100.0Computer And Information Sciences 6.8 0.7 32.3 6.3 6.9 3.0 0.5 43.4 84.1 6.9 9.0 100.0Education 5.3 1.2 9.5 2.7 12.9 4.0 0.5 63.9 92.0 6.7 1.3 100.0Engineering 4.4 0.7 28.5 6.8 10.9 3.8 0.4 44.5 87.7 7.3 5.0 100.0Fine And Applied Arts 4.1 1.1 11.8 3.3 7.8 3.2 0.4 68.2 87.1 10.4 2.5 100.0Foreign Languages 2.9 0.7 6.6 1.4 26.7 12.5 0.3 48.9 86.6 9.7 3.7 100.0Health Professions 7.5 1.0 12.9 11.5 8.9 3.4 0.4 54.5 91.5 7.0 1.5 100.0Home Economics 3.9 0.8 11.6 3.1 6.6 2.8 0.3 70.8 91.3 6.9 1.8 100.0Letters 5.2 1.2 4.1 1.6 7.5 2.8 0.3 77.3 88.4 10.3 1.3 100.0Library Science 0.0 0.0 0.0 0.0 0.0 0.0 0.0 0.0 0.0 0.0 0.0 100.0Mathematics 4.2 1.3 15.0 2.7 11.3 4.1 0.4 61.0 87.7 8.6 3.7 100.0Physical Science 4.1 0.9 12.9 2.6 6.7 3.0 0.4 69.4 86.8 9.4 3.8 100.0Psychology 8.4 1.3 5.5 2.7 11.9 4.6 0.3 65.2 91.0 8.0 1.0 100.0Public Affairs And Services 14.2 1.4 6.1 1.8 15.2 3.6 0.8 57.0 93.3 5.7 1.0 100.0Social Sciences 8.4 1.3 5.7 2.3 11.3 3.8 0.5 66.7 88.4 9.6 2.0 100.0InterdisciplinaryStudies 5.3 1.2 4.4 1.5 13.5 3.3 0.3 70.5 92.0 7.4 0.6 100.0Totals 6.4 1.0 14.2 4.0 11.0 3.8 0.4 59.1 89.3 7.8 2.9 100.0
Student Majors

146
Academic and Support Programs
Table 83 (continued)
CSU Fall 1991 Systemwide Enrollment in Undergraduate Programs by Discipline Division, by Ethnicity
White Non- TotalAfrican American Asian Mexican Other Pacific Non- Total resident All
Discipline Division American Indian American Filipino American Latino Islander Hispanic Identified Unknown Alien Groups
Percent By Discipline Division
Undeclared 10.9 8.3 8.8 9.2 12.1 11.7 9.6 7.0 8.3 10.3 5.2 8.4Agriculture And Natural Resources 0.3 3.3 0.4 0.2 1.1 1.1 0.9 2.7 1.9 1.7 1.4 1.9Architecture And Environmental Design 0.5 1.0 1.4 1.3 1.2 1.7 1.9 1.0 1.1 0.9 0.9 1.1Area Studies 0.0 0.0 0.1 0.0 0.1 0.2 0.2 0.1 0.1 0.1 0.1 0.1Biological Science 2.8 3.7 4.7 5.3 3.3 4.0 3.7 3.6 3.8 4.3 3.4 3.8Business And Management 21.0 18.2 33.6 25.4 20.2 20.4 24.4 20.0 22.3 18.4 36.0 22.3Communications 5.7 4.9 1.6 3.4 3.6 3.9 3.9 5.1 4.4 4.2 3.0 4.3Computer And Information Sciences 3.4 2.1 7.4 5.1 2.1 2.6 4.0 2.4 3.2 3.1 10.7 3.5Education 4.1 5.7 3.3 3.3 5.9 5.3 5.3 5.4 5.0 4.2 2.1 4.8Engineering 5.9 5.5 17.2 14.4 8.5 8.6 8.0 6.5 8.6 8.2 15.1 8.7Fine And Applied Arts 3.0 4.8 3.9 3.9 3.3 4.0 3.7 5.4 4.7 6.4 4.1 4.8Foreign Languages 0.3 0.4 0.3 0.2 1.6 2.2 0.5 0.6 0.7 0.9 0.9 0.7Health Professions 4.9 4.0 3.8 11.9 3.4 3.7 3.7 3.9 4.2 3.7 2.1 4.1Home Economics 0.7 1.0 1.0 1.0 0.8 0.9 0.9 1.5 1.2 1.1 0.8 1.2Letters 3.3 4.6 1.2 1.6 2.8 3.1 2.8 5.4 4.1 5.5 1.9 4.2Library Science 0.0 0.0 0.0 0.0 0.0 0.0 0.0 0.0 0.0 0.0 0.0 0.0Mathematics 0.7 1.3 1.1 0.7 1.1 1.1 1.0 1.1 1.0 1.2 1.3 1.0Physical Science 0.8 1.1 1.1 0.8 0.8 1.0 1.0 1.5 1.2 1.5 1.7 1.3Psychology 7.2 7.0 2.1 3.7 6.0 6.7 4.2 6.1 5.5 5.6 1.9 5.4Public Affairs And Services 8.8 5.5 1.7 1.7 5.6 3.8 7.6 3.9 4.0 2.8 1.3 3.8Social Sciences 9.3 8.7 2.8 4.1 7.3 7.2 7.6 8.0 7.1 8.9 4.8 7.2Interdisciplinary Studies 6.2 8.8 2.3 2.8 9.3 6.6 5.1 9.0 7.6 7.0 1.4 7.4Totals 100.0 100.0 100.0 100.0 100.0 100.0 100.0 100.0 100.0 100.0 100.0 100.0
Percent Female
Undeclared 56.9 56.2 50.4 55.9 57.6 55.0 50.0 55.7 55.2 53.4 47.6 54.9Agriculture And Natural Resources 35.2 55.6 36.9 39.1 34.4 51.4 54.5 44.3 43.7 41.2 25.0 43.1Architecture And Environmental Design 42.9 57.7 41.6 40.0 38.4 35.3 31.8 48.9 44.9 40.6 50.0 44.7Area Studies 50.0 0.0 50.0 33.3 68.8 47.1 0.0 57.6 57.3 53.8 71.4 57.3Biological Science 68.1 54.5 52.2 55.3 52.4 52.3 55.8 53.3 53.8 49.5 54.2 53.5Business And Management 56.9 45.7 57.8 57.0 52.6 52.8 48.1 46.2 50.7 46.5 48.8 50.3Communications 63.0 57.1 59.2 57.3 59.0 58.7 53.3 56.2 57.3 51.7 61.9 57.0Computer And Information Sciences 42.9 25.9 37.4 38.2 39.6 31.8 32.6 23.6 31.7 24.7 34.6 31.5Education 48.6 46.1 43.1 41.1 58.4 52.5 34.4 52.5 51.7 48.6 45.8 51.4Engineering 24.9 16.8 12.6 17.7 17.9 13.5 16.1 13.2 14.4 12.1 11.1 14.1Fine And Applied Arts 54.2 58.0 59.1 43.1 47.6 54.7 39.5 56.7 55.6 54.4 59.1 55.6Foreign Languages 68.6 66.7 64.9 66.7 69.4 68.7 83.3 66.7 67.7 67.2 55.4 67.2Health Professions 81.9 88.0 81.6 82.4 81.6 79.6 69.8 84.1 83.0 77.8 78.9 82.6Home Economics 96.0 88.5 92.3 86.3 88.8 94.6 0.0 94.4 93.6 89.9 85.9 93.2Letters 66.0 68.8 63.8 63.7 61.0 62.0 56.3 64.3 64.1 57.7 75.2 63.6Library Science 0.0 0.0 0.0 0.0 0.0 0.0 0.0 0.0 0.0 0.0 0.0 0.0Mathematics 45.5 45.7 46.1 37.5 38.7 39.1 66.7 45.3 44.4 35.7 39.3 43.4Physical Science 33.3 31.0 43.5 49.4 27.5 28.9 41.7 27.9 30.8 24.9 38.7 30.6Psychology 77.0 75.3 71.7 71.7 75.5 75.8 61.2 75.4 75.2 70.9 72.5 74.8Public Affairs And Services 63.7 55.3 48.2 41.8 52.4 53.7 44.3 53.4 54.2 50.1 58.3 54.0Social Sciences 54.4 50.0 47.1 47.4 46.8 47.7 40.9 46.4 47.3 44.2 44.6 46.9Interdisciplinary Studies 82.2 81.1 81.4 77.5 79.0 78.5 78.0 82.7 81.9 76.0 73.6 81.4Totals 59.6 55.7 48.3 52.6 54.9 53.6 47.5 54.2 53.7 49.9 44.0 53.1
Student Majors

Statistical Abstract 147
Academic and Support Programs
Table 83 (continued)
CSU Fall 1992 Systemwide Enrollment in Undergraduate Programs by Discipline Division, by Ethnicity
White Non- TotalAfrican American Asian Mexican Other Pacific Non- Total resident All
Discipline Division American Indian American Filipino American Latino Islander Hispanic Identified Unknown Alien Groups
Number
Undeclared 1,836 233 3,259 971 3,383 1,204 111 9,966 20,963 2,313 438 23,714Agriculture AndNatural Resources 59 95 170 30 323 116 12 3,995 4,800 478 86 5,364Architecture And Environmental Design 89 24 523 125 344 152 22 1,375 2,654 213 70 2,937Area Studies 3 2 26 2 37 24 1 158 253 29 13 295Biological Science 538 106 1,955 579 966 434 52 5,441 10,071 1,083 283 11,437Business And Management 3,329 448 11,944 2,533 5,737 2,081 287 26,437 52,796 4,110 2,909 59,815Communications 919 138 581 334 1,002 430 45 7,028 10,477 952 261 11,690Computer And Information Sciences 553 51 2,669 516 598 259 42 3,396 8,084 712 857 9,653Education 632 139 1,239 415 1,676 519 63 7,592 12,275 965 188 13,428Engineering 935 163 5,942 1,478 2,595 855 100 9,207 21,275 1,920 1,197 24,392Fine And Applied Arts 480 120 1,471 401 982 390 45 7,756 11,645 1,473 407 13,525Foreign Languages 56 9 123 20 527 224 3 822 1,784 204 82 2,070Health Professions 858 130 1,582 1,378 1,061 403 51 5,943 11,406 904 147 12,457Home Economics 113 26 382 115 205 107 5 1,937 2,890 213 77 3,180Letters 542 141 441 198 929 368 41 7,678 10,338 1,330 138 11,806Library Science 0 0 0 0 0 0 0 0 0 0 0 0Mathematics 120 37 364 62 314 103 12 1,438 2,450 275 95 2,820Physical Science 120 30 431 77 211 98 9 2,062 3,038 382 123 3,543Psychology 1,288 209 880 403 1,822 690 54 8,951 14,297 1,442 185 15,924Public Affairs And Services 1,573 142 739 230 1,826 415 85 5,828 10,838 725 76 11,639Social Sciences 1,685 268 1,118 440 2,294 812 102 11,869 18,588 2,185 360 21,133Interdisciplinary Studies 1,021
238966
2892,798
64754 12,403 18,416 1,655 110 20,181
Total 16,749 2,749 36,805 10,596 29,630 10,331 1,196 141,282 249,338 23,563 8,102 281,003
Percent By Ethnic Group
Undeclared 8.8 1.1 15.5 4.6 16.1 5.7 0.5 47.5 (88.4) ( 9.8) ( 1.8) 100.0Agriculture And Natural Resources 1.2 2.0 3.5 0.6 6.7 2.4 0.3 83.2 (89.5) ( 8.9) ( 1.6) 100.0Architecture And Environmental Design 3.4 0.9 19.7 4.7 13.0 5.7 0.8 51.8 (90.4) ( 7.3) ( 2.4) 100.0Area Studies 1.2 0.8 10.3 0.8 14.6 9.5 0.4 62.5 (85.8) ( 9.8) ( 4.4) 100.0Biological Science 5.3 1.1 19.4 5.7 9.6 4.3 0.5 54.0 (88.1) ( 9.5) ( 2.5) 100.0Business And Management 6.3 0.8 22.6 4.8 10.9 3.9 0.5 50.1 (88.3) ( 6.9) ( 4.9) 100.0Communications 8.8 1.3 5.5 3.2 9.6 4.1 0.4 67.1 (89.6) ( 8.1) ( 2.2) 100.0Computer And Information Sciences 6.8 0.6 33.0 6.4 7.4 3.2 0.5 42.0 (83.7) ( 7.4) ( 8.9) 100.0Education 5.1 1.1 10.1 3.4 13.7 4.2 0.5 61.8 (91.4) ( 7.2) ( 1.4) 100.0Engineering 4.4 0.8 27.9 6.9 12.2 4.0 0.5 43.3 (87.2) ( 7.9) ( 4.9) 100.0Fine And Applied Arts 4.1 1.0 12.6 3.4 8.4 3.3 0.4 66.6 (86.1) (10.9) ( 3.0) 100.0Foreign Languages 3.1 0.5 6.9 1.1 29.5 12.6 0.2 46.1 (86.2) ( 9.9) ( 4.0) 100.0Health Professions 7.5 1.1 13.9 12.1 9.3 3.5 0.4 52.1 (91.6) ( 7.3) ( 1.2) 100.0Home Economics 3.9 0.9 13.2 4.0 7.1 3.7 0.2 67.0 (90.9) ( 6.7) ( 2.4) 100.0Letters 5.2 1.4 4.3 1.9 9.0 3.6 0.4 74.3 (87.6) (11.3) ( 1.2) 100.0Library Science 0.0 0.0 0.0 0.0 0.0 0.0 0.0 0.0 ( 0.0) ( 0.0) ( 0.0) 100.0Mathematics 4.9 1.5 14.9 2.5 12.8 4.2 0.5 58.7 (86.9) ( 9.8) ( 3.4) 100.0Physical Science 3.9 1.0 14.2 2.5 6.9 3.2 0.3 67.9 (85.7) (10.8) ( 3.5) 100.0Psychology 9.0 1.5 6.2 2.8 12.7 4.8 0.4 62.6 (89.8) ( 9.1) ( 1.2) 100.0Public Affairs And Services 14.5 1.3 6.8 2.1 16.8 3.8 0.8 53.8 (93.1) ( 6.2) ( 0.7) 100.0Social Sciences 9.1 1.4 6.0 2.4 12.3 4.4 0.5 63.9 (88.0) (10.3) ( 1.7) 100.0
Student Majors

148
Academic and Support Programs
Table 83 (continued)
CSU Fall 1992 Systemwide Enrollment in Undergraduate Programs by Discipline Division, by Ethnicity
White Non- TotalAfrican American Asian Mexican Other Pacific Non- Total resident All
Discipline Division American Indian American Filipino American Latino Islander Hispanic Identified Unknown Alien Groups
Percent By Discipline Division
Undeclared 11.0 8.5 8.9 9.2 11.4 11.7 9.3 7.1 8.4 9.8 5.4 8.4Agriculture And Natural Resources 0.4 3.5 0.5 0.3 1.1 1.1 1.0 2.8 1.9 2.0 1.1 1.9Architecture And Environmental Design 0.5 0.9 1.4 1.2 1.2 1.5 1.8 1.0 1.1 0.9 0.9 1.0Area Studies 0.0 0.1 0.1 0.0 0.1 0.2 0.1 0.1 0.1 0.1 0.2 0.1Biological Science 3.2 3.9 5.3 5.5 3.3 4.2 4.3 3.9 4.0 4.6 3.5 4.1Business And Management 19.9 16.3 32.5 23.9 19.4 20.1 24.0 18.7 21.2 17.4 35.9 21.3Communications 5.5 5.0 1.6 3.2 3.4 4.2 3.8 5.0 4.2 4.0 3.2 4.2Computer And Information Sciences 3.3 1.9 7.3 4.9 2.0 2.5 3.5 2.4 3.2 3.0 10.6 3.4Education 3.8 5.1 3.4 3.9 5.7 5.0 5.3 5.4 4.9 4.1 2.3 4.8Engineering 5.6 5.9 16.1 13.9 8.8 8.3 8.4 6.5 8.5 8.1 14.8 8.7Fine And Applied Arts 2.9 4.4 4.0 3.8 3.3 3.8 3.8 5.5 4.7 6.3 5.0 4.8Foreign Languages 0.3 0.3 0.3 0.2 1.8 2.2 0.3 0.6 0.7 0.9 1.0 0.7Health Professions 5.1 4.7 4.3 13.0 3.6 3.9 4.3 4.2 4.6 3.8 1.8 4.4Home Economics 0.7 0.9 1.0 1.1 0.7 1.0 0.4 1.4 1.2 0.9 1.0 1.1Letters 3.2 5.1 1.2 1.9 3.1 3.6 3.4 5.4 4.1 5.6 1.7 4.2Library Science 0.0 0.0 0.0 0.0 0.0 0.0 0.0 0.0 0.0 0.0 0.0 0.0Mathematics 0.7 1.3 1.0 0.6 1.1 1.0 1.0 1.0 1.0 1.2 1.2 1.0Physical Science 0.7 1.1 1.2 0.7 0.7 0.9 0.8 1.5 1.2 1.6 1.5 1.3Psychology 7.7 7.6 2.4 3.8 6.1 6.7 4.5 6.3 5.7 6.1 2.3 5.7Public Affairs And Services 9.4 5.2 2.0 2.2 6.2 4.0 7.1 4.1 4.3 3.1 0.9 4.1Social Sciences 10.1 9.7 3.0 4.2 7.7 7.9 8.5 8.4 7.5 9.3 4.4 7.5Interdisciplinary Studies 6.1
8.72.6
2.79.4 6.3 4.5 8.8 7.4 7.0 1.4 7.2
Total 100.0 100.0 100.0 100.0 100.0 100.0 100.0 100.0 100.0 100.0 100.0 100.0
Percent Female
Undeclared 59.3 51.9 52.3 58.3 56.6 56.1 53.2 56.9 56.3 54.0 46.1 55.9Agriculture And Natural Resources 45.8 48.4 41.8 50.0 34.1 51.7 41.7 44.7 44.1 38.7 31.4 43.4Architecture And Environmental Design 40.4 58.3 39.8 36.8 37.5 41.4 31.8 50.1 44.9 43.7 50.0 44.9Area Studies 0.0 0.0 53.8 50.0 67.6 50.0 0.0 60.8 60.1 44.8 76.9 59.3Biological Science 67.8 54.7 52.1 53.7 52.6 54.4 40.4 52.9 53.6 51.3 58.0 53.5Business And Management 56.1 52.7 57.7 55.2 53.7 51.2 50.5 46.6 51.1 46.5 50.7 50.8Communications 65.2 55.8 54.4 56.6 59.6 55.3 64.4 54.0 55.8 49.9 59.4 55.4Computer And Information Sciences 43.6 25.5 36.4 39.9 38.0 37.5 28.6 24.1 32.0 25.1 34.8 31.7Education 46.2 46.0 44.4 38.6 60.3 57.8 34.9 52.9 52.3 45.4 50.5 51.8Engineering 24.4 19.6 12.7 19.5 16.9 16.1 15.0 13.3 14.6 13.3 12.9 14.5Fine And Applied Arts 53.1 57.5 56.4 42.4 46.9 54.6 31.1 55.9 54.5 53.3 61.4 54.6Foreign Languages 71.4 44.4 67.5 65.0 67.4 69.6 66.7 68.0 67.9 66.2 54.9 67.2Health Professions 81.0 78.5 80.4 79.5 78.6 76.4 74.5 82.7 81.2 79.4 75.5 81.0Home Economics 95.6 88.5 92.9 89.6 89.8 91.6 0.0 93.8 93.1 92.5 88.3 93.0Letters 69.4 67.4 63.7 62.1 63.0 62.2 73.2 63.2 63.6 56.5 73.9 62.9Library Science 0.0 0.0 0.0 0.0 0.0 0.0 0.0 0.0 0.0 0.0 0.0 0.0Mathematics 43.3 43.2 46.2 40.3 41.1 37.9 50.0 45.3 44.4 34.5 40.0 43.3Physical Science 32.5 36.7 42.7 46.8 30.8 37.8 33.3 29.2 32.2 26.4 39.0 31.8Psychology 78.5 76.6 71.5 70.2 74.3 75.8 63.0 75.2 75.0 69.6 76.2 74.5Public Affairs And Services 63.8 52.1 46.1 40.4 51.8 53.7 50.6 53.5 53.9 51.2 59.2 53.8Social Sciences 54.4 51.5 47.0 48.6 49.4 44.7 40.2 47.1 48.0 43.4 44.7 47.5Interdisciplinary
Student Majors

Statistical Abstract 149
Academic and Support ProgramsStudent Majors
Table 84
CSU Fall 1990 Systemwide Enrollment in Master’s Programs by Discipline Division, by Ethnicity
White Total Non- TotalAfrican American Asian Mexican Other Pacific Non- Iden- resident All
Discipline Division American Indian American Filipino American Latino Islander Hispanic tified Unknown Alien Groups
Number by Discipline
Undeclared 42 7 82 12 36 14 2 533 728 72 48 848Agriculture and Natural Resources 4 0 5 0 8 7 0 181 205 26 28 259Architecture and Environmental Design 19 3 23 2 9 6 1 194 257 30 25 312Area Studies 0 3 3 6 2 0 58 72 6 7 85Biological Science 26 5 56 7 24 11 2 518 649 84 43 776Business and Management 116 36 779 60 126 111 6 4,063 5,297 592 795 6,684Communications 8 3 10 1 10 5 1 269 307 54 67 428Computer and Information Sciences 5 8 225 9 14 16 1 495 773 85 295 1,153Education 394 79 296 53 551 185 20 6,686 8,264 837 152 9,253Engineering 62 8 785 32 71 63 9 1,335 2,365 265 474 3,104Fine and Applied Arts 31 19 70 10 38 18 2 955 1,143 207 61 1,411Foreign Languages 3 1 15 1 59 34 1 149 263 31 14 308Health Professions 112 25 134 46 108 59 8 1,840 2,332 235 67 2,634Home Economics 7 4 25 7 7 5 1 233 289 27 25 341Letters 40 28 86 14 84 46 5 1,969 2,272 374 169 2,815Library Science 7 0 10 1 7 9 0 186 220 30 5 255Mathematics 14 2 52 7 10 13 0 302 400 63 34 497Physical Science 17 4 83 7 11 14 1 354 491 82 86 659Psychology 53 19 46 5 57 32 1 1,042 1,255 169 28 1,452Public Affairs and Services 346 36 153 49 273 96 12 2,208 3,173 309 42 3,524Social Sciences 74 18 81 10 95 47 6 1,481 1,812 291 119 2,222Interdisciplinary Studies 6 5 18 5 13 10 0 401 458 71 23 552Total 1,386 313 3,037 338 1,617 803 79 25,452 33,025 3,940 2,607 39,572
Percent by Ethnic Group
Undeclared 5.8 1.0 11.3 1.6 4.9 1.9 0.3 73.2 (85.8) ( 8.5) ( 5.7) 100.0Agriculture and Natural Resources 2.0 0.0 2.4 0.0 3.9 3.4 0.0 88.3 (79.2) (10.0) (10.8) 100.0Architecture and Environmental Design 7.4 1.2 8.9 0.8 3.5 2.3 0.4 75.5 (82.4) ( 9.6) ( 8.0) 100.0Area Studies 0.0 4.2 4.2 0.0 8.3 2.8 0.0 80.6 (84.7) ( 7.1) ( 8.2) 100.0Biological Science 4.0 0.8 8.6 1.1 3.7 1.7 0.3 79.8 (83.6) (10.8) ( 5.5) 100.0Business and Management 2.2 0.7 14.7 1.1 2.4 2.1 0.1 76.7 (79.2) ( 8.9) (11.9) 100.0Communications 2.6 1.0 3.3 0.3 3.3 1.6 0.3 87.6 (71.7) (12.6) (15.7) 100.0Computer and Information Sciences 0.6 1.0 29.1 1.2 1.8 2.1 0.1 64.0 (67.0) ( 7.4) (25.6) 100.0Education 4.8 1.0 3.6 0.6 6.7 2.2 0.2 80.9 (89.3) ( 9.0) ( 1.6) 100.0Engineering 2.6 0.3 33.2 1.4 3.0 2.7 0.4 56.4 (76.2) ( 8.5) (15.3) 100.0Fine and Applied Arts 2.7 1.7 6.1 0.9 3.3 1.6 0.2 83.6 (81.0) (14.7) ( 4.3) 100.0Foreign Languages 1.1 0.4 5.7 0.4 22.4 12.9 0.4 56.7 (85.4) (10.1) ( 4.5) 100.0Health Professions 4.8 1.1 5.7 2.0 4.6 2.5 0.3 78.9 (88.5) ( 8.9) ( 2.5) 100.0Home Economics 2.4 1.4 8.7 2.4 2.4 1.7 0.3 80.6 (84.8) ( 7.9) ( 7.3) 100.0Letters 1.8 1.2 3.8 0.6 3.7 2.0 0.2 86.7 (80.7) (13.3) ( 6.0) 100.0Library Science 3.2 0.0 4.5 0.5 3.2 4.1 0.0 84.5 (86.3) (11.8) ( 2.0) 100.0Mathematics 3.5 0.5 13.0 1.8 2.5 3.3 0.0 75.5 (80.5) (12.7) ( 6.8) 100.0Physical Science 3.5 0.8 16.9 1.4 2.2 2.9 0.2 72.1 (74.5) (12.4) (13.1) 100.0Psychology 4.2 1.5 3.7 0.4 4.5 2.5 0.1 83.0 (86.4) (11.6) ( 1.9) 100.0Public Affairs and Services 10.9 1.1 4.8 1.5 8.6 3.0 0.4 69.6 (90.0) ( 8.8) ( 1.2) 100.0Social Sciences 4.1 1.0 4.5 0.6 5.2 2.6 0.3 81.7 (81.5) (13.1) ( 5.4) 100.0Interdisciplinary Studies 1.3 1.1 3.9 1.1 2.8 2.2 0.0 87.6 (83.0) (12.9) ( 4.2) 100.0Total 4.2 0.9 9.2 1.0 4.9 2.4 0.2 77.1 (83.5) (10.0) ( 6.6) 100.0

150
Academic and Support ProgramsStudent Majors
Table 84 (continued)
CSU Fall 1990 Systemwide Enrollment in Master’s Programs by Discipline Division, by Ethnicity
White Total Non- TotalAfrican American Asian Mexican Other Pacific Non- Iden- resident All
Discipline Division American Indian American Filipino Amer. Latino Islander Hispanic tified Unknown Alien Groups
Percent by Discipline Division
Undeclared 3.0 2.2 2.7 3.6 2.2 1.7 2.5 2.1 2.2 1.8 1.8 2.1Agriculture and Natural Resources 0.3 0.0 0.2 0.0 0.5 0.9 0.0 0.7 0.6 0.7 1.1 0.7Architecture and Environmental Design 1.4 1.0 0.8 0.6 0.6 0.7 1.3 0.8 0.8 0.8 1.0 0.8Area Studies 0.0 1.0 0.1 0.0 0.4 0.2 0.0 0.2 0.2 0.2 0.3 0.2Biological Science 1.9 1.6 1.8 2.1 1.5 1.4 2.5 2.0 2.0 2.1 1.6 2.0Business and Management 8.4 11.5 25.7 17.8 7.8 13.8 7.6 16.0 16.0 15.0 30.5 16.9Communications 0.6 1.0 0.3 0.3 0.6 0.6 1.3 1.1 0.9 1.4 2.6 1.1Computer and Information Sciences 0.4 2.6 7.4 2.7 0.9 2.0 1.3 1.9 2.3 2.2 11.3 2.9Education 28.4 25.2 9.7 15.7 34.1 23.0 25.3 26.3 25.0 21.2 5.8 23.4Engineering 4.5 2.6 25.8 9.5 4.4 7.8 11.4 5.2 7.2 6.7 18.2 7.8Fine and Applied Arts 2.2 6.1 2.3 3.0 2.4 2.2 2.5 3.8 3.5 5.3 2.3 3.6Foreign Languages 0.2 0.3 0.5 0.3 3.6 4.2 1.3 0.6 0.8 0.8 0.5 0.8Health Professions 8.1 8.0 4.4 13.6 6.7 7.3 10.1 7.2 7.1 6.0 2.6 6.7Home Economics 0.5 1.3 0.8 2.1 0.4 0.6 1.3 0.9 0.9 0.7 1.0 0.9Letters 2.9 8.9 2.8 4.1 5.2 5.7 6.3 7.7 6.9 9.5 6.5 7.1Library Science 0.5 0.0 0.3 0.3 0.4 1.1 0.0 0.7 0.7 0.8 0.2 0.6Mathematics 1.0 0.6 1.7 2.1 0.6 1.6 0.0 1.2 1.2 1.6 1.3 1.3Physical Science 1.2 1.3 2.7 2.1 0.7 1.7 1.3 1.4 1.5 2.1 3.3 1.7Psychology 3.8 6.1 1.5 1.5 3.5 4.0 1.3 4.1 3.8 4.3 1.1 3.7Public Affairs and Services 25.0 11.5 5.0 14.5 16.9 12.0 15.2 8.7 9.6 7.8 1.6 8.9Social Sciences 5.3 5.8 2.7 3.0 5.9 5.9 7.6 5.8 5.5 7.4 4.6 5.6Interdisciplinary Studies 0.4 1.6 0.6 1.5 0.8 1.2 0.0 1.6 1.4 1.8 0.9 1.4Total 100.0 100.0 100.0 100.0 100.0 100.0 100.0 100.0 100.0 100.0 100.0 100.0
Percent Female
Undeclared 71.4 57.1 32.9 75.0 66.7 85.7 0.0 66.6 63.6 48.6 39.6 61.0Agriculture and Natural Resources 0.0 0.0 60.0 0.0 25.0 28.6 0.0 40.9 39.5 38.5 28.6 38.2Architecture and Environmental Design 26.3 0.0 39.1 50.0 11.1 0.0 0.0 38.1 36.2 46.7 20.0 35.9Area Studies 0.0 66.7 66.7 0.0 33.3 0.0 0.0 50.0 48.6 50.0 57.1 49.4Biological Science 65.4 40.0 53.6 42.9 41.7 36.4 0.0 51.4 51.2 44.0 69.8 51.4Business and Management 45.7 41.7 41.6 46.7 38.9 31.5 50.0 40.2 40.4 32.4 43.1 40.0Communications 87.5 66.7 40.0 0.0 60.0 60.0 0.0 64.3 63.8 57.4 62.7 62.9Computer and Information Sciences 20.0 25.0 38.2 55.6 21.4 12.5 0.0 22.4 27.3 28.2 35.6 29.5Education 79.9 70.9 74.7 66.0 69.3 74.1 45.0 77.8 76.9 73.7 77.0 76.6Engineering 16.1 37.5 12.9 9.4 9.9 7.9 22.2 12.4 12.5 14.3 16.2 13.2Fine and Applied Arts 41.9 36.8 84.3 50.0 47.4 66.7 50.0 60.3 60.5 58.0 72.1 60.6Foreign Languages 33.3 0.0 66.7 0.0 76.3 76.5 0.0 70.5 71.5 58.1 85.7 70.8Health Professions 83.0 88.0 76.9 71.7 85.2 72.9 75.0 85.5 84.3 77.9 64.2 83.2Home Economics 85.7 0.0 88.0 85.7 0.0 0.0 0.0 91.8 91.7 96.3 88.0 91.8Letters 65.0 60.7 67.4 78.6 64.3 63.0 60.0 66.9 66.7 61.2 74.6 66.5Library Science 71.4 0.0 70.0 0.0 85.7 55.6 0.0 81.2 79.5 73.3 0.0 79.2Mathematics 50.0 50.0 36.5 57.1 40.0 30.8 0.0 38.7 39.0 25.4 38.2 37.2Physical Science 23.5 50.0 28.9 71.4 18.2 28.6 0.0 22.9 24.8 17.1 32.6 24.9Psychology 81.1 52.6 80.4 60.0 54.4 62.5 0.0 72.5 71.7 65.7 75.0 71.1Public Affairs and Services 67.9 75.0 56.9 53.1 63.0 66.7 50.0 66.7 65.8 61.5 52.4 65.3Social Sciences 47.3 61.1 40.7 20.0 41.1 44.7 66.7 46.7 46.2 38.1 44.5 45.0Interdisciplinary Studies 66.7 80.0 72.2 60.0 53.8 40.0 0.0 51.6 52.8 60.6 34.8 53.1Total 65.7 62.3 42.1 54.4 59.6 54.4 49.4 60.3 58.6 52.9 44.0 57.1

Statistical Abstract 151
Academic and Support Programs
Table 84 (continued)
CSU Fall 1991 Systemwide Enrollment in Master’s Programs by Discipline Division, by Ethnicity
White Total Non- TotalAfrican American Asian Mexican Other Pacific Non- Iden- resident All
Discipline Division American Indian American Filipino Amer. Latino Islander Hispanic tified Unknown Alien Groups
Number
Undeclared 13 5 21 2 29 10 1 225 306 46 21 373Agriculture AndNatural Resources 4 3 10 0 8 7 0 158 190 34 51 275Architecture AndEnvironmental Design 16 1 19 2 9 6 1 183 237 31 29 297Area Studies 0 1 6 2 6 2 0 62 79 5 11 95Biological Science 21 8 69 10 23 11 1 499 642 91 31 764Business AndManagement 133 27 843 65 142 117 6 3,954 5,287 613 848 6,748Communications 14 0 17 3 13 7 2 288 344 53 75 472Computer AndInformation Sciences 17 7 362 14 15 13 3 568 999 108 346 1,453Education 454 89 335 66 600 209 15 6,590 8,358 974 158 9,490Engineering 68 7 847 40 88 72 8 1,339 2,469 282 528 3,279Fine And Applied Arts 43 20 84 9 43 21 4 971 1,195 245 70 1,510Foreign Languages 5 3 20 3 58 48 1 164 302 41 13 356Health Professions 131 27 190 68 123 75 1 1,962 2,577 266 59 2,902Home Economics 31 8 34 11 19 16 2 475 596 60 27 683Letters 59 32 131 23 110 49 3 2,166 2,573 469 175 3,217Library Science 4 0 13 1 8 6 0 245 277 40 4 321Mathematics 12 2 62 3 13 9 0 295 396 71 37 504Physical Science 20 2 68 5 20 17 1 380 513 87 91 691Psychology 68 14 48 10 74 44 4 1,080 1,342 177 25 1,544Public AffairsAnd Services 383 34 181 51 302 99 14 2,206 3,270 350 55 3,675Social Sciences 85 22 83 15 100 62 4 1,580 1,951 340 123 2,414InterdisciplinaryStudies 14 10 30 4 15 7 2 470 552 85 30 667Totals 1,595 322 3,473 407 1,818 907 73 25,860 34,455 4,468 2,807 41,730
Percent By Ethnic Group
Undeclared 4.2 1.6 6.9 0.7 9.5 3.3 0.3 73.5 82.0 12.3 5.6 100.0Agriculture AndNatural Resources 2.1 1.6 5.3 0.0 4.2 3.7 0.0 83.2 69.1 12.4 18.5 100.0Architecture AndEnvironmental Design 6.8 0.4 8.0 0.8 3.8 2.5 0.4 77.2 79.8 10.4 9.8 100.0Area Studies 0.0 1.3 7.6 2.5 7.6 2.5 0.0 78.5 83.2 5.3 11.6 100.0Biological Science 3.3 1.2 10.7 1.6 3.6 1.7 0.2 77.7 84.0 11.9 4.1 100.0Business AndManagement 2.5 0.5 15.9 1.2 2.7 2.2 0.1 74.8 78.3 9.1 12.6 100.0Communications 4.1 0.0 4.9 0.9 3.8 2.0 0.6 83.7 72.9 11.2 15.9 100.0Computer AndInformation Sciences 1.7 0.7 36.2 1.4 1.5 1.3 0.3 56.9 68.8 7.4 23.8 100.0Education 5.4 1.1 4.0 0.8 7.2 2.5 0.2 78.8 88.1 10.3 1.7 100.0Engineering 2.8 0.3 34.3 1.6 3.6 2.9 0.3 54.2 75.3 8.6 16.1 100.0Fine And Applied Arts 3.6 1.7 7.0 0.8 3.6 1.8 0.3 81.3 79.1 16.2 4.6 100.0Foreign Languages 1.7 1.0 6.6 1.0 19.2 15.9 0.3 54.3 84.8 11.5 3.7 100.0Health Professions 5.1 1.0 7.4 2.6 4.8 2.9 0.0 76.1 88.8 9.2 2.0 100.0Home Economics 5.2 1.3 5.7 1.8 3.2 2.7 0.3 79.7 87.3 8.8 4.0 100.0Letters 2.3 1.2 5.1 0.9 4.3 1.9 0.1 84.2 80.0 14.6 5.4 100.0Library Science 1.4 0.0 4.7 0.4 2.9 2.2 0.0 88.4 86.3 12.5 1.2 100.0Mathematics 3.0 0.5 15.7 0.8 3.3 2.3 0.0 74.5 78.6 14.1 7.3 100.0Physical Science 3.9 0.4 13.3 1.0 3.9 3.3 0.2 74.1 74.2 12.6 13.2 100.0Psychology 5.1 1.0 3.6 0.7 5.5 3.3 0.3 80.5 86.9 11.5 1.6 100.0Public AffairsAnd Services 11.7 1.0 5.5 1.6 9.2 3.0 0.4 67.5 89.0 9.5 1.5 100.0Social Sciences 4.4 1.1 4.3 0.8 5.1 3.2 0.2 81.0 80.8 14.1 5.1 100.0InterdisciplinaryStudies 2.5 1.8 5.4 0.7 2.7 1.3 0.4 85.1 82.8 12.7 4.5 100.0Totals 4.6 0.9 10.1 1.2 5.3 2.6 0.2 75.1 82.6 10.7 6.7 100.0
Student Majors

152
Academic and Support Programs
Table 84 (continued)
CSU Fall 1991 Systemwide Enrollment in Master’s Programs by Discipline Division, by Ethnicity
White Total Non- TotalAfrican American Asian Mexican Other Pacific Non- Iden- resident All
Discipline Division American Indian American Filipino Amer. Latino Islander Hispanic tified Unknown Alien Groups
Percent By Discipline Division
Undeclared 0.8 1.6 0.6 0.5 1.6 1.1 1.4 0.9 0.9 1.0 0.7 0.9Agriculture AndNatural Resources 0.3 0.9 0.3 0.0 0.4 0.8 0.0 0.6 0.6 0.8 1.8 0.7Architecture AndEnvironmental Design 1.0 0.3 0.5 0.5 0.5 0.7 1.4 0.7 0.7 0.7 1.0 0.7Area Studies 0.0 0.3 0.2 0.5 0.3 0.2 0.0 0.2 0.2 0.1 0.4 0.2Biological Science 1.3 2.5 2.0 2.5 1.3 1.2 1.4 1.9 1.9 2.0 1.1 1.8Business AndManagement 8.3 8.4 24.3 16.0 7.8 12.9 8.2 15.3 15.3 13.7 30.2 16.2Communications 0.9 0.0 0.5 0.7 0.7 0.8 2.7 1.1 1.0 1.2 2.7 1.1Computer AndInformation Sciences 1.1 2.2 10.4 3.4 0.8 1.4 4.1 2.2 2.9 2.4 12.3 3.5Education 28.5 27.6 9.6 16.2 33.0 23.0 20.5 25.5 24.3 21.8 5.6 22.7Engineering 4.3 2.2 24.4 9.8 4.8 7.9 11.0 5.2 7.2 6.3 18.8 7.9Fine And Applied Arts 2.7 6.2 2.4 2.2 2.4 2.3 5.5 3.8 3.5 5.5 2.5 3.6Foreign Languages 0.3 0.9 0.6 0.7 3.2 5.3 1.4 0.6 0.9 0.9 0.5 0.9Health Professions 8.2 8.4 5.5 16.7 6.8 8.3 1.4 7.6 7.5 6.0 2.1 7.0Home Economics 1.9 2.5 1.0 2.7 1.0 1.8 2.7 1.8 1.7 1.3 1.0 1.6Letters 3.7 9.9 3.8 5.7 6.1 5.4 4.1 8.4 7.5 10.5 6.2 7.7Library Science 0.3 0.0 0.4 0.2 0.4 0.7 0.0 0.9 0.8 0.9 0.1 0.8Mathematics 0.8 0.6 1.8 0.7 0.7 1.0 0.0 1.1 1.1 1.6 1.3 1.2Physical Science 1.3 0.6 2.0 1.2 1.1 1.9 1.4 1.5 1.5 1.9 3.2 1.7Psychology 4.3 4.3 1.4 2.5 4.1 4.9 5.5 4.2 3.9 4.0 0.9 3.7Public AffairsAnd Services 24.0 10.6 5.2 12.5 16.6 10.9 19.2 8.5 9.5 7.8 2.0 8.8Social Sciences 5.3 6.8 2.4 3.7 5.5 6.8 5.5 6.1 5.7 7.6 4.4 5.8InterdisciplinaryStudies 0.9
3.10.9
1.00.8 0.8 2.7 1.8 1.6 1.9 1.1 1.6
Totals 100.0 100.0 100.0 100.0 100.0 100.0 100.0 100.0 100.0 100.0 100.0 100.0
Percent Female
Undeclared 61.5 0.0 42.9 50.0 69.0 70.0 0.0 65.8 64.7 63.0 52.4 63.8Agriculture AndNatural Resources 0.0 0.0 50.0 0.0 12.5 28.6 0.0 43.0 40.0 35.3 17.6 35.3Architecture AndEnvironmental Design 31.3 0.0 47.4 0.0 11.1 0.0 0.0 38.3 36.3 41.9 31.0 36.4Area Studies 0.0 0.0 33.3 50.0 0.0 50.0 0.0 48.4 43.0 40.0 63.6 45.3Biological Science 38.1 37.5 60.9 40.0 47.8 54.5 0.0 51.5 51.6 42.9 71.0 51.3Business AndManagement 43.6 40.7 44.1 49.2 40.1 35.9 66.7 39.5 40.4 33.9 48.6 40.9Communications 50.0 0.0 47.1 0.0 53.8 28.6 0.0 67.4 64.2 60.4 72.0 65.0Computer AndInformation Sciences 47.1 28.6 37.3 42.9 20.0 23.1 33.3 23.2 29.0 25.0 32.4 29.5Education 75.8 71.9 77.6 71.2 68.8 79.4 80.0 76.9 76.3 72.2 74.1 75.8Engineering 17.6 28.6 12.5 10.0 12.5 11.1 12.5 11.8 12.2 14.2 15.5 12.9Fine And Applied Arts 34.9 35.0 79.8 55.6 44.2 66.7 0.0 63.3 62.1 56.3 72.9 61.7Foreign Languages 80.0 66.7 80.0 33.3 67.2 68.8 0.0 64.0 66.2 46.3 76.9 64.3Health Professions 86.3 77.8 74.7 77.9 81.3 72.0 0.0 83.2 82.1 76.3 62.7 81.2Home Economics 83.9 87.5 79.4 81.8 78.9 0.0 0.0 83.6 83.7 73.3 85.2 82.9Letters 64.4 68.8 70.2 69.6 56.4 57.1 33.3 65.5 65.2 57.8 73.1 64.6Library Science 0.0 0.0 61.5 0.0 0.0 50.0 0.0 77.6 76.9 65.0 0.0 75.7Mathematics 50.0 50.0 37.1 66.7 15.4 11.1 0.0 41.0 39.4 32.4 35.1 38.1Physical Science 25.0 0.0 30.9 20.0 10.0 41.2 0.0 24.7 25.7 21.8 40.7 27.2Psychology 79.4 64.3 81.3 70.0 59.5 52.3 75.0 72.6 71.8 63.3 80.0 70.9Public AffairsAnd Services 69.5 67.6 60.8 68.6 64.6 69.7 50.0 67.3 67.0 60.3 65.5 66.3Social Sciences 49.4 40.9 39.8 20.0 35.0 29.0 75.0 45.3 44.0 34.1 47.2 42.8InterdisciplinaryStudies 50.0 70.0 50.0 75.0 53.3 42.9 50.0 56.6 56.2 54.1 46.7 55.5
Student Majors
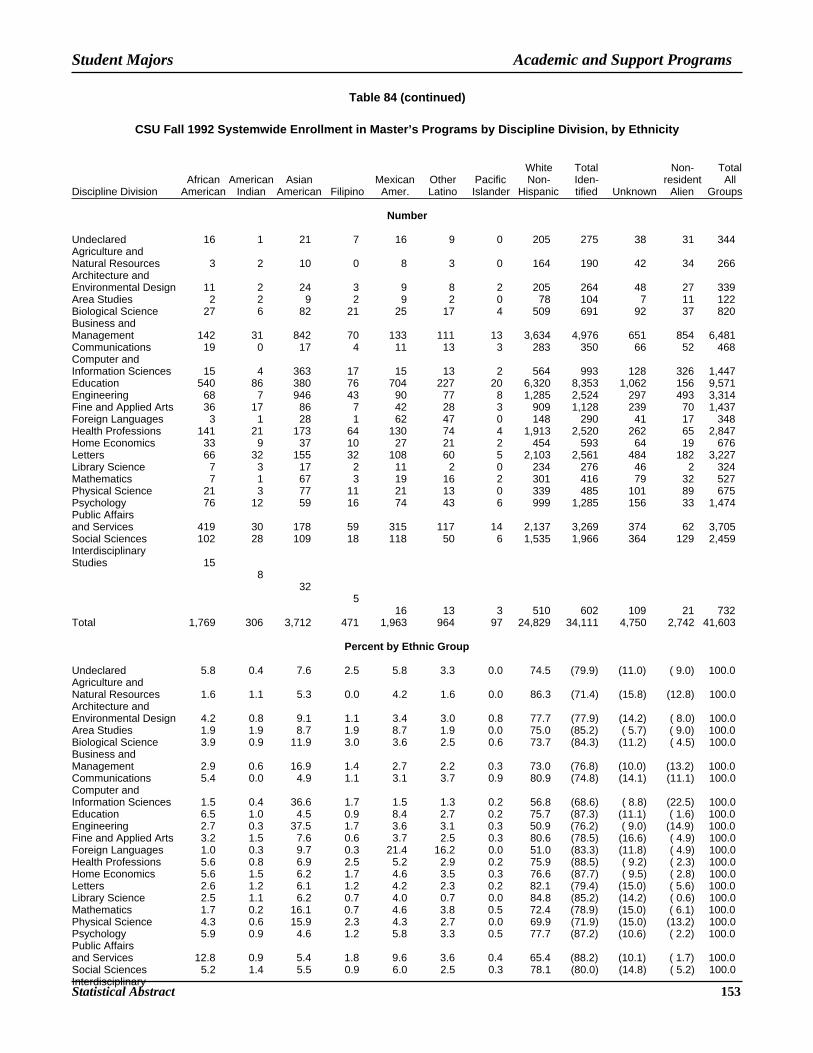
Statistical Abstract 153
Academic and Support Programs
Table 84 (continued)
CSU Fall 1992 Systemwide Enrollment in Master’s Programs by Discipline Division, by Ethnicity
White Total Non- TotalAfrican American Asian Mexican Other Pacific Non- Iden- resident All
Discipline Division American Indian American Filipino Amer. Latino Islander Hispanic tified Unknown Alien Groups
Number
Undeclared 16 1 21 7 16 9 0 205 275 38 31 344Agriculture andNatural Resources 3 2 10 0 8 3 0 164 190 42 34 266Architecture andEnvironmental Design 11 2 24 3 9 8 2 205 264 48 27 339Area Studies 2 2 9 2 9 2 0 78 104 7 11 122Biological Science 27 6 82 21 25 17 4 509 691 92 37 820Business andManagement 142 31 842 70 133 111 13 3,634 4,976 651 854 6,481Communications 19 0 17 4 11 13 3 283 350 66 52 468Computer andInformation Sciences 15 4 363 17 15 13 2 564 993 128 326 1,447Education 540 86 380 76 704 227 20 6,320 8,353 1,062 156 9,571Engineering 68 7 946 43 90 77 8 1,285 2,524 297 493 3,314Fine and Applied Arts 36 17 86 7 42 28 3 909 1,128 239 70 1,437Foreign Languages 3 1 28 1 62 47 0 148 290 41 17 348Health Professions 141 21 173 64 130 74 4 1,913 2,520 262 65 2,847Home Economics 33 9 37 10 27 21 2 454 593 64 19 676Letters 66 32 155 32 108 60 5 2,103 2,561 484 182 3,227Library Science 7 3 17 2 11 2 0 234 276 46 2 324Mathematics 7 1 67 3 19 16 2 301 416 79 32 527Physical Science 21 3 77 11 21 13 0 339 485 101 89 675Psychology 76 12 59 16 74 43 6 999 1,285 156 33 1,474Public Affairsand Services 419 30 178 59 315 117 14 2,137 3,269 374 62 3,705Social Sciences 102 28 109 18 118 50 6 1,535 1,966 364 129 2,459InterdisciplinaryStudies 15
832
516 13 3 510 602 109 21 732
Total 1,769 306 3,712 471 1,963 964 97 24,829 34,111 4,750 2,742 41,603
Percent by Ethnic Group
Undeclared 5.8 0.4 7.6 2.5 5.8 3.3 0.0 74.5 (79.9) (11.0) ( 9.0) 100.0Agriculture andNatural Resources 1.6 1.1 5.3 0.0 4.2 1.6 0.0 86.3 (71.4) (15.8) (12.8) 100.0Architecture andEnvironmental Design 4.2 0.8 9.1 1.1 3.4 3.0 0.8 77.7 (77.9) (14.2) ( 8.0) 100.0Area Studies 1.9 1.9 8.7 1.9 8.7 1.9 0.0 75.0 (85.2) ( 5.7) ( 9.0) 100.0Biological Science 3.9 0.9 11.9 3.0 3.6 2.5 0.6 73.7 (84.3) (11.2) ( 4.5) 100.0Business andManagement 2.9 0.6 16.9 1.4 2.7 2.2 0.3 73.0 (76.8) (10.0) (13.2) 100.0Communications 5.4 0.0 4.9 1.1 3.1 3.7 0.9 80.9 (74.8) (14.1) (11.1) 100.0Computer andInformation Sciences 1.5 0.4 36.6 1.7 1.5 1.3 0.2 56.8 (68.6) ( 8.8) (22.5) 100.0Education 6.5 1.0 4.5 0.9 8.4 2.7 0.2 75.7 (87.3) (11.1) ( 1.6) 100.0Engineering 2.7 0.3 37.5 1.7 3.6 3.1 0.3 50.9 (76.2) ( 9.0) (14.9) 100.0Fine and Applied Arts 3.2 1.5 7.6 0.6 3.7 2.5 0.3 80.6 (78.5) (16.6) ( 4.9) 100.0Foreign Languages 1.0 0.3 9.7 0.3 21.4 16.2 0.0 51.0 (83.3) (11.8) ( 4.9) 100.0Health Professions 5.6 0.8 6.9 2.5 5.2 2.9 0.2 75.9 (88.5) ( 9.2) ( 2.3) 100.0Home Economics 5.6 1.5 6.2 1.7 4.6 3.5 0.3 76.6 (87.7) ( 9.5) ( 2.8) 100.0Letters 2.6 1.2 6.1 1.2 4.2 2.3 0.2 82.1 (79.4) (15.0) ( 5.6) 100.0Library Science 2.5 1.1 6.2 0.7 4.0 0.7 0.0 84.8 (85.2) (14.2) ( 0.6) 100.0Mathematics 1.7 0.2 16.1 0.7 4.6 3.8 0.5 72.4 (78.9) (15.0) ( 6.1) 100.0Physical Science 4.3 0.6 15.9 2.3 4.3 2.7 0.0 69.9 (71.9) (15.0) (13.2) 100.0Psychology 5.9 0.9 4.6 1.2 5.8 3.3 0.5 77.7 (87.2) (10.6) ( 2.2) 100.0Public Affairsand Services 12.8 0.9 5.4 1.8 9.6 3.6 0.4 65.4 (88.2) (10.1) ( 1.7) 100.0Social Sciences 5.2 1.4 5.5 0.9 6.0 2.5 0.3 78.1 (80.0) (14.8) ( 5.2) 100.0Interdisciplinary
Student Majors

154
Academic and Support Programs
Table 84 (continued)
CSU Fall 1992 Systemwide Enrollment in Master’s Programs by Discipline Division, by Ethnicity
White Total Non- TotalAfrican American Asian Mexican Other Pacific Non- Iden- resident All
Discipline Division American Indian American Filipino Amer. Latino Islander Hispanic tified Unknown Alien Groups
Percent by Discipline Division
Undeclared 0.9 0.3 0.6 1.5 0.8 0.9 0.0 0.8 0.8 0.8 1.1 0.8Agriculture andNatural Resources 0.2 0.7 0.3 0.0 0.4 0.3 0.0 0.7 0.6 0.9 1.2 0.6Architecture andEnvironmental Design 0.6 0.7 0.6 0.6 0.5 0.8 2.1 0.8 0.8 1.0 1.0 0.8Area Studies 0.1 0.7 0.2 0.4 0.5 0.2 0.0 0.3 0.3 0.1 0.4 0.3Biological Science 1.5 2.0 2.2 4.5 1.3 1.8 4.1 2.1 2.0 1.9 1.3 2.0Business andManagement 8.0 10.1 22.7 14.9 6.8 11.5 13.4 14.6 14.6 13.7 31.1 15.6Communications 1.1 0.0 0.5 0.8 0.6 1.3 3.1 1.1 1.0 1.4 1.9 1.1Computer andInformation Sciences 0.8 1.3 9.8 3.6 0.8 1.3 2.1 2.3 2.9 2.7 11.9 3.5Education 30.5 28.1 10.2 16.1 35.9 23.5 20.6 25.5 24.5 22.4 5.7 23.0Engineering 3.8 2.3 25.5 9.1 4.6 8.0 8.2 5.2 7.4 6.3 18.0 8.0Fine and Applied Arts 2.0 5.6 2.3 1.5 2.1 2.9 3.1 3.7 3.3 5.0 2.6 3.5Foreign Languages 0.2 0.3 0.8 0.2 3.2 4.9 0.0 0.6 0.9 0.9 0.6 0.8Health Professions 8.0 6.9 4.7 13.6 6.6 7.7 4.1 7.7 7.4 5.5 2.4 6.8Home Economics 1.9 2.9 1.0 2.1 1.4 2.2 2.1 1.8 1.7 1.3 0.7 1.6Letters 3.7 10.5 4.2 6.8 5.5 6.2 5.2 8.5 7.5 10.2 6.6 7.8Library Science 0.4 1.0 0.5 0.4 0.6 0.2 0.0 0.9 0.8 1.0 0.1 0.8Mathematics 0.4 0.3 1.8 0.6 1.0 1.7 2.1 1.2 1.2 1.7 1.2 1.3Physical Science 1.2 1.0 2.1 2.3 1.1 1.3 0.0 1.4 1.4 2.1 3.2 1.6Psychology 4.3 3.9 1.6 3.4 3.8 4.5 6.2 4.0 3.8 3.3 1.2 3.5Public Affairsand Services 23.7 9.8 4.8 12.5 16.0 12.1 14.4 8.6 9.6 7.9 2.3 8.9Social Sciences 5.8 9.2 2.9 3.8 6.0 5.2 6.2 6.2 5.8 7.7 4.7 5.9InterdisciplinaryStudies 0.8
2.60.9
1.10.8
1.3 3.1 2.1 1.8 2.3 0.8 1.8Total 100.0 100.0 100.0 100.0 100.0 100.0 100.0 100.0 100.0 100.0 100.0 100.0
Percent Female
Undeclared 50.0 0.0 57.1 71.4 31.3 0.0 0.0 64.9 62.9 57.9 29.0 59.3Agriculture andNatural Resources 33.3 0.0 50.0 0.0 50.0 33.3 0.0 46.3 45.8 33.3 23.5 41.0Architecture andEnvironmental Design 36.4 50.0 29.2 33.3 33.3 25.0 50.0 44.9 42.0 37.5 40.7 41.3Area Studies 0.0 0.0 66.7 50.0 33.3 0.0 0.0 52.6 51.0 42.9 63.6 51.6Biological Science 55.6 50.0 48.8 52.4 52.0 41.2 25.0 50.5 50.2 40.2 67.6 49.9Business andManagement 40.8 35.5 46.4 50.0 42.1 43.2 30.8 39.2 40.8 30.9 47.1 40.6Communications 52.6 0.0 52.9 75.0 63.6 61.5 33.3 64.7 63.1 56.1 73.1 63.2Computer andInformation Sciences 33.3 25.0 36.9 52.9 33.3 23.1 50.0 21.8 28.3 25.8 36.8 30.0Education 74.1 72.1 78.4 72.4 70.3 73.1 60.0 77.0 76.1 71.3 75.0 75.5Engineering 16.2 28.6 12.3 16.3 12.2 16.9 0.0 12.6 12.8 14.1 19.1 13.8Fine and Applied Arts 47.2 29.4 83.7 57.1 33.3 64.3 33.3 64.5 63.6 55.6 72.9 62.7Foreign Languages 66.7 0.0 67.9 0.0 64.5 83.0 0.0 67.6 69.3 56.1 82.4 68.4Health Professions 85.8 90.5 74.0 78.1 80.8 78.4 75.0 82.7 82.0 77.5 66.2 81.2Home Economics 81.8 66.7 78.4 80.0 77.8 90.5 50.0 82.8 82.1 81.3 89.5 82.2Letters 63.6 53.1 68.4 65.6 61.1 51.7 60.0 65.0 64.5 56.6 83.0 64.4Library Science 85.7 0.0 70.6 0.0 72.7 50.0 0.0 79.1 77.9 71.7 0.0 77.2Mathematics 14.3 0.0 41.8 33.3 26.3 50.0 0.0 36.5 36.8 34.2 37.5 36.4Physical Science 28.6 66.7 36.4 18.2 0.0 30.8 0.0 27.7 28.0 19.8 51.7 29.9Psychology 77.6 66.7 78.0 68.8 55.4 58.1 66.7 73.9 72.5 69.2 84.8 72.5Public Affairsand Services 71.4 50.0 64.0 64.4 59.4 71.8 57.1 67.6 67.0 61.5 69.4 66.5Social Sciences 52.0 46.4 45.9 22.2 42.4 30.0 66.7 45.5 45.1 37.6 51.2 44.3Interdisciplinary
Student Majors

Statistical Abstract 155
Academic and Support Programs
Table 85
CSU Fall Enrollment in Undergraduate ProgramsPercent by Discipline Division, by Ethnicity, from Fall 1980
African American
Discipline Division 1981 1982 1983 1984 1985 1986 1987 1988 1989 1990 1991 1992
Undeclared 14.0 13.7 14.4 15.2 13.5 13.7 11.9 11.9 12.5 11.8 10.9 11.0Agriculture 0.3 0.3 0.3 0.3 0.3 0.3 0.4 0.3 0.3 0.3 0.3 0.4Architecture 0.3 0.2 0.3 0.3 0.4 0.5 0.5 0.5 0.5 0.6 0.5 0.5Area Studies 0.0 0.0 0.0 0.0 0.0 0.0 0.0 0.0 0.0 0.0 0.0 0.0Biological Sciences 3.4 3.5 3.8 3.9 3.7 3.5 3.1 2.8 2.8 2.9 2.8 3.2Business 25.3 25.2 24.4 23.1 24.9 24.9 25.1 24.7 23.7 22.0 21.0 19.9Communications 4.9 5.3 5.4 5.4 5.4 5.6 5.6 5.5 5.7 5.8 5.7 5.5Computer Sciences 3.6 4.3 5.3 5.9 5.1 5.3 4.8 4.1 3.5 3.8 3.4 3.3Education 4.5 4.6 4.3 4.4 4.5 4.4 4.3 4.3 4.2 4.4 4.1 3.8Engineering 4.9 5.4 5.0 5.1 4.9 5.2 5.1 5.3 5.2 5.5 5.9 5.6Fine & Applied Arts 3.8 3.7 3.3 3.3 3.5 3.1 3.1 3.3 3.4 3.0 3.0 2.9Foreign Languages 0.3 0.3 0.3 0.4 0.4 0.4 0.3 0.3 0.4 0.4 0.3 0.3Health Professions 5.5 5.4 5.6 5.2 5.0 4.9 4.7 4.5 4.3 4.4 4.9 5.1Home Economics 1.0 1.0 1.1 0.9 0.9 0.9 1.0 0.8 0.7 0.8 0.7 0.7Letters 2.3 2.4 2.1 2.0 2.4 2.6 2.8 2.8 2.8 2.8 3.3 3.2Mathematics 0.6 0.8 1.0 1.2 1.1 1.0 1.1 0.9 0.8 0.7 0.7 0.7Physical Sciences 0.9 0.8 1.0 0.9 0.9 0.8 0.7 0.8 0.8 0.8 0.8 0.7Psychology 5.1 4.8 5.0 5.0 5.1 5.1 5.8 6.1 6.6 6.8 7.2 7.7Public Affairs 8.1 7.1 6.9 6.9 7.7 6.8 7.8 8.2 8.1 8.5 8.8 9.4Social Sciences 7.3 7.1 6.7 6.8 6.6 6.8 7.2 7.8 8.5 8.9 9.3 10.1Interdisciplinary Studies 3.7 4.0 3.8 3.8 3.8 4.2 4.7 5.0 5.4 5.7 6.2 6.1Total, All Programs 100.0 100.0 100.0 100.0 100.0 100.0 100.0 100.0 100.0 100.0 100.0 100.0
American Indian
Discipline Division 1981 1982 1983 1984 1985 1986 1987 1988 1989 1990 1991 1992
Undeclared 18.8 12.5 11.2 11.4 11.6 10.2 9.3 8.9 10.1 9.5 8.3 8.5Agriculture 2.5 3.1 3.1 2.5 2.6 2.6 2.5 2.9 3.1 3.1 3.3 3.5Architecture 0.3 0.3 0.6 0.5 0.8 0.7 1.0 1.0 0.8 0.9 1.0 0.9Area Studies 0.2 0.2 0.0 0.0 0.2 0.0 0.0 0.0 0.0 0.0 0.0 0.1Biological Sciences 3.2 3.6 4.1 4.1 3.5 3.3 3.3 4.1 4.1 3.9 3.7 3.9Business 21.7 23.6 21.9 23.3 21.8 22.4 22.0 21.2 20.3 18.1 18.2 16.3Communications 4.0 4.8 5.0 3.8 4.4 4.0 3.5 4.0 3.7 4.6 4.9 5.0Computer Sciences 2.6 3.0 3.8 3.7 3.8 3.5 3.1 2.8 2.1 2.4 2.1 1.9Education 4.8 5.3 5.3 5.1 5.4 6.3 7.1 6.4 5.9 5.4 5.7 5.1Engineering 5.7 5.7 6.7 7.3 6.4 6.2 5.7 5.6 5.5 5.8 5.5 5.9Fine & Applied Arts 6.3 7.0 7.1 6.5 5.8 5.3 5.2 5.4 5.7 4.7 4.8 4.4Foreign Languages 0.5 0.4 0.4 0.3 0.5 0.4 0.4 0.3 0.4 0.5 0.4 0.3Health Professions 4.3 4.9 4.5 5.0 4.5 4.6 3.7 3.6 3.7 4.3 4.0 4.7Home Economics 1.2 1.1 1.0 1.1 1.4 1.5 1.4 1.2 1.3 1.1 1.0 0.9Letters 2.8 3.0 2.5 2.6 2.9 3.0 3.7 3.8 3.8 4.2 4.6 5.1Mathematics 0.7 0.8 1.4 1.8 1.5 1.9 1.3 1.0 0.9 1.1 1.3 1.3Physical Sciences 1.6 1.6 2.0 2.2 2.2 2.0 1.7 1.7 1.4 1.5 1.1 1.1Psychology 4.5 4.4 4.2 4.5 5.2 4.8 5.1 5.4 6.3 6.4 7.0 7.6Public Affairs 4.0 4.0 4.5 3.9 4.4 4.5 5.1 4.5 3.9 5.1 5.5 5.2Social Sciences 6.1 5.6 6.2 6.2 5.8 6.3 7.6 8.4 8.5 9.0 8.7 9.7Interdisciplinary Studies 4.3 5.1 4.5 4.3 5.3 6.6 7.3 7.9 8.4 8.3 8.8 8.7Total, All Programs 100.0 100.0 100.0 100.0 100.0 100.0 100.0 100.0 100.0 100.0 100.0 100.0
Student Majors
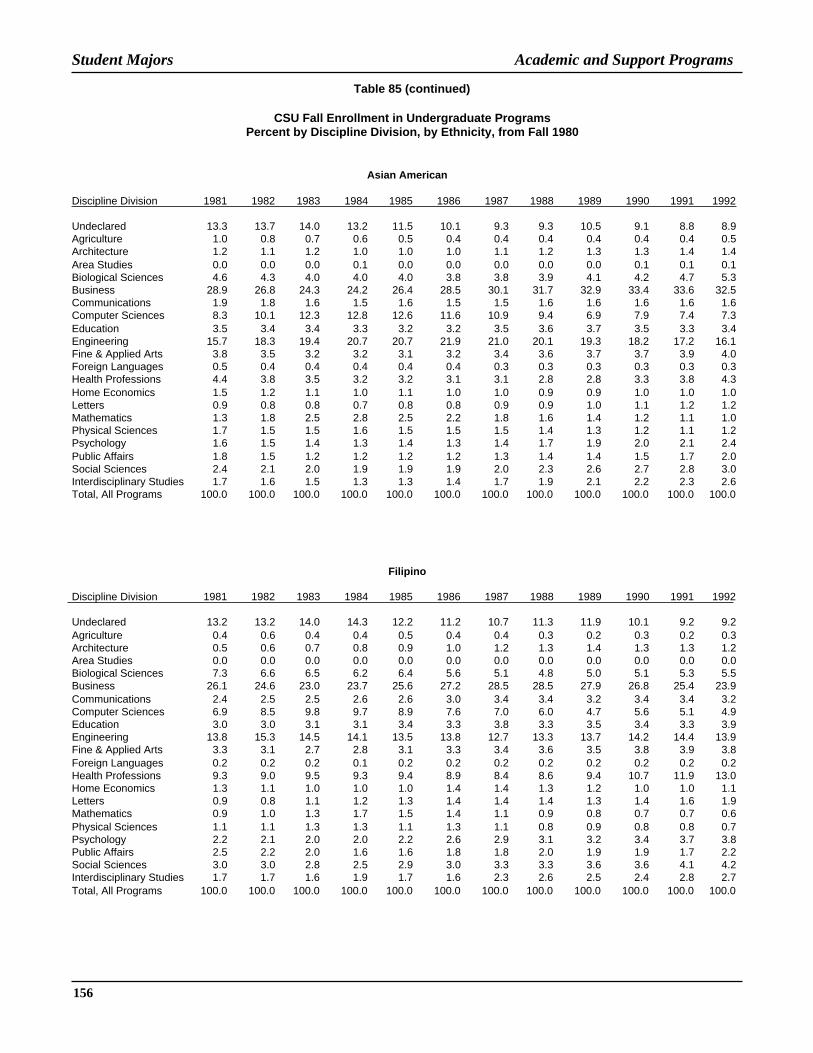
156
Academic and Support Programs
Table 85 (continued)
CSU Fall Enrollment in Undergraduate ProgramsPercent by Discipline Division, by Ethnicity, from Fall 1980
Student Majors
Asian American
Discipline Division 1981 1982 1983 1984 1985 1986 1987 1988 1989 1990 1991 1992
Undeclared 13.3 13.7 14.0 13.2 11.5 10.1 9.3 9.3 10.5 9.1 8.8 8.9Agriculture 1.0 0.8 0.7 0.6 0.5 0.4 0.4 0.4 0.4 0.4 0.4 0.5Architecture 1.2 1.1 1.2 1.0 1.0 1.0 1.1 1.2 1.3 1.3 1.4 1.4Area Studies 0.0 0.0 0.0 0.1 0.0 0.0 0.0 0.0 0.0 0.1 0.1 0.1Biological Sciences 4.6 4.3 4.0 4.0 4.0 3.8 3.8 3.9 4.1 4.2 4.7 5.3Business 28.9 26.8 24.3 24.2 26.4 28.5 30.1 31.7 32.9 33.4 33.6 32.5Communications 1.9 1.8 1.6 1.5 1.6 1.5 1.5 1.6 1.6 1.6 1.6 1.6Computer Sciences 8.3 10.1 12.3 12.8 12.6 11.6 10.9 9.4 6.9 7.9 7.4 7.3Education 3.5 3.4 3.4 3.3 3.2 3.2 3.5 3.6 3.7 3.5 3.3 3.4Engineering 15.7 18.3 19.4 20.7 20.7 21.9 21.0 20.1 19.3 18.2 17.2 16.1Fine & Applied Arts 3.8 3.5 3.2 3.2 3.1 3.2 3.4 3.6 3.7 3.7 3.9 4.0Foreign Languages 0.5 0.4 0.4 0.4 0.4 0.4 0.3 0.3 0.3 0.3 0.3 0.3Health Professions 4.4 3.8 3.5 3.2 3.2 3.1 3.1 2.8 2.8 3.3 3.8 4.3Home Economics 1.5 1.2 1.1 1.0 1.1 1.0 1.0 0.9 0.9 1.0 1.0 1.0Letters 0.9 0.8 0.8 0.7 0.8 0.8 0.9 0.9 1.0 1.1 1.2 1.2Mathematics 1.3 1.8 2.5 2.8 2.5 2.2 1.8 1.6 1.4 1.2 1.1 1.0Physical Sciences 1.7 1.5 1.5 1.6 1.5 1.5 1.5 1.4 1.3 1.2 1.1 1.2Psychology 1.6 1.5 1.4 1.3 1.4 1.3 1.4 1.7 1.9 2.0 2.1 2.4Public Affairs 1.8 1.5 1.2 1.2 1.2 1.2 1.3 1.4 1.4 1.5 1.7 2.0Social Sciences 2.4 2.1 2.0 1.9 1.9 1.9 2.0 2.3 2.6 2.7 2.8 3.0Interdisciplinary Studies 1.7 1.6 1.5 1.3 1.3 1.4 1.7 1.9 2.1 2.2 2.3 2.6Total, All Programs 100.0 100.0 100.0 100.0 100.0 100.0 100.0 100.0 100.0 100.0 100.0 100.0
Filipino
Discipline Division 1981 1982 1983 1984 1985 1986 1987 1988 1989 1990 1991 1992
Undeclared 13.2 13.2 14.0 14.3 12.2 11.2 10.7 11.3 11.9 10.1 9.2 9.2Agriculture 0.4 0.6 0.4 0.4 0.5 0.4 0.4 0.3 0.2 0.3 0.2 0.3Architecture 0.5 0.6 0.7 0.8 0.9 1.0 1.2 1.3 1.4 1.3 1.3 1.2Area Studies 0.0 0.0 0.0 0.0 0.0 0.0 0.0 0.0 0.0 0.0 0.0 0.0Biological Sciences 7.3 6.6 6.5 6.2 6.4 5.6 5.1 4.8 5.0 5.1 5.3 5.5Business 26.1 24.6 23.0 23.7 25.6 27.2 28.5 28.5 27.9 26.8 25.4 23.9Communications 2.4 2.5 2.5 2.6 2.6 3.0 3.4 3.4 3.2 3.4 3.4 3.2Computer Sciences 6.9 8.5 9.8 9.7 8.9 7.6 7.0 6.0 4.7 5.6 5.1 4.9Education 3.0 3.0 3.1 3.1 3.4 3.3 3.8 3.3 3.5 3.4 3.3 3.9Engineering 13.8 15.3 14.5 14.1 13.5 13.8 12.7 13.3 13.7 14.2 14.4 13.9Fine & Applied Arts 3.3 3.1 2.7 2.8 3.1 3.3 3.4 3.6 3.5 3.8 3.9 3.8Foreign Languages 0.2 0.2 0.2 0.1 0.2 0.2 0.2 0.2 0.2 0.2 0.2 0.2Health Professions 9.3 9.0 9.5 9.3 9.4 8.9 8.4 8.6 9.4 10.7 11.9 13.0Home Economics 1.3 1.1 1.0 1.0 1.0 1.4 1.4 1.3 1.2 1.0 1.0 1.1Letters 0.9 0.8 1.1 1.2 1.3 1.4 1.4 1.4 1.3 1.4 1.6 1.9Mathematics 0.9 1.0 1.3 1.7 1.5 1.4 1.1 0.9 0.8 0.7 0.7 0.6Physical Sciences 1.1 1.1 1.3 1.3 1.1 1.3 1.1 0.8 0.9 0.8 0.8 0.7Psychology 2.2 2.1 2.0 2.0 2.2 2.6 2.9 3.1 3.2 3.4 3.7 3.8Public Affairs 2.5 2.2 2.0 1.6 1.6 1.8 1.8 2.0 1.9 1.9 1.7 2.2Social Sciences 3.0 3.0 2.8 2.5 2.9 3.0 3.3 3.3 3.6 3.6 4.1 4.2Interdisciplinary Studies 1.7 1.7 1.6 1.9 1.7 1.6 2.3 2.6 2.5 2.4 2.8 2.7Total, All Programs 100.0 100.0 100.0 100.0 100.0 100.0 100.0 100.0 100.0 100.0 100.0 100.0

Statistical Abstract 157
Academic and Support ProgramsStudent Majors
Table 85 (continued)
CSU Fall Enrollment in Undergraduate ProgramsPercent by Discipline Division, by Ethnicity, from Fall 1980
Mexican American
Discipline Division 1981 1982 1983 1984 1985 1986 1987 1988 1989 1990 1991 1992
Undeclared 16.7 16.4 15.7 16.4 14.4 12.5 12.0 12.6 13.0 12.3 12.1 11.4Agriculture 1.8 1.6 1.7 1.6 1.4 1.2 1.2 1.0 1.0 1.0 1.1 1.1Architecture 0.9 0.8 0.9 0.9 0.9 1.1 1.2 1.4 1.3 1.2 1.2 1.2Area Studies 0.2 0.2 0.1 0.1 0.1 0.1 0.1 0.1 0.1 0.1 0.1 0.1Biological Sciences 3.5 3.8 3.9 3.8 3.7 3.5 3.3 3.2 3.0 3.1 3.3 3.3Business 19.5 19.8 18.9 19.6 21.8 22.6 23.0 22.3 21.7 20.9 20.2 19.4Communications 2.7 2.9 3.3 3.4 3.6 3.7 3.7 3.7 3.7 3.6 3.6 3.4Computer Sciences 2.0 2.9 3.5 3.8 3.5 3.4 3.0 2.6 2.2 2.2 2.1 2.0Education 6.2 5.9 5.9 5.5 5.4 5.5 5.7 5.5 5.8 5.6 5.9 5.7Engineering 7.1 7.8 8.3 8.3 8.1 8.0 7.8 7.9 8.3 8.2 8.5 8.8Fine & Applied Arts 3.9 3.7 3.6 3.3 3.4 3.4 3.5 3.4 3.4 3.5 3.3 3.3Foreign Languages 1.8 1.6 1.6 1.5 1.4 1.6 1.6 1.6 1.6 1.7 1.6 1.8Health Professions 3.9 3.9 4.1 3.7 3.9 3.8 3.6 3.5 3.1 3.3 3.4 3.6Home Economics 0.9 0.8 0.9 1.1 1.1 1.1 1.0 0.9 0.9 0.8 0.8 0.7Letters 1.7 1.7 1.6 1.9 2.0 2.3 2.6 2.5 2.7 2.8 2.8 3.1Mathematics 0.6 0.7 1.1 1.2 1.1 1.2 1.2 1.1 1.2 1.1 1.1 1.1Physical Sciences 0.9 1.0 1.0 0.9 1.0 0.9 0.9 0.8 0.8 0.8 0.8 0.7Psychology 4.0 4.1 3.6 3.5 4.2 4.5 4.7 5.2 5.6 5.9 6.0 6.1Public Affairs 6.3 5.8 5.8 5.7 5.9 5.5 5.6 5.7 5.5 5.3 5.6 6.2Social Sciences 8.2 7.3 7.3 7.1 6.2 6.2 6.1 6.5 6.7 7.2 7.3 7.7Interdisciplinary Studies 7.4 7.1 7.1 6.8 6.9 7.9 8.4 8.7 8.6 9.3 9.3 9.4Total, All Programs 100.0 100.0 100.0 100.0 100.0 100.0 100.0 100.0 100.0 100.0 100.0 100.0
Other Latino
Discipline Division 1981 1982 1983 1984 1985 1986 1987 1988 1989 1990 1991 1992
Undeclared 14.9 15.7 14.1 13.9 12.2 11.9 10.8 11.5 11.8 11.2 11.7 11.7Agriculture 1.6 1.2 1.3 1.2 1.3 1.3 1.2 1.1 1.1 1.1 1.1 1.1Architecture 1.4 0.9 1.1 1.2 1.2 1.3 1.6 1.7 2.0 1.8 1.7 1.5Area Studies 0.2 0.2 0.1 0.2 0.2 0.1 0.2 0.1 0.2 0.2 0.2 0.2Biological Sciences 5.3 4.8 4.8 5.4 5.2 4.4 4.3 4.0 3.7 3.6 4.0 4.2Business 21.2 19.8 19.4 20.3 22.2 22.6 23.2 23.4 22.8 21.4 20.4 20.1Communications 2.9 3.4 4.1 3.9 3.8 3.7 3.5 3.7 3.9 4.0 3.9 4.2Computer Sciences 2.8 3.4 4.3 4.5 4.2 4.1 4.0 3.6 2.8 3.1 2.6 2.5Education 4.6 4.6 5.0 4.5 4.9 4.7 5.0 4.9 4.8 5.0 5.3 5.0Engineering 9.4 9.8 9.8 10.0 9.4 10.0 9.3 8.5 8.4 8.7 8.6 8.3Fine & Applied Arts 4.9 4.8 4.4 3.9 4.4 4.5 4.3 4.1 4.0 4.1 4.0 3.8Foreign Languages 2.8 2.6 2.3 2.4 2.1 2.2 2.3 2.2 2.1 2.2 2.2 2.2Health Professions 3.7 3.8 3.7 3.2 3.6 3.3 3.5 3.4 3.5 3.7 3.7 3.9Home Economics 0.8 0.9 1.1 1.2 1.1 1.0 1.1 1.0 1.2 1.0 0.9 1.0Letters 2.2 2.3 2.1 2.6 2.5 2.6 2.5 2.6 2.8 2.8 3.1 3.6Mathematics 0.6 0.9 1.3 1.2 1.2 1.0 1.1 1.1 1.1 1.0 1.1 1.0Physical Sciences 1.4 1.5 1.7 1.5 1.4 1.2 1.0 0.9 1.0 1.0 1.0 0.9Psychology 5.0 5.1 4.9 4.9 5.1 4.7 5.3 5.8 6.1 6.9 6.7 6.7Public Affairs 3.6 3.6 3.6 3.3 3.3 3.2 3.3 3.4 3.3 3.8 3.8 4.0Social Sciences 6.0 6.4 6.2 6.1 5.7 6.2 6.5 6.5 6.9 6.8 7.2 7.9Interdisciplinary Studies 4.8 4.4 4.6 4.5 4.8 5.7 6.1 6.3 6.3 6.6 6.6 6.3Total, All Programs 100.0 100.0 100.0 100.0 100.0 100.0 100.0 100.0 100.0 100.0 100.0 100.0

158
Academic and Support Programs
Table 85 (continued)
CSU Fall Enrollment in Undergraduate ProgramsPercent by Discipline Division, by Ethnicity, from Fall 1980
Student Majors
Pacific Islander
Discipline Division 1981 1982 1983 1984 1985 1986 1987 1988 1989 1990 1991 1992
Undeclared 10.4 13.2 13.5 13.8 13.2 10.7 9.3 9.4 11.4 10.1 9.6 9.3Agriculture 2.1 1.9 1.8 2.2 1.8 2.0 1.8 1.1 1.0 1.2 0.9 1.0Architecture 1.5 1.4 1.3 1.0 0.5 1.2 0.9 1.0 1.4 1.4 1.9 1.8Area Studies 0.1 0.0 0.0 0.0 0.0 0.0 0.0 0.1 0.1 0.1 0.2 0.1Biological Sciences 5.7 4.0 4.2 5.1 5.1 4.3 4.9 4.0 3.2 3.7 3.7 4.3Business 21.0 22.4 21.6 23.8 24.6 25.2 26.8 25.2 27.9 25.7 24.4 24.0Communications 3.9 3.1 3.3 3.7 3.3 3.1 3.8 3.0 3.2 3.5 3.9 3.8Computer Sciences 4.9 4.5 5.4 5.4 7.4 6.4 5.5 5.1 4.3 3.7 4.0 3.5Education 4.8 4.5 4.2 4.3 5.5 4.6 4.8 6.3 6.1 5.5 5.3 5.3Engineering 12.5 13.0 13.2 10.7 10.0 11.6 9.9 10.0 8.6 8.2 8.0 8.4Fine & Applied Arts 5.5 5.4 4.7 4.9 4.5 3.8 4.2 5.0 4.2 4.3 3.7 3.8Foreign Languages 0.3 0.4 0.4 0.1 0.4 0.4 0.4 0.3 0.2 0.3 0.5 0.3Health Professions 5.0 5.7 5.3 4.1 3.4 2.9 3.5 3.1 3.3 3.7 3.7 4.3Home Economics 0.9 1.0 1.0 1.0 0.9 1.3 1.2 1.5 1.3 1.2 0.9 0.4Letters 1.9 1.3 1.8 1.9 2.2 2.3 1.7 2.0 2.3 3.7 2.8 3.4Mathematics 0.5 1.1 1.8 2.3 2.2 2.0 1.7 1.4 0.0 0.6 1.0 1.0Physical Sciences 2.3 2.0 2.3 2.8 1.5 1.7 1.2 1.4 0.8 1.2 1.0 0.8Psychology 2.0 1.6 1.8 2.0 2.8 3.3 3.6 3.6 1.5 3.4 4.2 4.5Public Affairs 3.8 4.1 4.2 3.5 4.0 4.7 5.0 5.6 2.8 6.8 7.6 7.1Social Sciences 6.7 6.4 6.1 5.4 4.3 5.5 6.8 7.2 5.3 7.3 7.6 8.5Interdisciplinary Studies 4.0 3.0 2.1 2.1 2.5 3.2 3.3 3.8 6.8 4.5 5.1 4.5Total, All Programs 100.0 100.0 100.0 100.0 100.0 100.0 100.0 100.0 100.0 100.0 100.0 100.0
White, Non-Latino
Discipline Division 1981 1982 1983 1984 1985 1986 1987 1988 1989 1990 1991 1992
Undeclared 11.2 12.3 12.4 12.2 11.0 9.5 9.2 9.1 9.1 8.0 7.0 7.1Agriculture 3.8 3.4 3.4 3.3 3.0 2.7 2.6 2.5 2.6 2.6 2.7 2.8Architecture 1.0 0.8 1.0 0.9 0.9 0.9 1.0 1.0 1.0 1.0 1.0 1.0Area Studies 0.1 0.1 0.1 0.1 0.1 0.1 0.1 0.1 0.1 0.1 0.1 0.1Biological Sciences 3.9 3.7 3.7 3.7 3.6 3.5 3.4 3.3 3.3 3.4 3.6 3.9Business 23.1 21.9 20.7 20.9 22.2 23.5 23.1 22.4 21.7 21.0 20.0 18.7Communications 4.3 4.4 4.9 4.9 4.9 5.0 5.1 5.2 5.2 5.1 5.1 5.0Computer Sciences 3.0 3.6 4.2 4.2 3.9 3.5 3.1 2.7 2.1 2.5 2.4 2.4Education 4.8 4.7 4.8 4.7 4.8 4.7 5.1 5.0 5.0 5.2 5.4 5.4Engineering 7.5 7.8 7.8 7.9 7.5 7.2 6.8 6.6 6.5 6.4 6.5 6.5Fine & Applied Arts 6.1 5.9 5.5 5.1 5.2 5.3 5.3 5.4 5.4 5.5 5.4 5.5Foreign Languages 0.6 0.6 0.6 0.6 0.6 0.6 0.6 0.6 0.6 0.6 0.6 0.6Health Professions 4.5 4.4 4.6 4.3 4.2 4.0 3.7 3.4 3.4 3.5 3.9 4.2Home Economics 1.9 1.8 1.7 2.0 1.9 1.8 1.8 1.7 1.6 1.6 1.5 1.4Letters 3.3 3.4 3.1 3.3 3.7 4.0 4.4 4.6 4.9 5.1 5.4 5.4Mathematics 0.9 1.1 1.5 1.6 1.6 1.5 1.4 1.2 1.2 1.1 1.1 1.0Physical Sciences 2.2 2.2 2.2 2.1 2.0 1.8 1.7 1.5 1.5 1.4 1.5 1.5Psychology 4.1 4.3 4.3 4.3 4.4 4.6 4.8 5.2 5.5 5.8 6.1 6.3Public Affairs 3.3 3.1 3.0 3.1 3.1 3.2 3.3 3.3 3.4 3.5 3.9 4.1Social Sciences 5.9 6.0 5.9 6.0 6.0 6.2 6.5 7.0 7.3 7.8 8.0 8.4Interdisciplinary Studies 4.5 4.5 4.5 4.9 5.4 6.3 7.3 8.0 8.5 8.8 9.0 8.8Total, All Programs 100.0 100.0 100.0 100.0 100.0 100.0 100.0 100.0 100.0 100.0 100.0 100.0

Statistical Abstract 159
Academic and Support Programs
Table 85 (continued)
CSU Fall Enrollment in Undergraduate ProgramsPercent by Discipline Division, by Ethnicity, from Fall 1980
Student Majors
Total, All Groups
Discipline Division 1981 1982 1983 1984 1985 1986 1987 1988 1989 1990 1991 1992
Undeclared 12.2 12.4 12.7 12.9 11.4 10.1 9.7 9.7 10.1 9.1 8.4 8.4Agriculture 3.0 2.8 2.7 2.5 2.3 2.0 2.0 1.9 1.9 1.9 1.9 1.9Architecture 0.9 0.8 0.9 0.9 0.9 0.9 1.0 1.0 1.1 1.1 1.1 1.0Area Studies 0.1 0.1 0.1 0.1 0.1 0.1 0.0 0.1 0.1 0.1 0.1 0.1Biological Sciences 3.9 3.8 3.9 3.9 3.8 3.7 3.5 3.4 3.4 3.6 3.8 4.1Business 23.2 22.3 21.2 21.3 23.0 24.1 24.2 23.9 23.6 23.0 22.3 21.3Communications 3.7 3.9 4.3 4.3 4.3 4.4 4.5 4.5 4.5 4.4 4.3 4.2Computer Sciences 3.6 4.4 5.4 5.3 5.3 5.0 4.3 3.7 3.0 3.6 3.5 3.4Education 4.7 4.6 4.7 4.5 4.6 4.5 4.9 4.8 4.8 4.8 4.8 4.8Engineering 9.1 9.6 9.5 9.3 9.3 9.3 8.7 8.6 8.6 8.7 8.7 8.7Fine & Applied Arts 5.5 5.3 5.0 4.7 4.7 4.7 4.7 4.8 4.7 4.9 4.8 4.8Foreign Languages 0.7 0.7 0.7 0.7 0.7 0.7 0.6 0.7 0.6 0.7 0.7 0.7Health Professions 4.5 4.4 4.5 4.3 4.1 4.0 3.8 3.6 3.5 3.7 4.1 4.4Home Economics 1.6 1.5 1.5 1.7 1.6 1.6 1.5 1.4 1.4 1.3 1.2 1.1Letters 2.9 2.9 2.7 2.9 3.1 3.3 3.6 3.7 3.8 4.0 4.2 4.2Mathematics 1.0 1.3 1.6 1.7 1.7 1.6 1.4 1.2 1.1 1.1 1.0 1.0Physical Sciences 2.0 2.1 2.1 1.9 1.8 1.7 1.5 1.4 1.3 1.3 1.3 1.3Psychology 3.9 3.9 3.9 3.9 4.0 4.1 4.4 4.8 5.1 5.2 5.4 5.7Public Affairs 3.6 3.3 3.2 3.3 3.3 3.2 3.5 3.6 3.6 3.6 3.8 4.1Social Sciences 5.9 5.7 5.7 5.7 5.5 5.7 5.9 6.3 6.6 7.0 7.2 7.5Interdisciplinary Studies 4.1 4.1 4.1 4.4 4.7 5.4 6.4 6.9 7.2 7.2 7.4 7.2Total, All Programs 100.0 100.0 100.0 100.0 100.0 100.0 100.0 100.0 100.0 100.0 100.0 100.0

160
Academic and Support Programs
Table 86
CSU Fall Systemwide Enrollment in Master’s Programs,Percent by Discipline Division, by Ethnicity, from Fall 1984
African American
Discipline Division 1984 1985 1986 1987 1988 1989 1990 1991 1992
Undeclared 4.2 2.6 10.2 2.5 3.1 2.7 3.0 0.8 0.9Agriculture 0.1 0.2 0.1 0.2 0.2 0.3 0.3 0.3 0.2Architecture 0.0 0.7 1.1 1.0 1.4 1.0 1.4 1.0 0.6Area Studies 0.3 0.1 0.0 0.0 0.1 0.0 0.0 0.0 0.1Biological Sciences 1.7 1.5 1.1 1.4 1.5 1.7 1.9 1.3 1.5Business 6.6 6.3 6.8 7.8 8.5 8.6 8.4 8.3 8.0Communications 0.5 1.0 0.7 0.8 1.0 0.6 0.6 0.9 1.1Computer Sciences 0.8 0.8 0.3 0.3 0.7 0.4 0.4 1.1 0.8Education 30.9 33.8 34.0 35.4 31.6 30.0 28.4 28.5 30.5Engineering 2.5 2.6 2.8 2.3 4.0 4.3 4.5 4.3 3.8Fine & Applied Arts 2.5 2.2 2.3 2.3 1.6 2.0 2.2 2.7 2.0Foreign Languages 0.7 0.4 0.4 0.4 0.3 0.3 0.2 0.3 0.2Health Professions 7.2 8.2 7.6 7.4 7.1 7.6 8.1 8.2 8.0Home Economics 1.5 1.3 1.1 0.8 1.1 0.4 0.5 1.9 1.9Letters 3.2 3.0 2.5 3.4 2.6 2.7 2.9 3.7 3.7Library Science 0.4 0.2 0.3 0.0 0.2 0.4 0.5 0.3 0.4Mathematics 0.5 0.6 1.1 1.2 0.7 1.2 1.0 0.8 0.4Physical Sciences 0.6 1.2 1.1 1.3 1.2 1.6 1.2 1.3 1.2Psychology 7.5 5.9 3.4 4.1 5.0 4.0 3.8 4.3 4.3Public Affairs 22.3 23.1 18.8 22.5 21.9 24.2 25.0 24.0 23.7Social Sciences 5.4 3.7 3.8 4.6 5.4 5.6 5.3 5.3 5.8Interdisciplinary Studies 0.6 0.6 0.3 0.3 0.7 0.6 0.4 0.9 0.8Total, All Programs 100.0 100.0 100.0 100.0 100.0 100.0 100.0 100.0 100.0
American Indian
Discipline Division 1984 1985 1986 1987 1988 1989 1990 1991 1992
Undeclared 2.0 1.3 0.7 2.8 2.8 2.8 2.2 1.6 0.3Agriculture 1.3 1.0 0.4 0.6 0.6 0.6 0.0 0.9 0.7Architecture 0.7 0.6 1.8 1.6 2.1 0.6 1.0 0.3 0.7Area Studies 0.0 0.0 0.0 0.3 0.3 0.6 1.0 0.3 0.7Biological Sciences 2.6 2.9 2.9 2.2 1.5 0.9 1.6 2.5 2.0Business 15.5 18.5 17.0 15.8 10.7 9.2 11.5 8.4 10.1Communications 1.3 0.6 1.4 1.2 1.2 0.3 1.0 0.0 0.0Computer Sciences 2.6 2.6 1.8 2.2 1.5 1.2 2.6 2.2 1.3Education 26.6 24.9 23.5 24.8 28.2 32.8 25.2 27.6 28.1Engineering 3.3 2.6 2.9 3.4 4.0 3.4 2.6 2.2 2.3Fine & Applied Arts 6.6 4.2 4.3 3.1 5.2 5.2 6.1 6.2 5.6Foreign Languages 0.3 0.3 0.7 0.3 0.0 0.0 0.3 0.9 0.3Health Professions 8.9 8.3 8.3 6.8 8.0 5.8 8.0 8.4 6.9Home Economics 1.0 1.0 0.7 0.9 1.2 1.5 1.3 2.5 2.9Letters 4.9 5.1 5.1 5.3 4.6 7.4 8.9 9.9 10.5Library Science 0.7 0.6 0.4 0.6 0.3 0.3 0.0 0.0 1.0Mathematics 0.7 1.0 1.4 0.9 0.6 0.6 0.6 0.6 0.3Physical Sciences 1.0 1.6 1.8 2.8 2.5 1.5 1.3 0.6 1.0Psychology 4.6
6.15.8 5.3 6.1 5.2 6.1 4.3 3.9
Public Affairs 9.5 11.8 12.3 10.2 12.0 11.7 11.5 10.6 9.8Social Sciences 4.3 3.2 4.0 6.8 5.5 6.7 5.8 6.8 9.2Interdisciplinary Studies 1.6 1.9 2.9 1.9 0.9 1.5 1.6 3.1 2.6
Student Majors
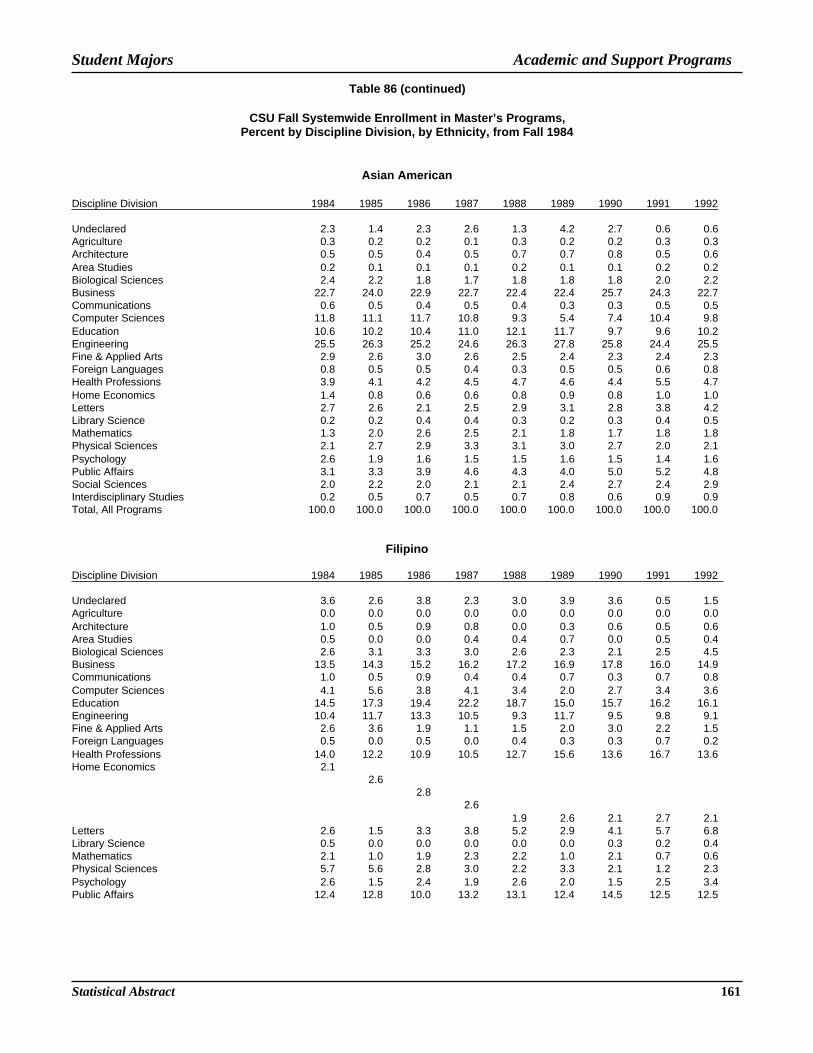
Statistical Abstract 161
Academic and Support Programs
Table 86 (continued)
CSU Fall Systemwide Enrollment in Master’s Programs,Percent by Discipline Division, by Ethnicity, from Fall 1984
Asian American
Discipline Division 1984 1985 1986 1987 1988 1989 1990 1991 1992
Undeclared 2.3 1.4 2.3 2.6 1.3 4.2 2.7 0.6 0.6Agriculture 0.3 0.2 0.2 0.1 0.3 0.2 0.2 0.3 0.3Architecture 0.5 0.5 0.4 0.5 0.7 0.7 0.8 0.5 0.6Area Studies 0.2 0.1 0.1 0.1 0.2 0.1 0.1 0.2 0.2Biological Sciences 2.4 2.2 1.8 1.7 1.8 1.8 1.8 2.0 2.2Business 22.7 24.0 22.9 22.7 22.4 22.4 25.7 24.3 22.7Communications 0.6 0.5 0.4 0.5 0.4 0.3 0.3 0.5 0.5Computer Sciences 11.8 11.1 11.7 10.8 9.3 5.4 7.4 10.4 9.8Education 10.6 10.2 10.4 11.0 12.1 11.7 9.7 9.6 10.2Engineering 25.5 26.3 25.2 24.6 26.3 27.8 25.8 24.4 25.5Fine & Applied Arts 2.9 2.6 3.0 2.6 2.5 2.4 2.3 2.4 2.3Foreign Languages 0.8 0.5 0.5 0.4 0.3 0.5 0.5 0.6 0.8Health Professions 3.9 4.1 4.2 4.5 4.7 4.6 4.4 5.5 4.7Home Economics 1.4 0.8 0.6 0.6 0.8 0.9 0.8 1.0 1.0Letters 2.7 2.6 2.1 2.5 2.9 3.1 2.8 3.8 4.2Library Science 0.2 0.2 0.4 0.4 0.3 0.2 0.3 0.4 0.5Mathematics 1.3 2.0 2.6 2.5 2.1 1.8 1.7 1.8 1.8Physical Sciences 2.1 2.7 2.9 3.3 3.1 3.0 2.7 2.0 2.1Psychology 2.6 1.9 1.6 1.5 1.5 1.6 1.5 1.4 1.6Public Affairs 3.1 3.3 3.9 4.6 4.3 4.0 5.0 5.2 4.8Social Sciences 2.0 2.2 2.0 2.1 2.1 2.4 2.7 2.4 2.9Interdisciplinary Studies 0.2 0.5 0.7 0.5 0.7 0.8 0.6 0.9 0.9Total, All Programs 100.0 100.0 100.0 100.0 100.0 100.0 100.0 100.0 100.0
Filipino
Discipline Division 1984 1985 1986 1987 1988 1989 1990 1991 1992
Undeclared 3.6 2.6 3.8 2.3 3.0 3.9 3.6 0.5 1.5Agriculture 0.0 0.0 0.0 0.0 0.0 0.0 0.0 0.0 0.0Architecture 1.0 0.5 0.9 0.8 0.0 0.3 0.6 0.5 0.6Area Studies 0.5 0.0 0.0 0.4 0.4 0.7 0.0 0.5 0.4Biological Sciences 2.6 3.1 3.3 3.0 2.6 2.3 2.1 2.5 4.5Business 13.5 14.3 15.2 16.2 17.2 16.9 17.8 16.0 14.9Communications 1.0 0.5 0.9 0.4 0.4 0.7 0.3 0.7 0.8Computer Sciences 4.1 5.6 3.8 4.1 3.4 2.0 2.7 3.4 3.6Education 14.5 17.3 19.4 22.2 18.7 15.0 15.7 16.2 16.1Engineering 10.4 11.7 13.3 10.5 9.3 11.7 9.5 9.8 9.1Fine & Applied Arts 2.6 3.6 1.9 1.1 1.5 2.0 3.0 2.2 1.5Foreign Languages 0.5 0.0 0.5 0.0 0.4 0.3 0.3 0.7 0.2Health Professions 14.0 12.2 10.9 10.5 12.7 15.6 13.6 16.7 13.6Home Economics 2.1
2.62.8
2.61.9 2.6 2.1 2.7 2.1
Letters 2.6 1.5 3.3 3.8 5.2 2.9 4.1 5.7 6.8Library Science 0.5 0.0 0.0 0.0 0.0 0.0 0.3 0.2 0.4Mathematics 2.1 1.0 1.9 2.3 2.2 1.0 2.1 0.7 0.6Physical Sciences 5.7 5.6 2.8 3.0 2.2 3.3 2.1 1.2 2.3Psychology 2.6 1.5 2.4 1.9 2.6 2.0 1.5 2.5 3.4Public Affairs 12.4 12.8 10.0 13.2 13.1 12.4 14.5 12.5 12.5
Student Majors

162
Academic and Support Programs
Table 86 (continued)
CSU Fall Systemwide Enrollment in Master’s Programs,Percent by Discipline Division, by Ethnicity, from Fall 1984
Mexican American
Discipline Division 1984 1985 1986 1987 1988 1989 1990 1991 1992
Undeclared 4.3 3.0 2.4 1.6 4.1 2.3 2.2 1.6 0.8Agriculture 0.2 0.4 0.4 0.2 0.4 0.4 0.5 0.4 0.4Architecture 0.9 1.0 1.1 0.9 0.9 0.6 0.6 0.5 0.5Area Studies 0.5 0.8 0.4 0.2 0.4 0.3 0.4 0.3 0.5Biological Sciences 1.1 1.7 1.0 1.1 1.3 1.3 1.5 1.3 1.3Business 7.1 5.7 6.8 6.9 7.1 7.2 7.8 7.8 6.8Communications 0.3 0.6 0.3 0.3 0.1 0.4 0.6 0.7 0.6Computer Sciences 0.8 0.9 1.0 0.9 0.8 0.3 0.9 0.8 0.8Education 43.2 42.6 42.5 43.8 38.6 40.5 34.1 33.0 35.9Engineering 2.9 2.2 2.5 2.5 3.3 3.4 4.4 4.8 4.6Fine & Applied Arts 3.0 3.1 3.5 3.2 2.7 3.0 2.4 2.4 2.1Foreign Languages 2.1 2.5 2.5 2.6 2.7 2.9 3.6 3.2 3.2Health Professions 4.9 5.5 6.1 6.8 6.6 5.9 6.7 6.8 6.6Home Economics 0.5 0.3 0.5 0.4 0.6 0.5 0.4 1.0 1.4Letters 3.5 3.5 3.4 3.6 3.4 4.6 5.2 6.1 5.5Library Science 0.3 0.6 0.3 0.2 0.1 0.4 0.4 0.4 0.6Mathematics 0.5 0.6 0.3 0.5 0.4 0.6 0.6 0.7 1.0Physical Sciences 0.8 1.0 1.2 1.3 1.4 1.2 0.7 1.1 1.1Psychology 5.0 4.9 4.4 4.1 4.6 4.0 3.5 4.1 3.8Public Affairs 12.5 14.4 15.3 15.2 15.7 14.7 16.9 16.6 16.0Social Sciences 4.8 4.0 3.2 3.5 4.6 5.1 5.9 5.5 6.0Interdisciplinary Studies 0.6 0.8 0.6 0.4 0.4 0.5 0.8 0.8 0.8Total, All Programs 100.0 100.0 100.0 100.0 100.0 100.0 100.0 100.0 100.0
Other Latino
Discipline Division 1984 1985 1986 1987 1988 1989 1990 1991 1992
Undeclared 5.0 2.4 2.5 2.5 1.9 1.5 1.7 1.1 0.9Agriculture 0.3 0.6 0.5 0.7 0.6 0.5 0.9 0.8 0.3Architecture 0.3 0.5 0.7 0.6 1.2 1.1 0.7 0.7 0.8Area Studies 0.6 0.0 0.3 0.7 0.8 0.5 0.2 0.2 0.2Biological Sciences 1.5 1.4 2.5 1.4 1.9 2.2 1.4 1.2 1.8Business 10.3 12.4 12.4 12.3 11.9 14.0 13.8 12.9 11.5Communications 0.5 0.6 0.3 0.8 0.8 0.9 0.6 0.8 1.3Computer Sciences 1.6 1.3 1.3 2.1 2.4 1.2 2.0 1.4 1.3Education 29.7
29.229.4
29.226.9
26.123.0 23.0 23.5
Engineering 7.1 7.9 8.4 8.2 7.9 8.5 7.8 7.9 8.0Fine & Applied Arts 3.4 3.7 3.5 3.5 2.9 2.8 2.2 2.3 2.9Foreign Languages 4.5 4.8 4.3 5.2 4.7 4.5 4.2 5.3 4.9Health Professions 4.2 6.3 7.4 7.5 7.5 6.1 7.3 8.3 7.7Home Economics 1.0 0.6 0.3 0.6 0.5 0.4 0.6 1.8 2.2Letters 3.7 2.7 3.1 2.5 3.8 4.1 5.7 5.4 6.2Library Science 0.3 0.2 0.2 0.3 0.3 0.6 1.1 0.7 0.2Mathematics 0.6 0.8 0.7 1.0 1.0 1.6 1.6 1.0 1.7Physical Sciences 1.6 2.1 1.7 2.0 1.8 1.9 1.7 1.9 1.3Psychology 6.6 6.1 4.5 4.1 4.5 4.5 4.0 4.9 4.5
Student Majors

Statistical Abstract 163
Academic and Support Programs
Table 86 (continued)
CSU Fall Systemwide Enrollment in Master’s Programs,Percent by Discipline Division, by Ethnicity, from Fall 1984
Pacific Islander
Discipline Division 1984 1985 1986 1987 1988 1989 1990 1991 1992
Undeclared 0.0 1.4 1.2 3.5 4.8 6.5 2.5 1.4 0.0Agriculture 1.3 0.0 2.4 1.2 0.0 0.0 0.0 0.0 0.0Architecture 1.3 1.4 1.2 0.0 0.0 0.0 1.3 1.4 2.1Area Studies 0.0 1.4 1.2 1.2 1.2 1.1 0.0 0.0 0.0Biological Sciences 5.1 2.9 4.9 3.5 3.6 1.1 2.5 1.4 4.1Business 7.7 11.6 17.1 15.3 13.3 9.8 7.6 8.2 13.4Communications 0.0 0.0 0.0 0.0 0.0 1.1 1.3 2.7 3.1Computer Sciences 6.4 2.9 3.7 2.4 2.4 2.2 1.3 4.1 2.1Education 25.6 18.8 24.4 23.5 20.5 25.0 25.3 20.5 20.6Engineering 14.1 18.8 13.4 15.3 13.3 10.9 11.4 11.0 8.2Fine & Applied Arts 2.6 5.8 4.9 3.5 2.4 3.3 2.5 5.5 3.1Foreign Languages 0.0 0.0 0.0 0.0 0.0 0.0 1.3 1.4 0.0Health Professions 9.0 10.1 9.8 10.6 7.2 12.0 10.1 1.4 4.1Home Economics 0.0 0.0 0.0 0.0 4.8 2.2 1.3 2.7 2.1Letters 1.3 4.3 2.4 2.4 2.4 5.4 6.3 4.1 5.2Library Science 0.0 1.4 0.0 1.2 1.2 0.0 0.0 0.0 0.0Mathematics 0.0 1.4 2.4 1.2 0.0 1.1 0.0 0.0 2.1Physical Sciences 6.4 4.3 3.7 2.4 1.2 2.2 1.3 1.4 0.0Psychology 2.6 1.4 2.4 4.7 6.0 3.3 1.3 5.5 6.2Public Affairs 14.1 8.7 4.9 8.2 12.0 7.6 15.2 19.2 14.4Social Sciences 2.6 2.9 0.0 0.0 2.4 4.3 7.6 5.5 6.2Interdisciplinary Studies 0.0 0.0 0.0 0.0 1.2 1.1 0.0 2.7 3.1Total, All Programs 100.0 100.0 100.0 100.0 100.0 100.0 100.0 100.0 100.0
White Non-Latino
Discipline Division 1984 1985 1986 1987 1988 1989 1990 1991 1992
Undeclared 2.0 1.7 2.3 2.1 2.5 2.4 2.1 0.9 0.8Agriculture 0.9 0.8 0.7 0.7 0.7 0.7 0.7 0.6 0.7Architecture 0.6 0.7 0.9 0.8 0.9 0.8 0.8 0.7 0.8Area Studies 0.2
0.20.2
0.20.2
0.20.2
0.2 0.3Biological Sciences 2.6 2.4 2.2 2.2 2.0 2.0 2.0 1.9 2.1Business 18.5 18.6 17.4 17.0 16.1 15.9 16.0 15.3 14.6Communications 1.1 1.1 1.1 1.2 1.1 1.0 1.1 1.1 1.1Computer Sciences 3.0 2.9 2.7 2.4 2.2 1.6 1.9 2.2 2.3Education 26.1 25.5 26.7 27.4 27.4 27.2 26.3 25.5 25.5Engineering 4.3 4.6 5.0 4.8 5.1 5.2 5.2 5.2 5.2Fine & Applied Arts 4.0 4.2 4.0 3.9 3.8 3.9 3.8 3.8 3.7Foreign Languages 0.5 0.6 0.7 0.6 0.6 0.6 0.6 0.6 0.6Health Professions 7.3 7.3 7.1 6.9 7.0 7.2 7.2 7.6 7.7Home Economics 1.3 1.3 1.2 1.1 1.0 0.8 0.9 1.8 1.8Letters 6.0 6.2 6.0 6.4 6.5 7.1 7.7 8.4 8.5Library Science 0.4 0.6 0.7 0.7 0.8 0.8 0.7 0.9 0.9Mathematics 0.8 1.0 1.1 1.2 1.2 1.2 1.2 1.1 1.2Physical Sciences 2.1 2.0 1.9 1.8 1.9 1.8 1.4 1.5 1.4
Student Majors

164
Academic and Support Programs
Table 86 (continued)
CSU Fall Systemwide Enrollment in Master’s Programs,Percent by Discipline Division, by Ethnicity from Fall 1984
All Groups
Discipline Division 1984 1985 1986 1987 1988 1989 1990 1991 1992
Undeclared 2.4 1.8 2.6 2.3 2.4 2.8 2.1 0.9 0.8Agriculture 0.8 0.7 0.6 0.6 0.6 0.6 0.7 0.7 0.6Architecture 0.6 0.8 0.9 0.8 0.9 0.8 0.8 0.7 0.8Area Studies 0.3 0.2 0.2 0.2 0.2 0.2 0.2 0.2 0.3Biological Sciences 2.5 2.4 2.1 2.0 1.9 2.0 2.0 1.8 2.0Business 17.3 17.9 17.3 17.2 16.6 16.2 16.9 16.2 15.6Communications 1.0 1.1 1.1 1.2 1.1 1.0 1.1 1.1 1.1Computer Sciences 4.1 3.9 3.9 3.7 3.3 2.2 2.9 3.5 3.5Education 24.2 23.6 24.4 25.1 24.8 24.7 23.4 22.7 23.0Engineering 7.2 7.4 7.5 7.2 7.5 8.0 7.8 7.9 8.0Fine & Applied Arts 3.9 4.1 3.9 3.8 3.7 3.7 3.6 3.6 3.5Foreign Languages 0.7 0.8 0.8 0.7 0.7 0.8 0.8 0.9 0.8Health Professions 6.5 6.6 6.5 6.3 6.4 6.6 6.7 7.0 6.8Home Economics 1.2 1.2 1.1 1.0 0.9 0.8 0.9 1.6 1.6Letters 5.5 5.7 5.5 5.7 6.0 6.7 7.1 7.7 7.8Library Science 0.4 0.5 0.5 0.6 0.7 0.7 0.6 0.8 0.8Mathematics 0.9 1.2 1.3 1.4 1.3 1.3 1.3 1.2 1.3Physical Sciences 2.2 2.3 2.2 2.1 2.2 2.1 1.7 1.7 1.6Psychology 5.0 4.5 3.9 3.7 3.9 3.9 3.7 3.7 3.5Public Affairs 7.7 8.3 8.2 8.8 8.7 8.5 8.9 8.8 8.9Social Sciences 4.5 4.3 4.3 4.5 4.8 5.2 5.6 5.8 5.9Interdisciplinary Studies 1.1 1.1 1.2 1.1 1.3 1.3 1.4 1.6 1.8Total, All Programs 100.0 100.0 100.0 100.0 100.0 100.0 100.0 100.0 100.0
Student Majors

Statistical Abstract 165
Academic and Support Programs
Introduction
During 1991-92, 99,351 students enrolled at CSUcampuses, approximately 27% of the average annualCSU 1991-92 enrollment, received in excess of $384million in student financial aid funds. Student financial aidfunds in the form of scholarships and grants, work-studyemployment, and loans are made available from a varietyof sources including the federal government, stateprograms, CSU and campus programs, and variousoutside agencies and groups.
The biggest state financial aid program for CSU studentsis the State University Grant (SUG) program which wasimplemented in 1982-83 in order to offset the impact of
student fee increases for financially needy students.During 1991-92, 52,798 students, 53.1% of all CSU aidrecipients, received State University Grant funds totalingover $33 million.
The largest source of financial aid for CSU students is thefederal government through its Title IV student aidprograms. These programs include Pell Grants andSupplemental Educational Opportunity Grants (SEOG)for undergraduates, College Work-Study, Perkins Loans,and the various components of the Federal FamilyEducation Loan Program - Stafford, SLS, and Parentloans.
Support Programs - Student Financial Aid
39.4%
35.4%
8.3%
12.4%
2.8% 1.7%
Federal Family Educ. LoanPrograms
Other Federal Aid Programs
Cal Grant/State Graduate Fellowship
CSU Student Aid Programs
CSU Campus Aid Programs
Other Outside Aid Programs
53.3%
3.2%
43.5%
Scholarships/Grants
Work-Study
Loans
Figure 141991-92 Financial Aid Funds by Source and Type
By Source By Type
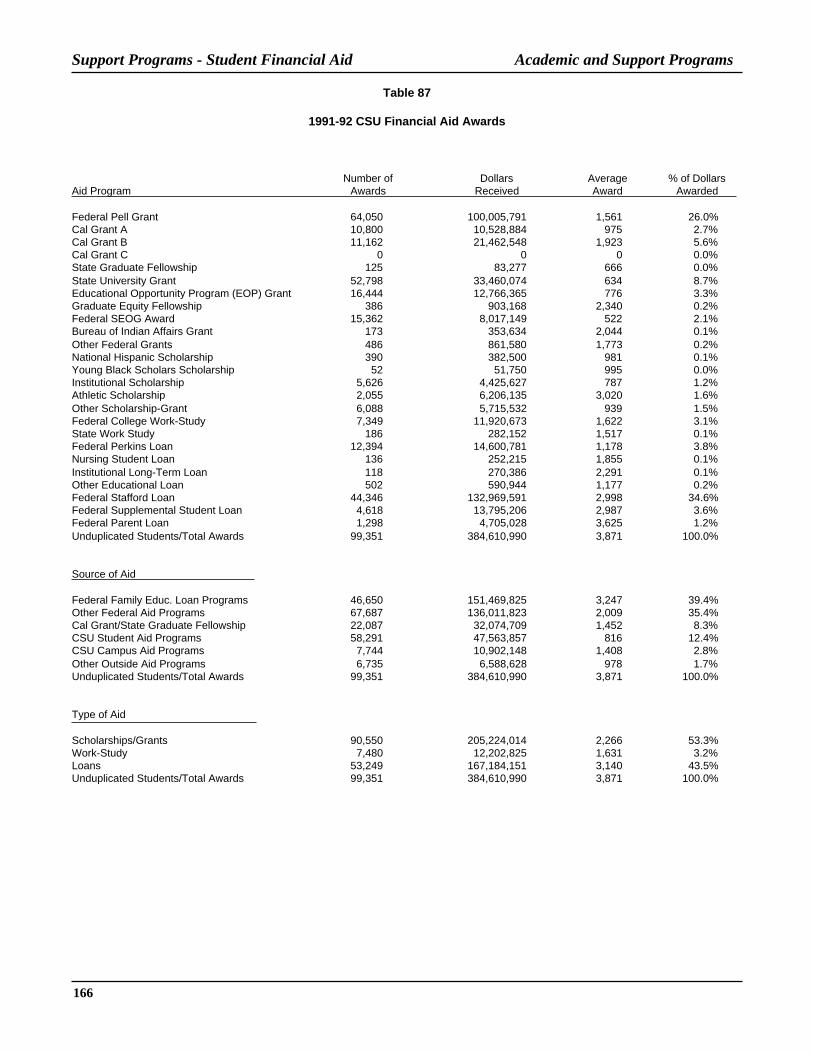
166
Academic and Support Programs
Table 87
1991-92 CSU Financial Aid Awards
Number of Dollars Average % of DollarsAid Program Awards Received Award Awarded
Federal Pell Grant 64,050 100,005,791 1,561 26.0%Cal Grant A 10,800 10,528,884 975 2.7%Cal Grant B 11,162 21,462,548 1,923 5.6%Cal Grant C 0 0 0 0.0%State Graduate Fellowship 125 83,277 666 0.0%State University Grant 52,798 33,460,074 634 8.7%Educational Opportunity Program (EOP) Grant 16,444 12,766,365 776 3.3%Graduate Equity Fellowship 386 903,168 2,340 0.2%Federal SEOG Award 15,362 8,017,149 522 2.1%Bureau of Indian Affairs Grant 173 353,634 2,044 0.1%Other Federal Grants 486 861,580 1,773 0.2%National Hispanic Scholarship 390 382,500 981 0.1%Young Black Scholars Scholarship 52 51,750 995 0.0%Institutional Scholarship 5,626 4,425,627 787 1.2%Athletic Scholarship 2,055 6,206,135 3,020 1.6%Other Scholarship-Grant 6,088 5,715,532 939 1.5%Federal College Work-Study 7,349 11,920,673 1,622 3.1%State Work Study 186 282,152 1,517 0.1%Federal Perkins Loan 12,394 14,600,781 1,178 3.8%Nursing Student Loan 136 252,215 1,855 0.1%Institutional Long-Term Loan 118 270,386 2,291 0.1%Other Educational Loan 502 590,944 1,177 0.2%Federal Stafford Loan 44,346 132,969,591 2,998 34.6%Federal Supplemental Student Loan 4,618 13,795,206 2,987 3.6%Federal Parent Loan 1,298 4,705,028 3,625 1.2%Unduplicated Students/Total Awards 99,351 384,610,990 3,871 100.0%
Source of Aid
Federal Family Educ. Loan Programs 46,650 151,469,825 3,247 39.4%Other Federal Aid Programs 67,687 136,011,823 2,009 35.4%Cal Grant/State Graduate Fellowship 22,087 32,074,709 1,452 8.3%CSU Student Aid Programs 58,291 47,563,857 816 12.4%CSU Campus Aid Programs 7,744 10,902,148 1,408 2.8%Other Outside Aid Programs 6,735 6,588,628 978 1.7%Unduplicated Students/Total Awards 99,351 384,610,990 3,871 100.0%
Type of Aid
Scholarships/Grants 90,550 205,224,014 2,266 53.3%Work-Study 7,480 12,202,825 1,631 3.2%Loans 53,249 167,184,151 3,140 43.5%Unduplicated Students/Total Awards 99,351 384,610,990 3,871 100.0%
Support Programs - Student Financial Aid

Statistical Abstract 167
Academic and Support Programs
Table 88
CSU Financial Aid by Category and Ethnic Group, Number and Ratio to Total
Number
Award Category American African Asian Mexican Other Pacific White TotalYear of Awards Indian American American Filipino American Latino Islander Non-Latino Unknown All Groups
1987/88 SUG 529 4,787 8,135 815 4,825 1,716 175 17,160 2,592 40,7341987/88 Scholarships/Grants 846 6,965 12,730 1,342 7,752 2,665 316 28,675 4,761 66,0521987/88 Work/Study 95 944 2,054 129 934 282 35 2,690 454 7,6171987/88 Loans 452 4,008 4,815 580 3,141 1,187 151 20,603 2,715 37,6521987/88 Total Aid 911 7,372 13,070 1,451 8,160 2,860 335 33,441 5,375 72,975
1988/89 SUG 509 4,442 8,517 968 5,301 1,852 158 17,505 2,720 41,9721988/89 Scholarships/Grants 911 7,113 13,509 1,697 9,013 3,009 324 32,481 5,060 73,1171988/89 Work/Study 71 901 2,003 139 989 293 33 2,539 452 7,4201988/89 Loans 557 4,344 5,183 771 3,727 1,426 171 22,848 3,029 42,0561988/89 Total Aid 986 7,597 13,853 1,853 9,432 3,221 351 37,500 5,637 80,430
1989/90 SUG 445 4,026 5,040 718 4,441 1,565 123 14,181 2,438 32,9771989/90 Scholarships/Grants 969 7,697 14,327 1,974 10,725 3,354 319 34,035 5,932 79,3321989/90 Work/Study 99 996 2,035 171 1,176 319 26 2,784 542 8,1481989/90 Loans 590 4,740 5,185 928 4,303 1,560 175 24,433 3,565 45,4791989/90 Total Aid 1,076 8,259 14,758 2,163 11,254 3,591 352 39,764 6,744 87,961
1990/91 SUG 582 5,038 6,305 1,000 5,521 1,886 176 18,093 3,511 42,1121990/91 Scholarships/Grants 1,048 8,332 15,276 2,238 12,019 3,584 355 35,650 7,720 86,2221990/91 Work/Study 102 961 2,172 184 1,209 328 28 2,521 575 8,0801990/91 Loans 664 5,055 5,613 1,119 5,106 1,712 210 25,427 4,395 49,3011990/91 Total Aid 1,136 8,923 15,740 2,461 12,711 3,833 395 41,396 8,676 95,271
1991/92 SUG 723 5,989 7,962 1,268 7,822 2,520 198 21,674 4,642 52,7981991/92 Scholarships/Grants 1,099 8,737 16,139 2,389 13,948 4,127 350 35,600 8,161 90,5501991/92 Work/Study 92 1,011 1,886 158 1,360 336 25 2,081 531 7,4801991/92 Loans 742 5,613 5,867 1,354 6,166 2,077 221 26,224 4,985 53,2491991/92 Total Aid 1,205 9,415 16,630 2,653 14,629 4,420 387 40,855 9,157 99,351
Percent of Total Aid Recipients
1987/88 SUG 58.1 64.9 62.2 56.2 59.1 60.0 52.2 51.3 48.2 55.81987/88 Scholarships/Grants 92.9 94.5 97.4 92.5 95.0 93.2 94.3 85.7 88.6 90.51987/88 Work/Study 10.4 12.8 15.7 8.9 11.4 9.9 10.4 8.0 8.4 10.41987/88 Loans 49.6 54.4 36.8 40.0 38.5 41.5 45.1 61.6 50.5 51.6
1988/89 SUG 51.6 58.5 61.5 52.2 56.2 57.5 45.0 46.7 48.3 52.21988/89 Scholarships/Grants 92.4 93.6 97.5 91.6 95.6 93.4 92.3 86.6 89.8 90.91988/89 Work/Study 7.2 11.9 14.5 7.5 10.5 9.1 9.4 6.8 8.0 9.21988/89 Loans 56.5 57.2 37.4 41.6 39.5 44.3 48.7 60.9 53.7 52.3
1989/90 SUG 41.4 48.7 34.2 33.2 39.5 43.6 34.9 35.7 36.2 37.51989/90 Scholarships/Grants 90.1 93.2 97.1 91.3 95.3 93.4 90.6 85.6 88.0 90.21989/90 Work/Study 9.2 12.1 13.8 7.9 10.4 8.9 7.4 7.0 8.0 9.31989/90 Loans 54.8 57.4 35.1 42.9 38.2 43.4 49.7 61.4 52.9 51.7
1990/91 SUG 51.2 56.5 40.1 40.6 43.4 49.2 44.6 43.7 40.5 44.21990/91 Scholarships/Grants 92.3 93.4 97.1 90.9 94.6 93.5 89.9 86.1 89.0 90.51990/91 Work/Study 9.0 10.8 13.8 7.5 9.5 8.6 7.1 6.1 6.6 8.51990/91 Loans 58.5 56.7 35.7 45.5 40.2 44.7 53.2 61.4 50.7 51.7
1991/92 SUG 60.0 63.6 47.9 47.8 53.5 57.0 51.2 53.1 50.7 53.11991/92 Scholarships/Grants 91.2 92.8 97.0 90.0 95.3 93.4 90.4 87.1 89.1 91.11991/92 Work/Study 7.6 10.7 11.3 6.0 9.3 7.6 6.5 5.1 5.8 7.51991/92 Loans 61.6 59.6 35.3 51.0 42.1 47.0 57.1 64.2 54.4 53.6
Note: Numbers under Total Aid represent the unduplicated students, i.e. if a student receives more than one grant award the student is counted only once as agrant recipient.
Support Programs - Student Financial Aid

168
Academic and Support Programs
Table 89
CSU Financial Aid By Category and Ethnic Group, Dollars and Ratio to Total
Dollars
Award Category American African Asian Mexican Other Pacific White TotalYear of Awards Indian American American Filipino American Latino Islander Non-Latino Unknown All Groups
1987/88 SUG 197,380 1,799,027 3,100,274 308,394 1,828,595 656,346 65,026 6,378,443 965,470 15,298,9551987/88 Scholarships/Grants 1,747,029 15,563,149 28,662,503 1,997,307 16,734,152 5,302,195 625,891 41,206,243 7,305,805 119,144,2741987/88 Work/Study 126,911 1,220,851 3,291,551 175,883 1,307,612 405,553 49,424 3,674,401 653,981 10,906,1671987/88 Loans 1,191,219 9,284,010 9,466,208 1,180,285 6,530,629 2,745,903 363,458 55,821,496 7,292,764 93,875,9721987/88 Total Aid 3,065,159 26,068,010 41,420,262 3,353,475 24,572,393 8,453,651 1,038,773 100,702,140 15,252,550 223,926,413
1988/89 SUG 208,794 1,862,573 3,583,028 411,435 2,253,949 774,322 67,249 7,352,292 1,121,951 17,635,5931988/89 Scholarships/Grants 2,047,634 16,857,633 31,436,730 2,741,678 20,968,173 6,220,270 727,800 51,488,111 8,409,659 140,897,6881988/89 Work/Study 78,097 1,209,054 3,075,818 181,852 1,374,497 405,580 49,000 3,652,518 632,334 10,658,7501988/89 Loans 1,511,320 10,963,026 11,826,306 1,796,255 8,271,598 3,592,996 461,725 67,227,033 8,890,818 114,541,0771988/89 Total Aid 3,637,051 29,029,713 46,338,854 4,719,785 30,614,268 10,218,846 1,238,525 122,367,662 17,932,811 266,097,515
1989/90 SUG 192,267 1,756,160 2,193,486 316,964 1,969,846 689,802 53,098 6,148,007 1,046,419 14,366,0491989/90 Scholarships/Grants 2,255,254 18,571,823 35,919,704 3,432,223 26,219,422 7,278,616 736,433 56,190,926 10,465,273 161,069,6741989/90 Work/Study 112,373 1,313,518 3,400,913 245,306 1,637,328 453,623 32,798 3,912,021 767,194 11,875,0741989/90 Loans 1,718,267 12,564,190 12,449,672 2,326,822 10,111,108 4,130,500 503,374 75,474,099 10,871,565 130,149,5971989/90 Total Aid 4,085,894 32,449,531 51,770,289 6,004,351 37,967,858 11,862,739 1,272,605 135,577,046 22,104,032 303,094,345
1990/91 SUG 287,373 2,533,315 3,163,177 510,933 2,805,354 942,153 87,504 8,967,102 1,697,120 20,994,0311990/91 Scholarships/Grants 2,590,670 20,777,179 38,813,532 3,906,748 29,592,476 7,795,989 831,738 59,006,199 13,117,170 176,431,7011990/91 Work/Study 110,030 1,402,365 3,679,680 282,514 1,825,955 486,064 38,647 3,971,627 883,875 12,680,7571990/91 Loans 1,943,466 14,108,089 13,720,596 3,107,664 12,591,297 4,789,861 615,196 82,218,522 14,007,207 147,101,8981990/91 Total Aid 4,644,166 36,287,633 56,213,808 7,296,926 44,009,728 13,071,914 1,485,581 145,196,348 28,008,252 336,214,356
1991/92 SUG 453,390 3,815,908 5,088,092 814,317 5,068,567 1,623,057 127,004 13,598,632 2,871,107 33,460,0741991/92 Scholarships/Grants
2,852,05523,839,812
45,481,1584,636,253
37,236,3479,918,534
896,138 64,866,756 15,496,961 205,224,0141991/92 Work/Study 107,126 1,564,766 3,367,727 255,292 2,121,573 519,723 42,075 3,360,313 864,230 12,202,8251991/92 Loans 2,259,572 16,638,341 15,093,401 3,893,362 15,904,358 6,179,572 661,377 89,580,424 16,973,744 167,184,1511991/92 Total Aid 5,218,753 42,042,919 63,942,286 8,784,907 55,262,278 16,617,829 1,599,590 157,807,493 33,334,935 384,610,990
Percent of Total Dollars Awarded
1987/88 SUG 6.4 6.9 7.5 9.2 7.4 7.8 6.3 6.3 6.3 6.81987/88 Scholarships/Grants 57.0 59.7 69.2 59.6 68.1 62.7 60.3 40.9 47.9 53.21987/88 Work/Study 4.1 4.7 7.9 5.2 5.3 4.8 4.8 3.6 4.3 4.91987/88 Loans 38.9 35.6 22.9 35.2 26.6 32.5 35.0 55.4 47.8 41.9
1988/89 SUG 5.7 6.4 7.7 8.7 7.4 7.6 5.4 6.0 6.3 6.61988/89 Scholarships/Grants 56.3 58.1 67.8 58.1 68.5 60.9 58.8 42.1 46.9 52.91988/89 Work/Study 2.1 4.2 6.6 3.9 4.5 4.0 4.0 3.0 3.5 4.01988/89 Loans 41.6 37.8 25.5 38.1 27.0 35.2 37.3 54.9 49.6 43.0
1989/90 SUG 4.7 5.4 4.2 5.3 5.2 5.8 4.2 4.5 4.7 4.71989/90 Scholarships/Grants 55.2 57.2 69.4 57.2 69.1 61.4 57.9 41.4 47.3 53.11989/90 Work/Study 2.8 4.0 6.6 4.1 4.3 3.8 2.6 2.9 3.5 3.91989/90 Loans 42.1 38.7 24.0 38.8 26.6 34.8 39.6 55.7 49.2 42.9
1990/91 SUG 6.2 7.0 5.6 7.0 6.4 7.2 5.9 6.2 6.1 6.21990/91 Scholarships/Grants 55.8 57.3 69.0 53.5 67.2 59.6 56.0 40.6 46.8 52.51990/91 Work/Study 2.4 3.9 6.5 3.9 4.1 3.7 2.6 2.7 3.2 3.81990/91 Loans 41.8 38.9 24.4 42.6 28.6 36.6 41.4 56.6 50.0 43.8
1991/92 SUG 8.7 9.1 8.0 9.3 9.2 9.8 7.9 8.6 8.6 8.71991/92 Scholarships/Grants 54.7 56.7 71.1 52.8 67.4 59.7 56.0 41.1 46.5 53.41991/92 Work/Study 2.1 3.7 5.3 2.9 3.8 3.1 2.6 2.1 2.6 3.2
Support Programs - Student Financial Aid

Statistical Abstract 169
Academic and Support Programs
Table 90
CSU Financial Aid by Category and Dependent Students’ Parent Income Group, Number and Ratio to Total
Number
Award Category $12,000 $12,001- $24,001- $36,001- $48,001- $60,001- $72,001- $84,001- OverYear of Awards and Under $24,000 $36,000 $48,000 $60,000 $72,000 $84,000 $96,000 $96,000 Total
1987/88 SUG 6,108 6,654 3,465 1,093 216 46 9 4 1 17,5961987/88 Scholarships/Grants 10,552 10,076 5,138 1,793 464 106 35 22 4 28,1901987/88 Work/Study 1,225 1,380 619 144 27 5 1 0 0 3,4011987/88 Loans 3,188 3,900 2,758 1,232 332 99 21 16 1 11,5471987/88 Total Aid 10,743 10,430 5,700 2,226 641 163 49 33 5 29,990
1988/89 SUG 5,630 6,401 3,541 1,218 295 71 11 7 3 17,1771988/89 Scholarships/Grants 9,963 10,586 6,048 2,320 681 218 58 24 17 29,9151988/89 Work/Study 1,211 1,404 648 193 34 11 2 2 0 3,5051988/89 Loans 3,245 4,027 2,950 1,390 462 170 72 17 13 12,3461988/89 Total Aid 10,225 10,922 6,610 2,819 926 322 117 35 25 32,001
1989/90 SUG 3,467 3,886 2,216 837 262 66 27 4 0 10,7651989/90 Scholarships/Grants 11,547 10,898 6,460 2,686 856 246 99 43 29 32,8641989/90 Work/Study 1,356 1,495 794 256 54 17 5 1 0 3,9781989/90 Loans 3,479 3,948 3,141 1,548 554 233 73 27 11 13,0141989/90 Total Aid 11,880 11,240 7,132 3,285 1,131 415 153 64 37 35,337
1990/91 SUG 4,016 4,925 2,938 1,182 382 133 53 15 2 13,6461990/91 Scholarships/Grants 10,237 12,002 7,012 3,295 1,145 403 198 82 41 34,4151990/91 Work/Study 1,321 1,628 767 263 58 15 8 2 0 4,0621990/91 Loans 3,140 4,301 3,367 1,974 851 368 221 89 55 14,3661990/91 Total Aid 10,377 12,305 7,632 4,025 1,585 658 362 149 89 37,182
1991/92 SUG 5,398 6,207 3,771 1,446 553 145 33 9 19 17,5811991/92 Scholarships/Grants 12,144 12,174 7,296 3,177 1,439 430 158 56 94 36,9681991/92 Work/Study 1,406 1,416 728 234 77 16 5 0 4 3,8861991/92 Loans 3,697 4,648 3,736 1,959 1,083 423 204 81 113 15,9441991/92 Total Aid 12,315 12,452 7,869 3,771 1,956 703 319 131 185 39,701
Percent of Total Aid Recipients
1987/88 SUG 56.9 63.8 60.8 49.1 33.7 28.2 18.4 12.1 20.0 58.71987/88 Scholarships/Grants 98.2 96.6 90.1 80.5 72.4 65.0 71.4 66.7 80.0 94.01987/88 Work/Study 11.4 13.2 10.9 6.5 4.2 3.1 2.0 0.0 0.0 11.31987/88 Loans 29.7 37.4 48.4 55.3 51.8 60.7 42.9 48.5 20.0 38.5
1988/89 SUG 55.1 58.6 53.6 43.2 31.9 22.0 9.4 20.0 12.0 53.71988/89 Scholarships/Grants 97.4 96.9 91.5 82.3 73.5 67.7 49.6 68.6 68.0 93.51988/89 Work/Study 11.8 12.9 9.8 6.8 3.7 3.4 1.7 5.7 0.0 11.01988/89 Loans 31.7 36.9 44.6 49.3 49.9 52.8 61.5 48.6 52.0 38.6
1989/90 SUG 29.2 34.6 31.1 25.5 23.2 15.9 17.6 6.3 0.0 30.51989/90 Scholarships/Grants 97.2 97.0 90.6 81.8 75.7 59.3 64.7 67.2 78.4 93.01989/90 Work/Study 11.4 13.3 11.1 7.8 4.8 4.1 3.3 1.6 0.0 11.31989/90 Loans 29.3 35.1 44.0 47.1 49.0 56.1 47.7 42.2 29.7 36.8
1990/91 SUG 38.7 40.0 38.5 29.4 24.1 20.2 14.6 10.1 2.2 36.71990/91 Scholarships/Grants 98.7 97.5 91.9 81.9 72.2 61.2 54.7 55.0 46.1 92.61990/91 Work/Study 12.7 13.2 10.0 6.5 3.7 2.3 2.2 1.3 0.0 10.91990/91 Loans 30.3 35.0 44.1 49.0 53.7 55.9 61.0 59.7 61.8 38.6
1991/92 SUG 43.8 49.8 47.9 38.3 28.3 20.6 10.3 6.9 10.3 44.31991/92 Scholarships/Grants 98.6 97.8 92.7 84.2 73.6 61.2 49.5 42.7 50.8 93.11991/92 Work/Study 11.4 11.4 9.3 6.2 3.9 2.3 1.6 0.0 2.2 9.81991/92 Loans 30.0 37.3 47.5 51.9 55.4 60.2 63.9 61.8 61.1 40.2
Note: Numbers under Total Aid represent the unduplicated students, i.e. if a student receives more than one grant award the student is counted only once as agrant recipient.
Support Programs - Student Financial Aid

170
Academic and Support Programs
Table 91
CSU Financial Aid By Category and Dependent Students’ Parent Income, Dollars and Ratio to Total
Dollars
Award Category $12,000 $12,001- $24,001- $36,001- $48,001- $60,001- $72,001- $84,001- OverYear of Awards and Under $24,000 $36,000 $48,000 $60,000 $72,000 $84,000 $96,000 $96,000 Total
1987/88 SUG 2,360,029 2,554,935 1,329,158 417,756 82,366 17,706 3,475 1,668 417 6,767,5101987/88 Scholarships/Grants 27,080,530 20,525,861 5,902,866 1,501,540 377,376 102,435 62,528 23,636 9,217 55,585,9891987/88 Work/Study 1,597,841 1,842,769 783,718 193,193 40,986 8,256 169 0 0 4,466,9321987/88 Loans 5,756,930 7,410,146 5,502,069 2,479,735 717,081 239,986 68,996 45,128 4,000 22,224,0711987/88 Total Aid 34,435,301 29,778,776 12,188,653 4,174,468 1,135,443 350,677 131,693 68,764 13,217 82,276,992
1988/89 SUG 2,426,493 2,772,826 1,524,799 525,979 128,988 31,602 5,024 3,290 1,164 7,420,1651988/89 Scholarships/Grants 27,022,637 24,607,574 8,661,214 2,343,465 640,370 212,081 67,339 32,407 17,493 63,604,5801988/89 Work/Study 1,549,349 1,854,357 866,811 245,627 38,844 12,899 1,989 2,187 0 4,572,0631988/89 Loans 6,528,350 7,971,475 6,082,220 2,930,356 1,031,252 419,938 208,126 50,793 42,620 25,265,1301988/89 Total Aid 35,100,336 34,433,406 15,610,245 5,519,448 1,710,466 644,918 277,454 85,387 60,113 93,441,773
1989/90 SUG 1,561,603 1,757,789 1,002,953 377,957 122,655 29,879 12,126 2,137 0 4,867,0991989/90 Scholarships/Grants 32,514,831 27,912,743 10,721,197 3,190,674 921,392 294,412 146,045 80,290 39,291 75,820,8751989/90 Work/Study 1,877,768 2,031,500 1,060,062 319,835 65,520 18,789 1,457 3,058 0 5,377,9891989/90 Loans 7,288,275 8,194,430 6,754,857 3,466,184 1,304,323 633,557 200,922 86,372 39,412 27,968,3321989/90 Total Aid 41,680,874 38,138,673 18,536,116 6,976,693 2,291,235 946,758 348,424 169,720 78,703 109,167,196
1990/91 SUG 2,083,761 2,570,596 1,520,107 608,359 199,980 69,748 28,025 8,211 849 7,089,6361990/91 Scholarships/Grants 31,565,940 32,207,041 12,019,921 4,025,943 1,309,629 439,683 249,965 112,336 53,128 81,983,5861990/91 Work/Study 1,897,801 2,347,854 1,131,386 376,369 95,783 19,222 7,662 1,705 0 5,877,7821990/91 Loans 6,566,970 9,449,527 7,714,861 4,753,648 2,230,355 1,091,751 732,570 286,123 188,938 33,014,7431990/91 Total Aid 40,030,711 44,004,422 20,866,168 9,155,960 3,635,767 1,550,656 990,197 400,164 242,066 120,876,111
1991/92 SUG 3,560,703 4,109,527 2,509,163 966,119 370,780 99,895 20,922 6,144 13,317 11,656,5701991/92 Scholarships/Grants
39,611,08035,418,779
14,405,9314,374,771
1,642,792478,941
185,617 75,559 161,911 96,355,3811991/92 Work/Study 2,213,523 2,114,669 1,143,230 338,223 113,647 25,082 5,918 0 6,439 5,960,7311991/92 Loans 8,165,798 10,585,478 8,955,233 4,858,987 2,927,924 1,277,789 675,430 309,346 403,852 38,159,8371991/92 Total Aid 49,990,401 48,118,926 24,504,394 9,571,981 4,684,363 1,781,812 866,965 384,905 572,202 140,475,949
Percent of Total Dollars Awarded
1987/88 SUG 6.9 8.6 10.9 10.0 7.3 5.0 2.6 2.4 3.2 8.21987/88 Scholarships/Grants 78.6 68.9 48.4 36.0 33.2 29.2 47.5 34.4 69.7 67.61987/88 Work/Study 4.6 6.2 6.4 4.6 3.6 2.4 0.1 0.0 0.0 5.41987/88 Loans 16.7 24.9 45.1 59.4 63.2 68.4 52.4 65.6 30.3 27.0
1988/89 SUG 6.9 8.1 9.8 9.5 7.5 4.9 1.8 3.9 1.9 7.91988/89 Scholarships/Grants 77.0 71.5 55.5 42.5 37.4 32.9 24.3 38.0 29.1 68.11988/89 Work/Study 4.4 5.4 5.6 4.5 2.3 2.0 0.7 2.6 0.0 4.91988/89 Loans 18.6 23.2 39.0 53.1 60.3 65.1 75.0 59.5 70.9 27.0
1989/90 SUG 3.7 4.6 5.4 5.4 5.4 3.2 3.5 1.3 0.0 4.51989/90 Scholarships/Grants 78.0 73.2 57.8 45.7 40.2 31.1 41.9 47.3 49.9 69.51989/90 Work/Study 4.5 5.3 5.7 4.6 2.9 2.0 0.4 1.8 0.0 4.91989/90 Loans 17.5 21.5 36.4 49.7 56.9 66.9 57.7 50.9 50.1 25.6
1990/91 SUG 5.2 5.8 7.3 6.6 5.5 4.5 2.8 2.1 0.4 5.91990/91 Scholarships/Grants 78.9 73.2 57.6 44.0 36.0 28.4 25.2 28.1 21.9 67.81990/91 Work/Study 4.7 5.3 5.4 4.1 2.6 1.2 0.8 0.4 0.0 4.91990/91 Loans 16.4 21.5 37.0 51.9 61.3 70.4 74.0 71.5 78.1 27.3
1991/92 SUG 7.1 8.5 10.2 10.1 7.9 5.6 2.4 1.6 2.3 8.31991/92 Scholarships/Grants 79.2 73.6 58.8 45.7 35.1 26.9 21.4 19.6 28.3 68.6
Support Programs - Student Financial Aid

Statistical Abstract 171
Academic and Support ProgramsSupport Programs - Student Financial Aid
Table 92
CSU Financial Aid by Category and Independent Students’ Student Income Group, Number and Ratio to Total
Number
Award Category $3,000 $3,001- $6,001- $9,001- $12,001- $18,001- $24,001- $36,001- OverYear of Awards and Under $6,000 $9,000 $12,000 $18,000 $24,000 $36,000 $48,000 $48,000 Total
1987/88 SUG 10,147 4,249 2,620 1,220 974 318 174 27 8 19,7371987/88 Scholarships/Grants 13,588 5,992 3,611 1,688 1,504 547 312 61 34 27,3371987/88 Work/Study 2,438 574 280 103 65 19 8 7 3 3,4971987/88 Loans 9,822 4,573 2,820 1,454 1,302 586 402 63 35 21,0571987/88 Total Aid 14,832 6,708 4,148 2,104 1,946 826 533 96 54 31,247
1988/89 SUG 7,474 6,003 5,137 2,273 2,070 885 734 168 31 24,7751988/89 Scholarships/Grants 11,705 9,557 8,504 3,305 2,989 1,358 1,115 251 58 38,8421988/89 Work/Study 1,748 979 645 243 175 70 43 6 2 3,9111988/89 Loans 7,748 6,810 5,938 3,207 2,844 1,280 1,261 418 106 29,6121988/89 Total Aid 12,412 10,180 9,125 4,332 3,955 1,746 1,605 512 134 44,001
1989/90 SUG 5,780 4,993 4,688 2,439 2,184 883 946 242 57 22,2121989/90 Scholarships/Grants 11,521 9,653 9,570 4,337 3,615 1,623 1,691 428 98 42,5361989/90 Work/Study 1,598 1,034 745 332 262 110 70 14 5 4,1701989/90 Loans 7,295 6,915 6,440 3,909 3,605 1,675 1,711 630 187 32,3671989/90 Total Aid 12,143 10,342 10,245 5,432 4,944 2,227 2,285 777 227 48,622
1990/91 SUG 6,300 6,373 5,990 3,331 2,997 1,371 1,405 421 138 28,3261990/91 Scholarships/Grants 10,444 10,216 10,089 5,127 4,376 2,056 2,149 653 212 45,3221990/91 Work/Study 1,464 968 741 337 272 125 72 16 4 3,9991990/91 Loans 6,984 7,164 6,736 4,422 4,087 1,912 2,061 791 304 34,4611990/91 Total Aid 11,036 10,796 10,652 6,137 5,695 2,683 2,814 1,028 397 51,238
1991/92 SUG 7,579 7,572 7,386 4,116 3,940 1,567 1,892 736 306 35,0941991/92 Scholarships/Grants 10,674 10,444 10,980 5,868 5,005 2,165 2,576 993 421 49,1261991/92 Work/Study 1,321 822 665 312 240 97 86 28 14 3,5851991/92 Loans 7,188 7,224 7,232 4,678 4,624 2,077 2,301 1,025 567 36,9161991/92 Total Aid 11,168 10,924 11,500 6,691 6,380 2,905 3,226 1,379 721 54,894
Percent of Total Aid Recipients
1987/88 SUG 68.4 63.3 63.2 58.0 50.1 38.5 32.6 28.1 14.8 63.21987/88 Scholarships/Grants 91.6 89.3 87.1 80.2 77.3 66.2 58.5 63.5 63.0 87.51987/88 Work/Study 16.4 8.6 6.8 4.9 3.3 2.3 1.5 7.3 5.6 11.21987/88 Loans 66.2 68.2 68.0 69.1 66.9 70.9 75.4 65.6 64.8 67.4
1988/89 SUG 60.2 59.0 56.3 52.5 52.3 50.7 45.7 32.8 23.1 56.31988/89 Scholarships/Grants 94.3 93.9 93.2 76.3 75.6 77.8 69.5 49.0 43.3 88.31988/89 Work/Study 14.1 9.6 7.1 5.6 4.4 4.0 2.7 1.2 1.5 8.91988/89 Loans 62.4 66.9 65.1 74.0 71.9 73.3 78.6 81.6 79.1 67.3
1989/90 SUG 47.6 48.3 45.8 44.9 44.2 39.6 41.4 31.1 25.1 45.71989/90 Scholarships/Grants 94.9 93.3 93.4 79.8 73.1 72.9 74.0 55.1 43.2 87.51989/90 Work/Study 13.2 10.0 7.3 6.1 5.3 4.9 3.1 1.8 2.2 8.61989/90 Loans 60.1 66.9 62.9 72.0 72.9 75.2 74.9 81.1 82.4 66.6
1990/91 SUG 57.1 59.0 56.2 54.3 52.6 51.1 49.9 41.0 34.8 55.31990/91 Scholarships/Grants 94.6 94.6 94.7 83.5 76.8 76.6 76.4 63.5 53.4 88.51990/91 Work/Study 13.3 9.0 7.0 5.5 4.8 4.7 2.6 1.6 1.0 7.81990/91 Loans 63.3 66.4 63.2 72.1 71.8 71.3 73.2 76.9 76.6 67.3
1991/92 SUG 67.9 69.3 64.2 61.5 61.8 53.9 58.6 53.4 42.4 63.91991/92 Scholarships/Grants 95.6 95.6 95.5 87.7 78.4 74.5 79.9 72.0 58.4 89.51991/92 Work/Study 11.8 7.5 5.8 4.7 3.8 3.3 2.7 2.0 1.9 6.51991/92 Loans 64.4 66.1 62.9 69.9 72.5 71.5 71.3 74.3 78.6 67.2
Note: Numbers under Total Aid represent the unduplicated students, i.e. if a student receives more than one grant award the student is counted only once as agrant recipient.

172
Academic and Support ProgramsSupport Programs - Student Financial Aid
Table 93
CSU Financial Aid By Category and Independent Students’ Student Income, Dollars and Ratio to Total
Dollars
Award Category $3,000 $3,001- $6,001- $9,001- $12,001- $18,001- $24,001- $36,001- OverYear of Awards and Under $6,000 $9,000 $12,000 $18,000 $24,000 $36,000 $48,000 $48,000 Total
1987/88 SUG 3,752,185 1,573,973 962,889 448,625 355,516 114,898 62,089 9,701 2,988 7,282,8641987/88 Scholarships/Grants 25,924,815 10,035,126 5,387,766 2,329,274 1,806,228 589,516 302,551 67,233 46,178 46,488,6871987/88 Work/Study 3,872,510 845,333 388,579 118,121 99,765 30,462 13,609 10,647 7,364 5,386,3901987/88 Loans 27,524,238 12,842,774 7,721,046 3,992,679 3,571,213 1,719,974 1,237,846 189,370 102,958 58,902,0981987/88 Total Aid 57,321,563 23,723,233 13,497,371 6,440,074 5,477,206 2,339,952 1,554,006 267,250 156,500 110,777,175
1988/89 SUG 3,095,454 2,494,530 2,124,049 928,511 833,002 358,033 296,289 66,579 11,357 10,207,8041988/89 Scholarships/Grants 24,799,221 19,020,001 14,847,749 4,798,785 4,357,995 1,891,838 1,110,671 238,904 61,834 71,126,9981988/89 Work/Study 2,761,139 1,514,601 1,015,150 342,020 279,645 98,588 62,188 3,253 1,442 6,078,0261988/89 Loans 22,391,140 20,400,683 17,345,417 9,380,558 8,697,737 4,573,304 4,505,032 1,321,775 350,991 88,966,6371988/89 Total Aid 49,951,500 40,935,285 33,208,316 14,521,363 13,335,377 6,563,730 5,677,891 1,563,932 414,267 166,171,661
1989/90 SUG 2,477,258 2,162,064 2,019,237 1,035,174 920,457 371,558 391,070 98,720 23,412 9,498,9501989/90 Scholarships/Grants 25,103,315 20,314,149 18,020,224 6,264,615 5,461,881 2,371,205 1,739,111 367,864 72,709 79,715,0731989/90 Work/Study 2,598,310 1,543,500 1,160,945 487,884 410,714 181,930 97,338 13,360 3,104 6,497,0851989/90 Loans 22,082,499 21,227,242 19,640,758 12,335,654 11,607,569 6,011,525 6,268,809 1,997,674 648,120 101,819,8501989/90 Total Aid 49,784,124 43,084,891 38,821,927 19,088,153 17,480,164 8,564,660 8,105,258 2,378,898 723,933 188,032,008
1990/91 SUG 3,104,487 3,149,370 2,933,597 1,635,290 1,450,379 641,998 665,159 197,608 65,635 13,843,5231990/91 Scholarships/Grants 24,074,983 22,017,471 19,569,359 7,282,756 6,372,538 2,865,941 2,306,983 513,803 188,909 85,192,7431990/91 Work/Study 2,544,920 1,642,425 1,262,893 525,630 457,842 196,082 116,471 24,937 5,411 6,776,6111990/91 Loans 22,282,792 23,163,936 21,328,887 14,257,857 12,986,299 7,111,692 7,628,301 2,701,507 1,030,575 112,491,8461990/91 Total Aid 48,902,695 46,823,832 42,161,139 22,066,243 19,816,679 10,173,715 10,051,755 3,240,247 1,224,895 204,461,200
1991/92 SUG 4,764,931 4,754,598 4,574,156 2,546,183 2,418,394 928,546 1,132,350 442,985 180,452 21,742,5951991/92 Scholarships/Grants
27,846,06324,994,258
24,112,3149,320,650
7,717,0153,432,812 3,158,542 938,150 435,006 101,954,810
1991/92 Work/Study 2,400,548 1,368,439 1,111,124 542,424 417,935 186,839 127,392 54,231 23,151 6,232,0831991/92 Loans 23,876,267 24,884,489 24,157,145 16,155,878 16,214,863 8,164,653 8,949,251 3,819,245 2,061,604 128,283,3951991/92 Total Aid 54,122,878 51,247,186 49,380,583 26,018,952 24,349,813 11,784,304 12,235,185 4,811,626 2,519,761 236,470,288
Percent of Total Dollars Awarded
1987/88 SUG 6.5 6.6 7.1 7.0 6.5 4.9 4.0 3.6 1.9 6.61987/88 Scholarships/Grants 45.2 42.3 39.9 36.2 33.0 25.2 19.5 25.2 29.5 42.01987/88 Work/Study 6.8 3.6 2.9 1.8 1.8 1.3 0.9 4.0 4.7 4.91987/88 Loans 48.0 54.1 57.2 62.0 65.2 73.5 79.7 70.9 65.8 53.2
1988/89 SUG 6.2 6.1 6.4 6.4 6.2 5.5 5.2 4.3 2.7 6.11988/89 Scholarships/Grants 49.6 46.5 44.7 33.0 32.7 28.8 19.6 15.3 14.9 42.81988/89 Work/Study 5.5 3.7 3.1 2.4 2.1 1.5 1.1 0.2 0.3 3.71988/89 Loans 44.8 49.8 52.2 64.6 65.2 69.7 79.3 84.5 84.7 53.5
1989/90 SUG 5.0 5.0 5.2 5.4 5.3 4.3 4.8 4.1 3.2 5.11989/90 Scholarships/Grants 50.4 47.1 46.4 32.8 31.2 27.7 21.5 15.5 10.0 42.41989/90 Work/Study 5.2 3.6 3.0 2.6 2.3 2.1 1.2 0.6 0.4 3.51989/90 Loans 44.4 49.3 50.6 64.6 66.4 70.2 77.3 84.0 89.5 54.2
1990/91 SUG 6.3 6.7 7.0 7.4 7.3 6.3 6.6 6.1 5.4 6.81990/91 Scholarships/Grants 49.2 47.0 46.4 33.0 32.2 28.2 23.0 15.9 15.4 41.71990/91 Work/Study 5.2 3.5 3.0 2.4 2.3 1.9 1.2 0.8 0.4 3.31990/91 Loans 45.6 49.5 50.6 64.6 65.5 69.9 75.9 83.4 84.1 55.0
1991/92 SUG 8.8 9.3 9.3 9.8 9.9 7.9 9.3 9.2 7.2 9.21991/92 Scholarships/Grants 51.4 48.8 48.8 35.8 31.7 29.1 25.8 19.5 17.3 43.11991/92 Work/Study 4.4 2.7 2.3 2.1 1.7 1.6 1.0 1.1 0.9 2.6

Statistical Abstract 173
Academic and Support ProgramsSupport Programs - Student Financial Aid
Table 94
CSU 1991-92 State University Grant Recipients by Ethnic Group, Number and Ratio to Total
Number
American African Asian Mexican Other Pacific White TotalCampus Indian American American Filipino American Latino Islander Non-Latino Unknown All Groups
Bakersfield 21 97 15 24 193 30 1 337 80 798Chico 101 228 117 24 378 84 12 2,682 257 3,883Dominguez Hills 9 613 88 31 213 90 4 246 135 1,429Fresno 47 239 274 38 949 73 13 1,082 191 2,906Fullerton 20 162 607 46 364 125 11 864 184 2,383Hayward 17 347 357 62 92 55 6 546 159 1,641Humboldt 94 81 41 7 116 53 7 1,383 244 2,026Long Beach 33 525 776 123 530 190 15 1,299 249 3,740Los Angeles 13 459 754 77 1,073 380 4 343 239 3,342Northridge 25 640 565 59 580 265 10 974 284 3,402Pomona 15 136 868 74 395 115 10 439 131 2,183Sacramento 73 389 370 89 414 99 15 1,708 302 3,459San Bernardino 18 248 83 16 257 58 6 719 123 1,528San Diego 77 512 462 155 874 221 26 3,050 527 5,904San Francisco 51 611 986 195 200 271 13 1,772 653 4,752San Jose 26 346 1,104 130 416 145 21 1,129 300 3,617San Luis Obispo 39 152 346 89 510 171 13 1,502 230 3,052San Marcos 1 11 7 5 16 9 0 172 24 245Sonoma 20 117 44 12 80 49 6 783 178 1,289Stanislaus 23 76 98 12 172 37 5 644 152 1,219Total 723 5,989 7,962 1,268 7,822 2,520 198 21,674 4,642 52,798
Percent
Bakersfield 2.6 12.2 1.9 3.0 24.2 3.8 0.1 42.2 10.0 100.0Chico 2.6 5.9 3.0 0.6 9.7 2.2 0.3 69.1 6.6 100.0Dominguez Hills 0.6 42.9 6.2 2.2 14.9 6.3 0.3 17.2 9.4 100.0Fresno 1.6 8.2 9.4 1.3 32.7 2.5 0.4 37.2 6.6 100.0Fullerton 0.8 6.8 25.5 1.9 15.3 5.2 0.5 36.3 7.7 100.0Hayward 1.0 21.1 21.8 3.8 5.6 3.4 0.4 33.3 9.7 100.0Humboldt 4.6 4.0 2.0 0.3 5.7 2.6 0.3 68.3 12.0 100.0Long Beach 0.9 14.0 20.7 3.3 14.2 5.1 0.4 34.7 6.7 100.0Los Angeles 0.4 13.7 22.6 2.3 32.1 11.4 0.1 10.3 7.2 100.0Northridge 0.7 18.8 16.6 1.7 17.0 7.8 0.3 28.6 8.3 100.0Pomona 0.7 6.2 39.8 3.4 18.1 5.3 0.5 20.1 6.0 100.0Sacramento 2.1 11.2 10.7 2.6 12.0 2.9 0.4 49.4 8.7 100.0San Bernardino 1.2 16.2 5.4 1.0 16.8 3.8 0.4 47.1 8.1 100.0San Diego 1.3 8.7 7.8 2.6 14.8 3.7 0.4 51.7 8.9 100.0San Francisco 1.1 12.9 20.7 4.1 4.2 5.7 0.3 37.3 13.7 100.0San Jose 0.7 9.6 30.5 3.6 11.5 4.0 0.6 31.2 8.3 100.0San Luis Obispo 1.3 5.0 11.3 2.9 16.7 5.6 0.4 49.2 7.5 100.0San Marcos 0.4 4.5 2.9 2.0 6.5 3.7 0.0 70.2 9.8 100.0Sonoma 1.6 9.1 3.4 0.9 6.2 3.8 0.5 60.7 13.8 100.0Stanislaus 1.9 6.2 8.0 1.0 14.1 3.0 0.4 52.8 12.5 100.0Total 1.4 11.3 15.1 2.4 14.8 4.8 0.4 41.1 8.8 100.0

174
Academic and Support ProgramsSupport Programs - Student Financial Aid
Table 95
CSU 1991-92 State University Grant by Ethnic Group, Total Aid Received and Ratio to Total
Dollars
American African Asian Mexican Other Pacific White TotalCampus Indian American American Filipino American Latino Islander Non-Latino Unknown All Groups
Bakersfield 12,945 63,926 9,158 14,317 125,925 21,220 723 215,467 52,215 515,896Chico 62,626 152,604 76,267 15,180 249,054 54,436 7,590 1,725,510 158,711 2,501,978Dominguez Hills 5,785 368,154 52,129 17,972 135,583 54,685 1,807 146,006 83,118 865,239Fresno 30,277 149,753 179,568 23,492 607,408 46,202 8,313 665,289 117,288 1,827,590Fullerton 11,744 105,827 394,565 29,049 234,507 77,834 7,953 541,536 114,493 1,517,508Hayward 11,334 214,788 205,343 40,758 57,078 36,867 3,804 336,382 98,320 1,004,674Humboldt 62,138 55,311 26,760 5,061 78,978 34,112 4,700 905,924 153,589 1,326,573Long Beach 21,060 337,563 496,091 81,039 348,249 124,830 10,123 816,838 155,491 2,391,284Los Angeles 6,834 275,347 473,238 47,121 683,008 237,975 2,651 201,571 146,525 2,074,270Northridge 16,791 428,161 362,892 40,123 385,088 174,000 5,825 601,274 174,742 2,188,896Pomona 10,031 90,907 578,163 52,085 268,907 77,461 6,748 285,609 83,157 1,453,068Sacramento 46,419 250,086 236,809 60,737 267,634 66,640 9,726 1,086,059 187,975 2,212,085San Bernardino 11,327 161,059 55,799 10,845 168,069 37,532 3,374 454,972 77,670 980,647San Diego 45,893 327,374 290,931 96,037 564,322 141,928 16,492 1,889,994 322,521 3,695,492San Francisco 32,327 387,959 627,267 118,272 130,321 175,342 8,315 1,086,526 405,351 2,971,680San Jose 15,342 219,642 707,851 85,671 269,512 90,711 13,786 712,444 185,623 2,300,582San Luis Obispo 25,546 102,089 232,249 60,396 340,661 112,581 8,194 986,035 152,312 2,020,063San Marcos 723 7,755 4,700 3,056 11,370 5,552 0 102,545 14,030 149,731Sonoma 12,455 79,696 29,645 7,918 54,189 33,062 4,338 506,269 112,489 840,061Stanislaus 11,793 37,907 48,667 5,188 88,704 20,087 2,542 332,382 75,487 622,757Total 453,390 3,815,908 5,088,092 814,317 5,068,567 1,623,057 127,004 13,598,632 2,871,107 33,460,074
Percent
Bakersfield 2.5 12.4 1.8 2.8 24.4 4.1 0.1 41.8 10.1 100.0Chico 2.5 6.1 3.0 0.6 10.0 2.2 0.3 69.0 6.3 100.0Dominguez Hills 0.7 42.5 6.0 2.1 15.7 6.3 0.2 16.9 9.6 100.0Fresno 1.7 8.2 9.8 1.3 33.2 2.5 0.5 36.4 6.4 100.0Fullerton 0.8 7.0 26.0 1.9 15.5 5.1 0.5 35.7 7.5 100.0Hayward 1.1 21.4 20.4 4.1 5.7 3.7 0.4 33.5 9.8 100.0Humboldt 4.7 4.2 2.0 0.4 6.0 2.6 0.4 68.3 11.6 100.0Long Beach 0.9 14.1 20.7 3.4 14.6 5.2 0.4 34.2 6.5 100.0Los Angeles 0.3 13.3 22.8 2.3 32.9 11.5 0.1 9.7 7.1 100.0Northridge 0.8 19.6 16.6 1.8 17.6 7.9 0.3 27.5 8.0 100.0Pomona 0.7 6.3 39.8 3.6 18.5 5.3 0.5 19.7 5.7 100.0Sacramento 2.1 11.3 10.7 2.7 12.1 3.0 0.4 49.1 8.5 100.0San Bernardino 1.2 16.4 5.7 1.1 17.1 3.8 0.3 46.4 7.9 100.0San Diego 1.2 8.9 7.9 2.6 15.3 3.8 0.4 51.1 8.7 100.0San Francisco 1.1 13.1 21.1 4.0 4.4 5.9 0.3 36.6 13.6 100.0San Jose 0.7 9.5 30.8 3.7 11.7 3.9 0.6 31.0 8.1 100.0San Luis Obispo 1.3 5.1 11.5 3.0 16.9 5.6 0.4 48.8 7.5 100.0San Marcos 0.5 5.2 3.1 2.0 7.6 3.7 0.0 68.5 9.4 100.0Sonoma 1.5 9.5 3.5 0.9 6.5 3.9 0.5 60.3 13.4 100.0Stanislaus 1.9 6.1 7.8 0.8 14.2 3.2 0.4 53.4 12.1 100.0Total 1.4 11.4 15.2 2.4 15.1 4.9 0.4 40.6 8.6 100.0

Statistical Abstract 175
Academic and Support ProgramsSupport Programs - Student Financial Aid
Table 96
CSU 1991-92 Dependent State University Grant Recipients by Parent Income Group,Number and Ratio to Total
Number
$12,000 $12,001- $24,001- $36,001- $48,001- $60,001- $72,001- $84,001- OverCampus and Under $24,000 $36,000 $48,000 $60,000 $72,000 $84,000 $96,000 $96,000 Total
Bakersfield 95 101 45 17 2 1 0 0 0 261Chico 185 334 320 176 95 23 5 1 1 1,140Dominguez Hills 125 127 58 9 3 1 0 0 0 323Fresno 336 435 181 73 17 2 0 0 0 1,044Fullerton 306 326 180 57 23 7 2 0 1 902Hayward 171 199 92 32 13 6 1 0 0 514Humboldt 86 213 154 63 42 0 0 0 0 558Long Beach 297 546 343 169 72 26 5 1 0 1,459Los Angeles 647 600 314 76 20 4 2 1 1 1,665Northridge 634 599 313 55 12 0 0 0 0 1,613Pomona 409 356 192 80 34 10 1 2 9 1,093Sacramento 191 313 216 92 32 13 4 0 1 862San Bernardino 127 129 70 32 13 2 1 1 0 375San Diego 397 621 408 229 67 24 6 2 4 1,758San Francisco 400 445 238 46 8 1 2 0 0 1,140San Jose 552 264 260 108 49 14 0 0 0 1,247San Luis Obispo 285 395 237 71 27 4 0 0 0 1,019San Marcos 1 4 3 3 2 0 0 0 0 13Sonoma 88 107 90 28 8 3 1 1 2 328Stanislaus 66 93 57 30 14 4 3 0 0 267Total 5,398 6,207 3,771 1,446 553 145 33 9 19 17,581
Percent
Bakersfield 36.4 38.7 17.2 6.5 0.8 0.4 0.0 0.0 0.0 100.0Chico 16.2 29.3 28.1 15.4 8.3 2.0 0.4 0.1 0.1 100.0Dominguez Hills 38.7 39.3 18.0 2.8 0.9 0.3 0.0 0.0 0.0 100.0Fresno 32.2 41.7 17.3 7.0 1.6 0.2 0.0 0.0 0.0 100.0Fullerton 33.9 36.1 20.0 6.3 2.6 0.8 0.2 0.0 0.1 100.0Hayward 33.3 38.7 17.9 6.2 2.5 1.2 0.2 0.0 0.0 100.0Humboldt 15.4 38.2 27.6 11.3 7.5 0.0 0.0 0.0 0.0 100.0Long Beach 20.4 37.4 23.5 11.6 4.9 1.8 0.3 0.1 0.0 100.0Los Angeles 38.9 36.0 18.9 4.6 1.2 0.2 0.1 0.1 0.1 100.0Northridge 39.3 37.1 19.4 3.4 0.7 0.0 0.0 0.0 0.0 100.0Pomona 37.4 32.6 17.6 7.3 3.1 0.9 0.1 0.2 0.8 100.0Sacramento 22.2 36.3 25.1 10.7 3.7 1.5 0.5 0.0 0.1 100.0San Bernardino 33.9 34.4 18.7 8.5 3.5 0.5 0.3 0.3 0.0 100.0San Diego 22.6 35.3 23.2 13.0 3.8 1.4 0.3 0.1 0.2 100.0San Francisco 35.1 39.0 20.9 4.0 0.7 0.1 0.2 0.0 0.0 100.0San Jose 44.3 21.2 20.9 8.7 3.9 1.1 0.0 0.0 0.0 100.0San Luis Obispo 28.0 38.8 23.3 7.0 2.7 0.4 0.0 0.0 0.0 100.0San Marcos 7.7 30.8 23.1 23.1 15.4 0.0 0.0 0.0 0.0 100.0Sonoma 26.8 32.6 27.4 8.5 2.4 0.9 0.3 0.3 0.6 100.0Stanislaus 24.7 34.8 21.3 11.2 5.2 1.5 1.1 0.0 0.0 100.0Total 30.7 35.3 21.4 8.2 3.1 0.8 0.2 0.1 0.1 100.0
Note: Humboldt reported income according to ranges used for federal reporting purposes. The maximum range reported was $45,000 or more.

176
Academic and Support ProgramsSupport Programs - Student Financial Aid
Table 97
CSU 1991-92 Dependent State University Grant Recipients by Parent Income Group,Total Aid Received and Ratio to Total
Dollars
$12,000 $12,001- $24,001- $36,001- $48,001- $60,001- $72,001- $84,001- OverCampus and Under $24,000 $36,000 $48,000 $60,000 $72,000 $84,000 $96,000 $96,000 Total
Bakersfield 62,646 69,767 30,234 11,809 1,446 723 0 0 0 176,625Chico 122,844 222,114 211,122 119,083 64,703 15,707 3,253 723 723 760,272Dominguez Hills 78,902 86,096 38,843 6,146 2,169 361 0 0 0 212,517Fresno 223,713 286,492 119,030 47,054 10,119 1,446 0 0 0 687,854Fullerton 203,095 217,720 117,555 38,212 15,346 4,700 1,085 0 723 598,436Hayward 97,029 122,677 58,854 21,088 8,843 4,338 723 0 0 313,552Humboldt 56,260 143,045 104,837 41,265 28,639 0 0 0 0 374,046Long Beach 194,567 366,576 231,261 114,858 50,414 18,041 3,253 723 0 979,693Los Angeles 419,970 388,253 206,099 48,636 11,568 2,519 964 723 482 1,079,214Northridge 431,642 401,948 212,651 39,041 7,555 0 0 0 0 1,092,837Pomona 277,738 240,202 131,141 54,173 22,522 7,178 402 1,446 6,332 741,134Sacramento 128,536 208,577 144,398 60,867 22,414 9,399 2,892 0 723 577,806San Bernardino 88,173 86,278 47,718 21,931 8,676 1,446 723 723 0 255,668San Diego 263,152 412,971 274,539 156,010 44,135 16,408 4,332 1,083 2,888 1,175,518San Francisco 260,945 286,141 153,575 27,794 4,864 723 1,085 0 0 735,127San Jose 363,362 174,051 172,269 72,094 33,659 10,122 0 0 0 825,557San Luis Obispo 190,980 268,653 160,264 48,165 18,798 2,892 0 0 0 689,752San Marcos 362 2,333 1,808 2,169 1,248 0 0 0 0 7,920Sonoma 59,317 73,400 61,259 18,240 5,784 2,169 723 723 1,446 223,061Stanislaus 37,470 52,233 31,706 17,484 7,878 1,723 1,487 0 0 149,981Total 3,560,703 4,109,527 2,509,163 966,119 370,780 99,895 20,922 6,144 13,317 11,656,570
Percent
Bakersfield 35.5 39.5 17.1 6.7 0.8 0.4 0.0 0.0 0.0 100.0Chico 16.2 29.2 27.8 15.7 8.5 2.1 0.4 0.1 0.1 100.0Dominguez Hills 37.1 40.5 18.3 2.9 1.0 0.2 0.0 0.0 0.0 100.0Fresno 32.5 41.7 17.3 6.8 1.5 0.2 0.0 0.0 0.0 100.0Fullerton 33.9 36.4 19.6 6.4 2.6 0.8 0.2 0.0 0.1 100.0Hayward 30.9 39.1 18.8 6.7 2.8 1.4 0.2 0.0 0.0 100.0Humboldt 15.0 38.2 28.0 11.0 7.7 0.0 0.0 0.0 0.0 100.0Long Beach 19.9 37.4 23.6 11.7 5.1 1.8 0.3 0.1 0.0 100.0Los Angeles 38.9 36.0 19.1 4.5 1.1 0.2 0.1 0.1 0.0 100.0Northridge 39.5 36.8 19.5 3.6 0.7 0.0 0.0 0.0 0.0 100.0Pomona 37.5 32.4 17.7 7.3 3.0 1.0 0.1 0.2 0.9 100.0Sacramento 22.2 36.1 25.0 10.5 3.9 1.6 0.5 0.0 0.1 100.0San Bernardino 34.5 33.7 18.7 8.6 3.4 0.6 0.3 0.3 0.0 100.0San Diego 22.4 35.1 23.4 13.3 3.8 1.4 0.4 0.1 0.2 100.0San Francisco 35.5 38.9 20.9 3.8 0.7 0.1 0.1 0.0 0.0 100.0San Jose 44.0 21.1 20.9 8.7 4.1 1.2 0.0 0.0 0.0 100.0San Luis Obispo 27.7 38.9 23.2 7.0 2.7 0.4 0.0 0.0 0.0 100.0San Marcos 4.6 29.5 22.8 27.4 15.8 0.0 0.0 0.0 0.0 100.0Sonoma 26.6 32.9 27.5 8.2 2.6 1.0 0.3 0.3 0.6 100.0Stanislaus 25.0 34.8 21.1 11.7 5.3 1.1 1.0 0.0 0.0 100.0Total 30.5 35.3 21.5 8.3 3.2 0.9 0.2 0.1 0.1 100.0
Note: Humboldt reported income according to ranges used for federal reporting purposes. The maximum range reported was $45,000 or more.
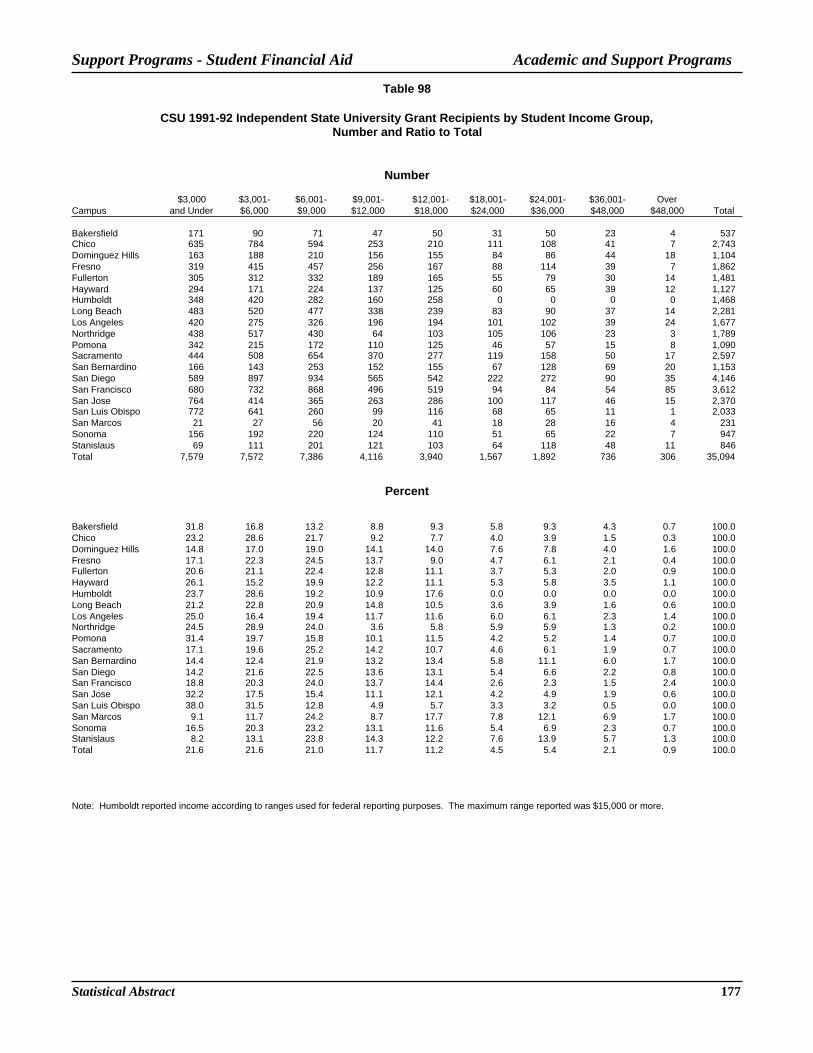
Statistical Abstract 177
Academic and Support ProgramsSupport Programs - Student Financial Aid
Table 98
CSU 1991-92 Independent State University Grant Recipients by Student Income Group,Number and Ratio to Total
Number
$3,000 $3,001- $6,001- $9,001- $12,001- $18,001- $24,001- $36,001- OverCampus and Under $6,000 $9,000 $12,000 $18,000 $24,000 $36,000 $48,000 $48,000 Total
Bakersfield 171 90 71 47 50 31 50 23 4 537Chico 635 784 594 253 210 111 108 41 7 2,743Dominguez Hills 163 188 210 156 155 84 86 44 18 1,104Fresno 319 415 457 256 167 88 114 39 7 1,862Fullerton 305 312 332 189 165 55 79 30 14 1,481Hayward 294 171 224 137 125 60 65 39 12 1,127Humboldt 348 420 282 160 258 0 0 0 0 1,468Long Beach 483 520 477 338 239 83 90 37 14 2,281Los Angeles 420 275 326 196 194 101 102 39 24 1,677Northridge 438 517 430 64 103 105 106 23 3 1,789Pomona 342 215 172 110 125 46 57 15 8 1,090Sacramento 444 508 654 370 277 119 158 50 17 2,597San Bernardino 166 143 253 152 155 67 128 69 20 1,153San Diego 589 897 934 565 542 222 272 90 35 4,146San Francisco 680 732 868 496 519 94 84 54 85 3,612San Jose 764 414 365 263 286 100 117 46 15 2,370San Luis Obispo 772 641 260 99 116 68 65 11 1 2,033San Marcos 21 27 56 20 41 18 28 16 4 231Sonoma 156 192 220 124 110 51 65 22 7 947Stanislaus 69 111 201 121 103 64 118 48 11 846Total 7,579 7,572 7,386 4,116 3,940 1,567 1,892 736 306 35,094
Percent
Bakersfield 31.8 16.8 13.2 8.8 9.3 5.8 9.3 4.3 0.7 100.0Chico 23.2 28.6 21.7 9.2 7.7 4.0 3.9 1.5 0.3 100.0Dominguez Hills 14.8 17.0 19.0 14.1 14.0 7.6 7.8 4.0 1.6 100.0Fresno 17.1 22.3 24.5 13.7 9.0 4.7 6.1 2.1 0.4 100.0Fullerton 20.6 21.1 22.4 12.8 11.1 3.7 5.3 2.0 0.9 100.0Hayward 26.1 15.2 19.9 12.2 11.1 5.3 5.8 3.5 1.1 100.0Humboldt 23.7 28.6 19.2 10.9 17.6 0.0 0.0 0.0 0.0 100.0Long Beach 21.2 22.8 20.9 14.8 10.5 3.6 3.9 1.6 0.6 100.0Los Angeles 25.0 16.4 19.4 11.7 11.6 6.0 6.1 2.3 1.4 100.0Northridge 24.5 28.9 24.0 3.6 5.8 5.9 5.9 1.3 0.2 100.0Pomona 31.4 19.7 15.8 10.1 11.5 4.2 5.2 1.4 0.7 100.0Sacramento 17.1 19.6 25.2 14.2 10.7 4.6 6.1 1.9 0.7 100.0San Bernardino 14.4 12.4 21.9 13.2 13.4 5.8 11.1 6.0 1.7 100.0San Diego 14.2 21.6 22.5 13.6 13.1 5.4 6.6 2.2 0.8 100.0San Francisco 18.8 20.3 24.0 13.7 14.4 2.6 2.3 1.5 2.4 100.0San Jose 32.2 17.5 15.4 11.1 12.1 4.2 4.9 1.9 0.6 100.0San Luis Obispo 38.0 31.5 12.8 4.9 5.7 3.3 3.2 0.5 0.0 100.0San Marcos 9.1 11.7 24.2 8.7 17.7 7.8 12.1 6.9 1.7 100.0Sonoma 16.5 20.3 23.2 13.1 11.6 5.4 6.9 2.3 0.7 100.0Stanislaus 8.2 13.1 23.8 14.3 12.2 7.6 13.9 5.7 1.3 100.0Total 21.6 21.6 21.0 11.7 11.2 4.5 5.4 2.1 0.9 100.0
Note: Humboldt reported income according to ranges used for federal reporting purposes. The maximum range reported was $15,000 or more.
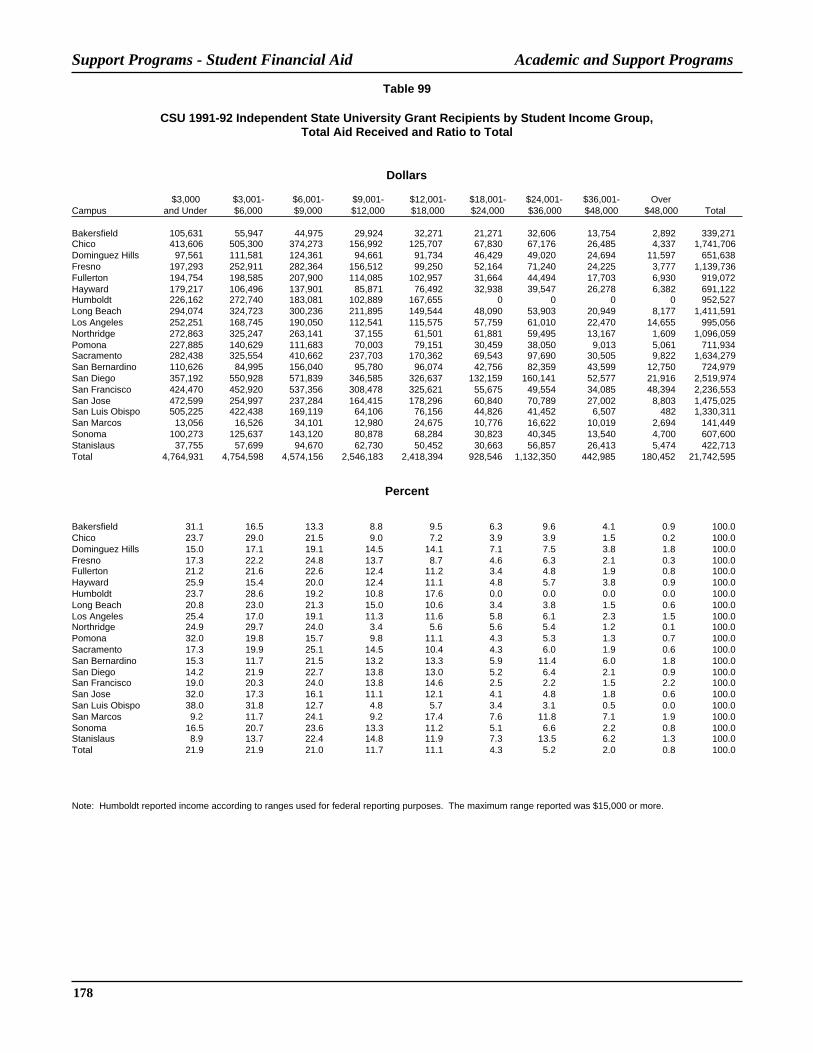
178
Academic and Support ProgramsSupport Programs - Student Financial Aid
Table 99
CSU 1991-92 Independent State University Grant Recipients by Student Income Group,Total Aid Received and Ratio to Total
Dollars
$3,000 $3,001- $6,001- $9,001- $12,001- $18,001- $24,001- $36,001- OverCampus and Under $6,000 $9,000 $12,000 $18,000 $24,000 $36,000 $48,000 $48,000 Total
Bakersfield 105,631 55,947 44,975 29,924 32,271 21,271 32,606 13,754 2,892 339,271Chico 413,606 505,300 374,273 156,992 125,707 67,830 67,176 26,485 4,337 1,741,706Dominguez Hills 97,561 111,581 124,361 94,661 91,734 46,429 49,020 24,694 11,597 651,638Fresno 197,293 252,911 282,364 156,512 99,250 52,164 71,240 24,225 3,777 1,139,736Fullerton 194,754 198,585 207,900 114,085 102,957 31,664 44,494 17,703 6,930 919,072Hayward 179,217 106,496 137,901 85,871 76,492 32,938 39,547 26,278 6,382 691,122Humboldt 226,162 272,740 183,081 102,889 167,655 0 0 0 0 952,527Long Beach 294,074 324,723 300,236 211,895 149,544 48,090 53,903 20,949 8,177 1,411,591Los Angeles 252,251 168,745 190,050 112,541 115,575 57,759 61,010 22,470 14,655 995,056Northridge 272,863 325,247 263,141 37,155 61,501 61,881 59,495 13,167 1,609 1,096,059Pomona 227,885 140,629 111,683 70,003 79,151 30,459 38,050 9,013 5,061 711,934Sacramento 282,438 325,554 410,662 237,703 170,362 69,543 97,690 30,505 9,822 1,634,279San Bernardino 110,626 84,995 156,040 95,780 96,074 42,756 82,359 43,599 12,750 724,979San Diego 357,192 550,928 571,839 346,585 326,637 132,159 160,141 52,577 21,916 2,519,974San Francisco 424,470 452,920 537,356 308,478 325,621 55,675 49,554 34,085 48,394 2,236,553San Jose 472,599 254,997 237,284 164,415 178,296 60,840 70,789 27,002 8,803 1,475,025San Luis Obispo 505,225 422,438 169,119 64,106 76,156 44,826 41,452 6,507 482 1,330,311San Marcos 13,056 16,526 34,101 12,980 24,675 10,776 16,622 10,019 2,694 141,449Sonoma 100,273 125,637 143,120 80,878 68,284 30,823 40,345 13,540 4,700 607,600Stanislaus 37,755 57,699 94,670 62,730 50,452 30,663 56,857 26,413 5,474 422,713Total 4,764,931 4,754,598 4,574,156 2,546,183 2,418,394 928,546 1,132,350 442,985 180,452 21,742,595
Percent
Bakersfield 31.1 16.5 13.3 8.8 9.5 6.3 9.6 4.1 0.9 100.0Chico 23.7 29.0 21.5 9.0 7.2 3.9 3.9 1.5 0.2 100.0Dominguez Hills 15.0 17.1 19.1 14.5 14.1 7.1 7.5 3.8 1.8 100.0Fresno 17.3 22.2 24.8 13.7 8.7 4.6 6.3 2.1 0.3 100.0Fullerton 21.2 21.6 22.6 12.4 11.2 3.4 4.8 1.9 0.8 100.0Hayward 25.9 15.4 20.0 12.4 11.1 4.8 5.7 3.8 0.9 100.0Humboldt 23.7 28.6 19.2 10.8 17.6 0.0 0.0 0.0 0.0 100.0Long Beach 20.8 23.0 21.3 15.0 10.6 3.4 3.8 1.5 0.6 100.0Los Angeles 25.4 17.0 19.1 11.3 11.6 5.8 6.1 2.3 1.5 100.0Northridge 24.9 29.7 24.0 3.4 5.6 5.6 5.4 1.2 0.1 100.0Pomona 32.0 19.8 15.7 9.8 11.1 4.3 5.3 1.3 0.7 100.0Sacramento 17.3 19.9 25.1 14.5 10.4 4.3 6.0 1.9 0.6 100.0San Bernardino 15.3 11.7 21.5 13.2 13.3 5.9 11.4 6.0 1.8 100.0San Diego 14.2 21.9 22.7 13.8 13.0 5.2 6.4 2.1 0.9 100.0San Francisco 19.0 20.3 24.0 13.8 14.6 2.5 2.2 1.5 2.2 100.0San Jose 32.0 17.3 16.1 11.1 12.1 4.1 4.8 1.8 0.6 100.0San Luis Obispo 38.0 31.8 12.7 4.8 5.7 3.4 3.1 0.5 0.0 100.0San Marcos 9.2 11.7 24.1 9.2 17.4 7.6 11.8 7.1 1.9 100.0Sonoma 16.5 20.7 23.6 13.3 11.2 5.1 6.6 2.2 0.8 100.0Stanislaus 8.9 13.7 22.4 14.8 11.9 7.3 13.5 6.2 1.3 100.0Total 21.9 21.9 21.0 11.7 11.1 4.3 5.2 2.0 0.8 100.0
Note: Humboldt reported income according to ranges used for federal reporting purposes. The maximum range reported was $15,000 or more.

Statistical Abstract 179
Academic and Support ProgramsSupport Programs - Student Financial Aid
Table 100
CSU 1991-92 Financial Aid Recipients by Ethnic Group, Number and Ratio to Total
Number
American African Asian Mexican Other Pacific White TotalCampus Indian American American Filipino American Latino Islander Non-Latino Unknown All Groups
Bakersfield 37 161 54 62 412 64 3 795 196 1,784Chico 139 282 184 34 524 125 13 4,156 412 5,869Dominguez Hills 14 881 143 58 384 135 12 476 262 2,365Fresno 106 506 714 106 2,041 162 23 3,112 839 7,609Fullerton 40 328 1,379 108 751 233 25 2,030 485 5,379Hayward 33 607 628 119 186 111 14 1,061 310 3,069Humboldt 144 121 68 12 188 77 11 2,417 478 3,516Long Beach 54 871 1,557 252 1,005 351 30 2,365 454 6,939Los Angeles 18 671 1,726 150 1,905 620 9 528 369 5,996Northridge 57 1,080 1,155 158 1,172 517 25 2,570 624 7,358Pomona 32 265 1,980 200 811 249 18 1,234 316 5,105Sacramento 119 604 742 156 761 180 38 3,424 637 6,661San Bernardino 41 410 152 38 474 114 14 1,439 252 2,934San Diego 105 734 969 347 1,533 341 47 4,468 757 9,301San Francisco 70 801 1,723 337 318 413 24 2,667 1,012 7,365San Jose 49 577 2,502 259 747 268 35 2,385 641 7,463San Luis Obispo 71 237 711 213 989 311 29 3,289 510 6,360San Marcos 3 12 10 7 29 15 0 225 38 339Sonoma 42 169 71 21 127 82 11 1,318 317 2,158Stanislaus 31 98 162 16 272 52 6 896 248 1,781Total 1,205 9,415 16,630 2,653 14,629 4,420 387 40,855 9,157 99,351
Percent
Bakersfield 2.1 9.0 3.0 3.5 23.1 3.6 0.2 44.6 11.0 100.0Chico 2.4 4.8 3.1 0.6 8.9 2.1 0.2 70.8 7.0 100.0Dominguez Hills 0.6 37.3 6.0 2.5 16.2 5.7 0.5 20.1 11.1 100.0Fresno 1.4 6.7 9.4 1.4 26.8 2.1 0.3 40.9 11.0 100.0Fullerton 0.7 6.1 25.6 2.0 14.0 4.3 0.5 37.7 9.0 100.0Hayward 1.1 19.8 20.5 3.9 6.1 3.6 0.5 34.6 10.1 100.0Humboldt 4.1 3.4 1.9 0.3 5.3 2.2 0.3 68.7 13.6 100.0Long Beach 0.8 12.6 22.4 3.6 14.5 5.1 0.4 34.1 6.5 100.0Los Angeles 0.3 11.2 28.8 2.5 31.8 10.3 0.2 8.8 6.2 100.0Northridge 0.8 14.7 15.7 2.1 15.9 7.0 0.3 34.9 8.5 100.0Pomona 0.6 5.2 38.8 3.9 15.9 4.9 0.4 24.2 6.2 100.0Sacramento 1.8 9.1 11.1 2.3 11.4 2.7 0.6 51.4 9.6 100.0San Bernardino 1.4 14.0 5.2 1.3 16.2 3.9 0.5 49.0 8.6 100.0San Diego 1.1 7.9 10.4 3.7 16.5 3.7 0.5 48.0 8.1 100.0San Francisco 1.0 10.9 23.4 4.6 4.3 5.6 0.3 36.2 13.7 100.0San Jose 0.7 7.7 33.5 3.5 10.0 3.6 0.5 32.0 8.6 100.0San Luis Obispo 1.1 3.7 11.2 3.3 15.6 4.9 0.5 51.7 8.0 100.0San Marcos 0.9 3.5 3.0 2.1 8.6 4.4 0.0 66.4 11.2 100.0Sonoma 1.9 7.8 3.3 1.0 5.9 3.8 0.5 61.1 14.7 100.0Stanislaus 1.7 5.5 9.1 0.9 15.3 2.9 0.3 50.3 13.9 100.0Total 1.2 9.5 16.7 2.7 14.7 4.4 0.4 41.1 9.2 100.0
Note: Numbers represent the unduplicated number of students receiving financial aid, i.e. if a student receives more than one type of award the student is countedonly once as an aid recipient.

180
Academic and Support ProgramsSupport Programs - Student Financial Aid
Table 101
CSU 1991-92 Financial Aid Recipients by Ethnic Group, Total Aid Received and Ratio to Total
Dollars
American African Asian Mexican Other Pacific White TotalCampus Indian American American Filipino American Latino Islander Non-Latino Unknown All Groups
Bakersfield 118,175 643,911 192,766 221,593 1,471,942 227,197 15,833 2,397,818 596,703 5,885,938Chico 688,394 1,633,565 819,160 119,691 2,433,016 580,141 70,043 17,170,698 1,804,816 25,319,524Dominguez Hills 48,655 3,477,255 472,486 159,037 1,176,526 476,089 57,559 1,780,332 851,465 8,499,404Fresno 422,705 2,149,356 2,460,469 336,722 7,817,729 595,680 101,265 9,185,547 1,940,947 25,010,420Fullerton 150,932 1,697,929 5,357,289 349,496 2,716,825 846,842 95,399 7,819,772 1,782,109 20,816,593Hayward 129,580 2,244,622 2,417,439 386,667 671,793 367,905 57,003 3,828,893 1,114,063 11,217,965Humboldt 665,372 614,430 282,622 46,765 874,301 322,234 43,489 9,518,093 1,801,833 14,169,139Long Beach 205,884 4,064,002 6,494,323 929,319 3,717,228 1,426,912 125,349 10,111,718 1,898,026 28,972,761Los Angeles 67,975 2,433,134 5,241,837 387,589 5,474,139 1,703,642 23,314 1,728,249 1,075,253 18,135,132Northridge 242,506 5,184,442 4,380,897 564,064 4,690,405 1,872,606 86,033 9,190,175 2,181,576 28,392,704Pomona 107,638 1,150,428 7,767,616 583,015 2,849,490 828,543 54,550 4,096,214 982,059 18,419,553Sacramento 529,176 2,536,803 2,852,085 495,620 2,826,380 719,414 151,540 12,711,655 2,229,163 25,051,836San Bernardino 174,416 1,830,133 562,968 132,488 1,770,642 389,405 55,425 5,222,111 910,434 11,048,022San Diego 507,353 3,773,302 4,055,601 1,040,012 6,204,620 1,609,016 211,745 20,055,776 3,401,754 40,859,179San Francisco 304,576 3,542,565 6,193,413 1,097,623 1,254,263 1,545,432 100,470 11,225,884 4,156,261 29,420,487San Jose 194,547 2,595,505 10,000,767 806,638 2,992,869 995,955 142,899 8,303,743 2,175,847 28,208,770San Luis Obispo 338,830 1,237,473 3,588,846 961,470 4,853,706 1,524,880 140,013 14,381,315 2,337,535 29,364,068San Marcos 13,821 67,631 37,932 27,222 112,573 43,356 0 854,107 130,938 1,287,580Sonoma 200,075 816,014 295,697 90,502 598,040 383,823 49,039 5,326,110 1,234,961 8,994,261Stanislaus 108,143 350,419 468,073 49,374 755,791 158,757 18,622 2,899,283 729,192 5,537,654Total 5,218,753 42,042,919 63,942,286 8,784,907 55,262,278 16,617,829 1,599,590 157,807,493 33,334,935 384,610,990
Percent
Bakersfield 2.0 10.9 3.3 3.8 25.0 3.9 0.3 40.7 10.1 100.0Chico 2.7 6.5 3.2 0.5 9.6 2.3 0.3 67.8 7.1 100.0Dominguez Hills 0.6 40.9 5.6 1.9 13.8 5.6 0.7 20.9 10.0 100.0Fresno 1.7 8.6 9.8 1.3 31.3 2.4 0.4 36.7 7.8 100.0Fullerton 0.7 8.2 25.7 1.7 13.1 4.1 0.5 37.6 8.6 100.0Hayward 1.2 20.0 21.6 3.4 6.0 3.3 0.5 34.1 9.9 100.0Humboldt 4.7 4.3 2.0 0.3 6.2 2.3 0.3 67.2 12.7 100.0Long Beach 0.7 14.0 22.4 3.2 12.8 4.9 0.4 34.9 6.6 100.0Los Angeles 0.4 13.4 28.9 2.1 30.2 9.4 0.1 9.5 5.9 100.0Northridge 0.9 18.3 15.4 2.0 16.5 6.6 0.3 32.4 7.7 100.0Pomona 0.6 6.2 42.2 3.2 15.5 4.5 0.3 22.2 5.3 100.0Sacramento 2.1 10.1 11.4 2.0 11.3 2.9 0.6 50.7 8.9 100.0San Bernardino 1.6 16.6 5.1 1.2 16.0 3.5 0.5 47.3 8.2 100.0San Diego 1.2 9.2 9.9 2.5 15.2 3.9 0.5 49.1 8.3 100.0San Francisco 1.0 12.0 21.1 3.7 4.3 5.3 0.3 38.2 14.1 100.0San Jose 0.7 9.2 35.5 2.9 10.6 3.5 0.5 29.4 7.7 100.0San Luis Obispo 1.2 4.2 12.2 3.3 16.5 5.2 0.5 49.0 8.0 100.0San Marcos 1.1 5.3 2.9 2.1 8.7 3.4 0.0 66.3 10.2 100.0Sonoma 2.2 9.1 3.3 1.0 6.6 4.3 0.5 59.2 13.7 100.0Stanislaus 2.0 6.3 8.5 0.9 13.6 2.9 0.3 52.4 13.2 100.0Total 1.4 10.9 16.6 2.3 14.4 4.3 0.4 41.0 8.7 100.0

Statistical Abstract 181
Academic and Support ProgramsSupport Programs - Student Financial Aid
Table 102
CSU 1991-92 Dependent Financial Aid Recipients by Parent Income Group, Number and Ratio to Total
Number
$12,000 $12,001- $24,001- $36,001- $48,001- $60,001- $72,001- $84,001- OverCampus and Under $24,000 $36,000 $48,000 $60,000 $72,000 $84,000 $96,000 $96,000 Total
Bakersfield 233 198 121 48 25 5 5 2 0 637Chico 358 549 542 312 172 61 26 13 19 2,052Dominguez Hills 280 220 102 37 19 5 1 0 1 665Fresno 1,050 1,077 478 249 102 40 17 15 14 3,042Fullerton 731 740 434 192 74 32 6 6 10 2,225Hayward 324 334 170 87 38 16 5 2 0 976Humboldt 152 345 277 147 221 0 0 0 0 1,142Long Beach 721 1,167 697 356 180 77 37 10 12 3,257Los Angeles 1,601 1,224 553 149 50 10 5 5 2 3,599Northridge 1,301 1,158 640 226 102 40 22 15 17 3,521Pomona 977 817 467 221 101 38 14 8 32 2,675Sacramento 418 625 486 241 136 68 27 9 8 2,018San Bernardino 259 276 175 85 52 17 10 5 2 881San Diego 905 1,239 780 482 172 67 30 8 13 3,696San Francisco 817 783 487 164 59 29 14 2 8 2,363San Jose 1,386 555 527 226 105 39 13 7 6 2,864San Luis Obispo 528 768 645 397 266 118 62 16 28 2,828San Marcos 5 9 3 5 3 1 0 0 0 26Sonoma 139 191 160 91 53 26 18 7 13 698Stanislaus 130 177 125 56 26 14 7 1 0 536Total 12,315 12,452 7,869 3,771 1,956 703 319 131 185 39,701
Percent
Bakersfield 36.6 31.1 19.0 7.5 3.9 0.8 0.8 0.3 0.0 100.0Chico 17.4 26.8 26.4 15.2 8.4 3.0 1.3 0.6 0.9 100.0Dominguez Hills 42.1 33.1 15.3 5.6 2.9 0.8 0.2 0.0 0.2 100.0Fresno 34.5 35.4 15.7 8.2 3.4 1.3 0.6 0.5 0.5 100.0Fullerton 32.9 33.3 19.5 8.6 3.3 1.4 0.3 0.3 0.4 100.0Hayward 33.2 34.2 17.4 8.9 3.9 1.6 0.5 0.2 0.0 100.0Humboldt 13.3 30.2 24.3 12.9 19.4 0.0 0.0 0.0 0.0 100.0Long Beach 22.1 35.8 21.4 10.9 5.5 2.4 1.1 0.3 0.4 100.0Los Angeles 44.5 34.0 15.4 4.1 1.4 0.3 0.1 0.1 0.1 100.0Northridge 37.0 32.9 18.2 6.4 2.9 1.1 0.6 0.4 0.5 100.0Pomona 36.5 30.5 17.5 8.3 3.8 1.4 0.5 0.3 1.2 100.0Sacramento 20.7 31.0 24.1 11.9 6.7 3.4 1.3 0.4 0.4 100.0San Bernardino 29.4 31.3 19.9 9.6 5.9 1.9 1.1 0.6 0.2 100.0San Diego 24.5 33.5 21.1 13.0 4.7 1.8 0.8 0.2 0.4 100.0San Francisco 34.6 33.1 20.6 6.9 2.5 1.2 0.6 0.1 0.3 100.0San Jose 48.4 19.4 18.4 7.9 3.7 1.4 0.5 0.2 0.2 100.0San Luis Obispo 18.7 27.2 22.8 14.0 9.4 4.2 2.2 0.6 1.0 100.0San Marcos 19.2 34.6 11.5 19.2 11.5 3.8 0.0 0.0 0.0 100.0Sonoma 19.9 27.4 22.9 13.0 7.6 3.7 2.6 1.0 1.9 100.0Stanislaus 24.3 33.0 23.3 10.4 4.9 2.6 1.3 0.2 0.0 100.0Total 31.0 31.4 19.8 9.5 4.9 1.8 0.8 0.3 0.5 100.0
Note: Numbers represent the unduplicated number of students receiving financial aid, i.e. if a student receives more than one type of award the student is countedonly once as an aid recipient. Humboldt reported income according to ranges used for federal reporting purposes. The maximum range reported was $45,000 ormore.

182
Academic and Support ProgramsSupport Programs - Student Financial Aid
Table 103
CSU 1991-92 Dependent Financial Aid Recipients by Parent Income Group, Total Aid Received and Ratio to Total
Dollars
$12,000 $12,001- $24,001- $36,001- $48,001- $60,001- $72,001- $84,001- OverCampus and Under $24,000 $36,000 $48,000 $60,000 $72,000 $84,000 $96,000 $96,000 Total
Bakersfield 939,584 728,715 345,180 110,384 41,871 4,783 9,331 5,250 0 2,185,098Chico 1,735,182 2,536,918 1,902,261 870,195 457,658 162,680 95,301 43,466 75,727 7,879,388Dominguez Hills 834,393 620,079 213,450 80,923 31,516 4,672 300 0 500 1,785,833Fresno 3,505,485 4,252,064 1,527,766 591,636 204,869 95,354 41,774 39,906 40,520 10,299,374Fullerton 3,047,234 2,847,251 1,211,943 490,163 188,976 101,520 13,904 18,436 25,274 7,944,701Hayward 1,345,056 1,208,121 415,717 211,292 76,770 36,646 17,096 8,000 0 3,318,698Humboldt 787,924 1,687,501 956,326 406,550 512,330 0 0 0 0 4,350,631Long Beach 3,267,611 4,680,242 2,130,849 878,732 435,399 215,824 109,571 30,476 38,574 11,787,278Los Angeles 5,172,411 3,719,561 1,293,909 253,080 79,091 27,684 17,007 9,588 1,822 10,574,153Northridge 5,491,438 4,428,619 2,138,319 648,937 259,872 123,165 64,810 46,337 53,508 13,255,005Pomona 3,988,570 3,019,591 1,290,841 469,943 249,400 78,385 37,406 20,846 118,647 9,273,629Sacramento 1,686,474 2,457,297 1,470,193 598,187 370,632 172,515 83,639 34,775 16,398 6,890,110San Bernardino 1,010,178 978,594 473,663 195,422 119,677 38,075 30,000 16,447 8,000 2,870,056San Diego 4,053,560 5,039,469 2,698,527 1,352,553 387,577 136,316 66,413 12,055 39,079 13,785,549San Francisco 3,149,303 2,713,496 1,348,401 354,905 133,670 74,375 42,921 8,000 23,654 7,848,725San Jose 6,064,891 2,098,514 1,706,731 544,361 258,821 99,240 34,347 19,078 15,427 10,841,410San Luis Obispo 2,831,440 3,762,489 2,551,637 1,150,099 681,845 302,643 144,226 40,721 68,210 11,533,310San Marcos 12,190 12,649 9,075 13,008 3,978 1,000 0 0 0 51,900Sonoma 645,634 856,587 534,839 244,803 144,468 80,488 47,602 30,604 46,862 2,631,887Stanislaus 421,843 471,169 284,767 106,808 45,943 26,447 11,317 920 0 1,369,214Total 49,990,401 48,118,926 24,504,394 9,571,981 4,684,363 1,781,812 866,965 384,905 572,202 140,475,949
Percent
Bakersfield 43.0 33.3 15.8 5.1 1.9 0.2 0.4 0.2 0.0 100.0Chico 22.0 32.2 24.1 11.0 5.8 2.1 1.2 0.6 1.0 100.0Dominguez Hills 46.7 34.7 12.0 4.5 1.8 0.3 0.0 0.0 0.0 100.0Fresno 34.0 41.3 14.8 5.7 2.0 0.9 0.4 0.4 0.4 100.0Fullerton 38.4 35.8 15.3 6.2 2.4 1.3 0.2 0.2 0.3 100.0Hayward 40.5 36.4 12.5 6.4 2.3 1.1 0.5 0.2 0.0 100.0Humboldt 18.1 38.8 22.0 9.3 11.8 0.0 0.0 0.0 0.0 100.0Long Beach 27.7 39.7 18.1 7.5 3.7 1.8 0.9 0.3 0.3 100.0Los Angeles 48.9 35.2 12.2 2.4 0.7 0.3 0.2 0.1 0.0 100.0Northridge 41.4 33.4 16.1 4.9 2.0 0.9 0.5 0.4 0.4 100.0Pomona 43.0 32.6 13.9 5.1 2.7 0.8 0.4 0.2 1.3 100.0Sacramento 24.5 35.7 21.3 8.7 5.4 2.5 1.2 0.5 0.2 100.0San Bernardino 35.2 34.1 16.5 6.8 4.2 1.3 1.0 0.6 0.3 100.0San Diego 29.4 36.6 19.6 9.8 2.8 1.0 0.5 0.1 0.3 100.0San Francisco 40.1 34.6 17.2 4.5 1.7 0.9 0.5 0.1 0.3 100.0San Jose 55.9 19.4 15.7 5.0 2.4 0.9 0.3 0.2 0.1 100.0San Luis Obispo 24.6 32.6 22.1 10.0 5.9 2.6 1.3 0.4 0.6 100.0San Marcos 23.5 24.4 17.5 25.1 7.7 1.9 0.0 0.0 0.0 100.0Sonoma 24.5 32.5 20.3 9.3 5.5 3.1 1.8 1.2 1.8 100.0Stanislaus 30.8 34.4 20.8 7.8 3.4 1.9 0.8 0.1 0.0 100.0Total 35.6 34.3 17.4 6.8 3.3 1.3 0.6 0.3 0.4 100.0
Note: Humboldt reported income according to ranges used for federal reporting purposes. The maximum range reported was $45,000 or more.

Statistical Abstract 183
Academic and Support ProgramsSupport Programs - Student Financial Aid
Table 104
CSU 1991-92 Independent Financial Aid Recipients by Student Income Group, Number and Ratio to Total
Number
$3,000 $3,001- $6,001- $9,001- $12,001- $18,001- $24,001- $36,001- OverCampus and Under $6,000 $9,000 $12,000 $18,000 $24,000 $36,000 $48,000 $48,000 Total
Bakersfield 241 139 120 77 81 58 103 49 17 885Chico 873 1,040 833 362 309 169 154 59 11 3,810Dominguez Hills 244 246 278 203 212 136 132 65 31 1,547Fresno 557 702 809 410 340 178 234 92 33 3,355Fullerton 498 565 622 366 333 151 177 72 46 2,830Hayward 457 288 377 229 206 111 135 74 24 1,901Humboldt 499 579 475 228 382 0 0 0 0 2,163Long Beach 700 785 767 536 410 183 177 86 38 3,682Los Angeles 581 376 484 278 272 157 156 53 29 2,386Northridge 580 683 780 417 353 184 201 90 40 3,328Pomona 575 386 336 217 241 95 106 43 19 2,018Sacramento 823 680 933 618 495 244 277 120 45 4,235San Bernardino 247 230 430 263 247 145 214 115 63 1,954San Diego 785 1,134 1,272 754 778 304 385 127 62 5,601San Francisco 875 954 1,126 665 679 264 183 95 161 5,002San Jose 1,200 649 592 435 460 206 204 88 44 3,878San Luis Obispo 1,093 1,056 620 262 209 124 115 30 13 3,522San Marcos 31 32 66 29 50 25 35 21 7 296Sonoma 225 263 321 185 188 90 99 38 20 1,429Stanislaus 84 137 259 157 135 81 139 62 18 1,072Total 11,168 10,924 11,500 6,691 6,380 2,905 3,226 1,379 721 54,894
Percent
Bakersfield 27.2 15.7 13.6 8.7 9.2 6.6 11.6 5.5 1.9 100.0Chico 22.9 27.3 21.9 9.5 8.1 4.4 4.0 1.5 0.3 100.0Dominguez Hills 15.8 15.9 18.0 13.1 13.7 8.8 8.5 4.2 2.0 100.0Fresno 16.6 20.9 24.1 12.2 10.1 5.3 7.0 2.7 1.0 100.0Fullerton 17.6 20.0 22.0 12.9 11.8 5.3 6.3 2.5 1.6 100.0Hayward 24.0 15.2 19.8 12.0 10.8 5.8 7.1 3.9 1.3 100.0Humboldt 23.1 26.8 22.0 10.5 17.7 0.0 0.0 0.0 0.0 100.0Long Beach 19.0 21.3 20.8 14.6 11.1 5.0 4.8 2.3 1.0 100.0Los Angeles 24.4 15.8 20.3 11.7 11.4 6.6 6.5 2.2 1.2 100.0Northridge 17.4 20.5 23.4 12.5 10.6 5.5 6.0 2.7 1.2 100.0Pomona 28.5 19.1 16.7 10.8 11.9 4.7 5.3 2.1 0.9 100.0Sacramento 19.4 16.1 22.0 14.6 11.7 5.8 6.5 2.8 1.1 100.0San Bernardino 12.6 11.8 22.0 13.5 12.6 7.4 11.0 5.9 3.2 100.0San Diego 14.0 20.2 22.7 13.5 13.9 5.4 6.9 2.3 1.1 100.0San Francisco 17.5 19.1 22.5 13.3 13.6 5.3 3.7 1.9 3.2 100.0San Jose 30.9 16.7 15.3 11.2 11.9 5.3 5.3 2.3 1.1 100.0San Luis Obispo 31.0 30.0 17.6 7.4 5.9 3.5 3.3 0.9 0.4 100.0San Marcos 10.5 10.8 22.3 9.8 16.9 8.4 11.8 7.1 2.4 100.0Sonoma 15.7 18.4 22.5 12.9 13.2 6.3 6.9 2.7 1.4 100.0Stanislaus 7.8 12.8 24.2 14.6 12.6 7.6 13.0 5.8 1.7 100.0Total 20.3 19.9 20.9 12.2 11.6 5.3 5.9 2.5 1.3 100.0
Note: Numbers represent the unduplicated number of students receiving financial aid, i.e. if a student receives more than one type of award the student is countedonly once as an aid recipient. Humboldt reported income according to ranges used for federal reporting purposes. The maximum range reported was $15,000 ormore.

184
Academic and Support ProgramsSupport Programs - Student Financial Aid
Table 105
CSU 1991-92 Independent Financial Aid Recipients by Student Income Group, Total Aid Received and Ratio to Total
Dollars
$3,000 $3,001- $6,001- $9,001- $12,001- $18,001- $24,001- $36,001- OverCampus and Under $6,000 $9,000 $12,000 $18,000 $24,000 $36,000 $48,000 $48,000 Total
Bakersfield 1,036,739 572,139 403,430 220,302 265,907 212,065 370,077 145,600 39,793 3,266,052Chico 4,581,383 4,905,514 3,582,232 1,528,686 1,246,037 725,118 621,540 192,142 44,734 17,427,386Dominguez Hills 944,614 1,106,538 1,287,114 898,212 845,491 608,670 515,593 231,148 125,916 6,563,296Fresno 2,318,046 2,670,657 3,169,812 1,508,811 1,158,718 651,640 839,665 282,609 83,340 12,683,298Fullerton 2,357,727 2,630,589 2,696,866 1,359,833 1,278,423 521,040 684,421 245,223 172,701 11,946,823Hayward 2,079,336 1,226,349 1,503,523 830,608 721,561 439,564 449,018 274,207 90,021 7,614,187Humboldt 2,453,679 2,645,173 1,939,123 875,918 1,551,864 0 0 0 0 9,465,757Long Beach 3,890,446 3,907,121 3,535,321 2,226,767 1,681,940 793,658 708,190 328,163 113,877 17,185,483Los Angeles 1,927,000 1,211,093 1,561,482 782,156 818,856 552,666 468,494 139,250 78,993 7,539,990Northridge 2,822,221 3,331,445 3,227,176 1,629,189 1,391,590 785,970 804,962 382,080 131,428 14,506,061Pomona 2,802,314 1,777,133 1,381,364 789,416 894,872 415,703 399,392 153,131 72,426 8,685,751Sacramento 3,647,195 3,101,099 4,141,414 2,365,495 1,868,838 968,299 994,318 433,413 141,544 17,661,615San Bernardino 1,189,142 1,062,347 1,878,418 1,092,470 933,183 580,950 742,053 354,474 242,638 8,075,675San Diego 4,241,625 6,073,796 6,310,419 3,322,332 3,322,783 1,382,763 1,652,521 537,051 227,715 27,071,005San Francisco 4,264,475 4,636,017 4,834,303 2,621,700 2,444,581 1,017,179 781,932 378,151 593,424 21,571,762San Jose 5,799,688 2,967,459 2,411,702 1,473,574 1,490,639 848,429 755,344 279,560 155,025 16,181,420San Luis Obispo 6,210,867 5,619,452 2,798,877 1,062,962 915,688 540,847 519,524 107,693 38,990 17,814,900San Marcos 144,874 120,871 333,773 126,175 192,439 93,762 137,005 56,961 12,646 1,218,506Sonoma 1,095,398 1,191,119 1,432,814 798,310 789,527 373,160 363,162 92,346 105,856 6,241,692Stanislaus 316,109 491,275 951,420 506,036 536,876 272,821 427,974 198,424 48,694 3,749,629Total 54,122,878 51,247,186 49,380,583 26,018,952 24,349,813 11,784,304 12,235,185 4,811,626 2,519,761 236,470,288
Percent
Bakersfield 31.7 17.5 12.4 6.7 8.1 6.5 11.3 4.5 1.2 100.0Chico 26.3 28.1 20.6 8.8 7.2 4.2 3.6 1.1 0.3 100.0Dominguez Hills 14.4 16.9 19.6 13.7 12.9 9.3 7.9 3.5 1.9 100.0Fresno 18.3 21.1 25.0 11.9 9.1 5.1 6.6 2.2 0.7 100.0Fullerton 19.7 22.0 22.6 11.4 10.7 4.4 5.7 2.1 1.4 100.0Hayward 27.3 16.1 19.7 10.9 9.5 5.8 5.9 3.6 1.2 100.0Humboldt 25.9 27.9 20.5 9.3 16.4 0.0 0.0 0.0 0.0 100.0Long Beach 22.6 22.7 20.6 13.0 9.8 4.6 4.1 1.9 0.7 100.0Los Angeles 25.6 16.1 20.7 10.4 10.9 7.3 6.2 1.8 1.0 100.0Northridge 19.5 23.0 22.2 11.2 9.6 5.4 5.5 2.6 0.9 100.0Pomona 32.3 20.5 15.9 9.1 10.3 4.8 4.6 1.8 0.8 100.0Sacramento 20.7 17.6 23.4 13.4 10.6 5.5 5.6 2.5 0.8 100.0San Bernardino 14.7 13.2 23.3 13.5 11.6 7.2 9.2 4.4 3.0 100.0San Diego 15.7 22.4 23.3 12.3 12.3 5.1 6.1 2.0 0.8 100.0San Francisco 19.8 21.5 22.4 12.2 11.3 4.7 3.6 1.8 2.8 100.0San Jose 35.8 18.3 14.9 9.1 9.2 5.2 4.7 1.7 1.0 100.0San Luis Obispo 34.9 31.5 15.7 6.0 5.1 3.0 2.9 0.6 0.2 100.0San Marcos 11.9 9.9 27.4 10.4 15.8 7.7 11.2 4.7 1.0 100.0Sonoma 17.6 19.1 23.0 12.8 12.6 6.0 5.8 1.5 1.7 100.0Stanislaus 8.4 13.1 25.4 13.5 14.3 7.3 11.4 5.3 1.3 100.0Total 22.9 21.7 20.9 11.0 10.3 5.0 5.2 2.0 1.1 100.0
Note: Humboldt reported income according to ranges used for federal reporting purposes. The maximum range reported was $15,000 or more.

Statistical Abstract 185
Academic and Support Programs
In the same college year, 8,293 new students wereadmitted to EOP. One third of these new students werespecial admits who did not meet regular admission criteria;the remaining two-thirds were students who metadmissions critiera but were in need of academic supportservices. The ethnic distribution of those new enrolleeswas 1.2 percent American Indian, 18.9 percent AfricanAmerican, 31.5 percent Mexican American, 5.3 percentOther Latino, 11.1 percent Asian American and 7.0 percentWhite.
The ethnic composition of EOP students has changeddramatically since 1973-74 when, for instance, AfricanAmericans comprised nearly 45 percent of new EOPenrollees. That percentage decreased to 18.9 percent in1989-90, indicating a substantial shift in the ethnicdistribution over the 18-year period. Latino representationamong new enrollees, which increased from 35 percent in1973-74 to almost 40 percent in 1989-90, was 37 percentin 1991-92. The proportion of Asian Americans enrollingas new EOP students has increased in recent years afterremaining relatively stable during the 1970s. Thedistribution of new EOP enrollees from other ethnic groups,although fluctuating some from 1973-74, has held steadyand is quite similar to the percentages reported during thatearly period.
Recognizing the low enrollments of students from ethnicallyunderrepresented groups, the California State Universityestablished the Educational Opportunity Program (EOP).It was the first comprehensive program charged withimproving access and retention of disadvantaged lowincome students who historically have beenunderrepresented in higher education. Although somecampuses established programs in 1968, state fundingfor all campuses was provided in 1969 through enablinglegislation, Senate Bill 1072 (Harmer).
The program provides a full range of support services,including application and admission assistance, academicadvisement, counseling support, learning skills, tutorialand flnancial assistance. Only disadvantaged studentswith a history of low income who need academic supportto succeed in college are admitted to the program. EOPstudents must be residents of the state of California andmeet low income criteria established for program eligibility.Students selected for the program receive support servicesthroughtout their attendance as undergraduates and areeligible to receive an annual EOP grant if they demonstratefinancial need. Legislation (AB 2617) authorizes amaximum grant award of up to $2,000 per academic year,but the actual average grant is approximately $1,000.Additional funding has not been authorized to fund therecent increase in the maximum grant.
In 1991-92, fully 32,756 new and continuing studentswere enrolled in the program. Total funding for the programwas $32,055,052, with approximately $12,869,520 of thatamount used to provide direct grant support for EOPstudents.
Support Programs - Educational Opportunity Program
Introduction

186
Academic and Support ProgramsSupport Programs - Educational Opportunity Program
Figure 15Educational Opportunity Program, Percent Enrollment by Selected
Ethnic Group, 1973-74 to 1989-90
Table 106
Grant and Budget Allocation, CSUEducational Opportunity Program from 1984-85
1984-85 1985-86 1986-87 1987-88 1988-89 1989-90 1990-91 1991-92
Grant Allocations
First Year 3,742 3,800 5,218 5,222 5,619 6,037 6,171 7,272Second Year 2,015 2,252 2,373 2,377 2,556 2,748 2,806 3,286Third Year 1,840 2,040 1,862 1,855 1,996 2,148 2,190 2,559Fourth Year 1,542 1,871 1,031 1,090 1,156 1,253 1,349 1,455Fifth Year 941 1,462 507 571 620 665 709 733
Total 10,080 11,425 10,991 11, 115 11,947 12,851 13,225 15,305
Budget Allocations
EOP Grants
First Year $ 2,956,180 $ 3,041,681 $ 4,201,140 $ 4,203,515 $ 4,636,670 $ 5,191,820 $5,523,045 $6,508,440Second Year 1,591,850 1,801,600 1,898,400 1,901,600 2,096,052 2,335,800 2,469,280 2,891,680Third Year 1,214,400 1,366,800 1,284,780 1,279,950 1,411,760 1,632,480 1,752,000 2,047,200Fourth Year 840,390 1,029,050 582,515 620,935 669,511 751,800 876,850 945,750Fifth Year 509,924 804,100 283,920 319,955 355,902 399,000 460,850 476,450
Total $ 7,112,744 $ 8,043,231 $ 8,250,755 $ 8,325,955 $ 9,169,895 $10,310,900 $11,082,840 $12,869,520
Program Administration 8,750,208 10,931,874 11,723,246 12,534,392 13,534,612 15,226,497 16,845,767 19,185,532
Total Funded Level $15,862,952 $18,975,105 $19,974,001 $20,860,347 $22,704,507 $25,537,397 $27,928,607 $32,055,052
ÅÅ
Å
ÅÅ
Å
Å ÅÅ
Å
Å ÅÅ
ÅÅ
Å ÅÅ Å
Ç Ç
ÇÇ Ç
Ç
Ç
Ç
ÇÇ Ç Ç
ÇÇ
ÇÇ Ç
Ç
Ç
ÉÉ É É
É ÉÉ É
É
É
É
É É É
É É É
ÉÉ
Ñ Ñ
ÑÑ
Ñ
ÑÑ Ñ Ñ Ñ Ñ
Ñ ÑÑ Ñ Ñ
ÑÑ Ñ
Ö Ö
Ö
Ö Ö
Ö
Ö
Ö
Ö Ö Ö
Ö Ö ÖÖ Ö Ö
Ö
Ö
73-74 75-76 77-78 79-80 81-82 83-84 85-86 87-88 89-900
5
10
15
20
25
30
35
40
45
50
Percent
Year
African American
Latino
Asian AmericanOther EOP
White
91-92

Statistical Abstract 187
Academic and Support ProgramsSupport Programs - Educational Opportunity Program
Table 107
New EOP Enrollees by Basis of Admission, 1990-91
Lower Lower Upper UpperFirst-Time Division First-Time Division Division DivisionFreshmen Transfer Freshmen Transfer Transfer Transfer Not
Year Special Special Regular Regular Regular Probation Other Reported Total
Bakersfield 60 10 40 6 47 0 5 0 168Chico 71 25 65 5 45 0 15 0 226Dominguez Hills 45 7 16 1 5 0 5 0 79Fresno 212 12 65 2 68 0 25 0 384Fullerton 105 10 121 2 72 0 44 0 354Hayward 113 14 46 2 91 0 9 0 275Humboldt 27 10 42 3 16 0 5 0 103Long Beach 237 26 323 25 154 0 69 0 834Los Angeles 319 19 418 19 288 0 23 0 1,086Northridge 372 39 302 13 181 0 24 0 931Pomona 38 4 192 5 136 0 5 0 380Sacramento 93 20 104 23 134 0 19 0 393San Bernardino 53 9 56 15 82 0 4 0 219San Diego 179 20 339 29 417 0 10 0 994San Francisco 221 52 118 8 126 0 84 0 609San Jose 161 25 145 18 256 0 11 0 616San Luis Obispo 19 4 116 11 160 0 5 0 315San Marcos 0 0 0 0 34 0 0 0 34Sonoma 47 3 24 1 58 0 11 0 144Stanislaus 46 9 15 6 37 0 2 0 115Total 2,418 318 2,547 194 2,407 0 375 0 8,259
Table 107 (continued)
New EOP Enrollees by Basis of Admission, 1991-92
Lower Lower Upper UpperFirst-Time Division First-Time Division Division DivisionFreshmen Transfer Freshmen Transfer Transfer Transfer Not
Year Special Special Regular Regular Regular Probation Other Reported Total
Bakersfield 68 4 50 3 55 0 1 0 181Chico 66 30 62 14 75 0 26 0 273Dominguez Hills 0 0 0 0 0 0 0 0 0Fresno 218 17 123 4 77 0 35 0 474Fullerton 114 10 142 13 152 0 30 0 461Hayward 94 20 39 8 64 0 5 0 230Humboldt 37 11 37 6 25 0 5 0 121Long Beach 236 13 287 14 69 0 26 0 645Los Angeles 364 20 463 15 238 0 14 0 1,114Northridge 406 34 283 17 169 0 17 0 926Pomona 30 0 165 7 138 0 3 0 343Sacramento 82 20 103 14 116 0 21 0 356San Bernardino 72 9 69 8 80 0 21 0 259San Diego 150 20 306 32 461 0 10 0 979San Francisco 186 24 138 4 99 0 131 0 582San Jose 168 22 207 23 306 0 9 0 735San Luis Obispo 28 0 164 11 165 0 0 0 368San Marcos 0 0 0 2 49 0 0 0 51Sonoma 44 5 58 2 60 0 3 0 172Stanislaus 36 5 25 3 38 0 2 0 109Total 2,399 264 2,721 200 2,436 0 359 0 8,379

188
Academic and Support Programs
Table 107 (continued)
New EOP Enrollees by Basis of Admission, Systemwide from 1970-71
Lower Lower Upper UpperFirst-Time Division First-Time Division Division DivisionFreshmen Transfer Freshmen Transfer Transfer Transfer Not
Year Special Special Regular Regular Regular Probation Other Reported Total
1970-71 1,727 1,165 98 0 176 105 11 0 3,2821971-72 2,037 1,166 109 0 165 206 6 0 3,6891972-73 2,229 1,226 97 0 224 120 14 0 3,9101973-74 2,510 1,692 220 0 460 61 110 0 5,0531974-75 2,664 1,494 325 0 686 41 74 0 5,2841975-76 2,897 1,426 619 0 1,029 51 57 0 6,0791976-77 2,850 1,582 562 0 910 64 81 16 6,0651977-78 2,739 1,534 920 216 776 38 74 3 6,3001978-79 3,331 1,228 553 205 596 63 51 0 6,0271979-80 3,384 1,205 634 208 715 70 71 3 6,2901980-81 3,234 1,212 713 147 844 52 54 0 6,2561981-82 2,662 1,007 648 195 887 45 55 0 5,4991982-83 2,650 883 812 201 1,186 54 42 0 5,8281983-84 2,331 659 1,056 209 1,269 0 70 0 5,5941984-85 2,620 605 907 175 1,140 0 82 0 5,5291985-86 2,573 587 1,012 201 1,030 0 75 0 5,4781986-87 2,365 546 1,314 142 643 0 613 0 5,6231987-88 1,927 503 1,089 659 0 0 465 0 4,6431988-89 2,288 576 2,595 687 1,818 0 193 0 8,1571989-90 2,054 417 2,020 302 2,195 0 346 0 7,3341990-91 2,418 318 2,547 194 2,407 0 375 0 8,2591991-92 2,399 264 2,721 200 2,436 0 359 0 8,379
Support Programs - Educational Opportunity Program

Statistical Abstract 189
Academic and Support Programs
Table 108
New EOP Enrollees by Ethnicity, 1990-91
American African Mexican Other Asian Indo - White All No Declined toYear Indian American American Latino American Chinese* Non-Latino Filipino Others Response State Total
Bakersfield 5 37 72 0 7 0 33 5 8 1 2 170Chico 18 42 85 9 17 0 39 6 11 0 1 228Dominguez Hills 1 46 21 7 4 0 0 0 0 0 0 79Fresno 4 47 255 1 10 0 9 7 3 44 7 387Fullerton 2 45 105 22 113 0 38 9 16 4 0 354Hayward 0 0 0 0 1 0 0 0 0 278 0 279Humboldt 17 25 27 8 2 0 26 0 0 0 0 105Long Beach 7 234 322 16 167 0 34 27 22 0 5 834Los Angeles 4 155 520 125 201 0 25 9 38 9 5 1,091Northridge 5 371 367 114 6 0 28 6 12 9 18 936Pomona 2 19 96 31 187 0 25 9 6 3 3 381Sacramento 8 85 166 7 9 0 35 10 9 56 9 394San Bernardino 0 0 0 0 0 0 0 0 0 224 0 224San Diego 13 190 347 23 4 0 124 89 29 159 20 998San Francisco 3 130 67 68 167 0 62 61 30 5 13 606San Jose 5 108 134 1 15 0 30 7 13 288 15 616San Luis Obispo 0 0 0 0 0 0 0 0 0 315 0 315San Marcos 0 6 2 2 2 0 20 0 0 0 0 32Sonoma 4 24 29 9 7 0 50 3 10 0 11 147Stanislaus 2 0 0 0 0 0 0 0 0 115 0 117TOTAL 100 1,564 2,615 443 919 0 578 248 207 1,510 109 8,293Percentage 1.2 18.9 31.5 5.3 11.1 0.0 7.0 3.0 2.5 18.2 1.3 100.0
Table 108 (continued)
New EOP Enrollees by Ethnicity, 1991-92
American African Mexican Other Asian Indo - White All No Declined toYear Indian American American Latino American Chinese* Non-Latino Filipino Others Response State Total
Bakersfield 3 36 88 8 4 0 28 9 3 2 3 184Chico 22 55 86 15 21 0 60 2 7 1 4 273Dominguez Hills 0 0 0 0 0 0 0 0 0 0 0 0Fresno 4 63 342 11 7 0 11 2 3 29 5 477Fullerton 3 54 159 48 120 0 54 11 2 1 10 462Hayward 0 0 0 0 0 0 0 0 0 237 0 237Humboldt 18 23 25 8 9 0 31 1 2 4 0 121Long Beach 4 166 227 72 114 0 23 18 11 8 2 645Los Angeles 2 130 584 43 5 0 24 19 7 300 8 1,122Northridge 11 375 378 129 23 0 8 3 3 1 1 932Pomona 1 17 113 6 7 0 10 12 4 171 2 343Sacramento 13 96 136 15 65 0 18 6 5 1 1 356San Bernardino 2 71 85 17 26 0 47 3 6 2 5 264San Diego 17 165 361 32 3 0 133 58 15 184 15 983San Francisco 7 118 32 53 247 0 49 34 17 11 14 582San Jose 1 104 149 38 349 0 47 10 19 0 19 736San Luis Obispo 3 38 157 29 93 0 33 9 4 2 1 369San Marcos 3 2 12 2 2 0 26 0 3 1 0 51Sonoma 1 0 0 0 0 0 0 0 0 171 0 172Stanislaus 2 28 42 6 7 0 7 2 16 1 0 111TOTAL 117 1,541 2,976 532 1,102 0 609 199 127 1,127 90 8,420Percentage 1.4 18.3 35.3 6.3 13.1 0.0 7.2 2.4 1.5 13.4 1.1 100.0
* Before 1982, the "Indo-Chinese category was a catchall category labelled "Other Non-White; in 1988-89, Indo-Chinese responses wereincorporated into the Asian American ethnic category. Pacific Islanders have beeen consolidated into "All Others'. Blanks or zeroes areconsolidated into "No Response".
Support Programs - Educational Opportunity Program

190
Academic and Support Programs
Table 108 (continued)
New EOP Enrollees by Ethnicity,Percent Distribution, Systemwide from 1973
American African Mexican Other Asian Indo - White All No Declined toYear Indian American American Latino American Chinese* Non-Latino Filipino Others Response State Total
1973-74 3.7 44.0 34.0 1.5 5.3 1.5 6.7 0.0 1.1 2.2 * 100.01974-75 2.5 45.9 33.1 1.7 4.1 1.6 6.7 0.8 0.9 2.7 * 100.01975-76 2.6 39.9 30.1 1.3 5.0 0.6 12.6 2.0 0.3 5.6 * 100.01976-77 2.4 44.0 30.1 2.3 5.2 1.2 10.3 2.0 0.3 2.0 * 100.01977-78 2.0 41.6 29.5 2.0 6.3 1.6 12.9 2.0 0.6 1.4 * 100.01978-79 2.0 43.1 27.6 2.5 6.6 0.5 7.7 2.1 1.5 2.8 3.3 100.01979-80 3.4 37.2 23.4 4.0 7.7 0.6 10.0 2.6 1.5 9.0 0.6 100.01980-81 1.9 38.0 25.7 4.5 8.1 0.7 10.4 2.9 1.4 6.0 0.4 100.01981-82 2.1 35.6 27.3 6.8 9.8 0.7 10.5 3.1 1.6 1.6 0.9 100.01982-83 1.9 33.4 25.3 7.3 13.5 0.5 10.2 2.8 2.1 1.8 1.2 100.01983-84 1.5 29.5 28.3 5.1 16.7 1.2 9.4 2.2 1.9 3.8 0.4 100.01984-85 1.2 29.6 28.2 5.7 12.1 5.9 10.5 3.1 1.6 1.1 0.8 100.01985-86 1.8 27.7 30.5 5.0 12.6 5.9 10.0 3.0 2.0 1.1 0.5 100.01986-87 1.3 25.0 29.1 8.3 12.3 5.9 11.5 3.4 2.0 0.8 0.4 100.01987-88 1.0 23.6 28.1 8.3 16.4 4.5 11.0 3.7 2.0 0.8 0.5 100.01988-89 1.2 21.0 31.2 7.6 17.4 0.0 10.1 3.6 5.8 1.3 0.8 100.01989-90 1.6 21.4 31.2 8.1 17.9 0.0 8.8 2.4 3.5 4.2 0.9 100.01990-91 1.2 18.9 31.5 5.3 11.1 0.0 7.0 3.0 2.5 18.2 1.3 100.01991-92 1.4 18.3 35.3 6.3 13.1 0.0 7.2 2.4 1.5 13.4 1.1 100.0
* Before 1982, the "Indo-Chinese category was a catchall category labelled "Other Non-White; in 1988-89, Indo-Chinese responses wereincorporated into the Asian American ethnic category. Pacific Islanders have been consolidated into "All Others". Blanks or zeroes areconsolidated into "No Response".
Support Programs - Educational Opportunity Program

Statistical Abstract 191
Academic and Support Programs
The California State University is committed to providingopportunities in higher education to students withdisabilities by making its programs, activities, and facilitiesfully accessible to persons with disabilities.
Some CSU campuses began providing specializedservices to students with disabilities in the 1960s. In 1973,several campuses received State funding for this purpose.By 1979, all CSU campuses received State funds todevelop disabled student services programs and servequalified students attending the CSU. Since then, thenumber of students receiving services from the DisabledStudent Services program and State funding has grownsimultaneously.
Efforts to expand postsecondary educational opportunitiesto people with disabilities were stimulated in large part bythe passage of the Federal Rehabilitation Act of 1973.Since 1973, the California legislature and governor haveenacted a variety of laws to provide special services forstudents with disabilities attending public postsecondaryinstitutions. In addition, the Americans with DisabilitiesAct of 1990 provides civil rights protection to people withdisabilities.
In 1987, the governor signed into law Assembly Bill 746(Hayden) a comprehensive bill which addressedattendance at postsecondary institutions by students withdisabilities. This legislation provides a listing of servicesthat may be provided with State funds, State fundingprovisions, and reporting requirements.
Services provided to students attending the CSU arebased on AB 746 and the Policy for Provision of ServingStudents with Disabilities (AAES 89-07). The systemwidepolicy refines the six types of disabilities by which studentsare categorized for reporting purposes: visual limitation,communication disability, deaf, mobility limitation, learningdisability, and other functional limitations.
Services provided are those that allow students toparticipate in the full range of campus programs andactivities. Some of the services include readers,notetakers, sign language interpreters, transcriptionservices, test-taking assistance, mobility assistance andorientation to campus facilities, registration assistance,
special parking, diagnostic assessment of learningdisability, specialized tutoring, disability-relatedcounseling, and special equipment and materials.
A CSU student's disability is verified when certified by anappropriate professional. Where the nature and extent ofthe disability is obvious, the director of Disabled StudentServices program may verify the disability. A student witha learning disability must provide testing evaluation resultsthat are dated no more than three years prior to the dateof request for learning disability services.
All CSU students with verified disabilities are eligible forservices. Additionally, all students with disabilities whohave transferred and received services from a disabledstudent services program at a California CommunityCollege or University of California are eligible for servicesprovided by a CSU Disabled Student Services program.
Data on students served through Disabled StudentServices provides information on CSU students withverified disabilities who are regularly enrolled and requestand receive special support services through campusDisabled Student Services programs. Those who areenrolled through extended or continuing education,summer session, or those students receiving servicesthrough the National Center on Deafness at CSU,Northridge are not included in data collected by thesystem.
While many students have more than one reporteddisability, the information in the following charts andgraphs describe students by their primary disability, only.
The number of students with disabilities served has grownfrom 3,230 in fall 1979 to 8,968 in fall 1992. Since 1979,the CSU has experienced a dramatic growth in the provisionof services to students with learning disabilities. In fall1979, 94 students with learning disabilities were providedservices. This number increased to 3,994, whichrepresents a growth of over 4,100 percent in thirteenyears. The total number of students with disabilitiesserved in this time increased by over 177 percent. Duringthe same time period, the overall number of studentsattending the CSU grew 13.3 percent.
Support Program - Disabled Student Services Program
Introduction

192
Academic and Support Programs
Figure 16Enrollment Reported by Disabled Student Services Programs, Fall 1979 to Fall 1992
While there are six types of disability categories, thelargest number of students served have learningdisabilities. In fall 1992, 44.5 percent of all students withdisabilities served had learning disabilities as their primarydisability.
Students with disabilities are attracted to and enroll atCSU campuses somewhat differently than studentsgenerally. For example, San Luis Obispo, with only 4.7percent of total CSU enrollment, serves 9.2 percent ofDisabled Student Services program's clients. Fullertonserves 7.0 percent of the CSU’s Disabled Student Servicesclients, but enrolls just 4.0 percent of the system’s students.
As in the CSU student population as a whole, DisabledStudent Services clients are more likely to be women thanmen. Women made up 54.7 percent of total CSUenrollment in fall 1992. Students in DSS programs weresomewhat more likely to be women, making up 57.1percent of program enrollees across the CSU.
Disabled Student Services clients pursue different degreeprograms than other CSU students. The largest gap isfound within Business and Management majors. While19.2 percent of CSU students were pursuing Businessand Management degrees in fall 1992, only 11.4 percentof Disabled Student Services clients were enrolled in suchprograms.
DSS students were also less likely to major in Engineering:only 5.7 percent of the system’s 8,968 DSS clients wereenrolled in engineering programs, while for the CSUpopulation as a whole the proportion was 8.0 percent.Among the programs in which DSS enrollees take agreater interest are Agriculture and Natural Resources(2.8 percent versus 1.6 percent of CSU total enrollment),Psychology (8.5 percent of DSS enrollment versus 5.1percent of total enrollment), and Public Affairs and Services(7.0 percent versus 4.5 percent of total enrollment).
Support Program - Disabled Student Services Program
1979 1980 1981 1982 1983 1984 1985 1986 1987 1988 1989 1990 1991 1992
0
1,000
2,000
3,000
4,000
5,000
6,000
7,000
8,000
9,000
10,000
Students
Year

Statistical Abstract 193
Academic and Support Programs
Figure 17Learning Disabled Students in Disabled Student Services Programs,
Fall 1979 to Fall 1992
Figure 18Disabled Student Services Enrollment by Campus, Fall 1992
Support Program - Disabled Student Services Program
1979 1980 1981 1982 1983 1984 1985 1986 1987 1988 1989 1990 1991 1992
0
500
1,000
1,500
2,000
2,500
3,000
3,500
4,000
Students
Year
San MarcosStanislaus
BakersfieldHumboldt
Dominguez HillsSonomaHaywardPomona
Los AngelesSan Bernardino
FullertonFresno
ChicoSan Francisco
Long BeachSacramento
NorthridgeSan Luis Obispo
San JoseSan Diego
0 100 200 300 400 500 600 700 800 900 1000Enrollment
Campus

194
Academic and Support Programs
Figure 19Disabled Students as a Percentage of Total Student Enrollment, Fall 1992
Support Program - Disabled Student Services Program
StanislausFullerton
Los AngelesPomona
FresnoLong Beach
HaywardSan Francisco
NorthridgeDominguez Hills
All CampusesSan Bernardino
SacramentoSan Jose
San MarcosChico
San DiegoHumboldt
BakersfieldSonoma
San Luis Obispo
0% 1% 2% 3% 4% 5% 6%
Campus
Percent
Figure 20Enrollment of Disabled Students by Type of Disability, Fall 1990 through 1992
5.5%2.2%
36.4%
39.0%
15.6%1.3% 5.0%
2.3%
32.0%
43.8%
15.7%1.2% 5.0%
2.4%
30.5%
44.5%
16.4%
1.2%
Visual Limitation
Communication Disability
Mobility Limitation
Learning Disability
Other Functional Limitations
Deaf
Fall 1990 Fall 1991 Fall 1992

Statistical Abstract 195
Academic and Support Programs
Table 109
Comparison of Disabled Student Services Program and Campus Enrollments
Fall 1990
Disabled Campus Percent of Percent of Percent of AllCampus Students Students Campus Students CSU Disabled CSU Students
Bakersfield 229 5,443 4.2 2.9 0.1Chico 392 16,641 2.4 5.0 0.1Dominguez Hills 227 9,450 2.4 2.9 0.1Fresno 244 19,962 1.2 3.1 0.1Fullerton 444 25,602 1.7 5.6 0.1Hayward 283 13,000 2.2 3.6 0.1Humboldt 245 7,654 3.2 3.1 0.1Long Beach 615 33,991 1.8 7.8 0.2Los Angeles 332 21,596 1.5 4.2 0.1Northridge 687 31,167 2.2 8.7 0.2Pomona 187 19,472 1.0 2.4 0.1Sacramento 656 26,339 2.5 8.3 0.2San Bernardino 255 11,927 2.1 3.2 0.1San Diego 829 35,489 2.3 10.5 0.2San Francisco 512 29,340 1.7 6.5 0.1San Jose 641 30,338 2.1 8.1 0.2San Luis Obispo 784 17,756 4.4 10.0 0.2San Marcos 11 448 2.5 0.1 0.0Sonoma 243 7,627 3.2 3.1 0.1Stanislaus 50 5,811 0.9 0.6 0.0Total 7,866 369,053 2.1 100.0 2.1
Fall 1991
Bakersfield 219 5,436 4.0 2.5 0.1Chico 411 15,679 2.6 4.6 0.1Dominguez Hills 229 10,357 2.2 2.6 0.1Fresno 358 19,823 1.8 4.0 0.1Fullerton 430 25,486 1.7 4.9 0.1Hayward 301 13,124 2.3 3.4 0.1Humboldt 291 7,823 3.7 3.3 0.1Long Beach 812 32,339 2.5 9.2 0.2Los Angeles 350 20,802 1.7 4.0 0.1Northridge 750 30,440 2.5 8.5 0.2Pomona 253 18,777 1.3 2.9 0.1Sacramento 662 25,868 2.6 7.5 0.2San Bernardino 299 12,561 2.4 3.4 0.1San Diego 939 33,407 2.8 10.6 0.3San Francisco 610 27,911 2.2 6.9 0.2San Jose 719 30,061 2.4 8.1 0.2San Luis Obispo 788 17,575 4.5 8.9 0.2San Marcos 33 1,102 3.0 0.4 0.0Sonoma 337 7,543 4.5 3.8 0.1Stanislaus 52 5,790 0.9 0.6 0.0Total 8,843 361,904 2.4 100 2.4
Fall 1992
Bakersfield 206 5,435 3.8 2.3 0.1Chico 447 15,172 2.9 5.0 0.1Dominguez Hills 269 10,477 2.6 3.0 0.1Fresno 363 18,906 1.9 4.0 0.1Fullerton 360 24,411 1.5 4.0 0.1Hayward 304 12,986 2.3 3.4 0.1Humboldt 245 7,854 3.1 2.7 0.1Long Beach 673 30,071 2.2 7.5 0.2Los Angeles 337 19,403 1.7 3.8 0.1Northridge 729 29,092 2.5 8.1 0.2Pomona 328 18,298 1.8 3.7 0.1Sacramento 674 24,468 2.8 7.5 0.2San Bernardino 340 12,485 2.7 3.8 0.1San Diego 941 30,887 3.0 10.5 0.3San Francisco 650 26,530 2.5 7.2 0.2San Jose 851 29,626 2.9 9.5 0.2San Luis Obispo 829 16,378 5.1 9.2 0.2San Marcos 56 1,904 2.9 0.6 0.0Sonoma 296 7,403 4.0 3.3 0.1Stanislaus 70 5,907 1.2 0.8 0.0Total 8,968 347,693 2.6 100 2.6
Support Program - Disabled Student Services Program
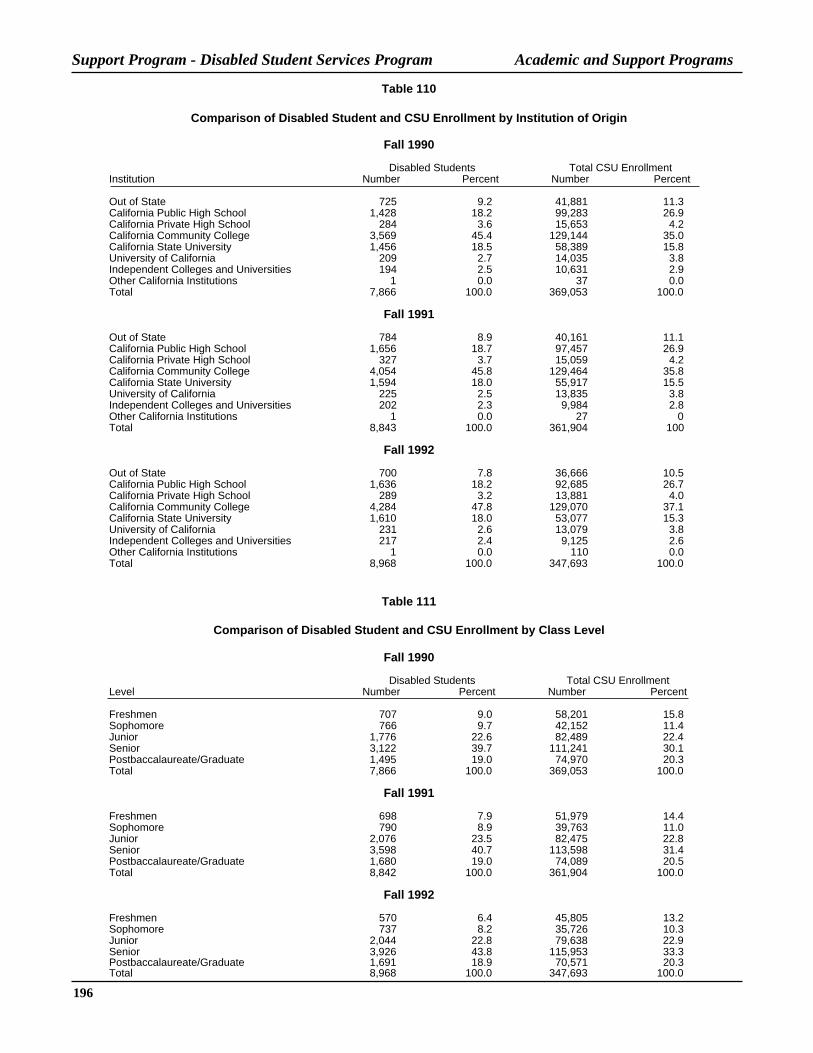
196
Academic and Support Programs
Table 110
Comparison of Disabled Student and CSU Enrollment by Institution of Origin
Fall 1990
Disabled Students Total CSU EnrollmentInstitution Number Percent Number Percent
Out of State 725 9.2 41,881 11.3California Public High School 1,428 18.2 99,283 26.9California Private High School 284 3.6 15,653 4.2California Community College 3,569 45.4 129,144 35.0California State University 1,456 18.5 58,389 15.8University of California 209 2.7 14,035 3.8Independent Colleges and Universities 194 2.5 10,631 2.9Other California Institutions 1 0.0 37 0.0Total 7,866 100.0 369,053 100.0
Fall 1991
Out of State 784 8.9 40,161 11.1California Public High School 1,656 18.7 97,457 26.9California Private High School 327 3.7 15,059 4.2California Community College 4,054 45.8 129,464 35.8California State University 1,594 18.0 55,917 15.5University of California 225 2.5 13,835 3.8Independent Colleges and Universities 202 2.3 9,984 2.8Other California Institutions 1 0.0 27 0Total 8,843 100.0 361,904 100
Fall 1992
Out of State 700 7.8 36,666 10.5California Public High School 1,636 18.2 92,685 26.7California Private High School 289 3.2 13,881 4.0California Community College 4,284 47.8 129,070 37.1California State University 1,610 18.0 53,077 15.3University of California 231 2.6 13,079 3.8Independent Colleges and Universities 217 2.4 9,125 2.6Other California Institutions 1 0.0 110 0.0Total 8,968 100.0 347,693 100.0
Table 111
Comparison of Disabled Student and CSU Enrollment by Class Level
Fall 1990
Disabled Students Total CSU EnrollmentLevel Number Percent Number Percent
Freshmen 707 9.0 58,201 15.8Sophomore 766 9.7 42,152 11.4Junior 1,776 22.6 82,489 22.4Senior 3,122 39.7 111,241 30.1Postbaccalaureate/Graduate 1,495 19.0 74,970 20.3Total 7,866 100.0 369,053 100.0
Fall 1991
Freshmen 698 7.9 51,979 14.4Sophomore 790 8.9 39,763 11.0Junior 2,076 23.5 82,475 22.8Senior 3,598 40.7 113,598 31.4Postbaccalaureate/Graduate 1,680 19.0 74,089 20.5Total 8,842 100.0 361,904 100.0
Fall 1992
Freshmen 570 6.4 45,805 13.2Sophomore 737 8.2 35,726 10.3Junior 2,044 22.8 79,638 22.9Senior 3,926 43.8 115,953 33.3Postbaccalaureate/Graduate 1,691 18.9 70,571 20.3Total 8,968 100.0 347,693 100.0
Support Program - Disabled Student Services Program

Statistical Abstract 197
Academic and Support Programs
Table 112
Gender Representation in Disabled Student Services Programs
Fall 1990
Disabled Students Campus PopulationCampus Women Total Percent Women Percent Women
Bakersfield 137 229 59.8 61.9Chico 213 392 54.3 50.8Dominguez Hills 146 227 64.3 61.9Fresno 127 244 52.0 54.4Fullerton 246 444 55.4 55.6Hayward 185 283 65.4 60.9Humboldt 130 245 53.1 48.3Long Beach 341 615 55.4 53.8Los Angeles 188 332 56.6 57.5Northridge 384 687 55.9 57.0Pomona 86 187 46.0 42.4Sacramento 376 656 57.3 56.6San Bernardino 155 255 60.8 60.6San Diego 451 829 54.4 53.5San Francisco 306 512 59.8 59.1San Jose 402 641 62.7 51.8San Luis Obispo 358 784 45.7 42.6San Marcos 8 11 72.7 72.1Sonoma 161 243 66.3 62.2Stanislaus 27 50 54.0 63.0Total 4,427 7,866 56.3 54.6
Fall 1991
Bakersfield 133 219 60.7 61.1Chico 209 411 50.9 50.8Dominguez Hills 159 229 69.4 63.0Fresno 191 358 53.4 54.8Fullerton 243 430 56.5 55.6Hayward 197 301 65.4 61.1Humboldt 141 291 48.5 48.9Long Beach 444 812 54.7 53.9Los Angeles 211 350 60.3 57.6Northridge 449 750 59.9 57.3Pomona 126 253 49.8 42.2Sacramento 380 662 57.4 56.3San Bernardino 187 299 62.5 60.4San Diego 537 939 57.2 53.4San Francisco 370 610 60.7 58.9San Jose 435 719 60.5 51.7San Luis Obispo 335 788 42.5 42.7San Marcos 26 33 78.8 72.8Sonoma 233 337 69.1 62.7Stanislaus 29 52 55.8 63.0Total 5,035 8,843 56.9 54.7
Fall 1992
Bakersfield 134 206 65.0 61.5Chico 222 447 49.7 50.5Dominguez Hills 191 269 71.0 63.1Fresno 208 363 57.3 54.5Fullerton 214 360 59.4 56.1Hayward 197 304 64.8 61.2Humboldt 123 245 50.2 48.5Long Beach 368 673 54.7 53.8Los Angeles 206 337 61.1 57.7Northridge 439 729 60.2 57.5Pomona 162 328 49.4 41.7Sacramento 373 674 55.3 55.6San Bernardino 219 340 64.4 60.7San Diego 536 941 57.0 53.5San Francisco 383 650 58.9 58.4San Jose 525 851 61.7 52.1San Luis Obispo 359 829 43.3 42.1San Marcos 43 56 76.8 71.2Sonoma 178 296 60.1 62.9Stanislaus 41 70 58.6 62.9Total 5,121 8,968 57.1 54.7
Support Program - Disabled Student Services Program
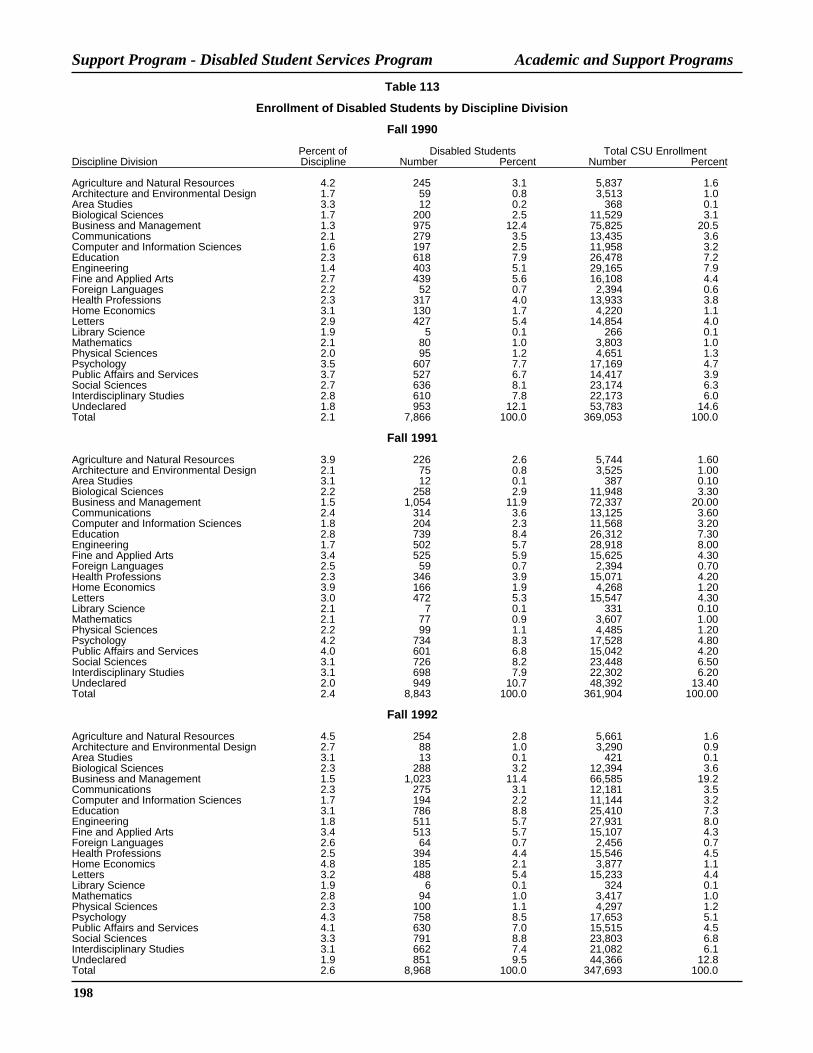
198
Academic and Support ProgramsSupport Program - Disabled Student Services Program
Table 113
Enrollment of Disabled Students by Discipline Division
Fall 1990
Percent of Disabled Students Total CSU EnrollmentDiscipline Division Discipline Number Percent Number Percent
Agriculture and Natural Resources 4.2 245 3.1 5,837 1.6Architecture and Environmental Design 1.7 59 0.8 3,513 1.0Area Studies 3.3 12 0.2 368 0.1Biological Sciences 1.7 200 2.5 11,529 3.1Business and Management 1.3 975 12.4 75,825 20.5Communications 2.1 279 3.5 13,435 3.6Computer and Information Sciences 1.6 197 2.5 11,958 3.2Education 2.3 618 7.9 26,478 7.2Engineering 1.4 403 5.1 29,165 7.9Fine and Applied Arts 2.7 439 5.6 16,108 4.4Foreign Languages 2.2 52 0.7 2,394 0.6Health Professions 2.3 317 4.0 13,933 3.8Home Economics 3.1 130 1.7 4,220 1.1Letters 2.9 427 5.4 14,854 4.0Library Science 1.9 5 0.1 266 0.1Mathematics 2.1 80 1.0 3,803 1.0Physical Sciences 2.0 95 1.2 4,651 1.3Psychology 3.5 607 7.7 17,169 4.7Public Affairs and Services 3.7 527 6.7 14,417 3.9Social Sciences 2.7 636 8.1 23,174 6.3Interdisciplinary Studies 2.8 610 7.8 22,173 6.0Undeclared 1.8 953 12.1 53,783 14.6Total 2.1 7,866 100.0 369,053 100.0
Fall 1991
Agriculture and Natural Resources 3.9 226 2.6 5,744 1.60Architecture and Environmental Design 2.1 75 0.8 3,525 1.00Area Studies 3.1 12 0.1 387 0.10Biological Sciences 2.2 258 2.9 11,948 3.30Business and Management 1.5 1,054 11.9 72,337 20.00Communications 2.4 314 3.6 13,125 3.60Computer and Information Sciences 1.8 204 2.3 11,568 3.20Education 2.8 739 8.4 26,312 7.30Engineering 1.7 502 5.7 28,918 8.00Fine and Applied Arts 3.4 525 5.9 15,625 4.30Foreign Languages 2.5 59 0.7 2,394 0.70Health Professions 2.3 346 3.9 15,071 4.20Home Economics 3.9 166 1.9 4,268 1.20Letters 3.0 472 5.3 15,547 4.30Library Science 2.1 7 0.1 331 0.10Mathematics 2.1 77 0.9 3,607 1.00Physical Sciences 2.2 99 1.1 4,485 1.20Psychology 4.2 734 8.3 17,528 4.80Public Affairs and Services 4.0 601 6.8 15,042 4.20Social Sciences 3.1 726 8.2 23,448 6.50Interdisciplinary Studies 3.1 698 7.9 22,302 6.20Undeclared 2.0 949 10.7 48,392 13.40Total 2.4 8,843 100.0 361,904 100.00
Fall 1992
Agriculture and Natural Resources 4.5 254 2.8 5,661 1.6Architecture and Environmental Design 2.7 88 1.0 3,290 0.9Area Studies 3.1 13 0.1 421 0.1Biological Sciences 2.3 288 3.2 12,394 3.6Business and Management 1.5 1,023 11.4 66,585 19.2Communications 2.3 275 3.1 12,181 3.5Computer and Information Sciences 1.7 194 2.2 11,144 3.2Education 3.1 786 8.8 25,410 7.3Engineering 1.8 511 5.7 27,931 8.0Fine and Applied Arts 3.4 513 5.7 15,107 4.3Foreign Languages 2.6 64 0.7 2,456 0.7Health Professions 2.5 394 4.4 15,546 4.5Home Economics 4.8 185 2.1 3,877 1.1Letters 3.2 488 5.4 15,233 4.4Library Science 1.9 6 0.1 324 0.1Mathematics 2.8 94 1.0 3,417 1.0Physical Sciences 2.3 100 1.1 4,297 1.2Psychology 4.3 758 8.5 17,653 5.1Public Affairs and Services 4.1 630 7.0 15,515 4.5Social Sciences 3.3 791 8.8 23,803 6.8Interdisciplinary Studies 3.1 662 7.4 21,082 6.1Undeclared 1.9 851 9.5 44,366 12.8Total 2.6 8,968 100.0 347,693 100.0
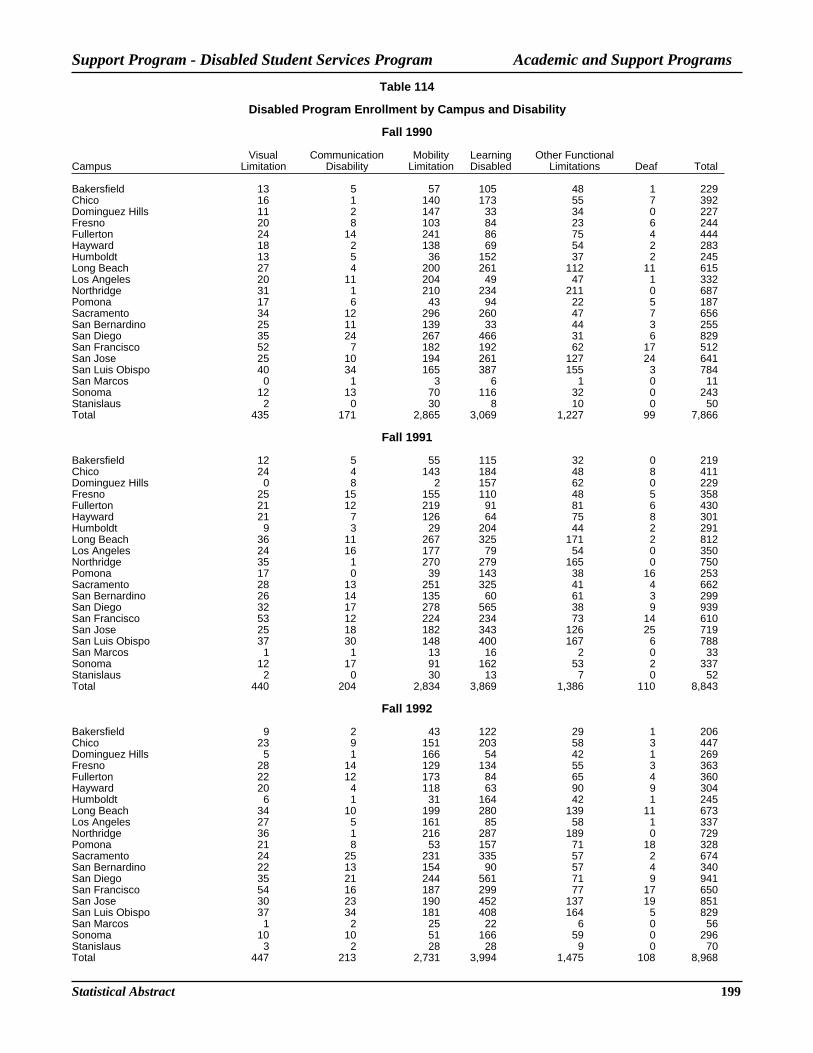
Statistical Abstract 199
Academic and Support Programs
Table 114
Disabled Program Enrollment by Campus and Disability
Fall 1990
Visual Communication Mobility Learning Other FunctionalCampus Limitation Disability Limitation Disabled Limitations Deaf Total
Bakersfield 13 5 57 105 48 1 229Chico 16 1 140 173 55 7 392Dominguez Hills 11 2 147 33 34 0 227Fresno 20 8 103 84 23 6 244Fullerton 24 14 241 86 75 4 444Hayward 18 2 138 69 54 2 283Humboldt 13 5 36 152 37 2 245Long Beach 27 4 200 261 112 11 615Los Angeles 20 11 204 49 47 1 332Northridge 31 1 210 234 211 0 687Pomona 17 6 43 94 22 5 187Sacramento 34 12 296 260 47 7 656San Bernardino 25 11 139 33 44 3 255San Diego 35 24 267 466 31 6 829San Francisco 52 7 182 192 62 17 512San Jose 25 10 194 261 127 24 641San Luis Obispo 40 34 165 387 155 3 784San Marcos 0 1 3 6 1 0 11Sonoma 12 13 70 116 32 0 243Stanislaus 2 0 30 8 10 0 50Total 435 171 2,865 3,069 1,227 99 7,866
Fall 1991
Bakersfield 12 5 55 115 32 0 219Chico 24 4 143 184 48 8 411Dominguez Hills 0 8 2 157 62 0 229Fresno 25 15 155 110 48 5 358Fullerton 21 12 219 91 81 6 430Hayward 21 7 126 64 75 8 301Humboldt 9 3 29 204 44 2 291Long Beach 36 11 267 325 171 2 812Los Angeles 24 16 177 79 54 0 350Northridge 35 1 270 279 165 0 750Pomona 17 0 39 143 38 16 253Sacramento 28 13 251 325 41 4 662San Bernardino 26 14 135 60 61 3 299San Diego 32 17 278 565 38 9 939San Francisco 53 12 224 234 73 14 610San Jose 25 18 182 343 126 25 719San Luis Obispo 37 30 148 400 167 6 788San Marcos 1 1 13 16 2 0 33Sonoma 12 17 91 162 53 2 337Stanislaus 2 0 30 13 7 0 52Total 440 204 2,834 3,869 1,386 110 8,843
Fall 1992
Bakersfield 9 2 43 122 29 1 206Chico 23 9 151 203 58 3 447Dominguez Hills 5 1 166 54 42 1 269Fresno 28 14 129 134 55 3 363Fullerton 22 12 173 84 65 4 360Hayward 20 4 118 63 90 9 304Humboldt 6 1 31 164 42 1 245Long Beach 34 10 199 280 139 11 673Los Angeles 27 5 161 85 58 1 337Northridge 36 1 216 287 189 0 729Pomona 21 8 53 157 71 18 328Sacramento 24 25 231 335 57 2 674San Bernardino 22 13 154 90 57 4 340San Diego 35 21 244 561 71 9 941San Francisco 54 16 187 299 77 17 650San Jose 30 23 190 452 137 19 851San Luis Obispo 37 34 181 408 164 5 829San Marcos 1 2 25 22 6 0 56Sonoma 10 10 51 166 59 0 296Stanislaus 3 2 28 28 9 0 70Total 447 213 2,731 3,994 1,475 108 8,968
Support Program - Disabled Student Services Program

200
Academic and Support Programs
Table 115
Disabled Program Enrollment by Disability and Discipline Division
Fall 1990
Visual Communication Mobility Learning Other FunctionalDiscipline Division Limitation Disability Limitation Disabled Limitations Deaf Total
Agriculture and Natural Resources 12 6 39 158 30 0 245Architecture and Environmental Design 1 3 15 28 11 1 59Area Studies 0 1 6 3 2 0 12Biological Sciences 4 10 69 85 30 2 200Business and Management 51 27 413 328 151 5 975Communications 12 9 107 109 37 5 279Computer and Information Scineces 21 3 98 45 28 2 197Education 37 17 224 254 76 10 618Engineering 19 19 122 165 71 7 403Fine and Applied Arts 21 5 177 176 53 7 439Foreign Languages 5 1 23 15 8 0 52Health Professions 12 7 129 110 51 8 317Home Economics 3 2 36 54 34 1 130Letters 29 4 150 166 75 3 427Library Science 0 0 3 0 2 0 5Mathematics 4 0 25 32 19 0 80Physical Sciences 5 2 30 41 15 2 95Psychology 47 7 209 233 105 6 607Public Affairs and Services 30 10 200 226 54 7 527Social Sciences 32 10 212 251 127 4 636Interdisciplinary Studies 33 11 193 266 96 11 610Undeclared 57 17 385 324 152 18 953Total 435 171 2,865 3,069 1,227 99 7,866
Fall 1991
Agriculture and Natural Resources 8 4 31 149 32 2 226Architecture and Environmental Design 1 2 17 42 10 3 75Area Studies 0 0 5 4 3 0 12Biological Sciences 8 7 75 124 43 1 258Business and Management 38 31 423 386 167 9 1,054Communications 13 8 105 144 41 3 314Computer and Information Scineces 18 3 76 70 33 4 204Education 47 22 238 342 83 7 739Engineering 20 23 130 223 93 13 502Fine and Applied Arts 25 7 163 240 82 8 525Foreign Languages 6 0 26 17 10 0 59Health Professions 9 9 120 143 55 10 346Home Economics 6 4 47 69 40 0 166Letters 28 13 153 194 80 4 472Library Science 0 0 5 0 2 0 7Mathematics 6 1 17 33 19 1 77Physical Sciences 5 0 27 53 13 1 99Psychology 54 9 227 310 123 11 734Public Affairs and Services 35 15 187 278 82 4 601Social Sciences 34 12 241 310 126 3 726Interdisciplinary Studies 34 13 195 337 107 12 698Undeclared 45 21 326 401 142 14 949Total 440 204 2,834 3,869 1,386 110 8,843
Fall 1992
Agriculture and Natural Resources 11 7 50 142 41 3 254Architecture and Environmental Design 0 3 15 54 15 1 88Area Studies 1 2 5 3 2 0 13Biological Sciences 7 3 75 156 46 1 288Business and Management 45 34 385 382 170 7 1,023Communications 11 4 89 130 39 2 275Computer and Information Scineces 9 6 77 62 33 7 194Education 58 17 264 350 86 11 786Engineering 20 27 125 232 100 7 511Fine and Applied Arts 22 7 132 264 82 6 513Foreign Languages 10 0 18 24 12 0 64Health Professions 15 15 125 165 64 10 394Home Economics 8 5 55 74 42 1 185Letters 24 12 151 210 86 5 488Library Science 0 2 2 0 2 0 6Mathematics 7 3 21 37 24 2 94Physical Sciences 6 1 26 51 15 1 100Psychology 45 8 228 319 149 9 758Public Affairs and Services 31 9 190 288 103 9 630Social Sciences 37 12 241 362 134 5 791Interdisciplinary Studies 34 18 187 314 101 8 662Undeclared 46 18 270 375 129 13 851Total 447 213 2,731 3,994 1,475 108 8,968
Support Program - Disabled Student Services Program

Statistical Abstract 201
Academic and Support Programs
Table 116
Percent of Campus Disabled Student Enrollment by Disability
Fall 1990
Visual Communication Mobility Learning Other FunctionalCampus Limitation Disability Limitation Disabled Limitations Deaf Total
Bakersfield 5.7 2.2 24.9 45.9 21.0 0.4 100.0Chico 4.1 0.3 35.7 44.1 14.0 1.8 100.0Dominguez Hills 4.8 0.9 64.8 14.5 15.0 0.0 100.0Fresno 8.2 3.3 42.2 34.4 9.4 2.5 100.0Fullerton 5.4 3.2 54.3 19.4 16.9 0.9 100.0Hayward 6.4 0.7 48.8 24.4 19.1 0.7 100.0Humboldt 5.3 2.0 14.7 62.0 15.1 0.8 100.0Long Beach 4.4 0.7 32.5 42.4 18.2 1.8 100.0Los Angeles 6.0 3.3 61.4 14.8 14.2 0.3 100.0Northridge 4.5 0.1 30.6 34.1 30.7 0.0 100.0Pomona 9.1 3.2 23.0 50.3 11.8 2.7 100.0Sacramento 5.2 1.8 45.1 39.6 7.2 1.1 100.0San Bernardino 9.8 4.3 54.5 12.9 17.3 1.2 100.0San Diego 4.2 2.9 32.2 56.2 3.7 0.7 100.0San Francisco 10.2 1.4 35.5 37.5 12.1 3.3 100.0San Jose 3.9 1.6 30.3 40.7 19.8 3.7 100.0San Luis Obispo 5.1 4.3 21.0 49.4 19.8 0.4 100.0San Marcos 0.0 9.1 27.3 54.5 9.1 0.0 100.0Sonoma 4.9 5.3 28.8 47.7 13.2 0.0 100.0Stanislaus 4.0 0.0 60.0 16.0 20.0 0.0 100.0Total 5.5 2.2 36.4 39.0 15.6 1.3 100.0
Fall 1991
Bakersfield 5.5 2.3 25.1 52.5 14.6 0.0 100.0Chico 5.8 1.0 34.8 44.8 11.7 1.9 100.0Dominguez Hills 0.0 3.5 0.9 68.6 27.1 0.0 100.0Fresno 7.0 4.2 43.3 30.7 13.4 1.4 100.0Fullerton 4.9 2.8 50.9 21.2 18.8 1.4 100.0Hayward 7.0 2.3 41.9 21.3 24.9 2.7 100.0Humboldt 3.1 1.0 10.0 70.1 15.1 0.7 100.0Long Beach 4.4 1.4 32.9 40.0 21.1 0.2 100.0Los Angeles 6.9 4.6 50.6 22.6 15.4 0.0 100.0Northridge 4.7 0.1 36.0 37.2 22.0 0.0 100.0Pomona 6.7 0.0 15.4 56.5 15.0 6.3 100.0Sacramento 4.2 2.0 37.9 49.1 6.2 0.6 100.0San Bernardino 8.7 4.7 45.2 20.1 20.4 1.0 100.0San Diego 3.4 1.8 29.6 60.2 4.0 1.0 100.0San Francisco 8.7 2.0 36.7 38.4 12.0 2.3 100.0San Jose 3.5 2.5 25.3 47.7 17.5 3.5 100.0San Luis Obispo 4.7 3.8 18.8 50.8 21.2 0.8 100.0San Marcos 3.0 3.0 39.4 48.5 6.1 0.0 100.0Sonoma 3.6 5.0 27.0 48.1 15.7 0.6 100.0Stanislaus 3.8 0.0 57.7 25.0 13.5 0.0 100.0Total 5.0 2.3 32.0 43.8 15.7 1.2 100.0
Fall 1992
Bakersfield 4.4 1.0 20.9 59.2 14.1 0.5 100.0Chico 5.1 2.0 33.8 45.4 13.0 0.7 100.0Dominguez Hills 1.9 0.4 61.7 20.1 15.6 0.4 100.0Fresno 7.7 3.9 35.5 36.9 15.2 0.8 100.0Fullerton 6.1 3.3 48.1 23.3 18.1 1.1 100.0Hayward 6.6 1.3 38.8 20.7 29.6 3.0 100.0Humboldt 2.4 0.4 12.7 66.9 17.1 0.4 100.0Long Beach 5.1 1.5 29.6 41.6 20.7 1.6 100.0Los Angeles 8.0 1.5 47.8 25.2 17.2 0.3 100.0Northridge 4.9 0.1 29.6 39.4 25.9 0.0 100.0Pomona 6.4 2.4 16.2 47.9 21.6 5.5 100.0Sacramento 3.6 3.7 34.3 49.7 8.5 0.3 100.0San Bernardino 6.5 3.8 45.3 26.5 16.8 1.2 100.0San Diego 3.7 2.2 25.9 59.6 7.5 1.0 100.0San Francisco 8.3 2.5 28.8 46.0 11.8 2.6 100.0San Jose 3.5 2.7 22.3 53.1 16.1 2.2 100.0San Luis Obispo 4.5 4.1 21.8 49.2 19.8 0.6 100.0San Marcos 1.8 3.6 44.6 39.3 10.7 0.0 100.0Sonoma 3.4 3.4 17.2 56.1 19.9 0.0 100.0Stanislaus 4.3 2.9 40.0 40.0 12.9 0.0 100.0Total 5.0 2.4 30.5 44.5 16.4 1.2 100.0
Support Program - Disabled Student Services Program

202
Academic and Support Programs
Table 117
Percent Distribution of Disabled Students in Discipline Divisions, by Disability
Fall 1990
Visual Communication Mobility Learning Other FunctionalDiscipline Division Limitation Disability Limitation Disabled Limitations Deaf Total
Agriculture and Natural Resources 4.9 2.4 15.9 64.5 12.2 0.0 100.0Architecture and Environmental Design 1.7 5.1 25.4 47.5 18.6 1.7 100.0Area Studies 0.0 8.3 50.0 25.0 16.7 0.0 100.0Biological Sciences 2.0 5.0 34.5 42.5 15.0 1.0 100.0Business and Management 5.2 2.8 42.4 33.6 15.5 0.5 100.0Communications 4.3 3.2 38.4 39.1 13.3 1.8 100.0Computer and Information Scineces 10.7 1.5 49.7 22.8 14.2 1.0 100.0Education 6.0 2.8 36.2 41.1 12.3 1.6 100.0Engineering 4.7 4.7 30.3 40.9 17.6 1.7 100.0Fine and Applied Arts 4.8 1.1 40.3 40.1 12.1 1.6 100.0Foreign Languages 9.6 1.9 44.2 28.8 15.4 0.0 100.0Health Professions 3.8 2.2 40.7 34.7 16.1 2.5 100.0Home Economics 2.3 1.5 27.7 41.5 26.2 0.8 100.0Letters 6.8 0.9 35.1 38.9 17.6 0.7 100.0Library Science 0.0 0.0 60.0 0.0 40.0 0.0 100.0Mathematics 5.0 0.0 31.3 40.0 23.8 0.0 100.0Physical Sciences 5.3 2.1 31.6 43.2 15.8 2.1 100.0Psychology 7.7 1.2 34.4 38.4 17.3 1.0 100.0Public Affairs and Services 5.7 1.9 38.0 42.9 10.2 1.3 100.0Social Sciences 5.0 1.6 33.3 39.5 20.0 0.6 100.0Interdisciplinary Studies 5.4 1.8 31.6 43.6 15.7 1.8 100.0Undeclared 6.0 1.8 40.4 34.0 15.9 1.9 100.0Total 5.5 2.2 36.4 39.0 15.6 1.3 100.0
Fall 1991
Agriculture and Natural Resources 3.5 1.8 13.7 65.9 14.2 0.9 100.0Architecture and Environmental Design 1.3 2.7 22.7 56.0 13.3 4.0 100.0Area Studies 0.0 0.0 41.7 33.3 25.0 0.0 100.0Biological Sciences 3.1 2.7 29.1 48.1 16.7 0.4 100.0Business and Management 3.6 2.9 40.1 36.6 15.8 0.9 100.0Communications 4.1 2.5 33.4 45.9 13.1 1.0 100.0Computer and Information Sciences 8.8 1.5 37.3 34.3 16.2 2.0 100.0Education 6.4 3.0 32.2 46.3 11.2 0.9 100.0Engineering 4.0 4.6 25.9 44.4 18.5 2.6 100.0Fine and Applied Arts 4.8 1.3 31.0 45.7 15.6 1.5 100.0Foreign Languages 10.2 0.0 44.1 28.8 16.9 0.0 100.0Health Professions 2.6 2.6 34.7 41.3 15.9 2.9 100.0Home Economics 3.6 2.4 28.3 41.6 24.1 0.0 100.0Letters 5.9 2.8 32.4 41.1 16.9 0.8 100.0Library Science 0.0 0.0 71.4 0.0 28.6 0.0 100.0Mathematics 7.8 1.3 22.1 42.9 24.7 1.3 100.0Physical Sciences 5.1 0.0 27.3 53.5 13.1 1.0 100.0Psychology 7.4 1.2 30.9 42.2 16.8 1.5 100.0Public Affairs and Services 5.8 2.5 31.1 46.3 13.6 0.7 100.0Social Sciences 4.7 1.7 33.2 42.7 17.4 0.4 100.0Interdisciplinary Studies 4.9 1.9 27.9 48.3 15.3 1.7 100.0Undeclared 4.7 2.2 34.4 42.3 15.0 1.5 100.0Total 5.0 2.3 32.0 43.8 15.7 1.2 100.0
Fall 1992
Agriculture and Natural Resources 4.3 2.8 19.7 55.9 16.1 1.2 100.0Architecture and Environmental Design 0.0 3.4 17.0 61.4 17.0 1.1 100.0Area Studies 7.7 15.4 38.5 23.1 15.4 0.0 100.0Biological Sciences 2.4 1.0 26.0 54.2 16.0 0.3 100.0Business and Management 4.4 3.3 37.6 37.3 16.6 0.7 100.0Communications 4.0 1.5 32.4 47.3 14.2 0.7 100.0Computer and Information Scineces 4.6 3.1 39.7 32.0 17.0 3.6 100.0Education 7.4 2.2 33.6 44.5 10.9 1.4 100.0Engineering 3.9 5.3 24.5 45.4 19.6 1.4 100.0Fine and Applied Arts 4.3 1.4 25.7 51.5 16.0 1.2 100.0Foreign Languages 15.6 0.0 28.1 37.5 18.8 0.0 100.0Health Professions 3.8 3.8 31.7 41.9 16.2 2.5 100.0Home Economics 4.3 2.7 29.7 40.0 22.7 0.5 100.0Letters 4.9 2.5 30.9 43.0 17.6 1.0 100.0Library Science 0.0 33.3 33.3 0.0 33.3 0.0 100.0Mathematics 7.4 3.2 22.3 39.4 25.5 2.1 100.0Physical Sciences 6.0 1.0 26.0 51.0 15.0 1.0 100.0Psychology 5.9 1.1 30.1 42.1 19.7 1.2 100.0Public Affairs and Services 4.9 1.4 30.2 45.7 16.3 1.4 100.0Social Sciences 4.7 1.5 30.5 45.8 16.9 0.6 100.0Interdisciplinary Studies 5.1 2.7 28.2 47.4 15.3 1.2 100.0Undeclared 5.4 2.1 31.7 44.1 15.2 1.5 100.0Total 5.0 2.4 30.5 44.5 16.4 1.2 100.0
Support Program - Disabled Student Services Program

Statistical Abstract 203
Academic and Support Programs
Table 118
Percent Distribution of Disabilities by Campus
Fall 1990
Visual Communication Mobility Learning Other FunctionalCampus Limitation Disability Limitation Disabled Limitations Deaf Total
Bakersfield 3.0 2.9 2.0 3.4 3.9 1.0 2.9Chico 3.7 0.6 4.9 5.6 4.5 7.1 5.0Dominguez Hills 2.5 1.2 5.1 1.1 2.8 0.0 2.9Fresno 4.6 4.7 3.6 2.7 1.9 6.1 3.1Fullerton 5.5 8.2 8.4 2.8 6.1 4.0 5.6Hayward 4.1 1.2 4.8 2.2 4.4 2.0 3.6Humboldt 3.0 2.9 1.3 5.0 3.0 2.0 3.1Long Beach 6.2 2.3 7.0 8.5 9.1 11.1 7.8Los Angeles 4.6 6.4 7.1 1.6 3.8 1.0 4.2Northridge 7.1 0.6 7.3 7.6 17.2 0.0 8.7Pomona 3.9 3.5 1.5 3.1 1.8 5.1 2.4Sacramento 7.8 7.0 10.3 8.5 3.8 7.1 8.3San Bernardino 5.7 6.4 4.9 1.1 3.6 3.0 3.2San Diego 8.0 14.0 9.3 15.2 2.5 6.1 10.5San Francisco 12.0 4.1 6.4 6.3 5.1 17.2 6.5San Jose 5.7 5.8 6.8 8.5 10.4 24.2 8.1San Luis Obispo 9.2 19.9 5.8 12.6 12.6 3.0 10.0San Marcos 0.0 0.6 0.1 0.2 0.1 0.0 0.1Sonoma 2.8 7.6 2.4 3.8 2.6 0.0 3.1Stanislaus 0.5 0.0 1.0 0.3 0.8 0.0 0.6Total 100.0 100.0 100.0 100.0 100.0 100.0 100.0
Fall 1991
Bakersfield 2.7 2.5 1.9 3.0 2.3 0.0 2.5Chico 5.5 2.0 5.0 4.8 3.5 7.3 4.6Dominguez Hills 0.0 3.9 0.1 4.1 4.5 0.0 2.6Fresno 5.7 7.4 5.5 2.8 3.5 4.5 4.0Fullerton 4.8 5.9 7.7 2.4 5.8 5.5 4.9Hayward 4.8 3.4 4.4 1.7 5.4 7.3 3.4Humboldt 2.0 1.5 1.0 5.3 3.2 1.8 3.3Long Beach 8.2 5.4 9.4 8.4 12.3 1.8 9.2Los Angeles 5.5 7.8 6.2 2.0 3.9 0.0 4.0Northridge 8.0 0.5 9.5 7.2 11.9 0.0 8.5Pomona 3.9 0.0 1.4 3.7 2.7 14.5 2.9Sacramento 6.4 6.4 8.9 8.4 3.0 3.6 7.5San Bernardino 5.9 6.9 4.8 1.6 4.4 2.7 3.4San Diego 7.3 8.3 9.8 14.6 2.7 8.2 10.6San Francisco 12.0 5.9 7.9 6.0 5.3 12.7 6.9San Jose 5.7 8.8 6.4 8.9 9.1 22.7 8.1San Luis Obispo 8.4 14.7 5.2 10.3 12.0 5.5 8.9San Marcos 0.2 0.5 0.5 0.4 0.1 0.0 0.4Sonoma 2.7 8.3 3.2 4.2 3.8 1.8 3.8Stanislaus 0.5 0.0 1.1 0.3 0.5 0.0 0.6Total 100.0 100.0 100.0 100.0 100.0 100.0 100.0
Fall 1992
Bakersfield 2.0 0.9 1.6 3.1 2.0 0.9 2.3Chico 5.1 4.2 5.5 5.1 3.9 2.8 5.0Dominguez Hills 1.1 0.5 6.1 1.4 2.8 0.9 3.0Fresno 6.3 6.6 4.7 3.4 3.7 2.8 4.0Fullerton 4.9 5.6 6.3 2.1 4.4 3.7 4.0Hayward 4.5 1.9 4.3 1.6 6.1 8.3 3.4Humboldt 1.3 0.5 1.1 4.1 2.8 0.9 2.7Long Beach 7.6 4.7 7.3 7.0 9.4 10.2 7.5Los Angeles 6.0 2.3 5.9 2.1 3.9 0.9 3.8Northridge 8.1 0.5 7.9 7.2 12.8 0.0 8.1Pomona 4.7 3.8 1.9 3.9 4.8 16.7 3.7Sacramento 5.4 11.7 8.5 8.4 3.9 1.9 7.5San Bernardino 4.9 6.1 5.6 2.3 3.9 3.7 3.8San Diego 7.8 9.9 8.9 14.0 4.8 8.3 10.5San Francisco 12.1 7.5 6.8 7.5 5.2 15.7 7.2San Jose 6.7 10.8 7.0 11.3 9.3 17.6 9.5San Luis Obispo 8.3 16.0 6.6 10.2 11.1 4.6 9.2San Marcos 0.2 0.9 0.9 0.6 0.4 0.0 0.6Sonoma 2.2 4.7 1.9 4.2 4.0 0.0 3.3Stanislaus 0.7 0.9 1.0 0.7 0.6 0.0 0.8Total 100.0 100.0 100.0 100.0 100.0 100.0 100.0
Support Program - Disabled Student Services Program

204
Academic and Support Programs
Table 119
Percent Distribution by Discipline Division of Disabilities
Fall 1990
Visual Communication Mobility Learning Other FunctionalDiscipline Division Limitation Disability Limitation Disabled Limitations Deaf Total
Agriculture and Natural Resources 2.8 3.5 1.4 5.1 2.4 0.0 3.1Architecture and Environmental Design 0.2 1.8 0.5 0.9 0.9 1.0 0.8Area Studies 0.0 0.6 0.2 0.1 0.2 0.0 0.2Biological Sciences 0.9 5.8 2.4 2.8 2.4 2.0 2.5Business and Management 11.7 15.8 14.4 10.7 12.3 5.1 12.4Communications 2.8 5.3 3.7 3.6 3.0 5.1 3.5Computer and Information Scineces 4.8 1.8 3.4 1.5 2.3 2.0 2.5Education 8.5 9.9 7.8 8.3 6.2 10.1 7.9Engineering 4.4 11.1 4.3 5.4 5.8 7.1 5.1Fine and Applied Arts 4.8 2.9 6.2 5.7 4.3 7.1 5.6Foreign Languages 1.1 0.6 0.8 0.5 0.7 0.0 0.7Health Professions 2.8 4.1 4.5 3.6 4.2 8.1 4.0Home Economics 0.7 1.2 1.3 1.8 2.8 1.0 1.7Letters 6.7 2.3 5.2 5.4 6.1 3.0 5.4Library Science 0.0 0.0 0.1 0.0 0.2 0.0 0.1Mathematics 0.9 0.0 0.9 1.0 1.5 0.0 1.0Physical Sciences 1.1 1.2 1.0 1.3 1.2 2.0 1.2Psychology 10.8 4.1 7.3 7.6 8.6 6.1 7.7Public Affairs and Services 6.9 5.8 7.0 7.4 4.4 7.1 6.7Social Sciences 7.4 5.8 7.4 8.2 10.4 4.0 8.1Interdisciplinary Studies 7.6 6.4 6.7 8.7 7.8 11.1 7.8Undeclared 13.1 9.9 13.4 10.6 12.4 18.2 12.1Total 100.0 100.0 100.0 100.0 100.0 100.0 100.0
Fall 1991
Agriculture and Natural Resources 1.8 2.0 1.1 3.9 2.3 1.8 2.6Architecture and Environmental Design 0.2 1.0 0.6 1.1 0.7 2.7 0.8Area Studies 0.0 0.0 0.2 0.1 0.2 0.0 0.1Biological Sciences 1.8 3.4 2.6 3.2 3.1 0.9 2.9Business and Management 8.6 15.2 14.9 10.0 12.0 8.2 11.9Communications 3.0 3.9 3.7 3.7 3.0 2.7 3.6Computer and Information Scineces 4.1 1.5 2.7 1.8 2.4 3.6 2.3Education 10.7 10.8 8.4 8.8 6.0 6.4 8.4Engineering 4.5 11.3 4.6 5.8 6.7 11.8 5.7Fine and Applied Arts 5.7 3.4 5.8 6.2 5.9 7.3 5.9Foreign Languages 1.4 0.0 0.9 0.4 0.7 0.0 0.7Health Professions 2.0 4.4 4.2 3.7 4.0 9.1 3.9Home Economics 1.4 2.0 1.7 1.8 2.9 0.0 1.9Letters 6.4 6.4 5.4 5.0 5.8 3.6 5.3Library Science 0.0 0.0 0.2 0.0 0.1 0.0 0.1Mathematics 1.4 0.5 0.6 0.9 1.4 0.9 0.9Physical Sciences 1.1 0.0 1.0 1.4 0.9 0.9 1.1Psychology 12.3 4.4 8.0 8.0 8.9 10.0 8.3Public Affairs and Services 8.0 7.4 6.6 7.2 5.9 3.6 6.8Social Sciences 7.7 5.9 8.5 8.0 9.1 2.7 8.2Interdisciplinary Studies 7.7 6.4 6.9 8.7 7.7 10.9 7.9Undeclared 10.2 10.3 11.5 10.4 10.2 12.7 10.7Total 100.0 100.0 100.0 100.0 100.0 100.0 100.0
Fall 1992
Agriculture and Natural Resources 2.5 3.3 1.8 3.6 2.8 2.8 2.8Architecture and Environmental Design 0.0 1.4 0.5 1.4 1.0 0.9 1.0Area Studies 0.2 0.9 0.2 0.1 0.1 0.0 0.1Biological Sciences 1.6 1.4 2.7 3.9 3.1 0.9 3.2Business and Management 10.1 16.0 14.1 9.6 11.5 6.5 11.4Communications 2.5 1.9 3.3 3.3 2.6 1.9 3.1Computer and Information Scineces 2.0 2.8 2.8 1.6 2.2 6.5 2.2Education 13.0 8.0 9.7 8.8 5.8 10.2 8.8Engineering 4.5 12.7 4.6 5.8 6.8 6.5 5.7Fine and Applied Arts 4.9 3.3 4.8 6.6 5.6 5.6 5.7Foreign Languages 2.2 0.0 0.7 0.6 0.8 0.0 0.7Health Professions 3.4 7.0 4.6 4.1 4.3 9.3 4.4Home Economics 1.8 2.3 2.0 1.9 2.8 0.9 2.1Letters 5.4 5.6 5.5 5.3 5.8 4.6 5.4Library Science 0.0 0.9 0.1 0.0 0.1 0.0 0.1Mathematics 1.6 1.4 0.8 0.9 1.6 1.9 1.0Physical Sciences 1.3 0.5 1.0 1.3 1.0 0.9 1.1Psychology 10.1 3.8 8.3 8.0 10.1 8.3 8.5Public Affairs and Services 6.9 4.2 7.0 7.2 7.0 8.3 7.0Social Sciences 8.3 5.6 8.8 9.1 9.1 4.6 8.8Interdisciplinary Studies 7.6 8.5 6.8 7.9 6.8 7.4 7.4Undeclared 10.3 8.5 9.9 9.4 8.7 12.0 9.5Total 100.0 100.0 100.0 100.0 100.0 100.0 100.0
Support Program - Disabled Student Services Program

Statistical Abstract 205
Academic and Support Programs
Introduction
The California State University System has offeredacademic year study abroad programs to students fromall of its campuses since 1963 through the state-fundedOffice of International Programs. These programs aredesigned to place CSU students in distinguished hostuniversities and other higher education institutions abroad.In addition to these programs, individual campuses of thesystem offer credit and non-credit study abroad programsthrough their own academic departments or throughextension. The data presented here relate to thesystemwide International Programs.
The International Programs enables students to enroll ina foreign university while maintaining home campusresidency, to earn resident academic credit, and to retaineligibility for financial aid support. Currently, theInternational Programs is affiliated with 37 host universitiesin 16 countries: Australia, Brazil, Canada, Denmark,France, Germany, Israel, Italy, Japan, Mexico, NewZealand, Spain, Sweden, Taiwan, the United Kingdom,and Zimbabwe. While most CSU students select studycenters in Western Europe for their study abroadexperience, the International Programs has focused itsdevelopment in recent years on non-European locations.Currently, 9 of the 16 study centers are located in regionsother than Europe. CSU International Programs studycenters abroad emphasize rapid progress in developmentof international communication skills and content courseswhich deepen the undergraduate student's understandingof their academic major. Over 80 academic disciplinescan be served in these programs, including many whichare not commonly served by study abroad programs.
Currently, nearly one-fourth of International Programsactivity abroad is based on reciprocal exchange involvingAustralia, Canada, Denmark, Germany, Japan, NewZealand, and Sweden. This trend to substitute exchangefor pure "export" operations is expected to continue for theremainder of the decade and will likely involve additional
Support Programs - International Programs
countries. While budgetary considerations have requiredthe delay of new site development, long-term planning forexpansion in South America, Southeast Asia, and EasternEurope was continued.
The implementation of the new Bilingual CredentialProgram in Mexico for 1994-95 was recently completed.This exciting concept brings together the credentialprograms of the CSU with the International Programs atthe Universidad Iberoamericana (UIA) in Mexico City toprovide a special pathway for award of the multi-subjectcredential with a bilingual emphasis. The goal of thisintensive 13 month program, which is conducted in bothCalifornia and Mexico by both CSU and UIA faculty, is toincrease access to the bilingual qualification for thosewho need linguistic and cultural immersion to meet theState of California's stringent performance standards. Itwill also add a new cadre of internationally trained teachersto help meet the needs of the State's schools into the 21stcentury.
Enrollment in the International Programs has fluctuatedsince its inception in 1963-64, reacting to internationalevents, changes in currency exchange rates, budgetaryrestrictions, and economic conditions in California.Enrollment reached a peak in 1990-91 when 475 studentsenrolled. Italy and Spain continue to be the most popularstudy sites abroad, while CPSU, San Luis Obispo continuesto provide the single largest contingent of IP students.The CSU International Programs continues to defy nationalstatistics on enrollment by status. Nationally,approximately 15-20% of study abroad students are male;in the CSU International Programs, 42% of the 1991-92enrollment was male. The CSU International Programsalso continues to surpass the national statistics on thediversity of its student body. Nationally, fewer than 5% ofthe study abroad population are minority students, while25% of the students enrolled in the CSU InternationalPrograms in 1991-92 represented minority populations.
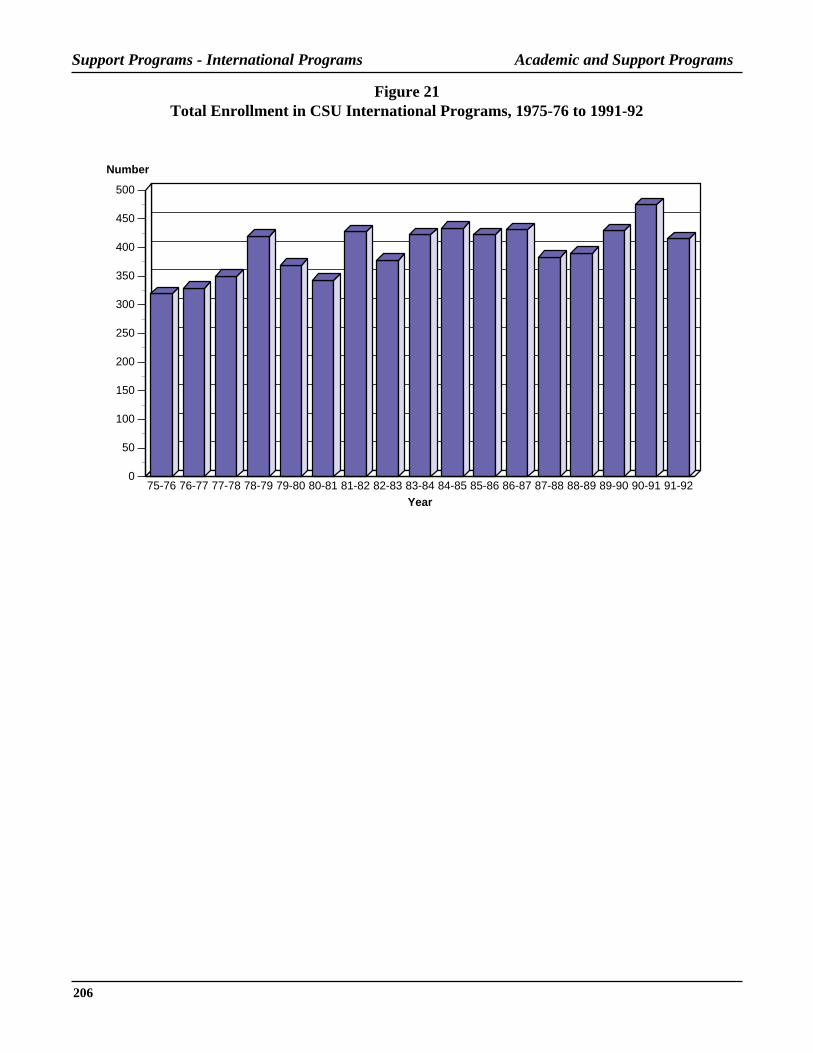
206
Academic and Support ProgramsSupport Programs - International Programs
Figure 21Total Enrollment in CSU International Programs, 1975-76 to 1991-92
75-76 76-77 77-78 78-79 79-80 80-81 81-82 82-83 83-84 84-85 85-86 86-87 87-88 88-89 89-90 90-91 91-920
50
100
150
200
250
300
350
400
450
500
Number
Year
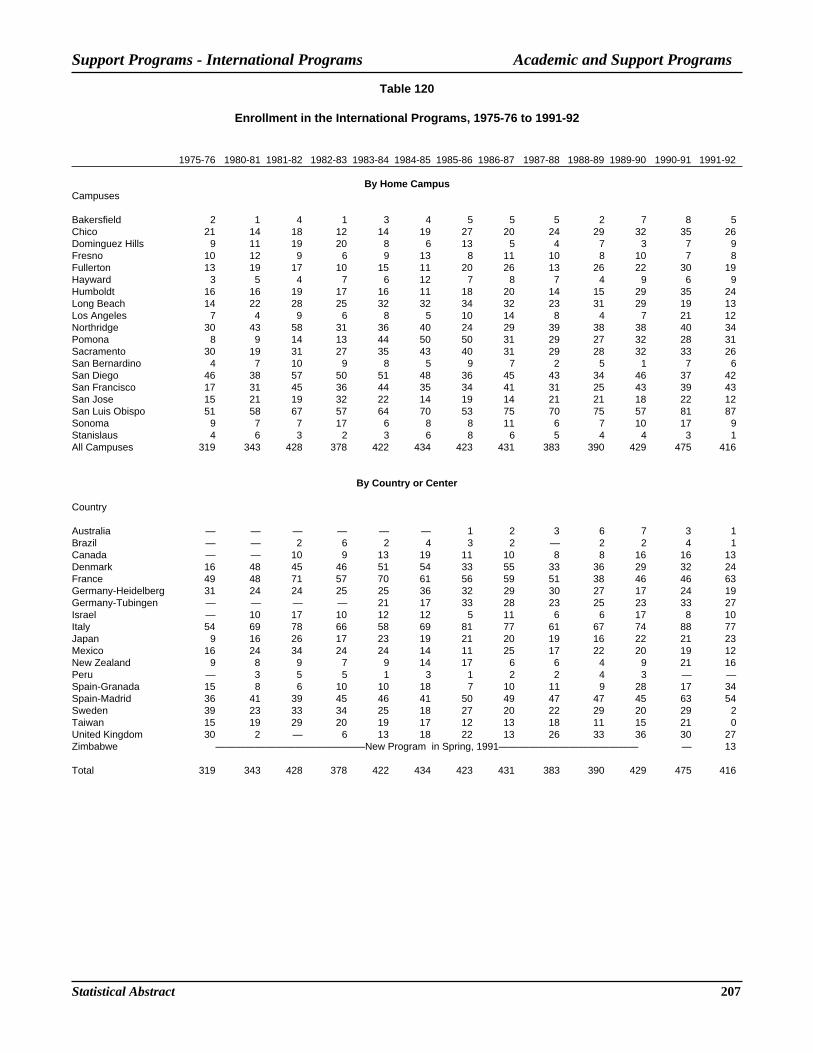
Statistical Abstract 207
Academic and Support Programs
Table 120
Enrollment in the International Programs, 1975-76 to 1991-92
1975-76 1980-81 1981-82 1982-83 1983-84 1984-85 1985-86 1986-87 1987-88 1988-89 1989-90 1990-91 1991-92
By Home CampusCampuses
Bakersfield 2 1 4 1 3 4 5 5 5 2 7 8 5Chico 21 14 18 12 14 19 27 20 24 29 32 35 26Dominguez Hills 9 11 19 20 8 6 13 5 4 7 3 7 9Fresno 10 12 9 6 9 13 8 11 10 8 10 7 8Fullerton 13 19 17 10 15 11 20 26 13 26 22 30 19Hayward 3 5 4 7 6 12 7 8 7 4 9 6 9Humboldt 16 16 19 17 16 11 18 20 14 15 29 35 24Long Beach 14 22 28 25 32 32 34 32 23 31 29 19 13Los Angeles 7 4 9 6 8 5 10 14 8 4 7 21 12Northridge 30 43 58 31 36 40 24 29 39 38 38 40 34Pomona 8 9 14 13 44 50 50 31 29 27 32 28 31Sacramento 30 19 31 27 35 43 40 31 29 28 32 33 26San Bernardino 4 7 10 9 8 5 9 7 2 5 1 7 6San Diego 46 38 57 50 51 48 36 45 43 34 46 37 42San Francisco 17 31 45 36 44 35 34 41 31 25 43 39 43San Jose 15 21 19 32 22 14 19 14 21 21 18 22 12San Luis Obispo 51 58 67 57 64 70 53 75 70 75 57 81 87Sonoma 9 7 7 17 6 8 8 11 6 7 10 17 9Stanislaus 4 6 3 2 3 6 8 6 5 4 4 3 1All Campuses 319 343 428 378 422 434 423 431 383 390 429 475 416
By Country or Center
Country
Australia — — — — — — 1 2 3 6 7 3 1Brazil — — 2 6 2 4 3 2 — 2 2 4 1Canada — — 10 9 13 19 11 10 8 8 16 16 13Denmark 16 48 45 46 51 54 33 55 33 36 29 32 24France 49 48 71 57 70 61 56 59 51 38 46 46 63Germany-Heidelberg 31 24 24 25 25 36 32 29 30 27 17 24 19Germany-Tubingen — — — — 21 17 33 28 23 25 23 33 27Israel — 10 17 10 12 12 5 11 6 6 17 8 10Italy 54 69 78 66 58 69 81 77 61 67 74 88 77Japan 9 16 26 17 23 19 21 20 19 16 22 21 23Mexico 16 24 34 24 24 14 11 25 17 22 20 19 12New Zealand 9 8 9 7 9 14 17 6 6 4 9 21 16Peru — 3 5 5 1 3 1 2 2 4 3 — —Spain-Granada 15 8 6 10 10 18 7 10 11 9 28 17 34Spain-Madrid 36 41 39 45 46 41 50 49 47 47 45 63 54Sweden 39 23 33 34 25 18 27 20 22 29 20 29 2Taiwan 15 19 29 20 19 17 12 13 18 11 15 21 0United Kingdom 30 2 — 6 13 18 22 13 26 33 36 30 27Zimbabwe ———————————————New Program in Spring, 1991—————————————— — 13
Total 319 343 428 378 422 434 423 431 383 390 429 475 416
Support Programs - International Programs

208
Academic and Support Programs
Table 121
Selected Characteristics of Students Enrolled in International Programs
Enrollment Category 1980-81 1981-82 1982-83 1983-84 1984-85 1985-86 1986-87 1987-88 1988-89 1989-90 1990-91 1991-92
1. Average units taken for year Undergraduates 32.6 32.9 32.1 33.1 33.7 33.0 33.5 34.0 34.5 * * * Graduates 27.2 25.9 23.8 29.4 32.9 28.8 31.9 32.7 31.3 * * *
2. Grade-point averages Pre-program 3.23 3.21 3.23 3.27 3.28 3.24 3.25 3.24 3.33 3.17 3.20 3.15 Program 3.20 3.23 3.25 3.30 3.29 3.24 3.31 3.31 3.27 * * * Post-program 3.25 3.23 3.22 3.25 3.25 3.25 3.20 — — * * *
3. Percent by class level Junior 42.0 40.4 40.0 35.3 39.4 44.9 45.7 42.0 45.1 50.8 51.4 53.9 Senior 48.1 51.4 51.7 56.9 50.0 46.8 48.7 51.7 50.3 44.5 43.8 40.9 Graduate 9.9 8.2 8.3 7.8 10.6 8.3 5.6 6.3 4.6 4.7 3.7 3.9
4. Percent male 40.8 43.7 44.4 39.8 42.3 39.8 42.2 43.5 42.8 41.0 42.7 42.1
5. Average age 23.2 23.3 24.5 23.5 22.3 22.4 22.1 22.1 22.3 22.3 22.2 21.7
6. Percent ethnic minority Black 1.2 1.4 1.0 0.7 0.7 1.2 1.2 1.3 0.5 2.1 0.5 2.6 Hispanic 8.7 11.7 6.5 7.3 6.2 8.1 6.7 8.6 7.7 10.3 9.1 11.1 Asian or Pacific Islander 2.9 3.0 5.2 5.0 5.8 4.3 7.2 7.3 5.6 4.4 4.4 9.1 Other non-white 1.2 0.2 — — 0.9 0.5 0.5 0.5 2.1 1.2 1.9 2.2 Total 14.0 16.4 12.7 13.0 13.6 14.0 15.5 17.8 15.9 17.9 15.9 25.0
7. Percent receiving financial aid 61.2 66.1 53.0 52.8 50.7 47.3 49.0 44.6 44.1 53.0 49.6 46.6
*Data are no longer collected.
Support Programs - International Programs

Statistical Abstract 209
Academic and Support Programs
Table 122
Percent Distribution of International Program Majors
Major 1980-81 1981-82 1982-83 1983-84 1984-85 1985-86 1986-87 1987-88 1988-89 1989-90 1990-91 1991-92
Agriculture and Natural Resources 2.6 2.8 3.6 1.7 4.1 3.5 1.2 2.6 2.8 2.3 1.9 3.2Anthropology 0.6 0.7 0.5 1.2 1.2 0.9 0.5 0.3 — — 0.8 0.5Architecture and Environmental Design 12.2 10.3 10.9 10.7 14.5 11.8 15.1 12.8 15.7 11.2 11.2 10.3Area and Ethnic Studies 2.3 0.9 2.1 1.4 1.8 0.7 1.4 2.6 0.5 0.7 0.6 1.2Art/Art History 8.2 6.3 7.0 5.0 5.1 8.7 5.6 3.4 4.6 5.6 4.4 5.8Behavioral Science — 0.2 — 0.5 0.5 0.7 0.5 0.3 — — — 0.0Biological Sciences 1.7 1.9 2.3 3.1 1.8 3.8 1.4 3.1 1.5 2.3 2.1 1.9Business & Management 11.4 15.9 17.1 18.5 16.1 12.3 14.8 15.1 11.8 13.1 12.8 13.5Communications 5.5 4.2 2.6 3.1 2.8 4.3 3.9 6.8 7.7 4.4 6.1 6.9Criminology 0.3 0.7 — 0.2 0.2 0.2 — — — — 0.4 0.0Dramatic Arts — 0.2 — — 0.2 0.2 0.5 0.3 0.5 0.3 0.4 0.5Economics 0.9 1.9 1.6 1.2 1.8 3.1 0.7 1.0 2.1 0.7 1.7 1.2Education/Child Development 2.9 1.2 0.5 0.9 2.5 0.2 1.6 1.3 1.8 1.9 1.5 1.5Engineering/Computer Science 0.6 0.7 1.0 3.6 2.8 1.7 2.5 3.3 2.8 3.5 2.3 4.3English/Comp. Lit./Linguistics 2.9 2.1 3.4 3.8 5.5 2.8 3.7 3.7 4.6 6.8 6.9 6.7Foreign Languages 27.1 26.6 20.7 23.0 19.8 18.4 20.0 18.5 17.0 17.3 15.6 14.2Geography 0.9 1.2 1.0 0.9 0.7 1.2 0.5 1.3 0.5 0.7 0.6 0.5Health Professions/ Nursing — — 0.5 — 0.2 — 0.5 0.3 0.5 0.3 0.2 0.7History 2.6 0.9 3.4 2.6 1.8 3.1 3.7 1.8 2.3 3.1 3.4 4.6Home Economics — — — 0.2 0.2 — 0.5 — — 0.7 0.4 1.5Humanities 0.3 1.2 1.0 0.2 0.2 0.5 0.2 0.3 0.5 1.4 0.8 1.0Liberal Studies 2.3 3.0 0.8 2.1 3.0 5.0 2.1 6.0 5.1 5.4 5.7 5.3Mathematics — 0.5 — 0.2 0.5 1.2 1.2 0.5 0.8 0.3 0.4 0.7Music — 0.5 2.1 0.5 0.5 0.5 0.9 1.6 0.8 0.5 0.6 0.7Philosophy/Religious Studies 0.3 0.7 1.3 1.2 0.5 0.5 1.2 0.3 0.3 2.1 0.2 0.2Physical Sciences 0.3 0.5 1.0 0.2 0.9 0.7 0.7 1.6 0.8 0.5 0.8 0.2Political Science/ Government 6.4 7.5 8.8 9.7 7.4 10.9 8.6 7.6 8.7 9.8 11.2 7.7Psychology 3.8 4.9 4.9 2.1 1.6 1.4 3.0 0.8 3.1 3.1 2.7 2.4Public Affairs & Services/ Social Welfare 0.6 — 0.3 — 0.2 0.2 0.7 — 0.3 0.5 0.4 0.0Social Science 0.9 0.9 1.3 1.4 0.7 0.7 1.4 1.8 2.1 0.9 1.5 1.7Sociology 0.9 0.5 — 0.5 0.5 0.7 1.2 1.0 0.5 0.7 1.5 1.0Special Major 1.5 1.2 0.3 0.2 0.2 — 0.5 — 0.3 0.5 0.6 0.2All Programs 100.0 100.0 100.0 100.0 100.0 100.0 100.0 100.0 100.0 100.0 100.0 100.0
Support Programs - International Programs

210
Academic and Support ProgramsSupport Programs - International Programs
Table 123
Gross General Fund Expenditures in International Programs
Fiscal Year Expenditures Annual FTE Cost per FTE
1972-73 $ 514,542 313 $1,6441973-74 586,418 308 1,9041974-75 608,013 326 1,8651975-76 645,096 340 1,8971976-77 771,847 353 2,1871977-78 849,409 375 2,2651978-79 907,768 432 2,1011979-80 1,029,034 384 2,6801980-81 1,098,940 369 2,9781981-82 1,152,565 461 2,5001982-83 1,175,078 416 2,8241983-84 1,198,365 439 2,7311984-85 1,340,380 457 2,9331985-86 1,669,930 431 3,8721986-87 1,603,200 458 3,5001987-88 1,847,222 404 4,5721988-89 1,810,740 422 4,2911989-90 2,097,690 485 4,3251990-91 2,191,482 521 4,2061991-92 2,000,144 458 4,367

Statistical Abstract 211
Academic and Support ProgramsContinuing Education
In 1970, the Legislature enacted a provision which hasbecome section 89704 of the Education Code whichcreated the CSU Continuing Education Revenue Fund.This fund serves as the fiscal vehicle for all self-supportinginstructional programs of the CSU. These programs includeSummer Session, January (Winter) Session, ExternalDegree Programs, Special Sessions, Credit Extensionand Concurrent Enrollment. These are credit programs.In addition, most campuses operate many non-creditactivities (designated as non-credit extension) throughthe C.E.R.F. As used here, “self-support” means thatprogram costs are covered by student tuition fees.
Summer SessionA self-support Summer Session provides students anopportunity to continue progress towards their educationalobjectives at a time of year when the campus wouldotherwise be closed. Credit earned through this programis fully applicable toward the baccalaureate, mastersdegree and credentials, including applying toward theuniversity’s residence requirement. (The data for thisprogram is divided into regular and contract categories.This technical distinction refers to sponsorship. Contractcourses involve cooperation between the university andsome other entity which hires the instructor and contractswith the university for academic credit for the instruction).
External DegreeExternal Degree Programs are specifically authorizedthrough the Academic Master Plan process to be offeredon a self-supporting basis.
January (Winter) SessionThis program is essentially identical to Summer Sessionbut is offered during the January break between the falland spring semesters.
Other Special SessionsThis refers to degree or other programs which are includedin the campus’ Academic Master Plans as a state-supported program and are offered also on a self-
supporting basis through the Continuing EducationRevenue Fund. Credit earned in such programs meet theundergraduate’s residency requirement.
Credit ExtensionCredit Extension courses bear limited credit and do notmeet university residency requirements. A maximum of24 semester units can be applied to a baccalaureatedegree.
Concurrent Enrollment ExtensionConcurrent Enrollment (sometimes called Open Universityor Adjunct Enrollment) is a mechanism whereby studentsare able to enroll in state-supported courses on a space-available basis by paying extension fees. They receiveextension credit for work successfully completed.
Non-Credit ExtensionThis category of self-supporting instruction encompassesmuch diversity. It includes offerings that are purely non-credit as well as others that carry so-called ContinuingEducation Units (CEU) which is a sort of quantity measure(i.e., one CEU equals ten hours of instruction). The CSUcurrently does not accumulate non-credit extension datain terms of CEU.
Highlights:
— 1991-92 Summer Session FTE rose to 9,629 units,the largest total in nineteen years.
— A total of 20,440 Continuing Education Annual Full-Time Equivalent students registered in 1991-92, anall-time record.
— 1991-92 Continuing Education revenue ($67,165,752)was clearly a record in extended education operations.
— Non-credit Extension Gross Enrollments(Registrations) totaled 40,250 units, representing thehighest total in a decade.
Introduction
Continuing Education

212
Academic and Support ProgramsContinuing Education
Figure 22Annual Full-Time Equivalent Student Enrollment in Summer Sessions
and Credit Extension, 1960-61 to 1991-92
Number
0
2,000
4,000
6,000
8,000
10,000
12,000
14,000
0
2,000
4,000
6,000
8,000
10,000
12,000
14,000
60-61 65-66 70-71 75-76 80-81 85-86 90-91
Year
Summer Session Annual FTE
Credit Extension Annual FTE

Statistical Abstract 213
Academic and Support Programs
Table 124
Annual Full-Time Equivalent Students inthe Summer Sessions and Extension, from 1955-56
Summer Sessions Credit ExtensionYear Annual FTE Annual FTE
1955-56 5,327 1,0201956-57 5,443 1,3971957-58 5,983 1,2291958-59 7,082 2,1501959-60 7,358 2,267
1960-61 7,766 2,3561961-62 8,541 2,7431962-63 9,269 3,1501963-64 11,042 3,9531964-65 10,813 4,646
1965-66 11,187 4,7031966-67 11,578 4,7181967-68 11,294 5,4921968-69 11,567 6,3911969-70 12,331 7,084
1970-71 11,768 7,7241971-72 11,303 7,8391972-73 10,056 7,1431973-74 9,135 7,4461974-75 8,158 7,703
1975-76 8,003 8,3911976-77 7,399 8,0951977-78 7,380 7,6941978-79 7,066 6,7991979-80 7,312 6,643
1980-81 7,727 6,3161981-82 7,797 5,9811982-83 8,027 6,2901983-84 8,259 6,6621984-85 8,175 6,916
1985-86 8,223 7,2531986-87 8,468 7,3161987-88 8,303 7,3891988-89 8,599 6,8551989-90 8,644 7,354
1990-91 9,119 7,7031991-92 9,629 7,297
Continuing Education

214
Academic and Support Programs
Table 125
Non Credit Extension, Gross Enrollment (Registrations)1976-77 through 1982-83
Campus 1976-77 1977-78 1978-79 1979-80 1980-81 1981-82 1982-83
Bakersfield 374 80 64 616 492 796 587Chico — — — — — — —Dominguez Hills 476 678 1,034 1,673 2,093 1,996 2,656Fresno — — — — — — —Fullerton — — — 152 2,889 4,367 2,598Hayward — — — — 365 1,929 1,437Humboldt — — — — — — —Long Beach 603 541 782 1,043 1,759 2,016 1,006Los Angeles — 102 5,551 3,756 4,686 4,524 2,777Northridge 1,982 5,666 7,437 6,219 5,167 6,802 5,329Pomona — — — — — — —Sacramento 1,323 1,591 2,131 3,391 2,871 4,290 2,012San Bernardino 445 1,664 1,061 1306 182 1,060 1,406San Diego 120 325 — 1320 1,498 589 339San Francisco — — 1,531 1,271 3,057 3,325 913San Jose 270 — 1,725 3,908 928 2,944 2,869San Luis Obispo — — — 15 232 982 2,026Sonoma 775 662 523 983 1,535 2,181 2,626Stanislaus 300 — — 94 1,163 312 400Total 6,668 11,309 21,839 25,747 28,917 38,113 28,981
Total Continuing EducationAnnual Full-Time Equivalent Students
Bakersfield 321 326 254 236 222 216 231Chico 645 576 461 460 461 540 589Dominguez Hills 771 715 809 748 704 683 744Fresno 833 689 637 728 855 914 1,030Fullerton 1,262 1,146 1,019 979 1,086 1,110 1,039Hayward 548 454 276 232 208 258 319Humboldt 160 153 132 124 129 128 116Long Beach 1,595 1,554 1,465 1,538 1,527 1,621 1,929Los Angeles 580 577 427 523 473 510 563Northridge 1,375 1,307 1,457 1,508 1,519 1,433 1,435Pomona 145 169 225 244 287 263 271Sacramento 1,504 1,229 978 1,153 1,222 1,025 996San Bernardino 479 483 472 431 340 335 331San Diego 1,740 1,642 1,497 1,622 1,593 1,762 1,734San Francisco 1,684 1,708 1,765 1,761 1,802 1,800 1,776San Jose 1,670 1,609 1,585 1,590 1,542 1,605 1,698San Luis Obispo 165 192 178 201 231 223 253Sonoma 541 405 281 319 352 448 396Stanislaus 181 166 172 196 176 179 232Consortium — — — — — — —Total 16,199 15,100 14,090 14,593 14,729 15,053 15,682
Total Continuing Education Revenue ($)
Bakersfield 325,977 340,61 6 344,763 393,453 400,448 41 7,948 457,203Chico 582,934 591,170 538,978 509,215 662,501 805,214 953,311Dominguez Hills 950,533 932,808 1,108,202 1,042,550 1,205,234 1,297,156 1,468,720Fresno 822,196 760,997 725,750 824,958 1,083,268 1,211,416 1,395,448Fullerton 1,177,946 1 ,190,183 1,127,055 1,112,495 1 ,449,005 1 ,769,335 1 ,922,620Hayward 410,349 418,282 309,063 272,488 276,271 397,316 513,054Humboldt 136,153 138,254 133,127 145,129 161,662 166,000 175,516Long Beach 1,583,648 1,685,604 1,772,702 1,995,569 2,360,504 2,778,458 3,190,735Los Angeles 448,195 582,649 784,330 985,710 1,128,229 1,480,958 1,653,541Northridge 1,495,869 1,711,651 2,140,558 2,283,693 2,536,006 3,089,1 88 3,134,150Pomona 106,617 171,771 221,508 268,775 318,878 398,497 455,745Sacramento 1,467,016 1,348,463 1,346,603 1,474,978 1,792,869 1,633,283 1,719,107San Bernardino 497,839 555,829 566,326 556,848 461,894 525,870 616,396San Diego 1,612,026 1,684,834 1,701,297 1,994,940 2,301,466 2,619,403 2,864,312San Francisco 1,598,591 1,686,287 1,980,625 2,127,207 2,375,379 2,623154 2,931,456San Jose 1,561,105 1,717,304 1,825,749 1,980,686 2,284,861 2,618,640 3,155,488San Luis Obispo 143,054 190,419 190,472 237,688 343,371 375,240 475,197Sonoma 586,814 379,367 226,104 425,051 584,517 722,916 917,279Stanislaus 141,306 167,128 166,256 196,138 249,022 275,666 369,445Consortium — — — — — — —Total 15,648,168 16,253,616 17,204,468 18,827,571 21,975,385 25,205,658 28,358,723
Continuing Education

Statistical Abstract 215
Academic and Support Programs
Table 125 (continued)
Non Credit Extension, Gross Enrollment (Registrations)1983-84 through 1989-90
Campus 1983-84 1984-85 1985-86 1986-87 1987-88 1988-89 1989-90
Bakersfield 916 564 559 520 372 400 376Chico — — — — — — —Dominguez Hills 1,738 959 2,439 1,475 1,177 1,229 1,459Fresno — — — — — — —Fullerton 466 558 456 372 944 1,651 996Hayward 2,511 5,342 5,126 — 1,331 1,482 1,689Humboldt — — — — — 305 1,291Long Beach 839 405 243 292 329 292 274Los Angeles 1,917 1,962 2,764 3,211 3,708 2,551 2,461Northridge 7,888 6,875 7,767 7,880 6,807 7,249 7,344Pomona 22 55 25 68 191 253 555Sacramento 2,693 2,900 2,657 2,609 2,216 2,090 3,649San Bernardino 2,473 2,539 2,198 2,823 1,257 5,337 5,174San Diego 415 351 439 412 370 353 395San Francisco 3,457 1,700 2,130 4,353 4,856 4,675 5,711San Jose 5,286 3,249 3,589 5,265 7,487 1,654 448San Luis Obispo 2,655 2,944 1,979 1,558 2,630 187 2,834Sonoma 1,223 2,241 2,062 3,051 2,360 2,629 2,999Stanislaus 149 96 73 27 85 220 396Total 34,648 32,740 34,506 33,916 36,120 32,557 38,051
Total Continuing EducationAnnual Full-time Equivalent Students
Bakersfield 201 247 268 319 321 332 407Chico 585 561 597 627 585 606 550Dominguez Hills 734 654 645 540 652 654 786Fresno 1,021 1,062 1,047 1,158 820 1,179 1,026Fullerton 1,103 1,161 1,256 1,264 1,293 1,268 1,311Hayward 437 546 615 590 600 671 718Humboldt 162 179 156 177 144 145 166Long Beach 2,179 2,168 2,052 2,118 2,054 2,085 1,940Los Angeles 530 531 609 627 689 641 623Northridge 1,508 1,433 1,692 1,760 1,728 1,557 1,685Pomona 302 320 349 400 431 384 449Sacramento 1,001 967 1,010 1,046 989 972 1,030San Bernardino 437 461 482 669 756 835 864San Diego 1,699 1,788 1,901 1,994 2,055 2,057 2,094San Francisco 1,857 1,849 1,834 1,895 1,916 1,910 2,037San Jose 1,795 1,498 1,861 1,956 1,913 1,844 1,939San Luis Obispo 259 274 284 269 241 207 243Sonoma 397 380 364 369 432 438 485Stanislaus 259 222 250 255 247 227 275Consortium — 702 — — — — —Total 16,466 17,003 17,272 18,033 17,866 18,012 18,628
Total Continuing Education Revenue ($)
Bakersfield 511,512 582,964 608,486 714,723 920,025 892,693 1,073,124Chico 1,023,846 1,048,579 1 267,759 1,354,599 1,442,988 1,400,941 1,418,992Dominguez Hills 1,402,767 1,247,718 1,429,135 1,305,714 1,606,111 1,626,843 2,269,671Fresno 1,568,626 1,716,965 1,914,252 2,402,388 1,811,879 2,807,509 2,552,311Fullerton 1,887,396 2,265,698 2,570,823 2,821,277 3,207,121 3,604,651 3,981,694Hayward 834,804 1,007,394 1,113,661 1,073,303 1,270,661 1,566,617 1,654,949Humboldt 242,525 272,710 348,195 269,723 305,676 316,490 375,557Long Beach 3,614,645 4,021,722 4,246,542 4,697,246 4,885,284 5,620,246 5,406,725Los Angeles 1,509,208 1,616,883 1,815,807 1,928,852 2,276,470 2,718,150 3,492,109Northridge 3,836,078 4,055,730 4,753,707 5,464,735 5,821,354 5,740,819 6,343,818Pomona 515,976 586,349 731,357 839,582 1,012,248 1,036,357 1,227,738Sacramento 1,783,755 2,336,768 2,524,218 2,598,749 2,701,264 2,594,126 2,995,866San Bernardino 905,358 1,040,146 1,120,666 1,434,565 1,715,654 2,179,410 2,807,785San Diego 3,042,888 3,591,792 4,059,543 4,585,091 5,098,128 5,495,937 5,568,352San Francisco 3,503,792 3,671,128 4,068,150 4,436,694 4,778,289 5,155,090 5,734,954San Jose 3,677,990 4,083,532 4 ,611,343 5,076,050 5,490,026 5,357,459 6,044,644San Luis Obispo 635,841 685,519 681,072 628,753 589,703 542,179 634,316Sonoma 794,961 768,692 776,636 856,672 986,968 1,104,521 1,238,463Stanislaus 407,294 333,711 423,318 473,410 498,671 738,254 695,399Consortium — 3,277,847 — — — — —Total 31,699,262 38,211,847 39,064,670 42,962,126 46,418,490 50,498,294 55,516,467
Continuing Education

216
Academic and Support Programs
Table 125 (continued)
Non Credit Extension, Gross Enrollment (Registrations)1990-91 through 1991-92
Campus 1990-91 1991-92
Bakersfield 444 497Chico 0 0Dominguez Hills 1,145 1,315Fresno 0 0Fullerton 701 809Hayward 1,554 2,140Humboldt 867 995Long Beach 290 369Los Angeles 2,329 1,983Northridge 2,736 5,505Pomona 498 381Sacramento 3,198 4,017San Bernardino 5,492 7,871San Diego 410 422San Francisco 7,033 7,901San Jose 0 0San Luis Obispo 2,488 2,398San Marcos — 0Sonoma 3,160 3,162Stanislaus 657 485Total 33,002 40,250
Total Continuing EducationAnnual Full-Time Equivalent Students
Bakersfield 438 497Chico 559 528Dominguez Hills 813 949Fresno 1,138 1,212Fullerton 1,415 1,403Hayward 849 829Humboldt 242 279Long Beach 2,119 2,198Los Angeles 736 650Northridge 1,759 1,725Pomona 489 447Sacramento 1,059 1,139San Bernardino 896 912San Diego 2,126 2,276San Francisco 2,098 2,066San Jose 2,010 2,140San Luis Obispo 239 235San Marcos — 17Sonoma 579 651Stanislaus 258 287Total 19,822 20,440
Total Continuing Education Revenue ($)
Bakersfield 1,217,359 1,711,772Chico 1,432,568 1,365,017Dominguez Hills 2,480,859 2,961,844Fresno 2,980,514 3,220,686Fullerton 4,390,318 4,825,831Hayward 2,030,545 2,244,108Humboldt 489,618 605,808Long Beach 6,447,043 7,206,289Los Angeles 2,847,150 2,104,402Northridge 6,588,827 6,941,039Pomona 1,417,276 1,793,746Sacramento 3,215,894 3,594,797San Bernardino 3,327,698 3,592,343San Diego 6,288,213 7,364,844San Francisco 6,802,351 7,063,253San Jose 6,462,089 7,273,627San Luis Obispo 704,964 729,884San Marcos — 28,010Sonoma 1,502,973 1,774,559Stanislaus 736,913 763,893Total 61,363,172 67,165,752
Continuing Education
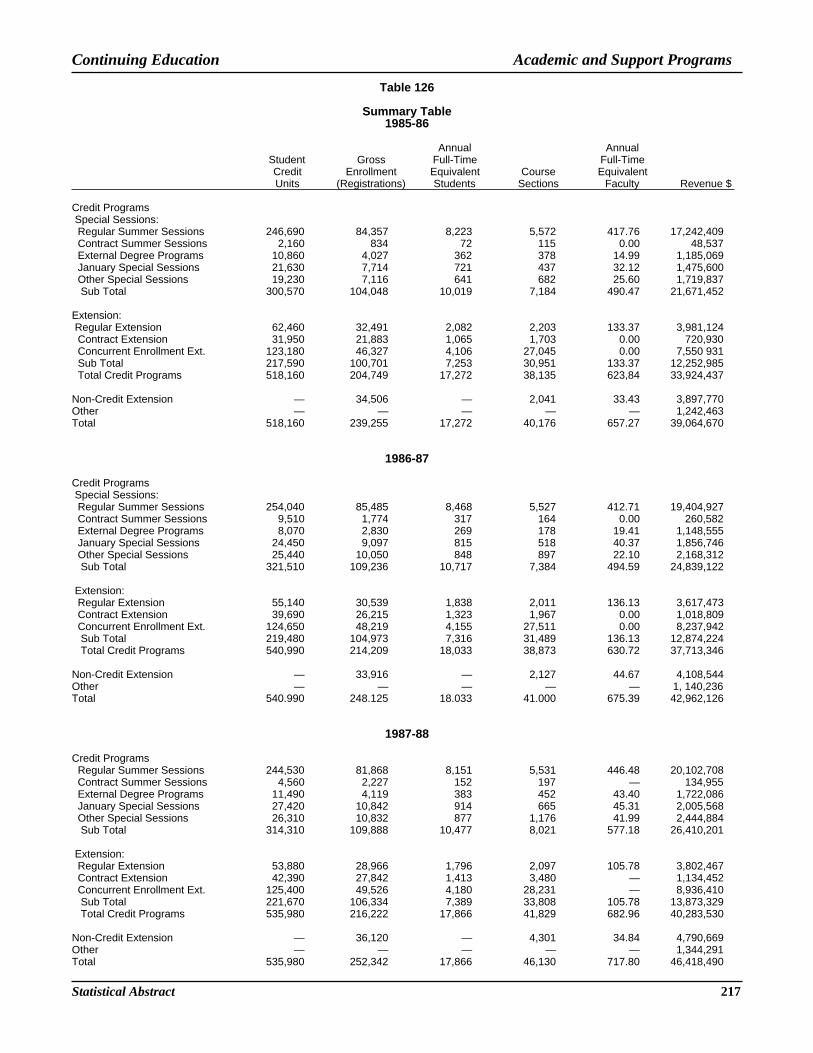
Statistical Abstract 217
Academic and Support Programs
Table 126
Summary Table1985-86
Annual AnnualStudent Gross Full-Time Full-TimeCredit Enrollment Equivalent Course EquivalentUnits (Registrations) Students Sections Faculty Revenue $
Credit Programs Special Sessions: Regular Summer Sessions 246,690 84,357 8,223 5,572 417.76 17,242,409 Contract Summer Sessions 2,160 834 72 115 0.00 48,537 External Degree Programs 10,860 4,027 362 378 14.99 1,185,069 January Special Sessions 21,630 7,714 721 437 32.12 1,475,600 Other Special Sessions 19,230 7,116 641 682 25.60 1,719,837 Sub Total 300,570 104,048 10,019 7,184 490.47 21,671,452
Extension: Regular Extension 62,460 32,491 2,082 2,203 133.37 3,981,124 Contract Extension 31,950 21,883 1,065 1,703 0.00 720,930 Concurrent Enrollment Ext. 123,180 46,327 4,106 27,045 0.00 7,550 931 Sub Total 217,590 100,701 7,253 30,951 133.37 12,252,985 Total Credit Programs 518,160 204,749 17,272 38,135 623,84 33,924,437
Non-Credit Extension — 34,506 — 2,041 33.43 3,897,770Other — — — — — 1,242,463Total 518,160 239,255 17,272 40,176 657.27 39,064,670
1986-87
Credit Programs Special Sessions: Regular Summer Sessions 254,040 85,485 8,468 5,527 412.71 19,404,927 Contract Summer Sessions 9,510 1,774 317 164 0.00 260,582 External Degree Programs 8,070 2,830 269 178 19.41 1,148,555 January Special Sessions 24,450 9,097 815 518 40.37 1,856,746 Other Special Sessions 25,440 10,050 848 897 22.10 2,168,312 Sub Total 321,510 109,236 10,717 7,384 494.59 24,839,122
Extension: Regular Extension 55,140 30,539 1,838 2,011 136.13 3,617,473 Contract Extension 39,690 26,215 1,323 1,967 0.00 1,018,809 Concurrent Enrollment Ext. 124,650 48,219 4,155 27,511 0.00 8,237,942 Sub Total 219,480 104,973 7,316 31,489 136.13 12,874,224 Total Credit Programs 540,990 214,209 18,033 38,873 630.72 37,713,346
Non-Credit Extension — 33,916 — 2,127 44.67 4,108,544Other — — — — — 1, 140,236Total 540.990 248.125 18.033 41.000 675.39 42,962,126
1987-88
Credit Programs Regular Summer Sessions 244,530 81,868 8,151 5,531 446.48 20,102,708 Contract Summer Sessions 4,560 2,227 152 197 — 134,955 External Degree Programs 11,490 4,119 383 452 43.40 1,722,086 January Special Sessions 27,420 10,842 914 665 45.31 2,005,568 Other Special Sessions 26,310 10,832 877 1,176 41.99 2,444,884 Sub Total 314,310 109,888 10,477 8,021 577.18 26,410,201
Extension: Regular Extension 53,880 28,966 1,796 2,097 105.78 3,802,467 Contract Extension 42,390 27,842 1,413 3,480 — 1,134,452 Concurrent Enrollment Ext. 125,400 49,526 4,180 28,231 — 8,936,410 Sub Total 221,670 106,334 7,389 33,808 105.78 13,873,329 Total Credit Programs 535,980 216,222 17,866 41,829 682.96 40,283,530
Non-Credit Extension — 36,120 — 4,301 34.84 4,790,669Other — — — — — 1,344,291Total 535,980 252,342 17,866 46,130 717.80 46,418,490
Continuing Education

218
Academic and Support Programs
Table 126 (continued)
Summary Table1988-89
Annual AnnualStudent Gross Full-Time Full-TimeCredit Enrollment Equivalent Course EquivalentUnits (Registrations) Students Sections Faculty Revenue $
Credit Programs Regular Summer Sessions 257,970 83,382 8,599 5,731 455.66 22,692 785 Contract Summer Sessions 5,250 1,941 175 192 — 157 443 External Degree Programs 12,480 4,444 416 398 26.39 1,810,256 January Special Sessions 32,730 11,853 1,091 727 54.41 2,868,697 Other Special Sessions 26 280 9 942 876 934 45.05 2 521327 Sub Total 334710 111562 11,157 7,982 581.51 30050508
Extension: Regular Extension 49,980 25,807 1,666 1,918 102.88 3,735,462 Contract Extension 41,820 26,397 1,394 1,950 — 1,297,936 Concurrent Enrollment Ext. 113,850 44,559 3,795 26,889 — 8,714,781 Sub Total 205 650 96 763 6 855 30 757 102.88 13 748179 Total Credit Programs 540 360 208 325 18 012 38 739 684.39 43 798 687
Non-Credit Extension — 32,557 — 2,243 42.90 5,160,206Other — — — — — 1,539,399Total 540,360 240,882 18,012 40,982 727.29 50,498,292
1989-90
Credit Programs Regular Summer Sessions 259,320 92,216 8,644 5,986 450.36 24,087,880 Contract Summer Sessions 5,940 2,568 198 239 — 186,941 External Degree Programs 13,350 4,531 445 355 29.13 1,900,723 January Special Sessions 34,860 12,248 1,162 699 60.19 3,171,390 Other Special Sessions 24,750 9,909 825 846 47.35 2,797,963 Sub Total 338,220 121,472 11,274 8,125 587.03 32,144,897
Extension: Regular Extension 50,100 28,041 1,670 2,010 112.19 4,092,525 Contract Extension 45,750 28,086 1,525 2,247 — 1,422,489 Concurrent Enrollment Ext. 124,770 49,760 4,159 25,857 — 10,063,475 Sub Total 220,620 105,887 7,354 30,114 112.19 15,578,489 Total Credit Programs 558,840 227,359 18,628 38,239 699.22 47,723,386
Non-Credit Extension — 38,051 — 2,491 38.41 6,462,103Other — — — — — 1,330,978Total 558,840 265,410 18,628 40,730 737.63 55,516,467
1990-91
Credit Programs Regular Summer Sessions 273,570 98,163 9,119 6,196 496.22 26,962,334 Contract Summer Sessions 6,720 2,795 224 229 — 206,475 External Degree Programs 14,670 4,850 489 430 18.00 1,837,804 January Special Sessions 39,960 14,160 1,332 830 67.04 3,854,378 Other Special Sessions 28,650 11,277 955 1,060 49.88 3,342,574 Sub Total 363,570 131,245 12,119 8,745 631.14 36,203,565
Extension: Regular Extension 49,020 25,372 1,634 1,932 107.40 4,477,127 Contract Extension 50,880 30,919 1,696 2,244 — 1,762,975 Concurrent Enrollment Ext. 131,190 50,309 4,373 30,704 — 11,110,228 Sub Total 231,090 106,600 7,703 34,880 107.40 17,350,330 Total Credit Programs 594,660 237,845 19,822 43,625 738.54 53,553,895
Non-Credit Extension — 33,002 — 2,343 48.99 5,810,950Other — — — — — 1,998,327Total 594,660 270,847 19,822 45,968 787.53 61,363,172
Continuing Education

Statistical Abstract 219
Academic and Support Programs
Table 126 (continued)
Summary Table1991-92
Annual AnnualStudent Gross Full-Time Full-TimeCredit Enrollment Equivalent Course EquivalentUnits (Registrations) Students Sections Faculty Revenue $
Credit Programs Regular Summer Sessions 288,870 103,363 9,629 6,547 527.93 29,782,997 Contract Summer Sessions 7,200 3,223 240 252 — 265,773 External Degree Programs 15,090 5,246 503 381 21.27 2,010,526 January Special Sessions 45,240 15,838 1,508 932 78.96 4,614,278 Other Special Sessions 37,890 15,266 1,263 1,383 67.35 4,860,119 Sub Total 394,290 142,936 13,143 9,495 695.51 41,533,693
Extension: Regular Extension 46,770 25,577 1,559 1,766 125.08 4,285,358 Contract Extension 48,720 28,256 1,624 2,488 — 1,795,199 Concurrent Enrollment Ext. 123,420 47,605 4,114 28,154 — 11,881,195 Sub Total 218,910 101,438 7,297 32,408 125.08 17,961,752 Total Credit Programs 613,200 244,374 20,440 41,903 820.59 59,495,445
Non-Credit Extension — 40,250 — 3,548 9.79 5,896,815Other — — — — — 1,773,492Total 613,200 284,624 20,440 45,451 830.38 67,165,752