sacomar technologies for safe and controlled martian entry
TRANSCRIPT

SACOMAR
Technologies for Safe and Controlled Martian Entry
SPA.2010.3.2-04
EU-Russia Cooperation for Strengthening Space Foundations (SICA)
Re-entry Technologies and Tools
Theme 9 - Space Activity 9.3 - Cross-Cutting-Activities Area 9.3.2 - International Cooperation
Deliverable Reference Number: D 5.5 Deliverable Title:
Results of experimental study in the TsNIImash Plasmatron facility U13
Due date of deliverable: 21st September 2011
Actual submission date: 30th September 2011
Start date of project: 20th January 2011
Duration: 18 months
Organisation name of lead contractor for this deliverable: TsNIImash
Revision #: 0
Project co-funded by the European Commission within the Seventh Framework Programme (2002-2006)
Dissemination Level
PU Public X
PP Restricted to other programme participants (including the Commission Services)
RE Restricted to a group specified by the consortium (including the Commission Services)
CO Confidential, only for members of the consortium (including the Commission Services)

APPROVAL
Title
Results of experimental study in the TsNIImash Plasmatron facility U13
issue
1
revision
0
Author(s)
R.V.Kovalev, V.I.Vlasov, N.F.Rudin, G.N.Zalogin
30.09.2011
Approved by
N.G. Panichkin
30.09.2011

Table of Contents
Table of contents
List of figures iii
List of tables iii
Nomenclature iii
1 Executive summary 1
1.1
Scope of the deliverable 1
1.2
Results 1
1.3
Specific highlights 1
1.4
Forms of integration within the work package and with other WPs 1
1.5
Problem areas 1
2 Introduction 2
3 Test matrix 3
4 TsNIImash U-13 ICP facility 4
5 Test models 7
6 CO2+N2 mixture flow diagnostics in U-13 ICP facility 10
7 Test results 15
8 Conclusions 17
9 References 17

List of figures
Figure 1:
U-13 ICP principal chart 5
Figure 2:
U-13 ICP general view 5
Figure 3:
General view of the U-13 ICP facility with additional cylindrical section between work and discharge chambers 7
Figure 4: Scheme of calorimetric model for heat flux specification. 8
Figure 5:
Water-cooled calorimeter installed in the work section of the facility (a) and its copper receiving part (b) 8
Figure 6:
Calorimeter with silver receiving part in CO2 plasma flow (a), silver coated receiving part of the calorimeter before (b) and after tests (c). 9
Figure 7:
Water-cooled calorimeter with quartz cup (a) and with thin quartz disk glued to copper base 9
Figure 8:
Static pressure sensor 11
Figure 9:
Pitot probe in CO2 plasma flow (a) and pressure sensitive element (b) 11
Figure 10: Digital mass flow meter/controller 12
Figure 11: Spectrometer Ocean Optics Maya 2000 Pro (a) and its blended lens with cable (b) 13
Figure 12: Heat flux to the silver calorimeter vs. inductor electric power at pressures of 10,20,40 and 80 mbar 14
Figure 13: Pressure difference between stagnation pressure and static pressure vs. inductor electric power at pressures of 10,20,40 and 80 mbar 14
Figure 14: Free stream enthalpy vs. inductor electric power at pressures of 10,20,40 and 80 mbar 15
List of tables
Table 1:
Reference points of the ExoMars trajectory used for experimental modeling in U-13
facility. 3
Table 2:
Test matrix for U-13 ICP facility (SACOMAR project). 4
Table 3: U-13 ICP performance characteristics 6
Table 4: Ocean Optics Maya 2000 Pro spectrometer performance characteristics 13
Table 4: Calorimetric measurements for silver, quartz and cooper models 16
Nomenclature
M – Mach number
p – Pressure
Re - Reynolds number
T – Temperature
H0 – Total Enthalpy
D – Model diameter
N – Anode electric power
G – Mass flow rate

Subscripts
0 Stagnation condition
Free stream
L For reference length
Pitot Pitot measurement
e Edge values
nominal Nominal parameter
actual Actual parameter
Acronyms
ICP Inductively Coupled Plasma
CFD Computational Fluid Dynamics
WP Work Package
DoW Description of Work

SACOMAR Del. No. D 5.5 Results of experimental study in TsNIImash plasmatron facility – Page 1 of 17
1 Executive summary
1.1 Scope of the deliverable
The problem of aeroheating of the interplanetary probes entering Martian atmosphere and, eventually, success of such missions cannot be reliably resolved without due knowledge of the thermal and chemical behaviour of the gases constituting the Mars atmosphere (primarily CO2). Though several thermochemical models of hightemperature carbon dioxide flow were developed previously, the experimental background for proving their relevance is still scarce and much work in this area will have to be done. Improvement of the existing thermochemical models on the basis of new sets of experimental data, that will be obtained in the course of WP5 of the SACOMAR project, is one of its primary goals. These experimental data will be gathered and combined from the tests of five different highenthalpy facilities (shock tunnel, hot shot, arc-heated and ICP plasmatrons).
This document includes detailed description of the test campaign carried out in TsNIImash U-13 ICP-plasmatron facility within the frameworks of the WP5 of the SACOMAR project following to the specifications determined in the experimental test plan [1].
1.2 Results
In the frameworks of the FP7 SACOMAR project (work package WP5) a number of tests on development and improvement of Mars atmosphere thermochemical model has been done. A mixture of carbon dioxide (СО2 – 97% volume fraction) and nitrogen (N2 – 3% volume fraction) has been used as a gas simulating real composition of Martian atmosphere. Measurements were made for two reference values of free stream total enthalpy – 9 и 13.8 MJ/kg and four pressure values – 10,20,40 and 80 hPa. Water cooled calorimeters shaped as standard ESA model of 50 mm diameter were utilized for heat flux specifications. The receiving surface of the calorimeters were made of silver (material with high catalycity in СО2 atmosphere), quartz (low catalycity material) or copper (intermediate catalycity assumed).
The work is completed in due correspondence to the test matrix. The test results will be used for Mars atmosphere thermochemical model improvement envisaged in the WP6 of the project.
1.3 Specific highlights
Not applicable
1.4 Forms of integration within the work package and with other WPs
The data dealt with in this report represents results of the experimental studies of CO2+N2 flow in U13 ICP-plasmatron facility of TsNIImash provided by WP5 Task 5.5 of the project DoW. This work package strongly depends on the specifications and requirements obtained in the WP51 (test plan – [2]). Results of the work of WP55 will provide the test data for CFD simulations of the experiments (WP7 Task 7.7) and the final synthesis of obtained results (Task 4.4 of WP4).
1.5 Problem areas
Not applicable

SACOMAR Del. No. D 5.5 Results of experimental study in TsNIImash plasmatron facility – Page 2 of 17
2 Introduction
The objective of the report is a description of the test campaign carried out in the highenthalpy ICP plasmatron facility U13 of TsNIImash within the frameworks of WP5 (Task 5.5) of the SACOMAR project. This work covered the following phases:
Design and manufacturing of a test model with instrumentation;
Characterization of the free-stream flow field;
Tests performance in CO2 + N2 environment in the facility.
Analysis of obtained experimental data (including he data gained from all other facilities involved in the project) allows further improvement thermochemical model of the Martian atmosphere, that will be used for numerical modeling Mars atmosphere entry conditions for future vehicles. As a reference trajectory the ExoMars vehicle steep trajectory entry conditions is used in the project (this mission is scheduled by ESA in 2016). A number of upper trajectory points was assigned as reference free stream conditions for on-ground experimental simulation.
Because of specifics of the U-13 ICP facility (relatively low pressure values and high total enthalpy) two trajectory points consistent with vehicle flight at higher altitudes with total enthalpy of 13.8 and 9 MJ/kg were selected for tests in it. Inasmuch as the objective of the work envisages improvement of existing thermochemical models of carbon dioxide atmosphere, rather than thermal simulation of entry conditions of certain vehicle, then the tests were made for a set of attainable pressures in the work section of the facility for both reference enthalpies. Besides, in order to study the interaction of carbon dioxide\nitrogen plasma flow with surface materials for every pair of pressure and enthalpy the tests were conducted with three different test samples made of different materials: silver (material with supposed high catalycity), quartz (low-catalycity material) and copper.

SACOMAR Del. No. D 5.5 Results of experimental study in TsNIImash plasmatron facility – Page 3 of 17
3 Test matrix
High levels of total enthalpy and relatively low values of pressures achievable in the work section of the TsNIImash U-13 ICP facility allows conducting experimental modeling of material thermal heating at upper part of trajectory of Mars entry probes. In the test plan for experiments [1] the following trajectory points of the European ExoMars [2] entry probe are considered as reference points for the tests in U-13 facility – see Table 1
Table 1: Reference points of the ExoMars trajectory used for experimental
modeling in U-13 facility.
Trajectory point number
Time Velocity Enthalpy Pitot pressure
[sec] [m/sec] [MJ/kg] [hPa]
1 81 5228 13.8 55
2 104 4072 8.5 82
Since the project objective is a modification and improvement of thermochemical model of behavior of gases constituting Martian atmosphere at their intensive heating in the shock layer around entry vehicles then the experimental modeling should embrace the most extensive range of the pressures reachable in available on-ground high enthalpy facilities of different kind. It enables receiving wide specter of experimental modeling conditions required for further analysis and introduction of necessary modifications to the existing physical models. Because of this reason the requirements on pressure values in the experiments conducted are stated in [1]. For the U-13 facility four reference pressures were selected [1]: 10,20,40 and 80 hPa.
To study hightemperature carbon dioxide plasma interaction with different materials the tests are carried out for materials with different surface catalycities (relative to recombination probabilities of CO2 plasma species): silver (material with high catalycity), quartz (low-catalycity material) and copper (is known to be high catalycity material for air plasma and to be of intermediate catalycity for Martian atmosphere gases).
Thus, totally 24(=2*4*3) tests were scheduled to perform (Table 2)

SACOMAR Del. No. D 5.5 Results of experimental study in TsNIImash plasmatron facility – Page 4 of 17
Table 2: Test matrix for U-13 ICP facility (SACOMAR project).
Test number Enthalpy Pitot pressure
Sample material [MJ/kg] [hPa]
1 13.8 10 Silver
2 13.8 20 Silver
3 13.8 40 Silver
4 13.8 80 Silver
5 13.8 10 Quartz
6 13.8 20 Quartz
7 13.8 40 Quartz
8 13.8 80 Quartz
9 13.8 10 Copper
10 13.8 20 Copper
11 13.8 40 Copper
12 13.8 80 Copper
13 9 10 Silver
14 9 20 Silver
15 9 40 Silver
16 9 80 Silver
17 9 10 Quartz
18 9 20 Quartz
19 9 40 Quartz
20 9 80 Quartz
21 9 10 Copper
22 9 20 Copper
23 9 40 Copper
24 9 80 Copper
4 TsNIImash U-13 ICP facility
The U-13 ICP plasmatron facility is a highenthalpy aerodynamic facility with RF inductive heating of working gas flow. Principal chart of the facility is presented in Fig.1 and its general view in Fig.2.

SACOMAR Del. No. D 5.5 Results of experimental study in TsNIImash plasmatron facility – Page 5 of 17
Figure 1: U-13 ICP principal chart
Figure 2: U-13 ICP general view
RF Generator
Model input
device
Gas supply
diffuser
Vacuum pumping
ICP heater
Data acquisition
Exhaust
system
Test chamber

SACOMAR Del. No. D 5.5 Results of experimental study in TsNIImash plasmatron facility – Page 6 of 17
Principles of the facility operation are described below. Working gas with known mass flow rate is fed to the discharge chamber (either by radial injection or by combined radial + axial feeding) from where the gas flows to the working section by vacuum pumping system. Working gas is heated in the discharge chamber by action of ring-like currents in the gas induced by magnetic flux that, in turn, is produced by the RF electric field in the inductor coil connected to the source o electric current – RF-generator. The region of extreme temperatures arises within the discharge chamber forming the glowing plasma RF-discharge. The heating inside this region allows achieving high values of enthalpies specific for vehicle entry conditions in the Earth or planetary atmospheres (depending on chemical composition of the working gas). High-temperature plasma jet from the discharge chamber comes to the working section of the facility (usually through cylindrical nozzle or using others nozzles that enables additional acceleration of the plasma flow) where the model with the sample of studied thermal protection material is injected. The system of RF inductive heating used in the facility enables to reach the following performance characteristics – Table 3
Table 3: U-13 ICP performance characteristics
Facility parameter Characteristic values
Gas temperature within the work section 3000 – 8000 К
Pitot pressure at the model 5 – 200 mbar
Total enthalpy 5 – 30 MJ/kg
Heat fluxes to models 10 – 5000 kW/m2
Nominal frequency of the RF - generator 440 kHz
Nominal electric power of the RF-generator 1 MW
Work section dimensions 0.8х0.8х0.8 m
Working gases Air, nitrogen,
argon, СО2, etc.
Test duration up to 120 min.
Plasma jet diameter 50–190 mm
This set of flow parameters allows characterizing heat transfer conditions (in terms of pressure, temperature and species mass fractions) specific for space vehicle entries in Earth and planetary atmospheres. Reproducing yet another additional parameter (boundary layer thickness or velocity gradient or heat transfer rate coefficient, etc) gives full simulation of the flow within the boundary layer near stagnation point of a blunt body. It should be noted on the other hand that facilities of this kind do not enable to obtain actual gasdynamic modeling as they operates under essentially lower Mach (usually subsonic) and Reynolds numbers that do not allow modeling of the flow near the bow shock and in the shock layer.
Values of total enthalpy as given in the test matrix lies near the bottom margin of the facility operation. First of all it concerns the value of enthalpy H0 = 9 MJ/kg which are hard attainable at standard facility scheme when using СО2 as a working gas. In this case relatively low input power of the RF generator is required that makes questionable ignition of the gaseous discharge and even if the discharges ignites then the plasma jet turns to be quite unstable and making reliable measurements is rather difficult. Enthalpy can be decreased by injection cold working gas into the hot main plasma stream at the exit of the discharge chamber in a relevant proportion. In this case the principal problem is the jet uniformity as well as possibility of proportional mixing of cold and hot gas volumes. The effective way to reduce enthalpy is model displacement downstream of inductor coil because jet enthalpy decreases rather quickly as model is installed farther from the

SACOMAR Del. No. D 5.5 Results of experimental study in TsNIImash plasmatron facility – Page 7 of 17
discharge chamber. However available horizontal stroke of the model support system is insufficient for remarkable reduction in free stream enthalpy around the model. For this reason additional cylindrical section of length ~ 0.5 m has been inserted between the discharge chamber and working section of the facility to decrease free stream enthalpy to required value of 9 MJ/kg (Fig.3). It allows providing total enthalpy values of 9 MJ/kg at pressures 10, 20 and 40 mbar. At pressure of 80 mbar required enthalpy level has been achieved with usual configuration of the facility. Similar situation took place at the enthalpy of 13.8 MJ/kg
Figure 3: General view of the U-13 ICP facility with additional cylindrical section between work and discharge chambers
5 Test models
A model of unified shape (faced cylinder with rounded edges – ESA standard model) is used for the tests in all the facilities [1] – Fig.4.

SACOMAR Del. No. D 5.5 Results of experimental study in TsNIImash plasmatron facility – Page 8 of 17
Figure 4: Scheme of calorimetric model for heat flux specification.
Overall three such calorimetric water-cooled models were employed in the experiments – copper holder with 20 mm disk inserts with silver, copper or quartz surfaces in the central part of the face. These inserts were insulated of the main body of the holder by thin layer of thermal insulation material. The copper insert is turned of monolithic copper lump, the body of silver insert is also made of copper with thin film of galvanic silver coating. Two types of quartz inserts were manufactured for tests – one with thin (0.7 mm) quartz disk glued to the front face of copper body and another one with quartz cap worn over the copper insert body and glued at the cap periphery. Photographs of water-cooled calorimeters are shown in Fig.5-7
Figure 5: Water-cooled calorimeter installed in the work section of the facility (a) and its copper receiving part (b)
flow
a) b)

SACOMAR Del. No. D 5.5 Results of experimental study in TsNIImash plasmatron facility – Page 9 of 17
Figure 6: Calorimeter with silver receiving part in CO2 plasma flow (a), silver coated receiving part of the calorimeter before (b) and after tests (c).
Figure 7: Water-cooled calorimeter with quartz cup (a) and with thin quartz disk glued to copper base
a)
b) c)
a) b)

SACOMAR Del. No. D 5.5 Results of experimental study in TsNIImash plasmatron facility – Page 10 of 17
6 CO2+N2 mixture flow diagnostics in U-13 ICP facility
The flow diagnostics in highenthalpy facilities with ICP heaters is a complex problem that have to combine experimental measurements and numerical modeling. Distinguishing from the pressure that can be measured in straightforward manner by sensors the free stream enthalpy at the model location is determined by indirect methods issuing from the value of heat flux to calorimetric probe. For correct using of this procedure the gas species composition at the outer edge of the boundary layer near the probe (in nonequillibrium flow case) as well as probabilities of heterogeneous recombination of gas species on the probe surface material have to be known. Keeping these values in mind the total enthalpy at the outer edge of the boundary layer can be readily recovered using numerical simulation. However it means that the flow diagnostics depends explicitly on the thermochemical model used in calculations (rates of chemical reactions, transport and thermodynamic properties of gas mixture and the character of flow interaction with the model surface). It also means that variation in physical model used for numerical treatment of the flow will lead to some variations in the flow diagnostics.
Besides, such variation of physical model is more complicated for the case of flows of mixtures with considerable fraction of СО2. Contrary to the case of air flow, even in case of hypothetical probe made of absolutely catalytic material with recombination probability equal to one, the mixture of reacting gas species cannot be “supercatalytic” and is not recovered to the its initial state (that is to the state with initial fraction of the carbon dioxide) but can include other stable in cold gas components (СО, О2). Mass fraction of these stable species determined in calculations also depends explicitly on thermochemical model used (on kinetics of gas-phase and heterogeneous reactions). The value of gas enthalpy near the surface directly depends on these species mass fractions because it includes formation enthalpy of those species and, consequently (at fixed value of measured heat flux), the free stream enthalpy depends on them as well. This situation leads to uncertainty in flow diagnostics for the facilities with ICP plasmatrons resulting from imperfection of the thermochemical model of gas mixture. Reduction of this uncertainty can be ensured by both analysis of all the test data obtained during measurements in different tests at the facility and, first of all, by comparison with the data measured in the facilities of other kinds in close flow conditions. In this respect the experimental work planned in the SACOMAR project will allow considerable reduction in the diagnostics of СО2+N2 plasma flows in the facilities with ICP-plasmatrons.
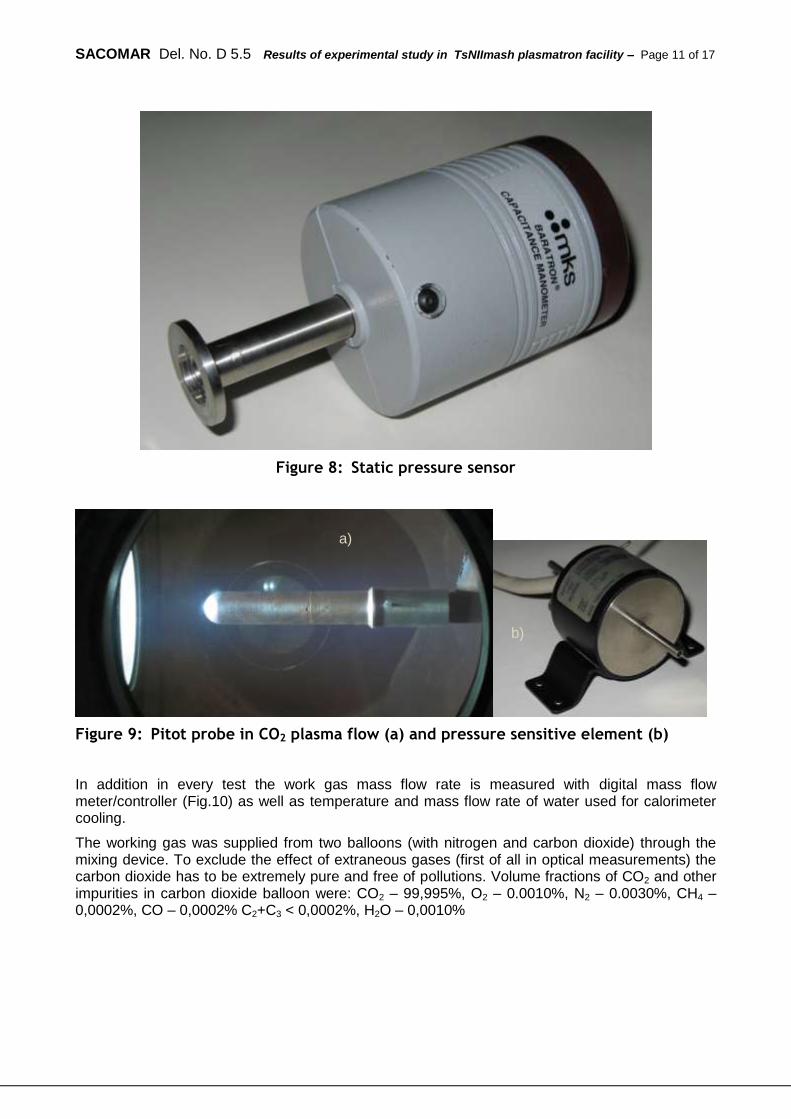
Static pressure in the work section is measured with the pressure sensor installed in its upper wall (Fig.8). Pitot pressure is measured with a Pitot sensor probe (Fig.9) that is brought into the flow axis in every test for a short time with a upper holder and then, after its removal, the model is injected into the same point using bottom holder.
SACOMAR Del. No. D 5.5 Results of experimental study in TsNIImash plasmatron facility – Page 11 of 17
Figure 8: Static pressure sensor
Figure 9: Pitot probe in CO2 plasma flow (a) and pressure sensitive element (b)
In addition in every test the work gas mass flow rate is measured with digital mass flow meter/controller (Fig.10) as well as temperature and mass flow rate of water used for calorimeter cooling.
The working gas was supplied from two balloons (with nitrogen and carbon dioxide) through the mixing device. To exclude the effect of extraneous gases (first of all in optical measurements) the carbon dioxide has to be extremely pure and free of pollutions. Volume fractions of CO2 and other impurities in carbon dioxide balloon were: CO2 – 99,995%, O2 – 0.0010%, N2 – 0.0030%, CH4 – 0,0002%, CO – 0,0002% C2+C3 < 0,0002%, H2O – 0,0010%
a)
b)

SACOMAR Del. No. D 5.5 Results of experimental study in TsNIImash plasmatron facility – Page 12 of 17
Figure 10: Digital mass flow meter/controller
Also for every flow regime a number of qualitative tests on the jet flow characterization were performed (microwave measurements of the electron density in the plasma jet and emission spectroscopy measurements with the spectrometer Ocean Optics Maya 2000 Pro (Fig.11, see also Table 4). This spectrometer is designed using the Cherny-Terner scheme with CCD detector Hamamatsu S10420 (2048*64 pixels). This device is equipped with the fiber-optic input with SMA 095 socket. The fiber optic cable of 2 m length with 600 nm fiber diameter was used in measurements. The device lens (quartz 84-UV-25 lens) was located near the outer surface of work section quartz window and was focused in the free stream point displaced at 180 mm distance from the nozzle exit that corresponds to the location of the model (and pitot probe) stagnation point. The spectrometer optical axis was normal to the facility nozzle symmetry axis. The spectrometer received plasma radiation in a rectangular spot of size 0.08*4.8 mm everywhere through the jet thickness. The wave length calibration of spectrometer was made with the help of mercury-argon lamp Ocean Optics HG-1. The signal amplitude calibration was made using photometric tungsten incandescent lamp SI-8-200 (over the range 400-1200 nm) and hydrogen/deuterium discharge lamp LD2D (within the 200-400 nm range).

SACOMAR Del. No. D 5.5 Results of experimental study in TsNIImash plasmatron facility – Page 13 of 17
Figure 11: Spectrometer Ocean Optics Maya 2000 Pro (a) and its blended lens with
cable (b)
Table 4: Ocean Optics Maya 2000 Pro spectrometer performance characteristics
Parameter Characteristic values
Spectral band 200-1200 nm
Spectral resolution ~0.5 nm
Lens focal length 101 mm
Some additional remarks concerning selection of facility operation regimes corresponding to the parameters given in the test matrix have to be made. Required value of the total enthalpy of the free stream is a result of whole set of parameters – inductor anode power, composition and characteristics of the work gas, distance from inductor coil to the model, pressure, etc. A part of the electric power supplied to the inductor coil (depending variable value of its efficiency that also depends on all those parameters) will be input to the plasma and goes to the gas heating that is to the increase of its enthalpy. Consequently, for every given value of pressure, distance from inductor to model and work gas mass flow rate a number of adjusting facility runs should be made at variable magnitudes of electric power N fed to the inductor coil. After performing heat flux measurements to the calorimetric probe (in that case the probe with known maximum surface catalycity value is used, in our case the silver one) the enthalpy of the probe free stream is determined using numerical modeling. It enables to create approximation dependence of free stream enthalpy versus inductor electric power for given level of pressure and, at last, select that value of provided power that ensure required value of the total enthalpy. These dependences for are presented in Figs.12 - 14. Note that all flow regimes with enthalpy of 9 MJ/kg were stable accessible in the U-13 facility with additional intermediate section as well as flow regimes with 13.8 MJ/kg enthalpy at lower pressures (10, 20 and 40 mbar). The flow regime with the highest pressure (80 mbar) at this enthalpy requires much higher input power in this case but is readily attainable at the same power levels when using standard facility configuration (without insert).

SACOMAR Del. No. D 5.5 Results of experimental study in TsNIImash plasmatron facility – Page 14 of 17
0
100
200
300
400
500
600
700
800
900
60 80 100 120 140 160 180 200 220 240 260
qAg, kW/m2
N, kW
P = 10
P = 20
P = 40
P = 80
Figure 12: Heat flux to the silver calorimeter vs. inductor electric power at
pressures of 10,20,40 and 80 mbar
0
20
40
60
80
100
120
140
160
180
200
60 80 100 120 140 160 180 200 220 240 260
∆P, Pa
N, kW
P = 10
P = 20
P = 40
P = 80
Figure 13: Pressure difference between stagnation pressure and static pressure
vs. inductor electric power at pressures of 10,20,40 and 80 mbar

SACOMAR Del. No. D 5.5 Results of experimental study in TsNIImash plasmatron facility – Page 15 of 17
4
6
8
10
12
14
16
18
60 80 100 120 140 160 180 200 220 240 260
H0, MJ/kg
N, kW
P = 10
P = 20
P = 40
P = 80
Figure 14: Free stream enthalpy vs. inductor electric power at pressures of
10,20,40 and 80 mbar
7 Test results
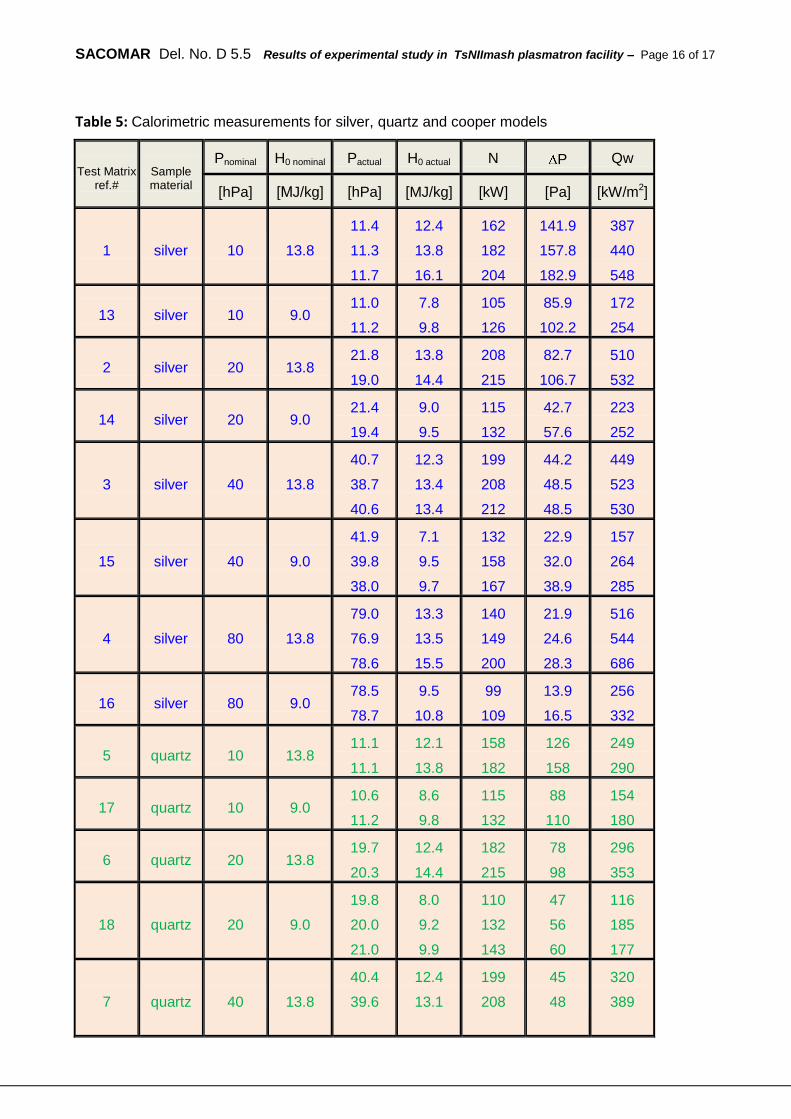
Obtained results for all the cases given in the test matrix (part 3) are presented below. For every test the nominal values of pressure (Pnominal) and enthalpy (H0nominal) as well as their actual values (Pactual and H0actual) are shown. Also the values of generator electric power (N), pressure difference
between stagnation pressure and static pressure ( P), test duration and measured heat flux are presented. For every case studied the work gas mass flow rate was almost the same and equal G ≈ 5 g/s. The duration of each of the tests was about 1 min and the model was exposed in the free stream for the time τ ~ 20 – 30 s.
SACOMAR Del. No. D 5.5 Results of experimental study in TsNIImash plasmatron facility – Page 16 of 17
Table 5: Calorimetric measurements for silver, quartz and cooper models
Test Matrix ref.#
Sample material
Pnominal H0 nominal Pactual H0 actual N P Qw
[hPa] [МJ/kg] [hPa] [MJ/kg] [kW] [Pa] [kW/m2]
1 silver 10 13.8
11.4
11.3
11.7
12.4
13.8
16.1
162
182
204
141.9
157.8
182.9
387
440
548
13 silver 10 9.0 11.0
11.2
7.8
9.8
105
126
85.9
102.2
172
254
2 silver 20 13.8 21.8
19.0
13.8
14.4
208
215
82.7
106.7
510
532
14 silver 20 9.0 21.4
19.4
9.0
9.5
115
132
42.7
57.6
223
252
3 silver 40 13.8
40.7
38.7
40.6
12.3
13.4
13.4
199
208
212
44.2
48.5
48.5
449
523
530
15 silver 40 9.0
41.9
39.8
38.0
7.1
9.5
9.7
132
158
167
22.9
32.0
38.9
157
264
285
4 silver 80 13.8
79.0
76.9
78.6
13.3
13.5
15.5
140
149
200
21.9
24.6
28.3
516
544
686
16 silver 80 9.0 78.5
78.7
9.5
10.8
99
109
13.9
16.5
256
332
5 quartz 10 13.8 11.1
11.1
12.1
13.8
158
182
126
158
249
290
17 quartz 10 9.0 10.6
11.2
8.6
9.8
115
132
88
110
154
180
6 quartz 20 13.8 19.7
20.3
12.4
14.4
182
215
78
98
296
353
18 quartz 20 9.0
19.8
20.0
21.0
8.0
9.2
9.9
110
132
143
47
56
60
116
185
177
7 quartz 40 13.8
40.4
39.6
12.4
13.1
199
208
45
48
320
389

SACOMAR Del. No. D 5.5 Results of experimental study in TsNIImash plasmatron facility – Page 17 of 17
19 quartz 40 9.0 38.7
39.5
8.8
10.0
153
170
32
37
178
237
8 quartz 80 13.8 75.4
75.0
13.2
13.7
141
151
23
25
319
339
20 quartz 80 9.0 76.0 9.5 99 13.9 221
9 cooper 10 13.8 11.2 13.9 182 160 401
21 cooper 10 9.0 10.8 8.8 120 100 214
10 cooper 20 13.8 20.6 13.7 204 92 446
22 cooper 20 9.0 20.6 8.9 126 54 197
11 cooper 40 13.8 39.7 13.7 217 50 524
23 cooper 40 9.0 39.9 8.6 154 34 254
12 cooper 80 13.8 81.6 14.1 161 27 596
24 cooper 80 9.0 80.7
78.4
8.6
9.7
90
99
12
14
216
261
8 Conclusions
Within the frameworks of the FP7 SACOMAR project (WP5 work package, task 5) a number of tests were performed in the U-13 ICP facility of TsNIImash. These tests were intended to investigate and improve thermochemical model of Martian atmosphere. A mixture of carbon dioxide (СО2 – 97%) and nitrogen (N2 –3%) was used as working gas to simulate actual composition of the Mars atmosphere. Measurements were made for two reference values of free stream enthalpy – 9 and 13.8 MJ/kg and four magnitudes of pressure – 10, 20, 40 and 80 hPa. For specification of heat fluxes three water-cooled calorimeters shaped as standard ESA model of 50 mm diameter were used. Receiving parts of the calorimeters were made of silver (higher catalycity in СО2 atmosphere), quartz (low-catalycity material) and copper (supposed to be lower than silver).
The work is performed completely with reference to the test plan and test matrix. Obtained test results will be used within the work package WP6 for modifications and improvements in the existing physical models of Martian atmosphere.
9 References
[1]. Test Plan for Experiments, SACOMAR D 5.1
[2]. Requirements on Modelling and Simulation, SACOMAR D 4.1