sacramento area council of governments technical ......the blueprint long range land...
TRANSCRIPT

Sacramento Area Council of Governments
Technical Methodology for Greenhouse Gas Calculations for the 2020 MTP/SCS
SACOG’s long range transportation plan, called the Metropolitan Transportation Plan (MTP) and its Sustainable Communities Strategy (SCS) has for the first two SCSs been treated as one, internally consistent plan, labeled as the MTP/SCS. The 2020 MTP/SCS is the third update of the SCS, and also the fourth update of the MTP after the adoption of the Blueprint long range land use/transportation vision for the region. The update is proceeding on three tracks: framing assumptions and constraints, public participation and input, and technical tools and data.
A fourth section of this document lays out SACOG’s updated SB 375 greenhouse gas (GHG) reduction target itself. The GHG reduction targets were reset by ARB in 2018. SACOG’s 2020 target was left at 7 percent. The 2035 target was reset from 16 to 19 percent, subject to SACOG’s ability, with state assistance, to identify substantive new programs, funding, or flexibility to achieve the higher target. Without additional programs, funding or flexibility, the target would be 18 percent. This fourth section describes a pilot program for the new target.
I. Framing Assumptions and Constraints
Regional Growth Projections SACOG employed the Center for the Continuing Study of the California Economy (CCSCE), one of the leading demographers in the state, to update the regional growth projections for the 2020 MTP/SCS. The projections set population, employment, and household totals for the plan based on a rigorous analysis of both exogenous and endogenous growth factors. This projection update included sensitivity, uncertainty and economic competitiveness analyses that produced a range of possible growth trends under different future conditions. The team vetted this range of forecasts with industry professionals, regional stakeholders, and an expert panel, culminating in a final growth projection for the plan. The updated growth projection contains lower annual growth rates relative the nearly decade-old projections of the current plan. These changes stem largely from larger growth trends, such as retirement in the baby boomer generation that will slow labor force growth or falling fertility rates.
The table below compares these regional data to the current SCS.

Sacramento Area Council of Governments Technical Methodology for Greenhouse Gas Calculations for the 2020 MTP/SCS
8/10/2018 2
Household income projections have taken on a more prominent role in this SCS process. In particular, the distribution across the range from poverty level to upper income has been changed by three factors: a) the continuing effects of the Great Recession, b) the importance that income plays in transportation decisions for many households, and c) the impact of employment sectors growth rates within the regional economy. The table below compares the percent of households in five income ranges to the current Plan.
The regional growth projections inform how many new people, homes, and jobs our region can expect by 2035 (compliance year for the SCS) and 2040 (the horizon year of the MTP). The land use forecast is the allocation of where those people, homes, and jobs are likely to locate within the region. Our region is unique in that the SCS cannot accommodate all of the growth being planned for by member jurisdictions. The sum of development capacity in local plans far exceeds the demand we are projecting by 2040 in the SCS. Because the distribution of homes and jobs across the region is one of the

Sacramento Area Council of Governments Technical Methodology for Greenhouse Gas Calculations for the 2020 MTP/SCS
8/10/2018 3
greatest variables in determining how residents travel, our process starts with a land use forecast. We consider a number of policy, regulatory and market factors to help us shape the land use forecast. The transportation project list is then refined to support the land uses and to work within the fiscally constrained financial budget of the plan.
Our scenario and analysis approach to this SCS update is building from the information we learned in our 2012 and 2016 SCS updates and is focused on what changes are necessary to achieve the new 19 percent greenhouse gas reduction target. The last two SCSs tested a range of land use and transportation scenarios. The results consistently showed that the scenario that had the highest amount of infill growth, the most housing choice including higher densities, and the most transportation choice, including more money spent on transit, walking, and biking options, is the scenario that reduces VMT and GHG the most. From this, we know that our current plan would need to shift even more growth into infill areas and provide more housing and transportation choice in these areas to achieve a GHG reduction that is greater than the current plan. Our approach is to create a Discussion Draft Scenario that aims to maintain or improve all of the performance measures of the current plan, including the GHG reduction target. The performance outcomes of this Discussion Draft Scenario will be a major discussion point with the SACOG Board in creating a framework for the final scenario. Additional analysis to inform the final scenario framework includes a benefit-cost analysis of key transportation projects, qualitative performance assessment of proposed transportation projects, pricing options and analysis, autonomous vehicle and shared mobility research and analysis, financial constraint analysis, public and stakeholder outreach, and integrating the values developed by the regional Economic Prosperity Partnership.
Staff reports relating to all of the above information can be found on our 2020 MTP/SCS Update website at: https://www.sacog.org/pod/staff-reports-research-data-analysis
Revenue Estimates Revenue estimates for the MTP/SCS update are under development. The final scenario framework including the revenue estimates is scheduled for action by the SACOG Board in December 2018. The revenue estimates will take into account the projected regional population growth endorsed by the Board in December 2017.
Framework and Schedule The schedule for this MTP/SCS update calls for action by the Board of Directors in February 2020. The update process kicked off in 2017 with issue exploration and the update to the regional growth projects. This led to the Board adopting a Policy Framework for the 2020 MTP/SCS that is a statement of major policy issues, challenges, and questions the SACOG Board has identified as priorities to be addressed in the plan. This framework is on our website at: https://www.sacog.org/pod/staff-reports-research-data-analysis
An outline of the process, the work completed to date, and the planned next steps is shown on our process map, which can be found here:

Sacramento Area Council of Governments Technical Methodology for Greenhouse Gas Calculations for the 2020 MTP/SCS
8/10/2018 4
https://www.sacog.org/sites/main/files/file-attachments/process_map.pdf
II. Public Participation and InputThe SACOG Public Participation Plan (PPP), along with our 2020 MTP/SCS Engagement and Communication Plan will be used to guide our outreach efforts throughout the MTP/SCS update. SACOG will utilize its standing advisory committees, a stakeholder sounding board, workshops and public hearings to fully comply with, not only state and Federal requirements, but also regional needs and policies on equitable and accessible public engagement.
The PPP is available here: https://www.sacog.org/post/public-participation-plan
2020 MTP/SCS Engagement and Communications Plan is here: https://www.sacog.org/sites/main/files/file-attachments/9-2020_mtp.pdf
An outline of our approach to the public workshops specifically can be found here: https://www.sacog.org/pod/staff-reports-research-data-analysis
III. Technical Tools and DataStarting with its landmark regional “Blueprint” project, SACOG has developed a reputation for data-driven, technically based transportation planning, with an emphasis on using state-of-the art modeling and analysis tools and practices to inform the planning process. These tools and data are the foundation of connecting the land use policy, transportation system development, and transportation-sourced GHG emissions. The section below provides details on these tools and data, and how they relate to the update of the MTP and development of an SCS for the region. Two important adjustment processes are included here that are necessary to take account of changes in the model for the travel and emissions metrics.
SACOG maintains or uses several technical planning and analysis tools to address three key components of transportation-source GHG production in the region.
o Land use planning and scenario analysis toolso Travel demand modeling toolso Emissions estimation tools
In addition to planning and analysis tools, regional monitoring and data programs provide a basis for establishment of analysis base years, tracking of growth and trends in the region, and validation and sensitivity testing of planning and analysis tools.
Sacramento Area Council of Governments Technical Methodology for Greenhouse Gas Calculations for the 2020 MTP/SCS
8/10/2018 5
Base Year Update Process SACOG systematically updated its land use and transportation monitoring datasets, and used these monitoring data to update the base year of its forecasting tools to Year 2016. Housing, employment and school inventories were updated, using a range of data sources (Census data, building permits, commercially and publicly available employment datasets, aerial photos, county assessors’ data, and other sources). SACOG’s regional GIS street and bikeway centerline file, published transit schedules and maps, and aerial photos were used to update the highway and transit datasets for SACOG travel demand models to Year 2016. Traffic counts and transit passenger volume datasets were updated, and will be used for validation of travel demand modeling tools.
Scenario Planning and Development Tools SACOG is using Envision Tomorrow Online as the tool for “painting” land use scenarios. SACOG has an extensive dataset that includes regional land use types and the translation of local land uses to the regional land uses that are used for modeling in the MTP/SCS. Using SACOG’s data and analysis as the foundation, Envision Tomorrow provides the platform for easily creating scenarios and integrating them into the format needed for SACSIM.
SACSIM Travel Demand Model SACOG uses the Sacramento Activity-Based Travel Demand Simulation model (SACSIM) for analysis of travel demand associated with land use and transportation alternatives. SACSIM is a state-of-the-art regional travel demand model. It is unique in its use of parcel/point-level land use input data, and was the first activity-based, demand simulation models for a regional long range plan and emissions analysis, for its 2008 MTP. SACSIM was the subject of a rigorous peer review in 2008, underwritten by the USDOT “Travel Model Improvement Program”1. Detailed documentation on the model was submitted to ARB for the 2012 and 2016 SCSs. Since the adoption of the 2016 MTP/SCS, SACSIM has been improved, through updating of the basic software modules used to run the model, addition of time periods to both highway and transit networks, upgrade of transit network software, and improved treatment of transit fares. SACOG has also developed a replacement of radial, fixed-distance proximity measures (e.g. number of jobs within ¼ mile) with proximity measures based on network distance, so proximity measures take account of network connectivity, and fixed barriers like freeways and rivers, etc. Additionally, proximity measures weight more heavily activities in close proximity, and weight less heavily activities further away—the prior iteration of SACSIM weighted all activities equally. All of these changes are state-of-practice or state-of-art for travel demand models. Finally, SACOG is developing and will use analysis of transportation facility pricing as part of the 2020 MTP/SCS. Collectively, these enhancements have been rolled into SACSIM19, which is the model version proposed for use in evaluation of the 2020 MTP/SCS.
1 The peer review report is available on: https://www.fhwa.dot.gov/planning/tmip/resources/peer_review_program/sacog/
Sacramento Area Council of Governments Technical Methodology for Greenhouse Gas Calculations for the 2020 MTP/SCS
8/10/2018 6
For the SACSIM19, SACOG updated sensitivity tests to land use variables, fuel prices and auto operating costs, added highway capacity, and transit fares. Updated sensitivity testing will be provided to ARB as part of the SCS technical review.
CARB has added to the valuable research on land use and transportation policies and factors, which has provided additional information on which to judge reasonable sensitivity of travel demand models, and to establish bounds on off-model adjustments (also discussed in greater detail below). The approach to utilizing SACSIM for the 2020 SCS is intended to simultaneously utilize the enhanced tools and research for evaluation, while also remaining reasonably consistent with the technical work used to establish the SB375 targets and to evaluate the 2020 SCS.
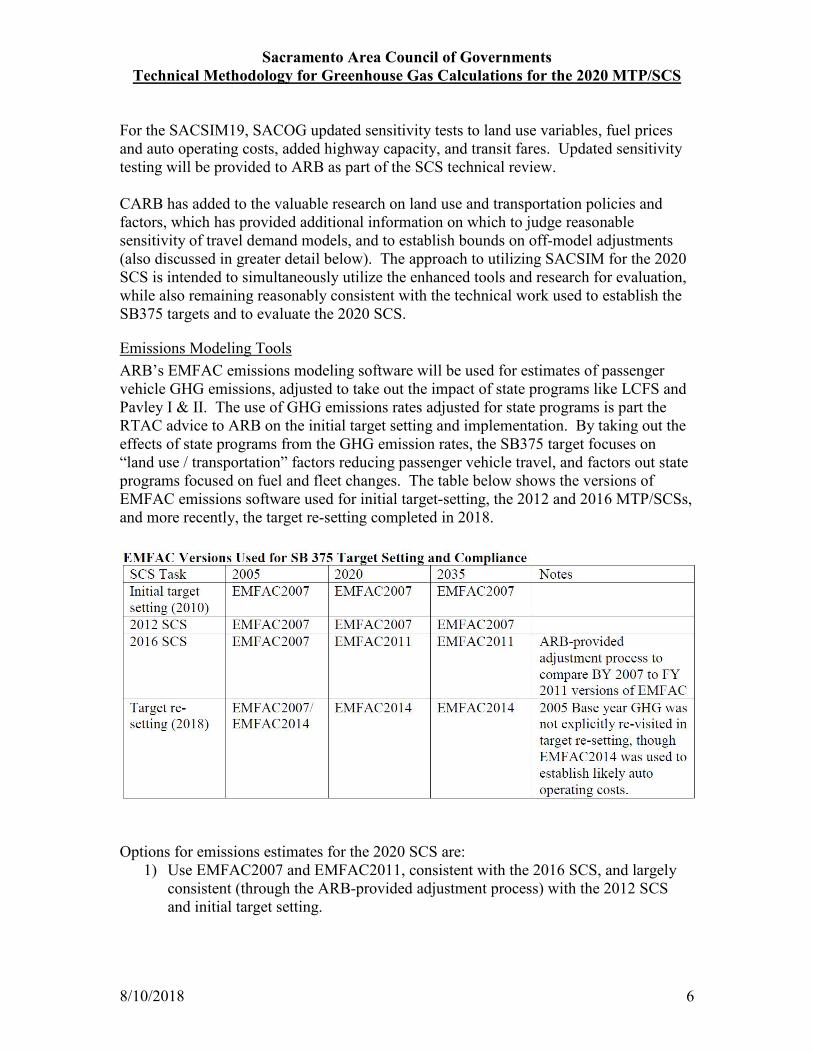
Emissions Modeling Tools ARB’s EMFAC emissions modeling software will be used for estimates of passenger vehicle GHG emissions, adjusted to take out the impact of state programs like LCFS and Pavley I & II. The use of GHG emissions rates adjusted for state programs is part the RTAC advice to ARB on the initial target setting and implementation. By taking out the effects of state programs from the GHG emission rates, the SB375 target focuses on “land use / transportation” factors reducing passenger vehicle travel, and factors out state programs focused on fuel and fleet changes. The table below shows the versions of EMFAC emissions software used for initial target-setting, the 2012 and 2016 MTP/SCSs, and more recently, the target re-setting completed in 2018.
Options for emissions estimates for the 2020 SCS are: 1) Use EMFAC2007 and EMFAC2011, consistent with the 2016 SCS, and largely
consistent (through the ARB-provided adjustment process) with the 2012 SCSand initial target setting.

Sacramento Area Council of Governments Technical Methodology for Greenhouse Gas Calculations for the 2020 MTP/SCS
8/10/2018 7
2) Use EMFAC2007 for the 2005 base year, and EMFAC2014 for the 2020 and2035 forecast years, and update the adjustment process for EMFAC2014 toEMFAC2007 comparisons.
3) Use EMFAC2014 for both base year and forecast year emissions estimates (the“apples-to-apples” approach).
4) Use EMFAC2017 for both base year and forecast year emissions estimates.
Initial, informal guidance from ARB staff for SACOGs 2020 SCS has been: 1) Preference that EMFAC2017 be used for passenger vehicle GHG estimate for SB
375, irrespective of what version may be used for Clean Air Act emissionsestimates.
2) Willingness to accept EMFAC2014 GHG estimates.3) Use either version of EMFAC on an “apples-to-apples” basis, comparing the 2005
base year to the 2020 and 2035 forecast years (i.e. no adjustments to allow forbase year to future year comparisons across different versions of EMFAC).
SACOG has done comparisons of EMFAC2014 and EMFAC2017, and has shared the comparisons with ARB staff. SACOG is open to using EMFAC2017, but has the following concerns and questions:
1) EMFAC2017 has not been approved by EPA for Clean Air Act analysis, and ifEMFAC2014 is used for Clean Air Act analysis for the 2012 MTP, SACOGwould like the option of using EMFAC2014 for the SB 375 analysis for the 2012SCS.
2) Some characteristics of EMFAC2017 create concerns related to comparabilitywith the initial target setting GHG estimates and the re-setting estimates. Inparticular:
a. EMFAC2017 passenger vehicle GHG-per-VMT rates for all years,including 2005, are substantially lower than EMFAC2007, EMFAC2011,or EMFAC2014 rates. (See table below).
b. EMFAC2017 passenger vehicle GHG rates decline significantly moregoing from 2005 to 2035 than other versions of EMFAC.
c. In addition, EMFAC2017 passenger vehicle VMT as a share of total VMTincreases significantly between 2005 and 2035—that characteristic ofEMFAC2017 offsets reductions in personal travel rates achieved by theSCS over time.

Sacramento Area Council of Governments Technical Methodology for Greenhouse Gas Calculations for the 2020 MTP/SCS
8/10/2018 8
SACOG will continue to explore these concerns and questions with ARB staff, and will use the appropriate version of EMFAC for SB 375 emissions analysis of the 2020 SCS.
Off-Model Adjustments and Post-Processing Through the SB375 GHG reduction target-setting process, and the first SCS evaluations, each MPO in the state performed a self-assessment of modeling capabilities2. Through that process, SACOG identified several key exogenous and policy variables for which SACSIM is not reasonably sensitive. Where this determination was made, SACOG used the following 5 step process for the 2012 and 2016 SCS to estimate an off-model adjustment, to be added to the SB375 GHG reduction calculation:
1) determine if the MTP/SCS includes a program which would implement thesubject policy, or for exogenous factors, whether evidence exists of a change inthe factor over the life of the MTP/SCS;
2) determine the most likely deployment level and geographic coverage of theprogram based on implementation of the MTP/SCS;
3) estimate through research a reasonable range of program or policy effects onpassenger vehicle GHG generation (or failing that, on VMT), based on thedocumented effectiveness of similar programs elsewhere;
4) combining results of steps 2 and 3, estimate a range of likely program effects onGHG generation for the MTP/SCS;
5) combine all estimated program effects into one off-model adjustment, to be addedto the modeled reduction calculated from SACSIM results.
This process was thoroughly documented in the attached SB 375 GHG reduction calculations, submitted to CARB as part of SACOG’s 2012 and 2016 SCS technical reviews. SACOG proposes to use the same basic process, with updates where needed, for the 2020 MTP/SCS.
Two additional resources available to SACOG for the 2020 SCS: • Technical assistance on post processing and off-model adjustments provided
through the “Future Mobility” project, a collaboration of the MetropolitanTransportation Commission, Southern California Association of Governments,San Diego Association of Governments, and SACOG. The purpose of thecollaboration is to jointly assess travel changes associated especially with newtechnology, and develop consist approaches for calculating GHG impacts (seeattached memorandum of agreement). WSP was retained as the lead consultantfor the work related to off-model adjustment and post-processing. So far, post-processing tools have been developed for: vanpool programs; car shareprograms; bike share programs; and micro-transit. These and any other toolsdeveloped as part of this collaborative project will be used, to the extent that the2020 SCS includes policies, projects and investments consistent with theprograms and technologies.
2 See the final documentation of the self-assessment, prepared by SACOG staff for presentation to the RTAC in May 2009. http://www.arb.ca.gov/cc/sb375/rtac/meetings/050509/mpoassessmentupdate.pdf

Sacramento Area Council of Governments Technical Methodology for Greenhouse Gas Calculations for the 2020 MTP/SCS
8/10/2018 9
• The recently completed household travel survey for the SACOG region. Thissurvey will provide useful information for updated off-model adjustmentcalculations.
Auto Operating Costs For the initial target-setting, and for the 2012 and 2016 SCSs, SACOG and the other large MPOs in the state used a consistent approach for defining, estimating and forecasting auto operating costs (AOC) for purposes of regional travel demand modeling. AOC was defined as:
• Average variable per-mile cost of driving a passenger vehicle.• Variable costs included fuel, tires and maintenance.• “Passenger vehicle” included four EMFAC vehicle types: light-duty auto, light
duty truck (1), light duty truck (2) and medium duty vehicles.• Average miles-per-gallon (MPG) for passenger vehicles based on VMT per gallon
of gasoline and diesel used, also based on EMFAC.• Base year non-fuel costs based on AAA “Your Cost of Driving”.• Base year fuel costs based on best source of average cost of regular gasoline in
the base year.• For future year forecasts:
o Average fleet MPG includes VMT from all fuel types (gasoline, diesel,hybrid, and electric vehicles), but only uses gasoline and diesel consumed.This is a way of factoring in, on an average basis, the cost advantages ofelectricity over petroleum fuels.
o Future fuel costs based on US Department of Energy forecasts, annuallyupdated by the Energy Information Administration, and published in the“Energy Outlook” series. Future costs were set at a value between the“Low” and “High” cost scenarios (75% between “Low” and “High”), plusthe current average difference in average fuel costs between California andthe US average (in past, between 25 and 32 cents).
SACOG will use an updated version of this approach for AOC for the 2020 SCS. Updates will be: use most recent DOE “Low” and “High”; update average fleet MPG using more current version of EMFAC; update non-fuel costs using latest AAA data; and update the CA/US price differential using most recent data. One modification to this approach will be to explicitly factor in cost of electricity for plug-in vehicles, on a VMT-weighted basis. This modification will provide a better accounting of the driving costs for plug-in vehicles.
Use of average variable cost per mile was selected by the MPOs in 2009 for initial target-setting because it was consistent with the values used in the regional travel demand models in each region. Average variable costs per mile have been shown to be more predictive of trip-making behavior than average “full” costs (which include vehicle ownership costs like finance charges, depreciation, insurance, etc.). The behavioral theory underpinning this is that for most households, vehicle ownership is a necessity, and choices of use of a vehicle (number of trips, length of trip, etc.) do not factor in

Sacramento Area Council of Governments Technical Methodology for Greenhouse Gas Calculations for the 2020 MTP/SCS
8/10/2018 10
ownership costs. There is some research to support this theory, plus anecdotal evidence that model estimations of trip frequency, length and mode choice are better predicted using average variable cost rather than full cost (see attached).
There is more mixed evidence of the predictive value of average variable versus average full costs of vehicles in vehicle ownership decision-making—but, model estimations using average variable costs for vehicle ownership do meet normal tests applied to choice models. This issue merits more research, outside the scope and schedule of this SCS update. Other topics worthy of research are:
• Including vehicle type in vehicle ownership models, and reflecting averagevariable cost by vehicle type, including hybrids, EVs, and conventional ICEvehicles.
• Including allocation of vehicle types for use among people within a household aspart of modeling of trip-making.
Disruptive/Transformative Mobility Options The major change in transportation between the 2012 and the adoption of SACOG’s first SCS and today is the emergence of several new mobility options in Sacramento:
• 2011: Zipcar launch in Davis and Downtown/Midtown• 2013:
o Uber & Lyft launcho Zipcar expands
• 2017:o Bike share soft launch in Davis, West Sacramento, Sacramentoo AQMD/Zipcar shared EV for disadvantaged communities launch in
Sacramento• 2018:
o JUMP e-assist bike share launch in Davis, West Sacramento, Sacramentoo VIA micro-transit launch in West Sacramentoo RT micro-transit launch in Citrus Heights
In addition to this partial listing of new mobility launches, services like Uber, Lyft, and other transportation network companies (TNCs), and bike share, expanded deployment and utilization significantly over the same time period. In short, new mobility options became a new reality for transportation in the region.
In some ways, these changes have been transformative, providing new ways to get around. TNCs offer the potential of reducing vehicle ownership and facilitating higher vehicle occupancy through sharing. Bike share systems offer a potential solution to the “first mile/last mile” problem for transit passengers, and offer a convenient alternative to driving in denser areas of the region. These new options can be disruptive as well—a part of the observed decline in transit ridership in Sacramento may be caused by TNCs. In addition to providing convenient access to dense, congested and parking constrained areas like Downtown, TNCs can add to traffic and block access to passenger loading areas.
Sacramento Area Council of Governments Technical Methodology for Greenhouse Gas Calculations for the 2020 MTP/SCS
8/10/2018 11
The two biggest potential transformations or disruptions are still looming: autonomous vehicles (AVs) and connected vehicles (CVs). The impact of these two future disruptions will depend on many factors:
• Trajectory of deployment—although active research and development, and fieldtesting, is underway now, full deployment of AVs is unknown, especially if “fulldeployment” means the ability of a private citizen to purchase and use a fullyconnected, level 5 AV without any restrictions, its years away. However, it isexpected that level 4 AVs may be available and in use through fleets (like Uber)in the next year or two.
• Consumer acceptance—the willingness of consumers to accept and embrace AVand CV features is another unknown. Recent stated preference surveys indicatethat a small percentage of respondents had strong feelings using AVs: about 15percent indicated very likely, or very unlikely, to use them. The remaining 70percent was split into two equal, more ambivalent groups: somewhat likely, orsomewhat unlikely, to use them.
• Behavioral responses—perhaps the biggest unknown is how people will respondto AVs and CVs. Here, the potential effects are broad and deep, with manyunknowns. A short list of the potential responses:
o Vehicle ownership versus shared use—as AVs become more available,will people want to own them? Or share them? Will AVs affect theeconomics of TNCs, and allow TNCs to provide cheaper travel? Will anowned AV within a household make a household less likely to buy asecond (or third, or fourth) car?
o Intra-household travel choices—will AVs change the way vehicles areused within a household? Will one vehicle be re-purposed to serve travelfor several people within a household (e.g. dropping off a worker, dead-heading back home to take a student to school, etc.?).
o Residential location choices—will AVs contribute to a “shared mobilitylifestyle”, in which living car-free in a walkable community with easyaccess to shared vehicles when needed, is valued? Or, will AVs reducethe perceived cost and pain of driving longer distances, and encouragemore households to relocate far from city centers?
o Choices about what mode of travel to use—will AVs allow for convenient,cheap, first-mile/last-mile access to transit, and enhance the attractivenessof transit? Or, will cheap and ubiquitous shared AVs provide an attractivealternative to transit, and undermine the current market for transit?
o Impact on traffic operations and roadways—will AVs create so manyincentives to “deadhead” trips (i.e. empty AVs being re-positioned toserve other trips) that vehicle miles traveled (VMT) increases? Willshared AVs create so many trips to and from dense areas that access tocurbs for passenger pick-up and drop-off becomes an operationalproblem? Will CVs allow for so many efficiencies in platooning ofvehicles on roadways, that current congestion problems disappear? Howdependent are potential roadway capacity increases on the deployment

Sacramento Area Council of Governments Technical Methodology for Greenhouse Gas Calculations for the 2020 MTP/SCS
8/10/2018 12
level of CVs? Will roadway capacity increases be higher on limited-access roadways (e.g. freeways) than surface streets?
These uncertainties make long range forecasts of travel, which are necessary for preparation of an SCS, similarly uncertain. At the same time, SACOG staff is cognizant of the requirement for forecasts for development of long range transportation plans around a single-point future. Most of the performance targets applicable to a long range transportation plan, including SB 375 and the Clean Air Act, were set assuming a single-point future forecast would be made, and achievement of the performance target definitively assessed (i.e. pass or fail) using that single-point future forecast. The real uncertainty on the future of mobility and transportation, and the necessity of building and SCS and long range transportation plan around a single-point future forecast scenario, creates a dilemma for travel demand forecasting. SACOG staff has discussed this dilemma with our Board through this calendar year, and identified the following path forward for the 2020 MTP/SCS:
• Preparation of a single-point land use forecast and a single set of transportationproject commitments over the planning horizon of the SCS, as we have in thepast.
• Analysis of the SCS using the available travel demand model (SACSIM19), plusany post-processing or “off-model” adjustments needed to capture the committedlevel of transportation investments in the SCS. This analysis would be the“baseline” analysis of the SCS, and would be used for assessment of futureachievement of the GHG reduction targets for SB 375.
• Preparation of a supplemental set of scenarios, where the potential impacts oftransformative/disruptive mobility is tested against the committed projects in theMTP/SCS. These supplemental scenarios would be based on varying:deployment level of AVs and CVs; degree of shared use of AVs versus owneduse; and range of impact of CVs on highway operations. There are clearly otherpotential impacts of AVs, as mentioned above, but the supplemental scenarioswill focus on these three for the 2020 MTP/SCS.
• Analysis of the scenarios will utilize AV functionality built into the latest versionof DAYSIM, the core activity-based demand simulation software within theSACSIM19 modeling system. RSG, Inc., the vendor for DAYSIM, has utilizedearly research conducted through the National Cooperative Highway ResearchProgram into scenario analysis tools that allow for a multi-dimensional treatmentof deployment level of AVs and degree of shared versus owned use. The scenarioanalysis does represent these effects in several dimensions of travel behavior(auto ownership, activity location choice, daily pattern of activities, and mode oftravel). Other parameters built into the supplemental scenarios will be: ranges onthe demand for and cost of paid parking; and ranges on the potential impact ofCVs on highway capacity.
• Although the foundational analysis of the MTP/SCS will be based on the“baseline” forecasts using SACSIM19, the supplemental analysis will be used toidentify specific risks that may affect the MTP/SCS. The goal will be to develop,discuss, and include in the MTP/SCS future actions that will help to minimize ormanage the identified risks to the MTP/SCS over time:

Sacramento Area Council of Governments Technical Methodology for Greenhouse Gas Calculations for the 2020 MTP/SCS
8/10/2018 13
o Research priorities to improve understanding of potential impacts oftransformative/disruptive mobility.
o Continued engagement with local member agencies through planningprojects like Smart Region, or support for innovative mobility solutionslike Civic Lab.
o Areas of policy development—knowledge of specific impacts andmitigating policy actions may not be known, but areas where policydevelopment needs to begin will be identified.
o Identify pilot projects or field tests that could assist in better understandingor shaping deployment of AVs or CVs in the region.
o Identify and develop monitoring capabilities to better track deployment oftransformative/disruptive mobility in our region, and the impact ofdeployment on travel patterns.
For purposes of the 2020 SCS, this supplemental analysis will be shared with ARB through the technical review process. However, the SB 375 GHG target analysis will be prepared using the “baseline” forecasts.
IV. GHG Reduction Target Pilot
In March 2018, ARB set new SB 375 GHG reduction targets for all MPOs. The SACOG pilot is described in the ARB staff report on the target re-setting:
The goal of the pilot is to develop and implement an SCS that more effectively coordinates growth with transportation investments within of the Sacramento area’s unique regional environment. It recognizes some of the differences between the Sacramento region and the other three large MPOs: the real estate market in Sacramento is more like the Central Valley, and the boom in attached housing which occurred in the coastal MPOs missed Sacramento; its expected growth rate is higher than any of the coastal MPOs, its transit systems are smaller and less developed, and transit ridership is lower than in any of the coastal MPOs. Success of the SACOG pilot will be dependent on actions taken by SACOG with the support of the State.